Embed Size (px)
Citation preview
Predictive Buffering for Streaming Video in 3G
Networks
Varun SINGH, Jörg OTT, Igor Curcio
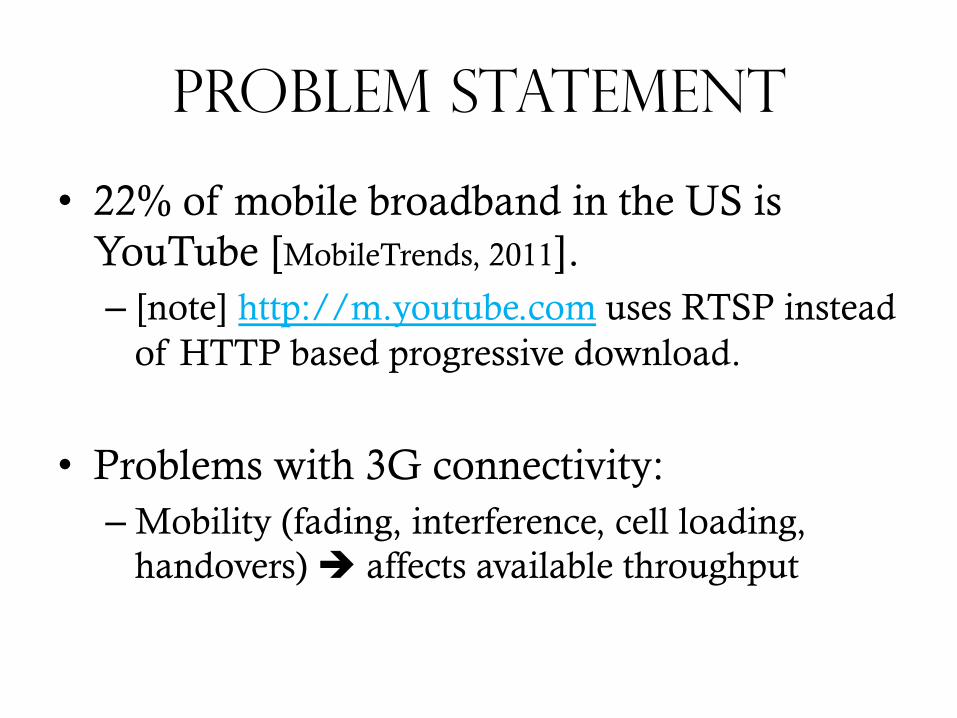
Problem Statement
• 22% of mobile broadband in the US is YouTube [MobileTrends, 2011]. – [note] http://m.youtube.com uses RTSP instead
of HTTP based progressive download.
• Problems with 3G connectivity: – Mobility (fading, interference, cell loading,
handovers) è affects available throughput
Streaming
• If there is loss of connectivity – Pre-buffer, typically, ~5 to 10s
• May be insufficient in the case of 3G
– Rate-switching usually happens after disruption is detected
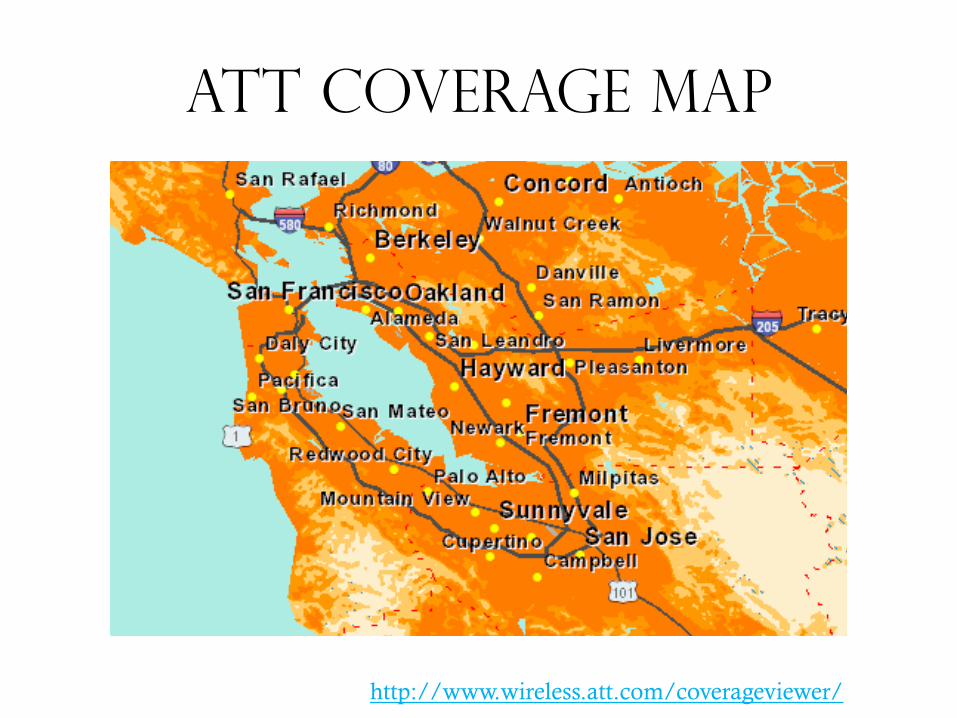
ATT Coverage map
http://www.wireless.att.com/coverageviewer/
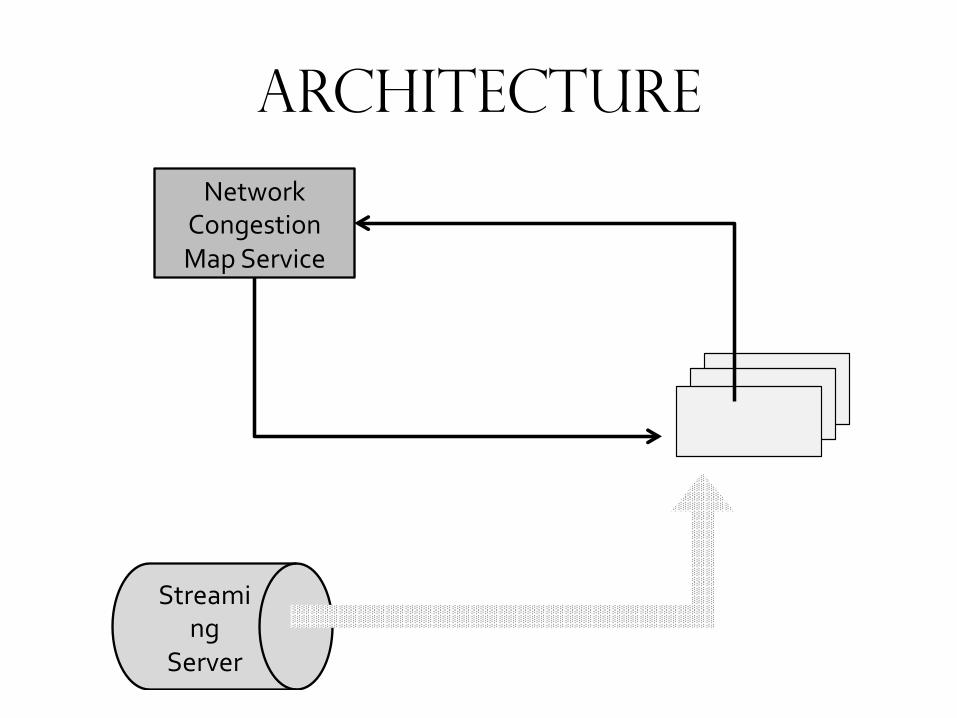
Architecture
Streaming*
Server*
Network*Congestion*Map*Service*
RTP
Throughput Updates Look-ahead Request
Available Throughput
RTCP
Streaming*Client*
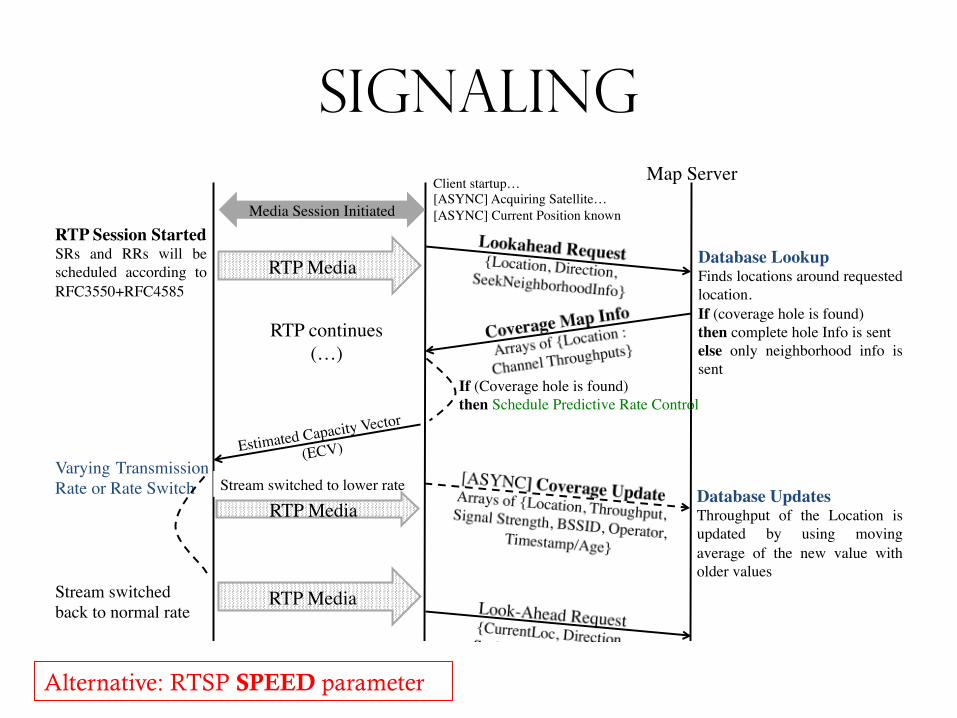
Signaling
Alternative: RTSP SPEED parameter
Streaming Server! Streaming Client! Network Coverage Map Server!Client startup…!
[ASYNC] Acquiring Satellite…![ASYNC] Current Position known!Media Session Initiated!
RTP Media! Database Lookup!Finds locations around requested location. !If (coverage hole is found) !then complete hole Info is sent!else only neighborhood info is sent!
RTP continues!(…)!
RTP Session Started!SRs and RRs will be scheduled according to RFC3550+RFC4585!
If (Coverage hole is found)!then Schedule Predictive Rate Control! !
Estimated Capacity Vector
(ECV)!Varying Transmission Rate or Rate Switch!
RTP Media!
Stream switched to lower rate!
RTP Media!
Stream switched back to normal rate!
Database Updates!Throughput of the Location is updated by using moving average of the new value with older values!
Look-ahead
• Known travel route – Client can calculate maximum size of pre-buffer
for the whole trip.
• Area look ahead – Client can only calculate optimum buffer for the
known outages
– Client subscribe to locations with poor connectivity for updates
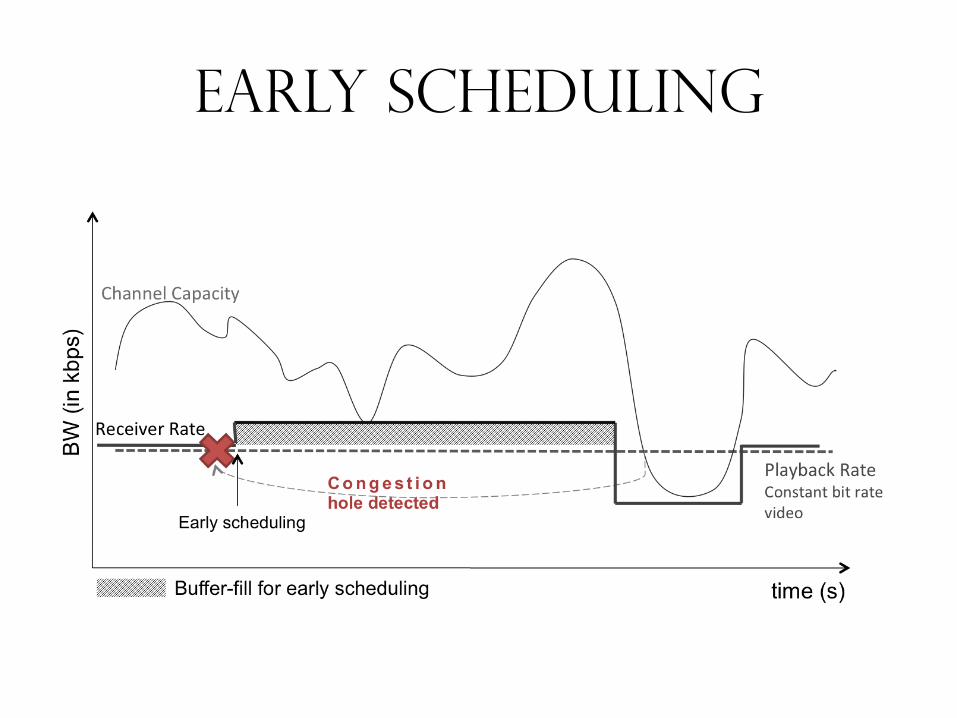
Early Scheduling
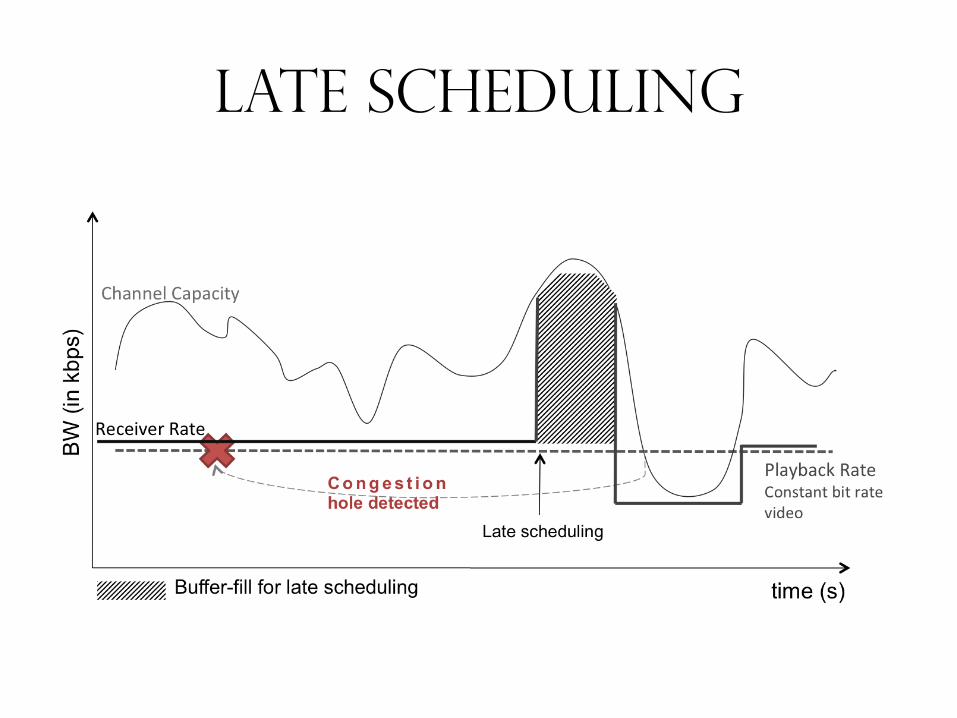
Late Scheduling
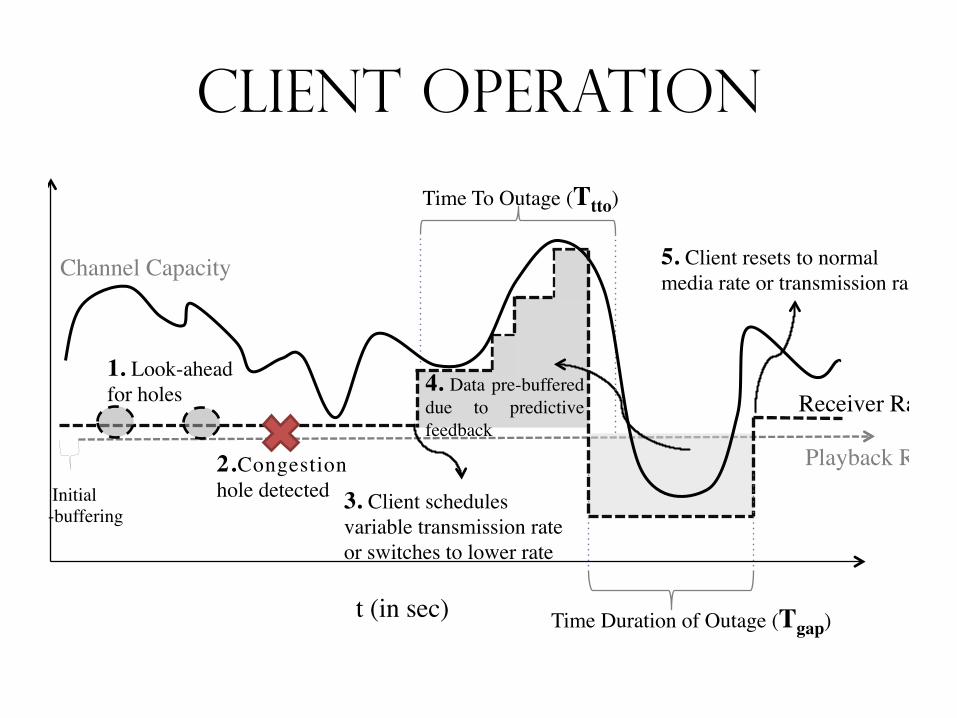
Client operation
t (in sec)!
BW (i
n kb
ps)!
Playback Rate!
Time To Outage (Ttto)!
Channel Capacity!
Receiver Rate!4. Data pre-buffered due to predictive feedback!
Initial !pre-buffering!
Time Duration of Outage (Tgap)!
2.Congestion hole detected! 3. Client schedules
variable transmission rate or switches to lower rate!
1. Look-ahead for holes!
5. Client resets to normal media rate or transmission rate!
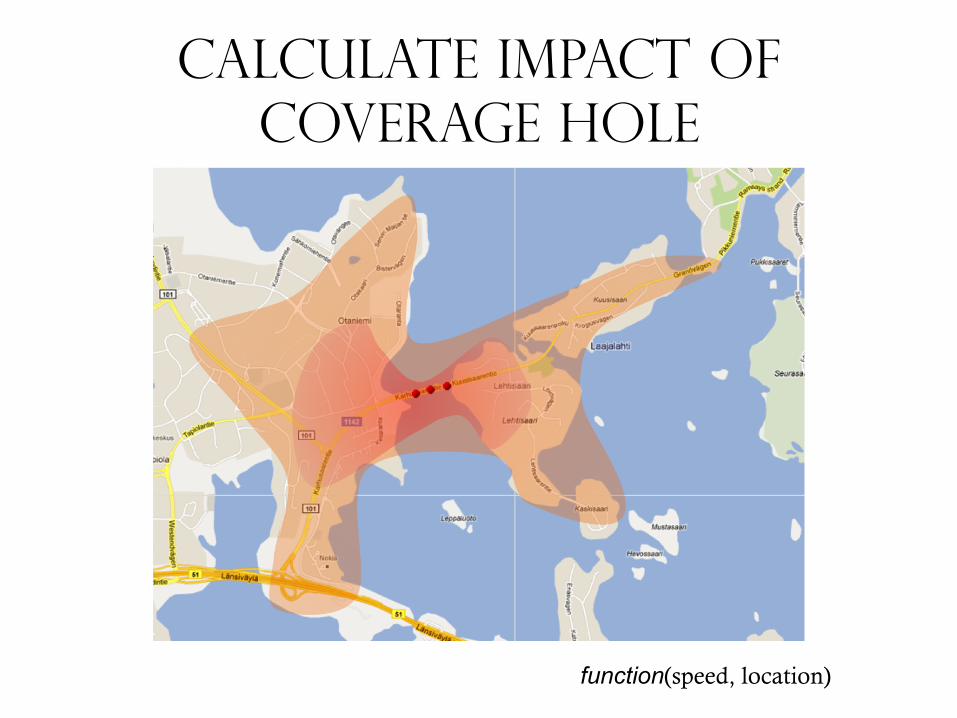
Calculate impact of coverage hole
function(speed, location)
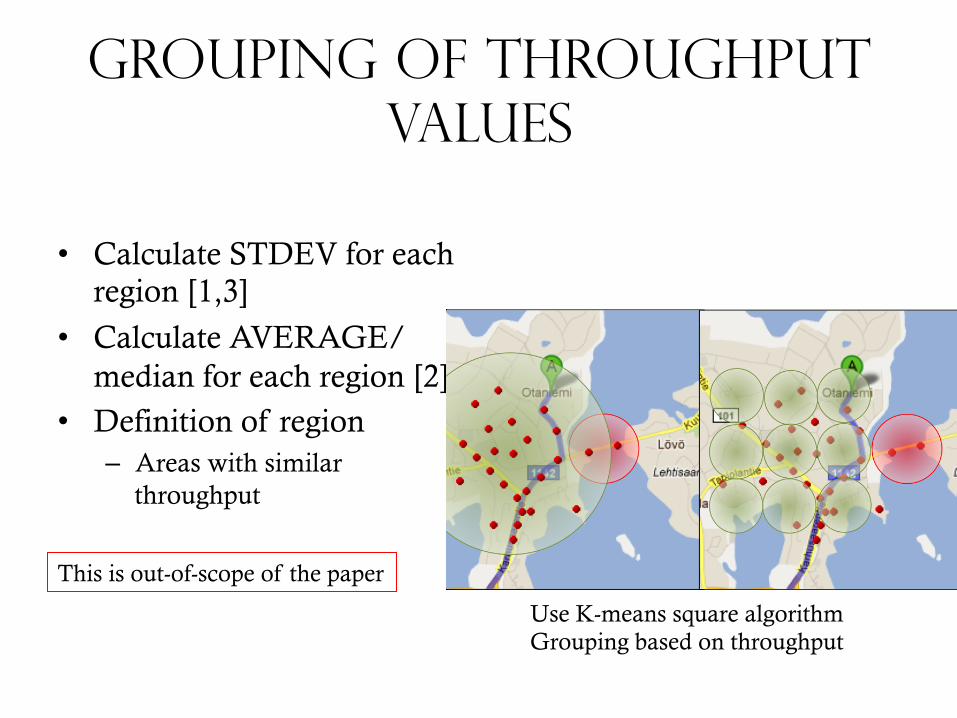
Grouping of throughput values
• Calculate STDEV for each region [1,3]
• Calculate AVERAGE/median for each region [2]
• Definition of region – Areas with similar
throughput
This is out-of-scope of the paper
Use K-means square algorithm Grouping based on throughput
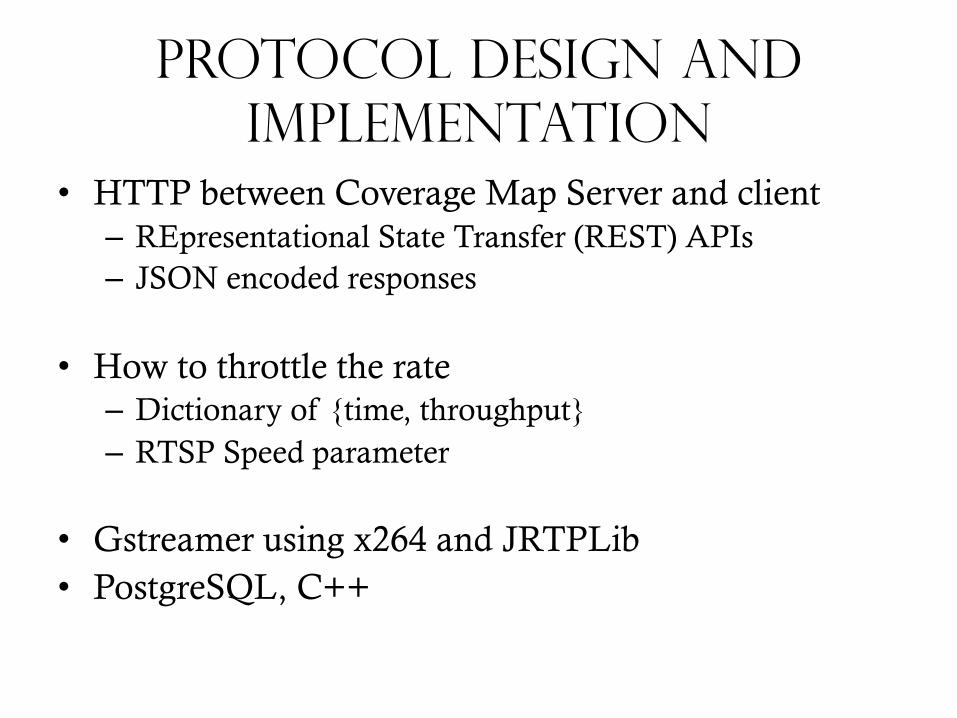
Protocol Design and implementation
• HTTP between Coverage Map Server and client – REpresentational State Transfer (REST) APIs – JSON encoded responses
• How to throttle the rate – Dictionary of {time, throughput} – RTSP Speed parameter
• Gstreamer using x264 and JRTPLib • PostgreSQL, C++
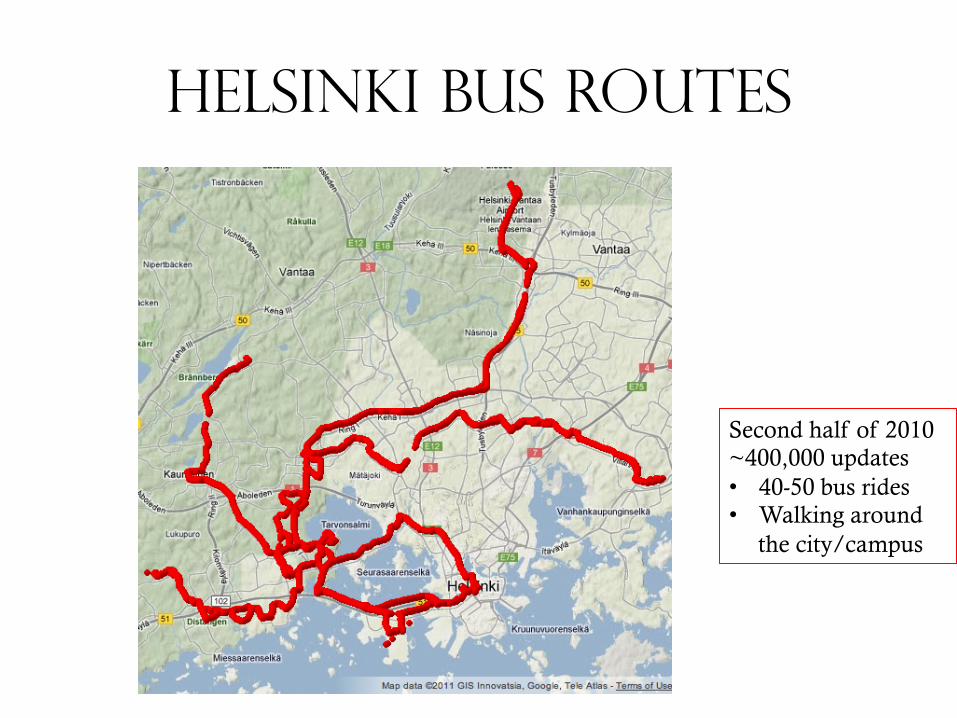
HelSinki Bus Routes
Second half of 2010 ~400,000 updates • 40-50 bus rides • Walking around
the city/campus
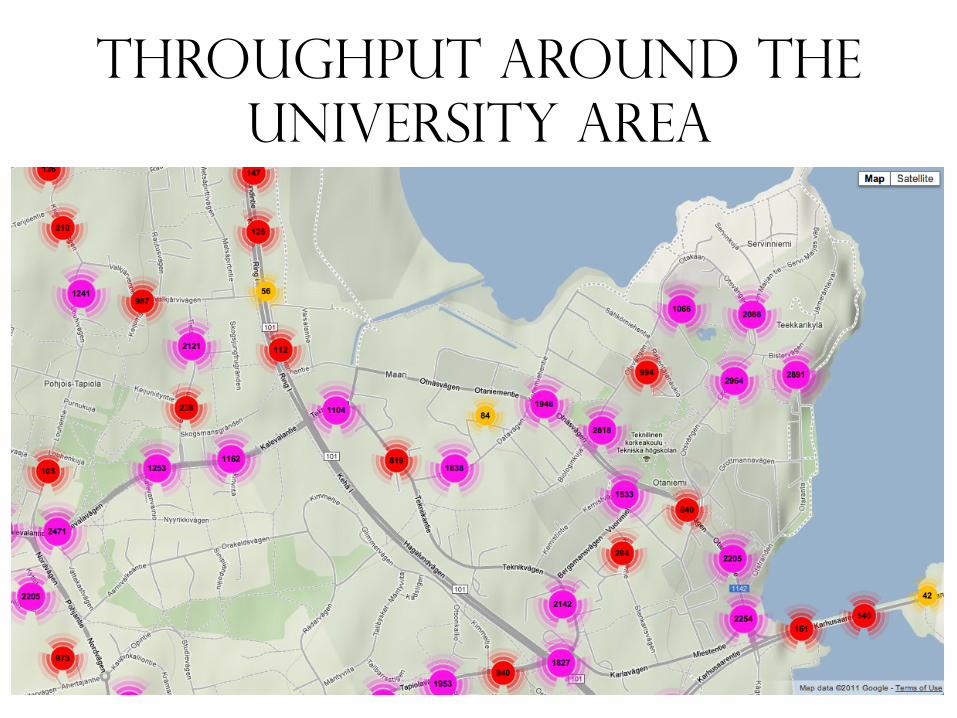
Throughput Around the University Area
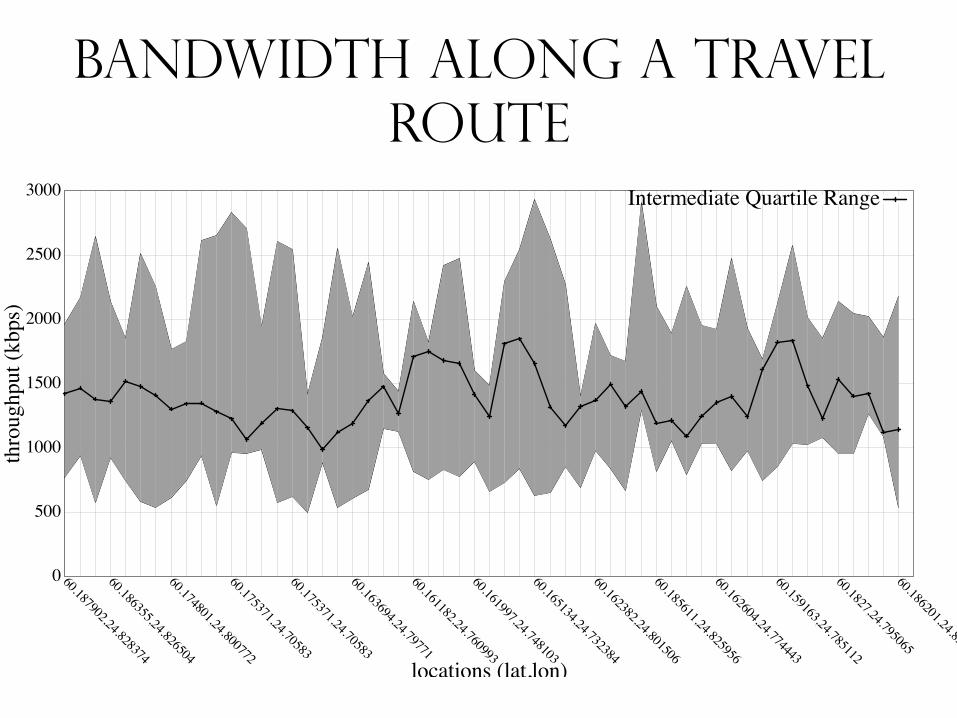
Bandwidth along a travel route
0
500
1000
1500
2000
2500
3000
60.187902,24.828374
60.186355,24.826504
60.174801,24.800772
60.175371,24.70583
60.175371,24.70583
60.163694,24.79771
60.161182,24.760993
60.161997,24.748103
60.165134,24.732384
60.162382,24.801506
60.185611,24.825956
60.162604,24.774443
60.159163,24.785112
60.1827,24.795065
60.186201,24.823197
thro
ughp
ut (k
bps)
locations (lat,lon)
Intermediate Quartile Range
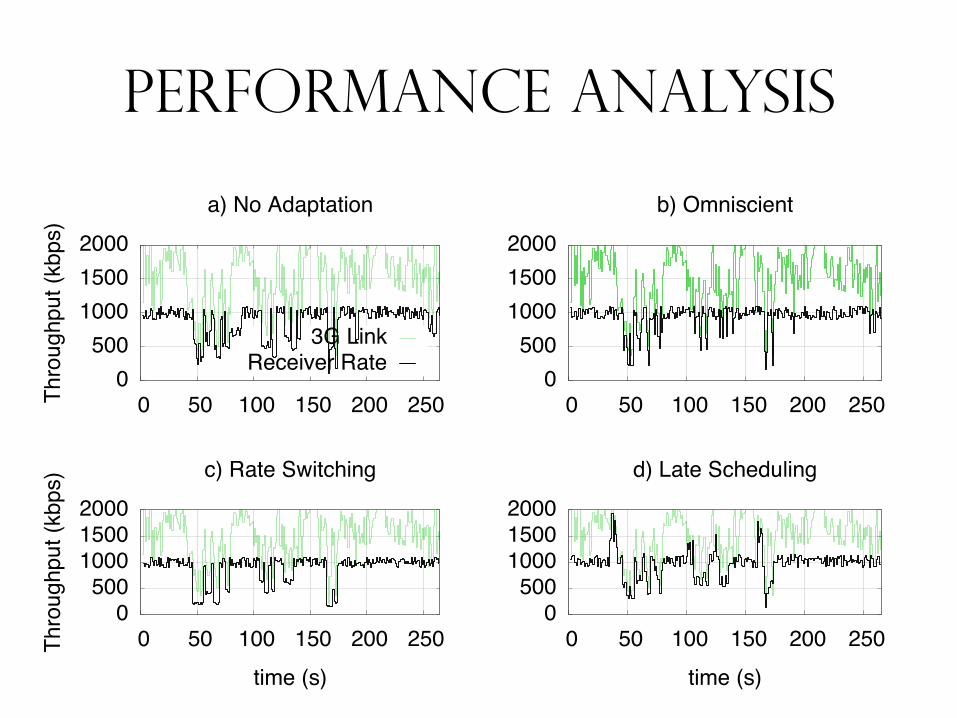
Performance Analysis
0 500
1000 1500 2000
0 50 100 150 200 250Thro
ughp
ut (k
bps)
a) No Adaptation
3G LinkReceiver Rate
0 500
1000 1500 2000
0 50 100 150 200 250Thro
ughp
ut (k
bps)
time (s)
c) Rate Switching
0 500
1000 1500 2000
0 50 100 150 200 250
b) Omniscient
0 500
1000 1500 2000
0 50 100 150 200 250time (s)
d) Late Scheduling
Video Quality
• Average PSNR over multiple runs
• No adaptation: 27.5
• Omniscient: 43.12
• Rate-switching: 42.75
• Late-switching: 48.43
0
0.2
0.4
0.6
0.8
1
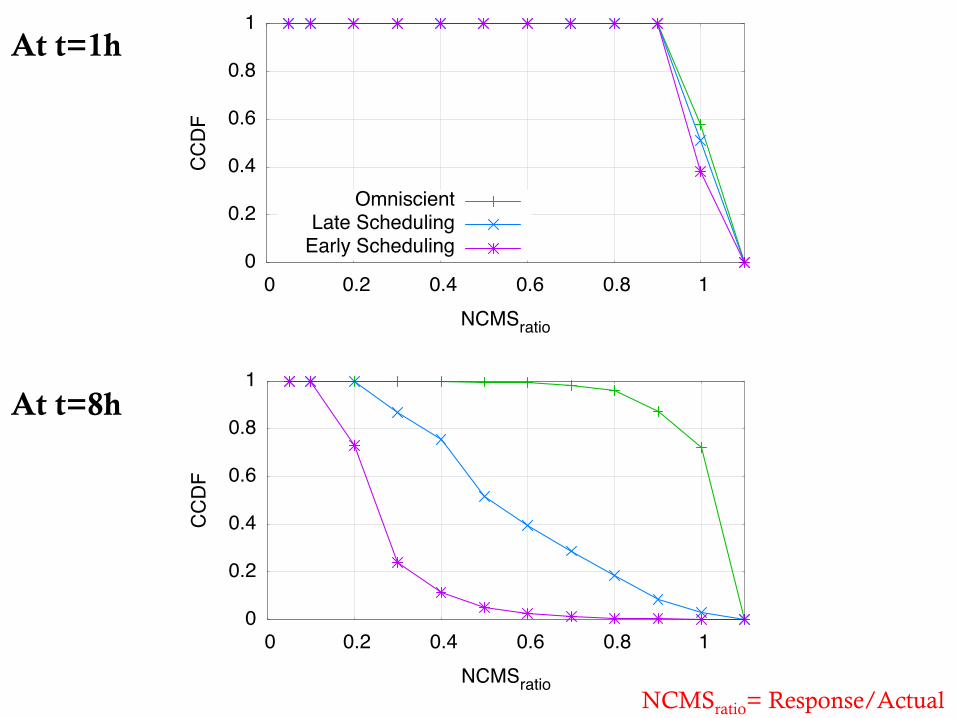
0 0.2 0.4 0.6 0.8 1
CC
DF
NCMSratio
OmniscientLate Scheduling
Early Scheduling
0
0.2
0.4
0.6
0.8
1
0 0.2 0.4 0.6 0.8 1
CC
DF
NCMSratio
At t=1h
At t=8h
NCMSratio= Response/Actual
Conclusions
• We find that the information provided by coverage map service is suitable for – Predictive rate-switching
– Predictive pre-buffering
• Future Work: Integrate with a DASH system


![Predictive Buffering for Streaming Video in 3G Networks · the video quality [10]. This problem has been the focus for 3GPP in the recent years (e.g. [11], [12]). A streaming client](https://img.pdfslide.net/doc/110x75/60510baf11a9f5473312c2ae/predictive-buffering-for-streaming-video-in-3g-the-video-quality-10-this-problem.jpg)