Embed Size (px)
Citation preview
www.mercer.com
Predictive Modeling Strategies for Disease Management Programs
December 14, 2007
The National Predictive Modeling Summit
Steve Johnson, Ph.D.
Linda Shields, RN, BSN
1Mercer
Topics
Predictive modeling overview.
Methodologies for identifying high cost individuals.
Predictive modeling results for Medicaid populations.
2Mercer
The $64,000 Question
Does predictive modeling work?— Definitely yes; predictive modeling techniques have proven to be
very successful in identifying members that will be expensive in future time periods.
Is predictive modeling perfect?— No, most models will generate some false positives, and identify
people that will not be among the most expensive in the next time period.
Are predictive modeling results improving?— Yes, the models are getting better, and health plans are
developing more effective strategies to mine the data.
3Mercer
Predictive Modeling Objectives
Identify members that are projected to be high cost in the future for additional interventions, in an effort to reduce their future expenditures.
— Members must have ongoing health care needs.
Stratify members by their projected health care needs to be able to determine the appropriate intervention.
Identify members that are currently inexpensive and are at the early stages of a disease onset, that would have not been identified by more traditional risk adjustment techniques.
4Mercer
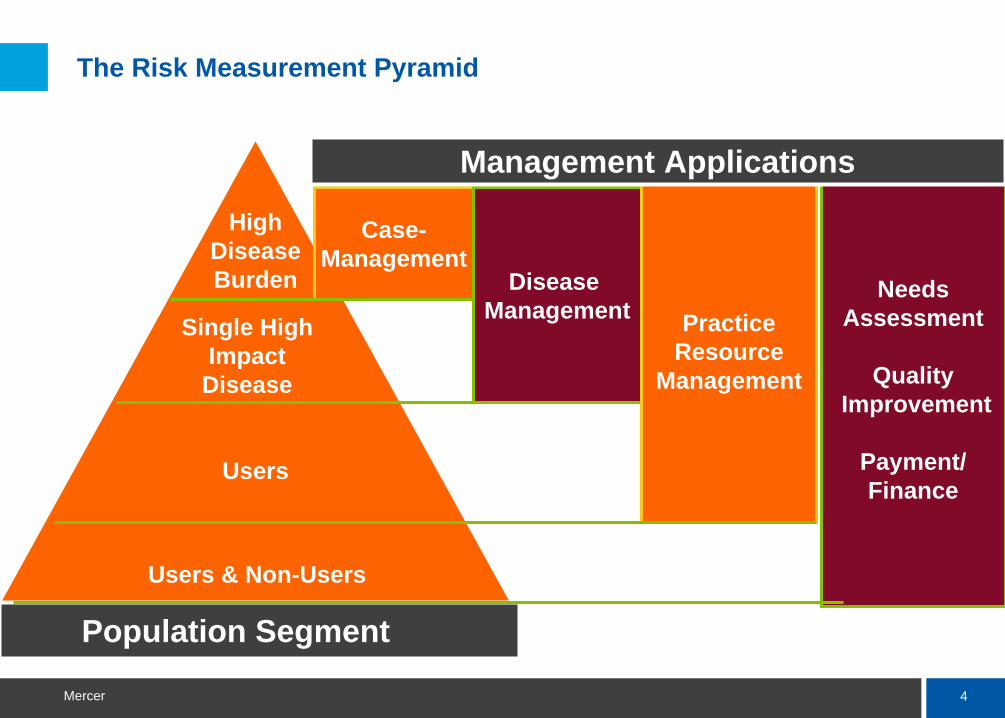
NeedsAssessment
Quality Improvement
Payment/Finance
The Risk Measurement Pyramid
Case-Management
Disease Management Practice
ResourceManagement
HighDisease Burden
Single High Impact
Disease
Users
Users & Non-Users
Management Applications
Population Segment
5Mercer
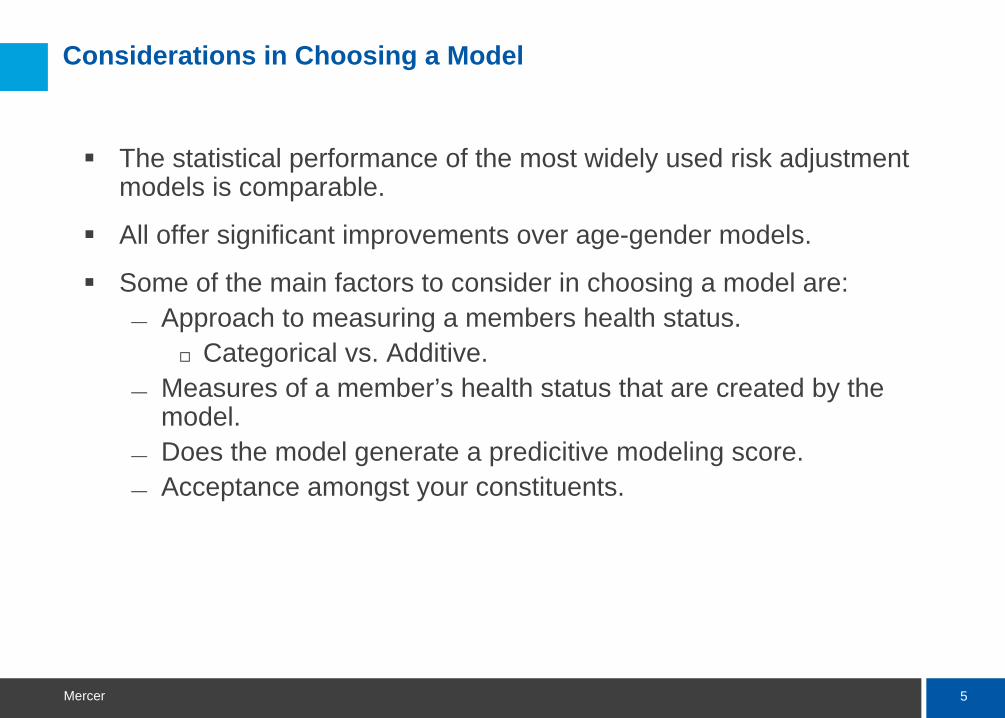
Considerations in Choosing a Model
The statistical performance of the most widely used risk adjustment models is comparable.
All offer significant improvements over age-gender models.
Some of the main factors to consider in choosing a model are:— Approach to measuring a members health status.
Categorical vs. Additive.— Measures of a member’s health status that are created by the
model.— Does the model generate a predicitive modeling score.— Acceptance amongst your constituents.
6Mercer
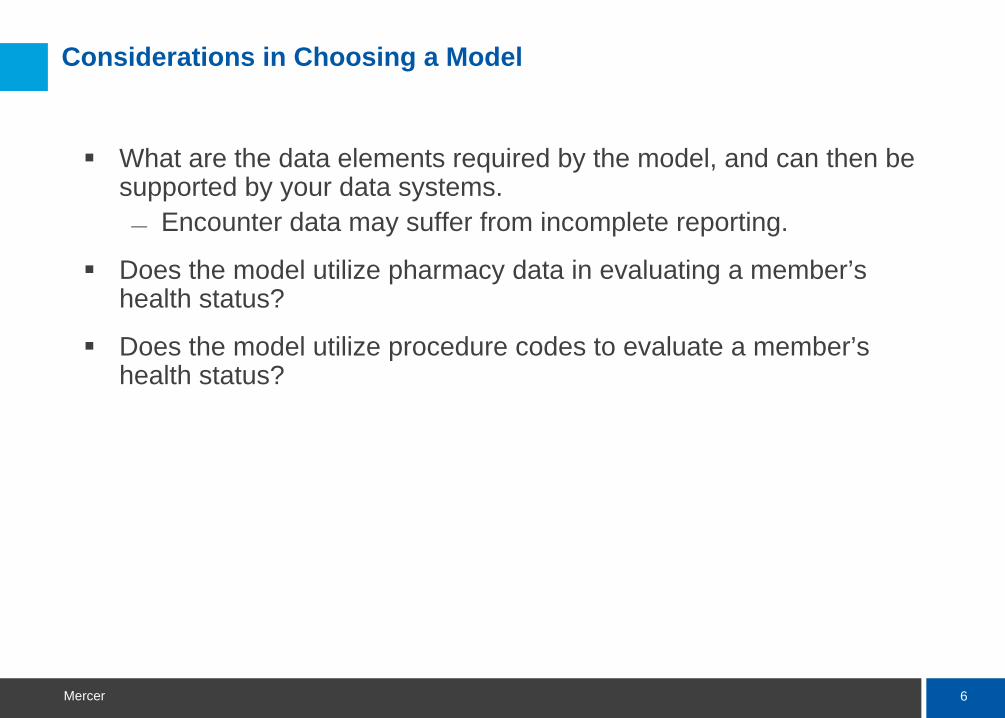
Considerations in Choosing a Model
What are the data elements required by the model, and can then be supported by your data systems.
— Encounter data may suffer from incomplete reporting.
Does the model utilize pharmacy data in evaluating a member’s health status?
Does the model utilize procedure codes to evaluate a member’s health status?
7Mercer
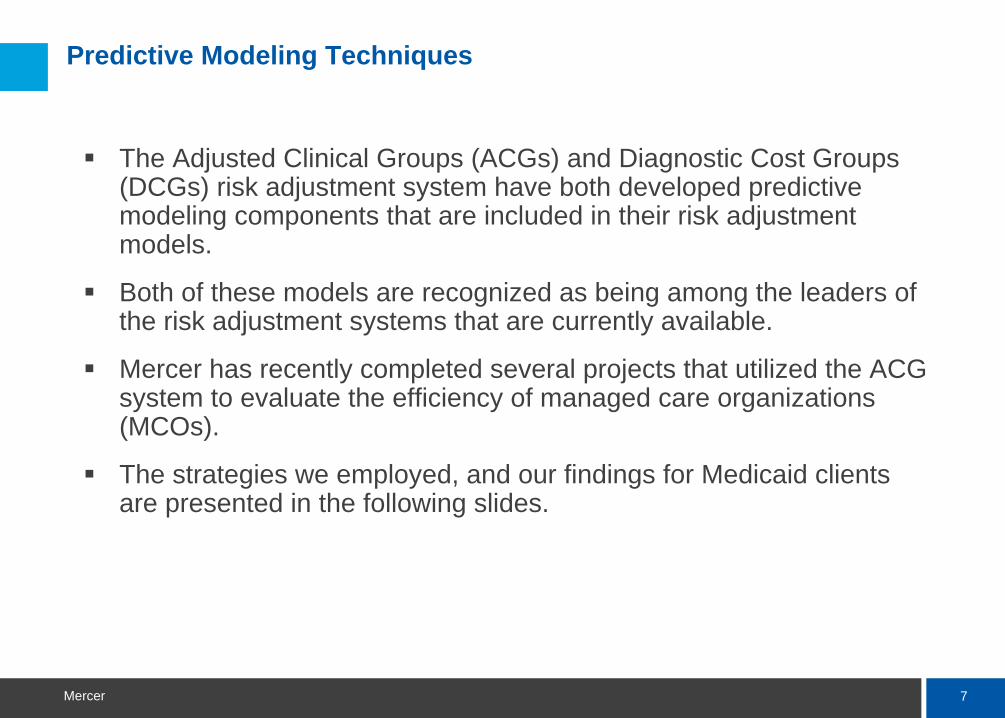
Predictive Modeling Techniques
The Adjusted Clinical Groups (ACGs) and Diagnostic Cost Groups (DCGs) risk adjustment system have both developed predictive modeling components that are included in their risk adjustment models.
Both of these models are recognized as being among the leaders of the risk adjustment systems that are currently available.
Mercer has recently completed several projects that utilized the ACG system to evaluate the efficiency of managed care organizations (MCOs).
The strategies we employed, and our findings for Medicaid clients are presented in the following slides.
8Mercer
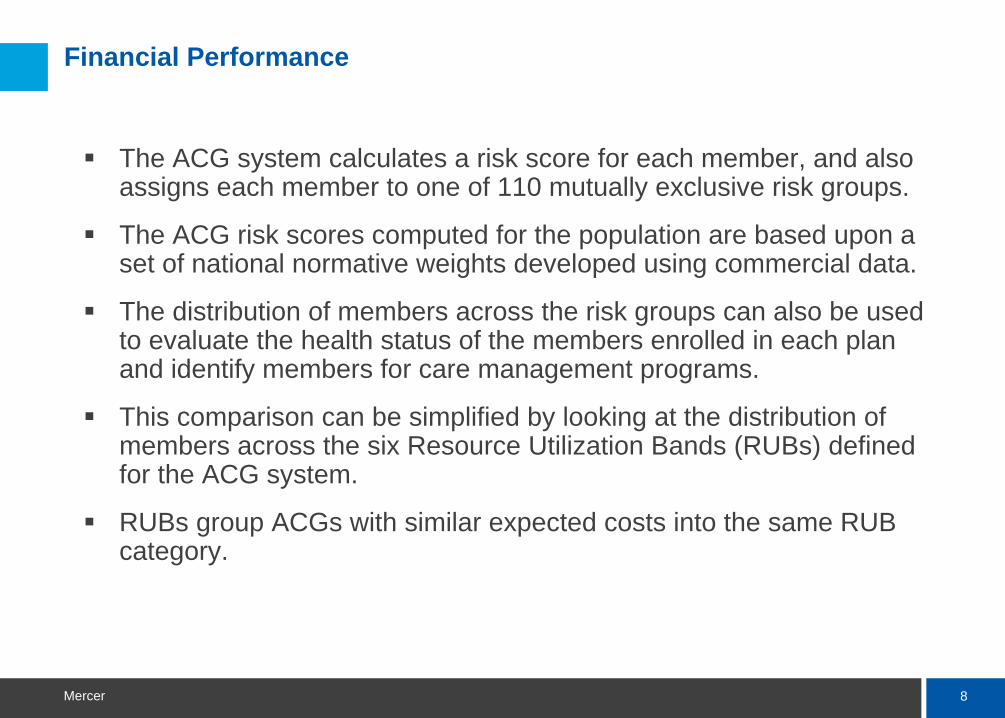
Financial Performance
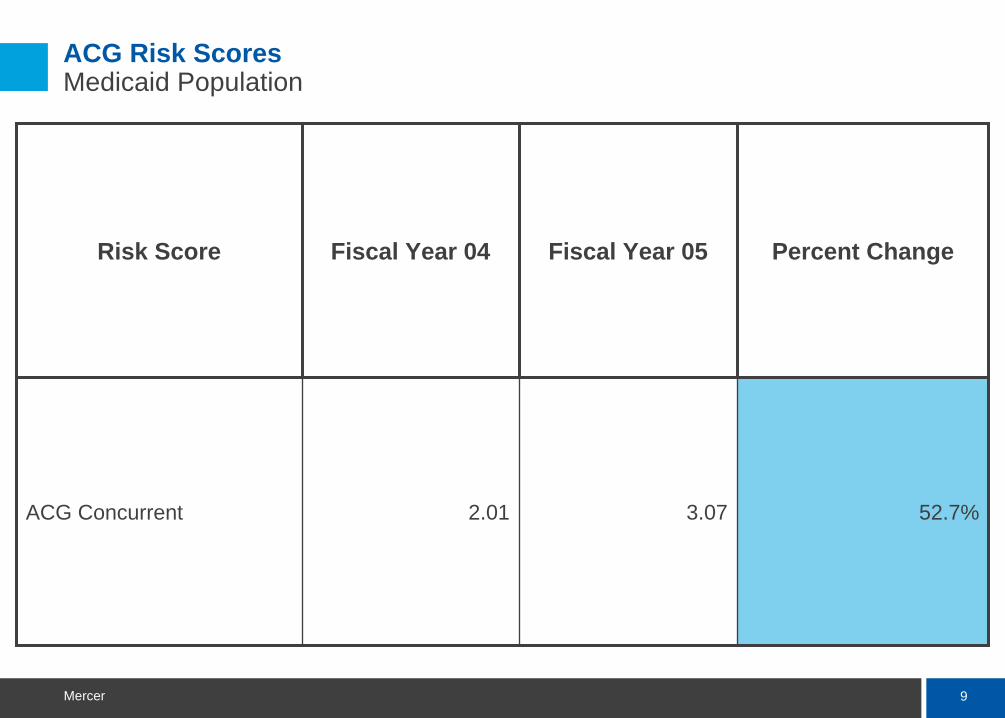
The ACG system calculates a risk score for each member, and alsoassigns each member to one of 110 mutually exclusive risk groups.
The ACG risk scores computed for the population are based upon aset of national normative weights developed using commercial data.
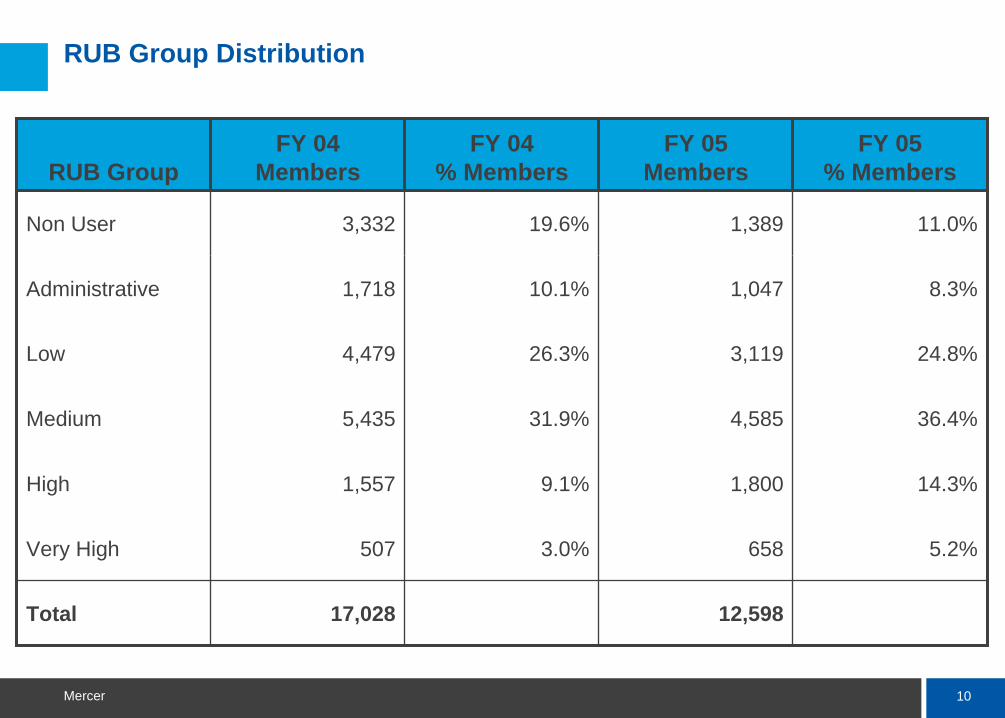
The distribution of members across the risk groups can also be used to evaluate the health status of the members enrolled in each plan and identify members for care management programs.
This comparison can be simplified by looking at the distribution of members across the six Resource Utilization Bands (RUBs) definedfor the ACG system.
RUBs group ACGs with similar expected costs into the same RUB category.
9Mercer
ACG Risk Scores Medicaid Population
Risk Score Fiscal Year 04 Fiscal Year 05 Percent Change
ACG Concurrent 2.01 3.07 52.7%
10Mercer
RUB Group Distribution
RUB GroupFY 04
MembersFY 04
% MembersFY 05
MembersFY 05
% Members
Non User 3,332 19.6% 1,389 11.0%
Administrative 1,718 10.1% 1,047 8.3%
Low 4,479 26.3% 3,119 24.8%
Medium 5,435 31.9% 4,585 36.4%
High 1,557 9.1% 1,800 14.3%
Very High 507 3.0% 658 5.2%
Total 17,028 12,598
11Mercer
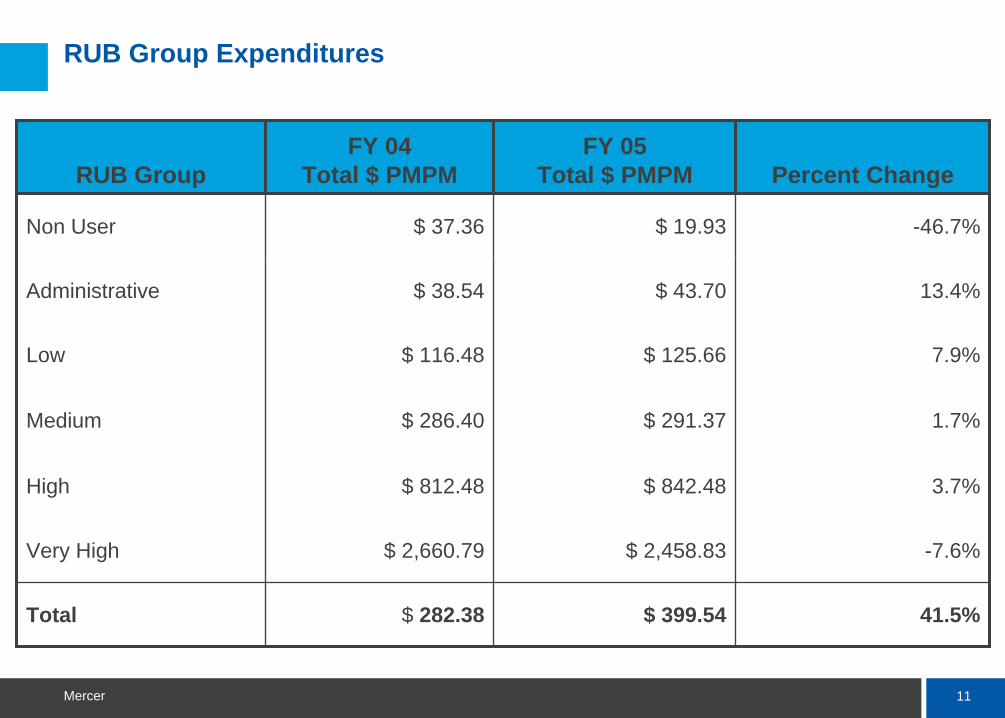
RUB Group Expenditures
RUB GroupFY 04
Total $ PMPMFY 05
Total $ PMPM Percent Change
Non User $ 37.36 $ 19.93 -46.7%
Administrative $ 38.54 $ 43.70 13.4%
Low $ 116.48 $ 125.66 7.9%
Medium $ 286.40 $ 291.37 1.7%
High $ 812.48 $ 842.48 3.7%
Very High $ 2,660.79 $ 2,458.83 -7.6%
Total $ 282.38 $ 399.54 41.5%
Prevalence of Chronic Conditions
13Mercer
Prevalence of Chronic Conditions
The ACG grouper also identifies members with chronic conditions that are amenable to disease management interventions.
These chronic condition markers can be used to evaluate the prevalence of chronic conditions within a population.
The chronic conditions that are identified by the ACG grouper are:— Arthritis, Asthma, Back Pain, COPD, CHF, Diabetes, Depression,
Hyperlipidemia, Hypertension, Ischemic Heart Disease, and Renal Failure.
Members with multiple chronic conditions would have a marker foreach condition.
14Mercer
Prevalence of Chronic Conditions
To avoid counting a member in multiple disease categories, a chronic condition hierarchy was used to assign each member to 1 chronic disease category.
The hierarchy that was used to assign members is as follows:— Renal Failure, CHF, COPD, Ischemic Heart Disease, Depression,
Asthma, Diabetes, Hyperlipidemia, Hypertension, Arthritis, and Low Back Pain.
The number of members identified with each chronic condition, after applying this hierarchy is provided on the next table.
15Mercer
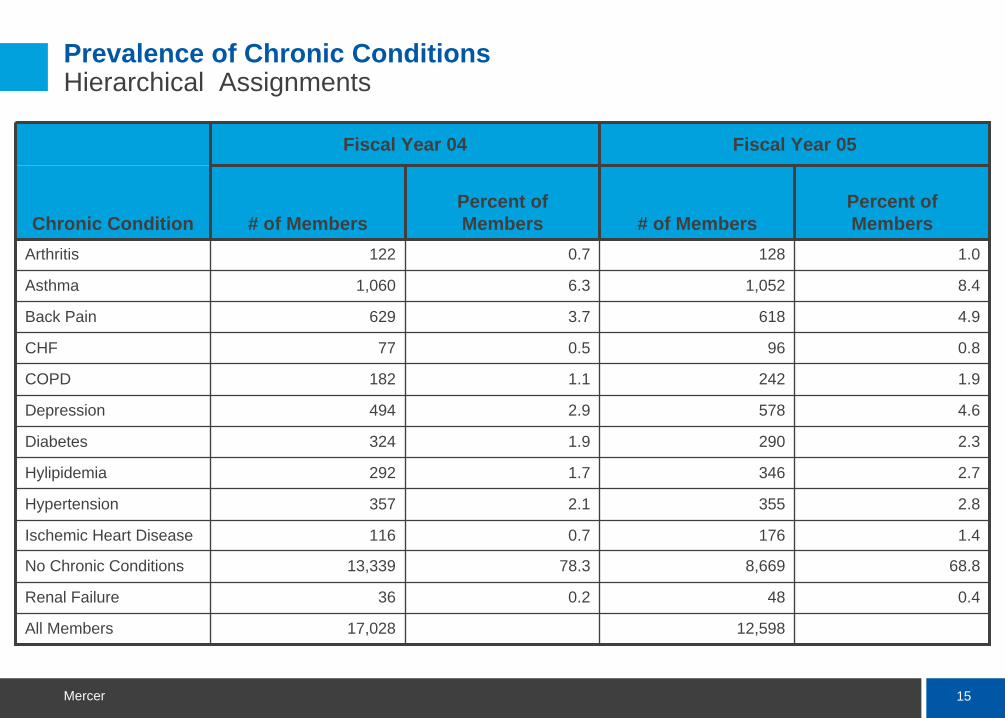
Prevalence of Chronic Conditions Hierarchical Assignments
Fiscal Year 04 Fiscal Year 05
Chronic Condition # of MembersPercent of Members # of Members
Percent of Members
Arthritis 122 0.7 128 1.0
Asthma 1,060 6.3 1,052 8.4
Back Pain 629 3.7 618 4.9
CHF 77 0.5 96 0.8
COPD 182 1.1 242 1.9
Depression 494 2.9 578 4.6
Diabetes 324 1.9 290 2.3
Hylipidemia 292 1.7 346 2.7
Hypertension 357 2.1 355 2.8
Ischemic Heart Disease 116 0.7 176 1.4
No Chronic Conditions 13,339 78.3 8,669 68.8
Renal Failure 36 0.2 48 0.4
All Members 17,028 12,598
16Mercer
Chronic Conditions Expenditures
Utilization rates will vary among members within each chronic condition category depending upon their health status.
The cost and complexity of caring for a patient with any of these chronic conditions will be affected by the number of comorbidites that each member has, which will impact their health status.
These factors can be accounted for by examining the RUB group assignment for members with chronic conditions.
The following slides profile the health care utilization of the members in each chronic condition category based upon their RUB group assignment.
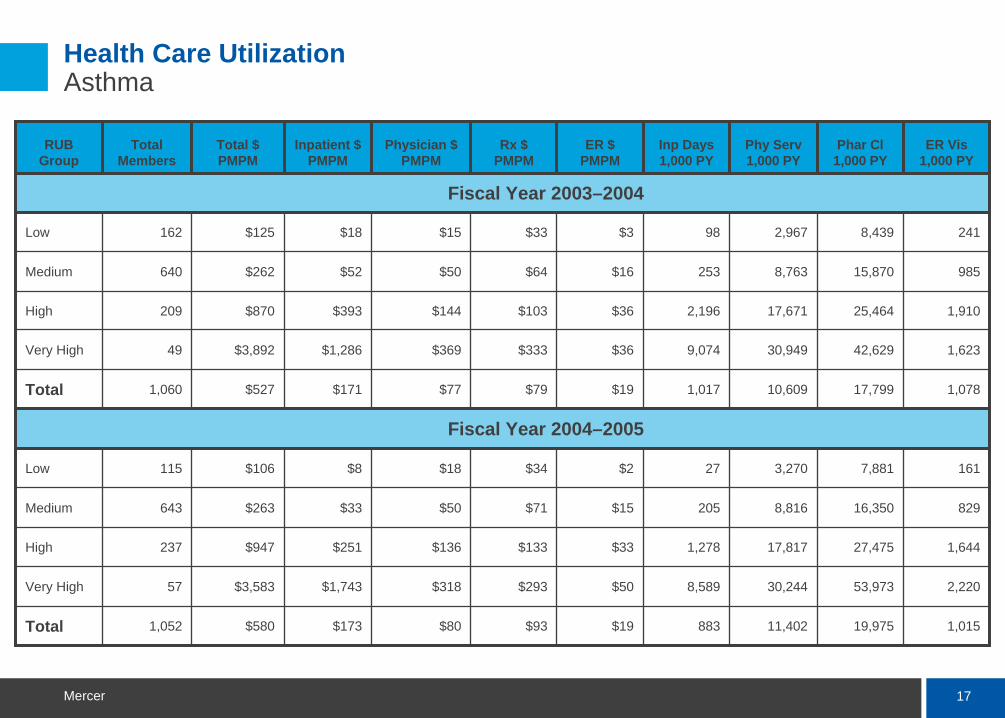
17Mercer
Health Care Utilization Asthma
RUB Group
Total Members
Total $ PMPM
Inpatient $ PMPM
Physician $ PMPM
Rx $ PMPM
ER $ PMPM
Inp Days 1,000 PY
Phy Serv 1,000 PY
Phar Cl 1,000 PY
ER Vis 1,000 PY
Fiscal Year 2003–2004
Low 162 $125 $18 $15 $33 $3 98 2,967 8,439 241
Medium 640 $262 $52 $50 $64 $16 253 8,763 15,870 985
High 209 $870 $393 $144 $103 $36 2,196 17,671 25,464 1,910
Very High 49 $3,892 $1,286 $369 $333 $36 9,074 30,949 42,629 1,623
Total 1,060 $527 $171 $77 $79 $19 1,017 10,609 17,799 1,078
Fiscal Year 2004–2005
Low 115 $106 $8 $18 $34 $2 27 3,270 7,881 161
Medium 643 $263 $33 $50 $71 $15 205 8,816 16,350 829
High 237 $947 $251 $136 $133 $33 1,278 17,817 27,475 1,644
Very High 57 $3,583 $1,743 $318 $293 $50 8,589 30,244 53,973 2,220
Total 1,052 $580 $173 $80 $93 $19 883 11,402 19,975 1,015
18Mercer
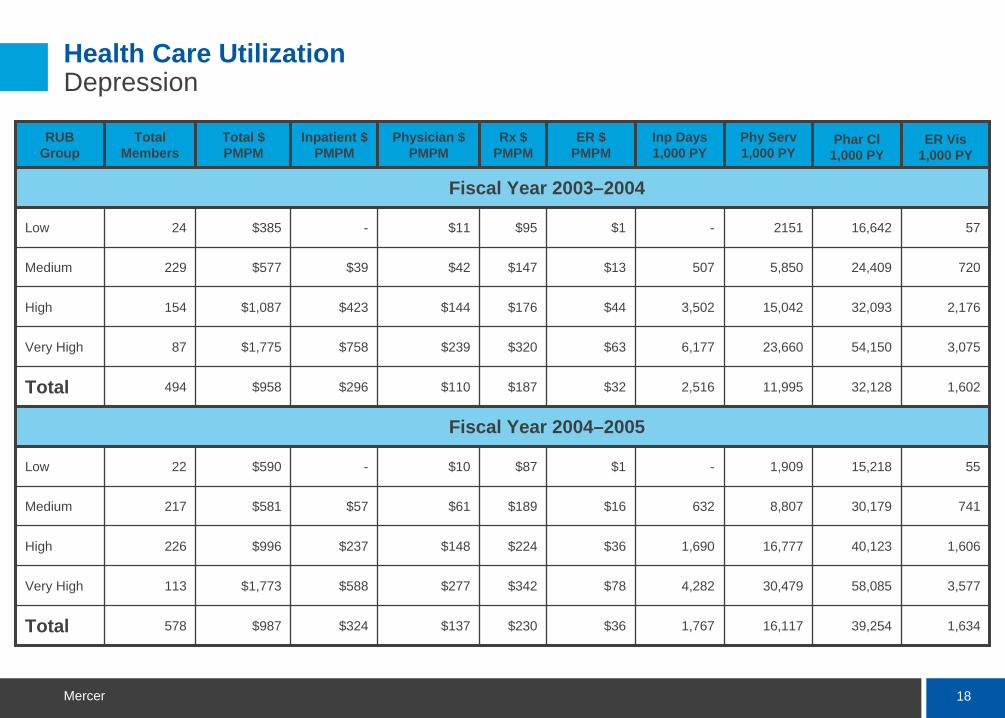
Health Care Utilization Depression
RUB Group
Total Members
Total $ PMPM
Inpatient $ PMPM
Physician $ PMPM
Rx $ PMPM
ER $ PMPM
Inp Days 1,000 PY
Phy Serv 1,000 PY
Phar Cl 1,000 PY
ER Vis 1,000 PY
Fiscal Year 2003–2004
Low 24 $385 - $11 $95 $1 - 2151 16,642 57
Medium 229 $577 $39 $42 $147 $13 507 5,850 24,409 720
High 154 $1,087 $423 $144 $176 $44 3,502 15,042 32,093 2,176
Very High 87 $1,775 $758 $239 $320 $63 6,177 23,660 54,150 3,075
Total 494 $958 $296 $110 $187 $32 2,516 11,995 32,128 1,602
Fiscal Year 2004–2005
Low 22 $590 - $10 $87 $1 - 1,909 15,218 55
Medium 217 $581 $57 $61 $189 $16 632 8,807 30,179 741
High 226 $996 $237 $148 $224 $36 1,690 16,777 40,123 1,606
Very High 113 $1,773 $588 $277 $342 $78 4,282 30,479 58,085 3,577
Total 578 $987 $324 $137 $230 $36 1,767 16,117 39,254 1,634
19Mercer
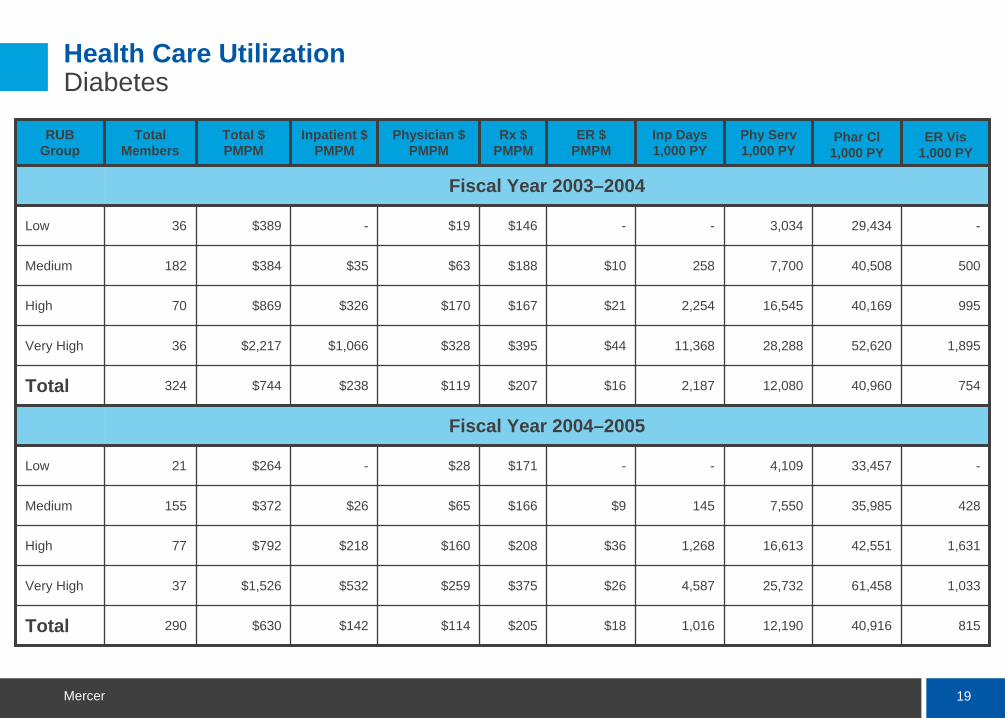
Health Care Utilization Diabetes
RUB Group
Total Members
Total $ PMPM
Inpatient $ PMPM
Physician $ PMPM
Rx $ PMPM
ER $ PMPM
Inp Days 1,000 PY
Phy Serv 1,000 PY
Phar Cl 1,000 PY
ER Vis 1,000 PY
Fiscal Year 2003–2004
Low 36 $389 - $19 $146 - - 3,034 29,434 -
Medium 182 $384 $35 $63 $188 $10 258 7,700 40,508 500
High 70 $869 $326 $170 $167 $21 2,254 16,545 40,169 995
Very High 36 $2,217 $1,066 $328 $395 $44 11,368 28,288 52,620 1,895
Total 324 $744 $238 $119 $207 $16 2,187 12,080 40,960 754
Fiscal Year 2004–2005
Low 21 $264 - $28 $171 - - 4,109 33,457 -
Medium 155 $372 $26 $65 $166 $9 145 7,550 35,985 428
High 77 $792 $218 $160 $208 $36 1,268 16,613 42,551 1,631
Very High 37 $1,526 $532 $259 $375 $26 4,587 25,732 61,458 1,033
Total 290 $630 $142 $114 $205 $18 1,016 12,190 40,916 815
Disease Management and Predictive Modeling
21Mercer
Disease Management and Predicitive Modeling
The chronic condition markers can be used to identify members that are candidates for disease management programs.
The number of members with chronic conditions can be used to determine if there is sufficient membership to institute a disease management program.
The challenge is to identify a subset of members within each chronic condition that would benefit from a disease management program.
Members whose condition is stable and have few comorbidites may have moderate health care needs.
Complex members with multiple comorbidites will have significanthealth care needs and would benefit from the focus on the care offered by a disease management program.
22Mercer
Disease Management and Predicitive Modeling
The ACG system offers multiple measures that can be used to identify the subset of members that would benefit the most from a diseasemanagement program.
The ACG system calculates a predicitive modeling (PM) score for each member.
The PM score represents the probability that they will be in the top 5% most expensive members the following year.
A PM score of .95 indicates that there is a 95% chance that a member will be among the top 5% most expensive members the next year.
These scores can be used to identify a subset of members within each chronic condition that have significant health care needs.
23Mercer
Disease Management and Predicitive Modeling
The PM scores range from 0 to 1.
Members with a PM score of .9 or higher will be very expensive the next year, but this score will identify a small number of members.
Selecting a lower PM score will identify more members, but some of these members will have lower costs in the following year.
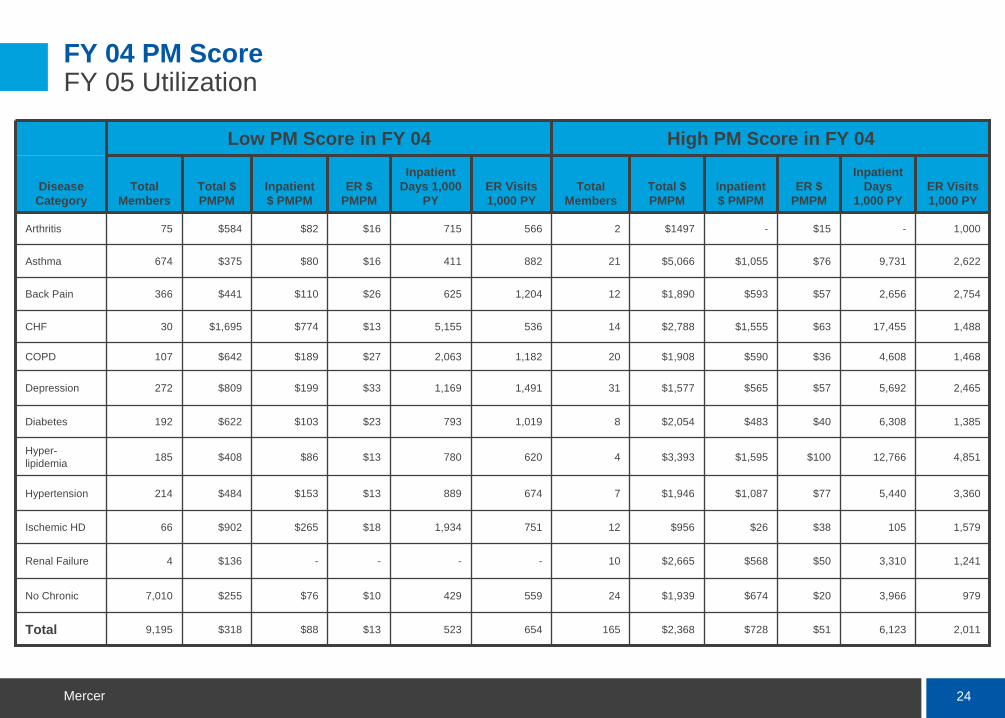
The following chart identified members as high risk if they had a PM score of .6 or higher.
The chart looks at a cohort of members that were enrolled in both FY04 and FY05.
Their FY04 PM score is related to their FY05 expenditures.
24Mercer
FY 04 PM Score FY 05 Utilization
Low PM Score in FY 04 High PM Score in FY 04
Disease Category
Total Members
Total $ PMPM
Inpatient $ PMPM
ER $ PMPM
Inpatient Days 1,000
PYER Visits 1,000 PY
Total Members
Total $ PMPM
Inpatient $ PMPM
ER $ PMPM
Inpatient Days
1,000 PYER Visits 1,000 PY
Arthritis 75 $584 $82 $16 715 566 2 $1497 - $15 - 1,000
Asthma 674 $375 $80 $16 411 882 21 $5,066 $1,055 $76 9,731 2,622
Back Pain 366 $441 $110 $26 625 1,204 12 $1,890 $593 $57 2,656 2,754
CHF 30 $1,695 $774 $13 5,155 536 14 $2,788 $1,555 $63 17,455 1,488
COPD 107 $642 $189 $27 2,063 1,182 20 $1,908 $590 $36 4,608 1,468
Depression 272 $809 $199 $33 1,169 1,491 31 $1,577 $565 $57 5,692 2,465
Diabetes 192 $622 $103 $23 793 1,019 8 $2,054 $483 $40 6,308 1,385
Hyper- lipidemia 185 $408 $86 $13 780 620 4 $3,393 $1,595 $100 12,766 4,851
Hypertension 214 $484 $153 $13 889 674 7 $1,946 $1,087 $77 5,440 3,360
Ischemic HD 66 $902 $265 $18 1,934 751 12 $956 $26 $38 105 1,579
Renal Failure 4 $136 - - - - 10 $2,665 $568 $50 3,310 1,241
No Chronic 7,010 $255 $76 $10 429 559 24 $1,939 $674 $20 3,966 979
Total 9,195 $318 $88 $13 523 654 165 $2,368 $728 $51 6,123 2,011
25Mercer
Disease Management and Predicitive Modeling
The PM score identified a small subset of members within each chronic condition that had dramatically higher expenses in FY05.
Asthmatics with a high PM score cost $5,066 PMPM in FY05, members with a low PM score cost $376.
The separation between the PM groups is smaller for the CHF chronic condition group.
All members with a high PM score cost $2,368 in FY05, members with a low PM score cost $318.
The PM score offers one method for identifying an expensive subset of members within each chronic condition.
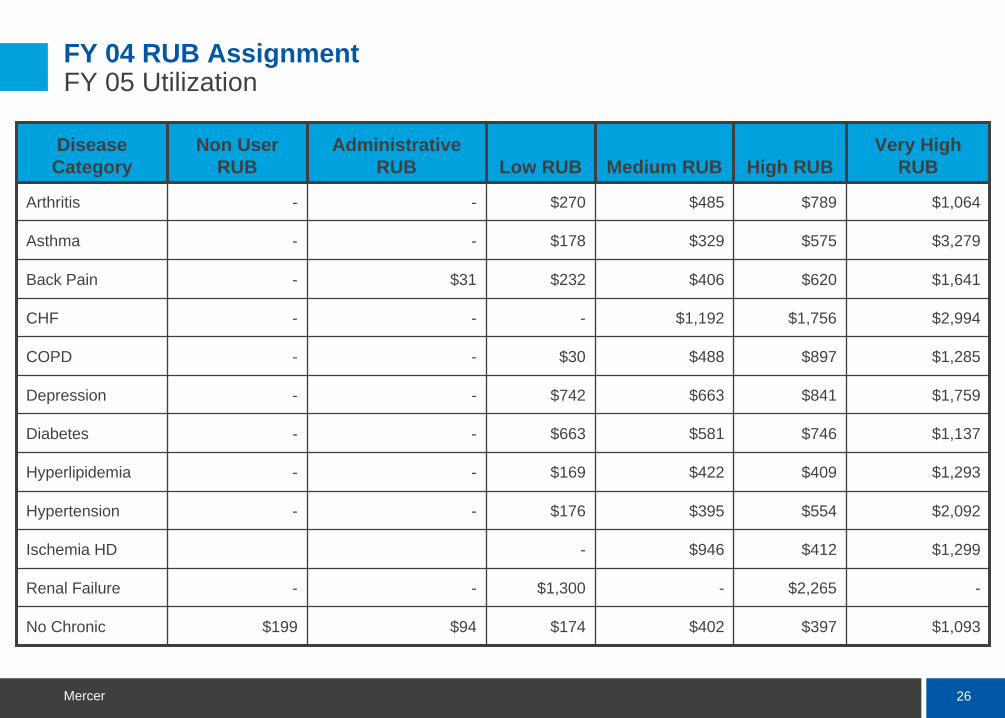
Another alternative is to look at a member’s RUB group assignment.
The following chart relates a member’s FY04 RUB group assignment to their FY05 expenditures.
26Mercer
FY 04 RUB Assignment FY 05 Utilization
Disease Category
Non User RUB
Administrative RUB Low RUB Medium RUB High RUB
Very High RUB
Arthritis - - $270 $485 $789 $1,064
Asthma - - $178 $329 $575 $3,279
Back Pain - $31 $232 $406 $620 $1,641
CHF - - - $1,192 $1,756 $2,994
COPD - - $30 $488 $897 $1,285
Depression - - $742 $663 $841 $1,759
Diabetes - - $663 $581 $746 $1,137
Hyperlipidemia - - $169 $422 $409 $1,293
Hypertension - - $176 $395 $554 $2,092
Ischemia HD - $946 $412 $1,299
Renal Failure - - $1,300 - $2,265 -
No Chronic $199 $94 $174 $402 $397 $1,093
27Mercer
Disease Management and Predicitive Modeling
Another measure created by the ACG system that can be used to identify a subset of high cost members is to look at the number of comorbidites that a member has.
Members with multiple chronic conditions will be more complex to treat and generally have more significant health care needs.
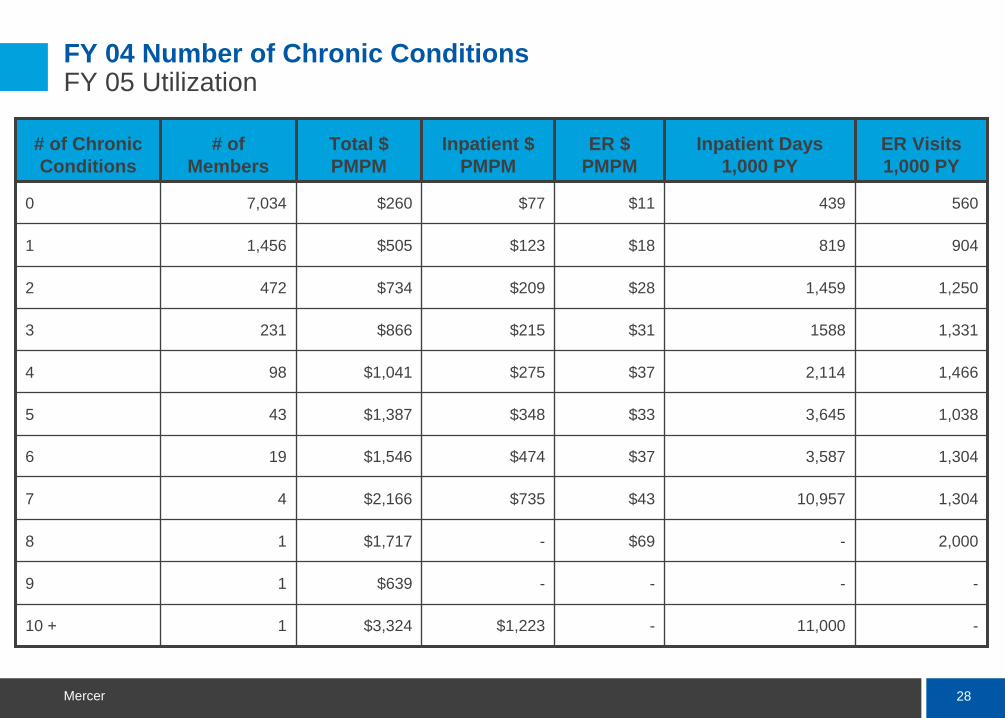
The chart on the following slide relates the number of chronic condition markers a member had in FY04 to their expenses in FY05.
Members with 4 or more chronic conditions in FY04 were significantly more expensive than members with 0 or 1 chronic conditions.
28Mercer
FY 04 Number of Chronic Conditions FY 05 Utilization
# of Chronic Conditions
# of Members
Total $ PMPM
Inpatient $ PMPM
ER $ PMPM
Inpatient Days 1,000 PY
ER Visits 1,000 PY
0 7,034 $260 $77 $11 439 560
1 1,456 $505 $123 $18 819 904
2 472 $734 $209 $28 1,459 1,250
3 231 $866 $215 $31 1588 1,331
4 98 $1,041 $275 $37 2,114 1,466
5 43 $1,387 $348 $33 3,645 1,038
6 19 $1,546 $474 $37 3,587 1,304
7 4 $2,166 $735 $43 10,957 1,304
8 1 $1,717 - $69 - 2,000
9 1 $639 - - - -
10 + 1 $3,324 $1,223 - 11,000 -
29Mercer
Disease Management and Predicitive Modeling
Another measure created by the ACG system is the number of hospital dominant conditions that a member has.
A hospital dominant condition is a diagnosis that has a high probability of requiring the member to be hospitalized in the following year.
The higher the number of hospital dominant conditions a member has, the greater their health care needs will be in the following year.
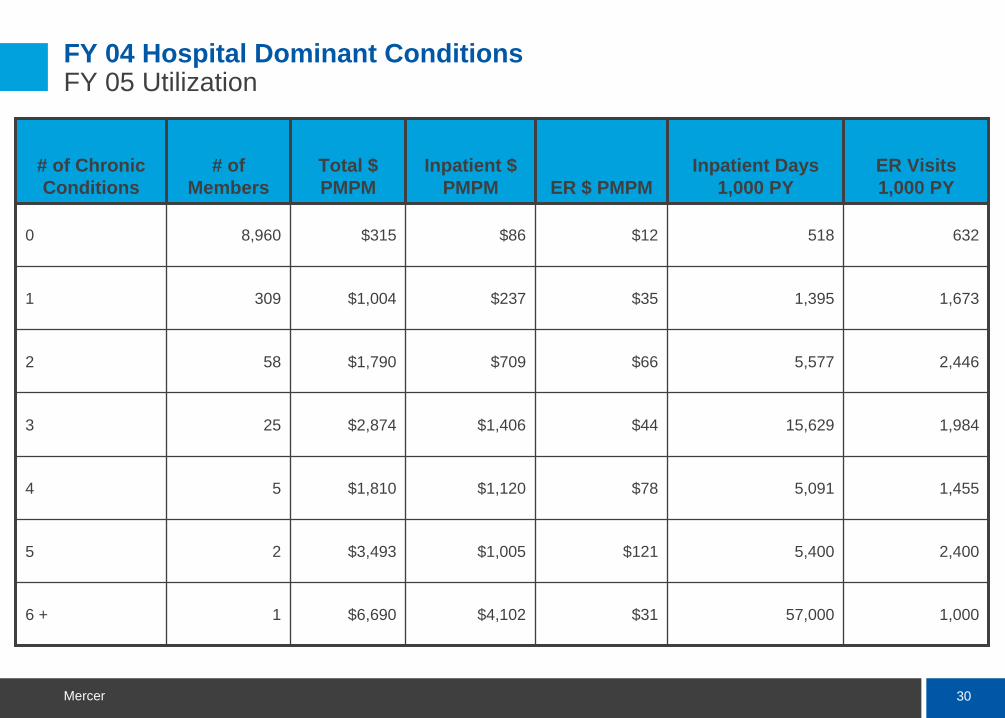
The following chart relates a members FY04 number of hospital dominant conditions to their FY05 expenditures.
Members with 1 or more hospital dominant conditions were significantly more expensive the following year.
30Mercer
FY 04 Hospital Dominant Conditions FY 05 Utilization
# of Chronic Conditions
# of Members
Total $ PMPM
Inpatient $ PMPM ER $ PMPM
Inpatient Days 1,000 PY
ER Visits 1,000 PY
0 8,960 $315 $86 $12 518 632
1 309 $1,004 $237 $35 1,395 1,673
2 58 $1,790 $709 $66 5,577 2,446
3 25 $2,874 $1,406 $44 15,629 1,984
4 5 $1,810 $1,120 $78 5,091 1,455
5 2 $3,493 $1,005 $121 5,400 2,400
6 + 1 $6,690 $4,102 $31 57,000 1,000
31Mercer
Disease Management and Predicitive Modeling
The combination of PM score, RUB group, number of chronic conditions, and number of hospital dominant conditions can be used to identify a subset of members that will be high cost in the following year.
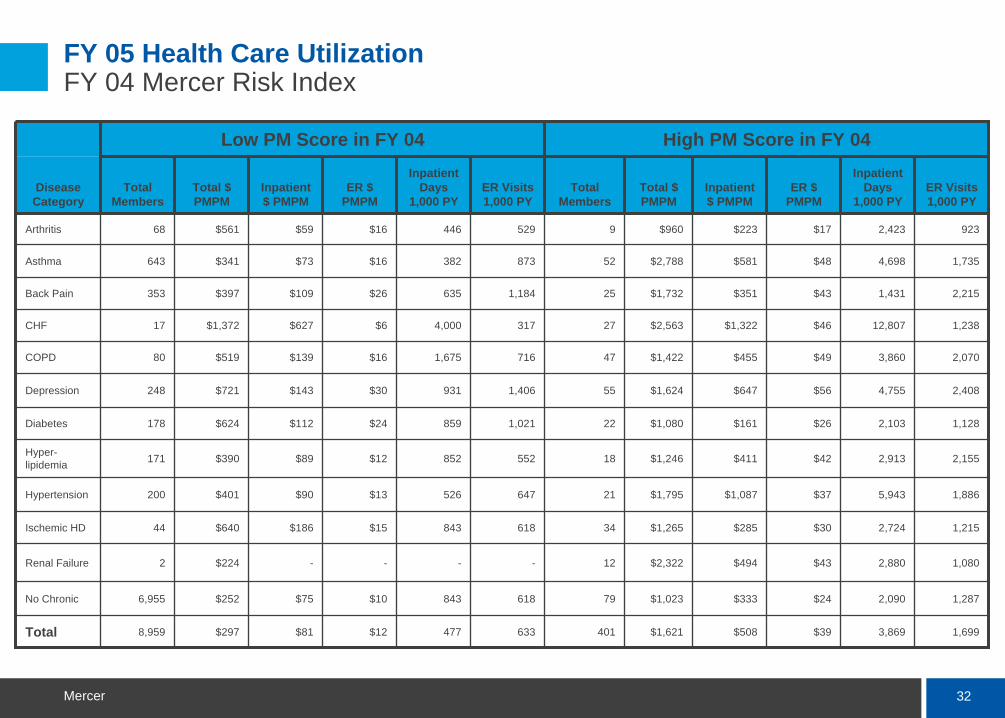
The following chart uses the Mercer Risk Index to identify high cost members based upon their FY04 ACG information.
The Mercer Risk Index is then related to their FY05 health care utilization.
32Mercer
FY 05 Health Care Utilization FY 04 Mercer Risk Index
Low PM Score in FY 04 High PM Score in FY 04
Disease Category
Total Members
Total $ PMPM
Inpatient $ PMPM
ER $ PMPM
Inpatient Days
1,000 PYER Visits 1,000 PY
Total Members
Total $ PMPM
Inpatient $ PMPM
ER $ PMPM
Inpatient Days
1,000 PYER Visits 1,000 PY
Arthritis 68 $561 $59 $16 446 529 9 $960 $223 $17 2,423 923
Asthma 643 $341 $73 $16 382 873 52 $2,788 $581 $48 4,698 1,735
Back Pain 353 $397 $109 $26 635 1,184 25 $1,732 $351 $43 1,431 2,215
CHF 17 $1,372 $627 $6 4,000 317 27 $2,563 $1,322 $46 12,807 1,238
COPD 80 $519 $139 $16 1,675 716 47 $1,422 $455 $49 3,860 2,070
Depression 248 $721 $143 $30 931 1,406 55 $1,624 $647 $56 4,755 2,408
Diabetes 178 $624 $112 $24 859 1,021 22 $1,080 $161 $26 2,103 1,128
Hyper- lipidemia 171 $390 $89 $12 852 552 18 $1,246 $411 $42 2,913 2,155
Hypertension 200 $401 $90 $13 526 647 21 $1,795 $1,087 $37 5,943 1,886
Ischemic HD 44 $640 $186 $15 843 618 34 $1,265 $285 $30 2,724 1,215
Renal Failure 2 $224 - - - - 12 $2,322 $494 $43 2,880 1,080
No Chronic 6,955 $252 $75 $10 843 618 79 $1,023 $333 $24 2,090 1,287
Total 8,959 $297 $81 $12 477 633 401 $1,621 $508 $39 3,869 1,699
33Mercer
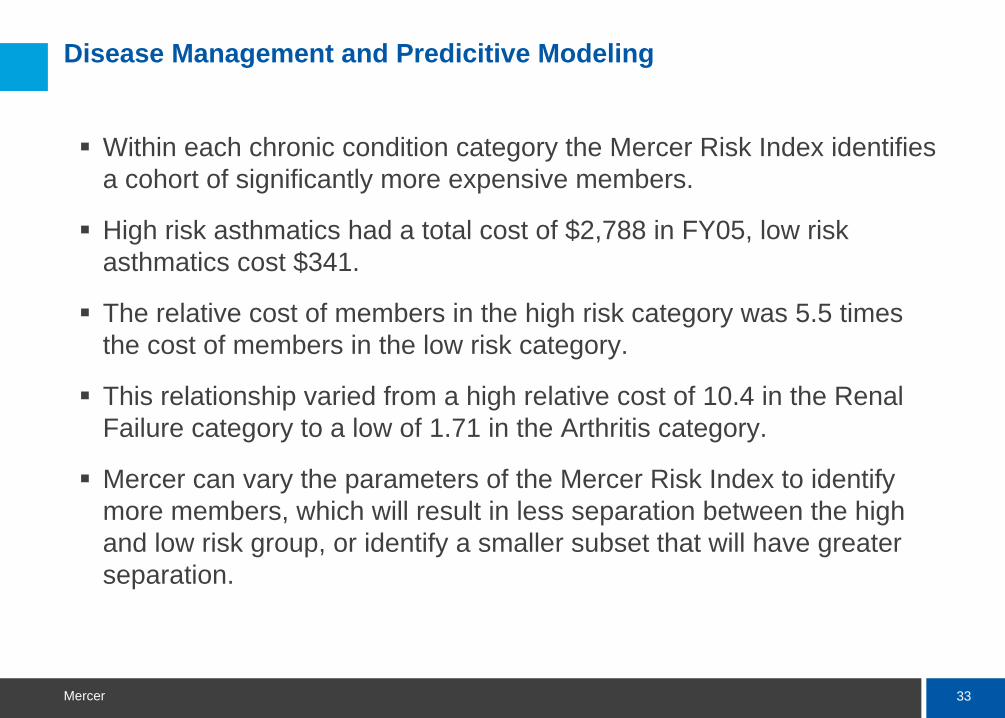
Disease Management and Predicitive Modeling
Within each chronic condition category the Mercer Risk Index identifies a cohort of significantly more expensive members.
High risk asthmatics had a total cost of $2,788 in FY05, low risk asthmatics cost $341.
The relative cost of members in the high risk category was 5.5 times the cost of members in the low risk category.
This relationship varied from a high relative cost of 10.4 in the Renal Failure category to a low of 1.71 in the Arthritis category.
Mercer can vary the parameters of the Mercer Risk Index to identify more members, which will result in less separation between the high and low risk group, or identify a smaller subset that will have greater separation.
34Mercer
Predictive Modeling Care Management Application
Frequency Distribution
Costs & Use
Impactable?
Quality Indicators
35Mercer
Health Risk Assessment
Self CareMailers
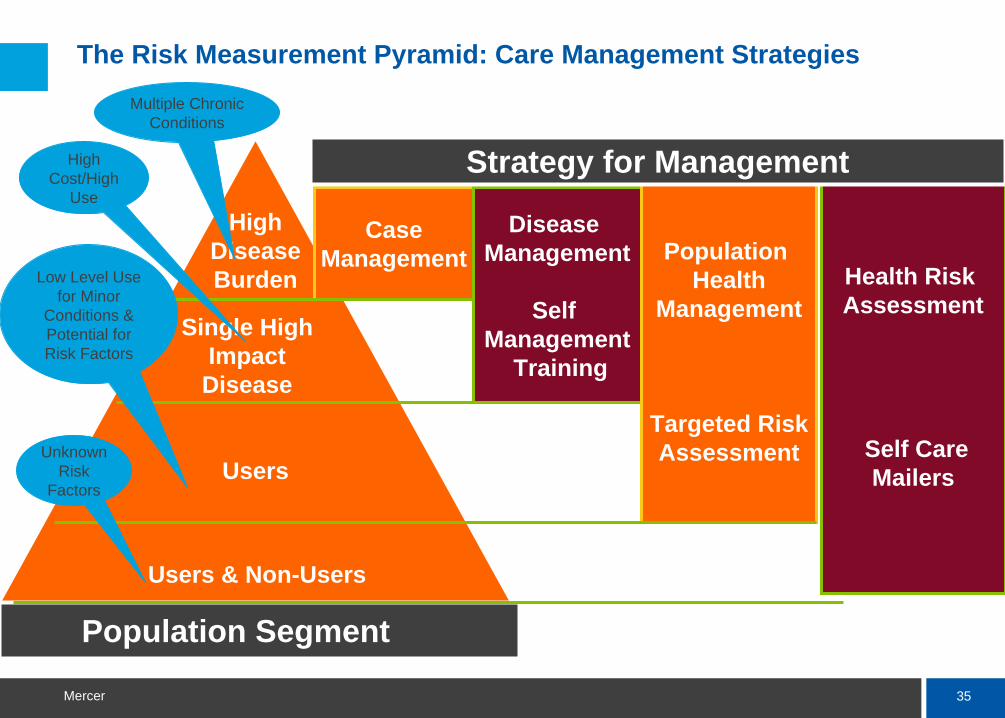
The Risk Measurement Pyramid: Care Management Strategies
CaseManagement
Disease Management
Self Management
Training
Population Health
Management
Targeted RiskAssessment
HighDisease Burden
Single High Impact
Disease
Users
Users & Non-Users
Strategy for Management
Population Segment
Multiple Chronic Conditions
High Cost/High
Use
Low Level Use for Minor
Conditions & Potential for Risk Factors
Unknown Risk
Factors
36Mercer
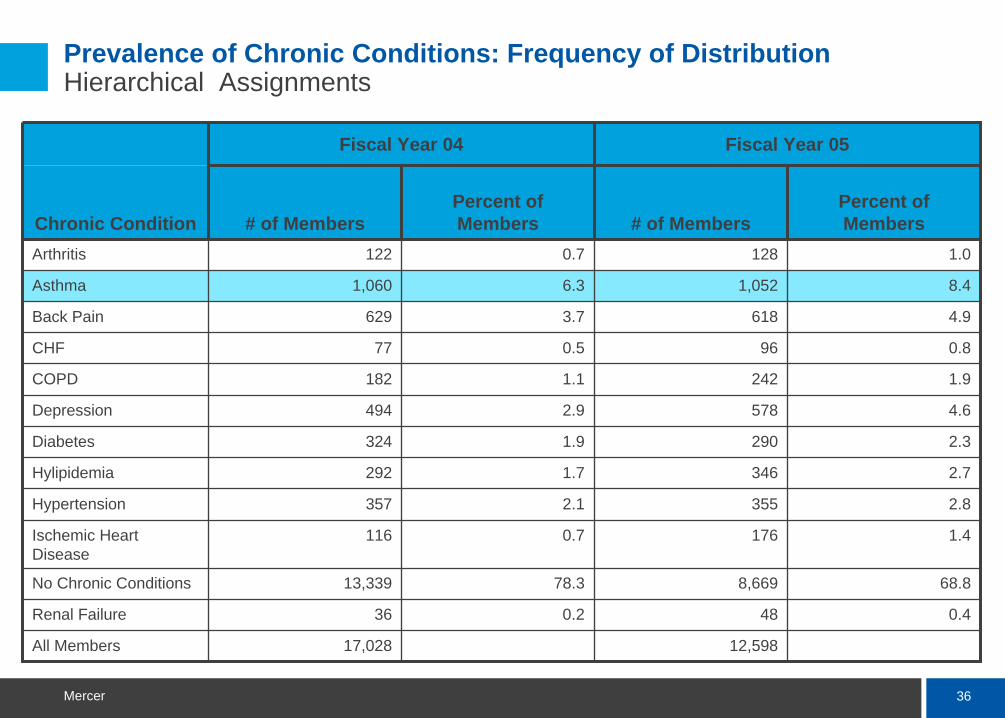
Prevalence of Chronic Conditions: Frequency of Distribution Hierarchical Assignments
Fiscal Year 04 Fiscal Year 05
Chronic Condition # of MembersPercent of Members # of Members
Percent of Members
Arthritis 122 0.7 128 1.0
Asthma 1,060 6.3 1,052 8.4
Back Pain 629 3.7 618 4.9
CHF 77 0.5 96 0.8
COPD 182 1.1 242 1.9
Depression 494 2.9 578 4.6
Diabetes 324 1.9 290 2.3
Hylipidemia 292 1.7 346 2.7
Hypertension 357 2.1 355 2.8
Ischemic Heart Disease
116 0.7 176 1.4
No Chronic Conditions 13,339 78.3 8,669 68.8
Renal Failure 36 0.2 48 0.4
All Members 17,028 12,598
37Mercer
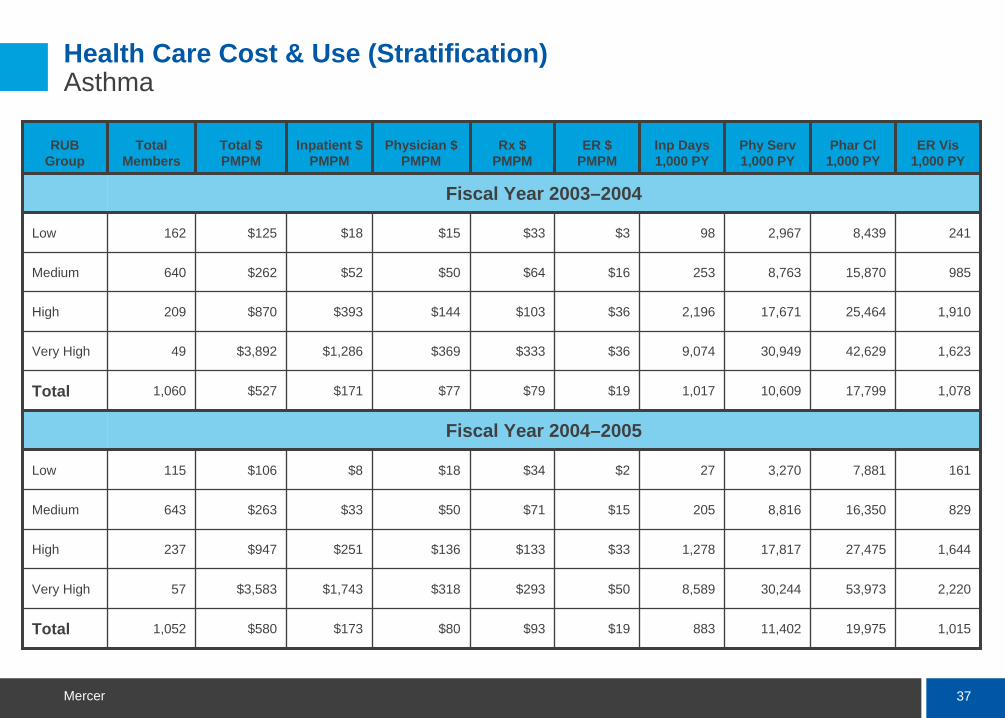
Health Care Cost & Use (Stratification) Asthma
RUB Group
Total Members
Total $ PMPM
Inpatient $ PMPM
Physician $ PMPM
Rx $ PMPM
ER $ PMPM
Inp Days 1,000 PY
Phy Serv 1,000 PY
Phar Cl 1,000 PY
ER Vis 1,000 PY
Fiscal Year 2003–2004
Low 162 $125 $18 $15 $33 $3 98 2,967 8,439 241
Medium 640 $262 $52 $50 $64 $16 253 8,763 15,870 985
High 209 $870 $393 $144 $103 $36 2,196 17,671 25,464 1,910
Very High 49 $3,892 $1,286 $369 $333 $36 9,074 30,949 42,629 1,623
Total 1,060 $527 $171 $77 $79 $19 1,017 10,609 17,799 1,078
Fiscal Year 2004–2005
Low 115 $106 $8 $18 $34 $2 27 3,270 7,881 161
Medium 643 $263 $33 $50 $71 $15 205 8,816 16,350 829
High 237 $947 $251 $136 $133 $33 1,278 17,817 27,475 1,644
Very High 57 $3,583 $1,743 $318 $293 $50 8,589 30,244 53,973 2,220
Total 1,052 $580 $173 $80 $93 $19 883 11,402 19,975 1,015
38Mercer
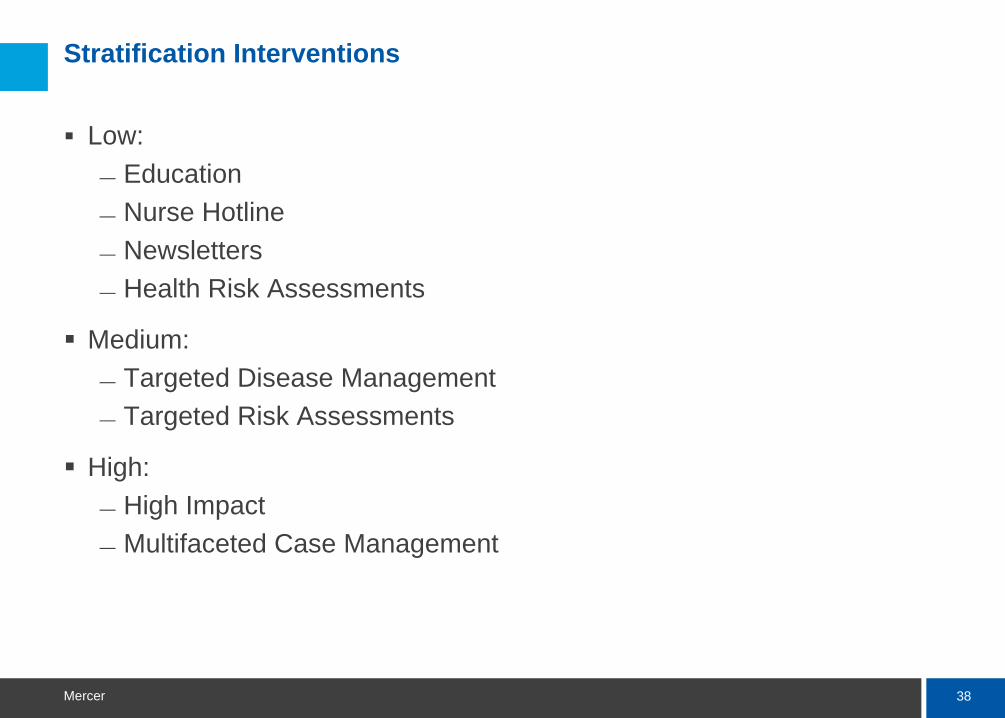
Stratification Interventions
Low: — Education— Nurse Hotline— Newsletters— Health Risk Assessments
Medium:— Targeted Disease Management— Targeted Risk Assessments
High:— High Impact— Multifaceted Case Management
39Mercer
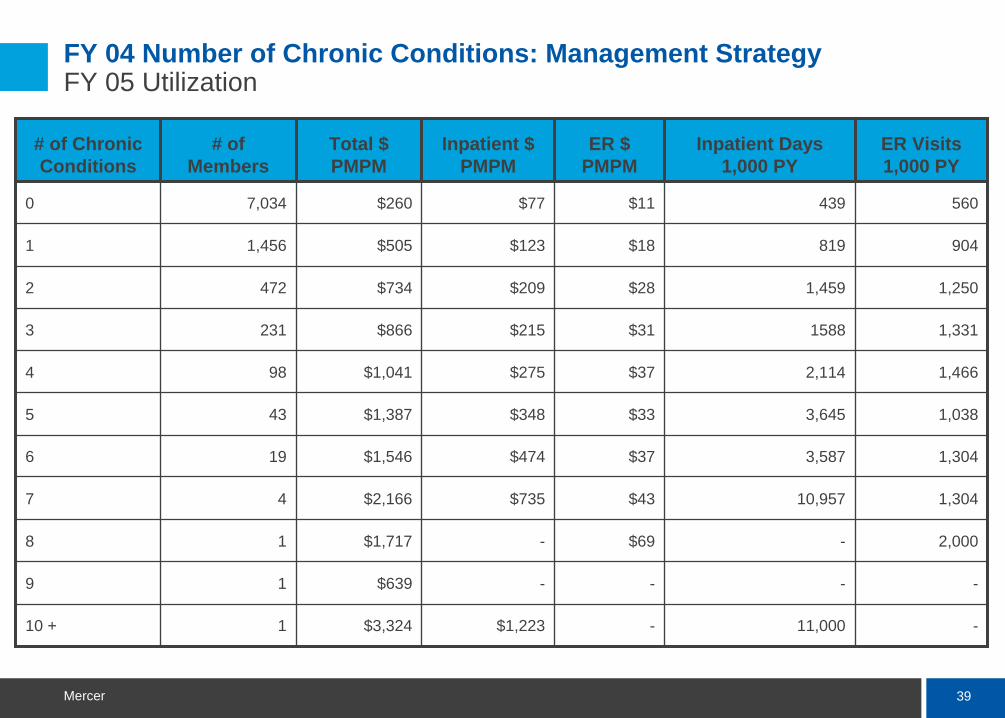
FY 04 Number of Chronic Conditions: Management Strategy FY 05 Utilization
# of Chronic Conditions
# of Members
Total $ PMPM
Inpatient $ PMPM
ER $ PMPM
Inpatient Days 1,000 PY
ER Visits 1,000 PY
0 7,034 $260 $77 $11 439 560
1 1,456 $505 $123 $18 819 904
2 472 $734 $209 $28 1,459 1,250
3 231 $866 $215 $31 1588 1,331
4 98 $1,041 $275 $37 2,114 1,466
5 43 $1,387 $348 $33 3,645 1,038
6 19 $1,546 $474 $37 3,587 1,304
7 4 $2,166 $735 $43 10,957 1,304
8 1 $1,717 - $69 - 2,000
9 1 $639 - - - -
10 + 1 $3,324 $1,223 - 11,000 -
40Mercer
Intervention Strategies
Inpatient
Emergency Room
Physician/Ambulatory Outpatient
41Mercer
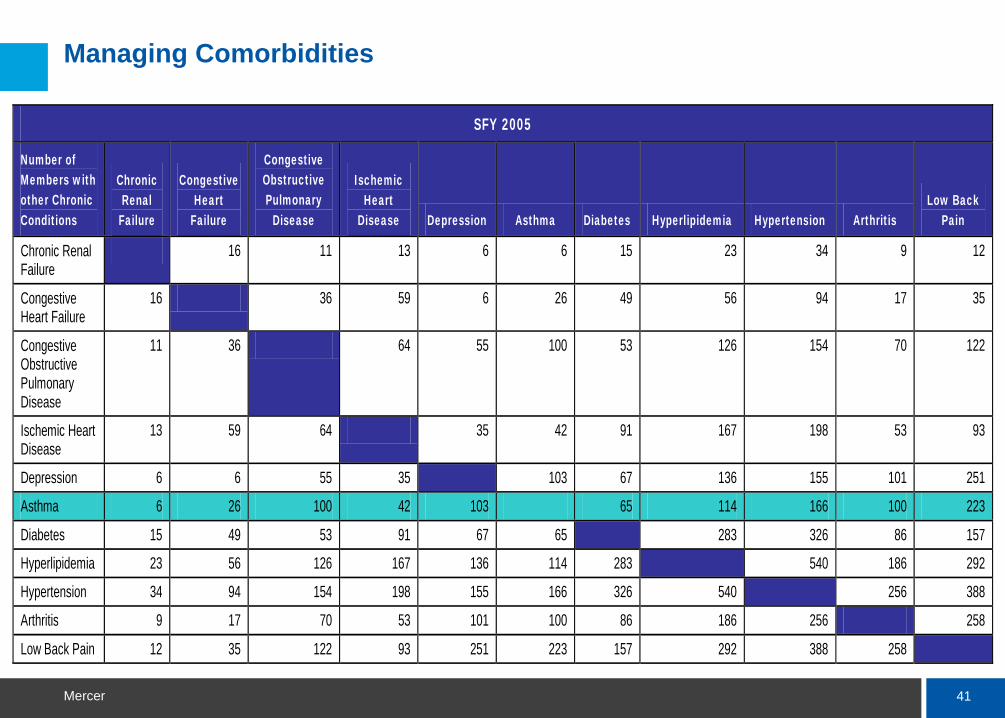
Managing Comorbidities
SFY 2005
Number of Members with other Chronic Conditions
Chronic Renal Failure
Congestive Heart
Failure
Congestive Obstructive Pulmonary
Disease
Ischemic Heart
Disease Depression Asthma Diabetes Hyperlipidemia Hypertension Arthritis Low Back
Pain
Chronic Renal Failure
16 11 13 6 6 15 23 34 9 12
Congestive Heart Failure
16 36 59 6 26 49 56 94 17 35
Congestive Obstructive Pulmonary Disease
11 36 64 55 100 53 126 154 70 122
Ischemic Heart Disease
13 59 64 35 42 91 167 198 53 93
Depression 6 6 55 35 103 67 136 155 101 251
Asthma 6 26 100 42 103 65 114 166 100 223
Diabetes 15 49 53 91 67 65 283 326 86 157
Hyperlipidemia 23 56 126 167 136 114 283 540 186 292
Hypertension 34 94 154 198 155 166 326 540 256 388
Arthritis 9 17 70 53 101 100 86 186 256 258
Low Back Pain 12 35 122 93 251 223 157 292 388 258
42Mercer
Disease Management
According to the Disease Management Association of America (DMAA):
“Disease Management is a system of coordinated health care interventions and communications for populations with conditions for which patient self-care efforts are significant.”
43Mercer
Disease Management and Co-morbidities
Decreasing treatment variability is a significant element determining success of a DM program.
Closing the gap between current treatment patterns and optimal treatment guidelines results in improved quality and decreased costs.
For providers to comply by adhering to guidelines, their acceptance of professional or national evidence-based guidelines is required.
Clinical guidelines direct care toward interventions proven to achieve optimal success.
Appropriate adjustments are made to guidelines to account for multiple co-morbid conditions or unique member situations.
Guidelines, translated into layman’s language, can also be shared with members as a means of supporting self-care behaviors resulting from increased knowledge and awareness.
44Mercer
Member’s Role in Disease Management
Active participation in DM is essential to achieve optimal result.
“Opting in” or “Opt out”.
Understand the importance of compliance with the providers’ treatment plan.
Understand their condition.
Identify trigger point exacerbating condition.
Provided with information and self-help materials to assist them in taking an active role in self-care.
45Mercer
Behavioral Modification Success Point
B e h a v io r C h a n g e F ra m e w o rk
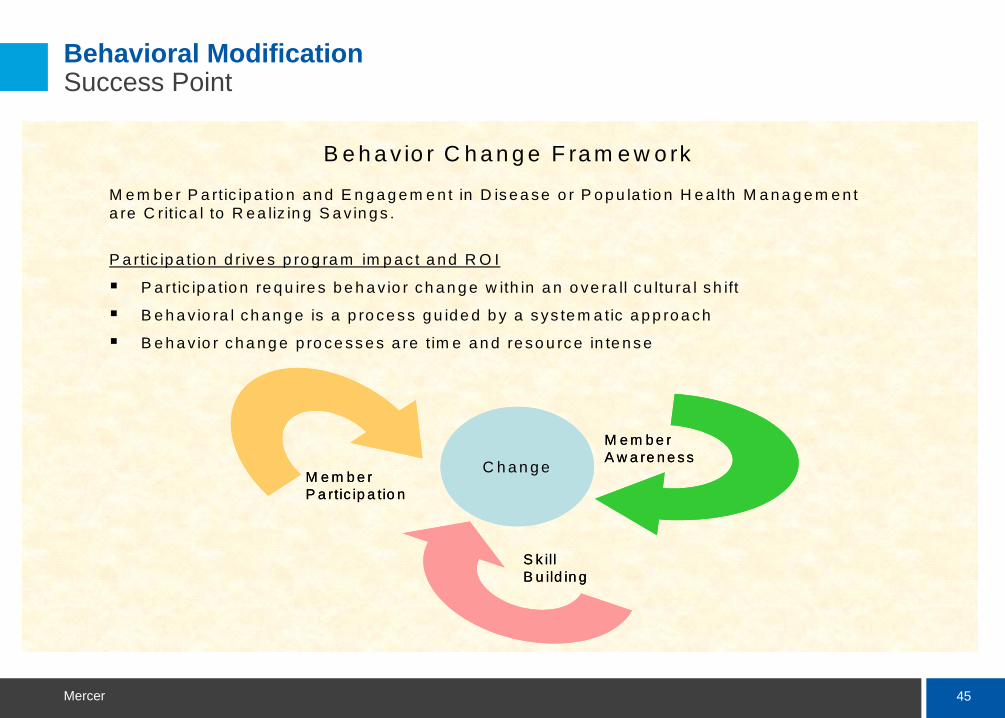
M e m b e r P a rtic ip a tio n a n d E n g a g e m e n t in D is e a se o r P o p u la tio n H e a lth M a n a g e m e n t a re C rit ica l to R e a liz in g S a v in g s .
P a rtic ip a tio n d rive s p ro g ra m im p a c t a n d R O I
P a rtic ip a tio n re q u ire s b e h a v io r ch a n g e w ith in a n o ve ra ll c u ltu ra l sh ift
B e h a v io ra l ch a n g e is a p ro ce s s g u id e d b y a s ys te m a tic a p p ro a ch
B e h a v io r c h a n g e p ro ce ss e s a re t im e a n d re so u rc e in te n s e
C h a n g e
M e m b e rA w a re n e s s
S k ill B u ild in g
M e m b e r P a rtic ip a tio n
C h a n g e
M e m b e rA w a re n e s s
S k ill B u ild in g
M e m b e r P a rtic ip a tio n
46Mercer
Proactive Care Management
Traditional health care management focused on treating existing illness or disease. DM and PHM focus interventions along the health care continuum from optimal health to illness.
Programs strive to proactively teach self-help behaviors that promote health, decrease development of risk factors, avoid behaviors that trigger acute events and help avoid disease development or to slow disease progression.
47Mercer
Health Care Continuum
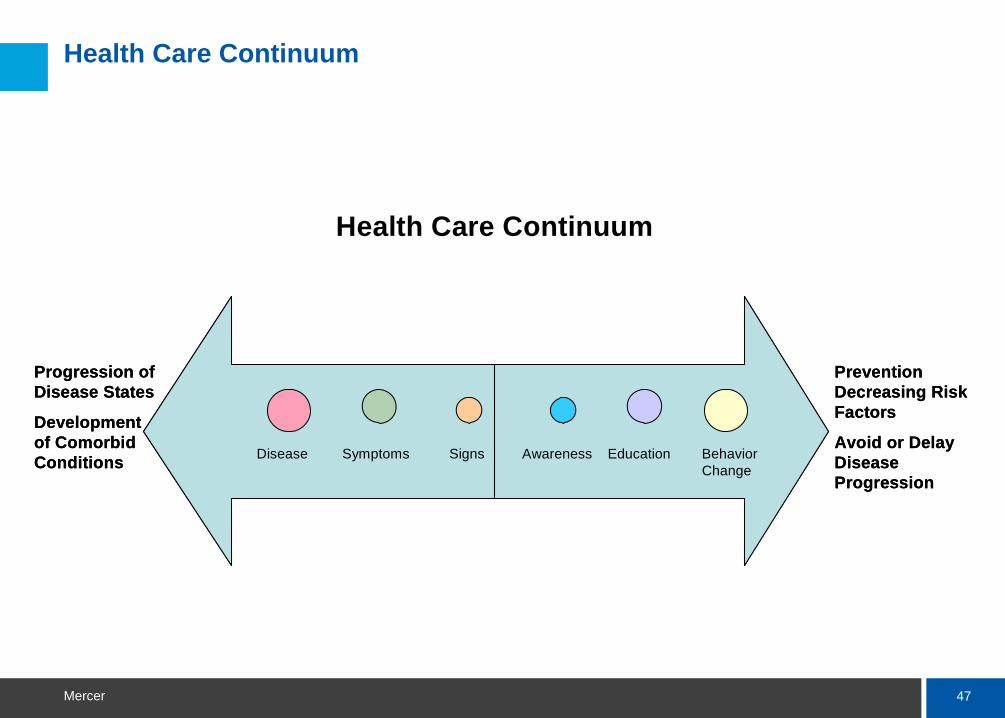
Prevention Decreasing Risk Factors
Avoid or Delay Disease Progression
Progression of Disease States
Developmentof ComorbidConditions Awareness Behavior
ChangeEducationSignsSymptomsDisease
Prevention Decreasing Risk Factors
Avoid or Delay Disease Progression
Progression of Disease States
Developmentof ComorbidConditions Awareness Behavior
ChangeEducationSignsSymptomsDisease
Health Care Continuum
48Mercer
Behavioral Change
A significant component for success of a DM program is achievingbehavior change. DM participants are assisted in becoming aware of how their lifestyle and behavior choices result in creating risk factors that can lead to illness or chronic disease.
49Mercer
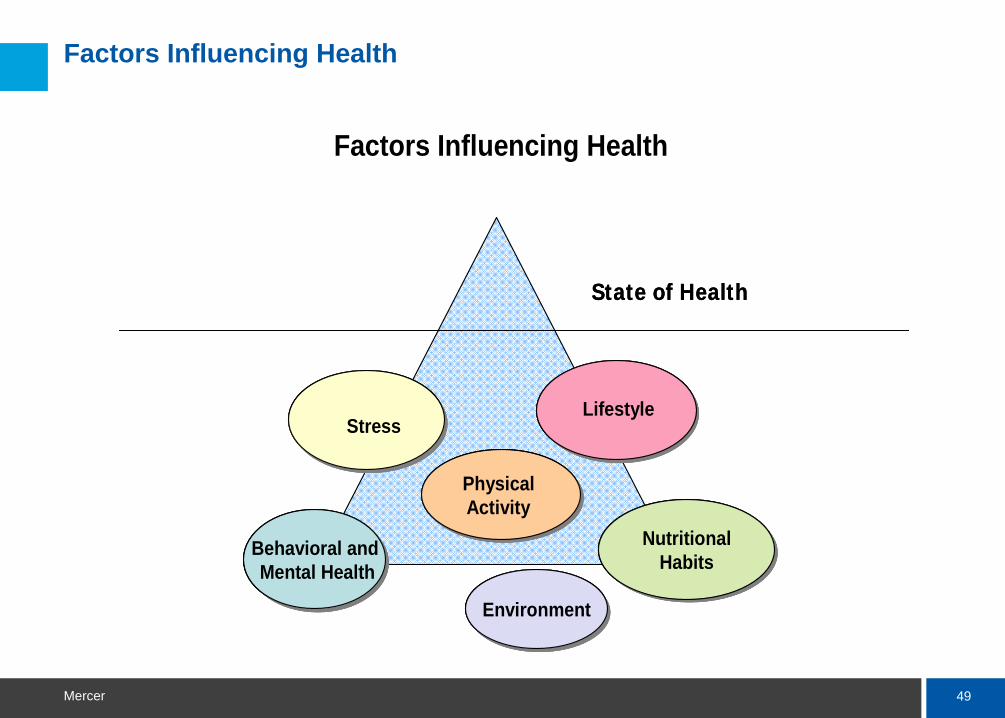
Factors Influencing Health
State of Health
StressStress
NutritionalHabits
NutritionalHabits
Physical Activity
Physical Activity
Lifestyle
EnvironmentEnvironment
Behavioral andMental Health
Behavioral andMental Health
State of Health
StressStress
NutritionalHabits
NutritionalHabits
Physical Activity
Physical Activity
Lifestyle
EnvironmentEnvironment
Behavioral andMental Health
Behavioral andMental Health
StressStress
NutritionalHabits
NutritionalHabits
Physical Activity
Physical Activity
Lifestyle
EnvironmentEnvironment
Behavioral andMental Health
Behavioral andMental Health
Factors Influencing Health
50Mercer
Risk Factors
Managing risk factors can:— Decrease the disease burden to the individual.— Improve quality outcomes.— Decrease the consumption of costly resources.
51Mercer
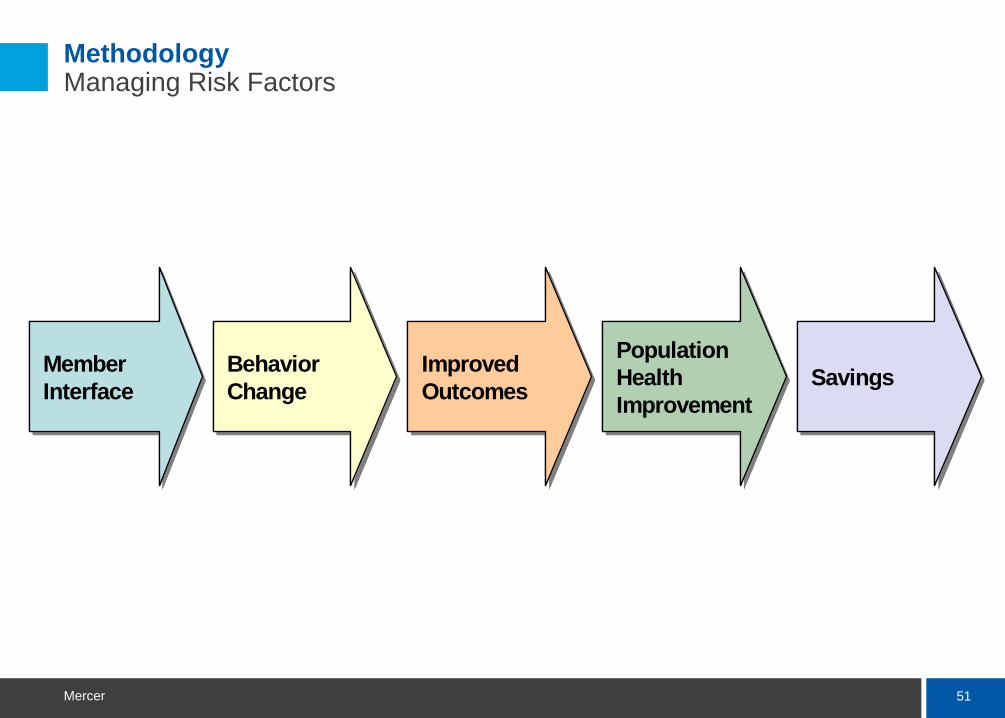
Methodology Managing Risk Factors
Member Interface Member Interface
Behavior Change Behavior Change
Improved Outcomes Improved Outcomes
Population Health Improvement
Population Health Improvement
SavingsSavingsMember Interface Member Interface
Behavior Change Behavior Change
Improved Outcomes Improved Outcomes
Population Health Improvement
Population Health Improvement
SavingsSavings
52Mercer
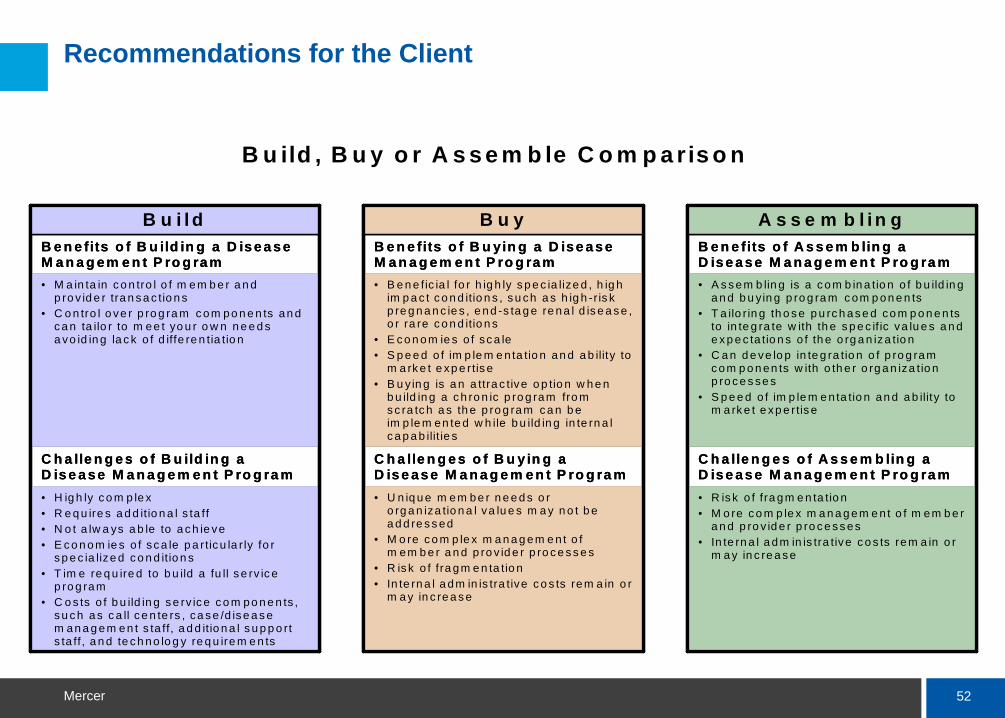
Recommendations for the Client
B u ild , B u y o r A s s e m b le C o m p a ris o n
• R is k o f fra gm e n ta tio n• M o re c o m p le x m a n a g em e nt o f m em b e r
a n d p ro v id e r p ro c e s s es• In te rn a l a dm in is tra tive c o s ts rem a in o r
m a y in c re a s e
• U n iq u e m em be r n e e d s o r o rg a n iza tio n a l va lu e s m a y n o t b e a d d re s s ed
• M o re c o m p le x m a n a g em e nt o f m em b e r a n d p ro v id e r p ro c e s s e s
• R is k o f fra gm e n ta tio n • In te rn a l a dm in is tra tive c o s ts rem a in o r
m a y in c re a s e
• H ig h ly c o m p le x• R e q u ire s a d d itio n a l s ta ff • N o t a lw a ys a b le to a c h ie ve • E c o n om ie s o f sc a le p a rtic u la r ly fo r
s p e c ia lize d c o n d itio n s• T im e re q u ire d to b u ild a fu ll s e rv ic e
p ro g ram • C o s ts o f b u ild in g s e rv ic e c o m po n e n ts ,
s u c h as c a ll c e n te rs , ca s e /d is e a s e m an a g em en t s ta ff, a d d itio n a l s u p p o rt s ta ff , a n d te c h no lo g y re q u ire m e n ts
C h a lle n g e s o f A s s e m b lin g a D is e a s e M a n a g e m e n t P ro g ra m
C h a lle n g e s o f B u y in g a D is e a s e M a n a g e m e n t P ro g ra m
C h a lle n g e s o f B u ild in g a D is e a s e M a n a g e m e n t P ro g ra m
• A s s em b lin g is a c om b in a tio n o f b u ild in g a n d b u yin g p ro g ra m c om p on e n ts
• T a ilo r in g th o s e p u rc h as e d co m p o n e n ts to in te g ra te w ith th e s p e c if ic va lu e s a n d e x p e c ta tio n s o f th e o rg a n iza tio n
• C a n d e ve lo p in te g ra tio n o f p ro g ram c om p o n en ts w ith o th e r o rg a n iza t io n p ro c e s se s
• S p e e d o f im p le m e n ta tio n an d a b ility to m a rk e t e xp e rtis e
• B e n e fic ia l fo r h ig h ly s p e c ia lize d , h ig h im p a c t c o n d itio n s , s u ch a s h ig h -r is k p re g n a n c ie s , e nd -s ta g e re na l d is e a s e , o r ra re c o n d itio n s
• E c o n om ie s o f sc a le • S p e e d o f im p le m e n ta tio n an d a b ility to
m a rk e t e xp e rtis e • B u y in g is a n a ttra c tive o p tio n w h e n
b u ild in g a c h ro n ic p ro g ram fro m s c ra tc h a s th e p ro g ram c a n b e im p le m en te d w h ile b u ild in g in te rn a l c a p a b ilit ie s
• M a in ta in c o n tro l o f m em b e r a n d p ro v id e r tra n s a c tio n s
• C o n tro l o ve r p ro g ra m c om po n e n ts an d c a n ta ilo r to m ee t yo u r o w n n e e d s a vo id in g la c k o f d iffe re n tia tio n
B e n e fits o f A s s e m b lin g a D is e a s e M a n a g e m e n t P ro g ra m
B e n e fits o f B u yin g a D is e a s e M a n a g e m e n t P ro g ra m
B e n e fits o f B u ild in g a D is e a s e M a n a g e m e n t P ro g ra m
A s se m b lin gB u yB u ild
53Mercer
Success???
For care management programs to be successful, a careful analysis of the required skills and resources must occur.
As care management focuses on prevention, behavioral change, andcompliance with evidence-based guidelines additional resources not currently in place may be required.
Based upon the specific needs of the member population and resources available, a number of program options are available.
The options include building a program, contracting with a vendor to provide a program or a combination of building, and outsourcing called assembly.
54Mercer
Successful Disease Management
According to the DMAA, components of a DM program include:— Population identification processes.— Evidence-based practice guidelines; — Collaborative practice models to include physician and support-service
providers;— Risk identification and matching interventions with need.— Patient self-management education (may include primary prevention,
behavior modification programs, and compliance/surveillance).— Process and outcomes measurement, evaluation and management.— Routine reporting/feedback loop (may include communication with
patient, physician, health plan and ancillary providers and practice profiling).
— Appropriate use of information technology (may include specialized software, data registries, automated decision support tools and call-back systems).
55Mercer
Quality Indicators
HEDIS &/or HEDIS-like Indicators
Client Specific Indicators
Utilization
56Mercer
Questions
If you have any questions contact:— Steve Johnson, Ph.D.— (602) 522-8566— [email protected]
— Linda Shields, RN, BSN— (602) 522-6569— [email protected]

www.mercer.com