Embed Size (px)
Citation preview

Predictive Power of PBPK Modeling and in silico / in vitro - in vivo Extrapolation
Using GastroPlus™ and ADMET Predictor™ Software Tools
Grace FraczkiewiczSimulations Plus, Inc.
Lancaster, CA
Outline
• Introduction to GastroPlus mechanistic absorption and PBPKmodeling– prediction of volume of distribution– clearance inputs– in vitro – in vivo extrapolation
• In silico – in vivo extrapolation using ADMET Predictor TM
– physicochemical property models– pKa: why is it so critical?– intrinsic clearance and metabolism models
• Validation examples
• Conclusions
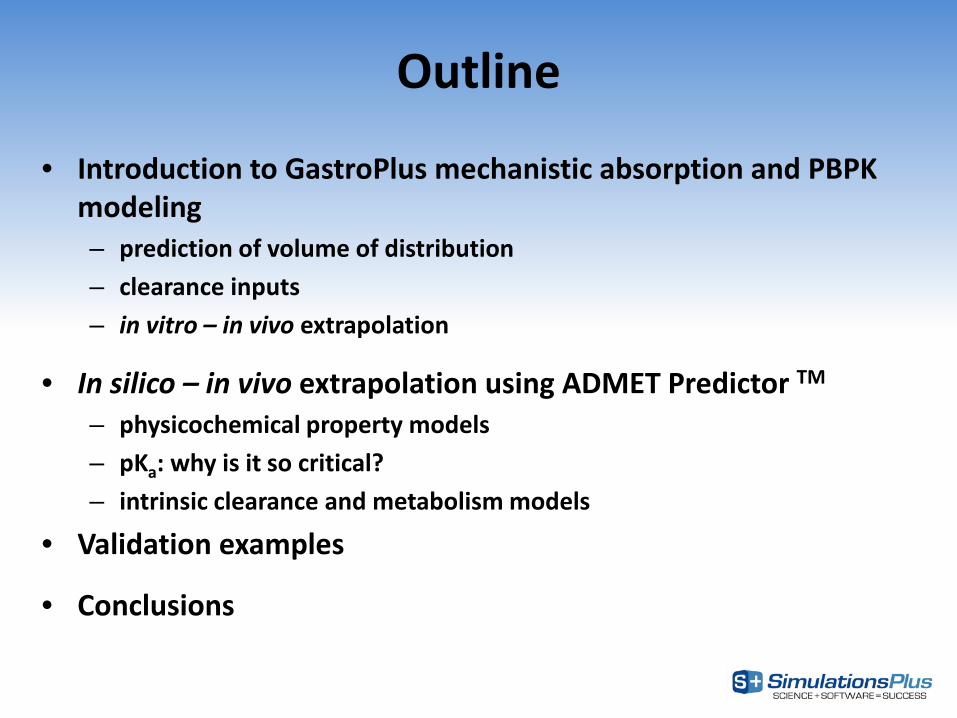
Simulations Plus Software Products
3
NHO
OH
OCH3
CH3
CH3
ADMETPredictor™ GastroPlus™
Population PK/PD Modeling & Simulations
Regulatory Submission
MedChem Studio™MedChem Designer™
DDDPlus™MembranePlus™
Consulting Services and Collaborations
Cognigen

What’s happening in vivo?
4
F% (not Fa%)Fa%
D PV
Metabolism Metabolism
A SCpKaSolubility vs. pHBiorelevant solubilityPrecipitation kinetics
Transcellular permeabilityParacellular permeabilitylogD vs. pHCarrier-mediated transportGut extraction
Liver metabolismHepatic uptakeBiliary secretion
FDp%
* Modified from van de Waterbeemd, H, and Gifford, E. ADMET In Silico Modelling: Towards Prediction Paradise? Nat. Rev. Drug Disc. 2003, 2:192-204

5
Mechanistic Absorption Modeling (MAM)
Physiologically based Pharmacokinetics (PBPK)

Alternative Dosage Routes Mechanistic Models
6
Pulmonary Oral Cavity
Dermal Ocular

Processes Involved in Oral Absorption
• dose or from previous compartment
• unreleased & undissolved & dissolved
Drug in solution,
Clumen
Degradation
Lumen
Enterocytes
Gut wall metabolism
Blood
Centerocytes
Cmesentery/portal vein
Local pH, fluid volume, concentration of bile salts …
Passive and carrier mediated
transport
Clumen
Transit In Transit Out
Dissolution
Precipitation
• to next compartment or excretion
• unreleased & undissolved & dissolved
These phenomena:• are happening simultaneously• are repeated in each of the compartments of the gastrointestinal tract
7

Full control over the physiology
PBPKPlus Module
• Add or remove tissues
• Change tissue type•Perfusion-limited tissue
•Permeability-limited tissue
• Adjust tissue parameters to reflect different physiology, disease state, …
• But default settings are used most often
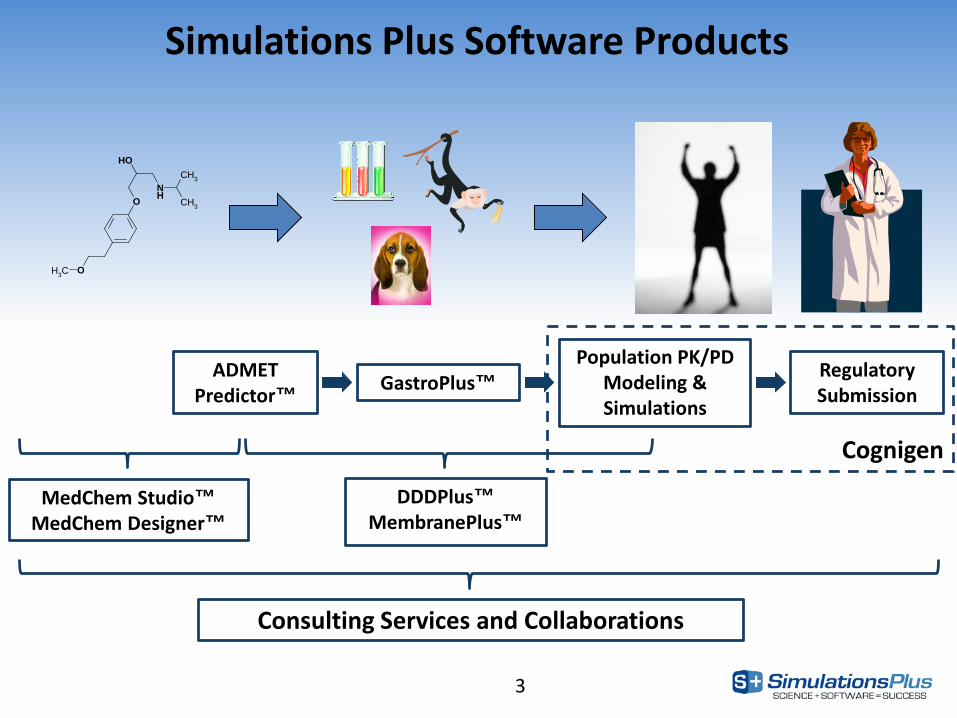
What’s Defined in a PBPK Model?
• Each compartment represents a tissue:
- specific volume
- blood perfusion rate
- enzyme/transporter expressions
- volume fractions of lipids & proteins
- partition coefficient Kp
• Perfusion limited tissues: concentration of chemical in the tissue is Kp*Cplasma
• Permeability limited tissue: Kpdetermines distribution of chemical between plasma and extracellular space, but intracellular concentration is determined by carrier-mediated transfer of chemical across cellular membrane or permeability surface area exposed to the plasma
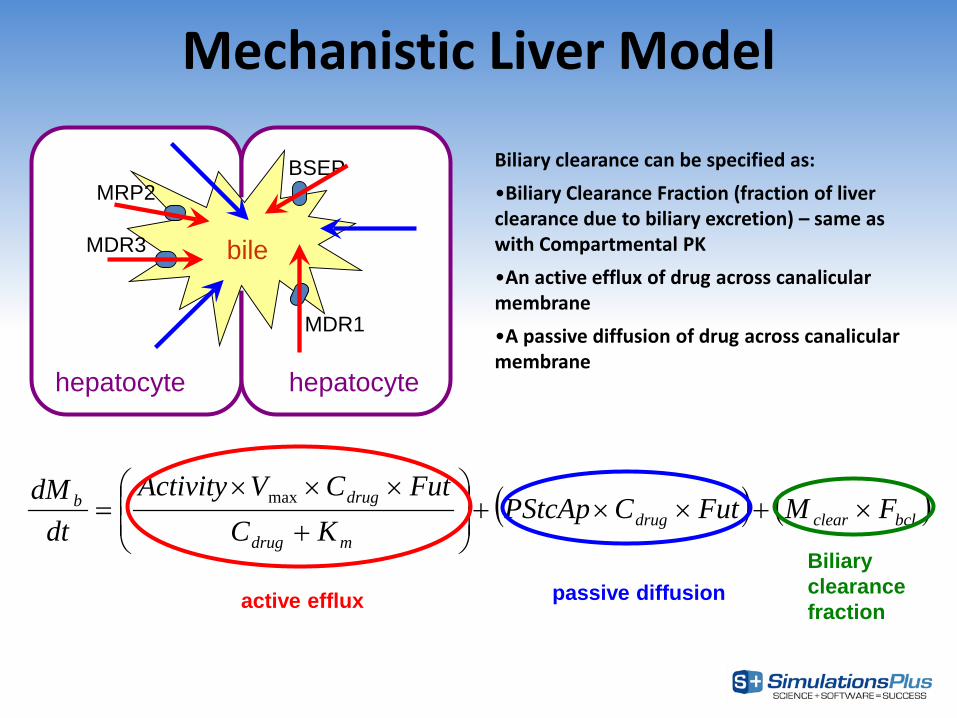
Mechanistic Liver Model
hepatocyte hepatocyte
bile
MRP2
MDR3
BSEP
MDR1
Biliary clearance can be specified as:•Biliary Clearance Fraction (fraction of liver clearance due to biliary excretion) – same as with Compartmental PK•An active efflux of drug across canalicularmembrane•A passive diffusion of drug across canalicularmembrane
( ) ( )bclcleardrugmdrug
drugb FMFutCPStcApKC
FutCVActivitydt
dM×+××+
+
×××= max
active efflux passive diffusionBiliary clearance fraction

Mechanistic Kidney ModelPerfusion Limited: Permeability Limited:
CLfilt Estimates:
- Fup*GFR - GFR - Fraction of Kidney blood flow - Other

12
Distribution and Clearance
Steady State Volume of Distribution (Vdss)
ttB
Peptss
HHRPEVPEVERKVVd
/))1((:
):()1(*
−−=
++−=∑
fupKpuKp *=
( )
( )
−⋅⋅
+⋅
⋅⋅+⋅+⋅−−⋅+
+
⋅⋅+⋅+⋅++=
)/1(
)1)/1((][
/1
)7.03.0(1
1
/1
)7.03.0(
/1
/1
],[
],[
],[
],[],[
],[
PD
IWDT
pD
phpnlp
pD
phtnltiw
pD
iwDew
X
XAPKaFc
RAtpX
VPVP
fupFaFn
X
VPVPV
X
XVKpu
S+ Method (Lukacova): The binding of drug to acidic phospholipids or plasma proteins is given by actual ionization of each drug at physiological pH
• Linear Clearance- CLint = intrinsic clearance
• Nonlinear Clearance- Michaelis-Menten kinetics
ionconcentrat drug tissueUnbound:clearance intrinsic Unbound:
,
int,
1 ,
maxint,
ut
u
nEnz
i utim
i
u
CCL
CKV
CL ∑=
+=
Systemic Clearance:
plasmain unboundfraction :ratioion concentrat maBlood/plas :
flow blood Tissue :
clearance blood plasma,:,
int,
int,
fupRbpQ
CLCLfupRbpQCL
CLQRbpCLRbpCL
bp
u
ubp
+⋅=⋅=

Predicting Kp:Rodgers vs. Lukacova
0
0.5
1
1.5
2
2.5
3
4 5 6 7 8 9 10pKa
Kp
mus
cle
S+ Rodgers
0
0.2
0.4
0.6
0.8
1
4 5 6 7 8 9 10pKa
Kp
adip
ose
S+ Rodgers
0
0.5
1
1.5
2
2.5
3
4 5 6 7 8 9 10pKa
Vss
[L/k
g]
S+ Rodgers
13
0
20
40
60
80
100
120
4 5 6 7 8 9 10pKa
% io
nize
d
pH 7.4 pH 7

14
Predicting KpsPoulin
0.01
0.1
1
10
100
1000
0.01 0.1 1 10 100 1000Experimental
Cal
cula
ted
Berezhkovskiy
0.01
0.1
1
10
100
1000
0.01 0.1 1 10 100 1000Experimental
Cal
cula
ted
Rodgers
0.01
0.1
1
10
100
1000
0.01 0.1 1 10 100 1000Experimental
Cal
cula
ted
S+
0.01
0.1
1
10
100
1000
0.01 0.1 1 10 100 1000Experimental
Cal
cula
ted
Lukacova – AAPS Annual Meeting 2008

Predicting Kps
Lukacova – AAPS Annual Meeting 2008 15
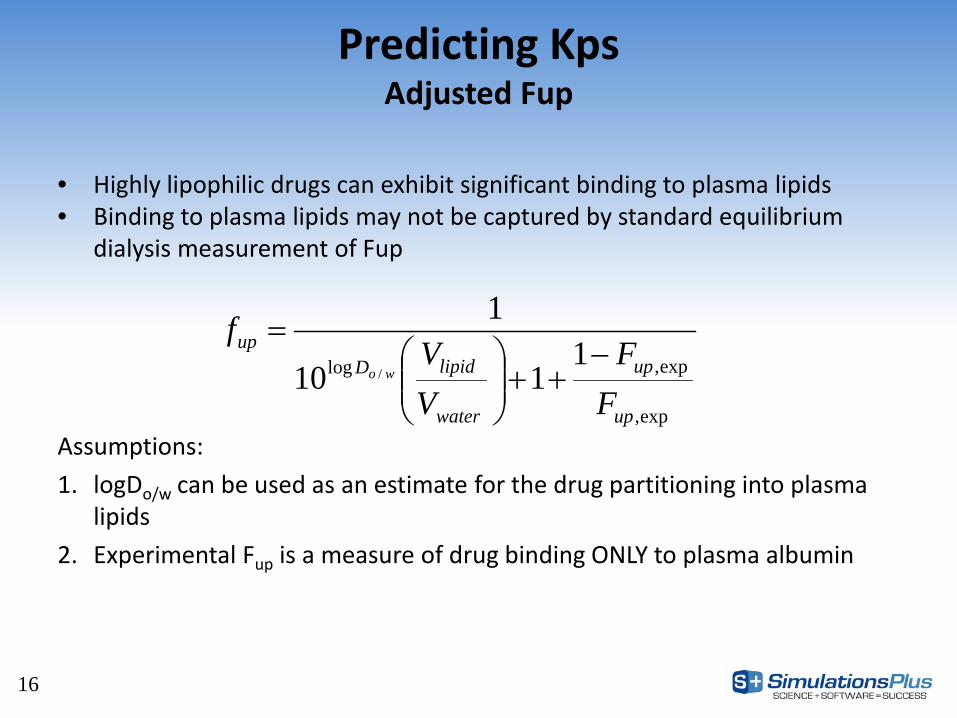
Predicting KpsAdjusted Fup
• Highly lipophilic drugs can exhibit significant binding to plasma lipids• Binding to plasma lipids may not be captured by standard equilibrium
dialysis measurement of Fup
16
exp,
exp,log 1110
1
/
up
up
water
lipidDup
FF
VV
fwo
−++
=
Assumptions:1. logDo/w can be used as an estimate for the drug partitioning into plasma
lipids2. Experimental Fup is a measure of drug binding ONLY to plasma albumin
17
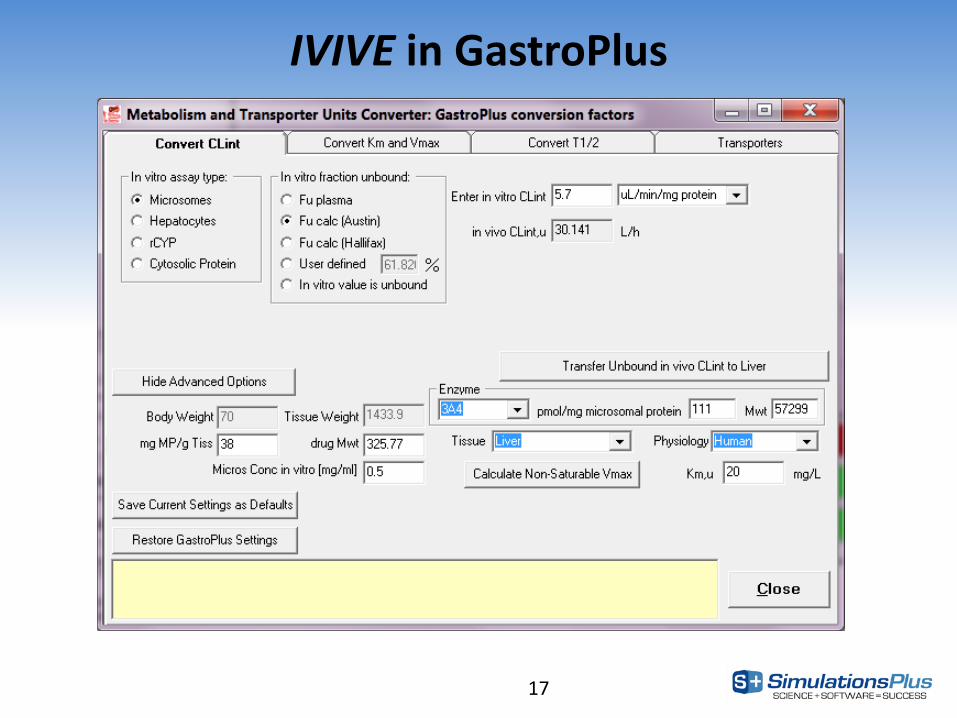
IVIVE in GastroPlus
Obtaining Necessary Physicochemical/CYP Metabolism Properties
from Chemical Structure
18

Structure-Based Predictions
19
PhysicochemicalBiopharmaceutica
lMetabolism
Quantitative Structure Activity Relationships(QSAR)
Physiologically-Based Pharmacokinetics(PBPK)
• 14

Predictive Models
20

Why are pKas so important?
pKas (“ionization”)
Dissolution & Precipitation
Distribution Absorption
Metabolism

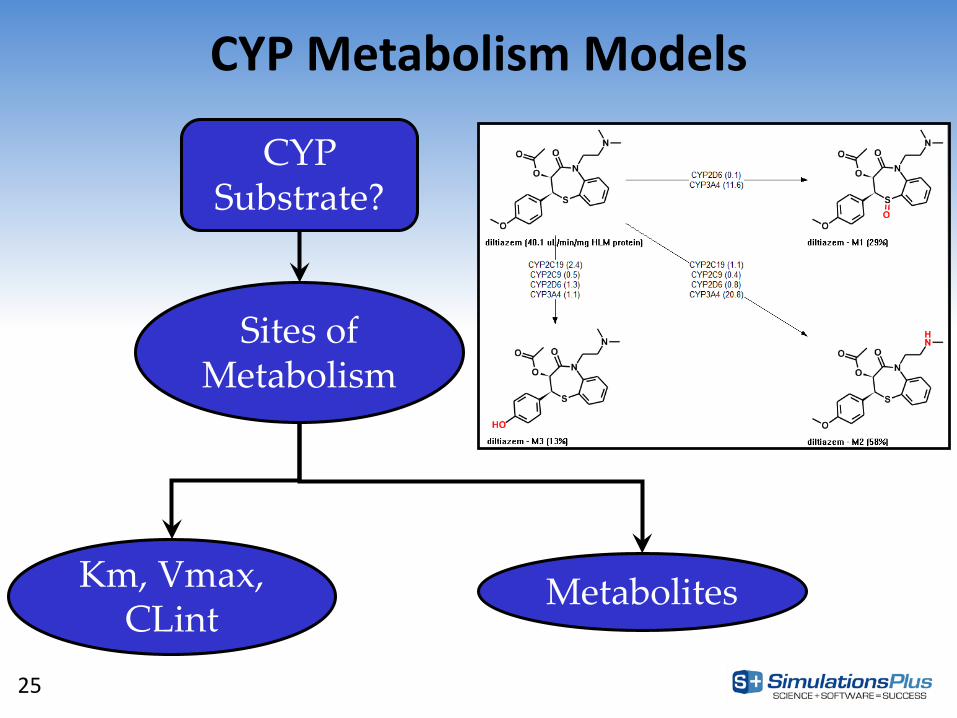
CYP Metabolism Models
22
CYP Substrate?
1A2
2C192C92D6
3A4
CYP Subst Star Plot:Predicted to be a
substr. for all 5 CYPs except 1A2
Diltiazem

CYP Metabolism Models
23
Sites of Metabolism
CYP Substrate?
Predicted 3A4 sites of metabolism (red mesh) and scores

CYP Metabolism Models
24
Sites of Metabolism
Km, Vmax, CLint
CYP Substrate?
Predicted 3A4 atomic CLint
CYP Metabolism Models
25
CYP Substrate?
Sites of Metabolism
MetabolitesKm, Vmax, CLint
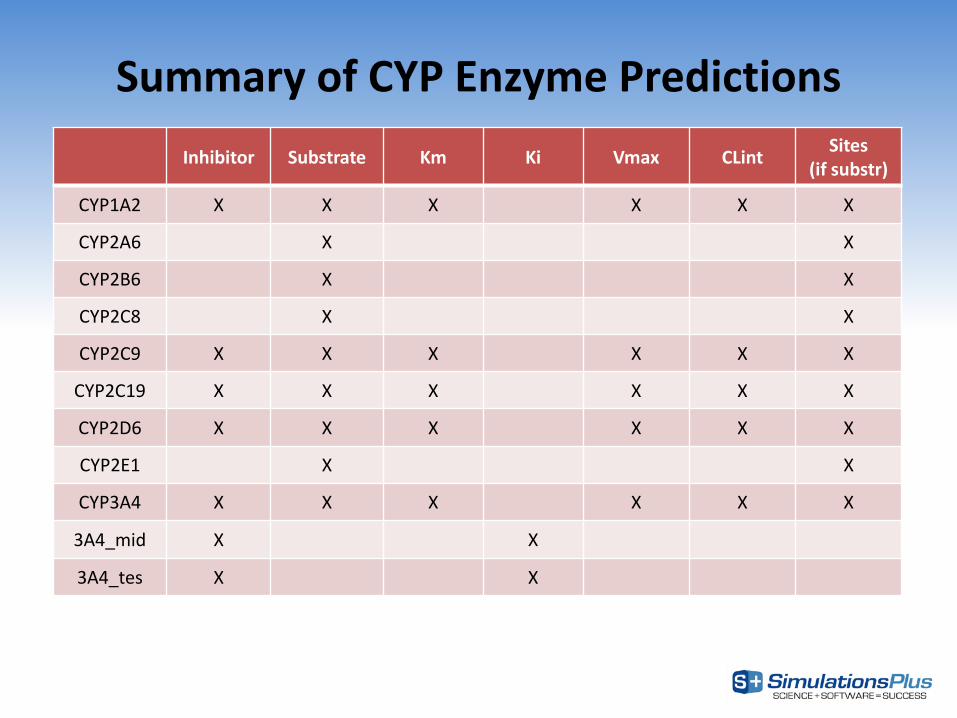
Summary of CYP Enzyme PredictionsInhibitor Substrate Km Ki Vmax CLint Sites
(if substr)
CYP1A2 X X X X X X
CYP2A6 X X
CYP2B6 X X
CYP2C8 X X
CYP2C9 X X X X X X
CYP2C19 X X X X X X
CYP2D6 X X X X X X
CYP2E1 X X
CYP3A4 X X X X X X
3A4_mid X X
3A4_tes X X

Validation Examples
27

Validation: in vitro – in vivo extrapolation
28
Ref: Haiying Zhou et. al., Using Physiologically Based Pharmacokinetic Modeling for in vitro – in vivo Extrapolation to Predict Chemical Exposure, Poster presented here at the IVIVE workshop.

Validation: in silico – in vivo extrapolation
29
Lawless et al. (2015) ISSX Annual MeetingUsing QSAR & PBPK to predict human F%:70% of compounds predicted within 2-fold

Prediction of F%• A database of 62 drugs including oral bioavailability (F%) and dose was constructed
– All compounds’ reported major clearance pathways (MCP) were CYP-mediated1
– For 43 drugs with more than one reported value of F%, the average experimental CV% was 29%
• Reported F% values2 varied from 3% (fluphenazine) to 99% (diazepam, galantamine, glimepiride, indomethacin, and tamsulosin), with an average of 60%
• F% was predicted by integrating quantitative structure activity relationship (QSAR) model predictions3 and physiologically based pharmacokinetic (PBPK) simulations4
– A 35-year-old American male physiology was use for all PBPK simulations
• All molecules were predicted to be substrates of the CYP associated with their MCP
• In 42 of the 62 molecules, the CYP isoform with highest predicted intrinsic clearance (CLint) was the same as the MCP
• Overall, 68% of the molecules were predicted within 2-fold of their reported F%
30
1 Toshimoto K et al, Drug Metabol. Disp. Fast Forward. Published on August 14, 2014.2 Thummel KE et al., In: Brunton LL, Chabner BA, Knollmann BC, editors. Goodman & Gilman’s the pharmacological basis of therapeutics.
12th ed. New York: McGraw-Hill; 2011. Some F% values were from drug data sheet.3 ADMET Predictor™ version 7.2, Simulations Plus, Inc., Lancaster, CA 95354 USA.4 GastroPlus™ version 9.0, Simulations Plus, Inc., Lancaster, CA 95354 USA.

31Daga et al. (2015) Gordon Research Conf.

Prediction of F% Using in silico Physicochemical Properties and in vitro, Predicted or Fitted Clearance - Case Study 1 49 Compounds: Single Med Chem series reported by Merck in various papers
• RAT in vivo data : %F, CLp• Physicochemical prop & in vitro data: -
CLglobalExp CLp CLlocal
• The low accuracy of the 1st approach was due to significant renal clearance that this series of compounds undergoes
• Global QSAR model built on a wide variety of compounds was not accurate enough for this series of compounds
32 Daga et al. (2015) Gordon Research Conf.

Prediction of F% Using in silico Physicochemical Properties and in vitro, Predicted or Fitted Clearance - Case Study 2
81 Compounds: Single Med Chem series reported by Astra-Zeneca in 4 publications
• RAT in vivo data: %F, CLp
• in vitro data: CLint(hep)Exp CLp CLglobalExp Hep CLint CLlocal
• These simulations suggest that this class of compounds undergo extensive hepatic clearance and that extrahepatic clearance mechanisms are either absent or minimal
33 Daga et al. (2015) Gordon Research Conf.

Prediction of F% Using in silico as well as Experimental Physicochemical Properties and in vitro, Predicted, or Fitted
Clearance - Case Study 3 61 compounds : Single Med-Chem series with experimental data
• Physicochemical prop & in vitro data: (Solubility, Caco2 permeability, Plasma Protein binding, CLint)
• RAT PK data: (%F, AUC, Cmax, Tmax, CLplasma, Vss)
in silico input prop & CLglb
Exp input properties & CLint
Exp CLp In silico input prop & CLloc
• These simulations suggest that purely in silico inputs can provide similar results to the experimentally obtained values
34 Daga et al. (2015) Gordon Research Conf.

Conclusions• Quality of predictions produced by Mechanistic Absorption and PBPK
modeling greatly depends on the input parameters and the routes of clearance that any given compound is subjected to in vivo.
• In general, volume of distribution is predicted well with the default GastroPlus PBPK methodology if the provided physicochemical and biopharmaceutical properties are correct. The main reasons for underprediction of Vd are: specific binding to some tissues, lysosomal trapping, and active transport (influx and efflux) into the tissue(s).
• Plasma concentrations and F% are typically predicted within 10-fold for the majority of chemicals. Compounds that undergo only passive renal clearance and/or hepatic CYP clearance can be predicted within 2-fold –even with only in silico inputs. Other routes of clearance such as: biliary in liver and transporter-based (in liver or kidney) are difficult to predict and are the major reasons for underpredicting clearance when in vitro-in vivo extrapolation is used.
35
Acknowledgments• Co-authors:‒ Haiying Zhou‒ Michael Lawless‒ Pankaj R. Daga‒ Michael B. Bolger
• Contributors:‒ Viera Lukacova‒ Robert Fraczkiewicz‒ Marvin Waldman‒ Robert D. Clark‒ Jinhua Zhang‒ John DiBella‒ Walter Woltosz
36

Additional Slides
37

Mechanisms: Clearance
38
Relationship between CLint and t1/2:
b.w. kgliver g *
liver gmicrosomes mg 38*
microsomes mgincubation ml*693.0
2/1int
xt
CL =

39
• Predict metabolic clearance in vivo from in vitro measurements (microsomes, hepatocytes, recombinant systems)
• Convert Vmax measured in rate of metabolism per ‘unit amount of enzyme’ to rate of metabolism in the entire tissue (liver, gut, etc.)
• in vitro ‘unit amount of enzyme’ is given by the in vitro assay:– mg of microsomal protein (microsomal assay)– 1 million cells (hepatocyte assay)– pmol of enzyme (recombinant enzymes)
IVIVE
tissue]ratetissue] of g
tissue] of gprotein] microsomal of mg
protein] microsomal of mgrate
[[
[[
[=××
[tissue]ratetissue] of [g
tissue] of [gcells] of [millions
cells] million [onerate
=××
[tissue]ratetissue] of [g
tissue] of [gprotein] microsomal of [mg
protein] microsomal of [mgenzyme] of [pmol
enzyme] of [pmolrate
=×××
To obtain in vivo Vmax in the entire tissue:
microsomes
hepatocytes
rCYP

Model performance… CYP2D6
Vmax
Km CLint
Zhang et al., ACS National Meeting (2013)

41
Define the physicochemicalproperties for your compounds
Define the initial formulation
conditions for your compounds
Define the pharmacokinetic model (compartmental or PBPK) for your
compounds, along with the Fu,plasma and blood:plasma concentration ratio
Define how the clearance will be estimated for your compounds:a. Include renal filtration clearance?
b. Use Vmax and Km for CYP enzymes OR intrinsic clearance – not both!c. If Vmax and Km are selected, use HLM data to calculate 3A4 Vmax and Km, or rCYP data
(rCYP data is used for all other CYPs)?