Embed Size (px)
Citation preview

“Predictive & Preventive Personalized Medicine”
Invited Talk
Right Care Initiative Annual Leadership Summit
Collaborating to Prevent Heart Attacks, Strokes, and Diabetic Complications
UC Berkeley
October 1, 2012
Dr. Larry Smarr
Director, California Institute for Telecommunications and Information Technology
Harry E. Gruber Professor,
Dept. of Computer Science and Engineering
Jacobs School of Engineering, UCSD
http://lsmarr.calit2.net
1

Where I Believe We are Headed: Predictive, Personalized, Preventive, & Participatory Medicine
www.newsweek.com/2009/06/26/a-doctor-s-vision-of-the-future-of-medicine.html
I am Leroy Hood’s Lab Rat!
Invited Paper for Focus Issue of Biotechnology Journal,Edited by Profs. Leroy Hood and Charles Auffray.
http://lsmarr.calit2.net/repository/Biotech_J._Supporting_Info_published.pdf
http://lsmarr.calit2.net/repository/Biotech_J._LS_published_article.pdf
Download Pdfs from my Portal:

From One to a Billion Data Points Defining Me:The Exponential Rise in Body Data in Just One Decade!
Billion: My Full DNA,MRI/CT Images
Million: My DNA SNPs,Zeo, FitBit
Hundred: My Blood VariablesOne: My WeightWeight
BloodVariables
SNPs
Microbial Genome
Improving Body
Discovering Disease

I Have Improved My HealthBy Measuring the State of My Body and “Tuning” It
2000
I Arrived in La Jolla in 2000 After 20 Years in the Midwestand Discovered I was Pre-Diabetic.
Age 51
2010
Age 61
1999
I Reversed My Body’s Decline By Altering Nutrition and Exercise
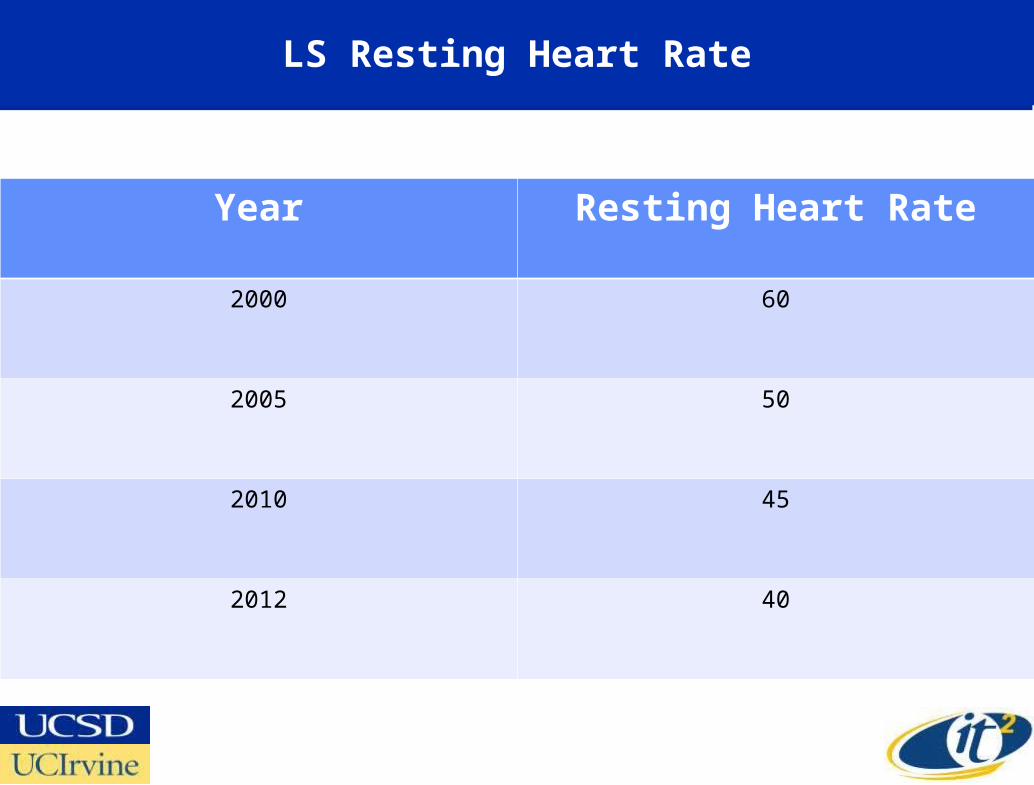
LS Resting Heart Rate
Year Resting Heart Rate
2000 60
2005 50
2010 45
2012 40

The Biofeedback of Monitoring Enables MeTo Increase My Daily Caloric Burn
25 Week Average: 2473 Calories Burned/Day
1:19 hr Physical Activity/Day (>3 METs)6887 Steps/Day (~3.4 Miles)
www.bodymedia.com
Elliptical Gardening Up and Down House Steps
Now Using FitbitAverage 8000 Steps/Day

Quantifying My Sleep Pattern Using a Zeo -Increased My Average to 8 Hours/Night
REM is Normally 20% of SleepMine is Between 45-65% of Sleep
An Infant Typically Has 50% REM
Stroke risk increased by sleeping less than six hours a night-M. Ruiter, Sleep 2012

Lower Triglycerides by Reducing Foods High in Simple Sugars
• TG– High Risk 200-500– Best <150– My TG ~40
• TG/HDL– Ratio>4 Are Pre-Diabetic or Have Type 2 Diabetes– Average American Has a Ratio of ~3.3– My Ratio 0.6
“The Ratio of Triglycerides to HDL Cholesterol (TG/HDL-C) is the
Single Most Powerful Lipid Predictor of
Extensive Coronary Disease.”[Clinics 2008; v.64: 427-432]

Goal: Change Your Cholesterol Levelsto Lower LDL, Raise HDL, While Lowering Total
Began Statin
Raising “Good” HDL Seems Most Difficult

Change in LS Cholesterol ProfileBefore and After Statins
Before Statin After Statin % Change
Total Cholesterol 165 125 -25%
LDL 94 54 -43%
HDL 59 60 No change
TG 45 38 -16%
Started Crestor July 2008Data from 2001-2012
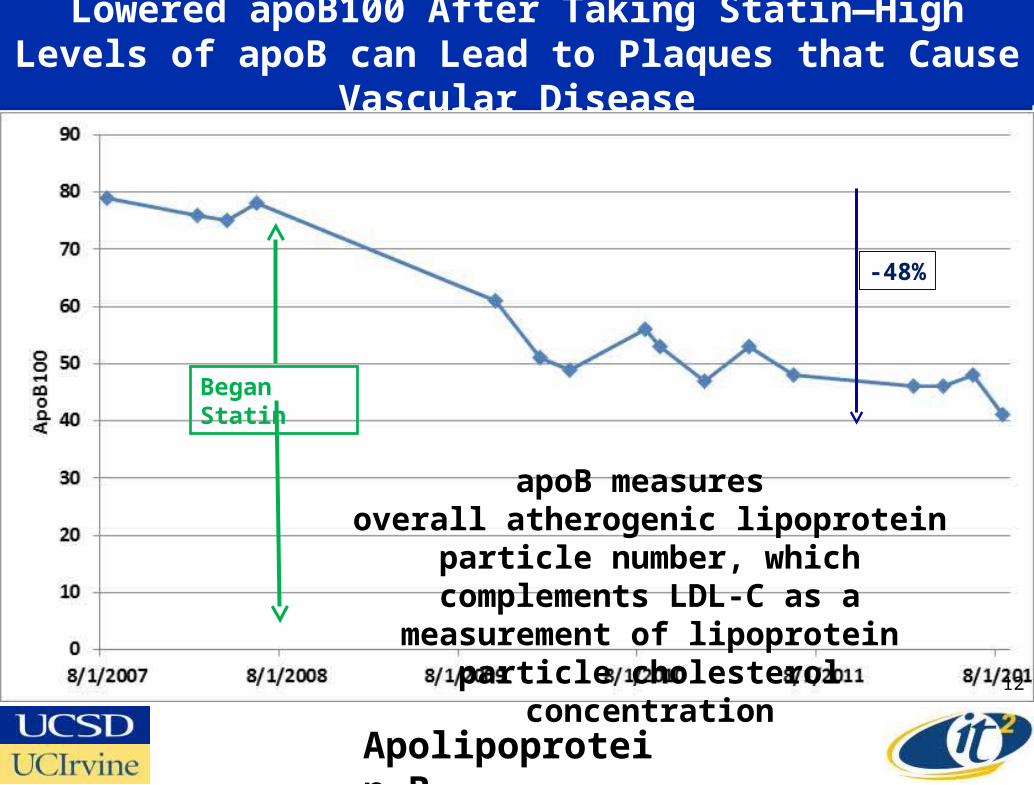
Lowered apoB100 After Taking Statin—High Levels of apoB can Lead to Plaques that Cause Vascular Disease
12
Began Statin
-48%
apoB measures overall atherogenic lipoprotein particle number, which complements LDL-C as a measurement of lipoprotein particle
cholesterol concentration
Apolipoprotein B

Change in LS Blood Pressure Under Different Blood Pressure Medication
Year Blood Pressure
Drug
AverageSystolic
Average Diastolic
2010 Benecar20mg
134 73
2012 Losartan100mg
143 82
2012 Lotrel5/10mg combo
125 70

From Measuring Macro-Variables to Measuring Your Internal Variables
www.technologyreview.com/biomedicine/39636

I Lowered My Body’s Inflammation From Food By Increasing Omega-3s and Reducing Omega-6s
Range Source: Barry SearsMy Tests by www.yourfuturehealth.com
Chronically IllAmerican
Average “Healthy”American
Ideal RangeMy Range
“Silent Inflammation”
I take 6 Fish OilPills Per Day
Blood Ratio of Omega 6 to Omega 3

I Track 100 Variables in Blood Tests Done Quarterly to Annually
• Electrolytes– Sodium, Potassium, Calcium,
Magnesium, Phosphorus, Boron, Chlorine, CO2
• Micronutrients– Arsenic, Chromium, Cobalt,
Copper, Iron, Manganese, Molybdenum, Selenium, Zinc
• Blood Sugar Cycle– Glucose, Insulin, A1C Hemoglobin
• Cardio Risk– Complex Reactive Protein
– Homocysteine
• Kidneys– Bun, Creatinine, Uric Acid
• Protein– Total Protein, Albumin, Globulin
• Liver– GGTP, SGOT, SGPT, LDH, Total
Direct Bilirubin, Alkaline Phosphatase
• Thyroid– T3 Uptake, T4, Free Thyroxine
Index, FT4, 2nd Gen TSH
• Blood Cells– Complete Blood Cell Count
– Red Blood Cell Subtypes
– White Blood Cell Subtypes
• Cancer Screen– CEA, Total PSA, % Free PSA
– CA-19-9
• Vitamins & Antioxidant Screen– Vit D, E; Selenium, ALA, coQ10,
Glutathione, Total Antioxidant Fn.
Only One of These Was Far Out of Normal Range

But, In Spite of My High Levels of Omega-3s, My Blood Measurements Revealed Chronic Inflammation
CRP >3 Indicates Increased Risk of CHD
15x
27x
Normal Range CRP < 1
Complex Reactive Protein (CRP) is a Blood Biomarker for Detecting Presence of Inflammation
5x
Antibiotics
Antibiotics

By Quantifying Stool Measurements Over Time I Discovered Source of Inflammation Was Likely in Colon
Normal Range<7.3 µg/mL
124x Upper Limit TypicalLactoferrin Value for
Active IBD
Lactoferrin is a Sensitive and Specific Biomarker for Detecting Presence of Inflammatory Bowel Disease (IBD)
Stool Samples Analyzed by www.yourfuturehealth.com
Antibiotics Antibiotics

Confirmation of IBD Using Calprotectin Biomarker From Stool Sample
Normal Range<50 µg/g
50x Upper Limit
Antibiotics
“It is worth noting that calprotectin concentrations
correlate more closely with histological than
macroscopic (endoscopic) findings, suggesting that this biological marker
is more sensitive than endoscopy in evaluating IBD’s activity.”
--Fecal Calprotectin and Lactoferrin for the Prediction of
Inflammatory Bowel Disease Relapse, Gisbert, et al.,
Inflamm. Bowel Dis. 15, 1190-1198 (2009)

Colonoscopy Images Show 6 Inches of Sigmoid Colon Inflammation
Dec 2010 May 2011
2010 Image from Scripps Health2011 Image from UCSD Health Services

Descending Colon
Sigmoid ColonThreading Iliac Arteries
Major Kink
Confirming the IBD (Crohn’s) Hypothesis:Finding the “Smoking Gun” with MRI Imaging
I Obtained the MRI Slices From UCSD Medical Services
and Converted to Interactive 3D Working With
Calit2 Staff & DeskVOX Software
Transverse ColonLiver
Small Intestine
Diseased Sigmoid ColonCross Section
MRI Jan 2012

Why Did I Have an Autoimmune Disease like IBD?
Despite decades of research, the etiology of Crohn's disease
remains unknown. Its pathogenesis may involve a complex interplay between
host genetics, immune dysfunction,
and microbial or environmental factors.--The Role of Microbes in Crohn's Disease
Paul B. Eckburg & David A. RelmanClin Infect Dis. 44:256-262 (2007)
So I Set Out to Quantify All Three!

From “How Do You Feel?”, to “What Are Your Numbers?”
Where’s There’s DataThere’s Hope