Embed Size (px)
Citation preview
Prefeasibility Report on Development of Logistics Park in Karnataka
i
Disclaimer The information in this Report has been prepared based on information collected from primary and
secondary sources. Wherever information was not readily available, reasonable assumptions have been
made, in good faith to draw meaningful inferences and these have been mentioned in the respective
sections of the report. All such assumptions are subject to further corroboration based on availability of
information. The information and analysis presented in this Report is not and does not purport to be
comprehensive or to have been independently verified. This report has been prepared by Feedback
Infrastructure Services Private Limited (FISPL) for its client, Infrastructure Development Department
(IDD), Karnataka for its use for furthering the project development activity on PPP basis. No external
agency shall use any part of this report without prior permission from IDD.
The information contained in this Report is selective and is subject to updation, expansion, revision and
amendment. It does not, and does not purport to, contain all the information that may be required.
This Report includes certain statements, estimates, projections and forecasts. Such statements,
estimates, projections, targets and forecasts are based on reasonable assumptions made by the
management, officers and employees of FISPL. Assumptions and the base information on which they are
made may or may not prove to be correct. No representation or warranty is given as to the
reasonableness of forecasts or the assumptions on which they may be based and nothing in this Report
is, or should be relied on as, a promise, representation or warranty.
Prefeasibility Report on Development of Logistics Park in Karnataka
i
Table of Contents
LIST OF TABLES ..................................................................................................................................................... III
LIST OF FIGURES ..................................................................................................................................................... V
1 EXECUTIVE SUMMARY ................................................................................................................................... 1
2 INTRODUCTION ............................................................................................................................................. 2
2.1 STRUCTURE OF THE REPORT ................................................................................................................................ 3
2.2 APPROACH & METHODOLOGY ............................................................................................................................. 4
3 SECTOR PROFILE ............................................................................................................................................ 6
3.1 INDUSTRY OVERVIEW ......................................................................................................................................... 6
3.2 REGIONAL PROFILE OF KARNATAKA ....................................................................................................................... 7
3.2.1 Transportation ......................................................................................................................................... 7
3.2.2 EXIM scenario of Karnataka ..................................................................................................................... 8
3.2.3 Industrial Scenario ................................................................................................................................... 8
3.2.4 Agriculture ............................................................................................................................................... 8
3.3 INFRASTRUCTURE GAP ....................................................................................................................................... 9
3.4 PPP ACTIVITIES IN THE SECTOR ............................................................................................................................ 9
3.5 KEY ISSUES ..................................................................................................................................................... 10
4 PROJECT ...................................................................................................................................................... 11
4.1 DESCRIPTION OF THE PROJECT ........................................................................................................................... 11
4.2 SITE/LOCATION DETAILS ................................................................................................................................... 13
4.2.1 Bangalore ............................................................................................................................................... 14
4.2.2 Hubli-Dharwad ....................................................................................................................................... 18
4.2.3 Hassan ................................................................................................................................................... 22
4.3 CASE STUDIES FOR SIMILAR PROJECTS IN INDIA ...................................................................................................... 24
5 MARKET ASSESSMENT ................................................................................................................................. 25
5.1 BANGALORE ................................................................................................................................................... 26
5.1.1 Inland Container Depot .......................................................................................................................... 26
5.1.2 Warehouse ............................................................................................................................................. 29
5.1.3 Truck Terminal ....................................................................................................................................... 30
5.1.4 Future Demand Drivers .......................................................................................................................... 30
5.2 HUBLI ........................................................................................................................................................... 32
5.2.1 Inland Container Depot .......................................................................................................................... 32
5.2.2 Warehousing .......................................................................................................................................... 34
5.2.3 Truck Terminal ....................................................................................................................................... 35
5.2.4 Future Demand Drivers .......................................................................................................................... 36
5.3 HASSAN ........................................................................................................................................................ 38
5.3.1 Inland Container Depot .......................................................................................................................... 38
5.3.2 Warehousing .......................................................................................................................................... 40
5.3.3 Truck Terminal ....................................................................................................................................... 41
5.3.4 Future Demand Drivers .......................................................................................................................... 41
Prefeasibility Report on Development of Logistics Park in Karnataka
ii
5.4 PROJECT DESIGN ............................................................................................................................................. 42
5.4.1 Bangalore ............................................................................................................................................... 42
5.4.2 Hubli-Dharwad ....................................................................................................................................... 44
5.4.3 Hassan ................................................................................................................................................... 47
6 PROJECT FINANCIALS ................................................................................................................................... 49
6.1 COST ESTIMATION ........................................................................................................................................... 49
6.1.1 Capital Cost ............................................................................................................................................ 49
6.2 OTHER PROJECT ASSUMPTIONS ......................................................................................................................... 51
6.2.1 Capital Structure .................................................................................................................................... 51
6.2.2 Income Tax Assumptions ....................................................................................................................... 52
6.2.3 Depreciation Assumptions ..................................................................................................................... 52
6.2.4 Revenue Assumptions ............................................................................................................................ 52
6.2.5 Assumptions for Operational Expenses .................................................................................................. 54
6.3 KEY PROJECT FINANCIALS.................................................................................................................................. 56
6.4 SENSITIVITY ANALYSIS ...................................................................................................................................... 56
6.4.1 Bangalore ............................................................................................................................................... 57
6.4.2 Hubli-Dharwad ....................................................................................................................................... 58
6.4.3 Hassan ................................................................................................................................................... 59
7 STATUTORY & LEGAL FRAMEWORK ............................................................................................................. 62
7.1. LEGAL & REGULATORY FRAMEWORK .................................................................................................................. 62
7.2. KEY ISSUES ..................................................................................................................................................... 63
8 INDICATIVE ENVIRONMENTAL AND SOCIAL IMPACTS ................................................................................. 65
8.1 ENVIRONMENTAL IMPACTS AND MITIGATION MEASURES ....................................................................................... 65
8.2 SOCIAL IMPACT ............................................................................................................................................... 66
8.3 CONCLUSION .................................................................................................................................................. 66
9 OPERATING FRAMEWORK ........................................................................................................................... 66
9.1 RISKS AND MITIGATION .................................................................................................................................... 66
9.2 CLASSIFICATION OF RISKS .................................................................................................................................. 67
9.3 RISK MITIGATION ............................................................................................................................................ 67
9.4 INDICATIVE PROJECT STRUCTURE ........................................................................................................................ 68
10 WAY FORWARD ........................................................................................................................................... 70
11 ANNEXURE .................................................................................................................................................. 71
11.1 ANNEXURE 1: ASSUMPTIONS FOR COMMODITY GROWTH RATES FOR PROJECTING CONTAINER TRAFFIC IN HUBLI AND
HASSAN 71
11.2 ANNEXURE 2: VALUE FOR MONEY ANALYSIS ........................................................................................................ 73
12 ANNEXURE 3 CASHFLOW STATEMENTS FOR ALL LOCATIONS ...................................................................... 75
Prefeasibility Report on Development of Logistics Park in Karnataka
iii
List of Tables
Table 1: Major Road Infrastructure in Karnataka...................................................................................... 7
Table 2: Major Centers handling Goods in Karnataka ............................................................................... 8
Table 3: PPP Projects Studies in Logistics Sector Done by the Government of Karnataka .......................... 9
Table 4: Key Details of the Selected Locations for Logistics Parks ........................................................... 13
Table 5: Major Industrial Areas and Industries in Bangalore ................................................................... 14
Table 6 Small Scale Industries in Bangalore ............................................................................................ 15
Table 7: Case Study of Logistics Park on PPP basis .................................................................................. 24
Table 8: Current Container Traffic Handling Scenario in Bangalore ........................................................ 26
Table 9 EXIM Annual Container Traffic trend at Bangalore’s ICDs ........................................................... 27
Table 10: Forecasted Traffic of Containers for Bangalore and the Proposed Facility at Harohalli ............ 28
Table 11: Warehouses Owned and Rented by Various Players in Bangalore ........................................... 29
Table 12: Assumptions for Warehouse Space at the Proposed Logistics Park in Bangalore at Harohalli .. 29
Table 13: Industrial Estates Planned in Bangalore .................................................................................. 30
Table 14: Major Projects Under Implementation in Bangalore ............................................................... 31
Table 15: Commodity wise container traffic in Hubli .............................................................................. 32
Table 16: Annual Trend of Container movement in Belgaum ICD ........................................................... 33
Table 17: Projected Container Traffic in Hubli ........................................................................................ 34
Table 18: Warehouses Owned and Rented by major players in Hubli ..................................................... 35
Table 19: Assumptions for Warehouse Space at the Proposed Logistics Park in Hubli ............................ 35
Table 20 Future industrial investments in Hubli-Dharwad ...................................................................... 37
Table 21: Exporters of Coffee in Hassan region ...................................................................................... 38
Table 22: Commodity-wise container movement at Hassan ................................................................... 38
Table 23: Traffic projections for container traffic at Hassan ................................................................... 39
Table 24: Estimating Warehousing Capacity Required at Hassan ............................................................ 40
Table 25: Break-up of trucks deployed in Hassan ................................................................................... 41
Table 26: Volumes of commodities moved in trucks at Hassan .............................................................. 41
Table 27: Area Plan for Basic Facilities at the Proposed Logistics Park at Harohalli Bangalore ................. 42
Table 28: Area Break-Up for Common Facilities at proposed at Logistics Park at Harohalli ..................... 43
Table 29: Area Break-Up for Common Facilities proposed at Logistics Park at Harohalli ......................... 43
Table 30: Area Summary for the Proposed Logistics Park at Harohalli in Bangalore ................................ 44
Table 31: Area Plan for Basic Facilities at the proposed Logistics Park at Hubli-Dharwad ........................ 45
Table 32: Area break-up for Common Facilities at Hubli-Dharwad ......................................................... 45
Table 33: Area for Commercial Facilities at Hubli-Dharwad .................................................................... 46
Table 34: Area Summary for the Proposed Logistics Park at Hubli-Dharwad ........................................... 46
Table 35: Area Plan for Basic Facilities at the proposed Logistics Park at Hassan .................................... 47
Table 36: Area Summary for the Proposed Logistics Park at Hassan ....................................................... 49
Prefeasibility Report on Development of Logistics Park in Karnataka
iv
Table 37: Capital Cost Assumptions ....................................................................................................... 50
Table 38: Equipment Assumptions ......................................................................................................... 50
Table 39: Cost Break-Up for Logistics Park at all proposed sites ............................................................. 51
Table 40: Financing Assumptions ........................................................................................................... 52
Table 41: Depreciation Assumptions ...................................................................................................... 52
Table 42: Revenue Assumptions for Proposed Logistics Parks in Bangalore, Hubli-Dharwad and Hassan 52
Table 43 Assumptions for Key Staff at the Logistics Park ........................................................................ 54
Table 44: Assumptions for Labour for the Logistics Parks ....................................................................... 54
Table 45: Assumptions for other Operational Expenses at Logistics Park ................................................ 55
Table 46: Lease Rental Assumptions for all the sites .............................................................................. 55
Table 47: Key Project Returns ................................................................................................................ 56
Table 48: Sensitivity Analysis to changes in construction costs for Logistics Park in Bangalore ............... 57
Table 49: Sensitivity of the Project to the Changes in Operational Costs for Bangalore Logistics Park ..... 57
Table 50: Sensitivity to Changes in Revenue For Bangalore Logistics Park .............................................. 58
Table 51: Sensitivity Analysis to changes in construction costs for Logistics Park in Hubli-Dharwad ........ 58
Table 52: Sensitivity of the Project to the Changes in Operational Costs for Hubli-Dharwad Logistics Park
.............................................................................................................................................................. 59
Table 53: Sensitivity to Changes in Revenue For Hubli-Dharwad Logistics Park....................................... 59
Table 54: Sensitivity Analysis to changes in construction costs for Logistics Park in Hassan .................... 60
Table 55: Sensitivity of the Project to the Changes in Operational Costs for Hassan Logistics Park ......... 60
Table 56: Sensitivity to Changes in Revenue For Hassan Logistics Park ................................................... 60
Table 57: Indicative Environmental Impact and Mitigation Measures .................................................... 65
Table 58: Risk Mitigation Measures for the Project ................................................................................ 67
Table 59: Project Implementation Framework ....................................................................................... 68
Table 60: Assumed Growth Rates of commodities being handled in containers at Hubli ........................ 71
Table 61: Assumed Growth Rates of commodities being handled in containers at Hassan ..................... 71
Table 62: VFM Analysis for Bangalore Logistics Park .............................................................................. 73
Prefeasibility Report on Development of Logistics Park in Karnataka
v
List of Figures Figure 1: Project Status ............................................................................................................................ 2
Figure 2: Methodology for the Study ....................................................................................................... 4
Figure 3: Major Logistics Centers in Karnataka ......................................................................................... 9
Figure 4: Aggregation of Major Warehouses at Consumption Centers ................................................... 12
Figure 5: Location of the Harohalli with Location of Major Industrial Areas ............................................ 16
Figure 6: Industrial Areas en-route to Chennai from Harohalli ............................................................... 17
Figure 7: Location and Connectivity of Mammigatti in Hubli-Dharwad ................................................... 19
Figure 8: Location and Connectivity of Site Available by KIADB in Hassan that can be used for the
proposed Logistics Park ......................................................................................................................... 22
Figure 9: Large Scale Projects Under Implementation in Hassan ............................................................ 41
Prefeasibility Report on Development of Logistics Park in Karnataka
1
1 Executive Summary
Background
Government of Karnataka (GoK) envisages development of infrastructure through Public Private
Partnership (PPP) and intends to attract investments in various sectors in Karnataka.
The current report details out the prefeasibility done for Logistics Parks on PPP basis in Karnataka at 3
locations:
a. Bangalore (Harohalli)
b. Hubli-Dharwad
c. Hassan
The main project idea is to have an integrated Logistics Park with facilities like Inland Container Depots
(ICD), warehouses, truck terminals and ancillary commercial development.
Sector Profile
Logistics is a significant part of economy which deals with the movement and storage of materials.
Logistics costs include cost of transport by various modes, warehousing and storage activities,
consolidation/deconsolidation activities and database management. Transportation and storage costs
contributes significantly to the total logistics cost.
In India logistics cost is estimated to be 8~10% per cent of GDP. India is ranked 47th on the World
Logistics Performance Indicator 2011, indicating that India’s logistics infrastructure is still at a developing
stage and a lot needs to be done to improve its efficiency. However overall logistics industry in India is
pegged to grow at around 11 per cent CAGR and is expected to reach INR 4.6 trillion in 2013-14.
Key Issues
1. Though studies have been done by various departments on creating logistics infrastructure on
PPP basis, on-ground progress on bidding out projects is slow. This needs a more proactive
approach by the concerned departments
2. Availability of land is a major issue. Even though Karnataka Industrial Areas Development Board
(KIADB) is creating a land bank for the proposed sites in Bangalore, Hubli and Hassan;, it will
need to be transferred to the private player. Further, the land at these sites is in final stages of
acquisition but it can still take 2-3 months for the final transfer to happen. This is because, even
though notification for farmers/owners of land to come up with their claims has been issued by
the government, the claims will have to be vetted after which the government will take the
possession of the land.
Prefeasibility Report on Development of Logistics Park in Karnataka
1
Project Description
Logistics Parks mainly comprises the following components:
1. Inland Container Depot (ICD): ICDs are facilities that provide container handling, custom
clearances away from the port to industries. There are two types of inland container
terminals-EXIM and Domestic Container terminals. While the former is meant for export and
import traffic, the latter is meant for domestic traffic. The Consultants do not recommend
domestic container terminal in any of the locations as of now. This is because domestic
container movement currently is at a highly nascent stage in India, with only Container
Corporation of India handling more than 80% of the domestic container traffic. The total
domestic container traffic in India is less than 1 mn TEU. One of the main reasons why the
domestic container movement has not picked up in India is non-availability of return load
and inability to run high frequency train services for domestic traffic.
2. Warehouses: Warehouses are storage areas for storing goods before distribution to
consumers. Typically, large warehouses aggregate around the metro cities which are major
consumption centers. Warehouses play a crucial role in distribution of commodities to the
final consumer.
3. Truck Terminals: Truck terminals provide parking space for the trucks carrying bulk
commodities and containers. By its very nature, a logistics park involves handling of bulk
commodities and containers and it will be important to provide space for trucks in the
premises. Further, the park can also be used to give truck parking space to other trucks
which are not using warehousing and container facility at the park. The need for truck
terminal arises from the fact that in its absence trucks are parked on the roads creating
congestion on the roads.
While each of the component described above are present on stand-alone basis in most of the
cities, a logistics park provides such facilities in an integrated manner. Companies located within
the facility will get benefits in terms of economies of scale and ability to provide integrated
services with complementary service providers being present in the vicinity. Hence, for the
proposed sites similar integrated facility is suggested. The components for each site are
suggested based on market assessment of each city.
Market Assessment
Market Assessment was done for all three cities to arrive at what kind of facilities that the proposed
Logistics Park would require. The assessment also indicated the project sizing for each city.
1. Bangalore: A logistics park is proposed at Harohalli in Rural Bangalore district of Karnataka.
a. Assessment for Inland Container Depot: A detailed market assessment and container
forecasting through regression analysis was done for Bangalore to arrive at container
traffic projections. One of the limitations of the site is that it is nearly 20 km away from
the nearest rail line; hence the consultants have considered only the container traffic
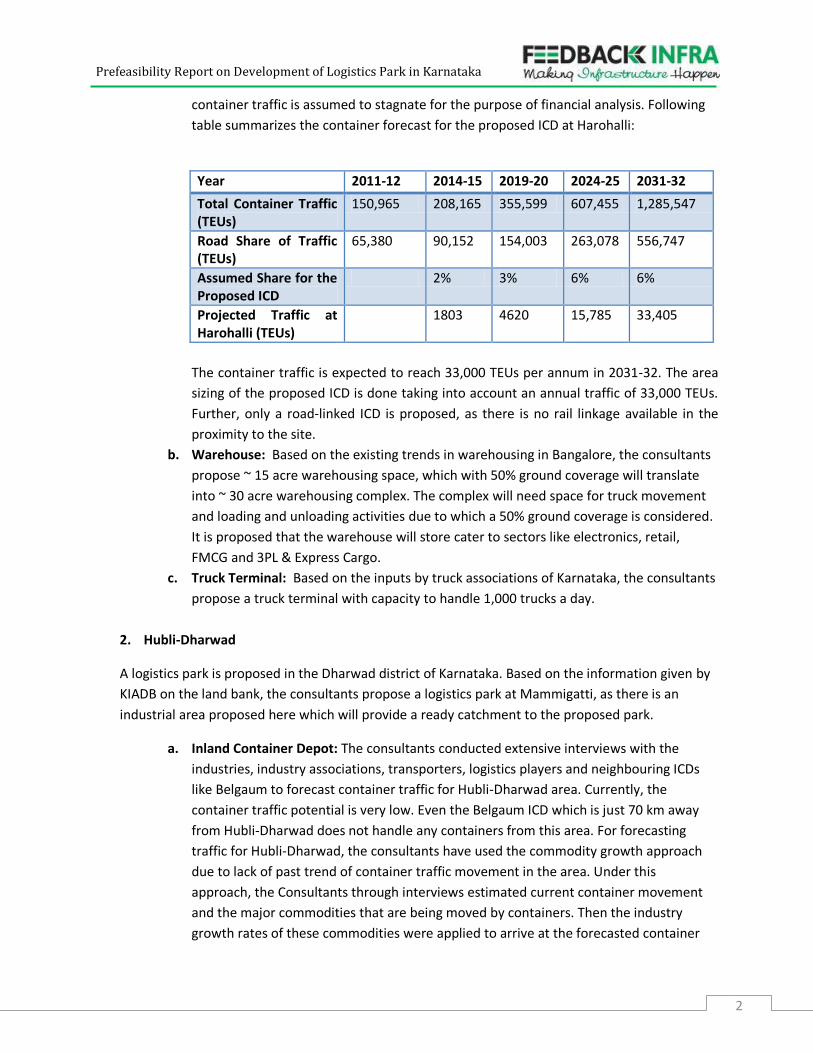
moving on roads for estimation. Further, forecast is done till 2032 after which the
Prefeasibility Report on Development of Logistics Park in Karnataka
2
container traffic is assumed to stagnate for the purpose of financial analysis. Following
table summarizes the container forecast for the proposed ICD at Harohalli:
Year 2011-12 2014-15 2019-20 2024-25 2031-32
Total Container Traffic (TEUs)
150,965 208,165 355,599 607,455 1,285,547
Road Share of Traffic (TEUs)
65,380 90,152 154,003 263,078 556,747
Assumed Share for the Proposed ICD
2% 3% 6% 6%
Projected Traffic at Harohalli (TEUs)
1803 4620 15,785 33,405
The container traffic is expected to reach 33,000 TEUs per annum in 2031-32. The area
sizing of the proposed ICD is done taking into account an annual traffic of 33,000 TEUs.
Further, only a road-linked ICD is proposed, as there is no rail linkage available in the
proximity to the site.
b. Warehouse: Based on the existing trends in warehousing in Bangalore, the consultants
propose ~ 15 acre warehousing space, which with 50% ground coverage will translate
into ~ 30 acre warehousing complex. The complex will need space for truck movement
and loading and unloading activities due to which a 50% ground coverage is considered.
It is proposed that the warehouse will store cater to sectors like electronics, retail,
FMCG and 3PL & Express Cargo.
c. Truck Terminal: Based on the inputs by truck associations of Karnataka, the consultants
propose a truck terminal with capacity to handle 1,000 trucks a day.
2. Hubli-Dharwad
A logistics park is proposed in the Dharwad district of Karnataka. Based on the information given by
KIADB on the land bank, the consultants propose a logistics park at Mammigatti, as there is an
industrial area proposed here which will provide a ready catchment to the proposed park.
a. Inland Container Depot: The consultants conducted extensive interviews with the
industries, industry associations, transporters, logistics players and neighbouring ICDs
like Belgaum to forecast container traffic for Hubli-Dharwad area. Currently, the
container traffic potential is very low. Even the Belgaum ICD which is just 70 km away
from Hubli-Dharwad does not handle any containers from this area. For forecasting
traffic for Hubli-Dharwad, the consultants have used the commodity growth approach
due to lack of past trend of container traffic movement in the area. Under this
approach, the Consultants through interviews estimated current container movement
and the major commodities that are being moved by containers. Then the industry
growth rates of these commodities were applied to arrive at the forecasted container
Prefeasibility Report on Development of Logistics Park in Karnataka
3
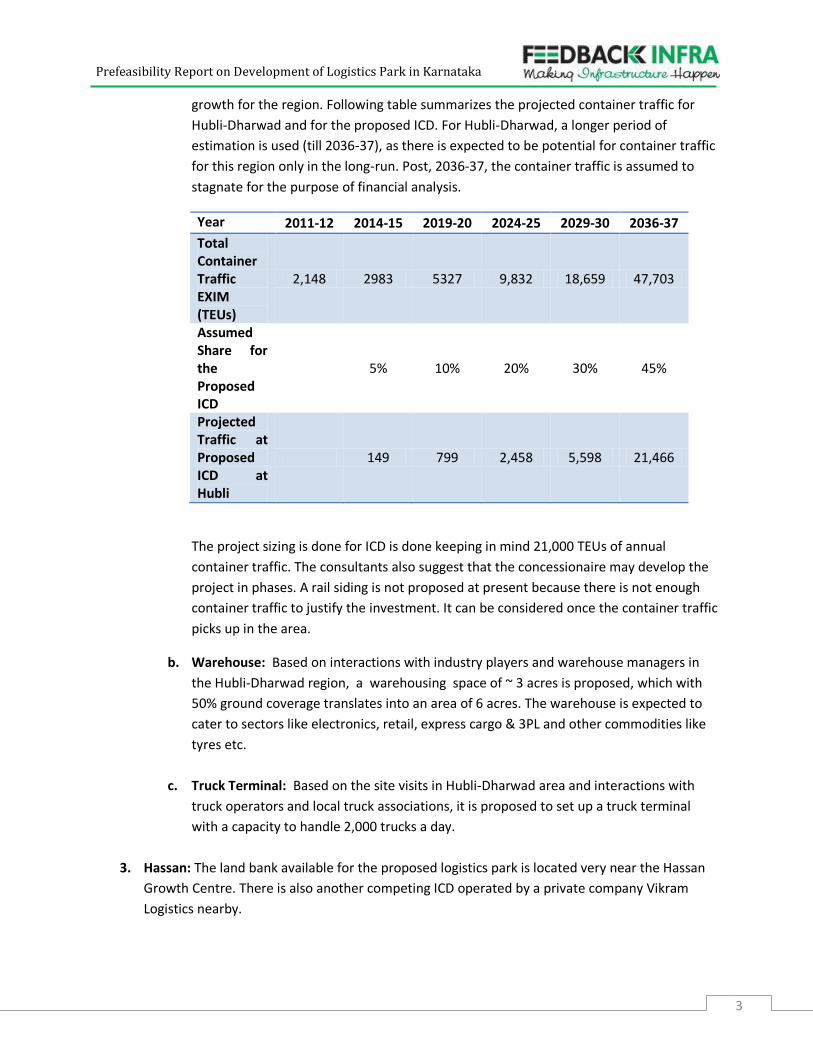
growth for the region. Following table summarizes the projected container traffic for
Hubli-Dharwad and for the proposed ICD. For Hubli-Dharwad, a longer period of
estimation is used (till 2036-37), as there is expected to be potential for container traffic
for this region only in the long-run. Post, 2036-37, the container traffic is assumed to
stagnate for the purpose of financial analysis.
Year 2011-12 2014-15 2019-20 2024-25 2029-30 2036-37
Total Container Traffic EXIM (TEUs)
2,148 2983 5327 9,832 18,659 47,703
Assumed Share for the Proposed ICD
5% 10% 20% 30% 45%
Projected Traffic at Proposed ICD at Hubli
149 799 2,458 5,598 21,466
The project sizing is done for ICD is done keeping in mind 21,000 TEUs of annual
container traffic. The consultants also suggest that the concessionaire may develop the
project in phases. A rail siding is not proposed at present because there is not enough
container traffic to justify the investment. It can be considered once the container traffic
picks up in the area.
b. Warehouse: Based on interactions with industry players and warehouse managers in
the Hubli-Dharwad region, a warehousing space of ~ 3 acres is proposed, which with
50% ground coverage translates into an area of 6 acres. The warehouse is expected to
cater to sectors like electronics, retail, express cargo & 3PL and other commodities like
tyres etc.
c. Truck Terminal: Based on the site visits in Hubli-Dharwad area and interactions with
truck operators and local truck associations, it is proposed to set up a truck terminal
with a capacity to handle 2,000 trucks a day.
3. Hassan: The land bank available for the proposed logistics park is located very near the Hassan
Growth Centre. There is also another competing ICD operated by a private company Vikram
Logistics nearby.
Prefeasibility Report on Development of Logistics Park in Karnataka
4
a. Inland Container Depot: Even though the container movement in Hassan is more than
that seen in Hubli-Dharwad( ~ 10,000 container a year), it already has a container depot,
which is highly underutilized. The facility is not handling any export containers for past
six months due to lack of Electronic Data Interchange (EDI) facility - leading to non-
availability of connectivity to the Export Development Authority’s new centralized
online clearance system. The ICD is expected to get this connectivity from April 2012.
The ICD with 12,000 sqm of yard space has the capacity to handle ~1 lakh containers a
year. The Consultants projected the container traffic growth for Hassan the same way it
was done for Hubli, but found that the growth will not be enough to justify another ICD.
Hence, an ICD is not recommended for Hassan.
b. Warehouse: Currently, Hassan mainly has warehouses for foodgrains and fertilizers. The
consultants analysed the movement of food grains and fertilizers from good sheds and
the existing capacity of the major warehouses like Karnataka State Warehouses. It is
estimated that there is a need for ~ 3.4 acres of warehousing space for foodgrains and
fertilizers. With a ground coverage of 50% , this translates into ~7 acres of warehousing
complex for Hassan logistics park.
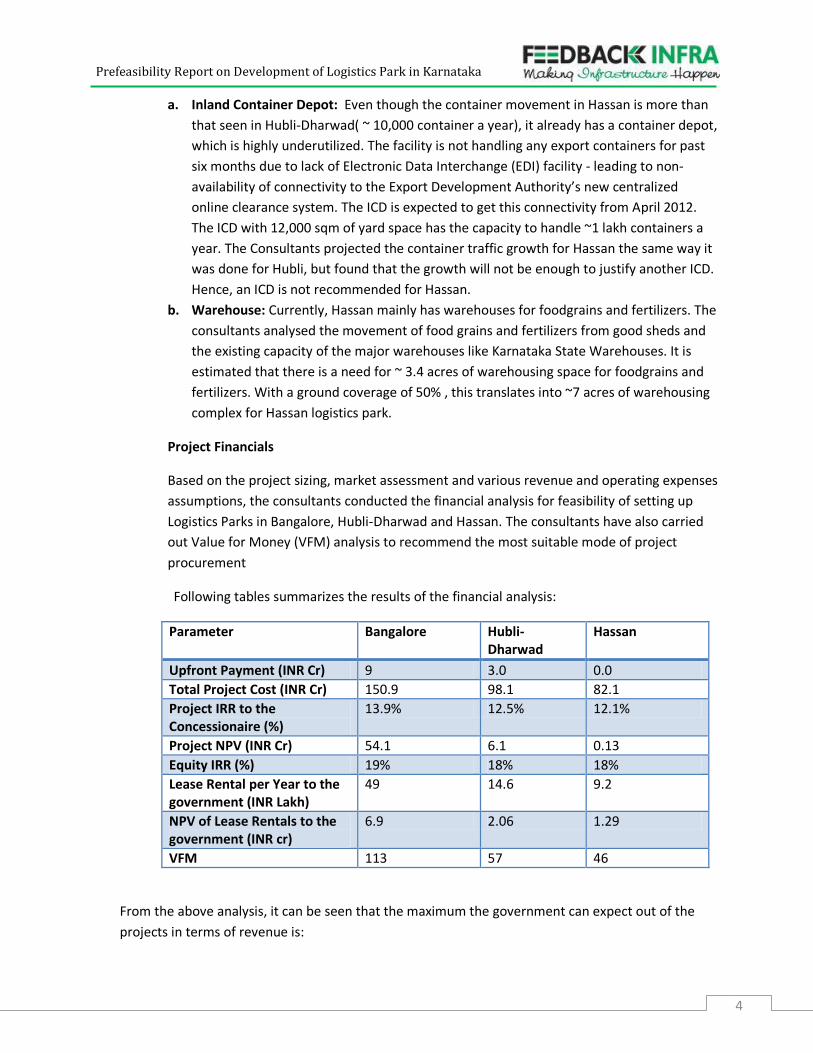
Project Financials
Based on the project sizing, market assessment and various revenue and operating expenses
assumptions, the consultants conducted the financial analysis for feasibility of setting up
Logistics Parks in Bangalore, Hubli-Dharwad and Hassan. The consultants have also carried
out Value for Money (VFM) analysis to recommend the most suitable mode of project
procurement
Following tables summarizes the results of the financial analysis:
Parameter Bangalore Hubli-Dharwad
Hassan
Upfront Payment (INR Cr) 9 3.0 0.0
Total Project Cost (INR Cr) 150.9 98.1 82.1
Project IRR to the Concessionaire (%)
13.9% 12.5% 12.1%
Project NPV (INR Cr) 54.1 6.1 0.13
Equity IRR (%) 19% 18% 18%
Lease Rental per Year to the government (INR Lakh)
49 14.6 9.2
NPV of Lease Rentals to the government (INR cr)
6.9 2.06 1.29
VFM 113 57 46
From the above analysis, it can be seen that the maximum the government can expect out of the
projects in terms of revenue is:
Prefeasibility Report on Development of Logistics Park in Karnataka
5
1. Bangalore-INR 16 crore (upfront plus the NPV of lease rentals)
2. Hubli-Dharwad-INR 5 crore (upfront fee plus the NPV of lease rentals)
3. Hassan-INR 1.3 crore of lease rentals
All projects offer positive project and equity NPV in both the scenarios. Further the value for money
is also positive for all three projects, hence the project is expected to give generate value for all
stakeholders involved and can be taken up on PPP basis.
Statutory and Legal Framework
Logistics sector is not a highly regulated sector, except for facilities which are related to export and
import of goods, where prior permission from Ministry of Commerce and Industry is required. There
are no restrictions on tariffs to be charged for logistics services and they are determined
competitively. However, there are several policies that govern and impact the sector at central and
state level.
At the Central level, the regulation that can have a major impact on the sector, especially
warehousing is Goods & Service Tax regime. India plans to introduce Goods and Service Tax (GST) in
the country, which is a single tax umbrella for goods and services. While the rollout of the Goods
and Services Tax is delayed, it is expected that implementation of this tax regime would lead to
consolidation of warehousing space in India, with players preferring larger warehouses serving
multiple states. The GST is expected to fuel the demand for large integrated logistics facilities in
India.
Further, setting up of an inland container terminal (ICD/CFS under the Customs Act, 1962) will
require a prior Ministry of Commerce and Industry approval.
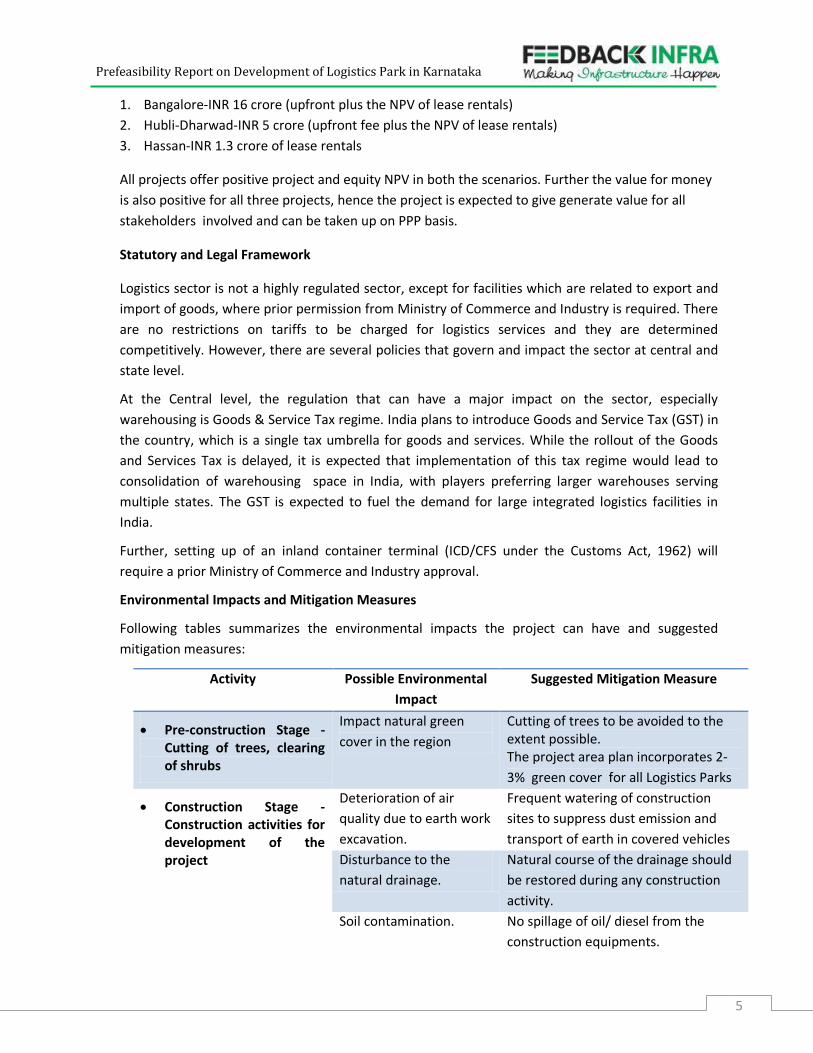
Environmental Impacts and Mitigation Measures
Following tables summarizes the environmental impacts the project can have and suggested
mitigation measures:
Activity Possible Environmental
Impact
Suggested Mitigation Measure
Pre-construction Stage - Cutting of trees, clearing of shrubs
Impact natural green
cover in the region
Cutting of trees to be avoided to the extent possible. The project area plan incorporates 2-
3% green cover for all Logistics Parks
Construction Stage - Construction activities for development of the project
Deterioration of air
quality due to earth work
excavation.
Frequent watering of construction
sites to suppress dust emission and
transport of earth in covered vehicles
Disturbance to the
natural drainage.
Natural course of the drainage should
be restored during any construction
activity.
Soil contamination. No spillage of oil/ diesel from the
construction equipments.
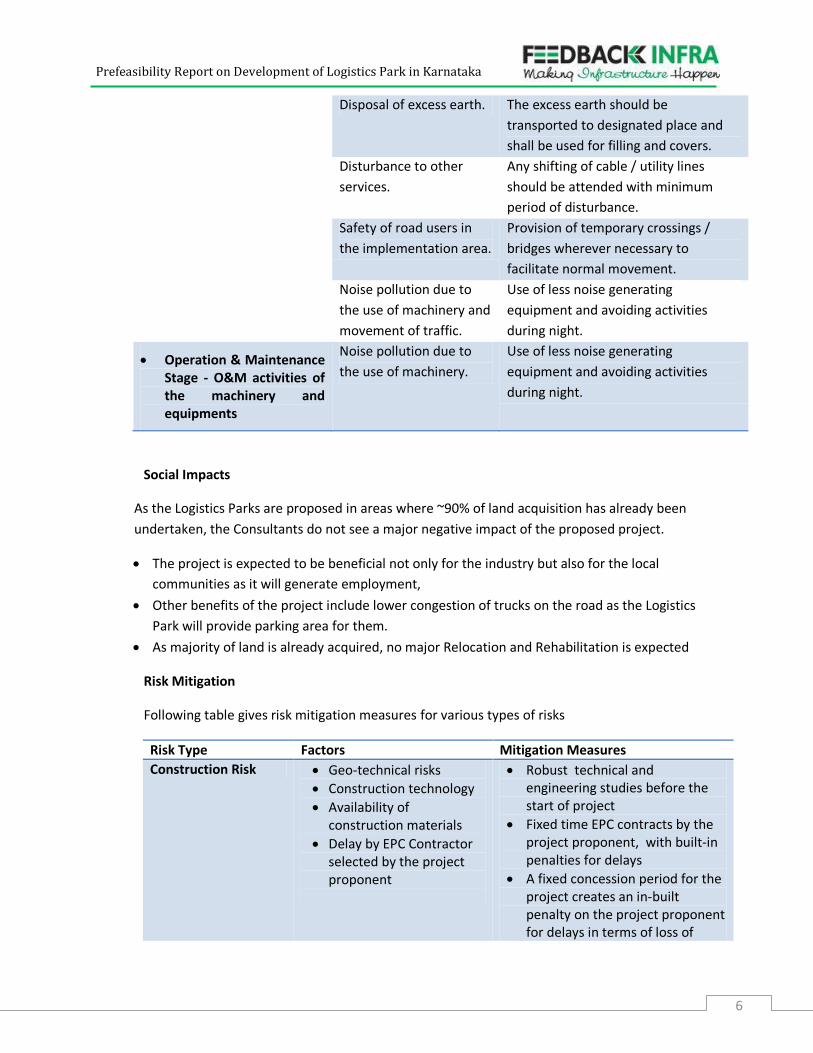
Prefeasibility Report on Development of Logistics Park in Karnataka
6
Disposal of excess earth. The excess earth should be
transported to designated place and
shall be used for filling and covers.
Disturbance to other
services.
Any shifting of cable / utility lines
should be attended with minimum
period of disturbance.
Safety of road users in
the implementation area.
Provision of temporary crossings /
bridges wherever necessary to
facilitate normal movement.
Noise pollution due to
the use of machinery and
movement of traffic.
Use of less noise generating
equipment and avoiding activities
during night.
Operation & Maintenance Stage - O&M activities of the machinery and equipments
Noise pollution due to
the use of machinery.
Use of less noise generating
equipment and avoiding activities
during night.
Social Impacts
As the Logistics Parks are proposed in areas where ~90% of land acquisition has already been
undertaken, the Consultants do not see a major negative impact of the proposed project.
The project is expected to be beneficial not only for the industry but also for the local
communities as it will generate employment,
Other benefits of the project include lower congestion of trucks on the road as the Logistics
Park will provide parking area for them.
As majority of land is already acquired, no major Relocation and Rehabilitation is expected
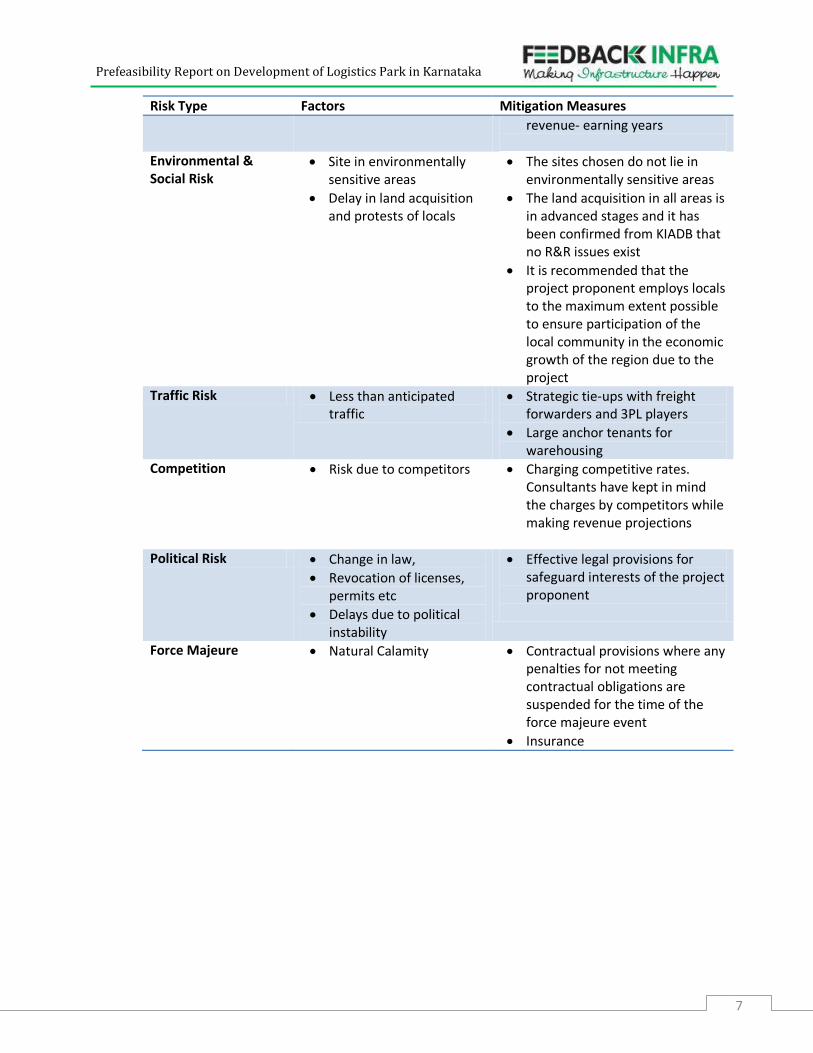
Risk Mitigation
Following table gives risk mitigation measures for various types of risks
Risk Type Factors Mitigation Measures
Construction Risk Geo-technical risks
Construction technology
Availability of construction materials
Delay by EPC Contractor selected by the project proponent
Robust technical and engineering studies before the start of project
Fixed time EPC contracts by the project proponent, with built-in penalties for delays
A fixed concession period for the project creates an in-built penalty on the project proponent for delays in terms of loss of
Prefeasibility Report on Development of Logistics Park in Karnataka
7
Risk Type Factors Mitigation Measures
revenue- earning years
Environmental & Social Risk
Site in environmentally sensitive areas
Delay in land acquisition and protests of locals
The sites chosen do not lie in environmentally sensitive areas
The land acquisition in all areas is in advanced stages and it has been confirmed from KIADB that no R&R issues exist
It is recommended that the project proponent employs locals to the maximum extent possible to ensure participation of the local community in the economic growth of the region due to the project
Traffic Risk Less than anticipated traffic
Strategic tie-ups with freight forwarders and 3PL players
Large anchor tenants for warehousing
Competition Risk due to competitors Charging competitive rates. Consultants have kept in mind the charges by competitors while making revenue projections
Political Risk Change in law,
Revocation of licenses, permits etc
Delays due to political instability
Effective legal provisions for safeguard interests of the project proponent
Force Majeure Natural Calamity Contractual provisions where any penalties for not meeting contractual obligations are suspended for the time of the force majeure event
Insurance
Prefeasibility Report on Development of Logistics Park in Karnataka
1
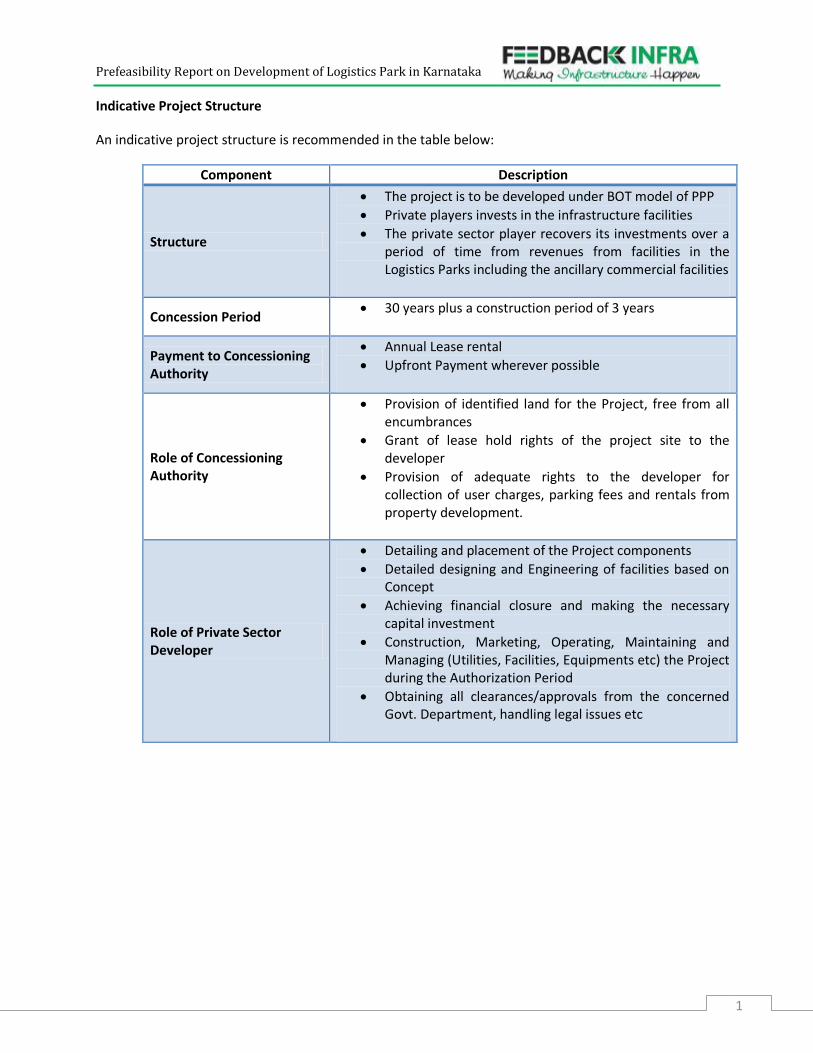
Indicative Project Structure
An indicative project structure is recommended in the table below:
Component Description
Structure
The project is to be developed under BOT model of PPP
Private players invests in the infrastructure facilities
The private sector player recovers its investments over a period of time from revenues from facilities in the Logistics Parks including the ancillary commercial facilities
Concession Period 30 years plus a construction period of 3 years
Payment to Concessioning Authority
Annual Lease rental
Upfront Payment wherever possible
Role of Concessioning Authority
Provision of identified land for the Project, free from all encumbrances
Grant of lease hold rights of the project site to the developer
Provision of adequate rights to the developer for collection of user charges, parking fees and rentals from property development.
Role of Private Sector Developer
Detailing and placement of the Project components
Detailed designing and Engineering of facilities based on Concept
Achieving financial closure and making the necessary capital investment
Construction, Marketing, Operating, Maintaining and Managing (Utilities, Facilities, Equipments etc) the Project during the Authorization Period
Obtaining all clearances/approvals from the concerned Govt. Department, handling legal issues etc
Prefeasibility Report on Development of Logistics Park in Karnataka
2
2 Introduction
Government of Karnataka (GoK) envisages development of infrastructure through Public Private
Partnership (PPP) and intends to attract investments in various sectors in Karnataka.
For this, Infrastructure Development Department (IDD) has selected consultants for Sector Specific
Inventory & Institutional Strengthening for mainstreaming of PPP for various departments related to
infrastructure development in the state. Feedback Infrastructure Services Private Limited (FISPL) was
selected to assist Infrastructure Development Department (IDD) to fulfill the above objective.
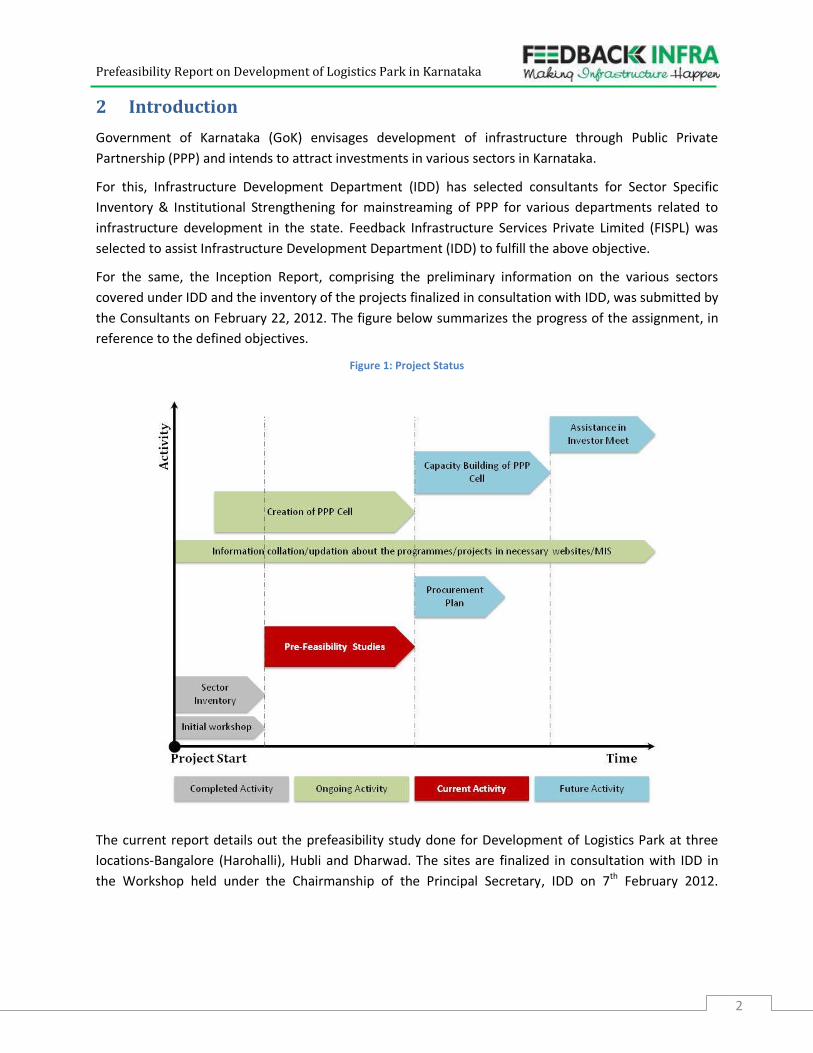
For the same, the Inception Report, comprising the preliminary information on the various sectors
covered under IDD and the inventory of the projects finalized in consultation with IDD, was submitted by
the Consultants on February 22, 2012. The figure below summarizes the progress of the assignment, in
reference to the defined objectives.
Figure 1: Project Status
The current report details out the prefeasibility study done for Development of Logistics Park at three
locations-Bangalore (Harohalli), Hubli and Dharwad. The sites are finalized in consultation with IDD in
the Workshop held under the Chairmanship of the Principal Secretary, IDD on 7th February 2012.
Prefeasibility Report on Development of Logistics Park in Karnataka
3
2.1 Structure of the Report
This Project Report has been structured along the following in a chapter-wise format.
Chapter 2: Introduction
The chapter includes the background of the project and introduction about the study that is being
undertaken.
Chapter 3: Sector Profile
The chapter includes the industry overview of the logistics sector in India and the regional profile of
Logistics infrastructure in Karnataka
Chapter 4: Project Detail
The chapter includes the details and description of the project and project components. The project also
includes the needs & considerations undertaken for the development of the project. The best case
studies will be reviewed in this chapter and the relevant points will be taken to apply in the specific
project and project design
Chapter 5: Market Assessment
Chapter 5 includes the market assessment for the project. The chapter describes the logistics industry
outlook of the region, opportunities in the sector & thus the demand projections have been made.
Chapter 6: Project Financials
Based on the market assessment and project details, this chapter describes the project financial analysis.
The chapter includes the cost & revenue assessment for the project facilities.
Chapter 7: Statutory & Legal Framework
Based on the above analysis a legal & regulatory framework has been developed for the project and a
proposed tariff structure has been prepared for the project.
Chapter 8: Indicative Environmental & Social Impacts
The chapter includes an indicative environmental & social impact assessment and the mitigation
measures for the project.
Chapter 9: Operating Framework
The chapter includes the risk assessment for the projects & appropriate mitigation measures. An
indicative project structure has been prepared.
Chapter 10: Way Ahead
The chapter includes the time line for the procurement plan for further development of the project.
Prefeasibility Report on Development of Logistics Park in Karnataka
4
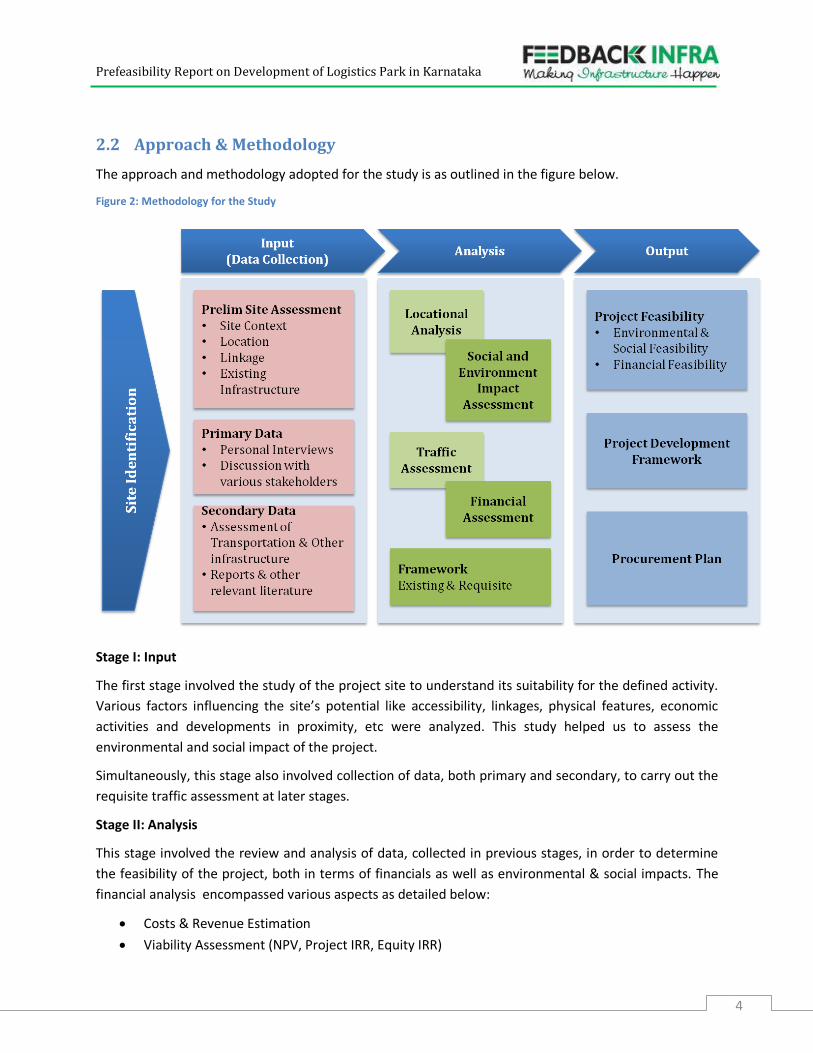
2.2 Approach & Methodology
The approach and methodology adopted for the study is as outlined in the figure below.
Figure 2: Methodology for the Study
Stage I: Input
The first stage involved the study of the project site to understand its suitability for the defined activity.
Various factors influencing the site’s potential like accessibility, linkages, physical features, economic
activities and developments in proximity, etc were analyzed. This study helped us to assess the
environmental and social impact of the project.
Simultaneously, this stage also involved collection of data, both primary and secondary, to carry out the
requisite traffic assessment at later stages.
Stage II: Analysis
This stage involved the review and analysis of data, collected in previous stages, in order to determine
the feasibility of the project, both in terms of financials as well as environmental & social impacts. The
financial analysis encompassed various aspects as detailed below:
Costs & Revenue Estimation
Viability Assessment (NPV, Project IRR, Equity IRR)
Prefeasibility Report on Development of Logistics Park in Karnataka
5
Project Funding
Scenario Analysis, etc.
This stage also involved a study of the legal and statutory framework along with identification of issues
and mitigation measures.
Stage III: Output
Based upon the results of the analysis, the framework and the procurement plan for further
development of the project were defined.
Prefeasibility Report on Development of Logistics Park in Karnataka
6
3 Sector Profile
3.1 Industry Overview
Logistics is a significant part of economy which deals with the movement and storage of materials.
Logistics costs include cost of transport by various modes, warehousing and storage activities,
consolidation/deconsolidation activities and database management. Transportation and storage
costs contributes significantly to the total logistics cost.
In India logistics cost is estimated to be 8~10% per cent of GDP. India is ranked 47th on the World
Logistics Performance Indicator 2011, indicating that India’s logistics infrastructure is still at a
developing stage and a lot needs to be done to improve its efficiency. However overall logistics
industry in India is pegged to grow at around 11 per cent CAGR and is expected to reach INR 4.6
trillion in 2013-14.
Logistics includes two major components:
a) Transportation
Transportation is the most important aspect in the logistics, with maximum share in the total
logistics cost. Transportation is required at each step in the logistics supply chain, be it the
transport of raw materials from production centers to the manufacturing centers or transport of
finished products from manufacturing centers to the consumption centers.
The transportation of goods can be through any mode of transport whether it’s Road, Rail, Ports
or Airports. Thus an efficient transport system helps in reducing the logistics cost of any country.
b) Storage
There are various stages at which storage of goods is required in the logistics supply chain.
Storage of goods is required to store both the raw materials and finished products either at or
near the manufacturing/production or consumption centres. These spaces also work as a nodal
centre for consolidation, stuffing and de stuffing of bulk materials to be transported further.
Similarly, to provide efficient and quick supply to various regions, storage is required at various
levels.
The facilities required at the logistics park or at the storage facility are as follows:
Inland Container Depot (ICD)/Container Freight Station (CFS): Handle containers emanating
out of the catchment area
Warehousing Complex: Providing storage facilities, including cold storage facility
Truck Terminal: Space for truck parking and resting facilities/dormitories for drivers
Bulk Handling Facilities: To be developed at places where bulk handling is required
Rail Siding where ever necessary can be developed for better connectivity
Office complex for freight forwarders, shipping agents, logistics companies
Indian logistics industry offers huge opportunity for investments. Government is trying to reform the
regulatory scenario to chart the growth path. Introduction of GST will help decrease logistics spend
in India.
Prefeasibility Report on Development of Logistics Park in Karnataka
7
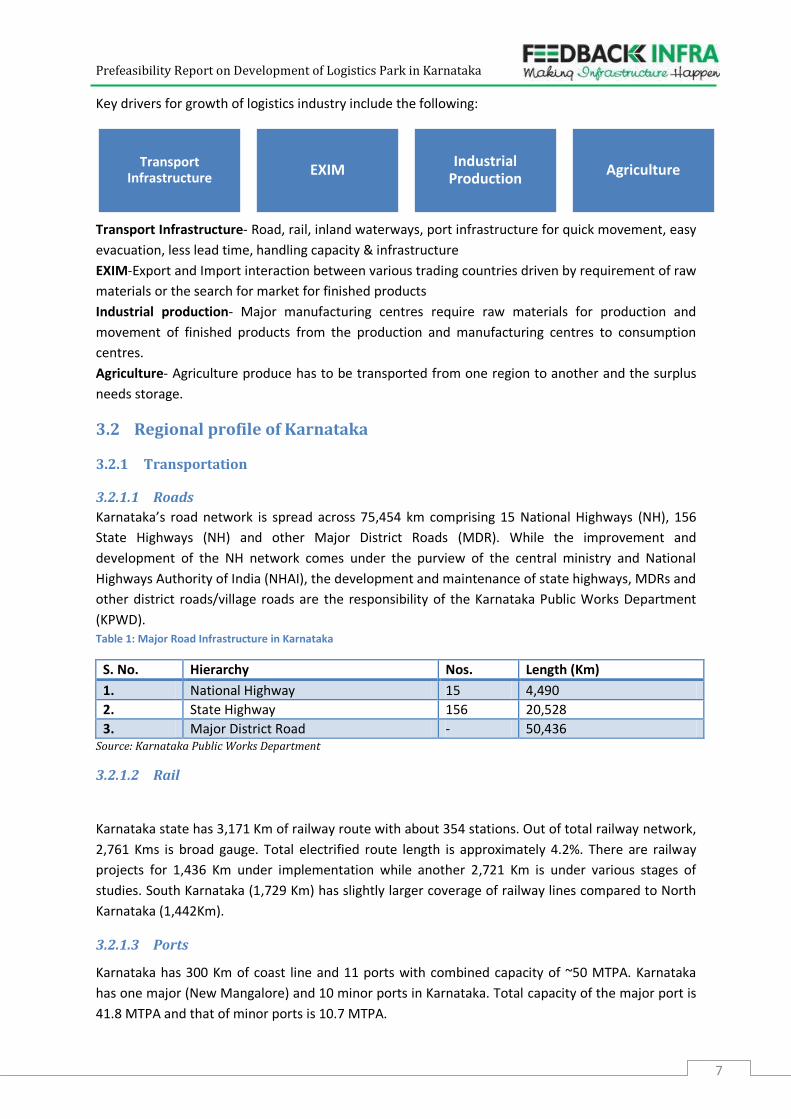
Key drivers for growth of logistics industry include the following:
Transport Infrastructure- Road, rail, inland waterways, port infrastructure for quick movement, easy
evacuation, less lead time, handling capacity & infrastructure
EXIM-Export and Import interaction between various trading countries driven by requirement of raw
materials or the search for market for finished products
Industrial production- Major manufacturing centres require raw materials for production and
movement of finished products from the production and manufacturing centres to consumption
centres.
Agriculture- Agriculture produce has to be transported from one region to another and the surplus
needs storage.
3.2 Regional profile of Karnataka
3.2.1 Transportation
3.2.1.1 Roads
Karnataka’s road network is spread across 75,454 km comprising 15 National Highways (NH), 156
State Highways (NH) and other Major District Roads (MDR). While the improvement and
development of the NH network comes under the purview of the central ministry and National
Highways Authority of India (NHAI), the development and maintenance of state highways, MDRs and
other district roads/village roads are the responsibility of the Karnataka Public Works Department
(KPWD). Table 1: Major Road Infrastructure in Karnataka
S. No. Hierarchy Nos. Length (Km)
1. National Highway 15 4,490
2. State Highway 156 20,528
3. Major District Road - 50,436 Source: Karnataka Public Works Department
3.2.1.2 Rail
Karnataka state has 3,171 Km of railway route with about 354 stations. Out of total railway network,
2,761 Kms is broad gauge. Total electrified route length is approximately 4.2%. There are railway
projects for 1,436 Km under implementation while another 2,721 Km is under various stages of
studies. South Karnataka (1,729 Km) has slightly larger coverage of railway lines compared to North
Karnataka (1,442Km).
3.2.1.3 Ports
Karnataka has 300 Km of coast line and 11 ports with combined capacity of ~50 MTPA. Karnataka
has one major (New Mangalore) and 10 minor ports in Karnataka. Total capacity of the major port is
41.8 MTPA and that of minor ports is 10.7 MTPA.
Transport Infrastructure
EXIM Industrial
Production Agriculture
Prefeasibility Report on Development of Logistics Park in Karnataka
8
Total traffic handled by minor ports is 3 MTPA in year 2009-10. Major commodities handled by ports
are Iron ore, Granite, Molasses, Salt, POL & Products and Edible Oil.
3.2.1.4 Airports
Karnataka’s aviation infrastructure comprises national and international airports. Currently, the air
travel demand is catered to by 4 operational airports at Bangalore, Mangalore, Hubli and Belgaum.
While the airports at Bangalore & Mangalore are international airports, other airports are used for
domestic purpose only. Bangalore Airport is the most significant in the state registering traffic of
nearly 8.5 mn passengers during April to November 2011, 18% of which were international
passengers.
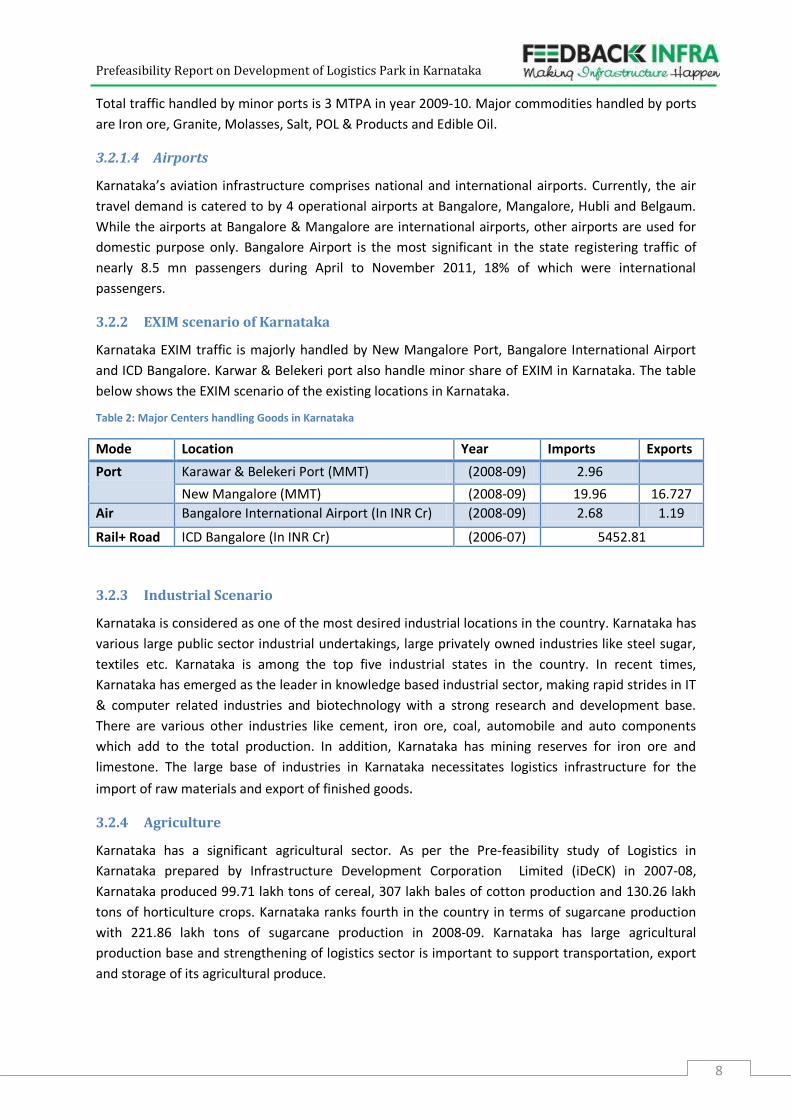
3.2.2 EXIM scenario of Karnataka
Karnataka EXIM traffic is majorly handled by New Mangalore Port, Bangalore International Airport
and ICD Bangalore. Karwar & Belekeri port also handle minor share of EXIM in Karnataka. The table
below shows the EXIM scenario of the existing locations in Karnataka.
Table 2: Major Centers handling Goods in Karnataka
Mode Location Year Imports Exports
Port Karawar & Belekeri Port (MMT) (2008-09) 2.96
New Mangalore (MMT) (2008-09) 19.96 16.727
Air Bangalore International Airport (In INR Cr) (2008-09) 2.68 1.19
Rail+ Road ICD Bangalore (In INR Cr) (2006-07) 5452.81
3.2.3 Industrial Scenario
Karnataka is considered as one of the most desired industrial locations in the country. Karnataka has
various large public sector industrial undertakings, large privately owned industries like steel sugar,
textiles etc. Karnataka is among the top five industrial states in the country. In recent times,
Karnataka has emerged as the leader in knowledge based industrial sector, making rapid strides in IT
& computer related industries and biotechnology with a strong research and development base.
There are various other industries like cement, iron ore, coal, automobile and auto components
which add to the total production. In addition, Karnataka has mining reserves for iron ore and
limestone. The large base of industries in Karnataka necessitates logistics infrastructure for the
import of raw materials and export of finished goods.
3.2.4 Agriculture
Karnataka has a significant agricultural sector. As per the Pre-feasibility study of Logistics in
Karnataka prepared by Infrastructure Development Corporation Limited (iDeCK) in 2007-08,
Karnataka produced 99.71 lakh tons of cereal, 307 lakh bales of cotton production and 130.26 lakh
tons of horticulture crops. Karnataka ranks fourth in the country in terms of sugarcane production
with 221.86 lakh tons of sugarcane production in 2008-09. Karnataka has large agricultural
production base and strengthening of logistics sector is important to support transportation, export
and storage of its agricultural produce.
Prefeasibility Report on Development of Logistics Park in Karnataka
9
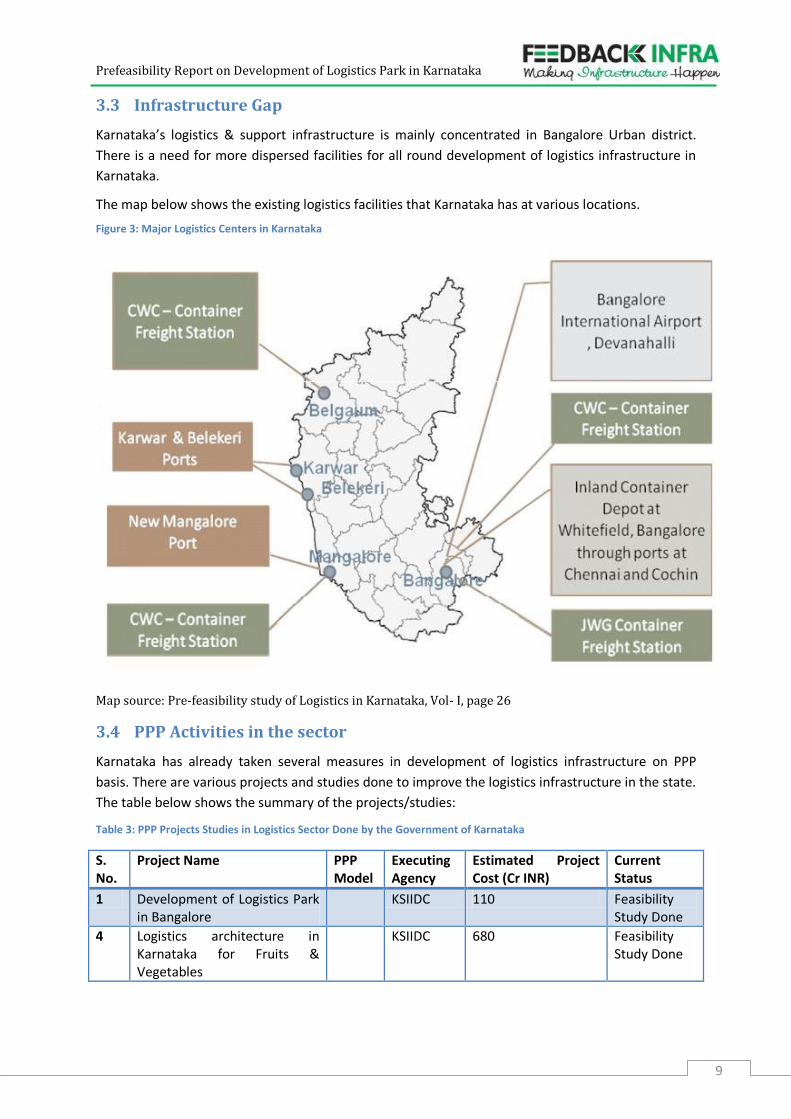
3.3 Infrastructure Gap
Karnataka’s logistics & support infrastructure is mainly concentrated in Bangalore Urban district.
There is a need for more dispersed facilities for all round development of logistics infrastructure in
Karnataka.
The map below shows the existing logistics facilities that Karnataka has at various locations.
Figure 3: Major Logistics Centers in Karnataka
Map source: Pre-feasibility study of Logistics in Karnataka, Vol- I, page 26
3.4 PPP Activities in the sector
Karnataka has already taken several measures in development of logistics infrastructure on PPP
basis. There are various projects and studies done to improve the logistics infrastructure in the state.
The table below shows the summary of the projects/studies:
Table 3: PPP Projects Studies in Logistics Sector Done by the Government of Karnataka
S. No.
Project Name PPP Model
Executing Agency
Estimated Project Cost (Cr INR)
Current Status
1 Development of Logistics Park in Bangalore
KSIIDC 110 Feasibility Study Done
4 Logistics architecture in Karnataka for Fruits & Vegetables
KSIIDC 680 Feasibility Study Done
Prefeasibility Report on Development of Logistics Park in Karnataka
10
3.5 Key Issues
3. Though studies have been done by various departments on creating logistics infrastructure
on PPP basis, on-ground progress on bidding out projects is slow. This needs a more
proactive approach by the concerned departments
4. Availability of land is a major issue. Even though Karnataka Industrial Areas Development
Board (KIADB) is creating a land bank for the proposed sites in Bangalore, Hubli and
Hassan;, it will need to be transferred to the private player. Further, the land at these sites is
in final stages of acquisition but it can still take 2-3 months for the final transfer to happen.
This is because, even though notification for farmers/owners of land to come up with their
claims has been issued by the government, the claims will have to be vetted after which the
government will take the possession of the land.
Prefeasibility Report on Development of Logistics Park in Karnataka
11
4 Project
4.1 Description of the Project
It is proposed that logistics parks be set up in 3 locations in Karnataka. Logistics centres are generally
established to aid the industrial and economic activity in a city. Major components of a Logistics Park
include:
1. Inland Container Depots:
Inland container depots are facilities that provide container handling, custom clearances
away from the port to the industries. There are two types of inland container terminals:
a. EXIM Container Terminals catering to the export and import container traffic of the
surrounding industries. The terminals offer services for handling and temporary storage
of import/ export laden and empty containers carried under customs control and have
the authority to clear goods for home use, warehousing, temporary admissions,
re‐export, temporary storage for onward transit and export. Transshipment of cargo can
also take place from such stations.
b. Domestic Container Terminals: Acts as aggregation point for goods to be transported
within India in containers. Domestic container movement currently is at a highly nascent
stage in India, with only Container Corporation of India handling more than 80% of the
domestic container traffic. The total domestic container traffic in India is less than 1 mn
TEU. The domestic container sector suffers from various issues such as:
Non-availability of return load and inability to run high frequency rail services for
domestic container traffic
Lack of industry specific customized services and containers
Lack of last-mile connectivity increases multiple handling, thereby increasing the
total logistics cost
Low volumes of domestic container traffic make it unviable to operate domestic container
depots. Thus, the consultants do not recommend Domestic Container Terminal in the
Logistics Park proposed in any of the identified locations.
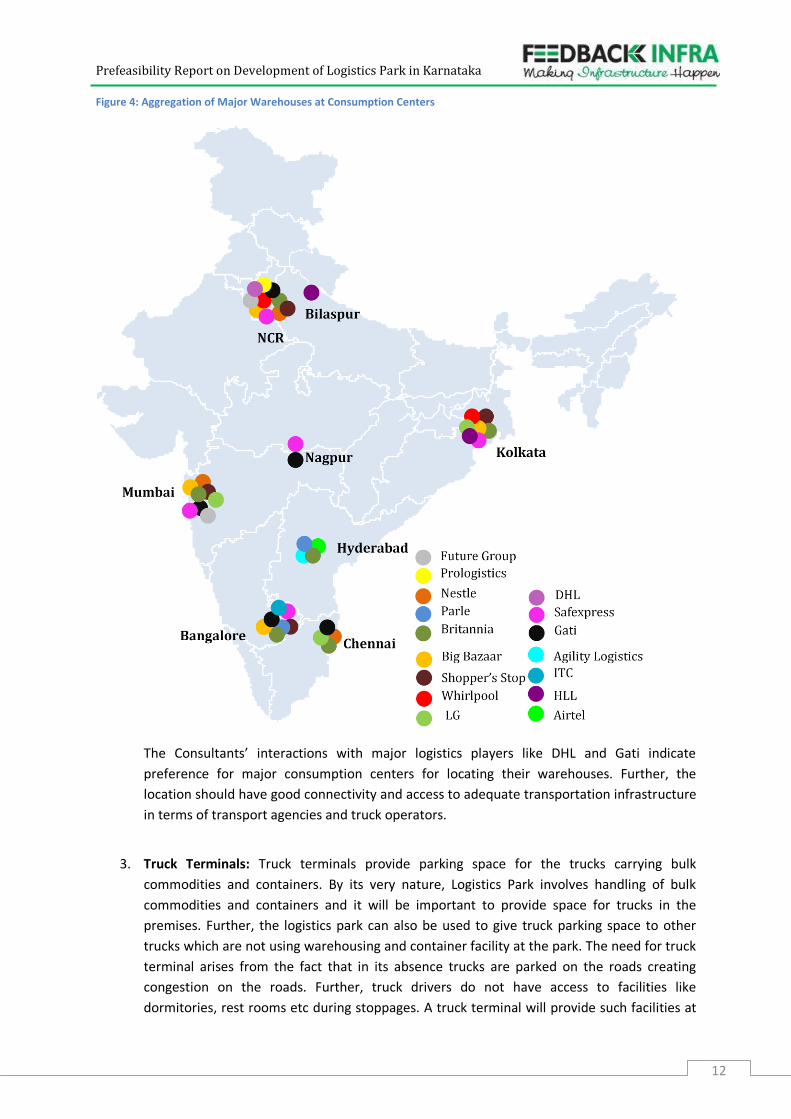
2. Warehouses: Warehouses are storage areas for storing goods before distribution to
consumers. Typically, large warehouses aggregate around the metro cities which are major
consumption centers. Warehouses play a crucial role in distribution of commodities to the
final consumer. While the manufacturing centres house the mother warehouses, they are
generally owned by the production unit itself providing limited opportunity for a private
player to provide storage services. It is at the distribution points, where the opportunity for
a logistics player to provide services lies. Following figure illustrates how there is an
aggregation of warehouses in the major metros, which are also major consumption centers:
Prefeasibility Report on Development of Logistics Park in Karnataka
12
Figure 4: Aggregation of Major Warehouses at Consumption Centers
The Consultants’ interactions with major logistics players like DHL and Gati indicate
preference for major consumption centers for locating their warehouses. Further, the
location should have good connectivity and access to adequate transportation infrastructure
in terms of transport agencies and truck operators.
3. Truck Terminals: Truck terminals provide parking space for the trucks carrying bulk
commodities and containers. By its very nature, Logistics Park involves handling of bulk
commodities and containers and it will be important to provide space for trucks in the
premises. Further, the logistics park can also be used to give truck parking space to other
trucks which are not using warehousing and container facility at the park. The need for truck
terminal arises from the fact that in its absence trucks are parked on the roads creating
congestion on the roads. Further, truck drivers do not have access to facilities like
dormitories, rest rooms etc during stoppages. A truck terminal will provide such facilities at
Prefeasibility Report on Development of Logistics Park in Karnataka
13
one place and also provide for space for offices of the truck operators to allow them to
conduct business from the terminal itself.
While each of the component of the Logistics Park described above are present on stand-alone
basis in most of the cities, a Logistics Park provides such facilities in an integrated manner.
Companies located within the facility will get benefits in terms of economies of scale and ability
to provide integrated services with complementary service providers being present in the
vicinity.
Based on the requirements for each component of the logistics park discussed above, it is
evident that locations with considerable economic and industrial activity are ideal for a Logistics
Park. Further, it is also important that land is available for construction of Logistics Park with the
government. Keeping these factors in mind, 3 locations-Hubli, Hassan and Bangalore are chosen.
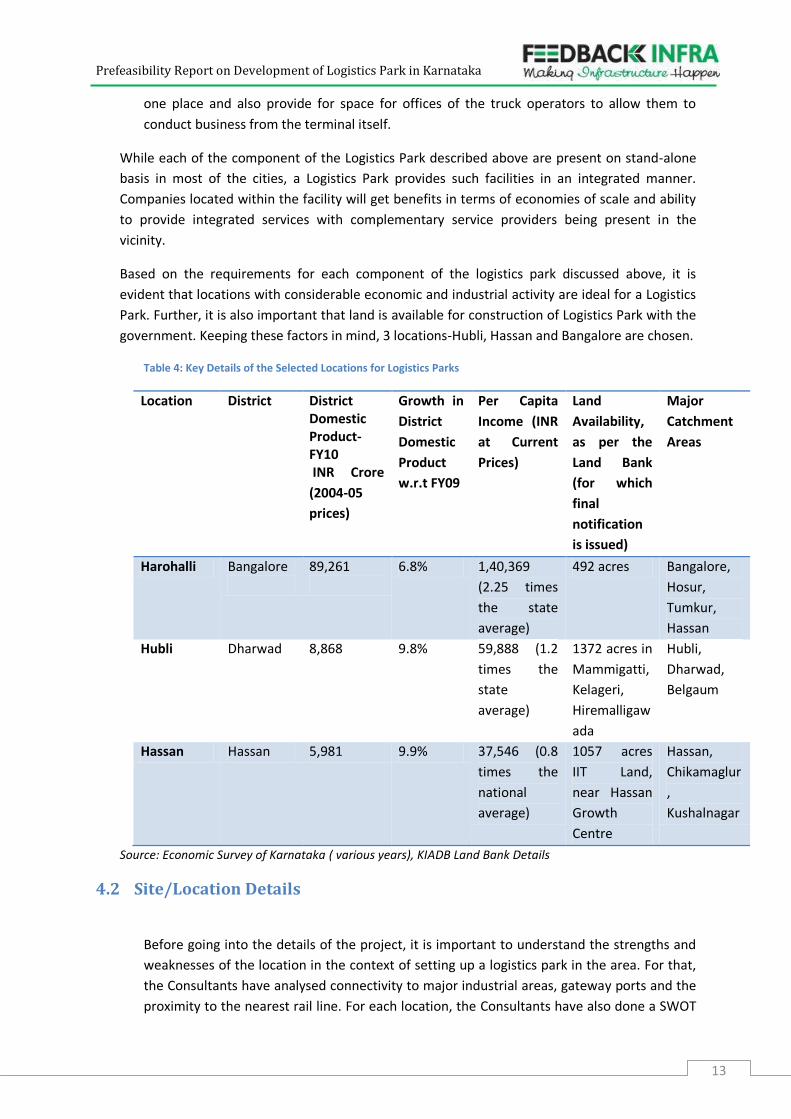
Table 4: Key Details of the Selected Locations for Logistics Parks
Location District District Domestic Product-FY10 INR Crore
(2004-05
prices)
Growth in
District
Domestic
Product
w.r.t FY09
Per Capita
Income (INR
at Current
Prices)
Land
Availability,
as per the
Land Bank
(for which
final
notification
is issued)
Major
Catchment
Areas
Harohalli Bangalore
89,261
6.8% 1,40,369
(2.25 times
the state
average)
492 acres Bangalore,
Hosur,
Tumkur,
Hassan
Hubli Dharwad 8,868 9.8% 59,888 (1.2
times the
state
average)
1372 acres in
Mammigatti,
Kelageri,
Hiremalligaw
ada
Hubli,
Dharwad,
Belgaum
Hassan Hassan 5,981 9.9% 37,546 (0.8
times the
national
average)
1057 acres
IIT Land,
near Hassan
Growth
Centre
Hassan,
Chikamaglur
,
Kushalnagar
Source: Economic Survey of Karnataka ( various years), KIADB Land Bank Details
4.2 Site/Location Details
Before going into the details of the project, it is important to understand the strengths and
weaknesses of the location in the context of setting up a logistics park in the area. For that,
the Consultants have analysed connectivity to major industrial areas, gateway ports and the
proximity to the nearest rail line. For each location, the Consultants have also done a SWOT
Prefeasibility Report on Development of Logistics Park in Karnataka
14
analysis, to give a balanced picture on strengths and weaknesses of a particular location
along with threats and opportunities.
4.2.1 Bangalore
Bangalore is chosen for setting up of a Logistics Park as it is the most prosperous and
industrialized district of Karnataka. The site proposed in consultation with Infrastructure
Development Department is in Harohalli. KIADB has a land bank of nearly 492 acres in
Harohalli 3rd stage, for which the final notification has been issued, (which means all the public
hearings are done and land acquisition process is 90% done).
4.2.1.1 Existing Economic and Industrial Base of the City
Bangalore is one of the most prosperous districts of Karnataka accounting for more than 37%
of the state domestic product. It is a major industrial centre with electronics, engineering and
auto being the major sectors. Further, it is a major consumption centre, being the 5th largest
metropolitan city in India with a population of ~8 mn. Of the 13,000 registered factories in
Karnataka, more than half of them are present in Bangalore.
Apart from the booming IT/ITES sector, Bangalore has an appreciable manufacturing base
also. Major industrial areas in and around Bangalore driving the industrial production of the
district include Peenya Industrial Area, Jigani Industrial Area, Neelmangala Industrial Area and
Bidadi Industrial Area. Following table gives the prominent industrial areas and industries in
the district:
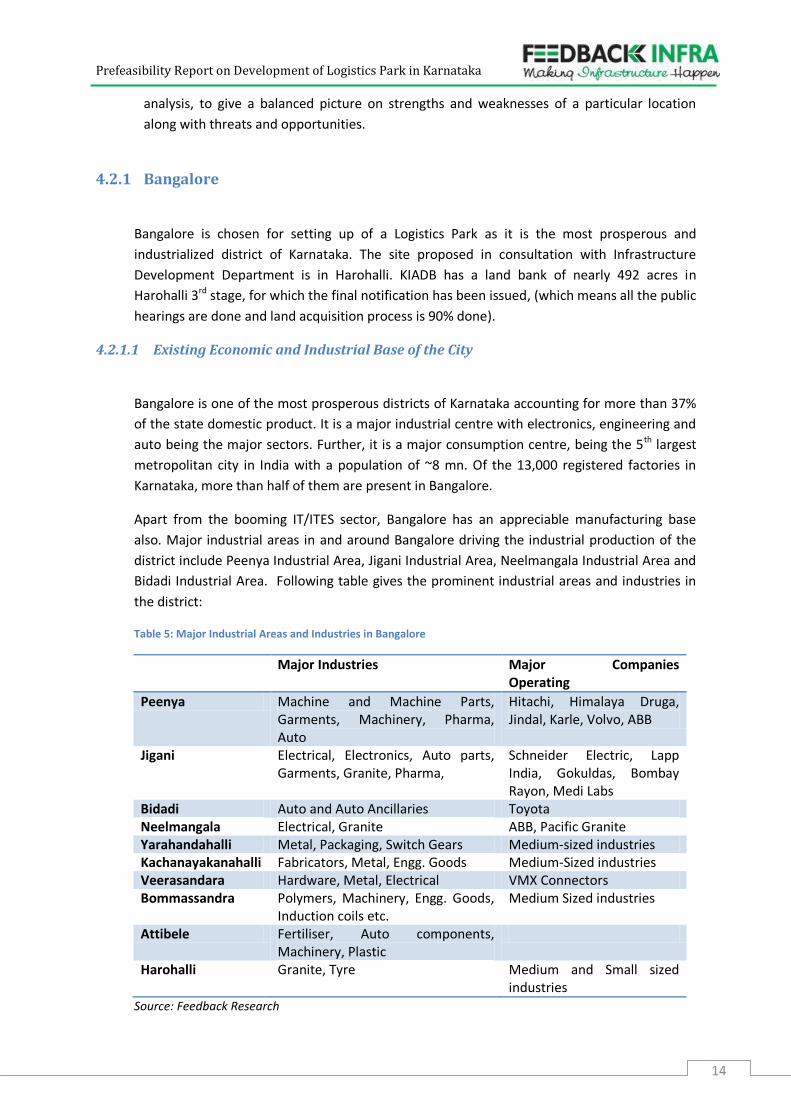
Table 5: Major Industrial Areas and Industries in Bangalore
Major Industries Major Companies Operating
Peenya Machine and Machine Parts, Garments, Machinery, Pharma, Auto
Hitachi, Himalaya Druga, Jindal, Karle, Volvo, ABB
Jigani Electrical, Electronics, Auto parts, Garments, Granite, Pharma,
Schneider Electric, Lapp India, Gokuldas, Bombay Rayon, Medi Labs
Bidadi Auto and Auto Ancillaries Toyota Neelmangala Electrical, Granite ABB, Pacific Granite Yarahandahalli Metal, Packaging, Switch Gears Medium-sized industries Kachanayakanahalli Fabricators, Metal, Engg. Goods Medium-Sized industries Veerasandara Hardware, Metal, Electrical VMX Connectors Bommassandra Polymers, Machinery, Engg. Goods,
Induction coils etc. Medium Sized industries
Attibele Fertiliser, Auto components, Machinery, Plastic
Harohalli Granite, Tyre Medium and Small sized industries
Source: Feedback Research
Prefeasibility Report on Development of Logistics Park in Karnataka
15
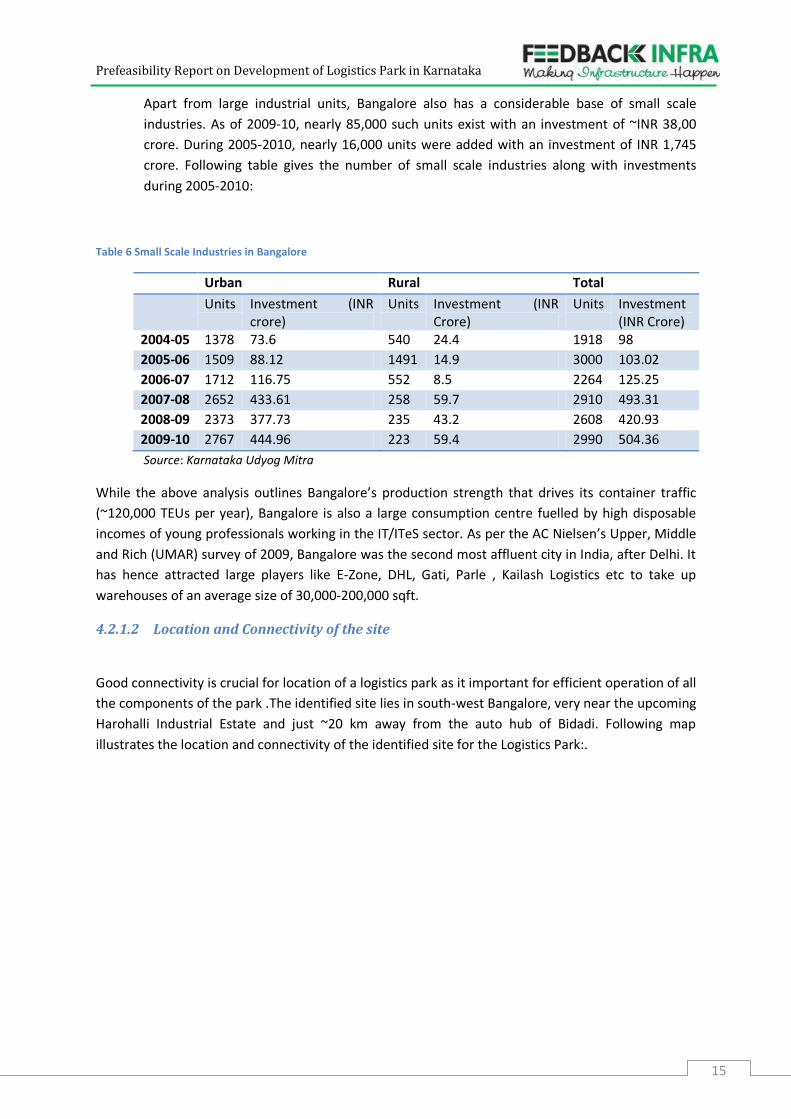
Apart from large industrial units, Bangalore also has a considerable base of small scale
industries. As of 2009-10, nearly 85,000 such units exist with an investment of ~INR 38,00
crore. During 2005-2010, nearly 16,000 units were added with an investment of INR 1,745
crore. Following table gives the number of small scale industries along with investments
during 2005-2010:
Table 6 Small Scale Industries in Bangalore
Urban Rural Total
Units Investment (INR crore)
Units Investment (INR Crore)
Units Investment (INR Crore)
2004-05 1378 73.6 540 24.4 1918 98
2005-06 1509 88.12 1491 14.9 3000 103.02
2006-07 1712 116.75 552 8.5 2264 125.25
2007-08 2652 433.61 258 59.7 2910 493.31
2008-09 2373 377.73 235 43.2 2608 420.93
2009-10 2767 444.96 223 59.4 2990 504.36
Source: Karnataka Udyog Mitra
While the above analysis outlines Bangalore’s production strength that drives its container traffic
(~120,000 TEUs per year), Bangalore is also a large consumption centre fuelled by high disposable
incomes of young professionals working in the IT/ITeS sector. As per the AC Nielsen’s Upper, Middle
and Rich (UMAR) survey of 2009, Bangalore was the second most affluent city in India, after Delhi. It
has hence attracted large players like E-Zone, DHL, Gati, Parle , Kailash Logistics etc to take up
warehouses of an average size of 30,000-200,000 sqft.
4.2.1.2 Location and Connectivity of the site
Good connectivity is crucial for location of a logistics park as it important for efficient operation of all
the components of the park .The identified site lies in south-west Bangalore, very near the upcoming
Harohalli Industrial Estate and just ~20 km away from the auto hub of Bidadi. Following map
illustrates the location and connectivity of the identified site for the Logistics Park:.
Prefeasibility Report on Development of Logistics Park in Karnataka
16
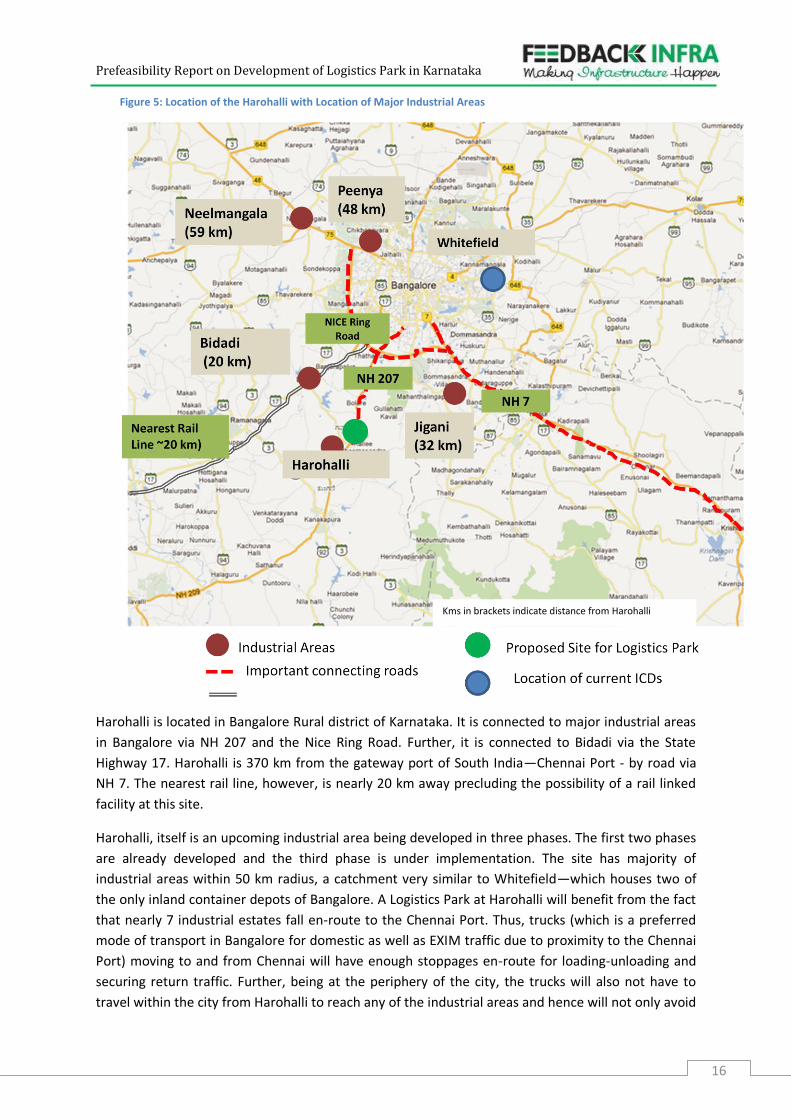
Figure 5: Location of the Harohalli with Location of Major Industrial Areas
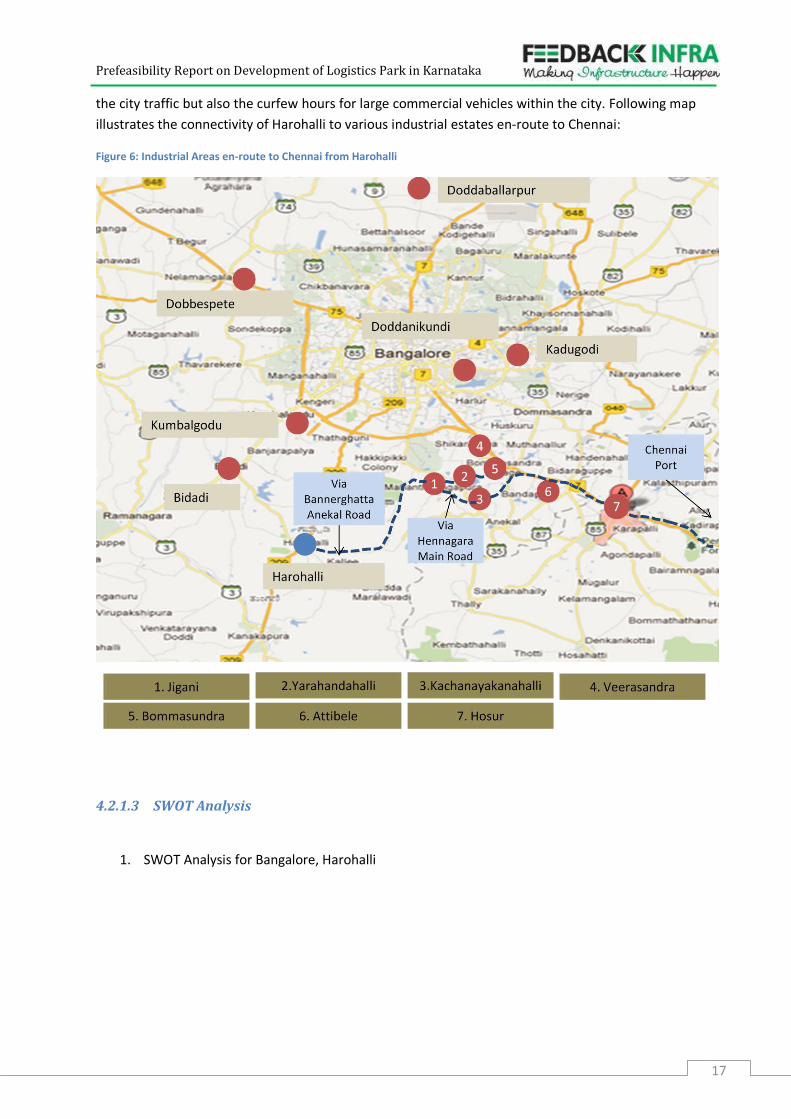
Harohalli is located in Bangalore Rural district of Karnataka. It is connected to major industrial areas
in Bangalore via NH 207 and the Nice Ring Road. Further, it is connected to Bidadi via the State
Highway 17. Harohalli is 370 km from the gateway port of South India—Chennai Port - by road via
NH 7. The nearest rail line, however, is nearly 20 km away precluding the possibility of a rail linked
facility at this site.
Harohalli, itself is an upcoming industrial area being developed in three phases. The first two phases
are already developed and the third phase is under implementation. The site has majority of
industrial areas within 50 km radius, a catchment very similar to Whitefield—which houses two of
the only inland container depots of Bangalore. A Logistics Park at Harohalli will benefit from the fact
that nearly 7 industrial estates fall en-route to the Chennai Port. Thus, trucks (which is a preferred
mode of transport in Bangalore for domestic as well as EXIM traffic due to proximity to the Chennai
Port) moving to and from Chennai will have enough stoppages en-route for loading-unloading and
securing return traffic. Further, being at the periphery of the city, the trucks will also not have to
travel within the city from Harohalli to reach any of the industrial areas and hence will not only avoid
Kms in brackets indicate distance from Harohalli
Prefeasibility Report on Development of Logistics Park in Karnataka
17
the city traffic but also the curfew hours for large commercial vehicles within the city. Following map
illustrates the connectivity of Harohalli to various industrial estates en-route to Chennai:
Figure 6: Industrial Areas en-route to Chennai from Harohalli
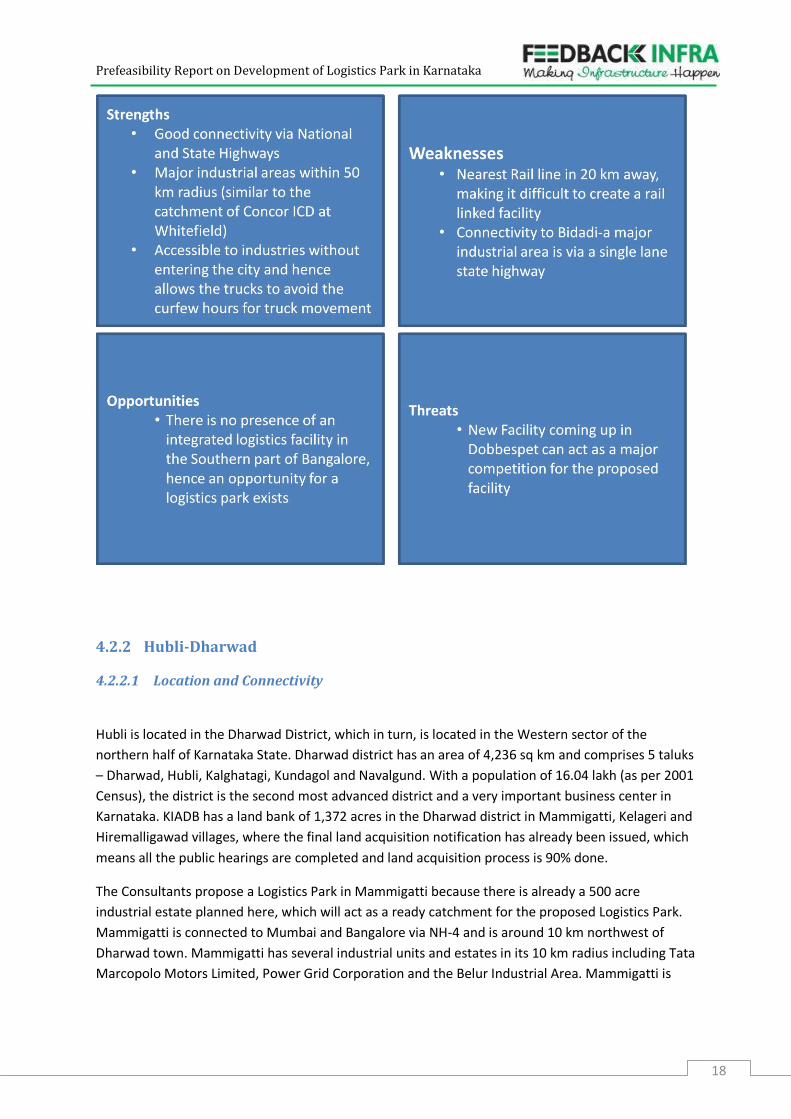
4.2.1.3 SWOT Analysis
1. SWOT Analysis for Bangalore, Harohalli
Prefeasibility Report on Development of Logistics Park in Karnataka
18
4.2.2 Hubli-Dharwad
4.2.2.1 Location and Connectivity
Hubli is located in the Dharwad District, which in turn, is located in the Western sector of the
northern half of Karnataka State. Dharwad district has an area of 4,236 sq km and comprises 5 taluks
– Dharwad, Hubli, Kalghatagi, Kundagol and Navalgund. With a population of 16.04 lakh (as per 2001
Census), the district is the second most advanced district and a very important business center in
Karnataka. KIADB has a land bank of 1,372 acres in the Dharwad district in Mammigatti, Kelageri and
Hiremalligawad villages, where the final land acquisition notification has already been issued, which
means all the public hearings are completed and land acquisition process is 90% done.
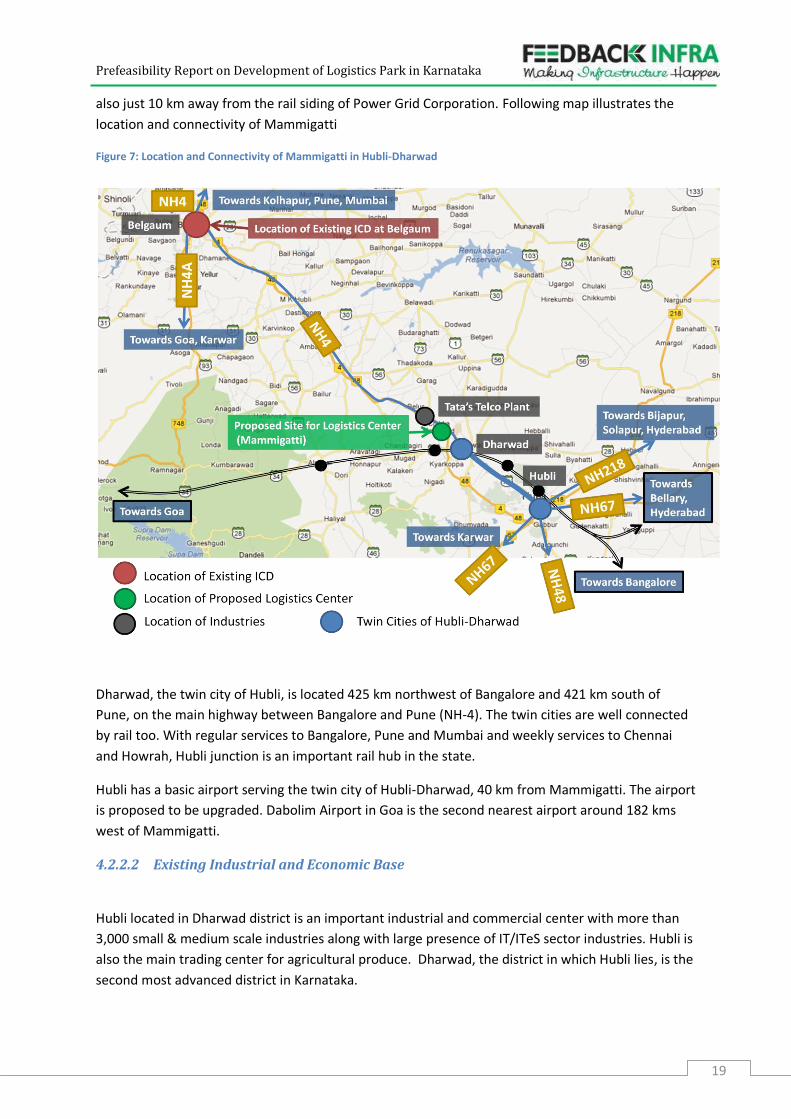
The Consultants propose a Logistics Park in Mammigatti because there is already a 500 acre
industrial estate planned here, which will act as a ready catchment for the proposed Logistics Park.
Mammigatti is connected to Mumbai and Bangalore via NH-4 and is around 10 km northwest of
Dharwad town. Mammigatti has several industrial units and estates in its 10 km radius including Tata
Marcopolo Motors Limited, Power Grid Corporation and the Belur Industrial Area. Mammigatti is
Prefeasibility Report on Development of Logistics Park in Karnataka
19
also just 10 km away from the rail siding of Power Grid Corporation. Following map illustrates the
location and connectivity of Mammigatti
Figure 7: Location and Connectivity of Mammigatti in Hubli-Dharwad
Dharwad, the twin city of Hubli, is located 425 km northwest of Bangalore and 421 km south of
Pune, on the main highway between Bangalore and Pune (NH-4). The twin cities are well connected
by rail too. With regular services to Bangalore, Pune and Mumbai and weekly services to Chennai
and Howrah, Hubli junction is an important rail hub in the state.
Hubli has a basic airport serving the twin city of Hubli-Dharwad, 40 km from Mammigatti. The airport
is proposed to be upgraded. Dabolim Airport in Goa is the second nearest airport around 182 kms
west of Mammigatti.
4.2.2.2 Existing Industrial and Economic Base
Hubli located in Dharwad district is an important industrial and commercial center with more than
3,000 small & medium scale industries along with large presence of IT/ITeS sector industries. Hubli is
also the main trading center for agricultural produce. Dharwad, the district in which Hubli lies, is the
second most advanced district in Karnataka.
Prefeasibility Report on Development of Logistics Park in Karnataka
20
Farmers from all over the state sell their produce here. Primarily, the industries in the region are
producing engineering items, industrial valves, electrical goods and agricultural implements,
machine tools, electrical products, steel furniture, food products, cotton, etc.
Hubli-Dharwad has six industrial estates with two in each town:
Hubli – Gokul, Tharihala, Sattur Industrial Estates
Dharwad – Belur, Raiapur, Lakkammanahalli Industrial Estates
Dharwad is a major consumption centre too, with per capita income of ~ INR 60,000 (2009-10) which
is nearly twice the state average. Its growth as a major consumption centre can be understood from
the fact that the major carmakers - Maruti Suzuki, Tata Motors, Mahindra & Mahindra, Fiat, Honda,
Hyundai, Chevrolet, Skoda and Volkswagen- and retail players have opened their showrooms here.
Further, with the establishment of IT park in Hubli, there is also a presence of young professionals
with appreciable disposable incomes to drive the growth of retail sector. Hubli IT park, established in
2002 and housing software giants like TCS, Tata Teleservices, IIIT, SPTI was one of the earliest IT
parks set up outside Bangalore and has acted as a precursor for strong capital investments in the
region.
Retail giants like Big Bazaar, Aditya Birla Retail and Reliance retail have a presence here. The retail
sector in Hubli-Dharwad, as per Karnataka Chambers of Commerce and Industry generates revenue
of nearly INR 100 crore everyday.
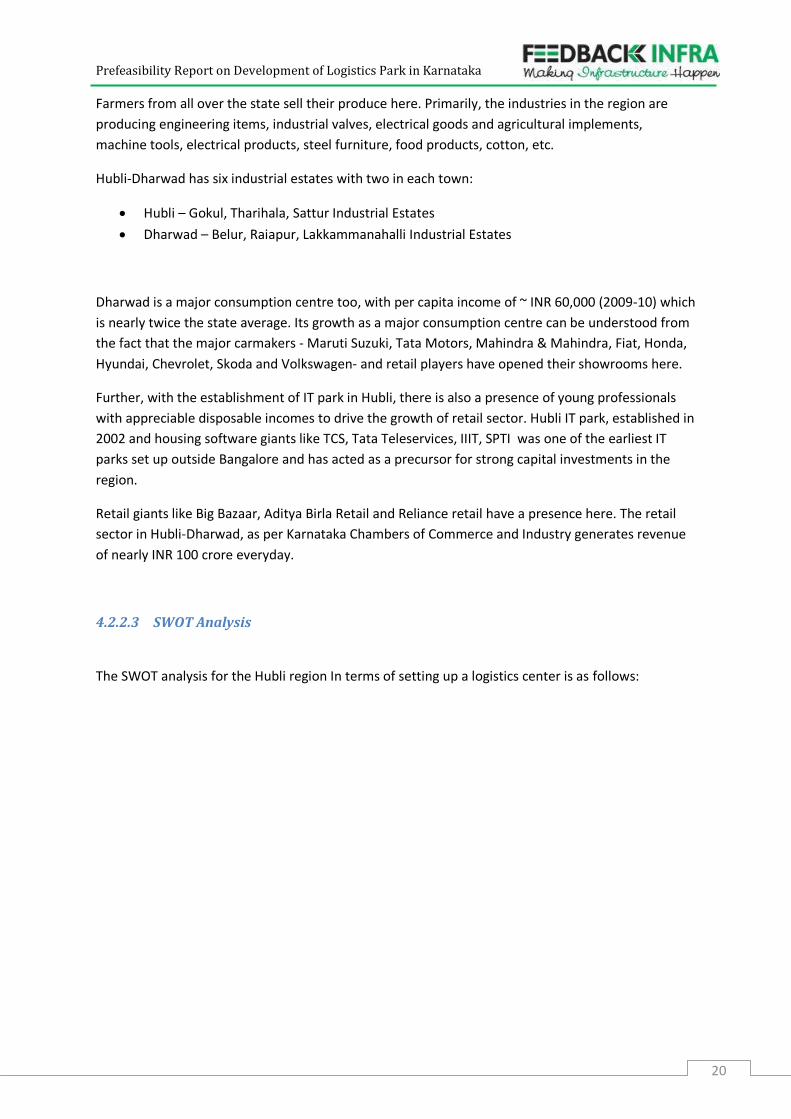
4.2.2.3 SWOT Analysis
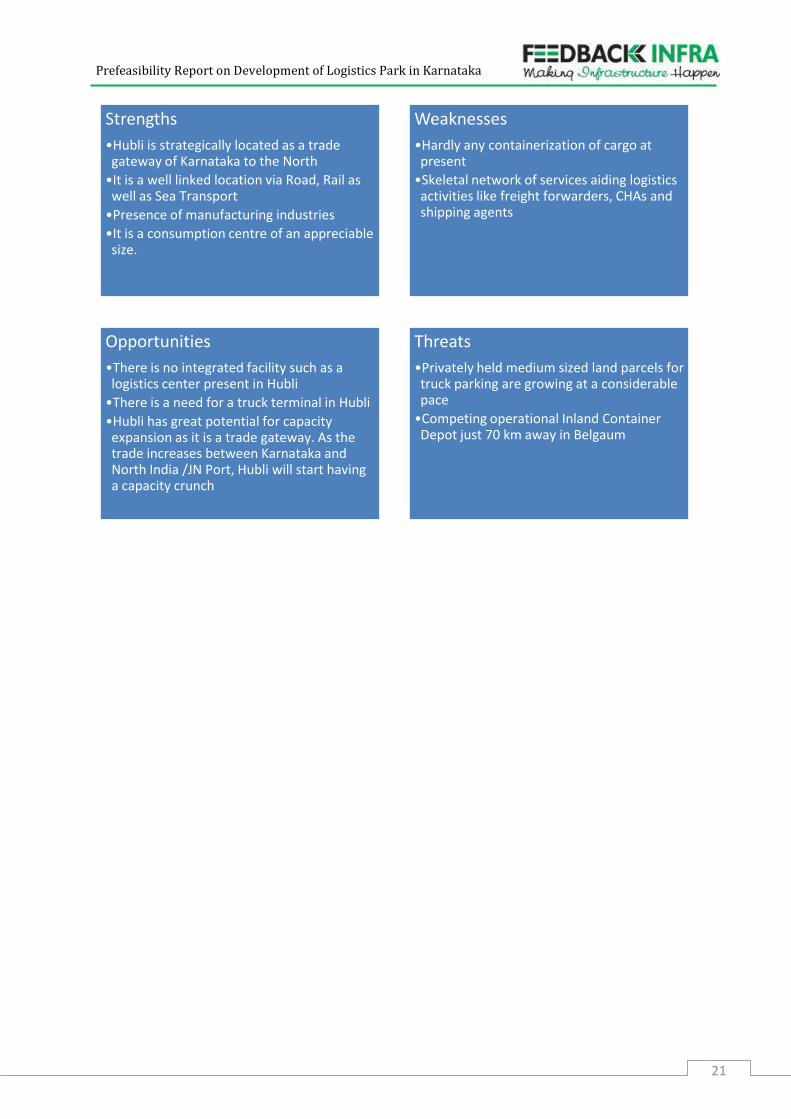
The SWOT analysis for the Hubli region In terms of setting up a logistics center is as follows:
Prefeasibility Report on Development of Logistics Park in Karnataka
21
Strengths
•Hubli is strategically located as a trade gateway of Karnataka to the North
•It is a well linked location via Road, Rail as well as Sea Transport
•Presence of manufacturing industries
•It is a consumption centre of an appreciable size.
Weaknesses
•Hardly any containerization of cargo at present
•Skeletal network of services aiding logistics activities like freight forwarders, CHAs and shipping agents
Opportunities
•There is no integrated facility such as a logistics center present in Hubli
•There is a need for a truck terminal in Hubli
•Hubli has great potential for capacity expansion as it is a trade gateway. As the trade increases between Karnataka and North India /JN Port, Hubli will start having a capacity crunch
Threats
•Privately held medium sized land parcels for truck parking are growing at a considerable pace
•Competing operational Inland Container Depot just 70 km away in Belgaum
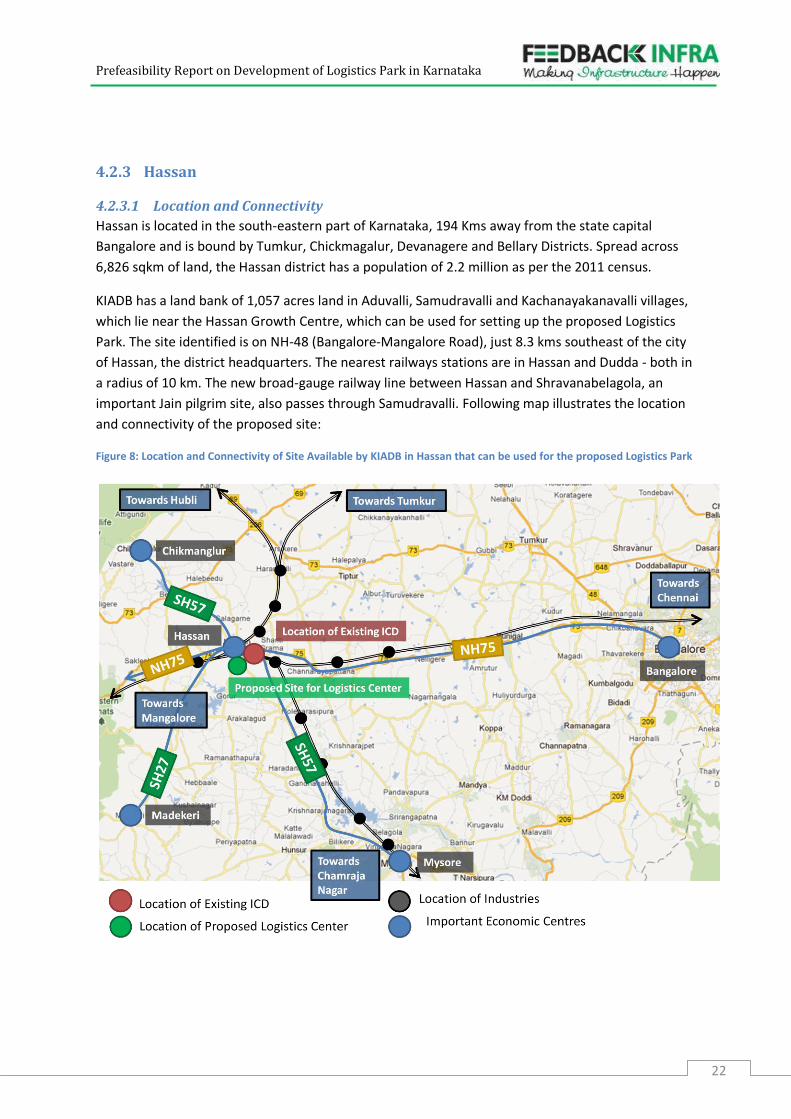
Prefeasibility Report on Development of Logistics Park in Karnataka
22
4.2.3 Hassan
4.2.3.1 Location and Connectivity
Hassan is located in the south-eastern part of Karnataka, 194 Kms away from the state capital
Bangalore and is bound by Tumkur, Chickmagalur, Devanagere and Bellary Districts. Spread across
6,826 sqkm of land, the Hassan district has a population of 2.2 million as per the 2011 census.
KIADB has a land bank of 1,057 acres land in Aduvalli, Samudravalli and Kachanayakanavalli villages,
which lie near the Hassan Growth Centre, which can be used for setting up the proposed Logistics
Park. The site identified is on NH-48 (Bangalore-Mangalore Road), just 8.3 kms southeast of the city
of Hassan, the district headquarters. The nearest railways stations are in Hassan and Dudda - both in
a radius of 10 km. The new broad-gauge railway line between Hassan and Shravanabelagola, an
important Jain pilgrim site, also passes through Samudravalli. Following map illustrates the location
and connectivity of the proposed site:
Figure 8: Location and Connectivity of Site Available by KIADB in Hassan that can be used for the proposed Logistics Park
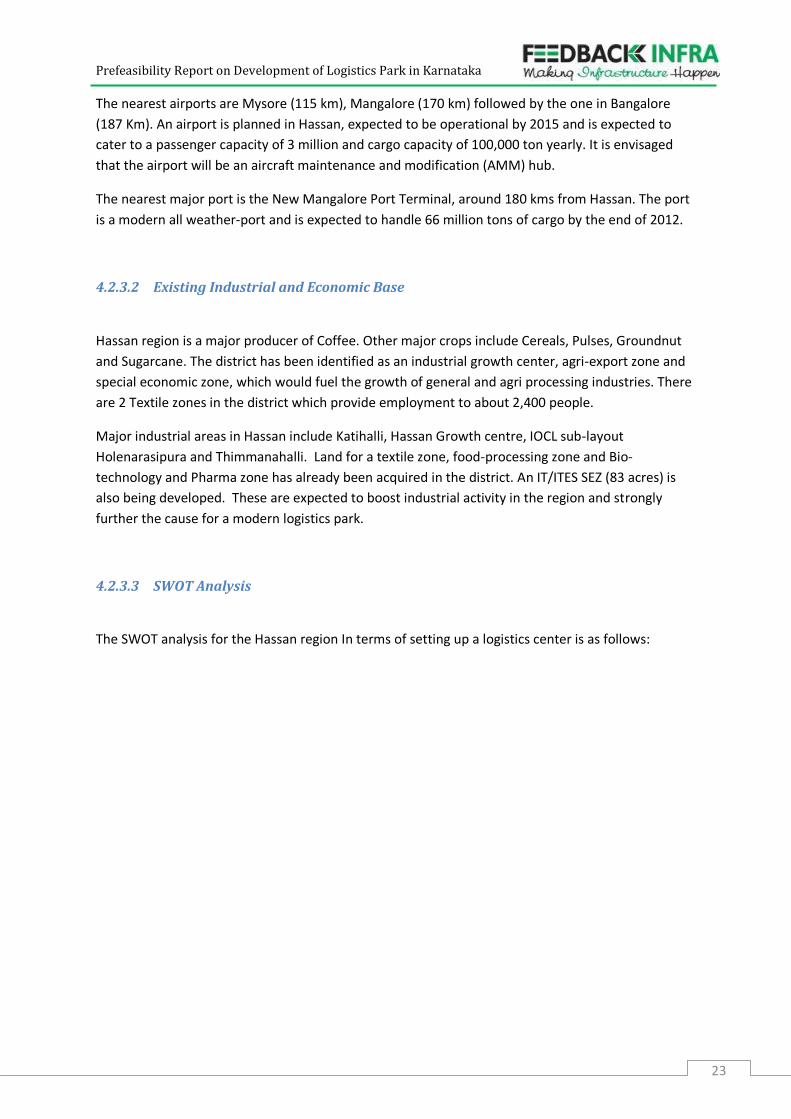
Prefeasibility Report on Development of Logistics Park in Karnataka
23
The nearest airports are Mysore (115 km), Mangalore (170 km) followed by the one in Bangalore
(187 Km). An airport is planned in Hassan, expected to be operational by 2015 and is expected to
cater to a passenger capacity of 3 million and cargo capacity of 100,000 ton yearly. It is envisaged
that the airport will be an aircraft maintenance and modification (AMM) hub.
The nearest major port is the New Mangalore Port Terminal, around 180 kms from Hassan. The port
is a modern all weather-port and is expected to handle 66 million tons of cargo by the end of 2012.
4.2.3.2 Existing Industrial and Economic Base
Hassan region is a major producer of Coffee. Other major crops include Cereals, Pulses, Groundnut
and Sugarcane. The district has been identified as an industrial growth center, agri-export zone and
special economic zone, which would fuel the growth of general and agri processing industries. There
are 2 Textile zones in the district which provide employment to about 2,400 people.
Major industrial areas in Hassan include Katihalli, Hassan Growth centre, IOCL sub-layout
Holenarasipura and Thimmanahalli. Land for a textile zone, food-processing zone and Bio-
technology and Pharma zone has already been acquired in the district. An IT/ITES SEZ (83 acres) is
also being developed. These are expected to boost industrial activity in the region and strongly
further the cause for a modern logistics park.
4.2.3.3 SWOT Analysis
The SWOT analysis for the Hassan region In terms of setting up a logistics center is as follows:
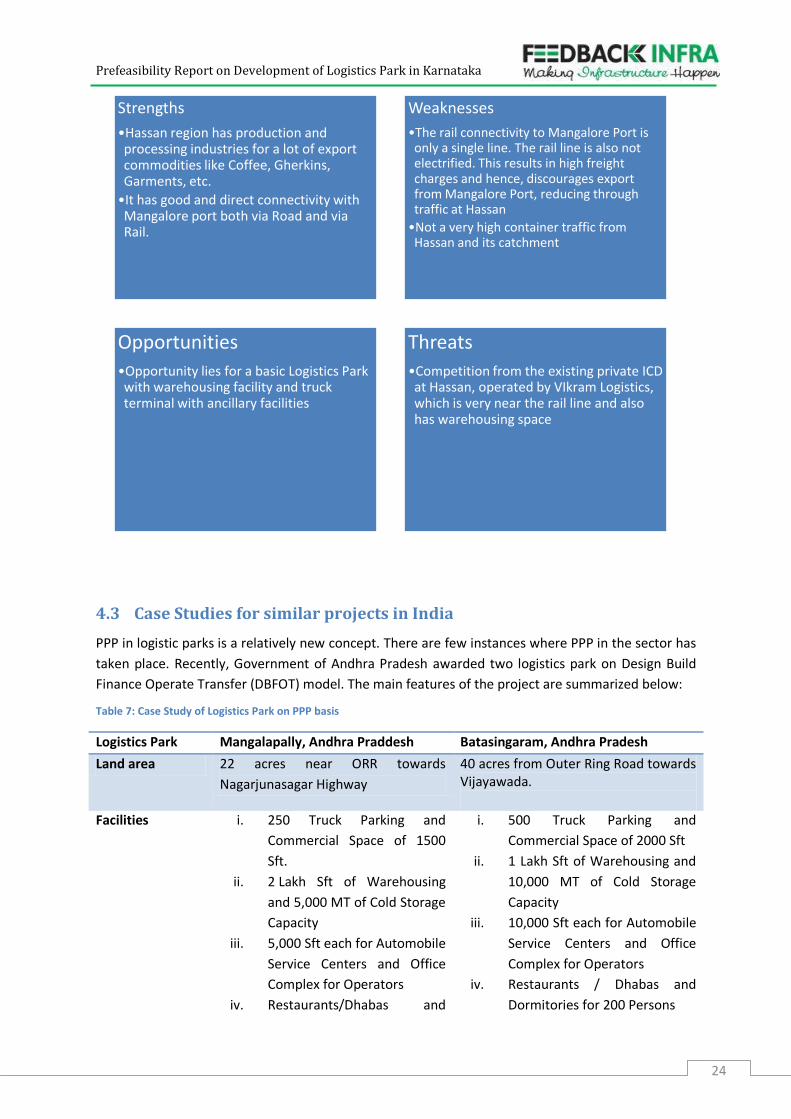
Prefeasibility Report on Development of Logistics Park in Karnataka
24
4.3 Case Studies for similar projects in India
PPP in logistic parks is a relatively new concept. There are few instances where PPP in the sector has
taken place. Recently, Government of Andhra Pradesh awarded two logistics park on Design Build
Finance Operate Transfer (DBFOT) model. The main features of the project are summarized below:
Table 7: Case Study of Logistics Park on PPP basis
Logistics Park Mangalapally, Andhra Praddesh Batasingaram, Andhra Pradesh
Land area 22 acres near ORR towards
Nagarjunasagar Highway
40 acres from Outer Ring Road towards Vijayawada.
Facilities i. 250 Truck Parking and
Commercial Space of 1500
Sft.
ii. 2 Lakh Sft of Warehousing
and 5,000 MT of Cold Storage
Capacity
iii. 5,000 Sft each for Automobile
Service Centers and Office
Complex for Operators
iv. Restaurants/Dhabas and
i. 500 Truck Parking and
Commercial Space of 2000 Sft
ii. 1 Lakh Sft of Warehousing and
10,000 MT of Cold Storage
Capacity
iii. 10,000 Sft each for Automobile
Service Centers and Office
Complex for Operators
iv. Restaurants / Dhabas and
Dormitories for 200 Persons
Strengths
•Hassan region has production and processing industries for a lot of export commodities like Coffee, Gherkins, Garments, etc.
•It has good and direct connectivity with Mangalore port both via Road and via Rail.
Weaknesses
•The rail connectivity to Mangalore Port is only a single line. The rail line is also not electrified. This results in high freight charges and hence, discourages export from Mangalore Port, reducing through traffic at Hassan
•Not a very high container traffic from Hassan and its catchment
Opportunities
•Opportunity lies for a basic Logistics Park with warehousing facility and truck terminal with ancillary facilities
Threats
•Competition from the existing private ICD at Hassan, operated by VIkram Logistics, which is very near the rail line and also has warehousing space
Prefeasibility Report on Development of Logistics Park in Karnataka
25
Dormitories for 100 persons
v. Fuel Stations and Vehicle
testing Centre, Electronic
Weigh Bridge. 1000 Sft Built
up area for Primary Health
Centre
v. Fuel Stations and Vehicle
testing Centre, Electronic
Weigh Bridge
vi. 1500 Sft Built up area for
Primary Health Centre
Project cost INR 22 Cr INR 35 Cr
Development
Model
DBFOT DBFOT
Concessionaire Ancon Design Group - KCP Projects
Ltd (JV)
Credence Logistics Limited
Concession
period
33 Years 33 Years
Annual Lease rent INR 1.5 lakh will be increased @ 5%,
p.a
INR 4.0 Lakhs with escalation of 5%
every year
Revenue share 5% annually and at least INR 15 lakh
in the first year of operation
A 5% revenue share annually and INR
35 lakh in the first year of operation
Development Fee INR 60 lakhs INR 90 Lakhs
Sublease No sublease of the land is allowed.
Developed space can be leased out
No sublease of the land is allowed.
Developed space can be leased out
The projects are currently in pre-construction phase.
As Logistics Park is a new phenomenon in India, there are limited examples of successful PPP
projects in this sector.
5 Market Assessment
This section assesses the market in terms of identifying the existing logistics facilities in the selected
cities along with ascertaining the need for additional logistics facilities. The Consultants have
conducted interviews with industries to ascertain demand for logistics facilities in these areas, and to
analyse the need for each component in the Logistics Park. The section also underlines the future
industrial development in each of the locations that are expected to drive the future demand.
For container terminal, the catchment area for container traffic generation is identified. Further, the
section also makes demand forecast, especially for the container traffic to analyse the possibility of
setting up container terminal in the area. Forecasts are done via regression analysis, wherever the
past trend is available. In case past trend is not available, the container growth is projected using the
growth rates of the major commodities transported in containers.
For warehousing, the major commodities stored in the area are identified. Further, average size of
the warehouses is ascertained along with average rentals paid in each city for storage.
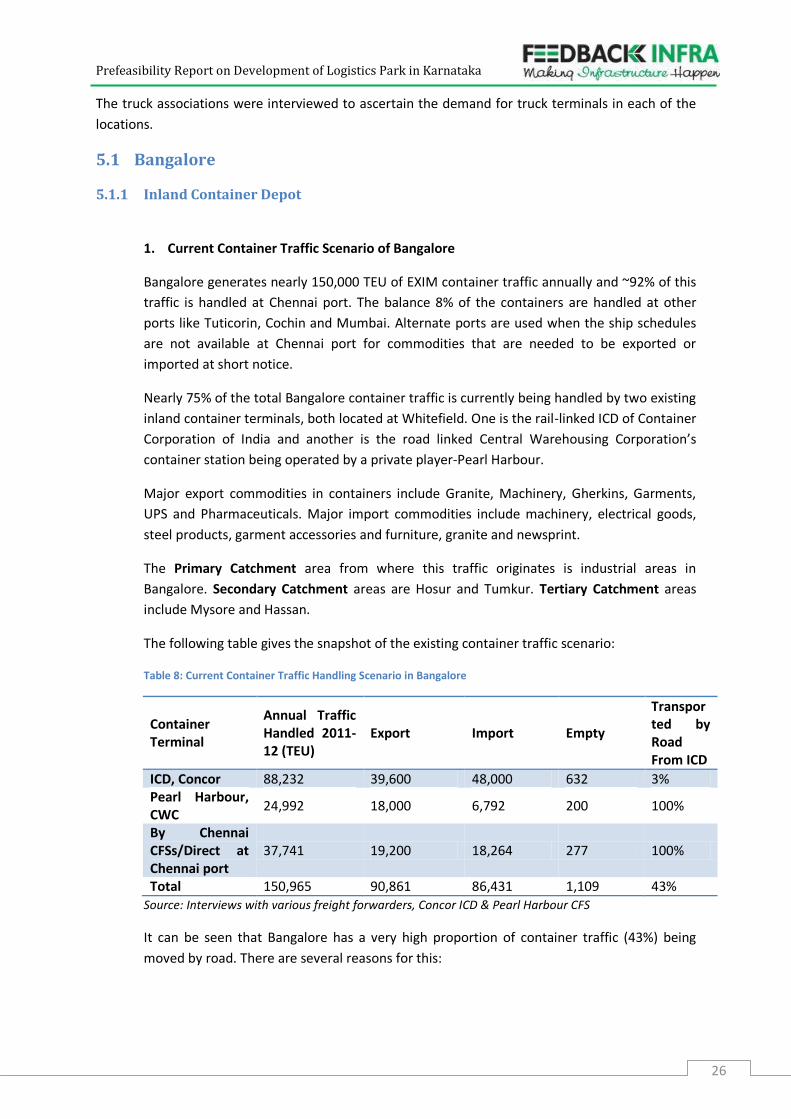
Prefeasibility Report on Development of Logistics Park in Karnataka
26
The truck associations were interviewed to ascertain the demand for truck terminals in each of the
locations.
5.1 Bangalore
5.1.1 Inland Container Depot
1. Current Container Traffic Scenario of Bangalore
Bangalore generates nearly 150,000 TEU of EXIM container traffic annually and ~92% of this
traffic is handled at Chennai port. The balance 8% of the containers are handled at other
ports like Tuticorin, Cochin and Mumbai. Alternate ports are used when the ship schedules
are not available at Chennai port for commodities that are needed to be exported or
imported at short notice.
Nearly 75% of the total Bangalore container traffic is currently being handled by two existing
inland container terminals, both located at Whitefield. One is the rail-linked ICD of Container
Corporation of India and another is the road linked Central Warehousing Corporation’s
container station being operated by a private player-Pearl Harbour.
Major export commodities in containers include Granite, Machinery, Gherkins, Garments,
UPS and Pharmaceuticals. Major import commodities include machinery, electrical goods,
steel products, garment accessories and furniture, granite and newsprint.
The Primary Catchment area from where this traffic originates is industrial areas in
Bangalore. Secondary Catchment areas are Hosur and Tumkur. Tertiary Catchment areas
include Mysore and Hassan.
The following table gives the snapshot of the existing container traffic scenario:
Table 8: Current Container Traffic Handling Scenario in Bangalore
Container Terminal
Annual Traffic Handled 2011-12 (TEU)
Export Import Empty
Transported by Road From ICD
ICD, Concor 88,232 39,600 48,000 632 3% Pearl Harbour, CWC
24,992 18,000 6,792 200 100%
By Chennai CFSs/Direct at Chennai port
37,741 19,200 18,264 277 100%
Total 150,965 90,861 86,431 1,109 43% Source: Interviews with various freight forwarders, Concor ICD & Pearl Harbour CFS
It can be seen that Bangalore has a very high proportion of container traffic (43%) being
moved by road. There are several reasons for this:
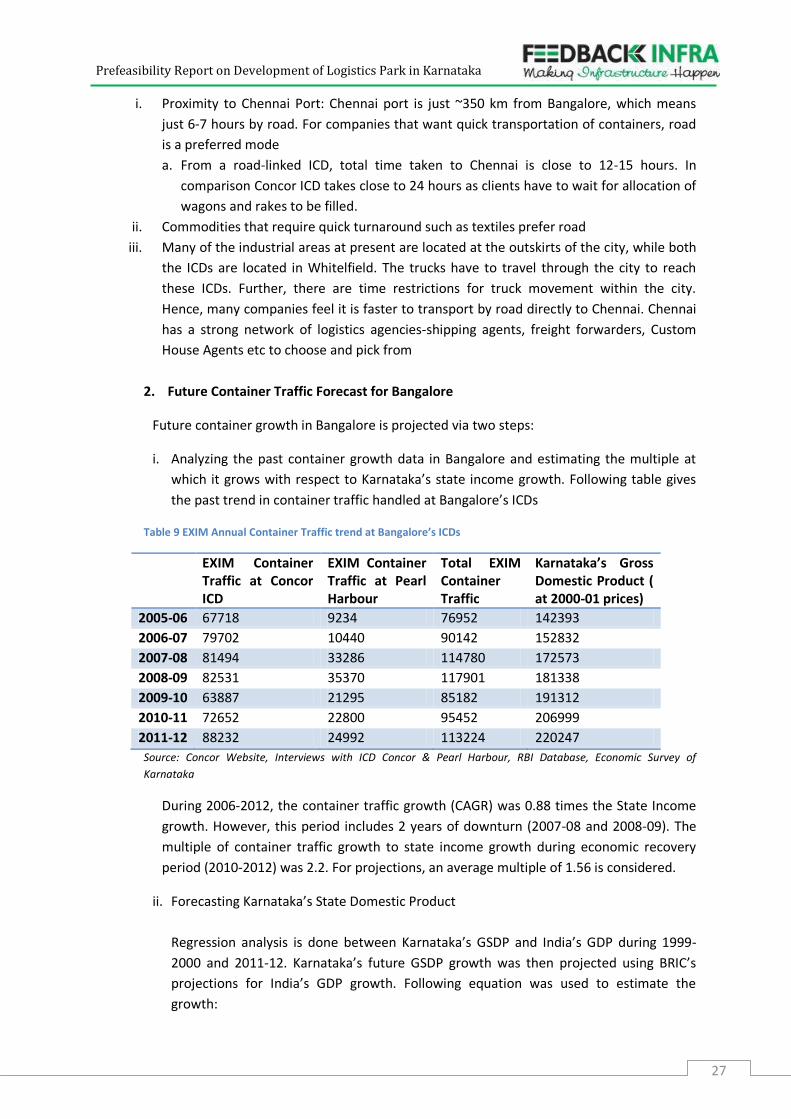
Prefeasibility Report on Development of Logistics Park in Karnataka
27
i. Proximity to Chennai Port: Chennai port is just ~350 km from Bangalore, which means
just 6-7 hours by road. For companies that want quick transportation of containers, road
is a preferred mode
a. From a road-linked ICD, total time taken to Chennai is close to 12-15 hours. In
comparison Concor ICD takes close to 24 hours as clients have to wait for allocation of
wagons and rakes to be filled.
ii. Commodities that require quick turnaround such as textiles prefer road
iii. Many of the industrial areas at present are located at the outskirts of the city, while both
the ICDs are located in Whitelfield. The trucks have to travel through the city to reach
these ICDs. Further, there are time restrictions for truck movement within the city.
Hence, many companies feel it is faster to transport by road directly to Chennai. Chennai
has a strong network of logistics agencies-shipping agents, freight forwarders, Custom
House Agents etc to choose and pick from
2. Future Container Traffic Forecast for Bangalore
Future container growth in Bangalore is projected via two steps:
i. Analyzing the past container growth data in Bangalore and estimating the multiple at
which it grows with respect to Karnataka’s state income growth. Following table gives
the past trend in container traffic handled at Bangalore’s ICDs
Table 9 EXIM Annual Container Traffic trend at Bangalore’s ICDs
EXIM Container Traffic at Concor ICD
EXIM Container Traffic at Pearl Harbour
Total EXIM Container Traffic
Karnataka’s Gross Domestic Product ( at 2000-01 prices)
2005-06 67718 9234 76952 142393
2006-07 79702 10440 90142 152832
2007-08 81494 33286 114780 172573
2008-09 82531 35370 117901 181338
2009-10 63887 21295 85182 191312
2010-11 72652 22800 95452 206999
2011-12 88232 24992 113224 220247
Source: Concor Website, Interviews with ICD Concor & Pearl Harbour, RBI Database, Economic Survey of
Karnataka
During 2006-2012, the container traffic growth (CAGR) was 0.88 times the State Income
growth. However, this period includes 2 years of downturn (2007-08 and 2008-09). The
multiple of container traffic growth to state income growth during economic recovery
period (2010-2012) was 2.2. For projections, an average multiple of 1.56 is considered.
ii. Forecasting Karnataka’s State Domestic Product
Regression analysis is done between Karnataka’s GSDP and India’s GDP during 1999-
2000 and 2011-12. Karnataka’s future GSDP growth was then projected using BRIC’s
projections for India’s GDP growth. Following equation was used to estimate the
growth:
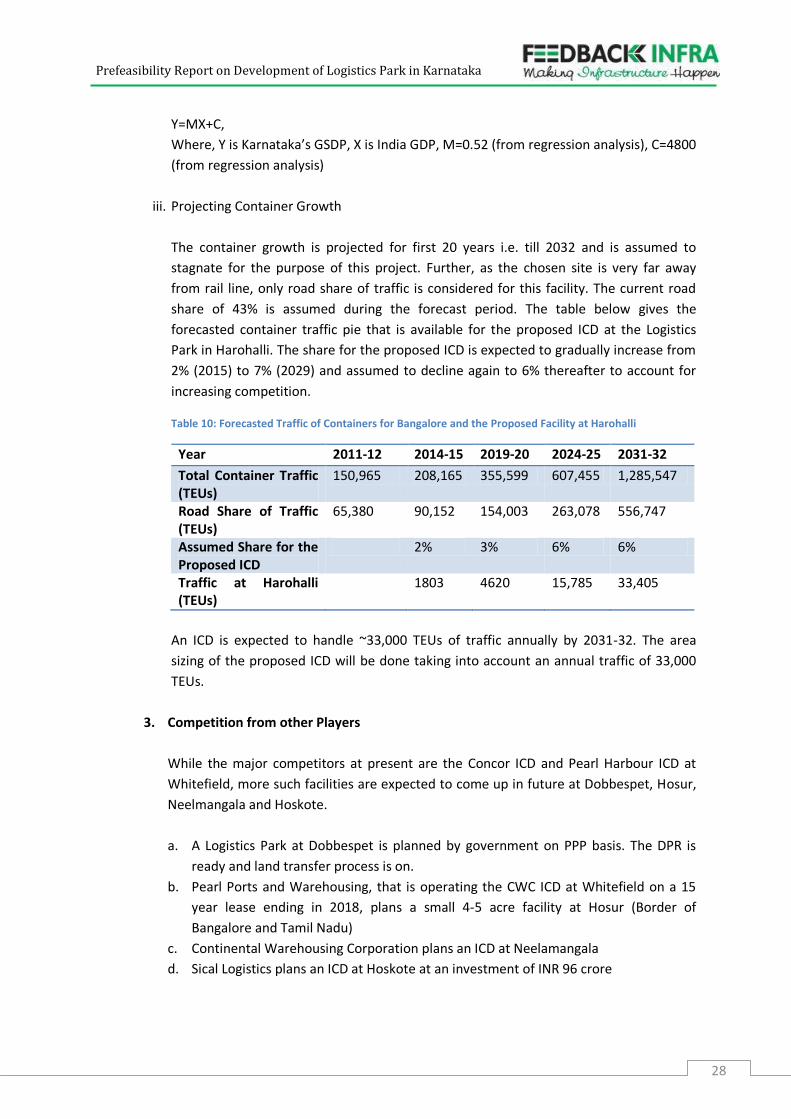
Prefeasibility Report on Development of Logistics Park in Karnataka
28
Y=MX+C,
Where, Y is Karnataka’s GSDP, X is India GDP, M=0.52 (from regression analysis), C=4800
(from regression analysis)
iii. Projecting Container Growth
The container growth is projected for first 20 years i.e. till 2032 and is assumed to
stagnate for the purpose of this project. Further, as the chosen site is very far away
from rail line, only road share of traffic is considered for this facility. The current road
share of 43% is assumed during the forecast period. The table below gives the
forecasted container traffic pie that is available for the proposed ICD at the Logistics
Park in Harohalli. The share for the proposed ICD is expected to gradually increase from
2% (2015) to 7% (2029) and assumed to decline again to 6% thereafter to account for
increasing competition.
Table 10: Forecasted Traffic of Containers for Bangalore and the Proposed Facility at Harohalli
Year 2011-12 2014-15 2019-20 2024-25 2031-32
Total Container Traffic (TEUs)
150,965 208,165 355,599 607,455 1,285,547
Road Share of Traffic (TEUs)
65,380 90,152 154,003 263,078 556,747
Assumed Share for the Proposed ICD
2% 3% 6% 6%
Traffic at Harohalli (TEUs)
1803 4620 15,785 33,405
An ICD is expected to handle ~33,000 TEUs of traffic annually by 2031-32. The area
sizing of the proposed ICD will be done taking into account an annual traffic of 33,000
TEUs.
3. Competition from other Players
While the major competitors at present are the Concor ICD and Pearl Harbour ICD at
Whitefield, more such facilities are expected to come up in future at Dobbespet, Hosur,
Neelmangala and Hoskote.
a. A Logistics Park at Dobbespet is planned by government on PPP basis. The DPR is
ready and land transfer process is on.
b. Pearl Ports and Warehousing, that is operating the CWC ICD at Whitefield on a 15
year lease ending in 2018, plans a small 4-5 acre facility at Hosur (Border of
Bangalore and Tamil Nadu)
c. Continental Warehousing Corporation plans an ICD at Neelamangala
d. Sical Logistics plans an ICD at Hoskote at an investment of INR 96 crore
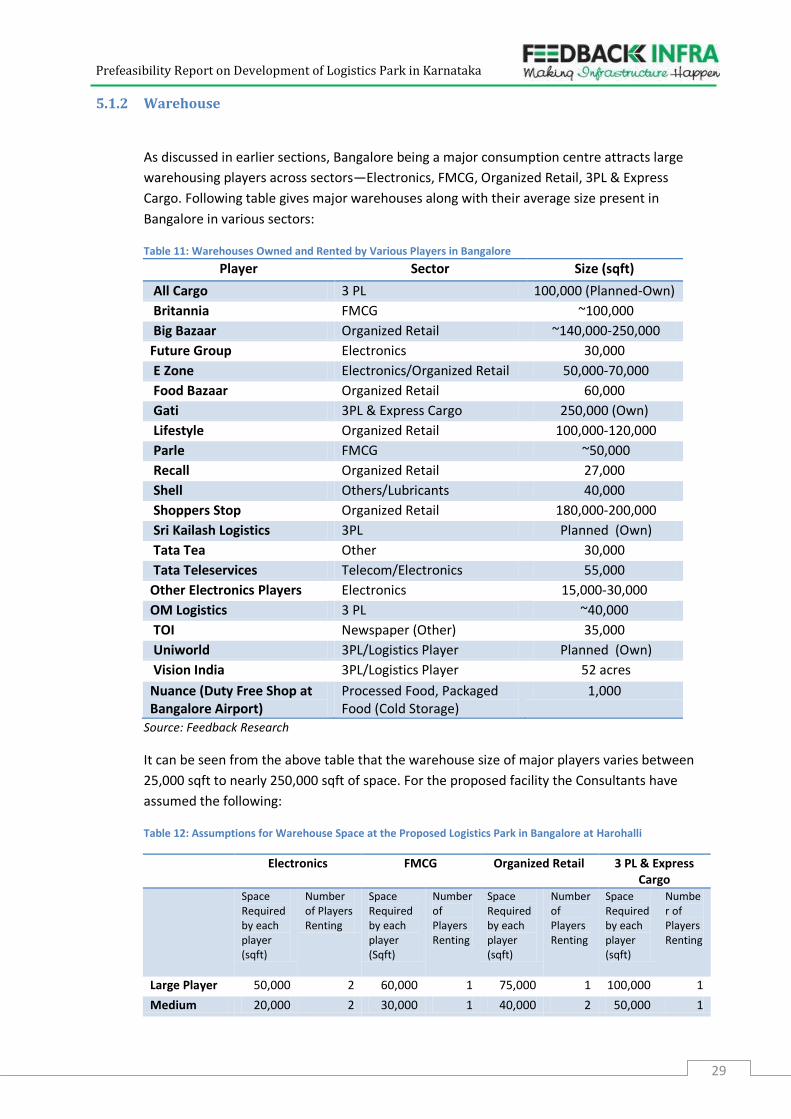
Prefeasibility Report on Development of Logistics Park in Karnataka
29
5.1.2 Warehouse
As discussed in earlier sections, Bangalore being a major consumption centre attracts large
warehousing players across sectors—Electronics, FMCG, Organized Retail, 3PL & Express
Cargo. Following table gives major warehouses along with their average size present in
Bangalore in various sectors:
Table 11: Warehouses Owned and Rented by Various Players in Bangalore
Player Sector Size (sqft)
All Cargo 3 PL 100,000 (Planned-Own)
Britannia FMCG ~100,000
Big Bazaar Organized Retail ~140,000-250,000
Future Group Electronics 30,000
E Zone Electronics/Organized Retail 50,000-70,000
Food Bazaar Organized Retail 60,000
Gati 3PL & Express Cargo 250,000 (Own)
Lifestyle Organized Retail 100,000-120,000
Parle FMCG ~50,000
Recall Organized Retail 27,000
Shell Others/Lubricants 40,000
Shoppers Stop Organized Retail 180,000-200,000
Sri Kailash Logistics 3PL Planned (Own)
Tata Tea Other 30,000
Tata Teleservices Telecom/Electronics 55,000
Other Electronics Players Electronics 15,000-30,000
OM Logistics 3 PL ~40,000
TOI Newspaper (Other) 35,000
Uniworld 3PL/Logistics Player Planned (Own)
Vision India 3PL/Logistics Player 52 acres
Nuance (Duty Free Shop at Bangalore Airport)
Processed Food, Packaged Food (Cold Storage)
1,000
Source: Feedback Research
It can be seen from the above table that the warehouse size of major players varies between
25,000 sqft to nearly 250,000 sqft of space. For the proposed facility the Consultants have
assumed the following:
Table 12: Assumptions for Warehouse Space at the Proposed Logistics Park in Bangalore at Harohalli
Electronics FMCG Organized Retail 3 PL & Express Cargo
Space Required by each player (sqft)
Number of Players Renting
Space Required by each player (Sqft)
Number of Players Renting
Space Required by each player (sqft)
Number of Players Renting
Space Required by each player (sqft)
Number of Players Renting
Large Player 50,000 2 60,000 1 75,000 1 100,000 1
Medium 20,000 2 30,000 1 40,000 2 50,000 1
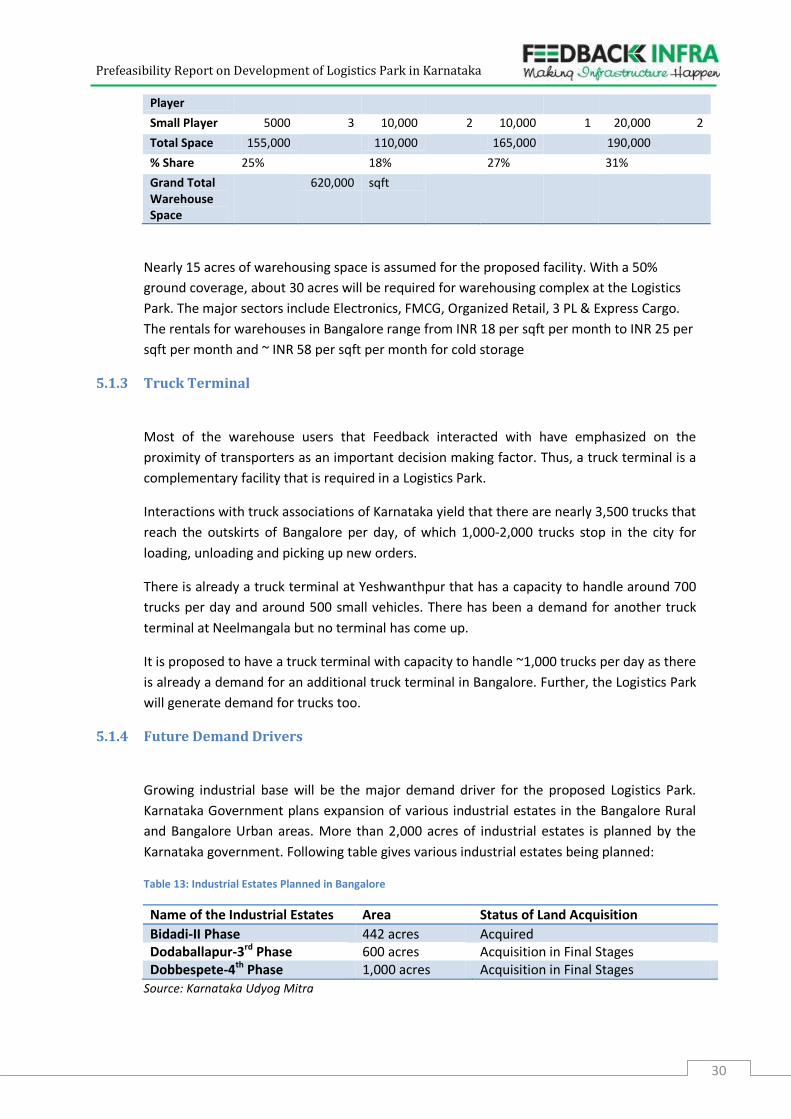
Prefeasibility Report on Development of Logistics Park in Karnataka
30
Player
Small Player 5000 3 10,000 2 10,000 1 20,000 2
Total Space 155,000 110,000 165,000 190,000
% Share 25% 18% 27% 31%
Grand Total Warehouse Space
620,000 sqft
Nearly 15 acres of warehousing space is assumed for the proposed facility. With a 50%
ground coverage, about 30 acres will be required for warehousing complex at the Logistics
Park. The major sectors include Electronics, FMCG, Organized Retail, 3 PL & Express Cargo.
The rentals for warehouses in Bangalore range from INR 18 per sqft per month to INR 25 per
sqft per month and ~ INR 58 per sqft per month for cold storage
5.1.3 Truck Terminal
Most of the warehouse users that Feedback interacted with have emphasized on the
proximity of transporters as an important decision making factor. Thus, a truck terminal is a
complementary facility that is required in a Logistics Park.
Interactions with truck associations of Karnataka yield that there are nearly 3,500 trucks that
reach the outskirts of Bangalore per day, of which 1,000-2,000 trucks stop in the city for
loading, unloading and picking up new orders.
There is already a truck terminal at Yeshwanthpur that has a capacity to handle around 700
trucks per day and around 500 small vehicles. There has been a demand for another truck
terminal at Neelmangala but no terminal has come up.
It is proposed to have a truck terminal with capacity to handle ~1,000 trucks per day as there
is already a demand for an additional truck terminal in Bangalore. Further, the Logistics Park
will generate demand for trucks too.
5.1.4 Future Demand Drivers
Growing industrial base will be the major demand driver for the proposed Logistics Park.
Karnataka Government plans expansion of various industrial estates in the Bangalore Rural
and Bangalore Urban areas. More than 2,000 acres of industrial estates is planned by the
Karnataka government. Following table gives various industrial estates being planned:
Table 13: Industrial Estates Planned in Bangalore
Name of the Industrial Estates Area Status of Land Acquisition
Bidadi-II Phase 442 acres Acquired Dodaballapur-3rd Phase 600 acres Acquisition in Final Stages Dobbespete-4th Phase 1,000 acres Acquisition in Final Stages
Source: Karnataka Udyog Mitra
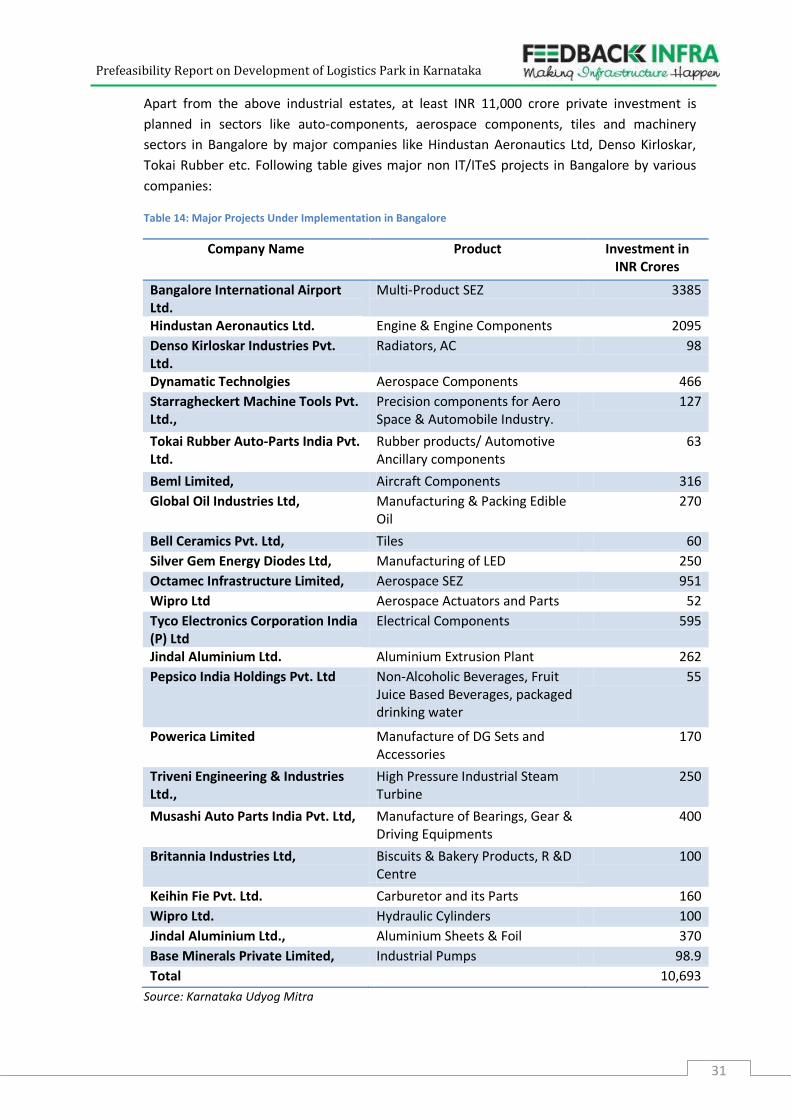
Prefeasibility Report on Development of Logistics Park in Karnataka
31
Apart from the above industrial estates, at least INR 11,000 crore private investment is
planned in sectors like auto-components, aerospace components, tiles and machinery
sectors in Bangalore by major companies like Hindustan Aeronautics Ltd, Denso Kirloskar,
Tokai Rubber etc. Following table gives major non IT/ITeS projects in Bangalore by various
companies:
Table 14: Major Projects Under Implementation in Bangalore
Company Name Product Investment in INR Crores
Bangalore International Airport Ltd.
Multi-Product SEZ 3385
Hindustan Aeronautics Ltd. Engine & Engine Components 2095
Denso Kirloskar Industries Pvt. Ltd.
Radiators, AC 98
Dynamatic Technolgies Aerospace Components 466
Starragheckert Machine Tools Pvt. Ltd.,
Precision components for Aero Space & Automobile Industry.
127
Tokai Rubber Auto-Parts India Pvt. Ltd.
Rubber products/ Automotive Ancillary components
63
Beml Limited, Aircraft Components 316
Global Oil Industries Ltd, Manufacturing & Packing Edible Oil
270
Bell Ceramics Pvt. Ltd, Tiles 60
Silver Gem Energy Diodes Ltd, Manufacturing of LED 250
Octamec Infrastructure Limited, Aerospace SEZ 951
Wipro Ltd Aerospace Actuators and Parts 52
Tyco Electronics Corporation India (P) Ltd
Electrical Components 595
Jindal Aluminium Ltd. Aluminium Extrusion Plant 262
Pepsico India Holdings Pvt. Ltd Non-Alcoholic Beverages, Fruit Juice Based Beverages, packaged drinking water
55
Powerica Limited Manufacture of DG Sets and Accessories
170
Triveni Engineering & Industries Ltd.,
High Pressure Industrial Steam Turbine
250
Musashi Auto Parts India Pvt. Ltd, Manufacture of Bearings, Gear & Driving Equipments
400
Britannia Industries Ltd, Biscuits & Bakery Products, R &D Centre
100
Keihin Fie Pvt. Ltd. Carburetor and its Parts 160
Wipro Ltd. Hydraulic Cylinders 100
Jindal Aluminium Ltd., Aluminium Sheets & Foil 370
Base Minerals Private Limited, Industrial Pumps 98.9
Total 10,693
Source: Karnataka Udyog Mitra
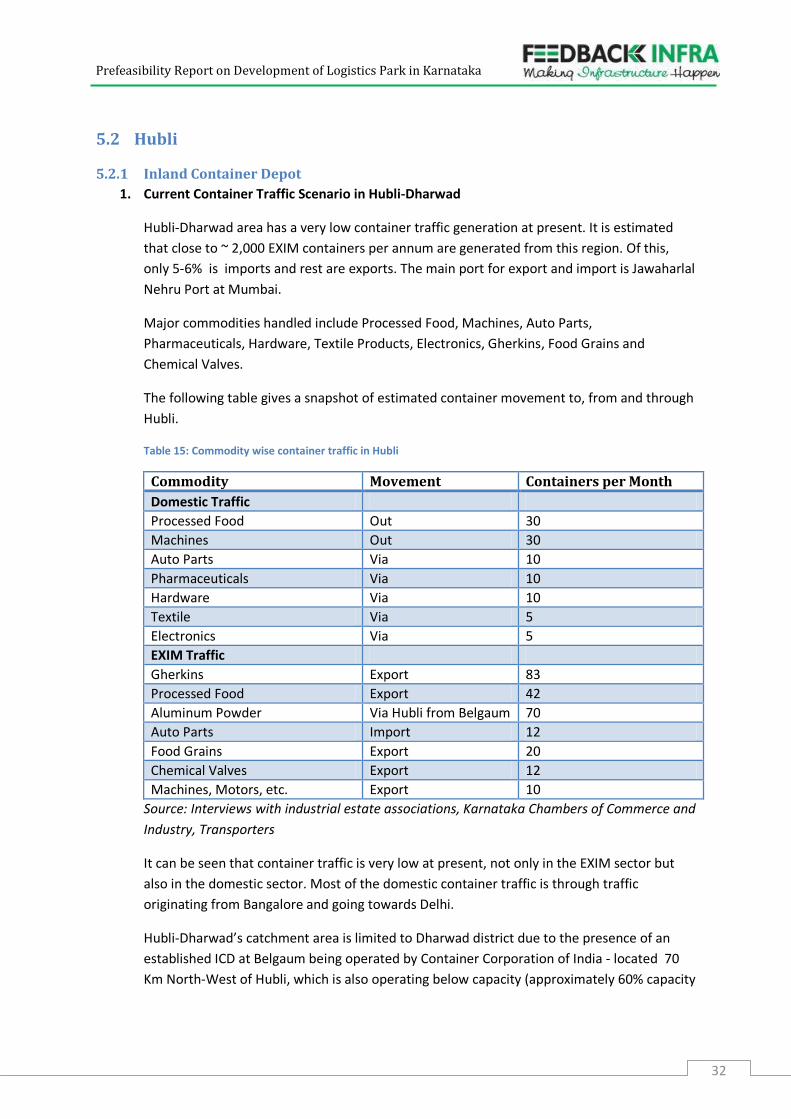
Prefeasibility Report on Development of Logistics Park in Karnataka
32
5.2 Hubli
5.2.1 Inland Container Depot
1. Current Container Traffic Scenario in Hubli-Dharwad
Hubli-Dharwad area has a very low container traffic generation at present. It is estimated
that close to ~ 2,000 EXIM containers per annum are generated from this region. Of this,
only 5-6% is imports and rest are exports. The main port for export and import is Jawaharlal
Nehru Port at Mumbai.
Major commodities handled include Processed Food, Machines, Auto Parts,
Pharmaceuticals, Hardware, Textile Products, Electronics, Gherkins, Food Grains and
Chemical Valves.
The following table gives a snapshot of estimated container movement to, from and through
Hubli.
Table 15: Commodity wise container traffic in Hubli
Commodity Movement Containers per Month
Domestic Traffic
Processed Food Out 30
Machines Out 30
Auto Parts Via 10
Pharmaceuticals Via 10
Hardware Via 10
Textile Via 5
Electronics Via 5
EXIM Traffic
Gherkins Export 83
Processed Food Export 42
Aluminum Powder Via Hubli from Belgaum 70
Auto Parts Import 12
Food Grains Export 20
Chemical Valves Export 12
Machines, Motors, etc. Export 10
Source: Interviews with industrial estate associations, Karnataka Chambers of Commerce and
Industry, Transporters
It can be seen that container traffic is very low at present, not only in the EXIM sector but
also in the domestic sector. Most of the domestic container traffic is through traffic
originating from Bangalore and going towards Delhi.
Hubli-Dharwad’s catchment area is limited to Dharwad district due to the presence of an
established ICD at Belgaum being operated by Container Corporation of India - located 70
Km North-West of Hubli, which is also operating below capacity (approximately 60% capacity
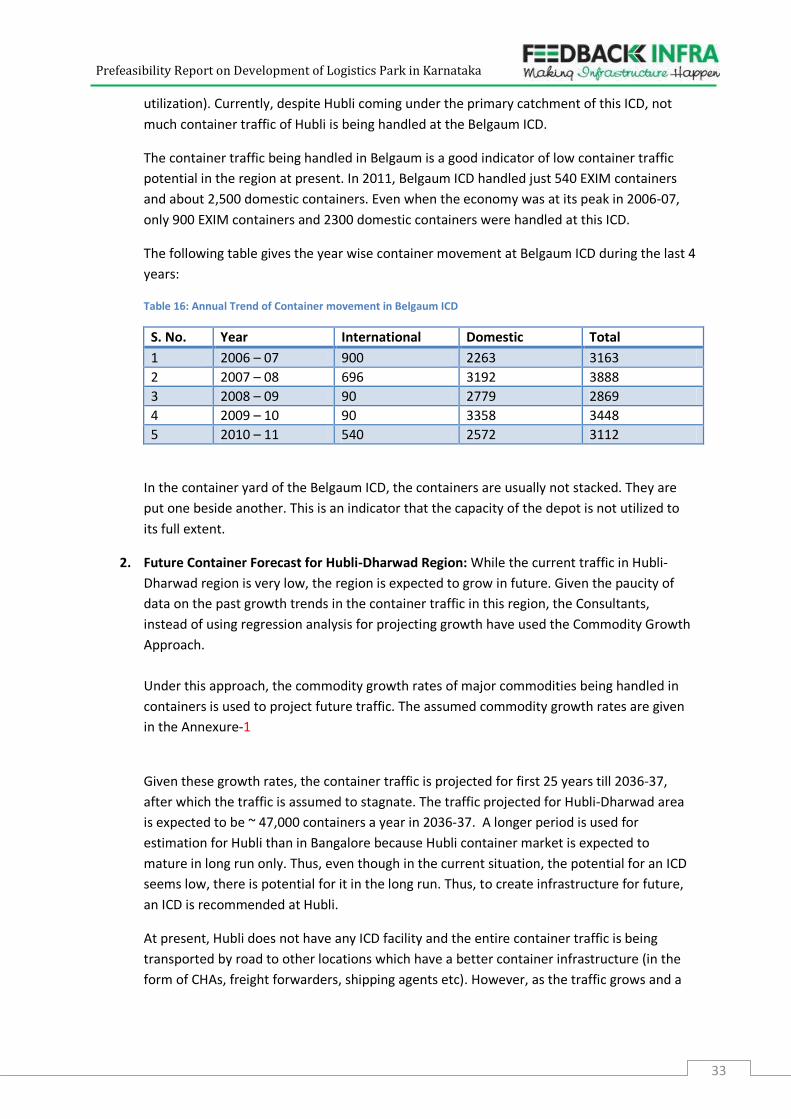
Prefeasibility Report on Development of Logistics Park in Karnataka
33
utilization). Currently, despite Hubli coming under the primary catchment of this ICD, not
much container traffic of Hubli is being handled at the Belgaum ICD.
The container traffic being handled in Belgaum is a good indicator of low container traffic
potential in the region at present. In 2011, Belgaum ICD handled just 540 EXIM containers
and about 2,500 domestic containers. Even when the economy was at its peak in 2006-07,
only 900 EXIM containers and 2300 domestic containers were handled at this ICD.
The following table gives the year wise container movement at Belgaum ICD during the last 4
years:
Table 16: Annual Trend of Container movement in Belgaum ICD
S. No. Year International Domestic Total
1 2006 – 07 900 2263 3163
2 2007 – 08 696 3192 3888
3 2008 – 09 90 2779 2869
4 2009 – 10 90 3358 3448
5 2010 – 11 540 2572 3112
In the container yard of the Belgaum ICD, the containers are usually not stacked. They are
put one beside another. This is an indicator that the capacity of the depot is not utilized to
its full extent.
2. Future Container Forecast for Hubli-Dharwad Region: While the current traffic in Hubli-
Dharwad region is very low, the region is expected to grow in future. Given the paucity of
data on the past growth trends in the container traffic in this region, the Consultants,
instead of using regression analysis for projecting growth have used the Commodity Growth
Approach.
Under this approach, the commodity growth rates of major commodities being handled in
containers is used to project future traffic. The assumed commodity growth rates are given
in the Annexure-1
Given these growth rates, the container traffic is projected for first 25 years till 2036-37,
after which the traffic is assumed to stagnate. The traffic projected for Hubli-Dharwad area
is expected to be ~ 47,000 containers a year in 2036-37. A longer period is used for
estimation for Hubli than in Bangalore because Hubli container market is expected to
mature in long run only. Thus, even though in the current situation, the potential for an ICD
seems low, there is potential for it in the long run. Thus, to create infrastructure for future,
an ICD is recommended at Hubli.
At present, Hubli does not have any ICD facility and the entire container traffic is being
transported by road to other locations which have a better container infrastructure (in the
form of CHAs, freight forwarders, shipping agents etc). However, as the traffic grows and a
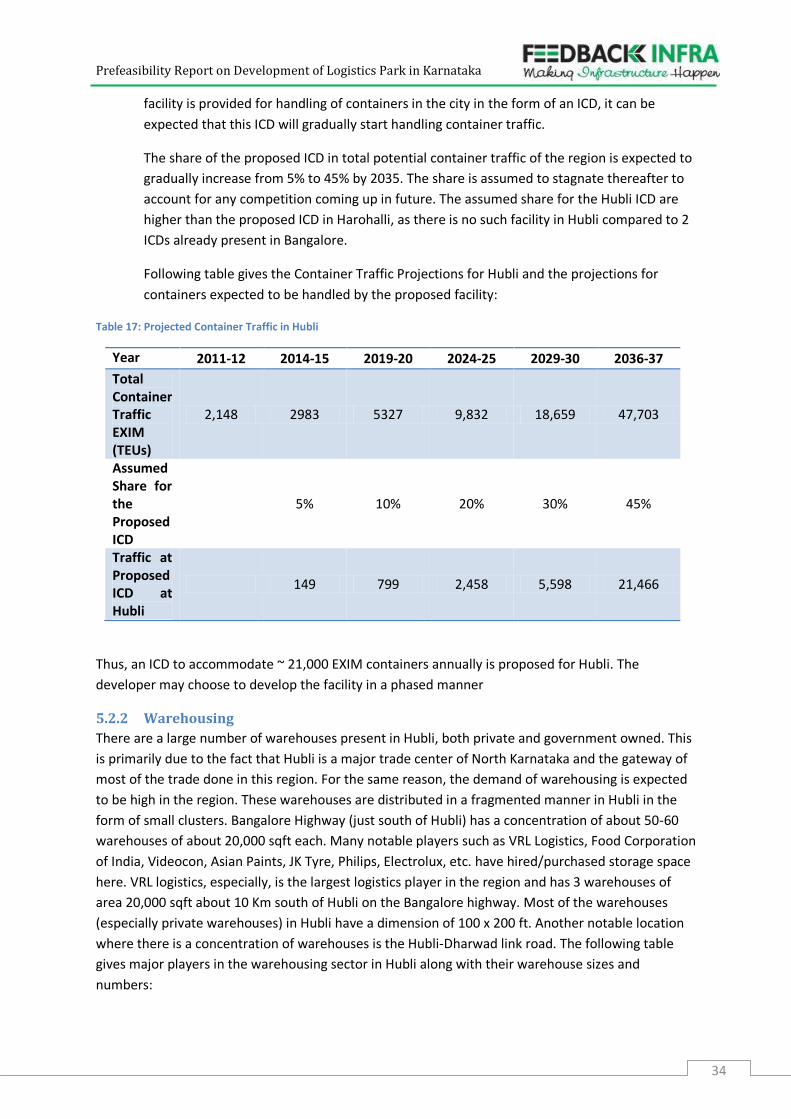
Prefeasibility Report on Development of Logistics Park in Karnataka
34
facility is provided for handling of containers in the city in the form of an ICD, it can be
expected that this ICD will gradually start handling container traffic.
The share of the proposed ICD in total potential container traffic of the region is expected to
gradually increase from 5% to 45% by 2035. The share is assumed to stagnate thereafter to
account for any competition coming up in future. The assumed share for the Hubli ICD are
higher than the proposed ICD in Harohalli, as there is no such facility in Hubli compared to 2
ICDs already present in Bangalore.
Following table gives the Container Traffic Projections for Hubli and the projections for
containers expected to be handled by the proposed facility:
Table 17: Projected Container Traffic in Hubli
Year 2011-12 2014-15 2019-20 2024-25 2029-30 2036-37
Total Container Traffic EXIM (TEUs)
2,148 2983 5327 9,832 18,659 47,703
Assumed Share for the Proposed ICD
5% 10% 20% 30% 45%
Traffic at Proposed ICD at Hubli
149 799 2,458 5,598 21,466
Thus, an ICD to accommodate ~ 21,000 EXIM containers annually is proposed for Hubli. The
developer may choose to develop the facility in a phased manner
5.2.2 Warehousing
There are a large number of warehouses present in Hubli, both private and government owned. This
is primarily due to the fact that Hubli is a major trade center of North Karnataka and the gateway of
most of the trade done in this region. For the same reason, the demand of warehousing is expected
to be high in the region. These warehouses are distributed in a fragmented manner in Hubli in the
form of small clusters. Bangalore Highway (just south of Hubli) has a concentration of about 50-60
warehouses of about 20,000 sqft each. Many notable players such as VRL Logistics, Food Corporation
of India, Videocon, Asian Paints, JK Tyre, Philips, Electrolux, etc. have hired/purchased storage space
here. VRL logistics, especially, is the largest logistics player in the region and has 3 warehouses of
area 20,000 sqft about 10 Km south of Hubli on the Bangalore highway. Most of the warehouses
(especially private warehouses) in Hubli have a dimension of 100 x 200 ft. Another notable location
where there is a concentration of warehouses is the Hubli-Dharwad link road. The following table
gives major players in the warehousing sector in Hubli along with their warehouse sizes and
numbers:
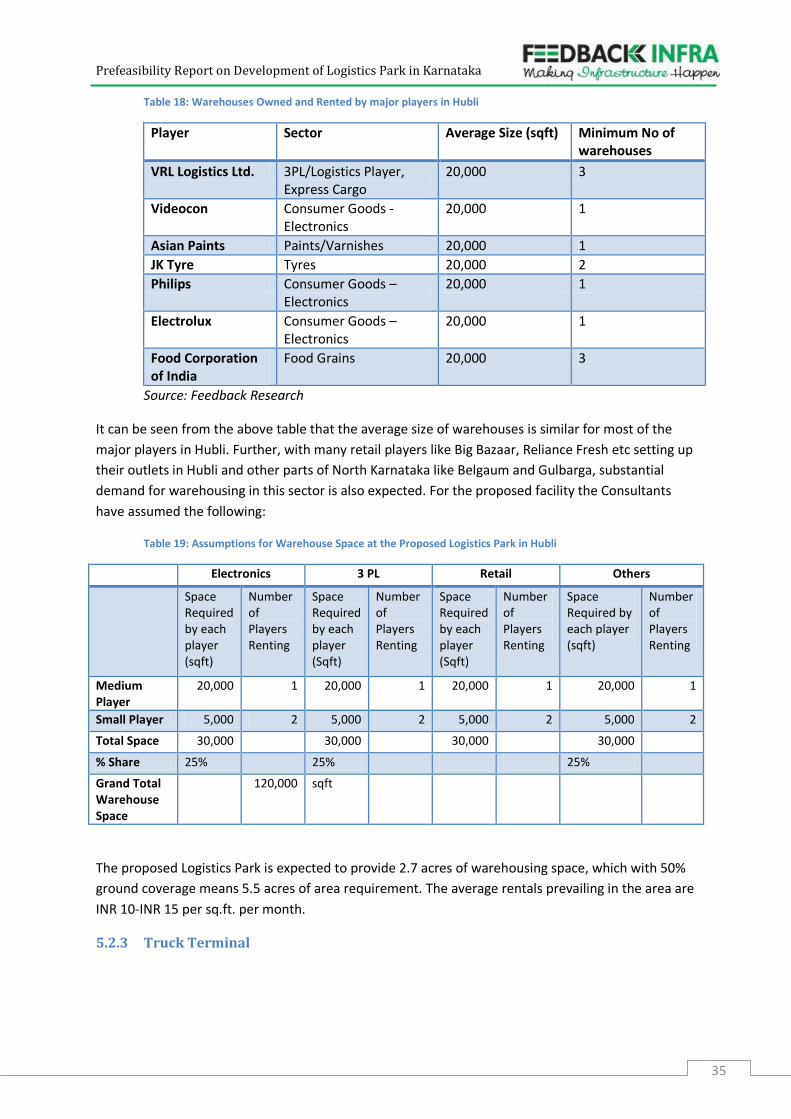
Prefeasibility Report on Development of Logistics Park in Karnataka
35
Table 18: Warehouses Owned and Rented by major players in Hubli
Player Sector Average Size (sqft) Minimum No of warehouses
VRL Logistics Ltd. 3PL/Logistics Player, Express Cargo
20,000 3
Videocon Consumer Goods - Electronics
20,000 1
Asian Paints Paints/Varnishes 20,000 1
JK Tyre Tyres 20,000 2
Philips Consumer Goods – Electronics
20,000 1
Electrolux Consumer Goods – Electronics
20,000 1
Food Corporation of India
Food Grains 20,000 3
Source: Feedback Research
It can be seen from the above table that the average size of warehouses is similar for most of the
major players in Hubli. Further, with many retail players like Big Bazaar, Reliance Fresh etc setting up
their outlets in Hubli and other parts of North Karnataka like Belgaum and Gulbarga, substantial
demand for warehousing in this sector is also expected. For the proposed facility the Consultants
have assumed the following:
Table 19: Assumptions for Warehouse Space at the Proposed Logistics Park in Hubli
Electronics 3 PL Retail Others
Space Required by each player (sqft)
Number of Players Renting
Space Required by each player (Sqft)
Number of Players Renting
Space Required by each player (Sqft)
Number of Players Renting
Space Required by each player (sqft)
Number of Players Renting
Medium Player
20,000 1 20,000 1 20,000 1 20,000 1
Small Player 5,000 2 5,000 2 5,000 2 5,000 2
Total Space 30,000 30,000 30,000 30,000
% Share 25% 25% 25%
Grand Total Warehouse Space
120,000 sqft
The proposed Logistics Park is expected to provide 2.7 acres of warehousing space, which with 50%
ground coverage means 5.5 acres of area requirement. The average rentals prevailing in the area are
INR 10-INR 15 per sq.ft. per month.
5.2.3 Truck Terminal
Prefeasibility Report on Development of Logistics Park in Karnataka
36
From the interactions with the Karnataka Chambers of Commerce and Industry, Goods Transport
and Lorry Owners’ Association at Hubli and VRL Logistics Ltd., it is concluded that Hubli has a truck
traffic of nearly 5,000 trucks per day of which nearly 1,000 to 1,500 trucks stop at Hubli for
loading/unloading (approx. 10,000 tonnes) and about 100 trucks travel within the city primarily for
movement of goods from the goods shed at the rail head to various warehouses in Hubli.
The principal commodities handled using trucks at Hubli are Break Bulk cargo, Chili, Sugar, Food
Grains, raw materials and products from Tata Telcon, Cement, Chemicals, Steel, Tyre, Construction
Aggregate, Lubricants, Fertilizer, Chemical Valves, Fast Moving Consumer Goods, Hardware, etc. In
total, less than 5% are containers.
Hubli region is used by many large logistics players such as VRL Logistics as a goods redistribution
center for North Karnataka. This means that at Hubli, logistics players arrange the goods in various
outgoing trucks according to their dispatch locations. For this, logistics players usually have their
own private warehouses and loading/unloading space.
Presently, there is no truck terminal in Hubli. There are private lands at 3-4 locations of about 5 acres
each, which have a holding capacity of about 100-150 trucks each, where the trucks currently park.
The spillover trucks from these sites are being parked at night on the roads itself. These private land
owners charge for parking at the rate of INR 30 to 50 for 12-18 hours. The land parcels are privately
owned and operated, and do not have sufficient space nor facilities/amenities to house/service all
the trucks. There is a 40 acre parcel of land owned by VRL Logistics about 20 Km south of Bangalore.
It has a capacity of about 700-800 trucks and is used by VRL Logistics to park its own fleet of trucks.
As per inputs provided by the North Karnataka Lorry Owner’s Association and VRL logistics, of the
trucks that are bypassing Hubli and not carrying out loading/unloading at present, nearly 25% trucks
stop at Hubli as a mid-journey stop, the number would be approximately 1,000 trucks. In addition,
approximately 1500 trucks are doing business within Hubli. Hence a truck terminal would be
required for ~2,500 trucks. The present capacity in Hubli is not more than 1,500 trucks, which is
highly unorganized (except VRL’s private parking area). Thus, a truck terminal for 2,000 trucks is
proposed in Hubli with various facilities, amenities and utilities such as Office, Workshop, Petrol
Pump, Police Station, Fire Station and Hospital/Medical Center. Considering that even the current
facilities charge for parking and do not have good facilities, the proposed facility is expected to sway
traffic away from them.
The Government of Karnataka had plans of acquiring 50 acres of land south of Hubli on the
Bangalore highway to set up a truck terminal but the plan has not materialized till now. The
Consultants recommend that instead, a truck terminal is set up as a part of the proposed Logistics
Park at Hubli.
5.2.4 Future Demand Drivers
The major demand drivers that are expected to fuel the growth of logistics activities in the Hubli
region are:
1. The Karnataka State Government has earmarked ~1,000 acres of land for
development of industrial areas in the near future in Mammigatti and Gamangatti.
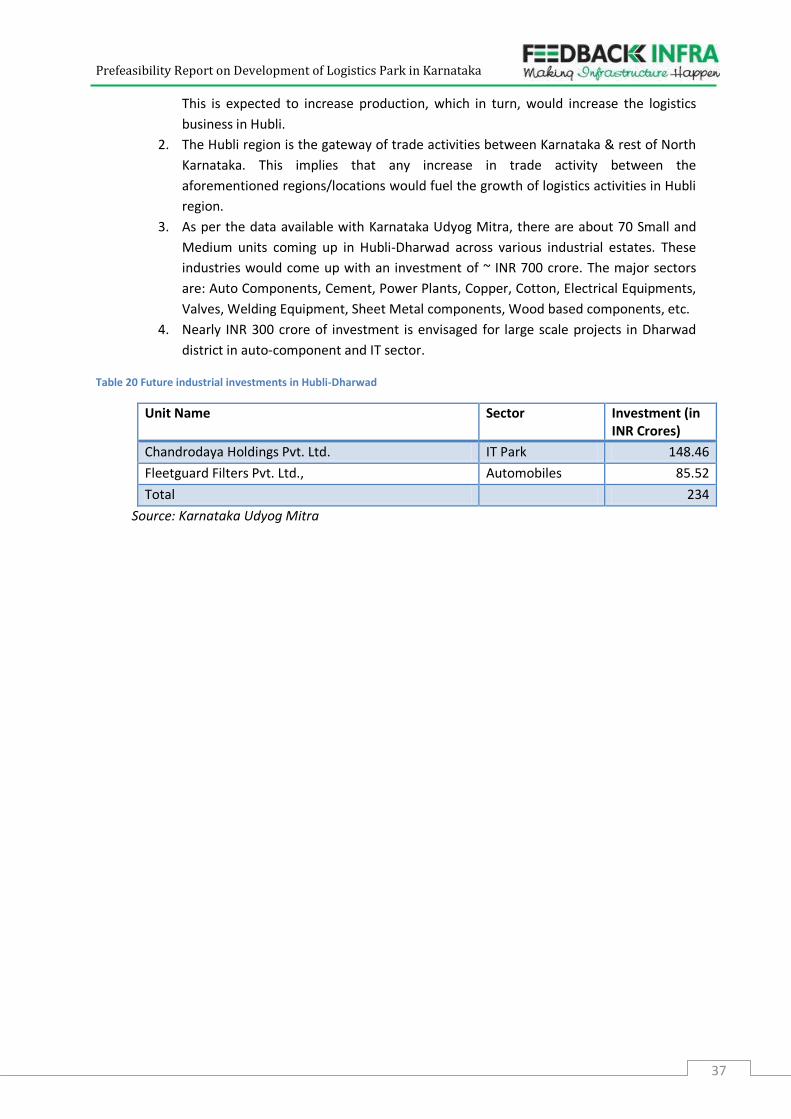
Prefeasibility Report on Development of Logistics Park in Karnataka
37
This is expected to increase production, which in turn, would increase the logistics
business in Hubli.
2. The Hubli region is the gateway of trade activities between Karnataka & rest of North
Karnataka. This implies that any increase in trade activity between the
aforementioned regions/locations would fuel the growth of logistics activities in Hubli
region.
3. As per the data available with Karnataka Udyog Mitra, there are about 70 Small and
Medium units coming up in Hubli-Dharwad across various industrial estates. These
industries would come up with an investment of ~ INR 700 crore. The major sectors
are: Auto Components, Cement, Power Plants, Copper, Cotton, Electrical Equipments,
Valves, Welding Equipment, Sheet Metal components, Wood based components, etc.
4. Nearly INR 300 crore of investment is envisaged for large scale projects in Dharwad
district in auto-component and IT sector.
Table 20 Future industrial investments in Hubli-Dharwad
Unit Name Sector Investment (in INR Crores)
Chandrodaya Holdings Pvt. Ltd. IT Park 148.46
Fleetguard Filters Pvt. Ltd., Automobiles 85.52
Total 234
Source: Karnataka Udyog Mitra
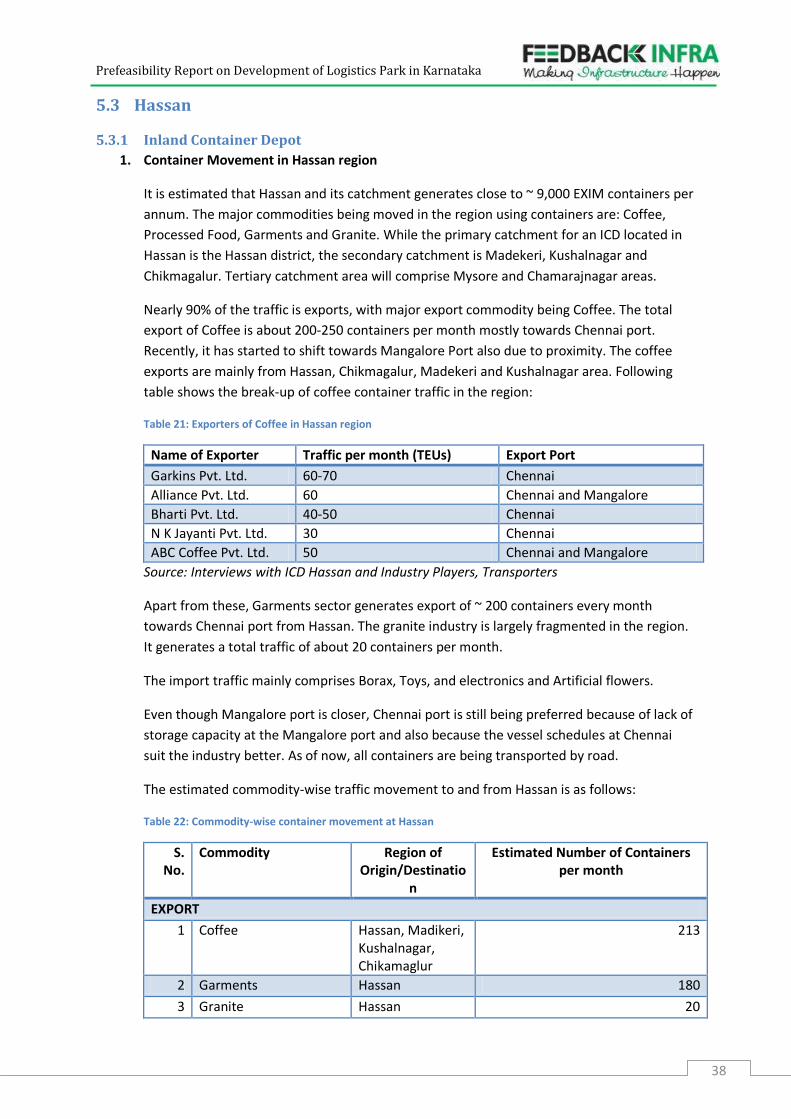
Prefeasibility Report on Development of Logistics Park in Karnataka
38
5.3 Hassan
5.3.1 Inland Container Depot
1. Container Movement in Hassan region
It is estimated that Hassan and its catchment generates close to ~ 9,000 EXIM containers per
annum. The major commodities being moved in the region using containers are: Coffee,
Processed Food, Garments and Granite. While the primary catchment for an ICD located in
Hassan is the Hassan district, the secondary catchment is Madekeri, Kushalnagar and
Chikmagalur. Tertiary catchment area will comprise Mysore and Chamarajnagar areas.
Nearly 90% of the traffic is exports, with major export commodity being Coffee. The total
export of Coffee is about 200-250 containers per month mostly towards Chennai port.
Recently, it has started to shift towards Mangalore Port also due to proximity. The coffee
exports are mainly from Hassan, Chikmagalur, Madekeri and Kushalnagar area. Following
table shows the break-up of coffee container traffic in the region:
Table 21: Exporters of Coffee in Hassan region
Name of Exporter Traffic per month (TEUs) Export Port
Garkins Pvt. Ltd. 60-70 Chennai
Alliance Pvt. Ltd. 60 Chennai and Mangalore
Bharti Pvt. Ltd. 40-50 Chennai
N K Jayanti Pvt. Ltd. 30 Chennai
ABC Coffee Pvt. Ltd. 50 Chennai and Mangalore
Source: Interviews with ICD Hassan and Industry Players, Transporters
Apart from these, Garments sector generates export of ~ 200 containers every month
towards Chennai port from Hassan. The granite industry is largely fragmented in the region.
It generates a total traffic of about 20 containers per month.
The import traffic mainly comprises Borax, Toys, and electronics and Artificial flowers.
Even though Mangalore port is closer, Chennai port is still being preferred because of lack of
storage capacity at the Mangalore port and also because the vessel schedules at Chennai
suit the industry better. As of now, all containers are being transported by road.
The estimated commodity-wise traffic movement to and from Hassan is as follows:
Table 22: Commodity-wise container movement at Hassan
S. No.
Commodity Region of Origin/Destinatio
n
Estimated Number of Containers per month
EXPORT
1 Coffee Hassan, Madikeri, Kushalnagar, Chikamaglur
213
2 Garments Hassan 180
3 Granite Hassan 20
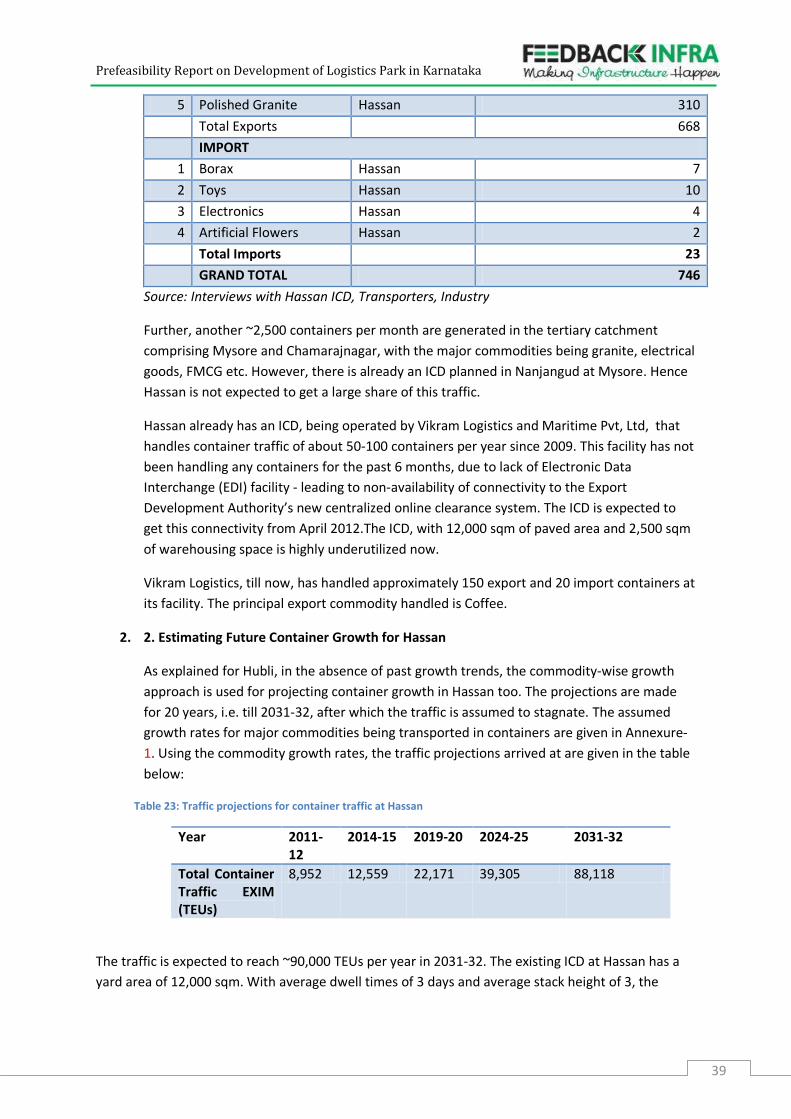
Prefeasibility Report on Development of Logistics Park in Karnataka
39
5 Polished Granite Hassan 310
Total Exports 668
IMPORT
1 Borax Hassan 7
2 Toys Hassan 10
3 Electronics Hassan 4
4 Artificial Flowers Hassan 2
Total Imports 23
GRAND TOTAL 746
Source: Interviews with Hassan ICD, Transporters, Industry
Further, another ~2,500 containers per month are generated in the tertiary catchment
comprising Mysore and Chamarajnagar, with the major commodities being granite, electrical
goods, FMCG etc. However, there is already an ICD planned in Nanjangud at Mysore. Hence
Hassan is not expected to get a large share of this traffic.
Hassan already has an ICD, being operated by Vikram Logistics and Maritime Pvt, Ltd, that
handles container traffic of about 50-100 containers per year since 2009. This facility has not
been handling any containers for the past 6 months, due to lack of Electronic Data
Interchange (EDI) facility - leading to non-availability of connectivity to the Export
Development Authority’s new centralized online clearance system. The ICD is expected to
get this connectivity from April 2012.The ICD, with 12,000 sqm of paved area and 2,500 sqm
of warehousing space is highly underutilized now.
Vikram Logistics, till now, has handled approximately 150 export and 20 import containers at
its facility. The principal export commodity handled is Coffee.
2. 2. Estimating Future Container Growth for Hassan
As explained for Hubli, in the absence of past growth trends, the commodity-wise growth
approach is used for projecting container growth in Hassan too. The projections are made
for 20 years, i.e. till 2031-32, after which the traffic is assumed to stagnate. The assumed
growth rates for major commodities being transported in containers are given in Annexure-
1. Using the commodity growth rates, the traffic projections arrived at are given in the table
below:
Table 23: Traffic projections for container traffic at Hassan
Year 2011-12
2014-15 2019-20 2024-25 2031-32
Total Container Traffic EXIM (TEUs)
8,952 12,559 22,171 39,305 88,118
The traffic is expected to reach ~90,000 TEUs per year in 2031-32. The existing ICD at Hassan has a
yard area of 12,000 sqm. With average dwell times of 3 days and average stack height of 3, the
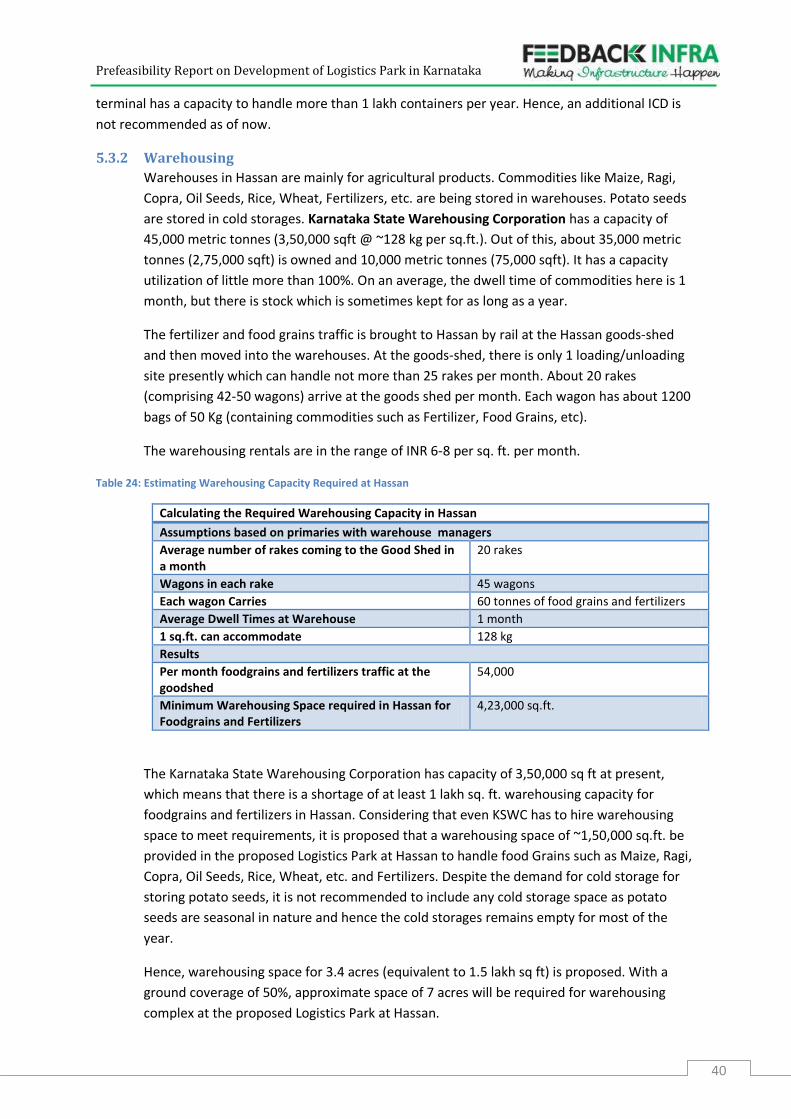
Prefeasibility Report on Development of Logistics Park in Karnataka
40
terminal has a capacity to handle more than 1 lakh containers per year. Hence, an additional ICD is
not recommended as of now.
5.3.2 Warehousing
Warehouses in Hassan are mainly for agricultural products. Commodities like Maize, Ragi,
Copra, Oil Seeds, Rice, Wheat, Fertilizers, etc. are being stored in warehouses. Potato seeds
are stored in cold storages. Karnataka State Warehousing Corporation has a capacity of
45,000 metric tonnes (3,50,000 sqft @ ~128 kg per sq.ft.). Out of this, about 35,000 metric
tonnes (2,75,000 sqft) is owned and 10,000 metric tonnes (75,000 sqft). It has a capacity
utilization of little more than 100%. On an average, the dwell time of commodities here is 1
month, but there is stock which is sometimes kept for as long as a year.
The fertilizer and food grains traffic is brought to Hassan by rail at the Hassan goods-shed
and then moved into the warehouses. At the goods-shed, there is only 1 loading/unloading
site presently which can handle not more than 25 rakes per month. About 20 rakes
(comprising 42-50 wagons) arrive at the goods shed per month. Each wagon has about 1200
bags of 50 Kg (containing commodities such as Fertilizer, Food Grains, etc).
The warehousing rentals are in the range of INR 6-8 per sq. ft. per month.
Table 24: Estimating Warehousing Capacity Required at Hassan
Calculating the Required Warehousing Capacity in Hassan
Assumptions based on primaries with warehouse managers
Average number of rakes coming to the Good Shed in a month
20 rakes
Wagons in each rake 45 wagons
Each wagon Carries 60 tonnes of food grains and fertilizers
Average Dwell Times at Warehouse 1 month
1 sq.ft. can accommodate 128 kg
Results
Per month foodgrains and fertilizers traffic at the goodshed
54,000
Minimum Warehousing Space required in Hassan for Foodgrains and Fertilizers
4,23,000 sq.ft.
The Karnataka State Warehousing Corporation has capacity of 3,50,000 sq ft at present,
which means that there is a shortage of at least 1 lakh sq. ft. warehousing capacity for
foodgrains and fertilizers in Hassan. Considering that even KSWC has to hire warehousing
space to meet requirements, it is proposed that a warehousing space of ~1,50,000 sq.ft. be
provided in the proposed Logistics Park at Hassan to handle food Grains such as Maize, Ragi,
Copra, Oil Seeds, Rice, Wheat, etc. and Fertilizers. Despite the demand for cold storage for
storing potato seeds, it is not recommended to include any cold storage space as potato
seeds are seasonal in nature and hence the cold storages remains empty for most of the
year.
Hence, warehousing space for 3.4 acres (equivalent to 1.5 lakh sq ft) is proposed. With a
ground coverage of 50%, approximate space of 7 acres will be required for warehousing
complex at the proposed Logistics Park at Hassan.
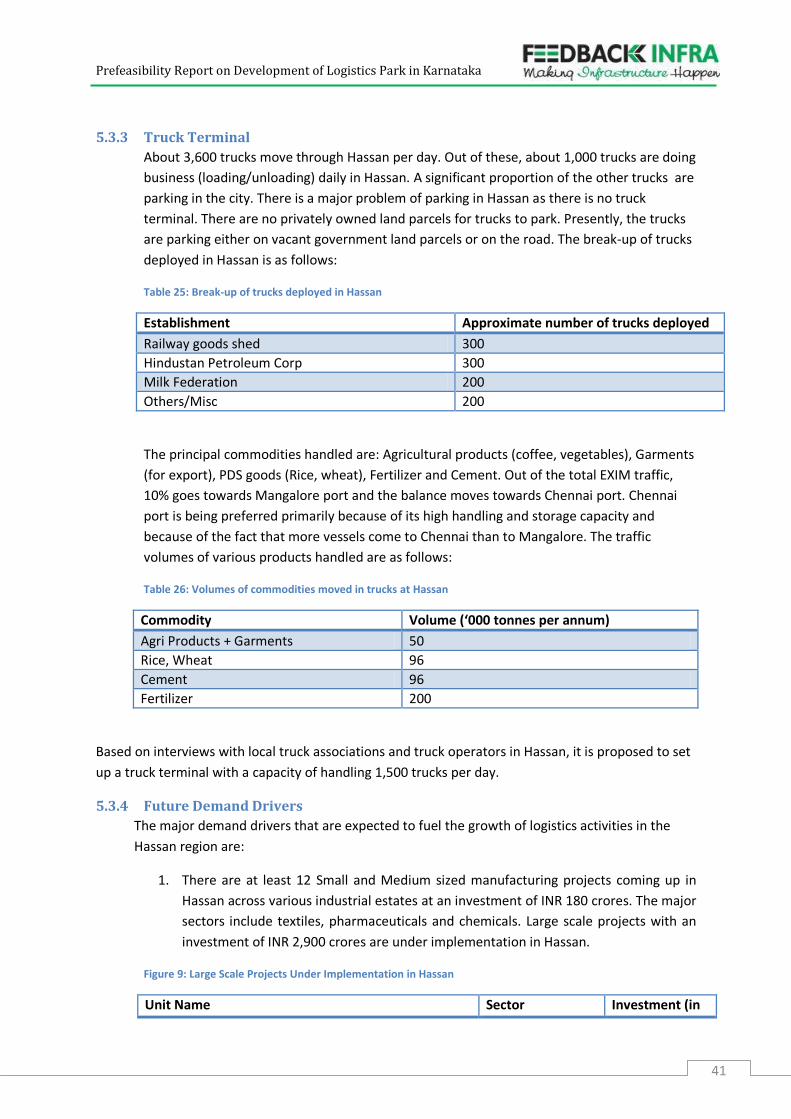
Prefeasibility Report on Development of Logistics Park in Karnataka
41
5.3.3 Truck Terminal
About 3,600 trucks move through Hassan per day. Out of these, about 1,000 trucks are doing
business (loading/unloading) daily in Hassan. A significant proportion of the other trucks are
parking in the city. There is a major problem of parking in Hassan as there is no truck
terminal. There are no privately owned land parcels for trucks to park. Presently, the trucks
are parking either on vacant government land parcels or on the road. The break-up of trucks
deployed in Hassan is as follows:
Table 25: Break-up of trucks deployed in Hassan
Establishment Approximate number of trucks deployed
Railway goods shed 300
Hindustan Petroleum Corp 300
Milk Federation 200
Others/Misc 200
The principal commodities handled are: Agricultural products (coffee, vegetables), Garments
(for export), PDS goods (Rice, wheat), Fertilizer and Cement. Out of the total EXIM traffic,
10% goes towards Mangalore port and the balance moves towards Chennai port. Chennai
port is being preferred primarily because of its high handling and storage capacity and
because of the fact that more vessels come to Chennai than to Mangalore. The traffic
volumes of various products handled are as follows:
Table 26: Volumes of commodities moved in trucks at Hassan
Commodity Volume (‘000 tonnes per annum)
Agri Products + Garments 50
Rice, Wheat 96
Cement 96
Fertilizer 200
Based on interviews with local truck associations and truck operators in Hassan, it is proposed to set
up a truck terminal with a capacity of handling 1,500 trucks per day.
5.3.4 Future Demand Drivers
The major demand drivers that are expected to fuel the growth of logistics activities in the
Hassan region are:
1. There are at least 12 Small and Medium sized manufacturing projects coming up in
Hassan across various industrial estates at an investment of INR 180 crores. The major
sectors include textiles, pharmaceuticals and chemicals. Large scale projects with an
investment of INR 2,900 crores are under implementation in Hassan.
Figure 9: Large Scale Projects Under Implementation in Hassan
Unit Name Sector Investment (in
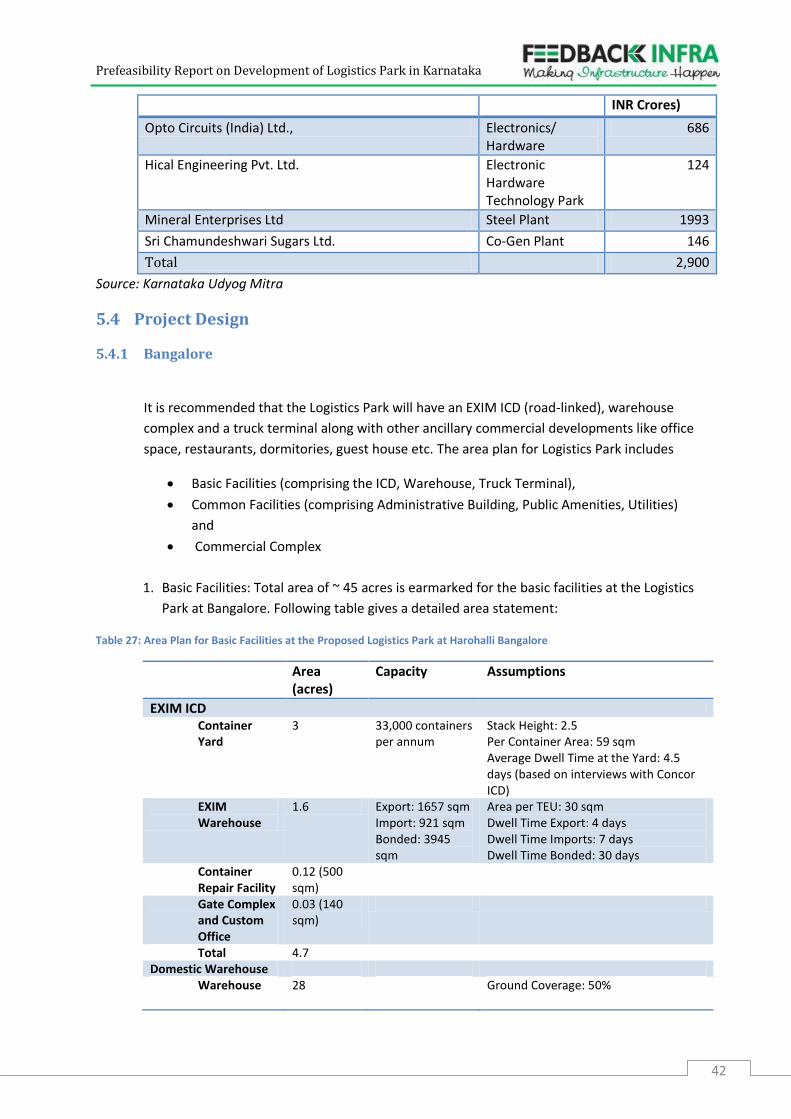
Prefeasibility Report on Development of Logistics Park in Karnataka
42
INR Crores)
Opto Circuits (India) Ltd., Electronics/ Hardware
686
Hical Engineering Pvt. Ltd. Electronic Hardware Technology Park
124
Mineral Enterprises Ltd Steel Plant 1993
Sri Chamundeshwari Sugars Ltd. Co-Gen Plant 146
Total 2,900
Source: Karnataka Udyog Mitra
5.4 Project Design
5.4.1 Bangalore
It is recommended that the Logistics Park will have an EXIM ICD (road-linked), warehouse
complex and a truck terminal along with other ancillary commercial developments like office
space, restaurants, dormitories, guest house etc. The area plan for Logistics Park includes
Basic Facilities (comprising the ICD, Warehouse, Truck Terminal),
Common Facilities (comprising Administrative Building, Public Amenities, Utilities)
and
Commercial Complex
1. Basic Facilities: Total area of ~ 45 acres is earmarked for the basic facilities at the Logistics
Park at Bangalore. Following table gives a detailed area statement:
Table 27: Area Plan for Basic Facilities at the Proposed Logistics Park at Harohalli Bangalore
Area (acres)
Capacity Assumptions
EXIM ICD Container Yard
3 33,000 containers per annum
Stack Height: 2.5 Per Container Area: 59 sqm Average Dwell Time at the Yard: 4.5 days (based on interviews with Concor ICD)
EXIM Warehouse
1.6 Export: 1657 sqm Import: 921 sqm Bonded: 3945 sqm
Area per TEU: 30 sqm Dwell Time Export: 4 days Dwell Time Imports: 7 days Dwell Time Bonded: 30 days
Container Repair Facility
0.12 (500 sqm)
Gate Complex and Custom Office
0.03 (140 sqm)
Total 4.7 Domestic Warehouse
Warehouse 28 Ground Coverage: 50%
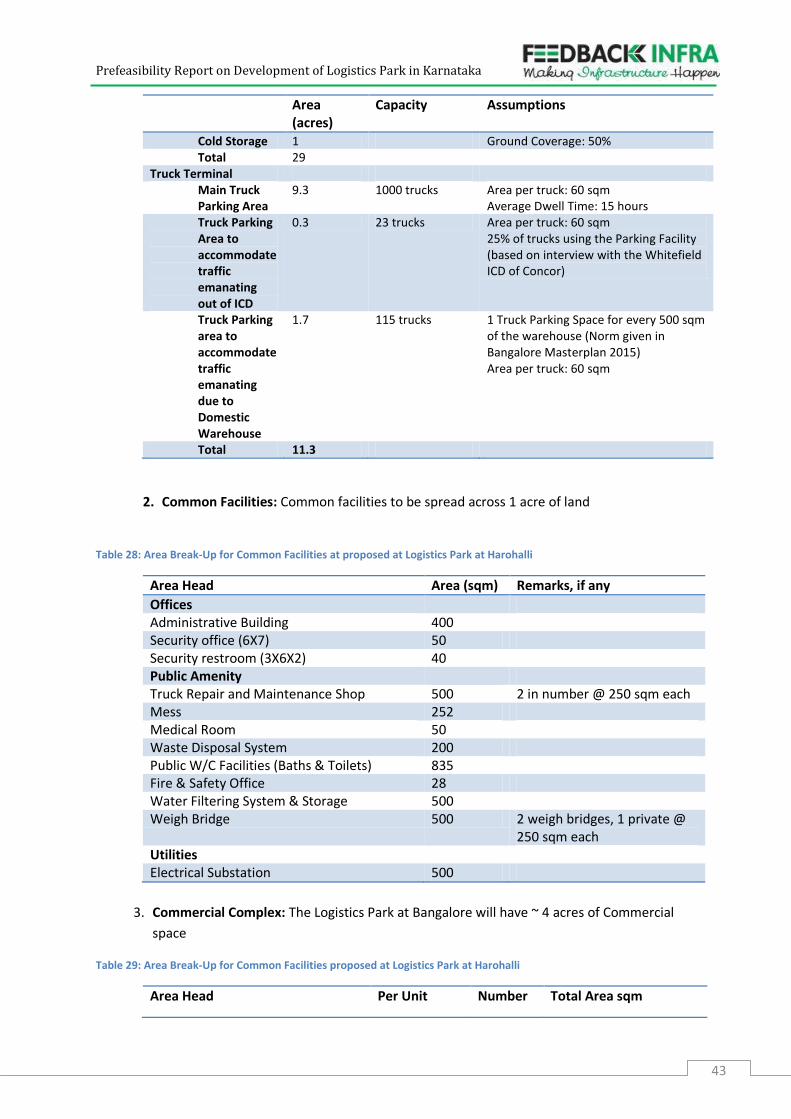
Prefeasibility Report on Development of Logistics Park in Karnataka
43
Area (acres)
Capacity Assumptions
Cold Storage 1 Ground Coverage: 50% Total 29
Truck Terminal Main Truck Parking Area
9.3 1000 trucks Area per truck: 60 sqm Average Dwell Time: 15 hours
Truck Parking Area to accommodate traffic emanating out of ICD
0.3 23 trucks Area per truck: 60 sqm 25% of trucks using the Parking Facility (based on interview with the Whitefield ICD of Concor)
Truck Parking area to accommodate traffic emanating due to Domestic Warehouse
1.7 115 trucks 1 Truck Parking Space for every 500 sqm of the warehouse (Norm given in Bangalore Masterplan 2015) Area per truck: 60 sqm
Total 11.3
2. Common Facilities: Common facilities to be spread across 1 acre of land
Table 28: Area Break-Up for Common Facilities at proposed at Logistics Park at Harohalli
Area Head Area (sqm) Remarks, if any
Offices Administrative Building 400 Security office (6X7) 50 Security restroom (3X6X2) 40 Public Amenity Truck Repair and Maintenance Shop 500 2 in number @ 250 sqm each Mess 252 Medical Room 50 Waste Disposal System 200 Public W/C Facilities (Baths & Toilets) 835 Fire & Safety Office 28 Water Filtering System & Storage 500 Weigh Bridge 500 2 weigh bridges, 1 private @
250 sqm each Utilities Electrical Substation 500
3. Commercial Complex: The Logistics Park at Bangalore will have ~ 4 acres of Commercial
space
Table 29: Area Break-Up for Common Facilities proposed at Logistics Park at Harohalli
Area Head Per Unit Number Total Area sqm
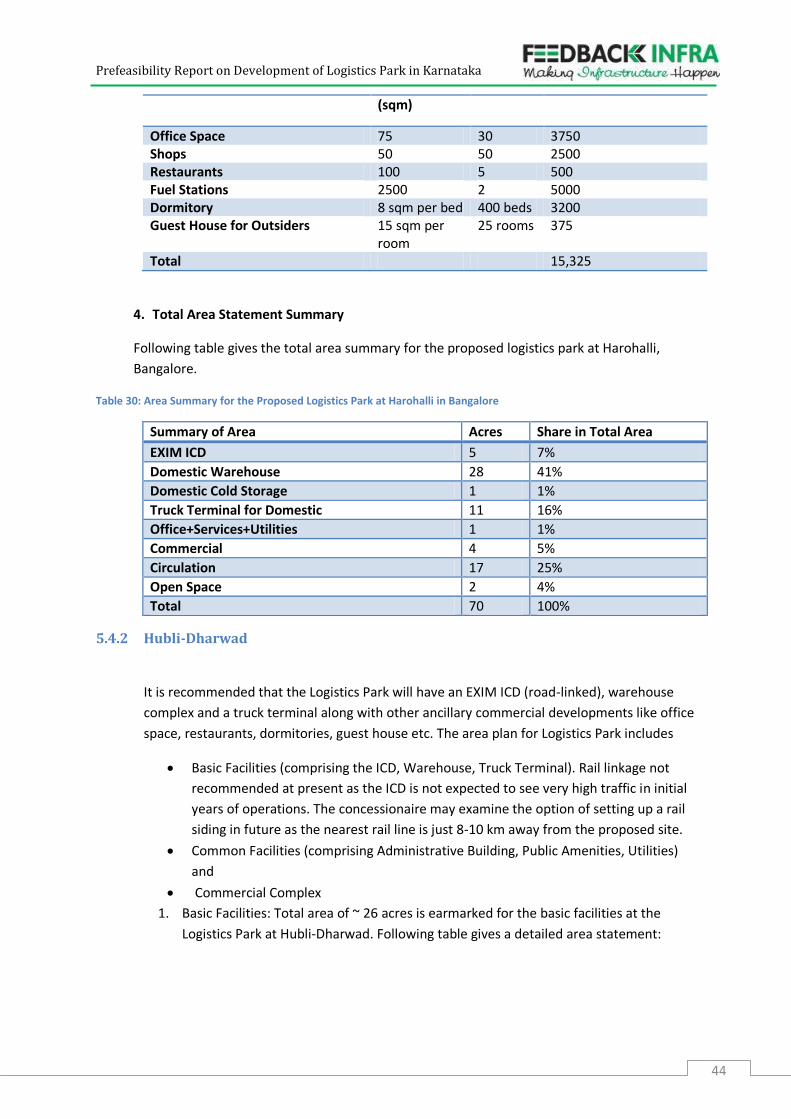
Prefeasibility Report on Development of Logistics Park in Karnataka
44
(sqm)
Office Space 75 30 3750 Shops 50 50 2500 Restaurants 100 5 500 Fuel Stations 2500 2 5000 Dormitory 8 sqm per bed 400 beds 3200 Guest House for Outsiders 15 sqm per
room 25 rooms 375
Total 15,325
4. Total Area Statement Summary
Following table gives the total area summary for the proposed logistics park at Harohalli,
Bangalore.
Table 30: Area Summary for the Proposed Logistics Park at Harohalli in Bangalore
Summary of Area Acres Share in Total Area
EXIM ICD 5 7%
Domestic Warehouse 28 41%
Domestic Cold Storage 1 1%
Truck Terminal for Domestic 11 16%
Office+Services+Utilities 1 1%
Commercial 4 5%
Circulation 17 25%
Open Space 2 4%
Total 70 100%
5.4.2 Hubli-Dharwad
It is recommended that the Logistics Park will have an EXIM ICD (road-linked), warehouse
complex and a truck terminal along with other ancillary commercial developments like office
space, restaurants, dormitories, guest house etc. The area plan for Logistics Park includes
Basic Facilities (comprising the ICD, Warehouse, Truck Terminal). Rail linkage not
recommended at present as the ICD is not expected to see very high traffic in initial
years of operations. The concessionaire may examine the option of setting up a rail
siding in future as the nearest rail line is just 8-10 km away from the proposed site.
Common Facilities (comprising Administrative Building, Public Amenities, Utilities)
and
Commercial Complex
1. Basic Facilities: Total area of ~ 26 acres is earmarked for the basic facilities at the
Logistics Park at Hubli-Dharwad. Following table gives a detailed area statement:
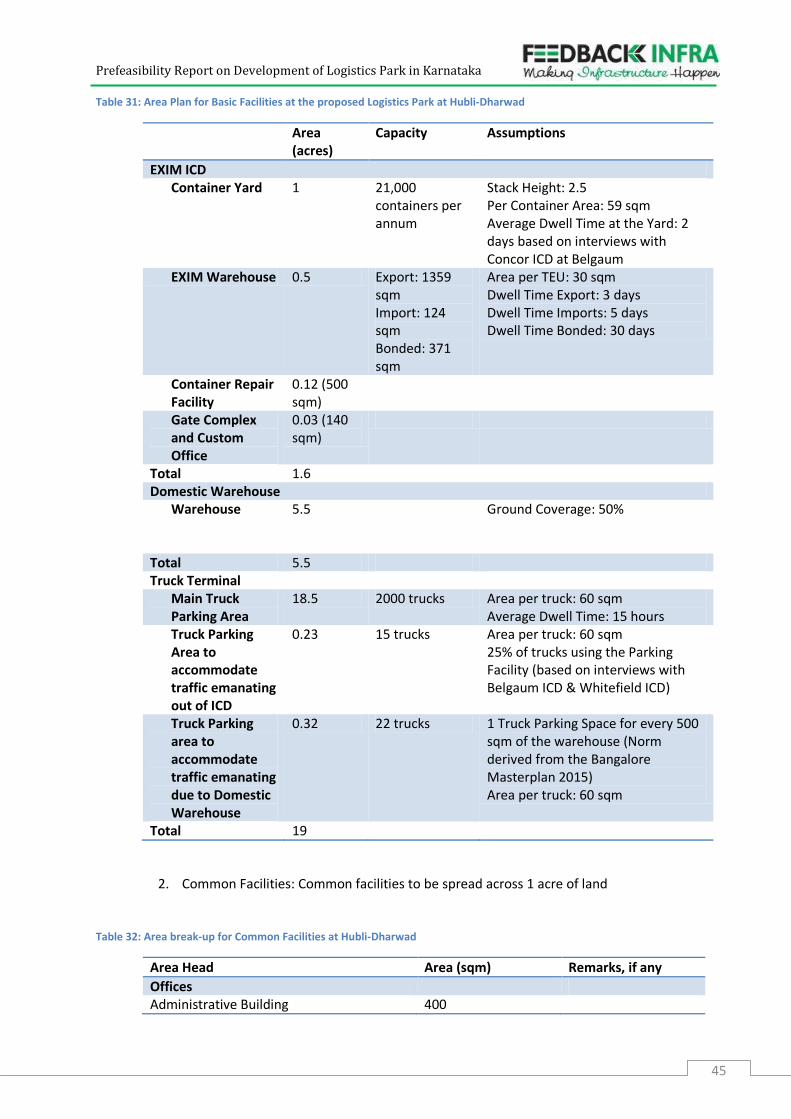
Prefeasibility Report on Development of Logistics Park in Karnataka
45
Table 31: Area Plan for Basic Facilities at the proposed Logistics Park at Hubli-Dharwad
Area (acres)
Capacity Assumptions
EXIM ICD Container Yard 1 21,000
containers per annum
Stack Height: 2.5 Per Container Area: 59 sqm Average Dwell Time at the Yard: 2 days based on interviews with Concor ICD at Belgaum
EXIM Warehouse 0.5 Export: 1359 sqm Import: 124 sqm Bonded: 371 sqm
Area per TEU: 30 sqm Dwell Time Export: 3 days Dwell Time Imports: 5 days Dwell Time Bonded: 30 days
Container Repair Facility
0.12 (500 sqm)
Gate Complex and Custom Office
0.03 (140 sqm)
Total 1.6 Domestic Warehouse
Warehouse 5.5 Ground Coverage: 50%
Total 5.5 Truck Terminal
Main Truck Parking Area
18.5 2000 trucks Area per truck: 60 sqm Average Dwell Time: 15 hours
Truck Parking Area to accommodate traffic emanating out of ICD
0.23 15 trucks Area per truck: 60 sqm 25% of trucks using the Parking Facility (based on interviews with Belgaum ICD & Whitefield ICD)
Truck Parking area to accommodate traffic emanating due to Domestic Warehouse
0.32 22 trucks 1 Truck Parking Space for every 500 sqm of the warehouse (Norm derived from the Bangalore Masterplan 2015) Area per truck: 60 sqm
Total 19
2. Common Facilities: Common facilities to be spread across 1 acre of land
Table 32: Area break-up for Common Facilities at Hubli-Dharwad
Area Head Area (sqm) Remarks, if any
Offices Administrative Building 400
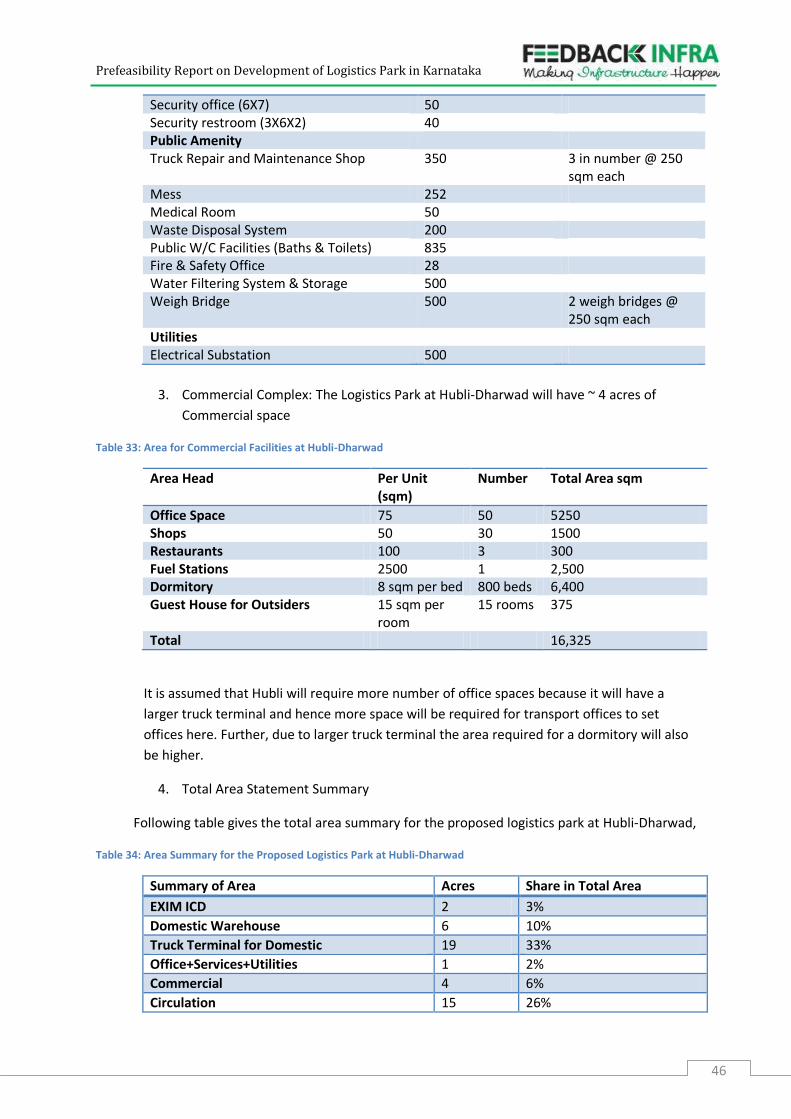
Prefeasibility Report on Development of Logistics Park in Karnataka
46
Security office (6X7) 50 Security restroom (3X6X2) 40 Public Amenity Truck Repair and Maintenance Shop 350 3 in number @ 250
sqm each Mess 252 Medical Room 50 Waste Disposal System 200 Public W/C Facilities (Baths & Toilets) 835 Fire & Safety Office 28 Water Filtering System & Storage 500 Weigh Bridge 500 2 weigh bridges @
250 sqm each Utilities Electrical Substation 500
3. Commercial Complex: The Logistics Park at Hubli-Dharwad will have ~ 4 acres of
Commercial space
Table 33: Area for Commercial Facilities at Hubli-Dharwad
Area Head Per Unit (sqm)
Number Total Area sqm
Office Space 75 50 5250 Shops 50 30 1500 Restaurants 100 3 300 Fuel Stations 2500 1 2,500 Dormitory 8 sqm per bed 800 beds 6,400 Guest House for Outsiders 15 sqm per
room 15 rooms 375
Total 16,325
It is assumed that Hubli will require more number of office spaces because it will have a
larger truck terminal and hence more space will be required for transport offices to set
offices here. Further, due to larger truck terminal the area required for a dormitory will also
be higher.
4. Total Area Statement Summary
Following table gives the total area summary for the proposed logistics park at Hubli-Dharwad,
Table 34: Area Summary for the Proposed Logistics Park at Hubli-Dharwad
Summary of Area Acres Share in Total Area
EXIM ICD 2 3%
Domestic Warehouse 6 10%
Truck Terminal for Domestic 19 33%
Office+Services+Utilities 1 2%
Commercial 4 6%
Circulation 15 26%
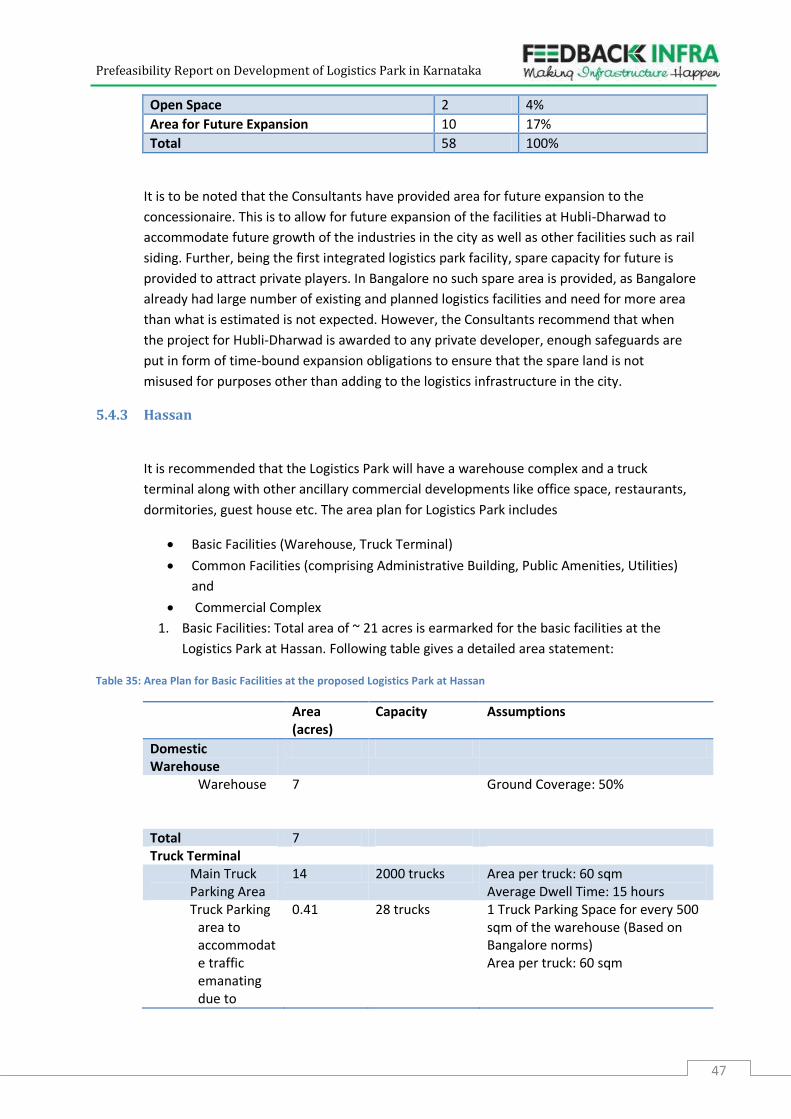
Prefeasibility Report on Development of Logistics Park in Karnataka
47
Open Space 2 4%
Area for Future Expansion 10 17%
Total 58 100%
It is to be noted that the Consultants have provided area for future expansion to the
concessionaire. This is to allow for future expansion of the facilities at Hubli-Dharwad to
accommodate future growth of the industries in the city as well as other facilities such as rail
siding. Further, being the first integrated logistics park facility, spare capacity for future is
provided to attract private players. In Bangalore no such spare area is provided, as Bangalore
already had large number of existing and planned logistics facilities and need for more area
than what is estimated is not expected. However, the Consultants recommend that when
the project for Hubli-Dharwad is awarded to any private developer, enough safeguards are
put in form of time-bound expansion obligations to ensure that the spare land is not
misused for purposes other than adding to the logistics infrastructure in the city.
5.4.3 Hassan
It is recommended that the Logistics Park will have a warehouse complex and a truck
terminal along with other ancillary commercial developments like office space, restaurants,
dormitories, guest house etc. The area plan for Logistics Park includes
Basic Facilities (Warehouse, Truck Terminal)
Common Facilities (comprising Administrative Building, Public Amenities, Utilities)
and
Commercial Complex
1. Basic Facilities: Total area of ~ 21 acres is earmarked for the basic facilities at the
Logistics Park at Hassan. Following table gives a detailed area statement:
Table 35: Area Plan for Basic Facilities at the proposed Logistics Park at Hassan
Area (acres)
Capacity Assumptions
Domestic Warehouse
Warehouse 7 Ground Coverage: 50%
Total 7 Truck Terminal
Main Truck Parking Area
14 2000 trucks Area per truck: 60 sqm Average Dwell Time: 15 hours
Truck Parking area to accommodate traffic emanating due to
0.41 28 trucks 1 Truck Parking Space for every 500 sqm of the warehouse (Based on Bangalore norms) Area per truck: 60 sqm
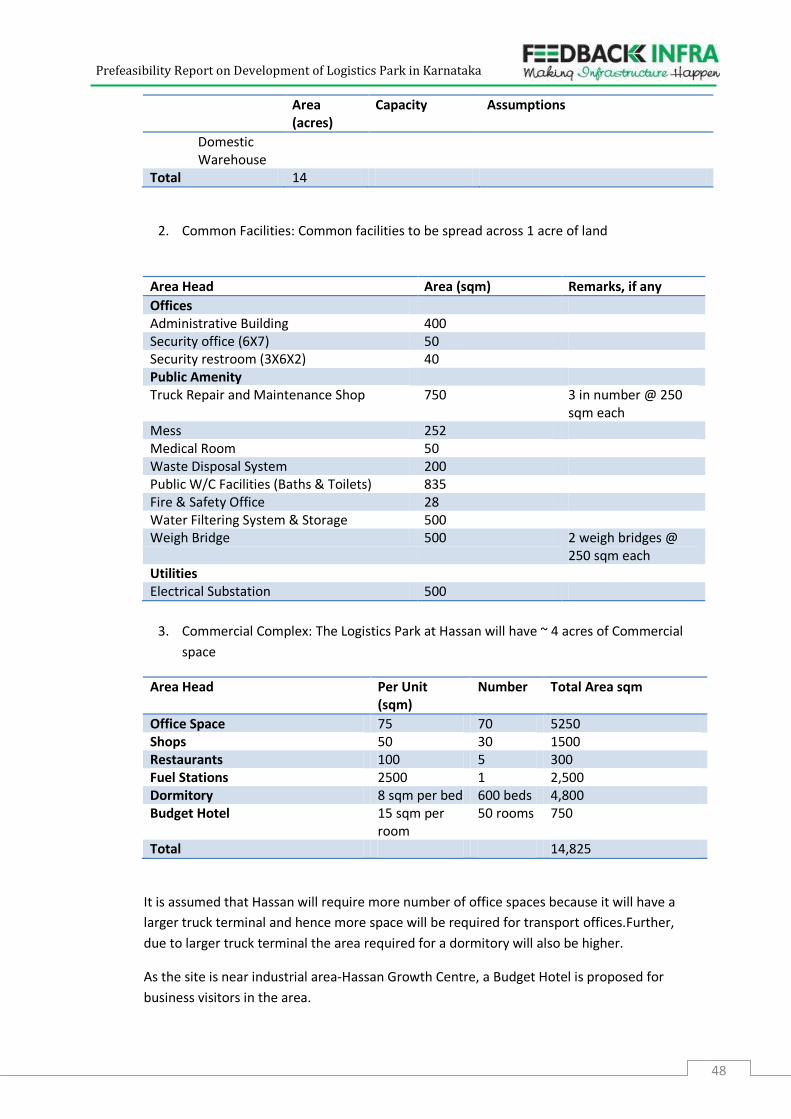
Prefeasibility Report on Development of Logistics Park in Karnataka
48
Area (acres)
Capacity Assumptions
Domestic Warehouse
Total 14
2. Common Facilities: Common facilities to be spread across 1 acre of land
Area Head Area (sqm) Remarks, if any
Offices Administrative Building 400 Security office (6X7) 50 Security restroom (3X6X2) 40 Public Amenity Truck Repair and Maintenance Shop 750 3 in number @ 250
sqm each Mess 252 Medical Room 50 Waste Disposal System 200 Public W/C Facilities (Baths & Toilets) 835 Fire & Safety Office 28 Water Filtering System & Storage 500 Weigh Bridge 500 2 weigh bridges @
250 sqm each Utilities Electrical Substation 500
3. Commercial Complex: The Logistics Park at Hassan will have ~ 4 acres of Commercial
space
Area Head Per Unit (sqm)
Number Total Area sqm
Office Space 75 70 5250 Shops 50 30 1500 Restaurants 100 5 300 Fuel Stations 2500 1 2,500 Dormitory 8 sqm per bed 600 beds 4,800 Budget Hotel 15 sqm per
room 50 rooms 750
Total 14,825
It is assumed that Hassan will require more number of office spaces because it will have a
larger truck terminal and hence more space will be required for transport offices.Further,
due to larger truck terminal the area required for a dormitory will also be higher.
As the site is near industrial area-Hassan Growth Centre, a Budget Hotel is proposed for
business visitors in the area.
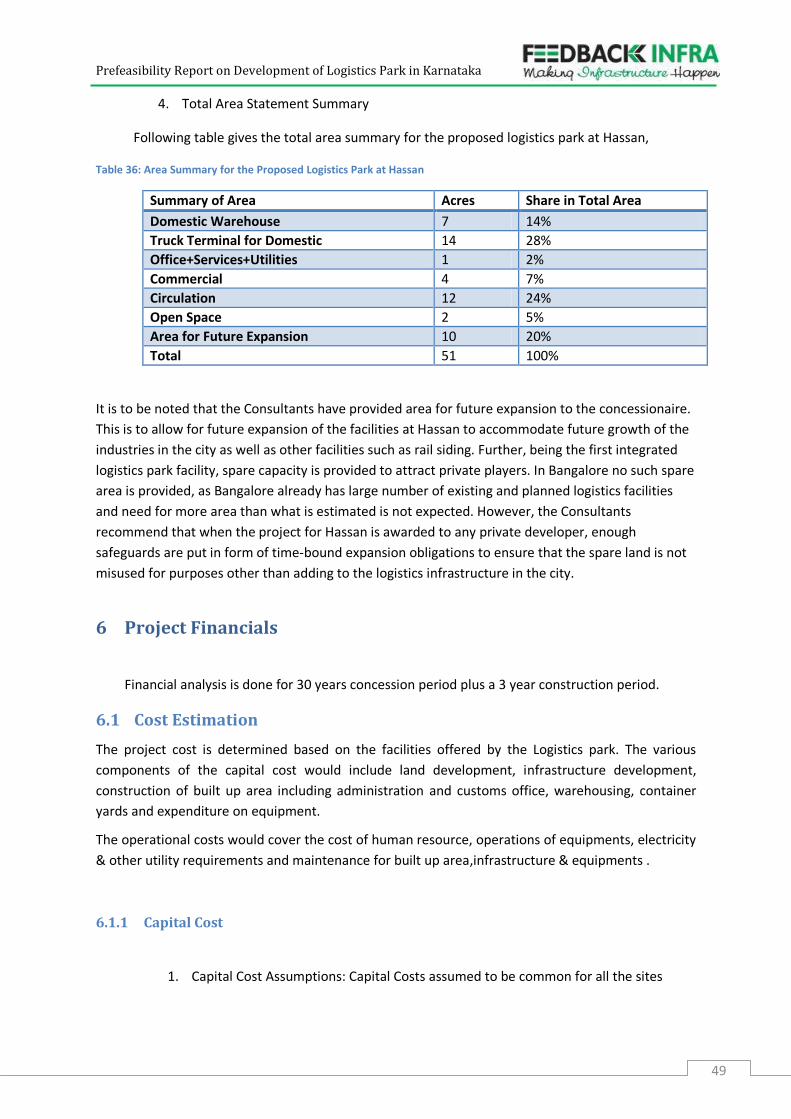
Prefeasibility Report on Development of Logistics Park in Karnataka
49
4. Total Area Statement Summary
Following table gives the total area summary for the proposed logistics park at Hassan,
Table 36: Area Summary for the Proposed Logistics Park at Hassan
Summary of Area Acres Share in Total Area
Domestic Warehouse 7 14%
Truck Terminal for Domestic 14 28%
Office+Services+Utilities 1 2%
Commercial 4 7%
Circulation 12 24%
Open Space 2 5%
Area for Future Expansion 10 20%
Total 51 100%
It is to be noted that the Consultants have provided area for future expansion to the concessionaire.
This is to allow for future expansion of the facilities at Hassan to accommodate future growth of the
industries in the city as well as other facilities such as rail siding. Further, being the first integrated
logistics park facility, spare capacity is provided to attract private players. In Bangalore no such spare
area is provided, as Bangalore already has large number of existing and planned logistics facilities
and need for more area than what is estimated is not expected. However, the Consultants
recommend that when the project for Hassan is awarded to any private developer, enough
safeguards are put in form of time-bound expansion obligations to ensure that the spare land is not
misused for purposes other than adding to the logistics infrastructure in the city.
6 Project Financials
Financial analysis is done for 30 years concession period plus a 3 year construction period.
6.1 Cost Estimation
The project cost is determined based on the facilities offered by the Logistics park. The various
components of the capital cost would include land development, infrastructure development,
construction of built up area including administration and customs office, warehousing, container
yards and expenditure on equipment.
The operational costs would cover the cost of human resource, operations of equipments, electricity
& other utility requirements and maintenance for built up area,infrastructure & equipments .
6.1.1 Capital Cost
1. Capital Cost Assumptions: Capital Costs assumed to be common for all the sites
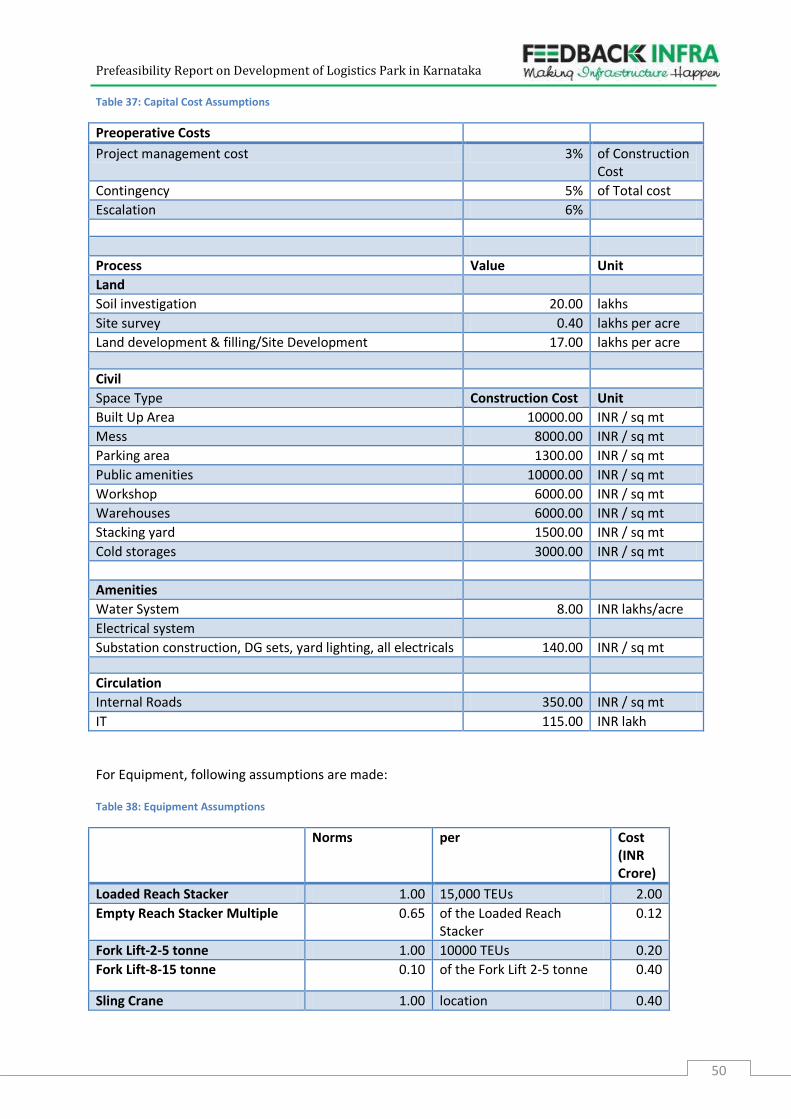
Prefeasibility Report on Development of Logistics Park in Karnataka
50
Table 37: Capital Cost Assumptions
Preoperative Costs
Project management cost 3% of Construction Cost
Contingency 5% of Total cost
Escalation 6%
Process Value Unit
Land
Soil investigation 20.00 lakhs
Site survey 0.40 lakhs per acre
Land development & filling/Site Development 17.00 lakhs per acre
Civil
Space Type Construction Cost Unit
Built Up Area 10000.00 INR / sq mt
Mess 8000.00 INR / sq mt
Parking area 1300.00 INR / sq mt
Public amenities 10000.00 INR / sq mt
Workshop 6000.00 INR / sq mt
Warehouses 6000.00 INR / sq mt
Stacking yard 1500.00 INR / sq mt
Cold storages 3000.00 INR / sq mt
Amenities
Water System 8.00 INR lakhs/acre
Electrical system
Substation construction, DG sets, yard lighting, all electricals 140.00 INR / sq mt
Circulation
Internal Roads 350.00 INR / sq mt
IT 115.00 INR lakh
For Equipment, following assumptions are made:
Table 38: Equipment Assumptions
Norms per Cost (INR Crore)
Loaded Reach Stacker 1.00 15,000 TEUs 2.00
Empty Reach Stacker Multiple 0.65 of the Loaded Reach Stacker
0.12
Fork Lift-2-5 tonne 1.00 10000 TEUs 0.20
Fork Lift-8-15 tonne 0.10 of the Fork Lift 2-5 tonne 0.40
Sling Crane 1.00 location 0.40
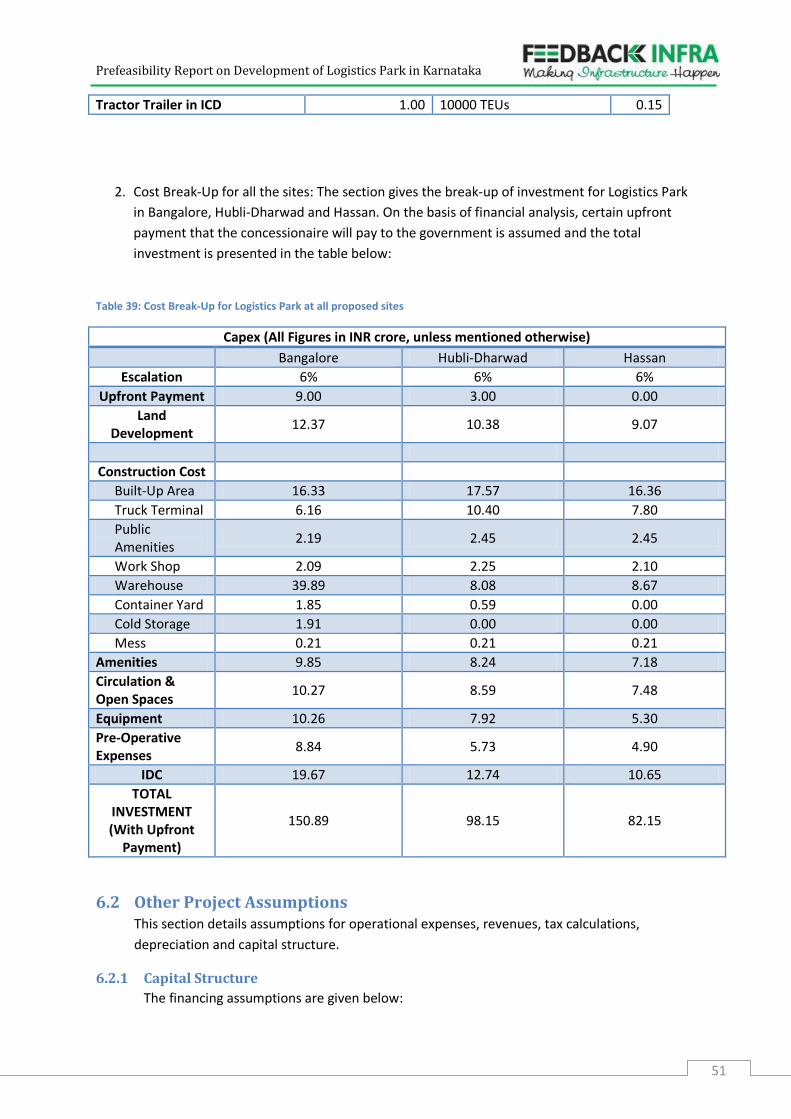
Prefeasibility Report on Development of Logistics Park in Karnataka
51
Tractor Trailer in ICD 1.00 10000 TEUs 0.15
2. Cost Break-Up for all the sites: The section gives the break-up of investment for Logistics Park
in Bangalore, Hubli-Dharwad and Hassan. On the basis of financial analysis, certain upfront
payment that the concessionaire will pay to the government is assumed and the total
investment is presented in the table below:
Table 39: Cost Break-Up for Logistics Park at all proposed sites
Capex (All Figures in INR crore, unless mentioned otherwise)
Bangalore Hubli-Dharwad Hassan
Escalation 6% 6% 6%
Upfront Payment 9.00 3.00 0.00
Land Development
12.37 10.38 9.07
Construction Cost
Built-Up Area 16.33 17.57 16.36
Truck Terminal 6.16 10.40 7.80
Public Amenities
2.19 2.45 2.45
Work Shop 2.09 2.25 2.10
Warehouse 39.89 8.08 8.67
Container Yard 1.85 0.59 0.00
Cold Storage 1.91 0.00 0.00
Mess 0.21 0.21 0.21
Amenities 9.85 8.24 7.18
Circulation & Open Spaces
10.27 8.59 7.48
Equipment 10.26 7.92 5.30
Pre-Operative Expenses
8.84 5.73 4.90
IDC 19.67 12.74 10.65
TOTAL INVESTMENT (With Upfront
Payment)
150.89 98.15 82.15
6.2 Other Project Assumptions This section details assumptions for operational expenses, revenues, tax calculations,
depreciation and capital structure.
6.2.1 Capital Structure
The financing assumptions are given below:
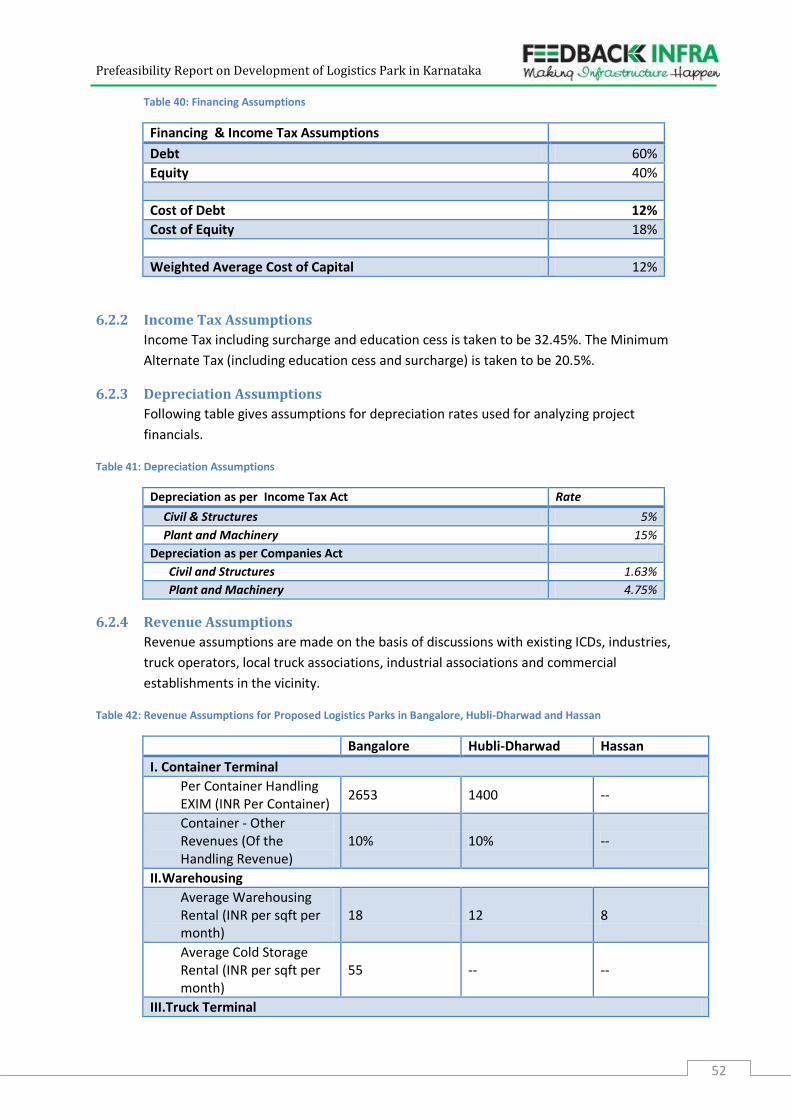
Prefeasibility Report on Development of Logistics Park in Karnataka
52
Table 40: Financing Assumptions
Financing & Income Tax Assumptions
Debt 60%
Equity 40%
Cost of Debt 12%
Cost of Equity 18%
Weighted Average Cost of Capital 12%
6.2.2 Income Tax Assumptions
Income Tax including surcharge and education cess is taken to be 32.45%. The Minimum
Alternate Tax (including education cess and surcharge) is taken to be 20.5%.
6.2.3 Depreciation Assumptions
Following table gives assumptions for depreciation rates used for analyzing project
financials.
Table 41: Depreciation Assumptions
Depreciation as per Income Tax Act Rate
Civil & Structures 5%
Plant and Machinery 15%
Depreciation as per Companies Act
Civil and Structures 1.63%
Plant and Machinery 4.75%
6.2.4 Revenue Assumptions
Revenue assumptions are made on the basis of discussions with existing ICDs, industries,
truck operators, local truck associations, industrial associations and commercial
establishments in the vicinity.
Table 42: Revenue Assumptions for Proposed Logistics Parks in Bangalore, Hubli-Dharwad and Hassan
Bangalore Hubli-Dharwad Hassan
I. Container Terminal
Per Container Handling EXIM (INR Per Container)
2653 1400 --
Container - Other Revenues (Of the Handling Revenue)
10% 10% --
II.Warehousing
Average Warehousing Rental (INR per sqft per month)
18 12 8
Average Cold Storage Rental (INR per sqft per month)
55 -- --
III.Truck Terminal
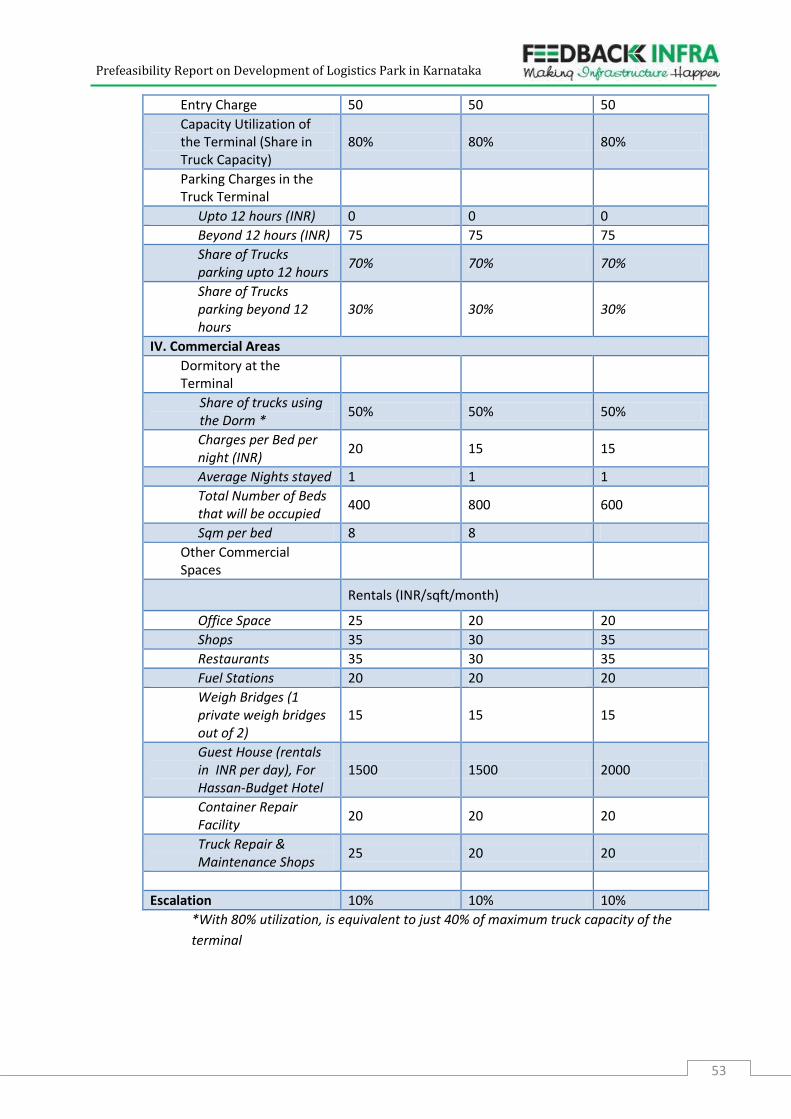
Prefeasibility Report on Development of Logistics Park in Karnataka
53
Entry Charge 50 50 50
Capacity Utilization of the Terminal (Share in Truck Capacity)
80% 80% 80%
Parking Charges in the Truck Terminal
Upto 12 hours (INR) 0 0 0
Beyond 12 hours (INR) 75 75 75
Share of Trucks parking upto 12 hours
70% 70% 70%
Share of Trucks parking beyond 12 hours
30% 30% 30%
IV. Commercial Areas
Dormitory at the Terminal
Share of trucks using the Dorm *
50% 50% 50%
Charges per Bed per night (INR)
20 15 15
Average Nights stayed 1 1 1
Total Number of Beds that will be occupied
400 800 600
Sqm per bed 8 8
Other Commercial Spaces
Rentals (INR/sqft/month)
Office Space 25 20 20
Shops 35 30 35
Restaurants 35 30 35
Fuel Stations 20 20 20
Weigh Bridges (1 private weigh bridges out of 2)
15 15 15
Guest House (rentals in INR per day), For Hassan-Budget Hotel
1500 1500 2000
Container Repair Facility
20 20 20
Truck Repair & Maintenance Shops
25 20 20
Escalation 10% 10% 10%
*With 80% utilization, is equivalent to just 40% of maximum truck capacity of the
terminal
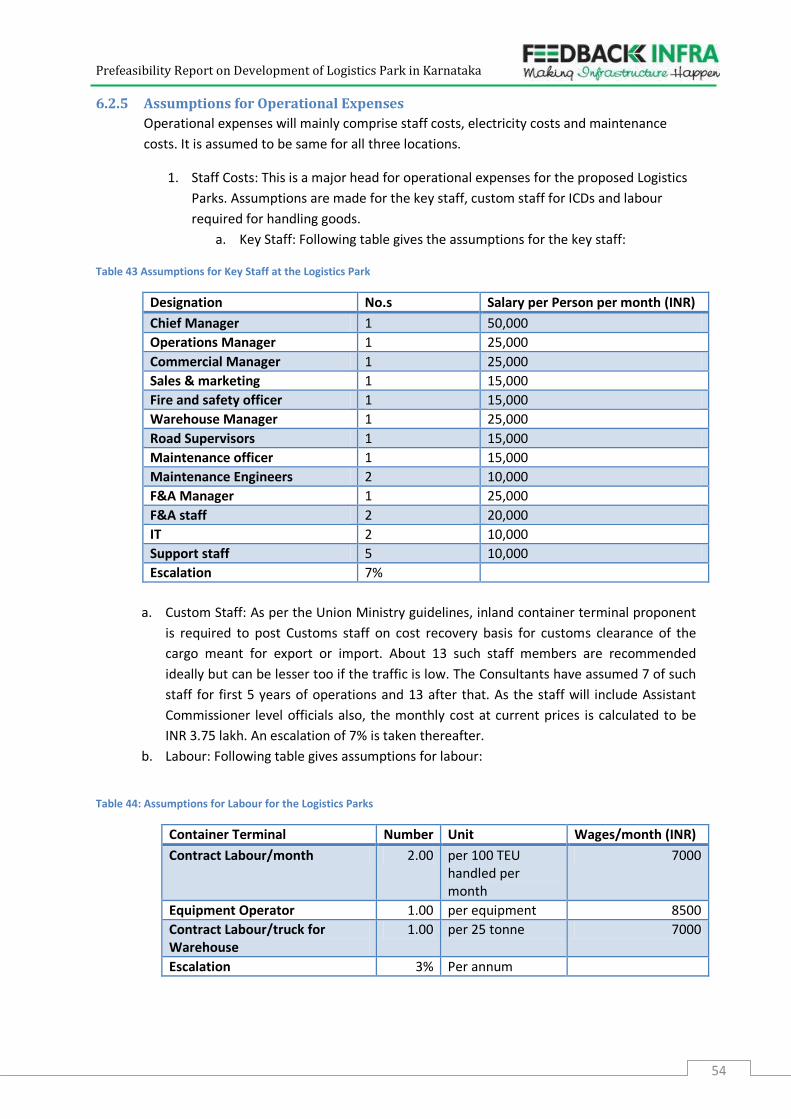
Prefeasibility Report on Development of Logistics Park in Karnataka
54
6.2.5 Assumptions for Operational Expenses
Operational expenses will mainly comprise staff costs, electricity costs and maintenance
costs. It is assumed to be same for all three locations.
1. Staff Costs: This is a major head for operational expenses for the proposed Logistics
Parks. Assumptions are made for the key staff, custom staff for ICDs and labour
required for handling goods.
a. Key Staff: Following table gives the assumptions for the key staff:
Table 43 Assumptions for Key Staff at the Logistics Park
Designation No.s Salary per Person per month (INR)
Chief Manager 1 50,000
Operations Manager 1 25,000
Commercial Manager 1 25,000
Sales & marketing 1 15,000
Fire and safety officer 1 15,000
Warehouse Manager 1 25,000
Road Supervisors 1 15,000
Maintenance officer 1 15,000
Maintenance Engineers 2 10,000
F&A Manager 1 25,000
F&A staff 2 20,000
IT 2 10,000
Support staff 5 10,000
Escalation 7%
a. Custom Staff: As per the Union Ministry guidelines, inland container terminal proponent
is required to post Customs staff on cost recovery basis for customs clearance of the
cargo meant for export or import. About 13 such staff members are recommended
ideally but can be lesser too if the traffic is low. The Consultants have assumed 7 of such
staff for first 5 years of operations and 13 after that. As the staff will include Assistant
Commissioner level officials also, the monthly cost at current prices is calculated to be
INR 3.75 lakh. An escalation of 7% is taken thereafter.
b. Labour: Following table gives assumptions for labour:
Table 44: Assumptions for Labour for the Logistics Parks
Container Terminal Number Unit Wages/month (INR)
Contract Labour/month 2.00 per 100 TEU handled per month
7000
Equipment Operator 1.00 per equipment 8500
Contract Labour/truck for Warehouse
1.00 per 25 tonne 7000
Escalation 3% Per annum
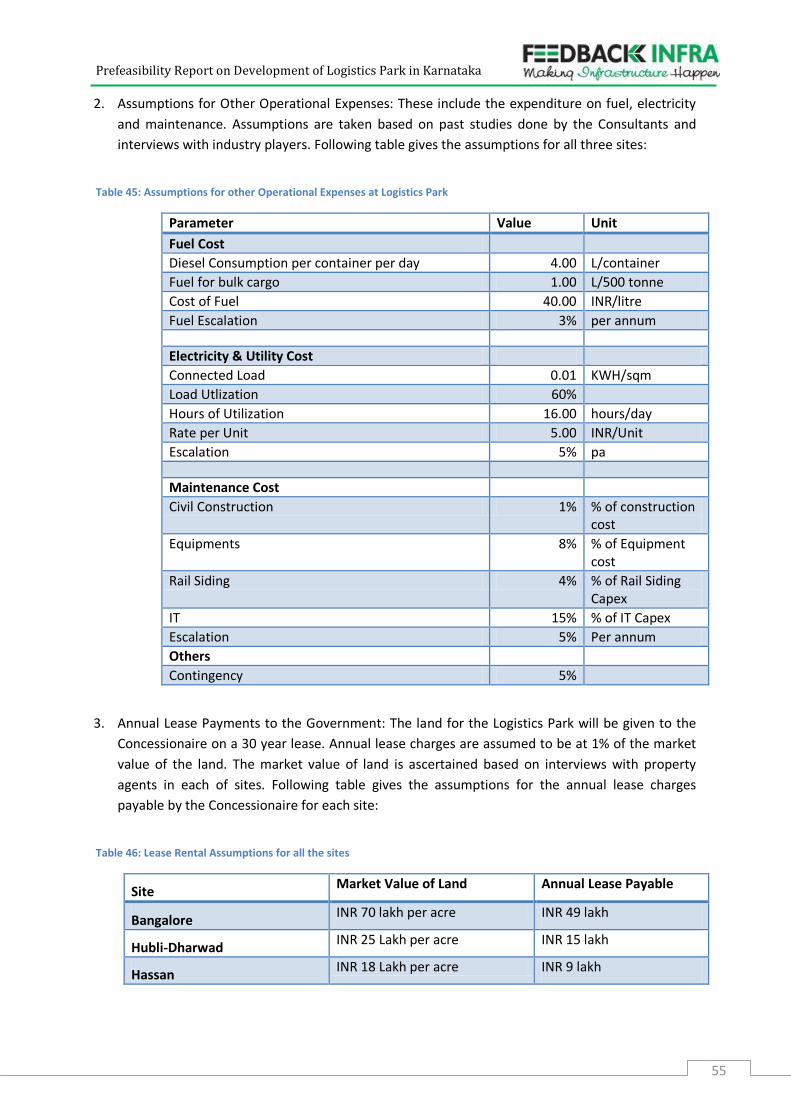
Prefeasibility Report on Development of Logistics Park in Karnataka
55
2. Assumptions for Other Operational Expenses: These include the expenditure on fuel, electricity
and maintenance. Assumptions are taken based on past studies done by the Consultants and
interviews with industry players. Following table gives the assumptions for all three sites:
Table 45: Assumptions for other Operational Expenses at Logistics Park
Parameter Value Unit
Fuel Cost
Diesel Consumption per container per day 4.00 L/container
Fuel for bulk cargo 1.00 L/500 tonne
Cost of Fuel 40.00 INR/litre
Fuel Escalation 3% per annum
Electricity & Utility Cost
Connected Load 0.01 KWH/sqm
Load Utlization 60%
Hours of Utilization 16.00 hours/day
Rate per Unit 5.00 INR/Unit
Escalation 5% pa
Maintenance Cost
Civil Construction 1% % of construction cost
Equipments 8% % of Equipment cost
Rail Siding 4% % of Rail Siding Capex
IT 15% % of IT Capex
Escalation 5% Per annum
Others
Contingency 5%
3. Annual Lease Payments to the Government: The land for the Logistics Park will be given to the
Concessionaire on a 30 year lease. Annual lease charges are assumed to be at 1% of the market
value of the land. The market value of land is ascertained based on interviews with property
agents in each of sites. Following table gives the assumptions for the annual lease charges
payable by the Concessionaire for each site:
Table 46: Lease Rental Assumptions for all the sites
Site Market Value of Land Annual Lease Payable
Bangalore INR 70 lakh per acre INR 49 lakh
Hubli-Dharwad INR 25 Lakh per acre INR 15 lakh
Hassan INR 18 Lakh per acre INR 9 lakh
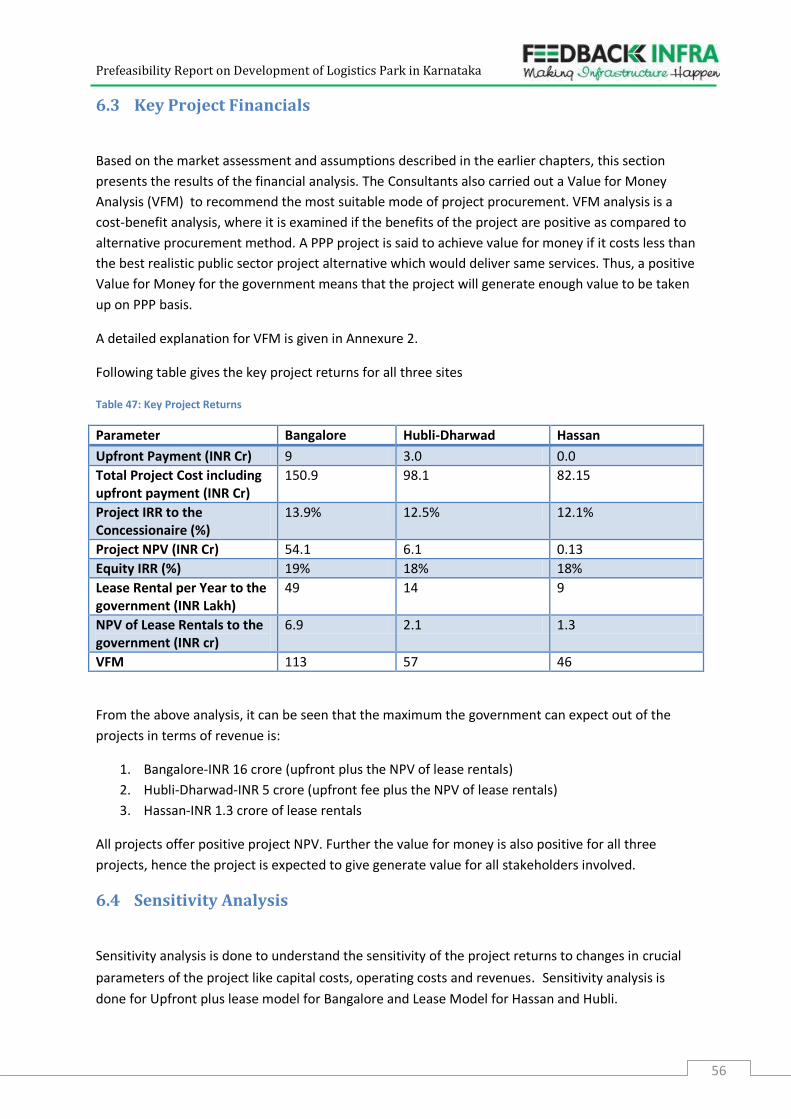
Prefeasibility Report on Development of Logistics Park in Karnataka
56
6.3 Key Project Financials
Based on the market assessment and assumptions described in the earlier chapters, this section
presents the results of the financial analysis. The Consultants also carried out a Value for Money
Analysis (VFM) to recommend the most suitable mode of project procurement. VFM analysis is a
cost-benefit analysis, where it is examined if the benefits of the project are positive as compared to
alternative procurement method. A PPP project is said to achieve value for money if it costs less than
the best realistic public sector project alternative which would deliver same services. Thus, a positive
Value for Money for the government means that the project will generate enough value to be taken
up on PPP basis.
A detailed explanation for VFM is given in Annexure 2.
Following table gives the key project returns for all three sites
Table 47: Key Project Returns
Parameter Bangalore Hubli-Dharwad Hassan
Upfront Payment (INR Cr) 9 3.0 0.0
Total Project Cost including upfront payment (INR Cr)
150.9 98.1 82.15
Project IRR to the Concessionaire (%)
13.9% 12.5% 12.1%
Project NPV (INR Cr) 54.1 6.1 0.13
Equity IRR (%) 19% 18% 18%
Lease Rental per Year to the government (INR Lakh)
49 14 9
NPV of Lease Rentals to the government (INR cr)
6.9 2.1 1.3
VFM 113 57 46
From the above analysis, it can be seen that the maximum the government can expect out of the
projects in terms of revenue is:
1. Bangalore-INR 16 crore (upfront plus the NPV of lease rentals)
2. Hubli-Dharwad-INR 5 crore (upfront fee plus the NPV of lease rentals)
3. Hassan-INR 1.3 crore of lease rentals
All projects offer positive project NPV. Further the value for money is also positive for all three
projects, hence the project is expected to give generate value for all stakeholders involved.
6.4 Sensitivity Analysis
Sensitivity analysis is done to understand the sensitivity of the project returns to changes in crucial
parameters of the project like capital costs, operating costs and revenues. Sensitivity analysis is
done for Upfront plus lease model for Bangalore and Lease Model for Hassan and Hubli.
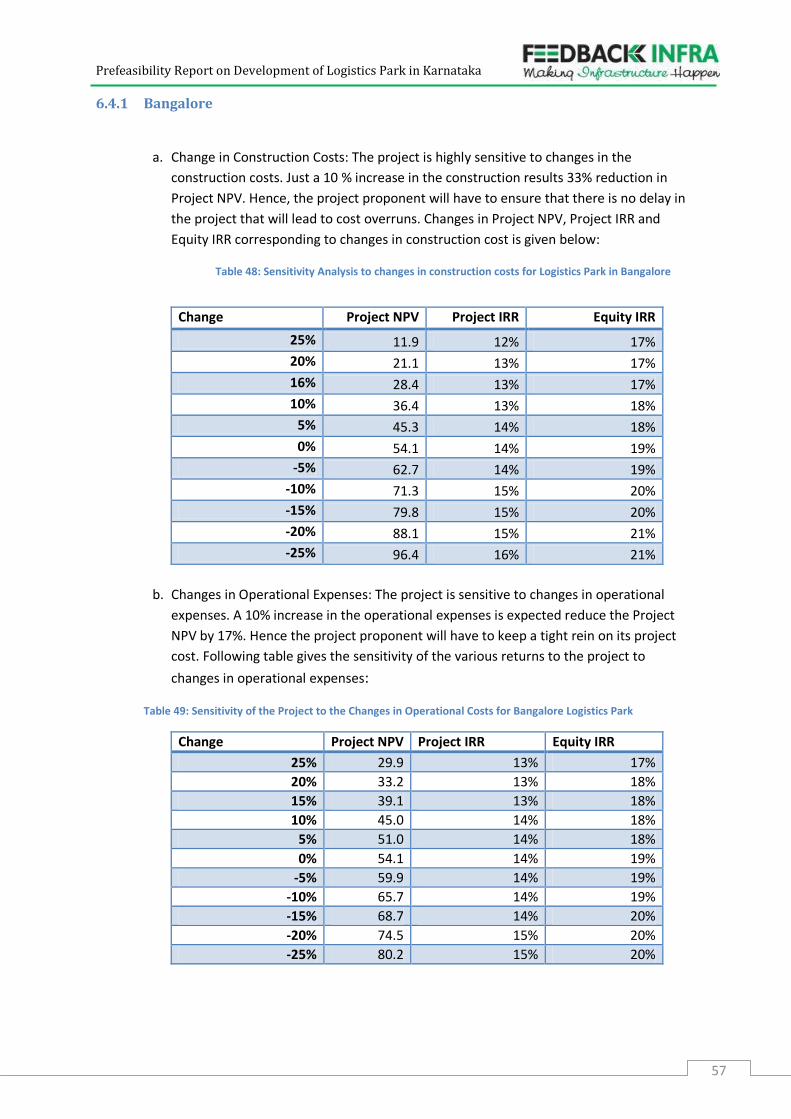
Prefeasibility Report on Development of Logistics Park in Karnataka
57
6.4.1 Bangalore
a. Change in Construction Costs: The project is highly sensitive to changes in the
construction costs. Just a 10 % increase in the construction results 33% reduction in
Project NPV. Hence, the project proponent will have to ensure that there is no delay in
the project that will lead to cost overruns. Changes in Project NPV, Project IRR and
Equity IRR corresponding to changes in construction cost is given below:
Table 48: Sensitivity Analysis to changes in construction costs for Logistics Park in Bangalore
Change Project NPV Project IRR Equity IRR
25% 11.9 12% 17%
20% 21.1 13% 17%
16% 28.4 13% 17%
10% 36.4 13% 18%
5% 45.3 14% 18%
0% 54.1 14% 19%
-5% 62.7 14% 19%
-10% 71.3 15% 20%
-15% 79.8 15% 20%
-20% 88.1 15% 21%
-25% 96.4 16% 21%
b. Changes in Operational Expenses: The project is sensitive to changes in operational
expenses. A 10% increase in the operational expenses is expected reduce the Project
NPV by 17%. Hence the project proponent will have to keep a tight rein on its project
cost. Following table gives the sensitivity of the various returns to the project to
changes in operational expenses:
Table 49: Sensitivity of the Project to the Changes in Operational Costs for Bangalore Logistics Park
Change Project NPV Project IRR Equity IRR
25% 29.9 13% 17%
20% 33.2 13% 18%
15% 39.1 13% 18%
10% 45.0 14% 18%
5% 51.0 14% 18%
0% 54.1 14% 19%
-5% 59.9 14% 19%
-10% 65.7 14% 19%
-15% 68.7 14% 20%
-20% 74.5 15% 20%
-25% 80.2 15% 20%
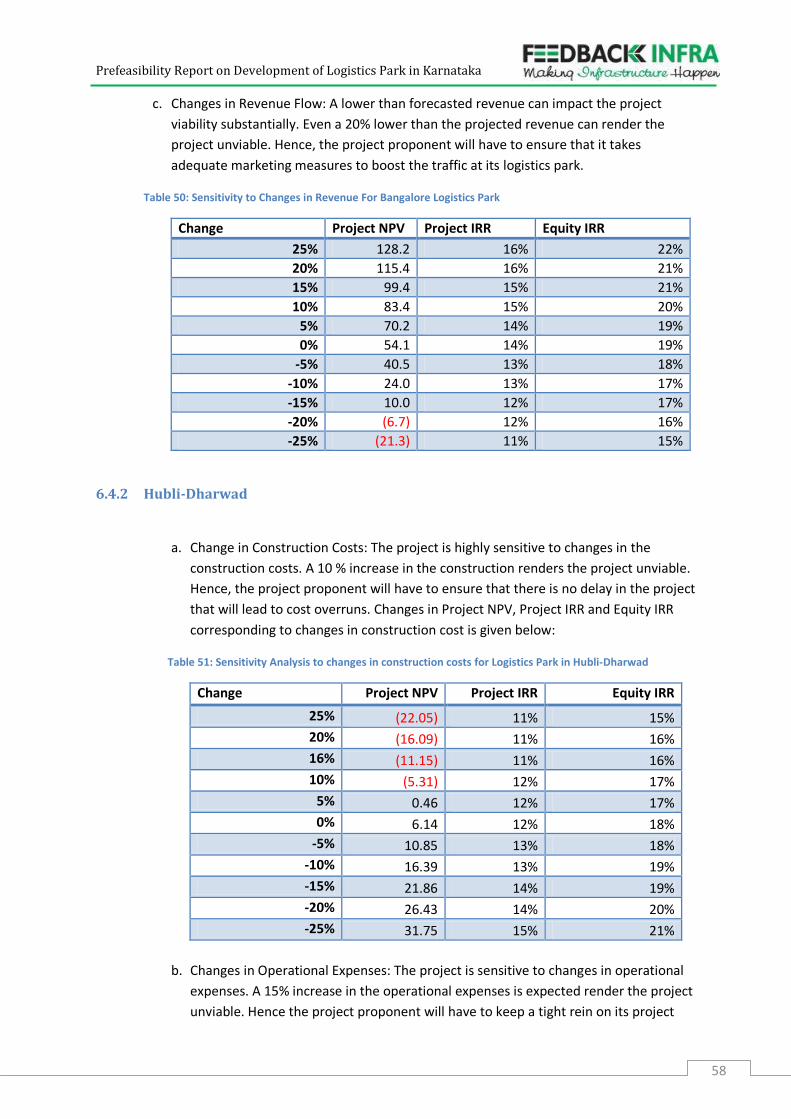
Prefeasibility Report on Development of Logistics Park in Karnataka
58
c. Changes in Revenue Flow: A lower than forecasted revenue can impact the project
viability substantially. Even a 20% lower than the projected revenue can render the
project unviable. Hence, the project proponent will have to ensure that it takes
adequate marketing measures to boost the traffic at its logistics park.
Table 50: Sensitivity to Changes in Revenue For Bangalore Logistics Park
Change Project NPV Project IRR Equity IRR
25% 128.2 16% 22%
20% 115.4 16% 21%
15% 99.4 15% 21%
10% 83.4 15% 20%
5% 70.2 14% 19%
0% 54.1 14% 19%
-5% 40.5 13% 18%
-10% 24.0 13% 17%
-15% 10.0 12% 17%
-20% (6.7) 12% 16%
-25% (21.3) 11% 15%
6.4.2 Hubli-Dharwad
a. Change in Construction Costs: The project is highly sensitive to changes in the
construction costs. A 10 % increase in the construction renders the project unviable.
Hence, the project proponent will have to ensure that there is no delay in the project
that will lead to cost overruns. Changes in Project NPV, Project IRR and Equity IRR
corresponding to changes in construction cost is given below:
Table 51: Sensitivity Analysis to changes in construction costs for Logistics Park in Hubli-Dharwad
Change Project NPV Project IRR Equity IRR
25% (22.05) 11% 15%
20% (16.09) 11% 16%
16% (11.15) 11% 16%
10% (5.31) 12% 17%
5% 0.46 12% 17%
0% 6.14 12% 18%
-5% 10.85 13% 18%
-10% 16.39 13% 19%
-15% 21.86 14% 19%
-20% 26.43 14% 20%
-25% 31.75 15% 21%
b. Changes in Operational Expenses: The project is sensitive to changes in operational
expenses. A 15% increase in the operational expenses is expected render the project
unviable. Hence the project proponent will have to keep a tight rein on its project
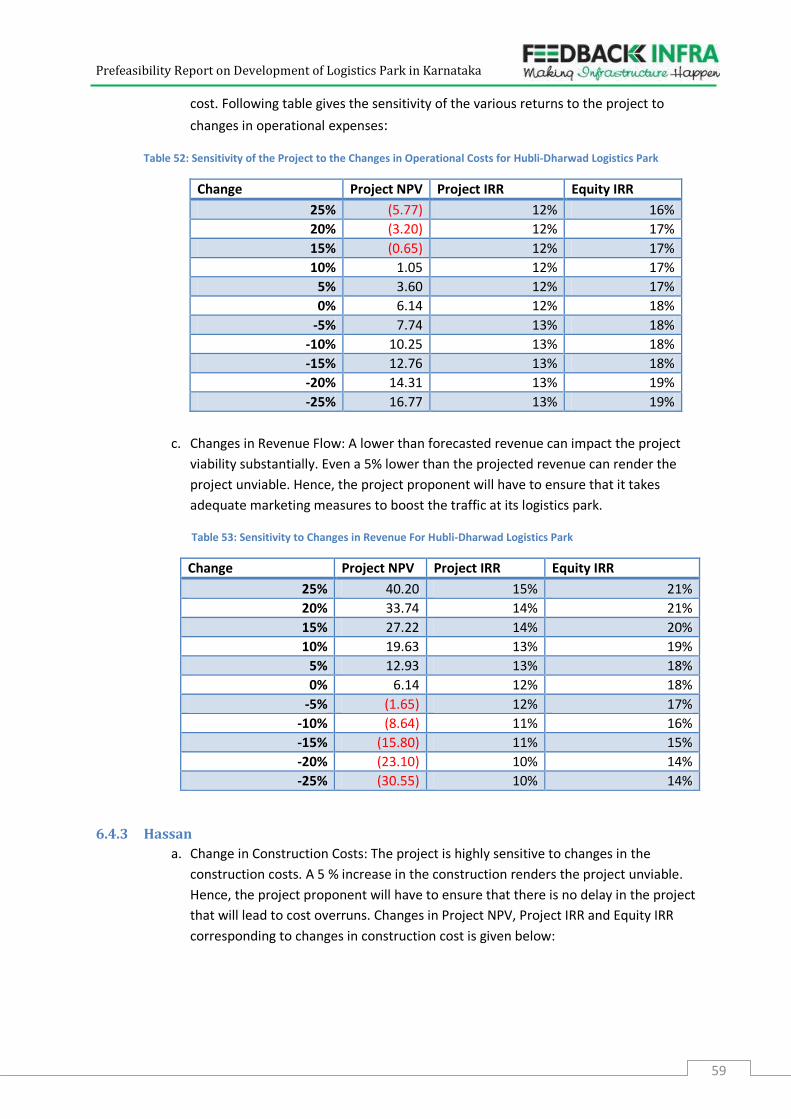
Prefeasibility Report on Development of Logistics Park in Karnataka
59
cost. Following table gives the sensitivity of the various returns to the project to
changes in operational expenses:
Table 52: Sensitivity of the Project to the Changes in Operational Costs for Hubli-Dharwad Logistics Park
Change Project NPV Project IRR Equity IRR
25% (5.77) 12% 16%
20% (3.20) 12% 17%
15% (0.65) 12% 17%
10% 1.05 12% 17%
5% 3.60 12% 17%
0% 6.14 12% 18%
-5% 7.74 13% 18%
-10% 10.25 13% 18%
-15% 12.76 13% 18%
-20% 14.31 13% 19%
-25% 16.77 13% 19%
c. Changes in Revenue Flow: A lower than forecasted revenue can impact the project
viability substantially. Even a 5% lower than the projected revenue can render the
project unviable. Hence, the project proponent will have to ensure that it takes
adequate marketing measures to boost the traffic at its logistics park.
Table 53: Sensitivity to Changes in Revenue For Hubli-Dharwad Logistics Park
Change Project NPV Project IRR Equity IRR
25% 40.20 15% 21%
20% 33.74 14% 21%
15% 27.22 14% 20%
10% 19.63 13% 19%
5% 12.93 13% 18%
0% 6.14 12% 18%
-5% (1.65) 12% 17%
-10% (8.64) 11% 16%
-15% (15.80) 11% 15%
-20% (23.10) 10% 14%
-25% (30.55) 10% 14%
6.4.3 Hassan
a. Change in Construction Costs: The project is highly sensitive to changes in the
construction costs. A 5 % increase in the construction renders the project unviable.
Hence, the project proponent will have to ensure that there is no delay in the project
that will lead to cost overruns. Changes in Project NPV, Project IRR and Equity IRR
corresponding to changes in construction cost is given below:
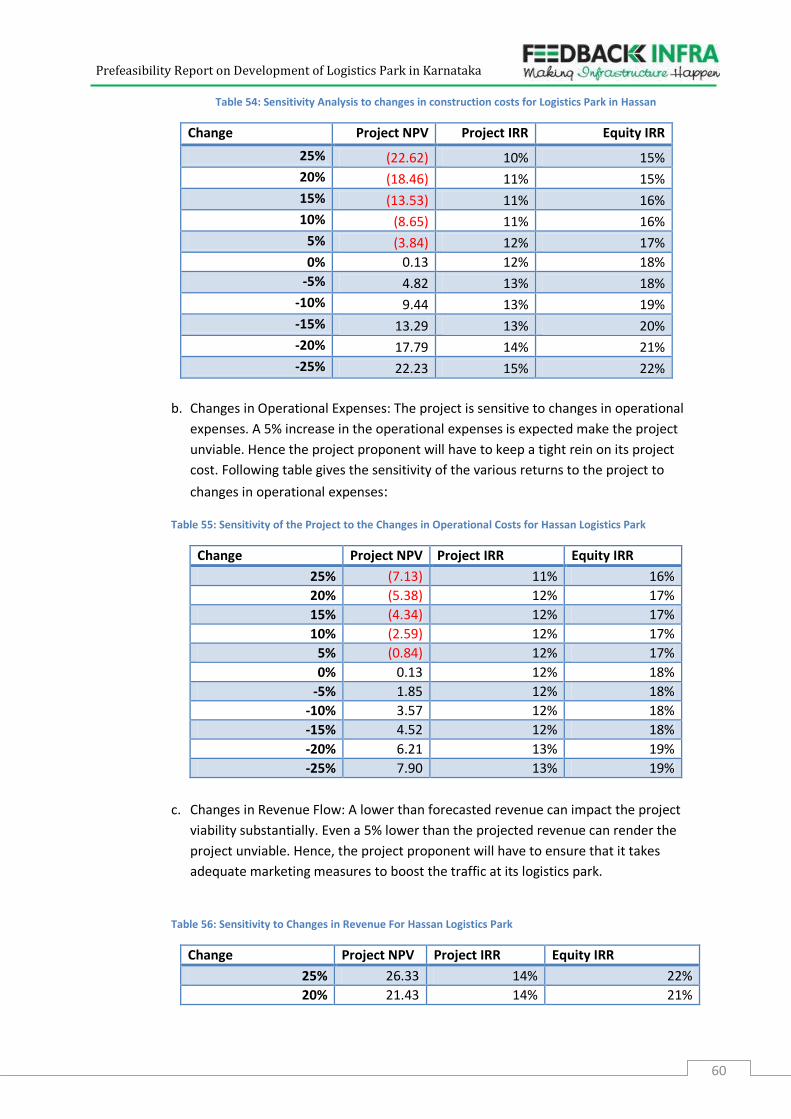
Prefeasibility Report on Development of Logistics Park in Karnataka
60
Table 54: Sensitivity Analysis to changes in construction costs for Logistics Park in Hassan
Change Project NPV Project IRR Equity IRR
25% (22.62) 10% 15%
20% (18.46) 11% 15%
15% (13.53) 11% 16%
10% (8.65) 11% 16%
5% (3.84) 12% 17%
0% 0.13 12% 18%
-5% 4.82 13% 18%
-10% 9.44 13% 19%
-15% 13.29 13% 20%
-20% 17.79 14% 21%
-25% 22.23 15% 22%
b. Changes in Operational Expenses: The project is sensitive to changes in operational
expenses. A 5% increase in the operational expenses is expected make the project
unviable. Hence the project proponent will have to keep a tight rein on its project
cost. Following table gives the sensitivity of the various returns to the project to
changes in operational expenses:
Table 55: Sensitivity of the Project to the Changes in Operational Costs for Hassan Logistics Park
Change Project NPV Project IRR Equity IRR
25% (7.13) 11% 16%
20% (5.38) 12% 17%
15% (4.34) 12% 17%
10% (2.59) 12% 17%
5% (0.84) 12% 17%
0% 0.13 12% 18%
-5% 1.85 12% 18%
-10% 3.57 12% 18%
-15% 4.52 12% 18%
-20% 6.21 13% 19%
-25% 7.90 13% 19%
c. Changes in Revenue Flow: A lower than forecasted revenue can impact the project
viability substantially. Even a 5% lower than the projected revenue can render the
project unviable. Hence, the project proponent will have to ensure that it takes
adequate marketing measures to boost the traffic at its logistics park.
Table 56: Sensitivity to Changes in Revenue For Hassan Logistics Park
Change Project NPV Project IRR Equity IRR
25% 26.33 14% 22%
20% 21.43 14% 21%
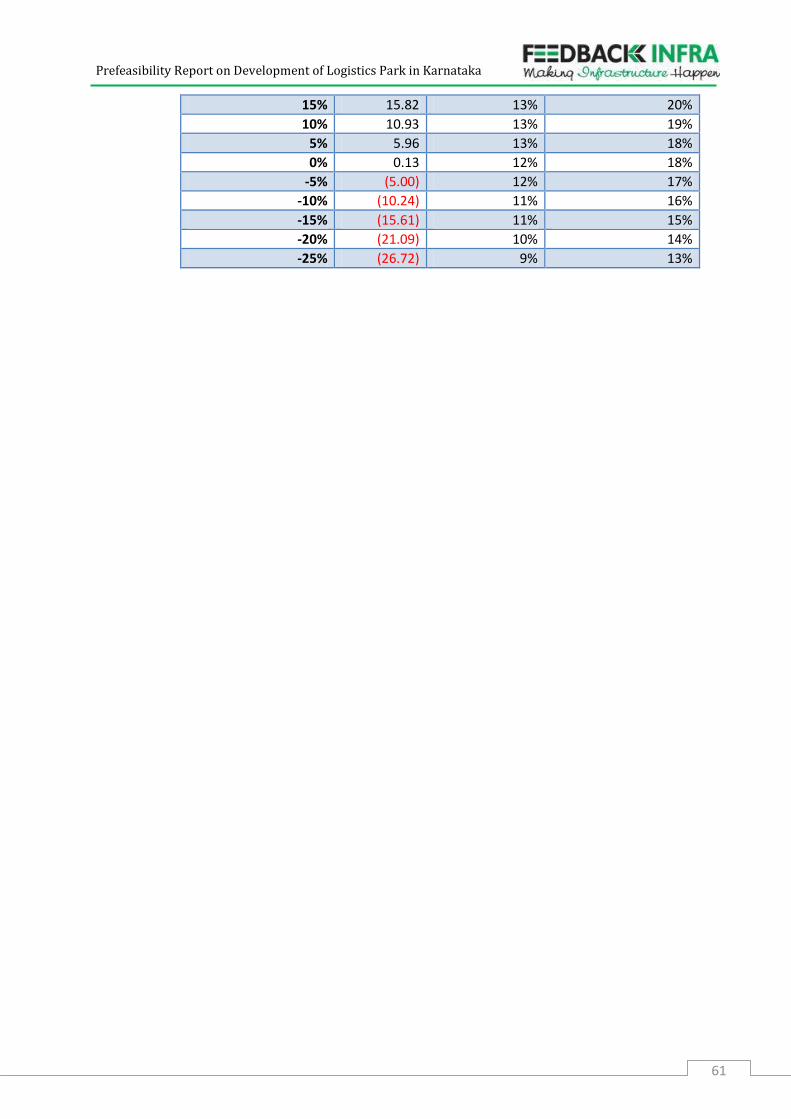
Prefeasibility Report on Development of Logistics Park in Karnataka
61
15% 15.82 13% 20%
10% 10.93 13% 19%
5% 5.96 13% 18%
0% 0.13 12% 18%
-5% (5.00) 12% 17%
-10% (10.24) 11% 16%
-15% (15.61) 11% 15%
-20% (21.09) 10% 14%
-25% (26.72) 9% 13%
Prefeasibility Report on Development of Logistics Park in Karnataka
62
7 Statutory & Legal Framework
Logistics sector is not a highly regulated sector, except for facilities which are related to export
and import of goods, where prior permission from Ministry of Commerce and Industry is
required. There are no restrictions on tariffs to be charged for logistics services and they are
determined competitively. However, there are several policies that govern and impact the sector
at central and state level.
7.1. Legal & Regulatory Framework
I. Central Government Policies and Regulations Impacting Logistics Sector
1. Goods and Service Tax Regime:
India plans to introduce Goods and Service Tax (GST) in the country, which is a single tax
umbrella for goods and services. While the rollout of the Goods and Services Tax is delayed, it is
expected that implementation of this tax regime would lead to consolidation of warehousing
space in India, with players preferring larger warehouses serving multiple states. The GST is
expected to fuel the demand for large integrated logistics facilities in India.
2. Foreign Direct Investment Regulations:
For foreign investors, Foreign Direct Investment norms are liberalized for most of the logistics
activities, except in sectors like air courier services and air cargo logistics. FDI regulations
governing the industry are as given below.
i. 100% FDI under automatic route (no prior government approval required) is allowed in all
the logistics services except:
a. FDI upto 100% in courier services require a prior Foreign Investment Promotion
Board approval
b. FDI upto 49% under automatic route is permitted for air transport services including
air cargo services
3. Union Ministry of Commerce Guidelines for setting up an ICD/CFS
Setting up logistics facilities for domestic use does not require prior government approval;
however facilities relating to export and import of goods come under the ambit of the Union
Ministry of Commerce and Industry. This implies that setting up of an inland container terminal
(ICD/CFS under the Customs Act, 1962) will require a prior Ministry of Commerce and Industry
approval. Following procedures need to be adhered to for setting up an inland container
terminal for export and import purpose:
a. Application for setting up an inland container terminal is required to be submitted to
the Ministry of Commerce and separate copies are to be submitted to the
jurisdictional Commissioner of Customs, who will give his views to the Central Board
Prefeasibility Report on Development of Logistics Park in Karnataka
63
of Excise and Customs. The project proponent will be required to submit a copy of
the feasibility report with the application
b. The Ministry of Commerce then will forward the proposal to the Inter-Ministerial
Committee (IMC), which will consider the proposal and give clearance for setting up
of the Inland Container Terminal. IMC has representation from Department of
Commerce, Department of Revenue, Department of Ports and Shipping and Ministry
of Railways.
c. On acceptance of the proposal, a Letter of Intent will be issued to the project
proponent.
d. The project proponent, then, is required to set up the infrastructure within one year
from the date of approval. Extension can be granted via prior approval of the
Ministry of Commerce
e. The project proponent is required to send quarterly progress reports to the
Department of Commerce
f. After the infrastructure has been put up and the facility has met all the
requirements of Commissioner of Customs, the government will accord final
approval to the project proponent
g. The inland container terminal proponent will also be required to post Customs staff
on cost recovery basis for customs clearance of the cargo meant for export or
import
II. State Policies and Incentives for Logistics Parks
Karnataka Government has promulgated the Infrastructure Policy-2007, with Logistics being
one of the beneficiary sectors. As per the policy, the concessions for public-private
partnership projects under Logistics sector will get following incentives:
1. Government land will be provided, subject to availability at concessional rates
2. Where the infrastructure project is not viable, the project proponent can acquire
additional land on same terms and conditions as for the main project to develop suitable
commercial activities
3. Concessions on stamp duty and land conversion fines
7.2. Key Issues
Logistics at present is a highly fragmented sector. While ICD/CFSs come under the purview of
Ministry of Commerce and Industry, rest of the activities in the Logistics sector is largely
unregulated and comprises a large proportion of unorganized players, especially in the
warehousing sector. The roll-out of GST is expected to bring about integration in this industry.
However, there has been a delay in roll-out of GST, with even the Union Budget of 2012-13 not
setting any timelines for this.
Another long standing issue that Logistics Sector has been grappling with is accordance of
‘infrastructure status’ to claim tax holiday under the 80 IA section of the Income Tax Act. Even
for ICD/CFSs, there is an uncertainty on whether it can be treated as an infrastructure facility to
Prefeasibility Report on Development of Logistics Park in Karnataka
64
claim tax holiday under the 80 IA section of the Income Tax Act. The present definition of
‘infrastructure facility’ does not specifically cover Container Freight Stations and Inland
Container Depot, which creates difficulties and disputes in claiming income tax benefits under
this section.
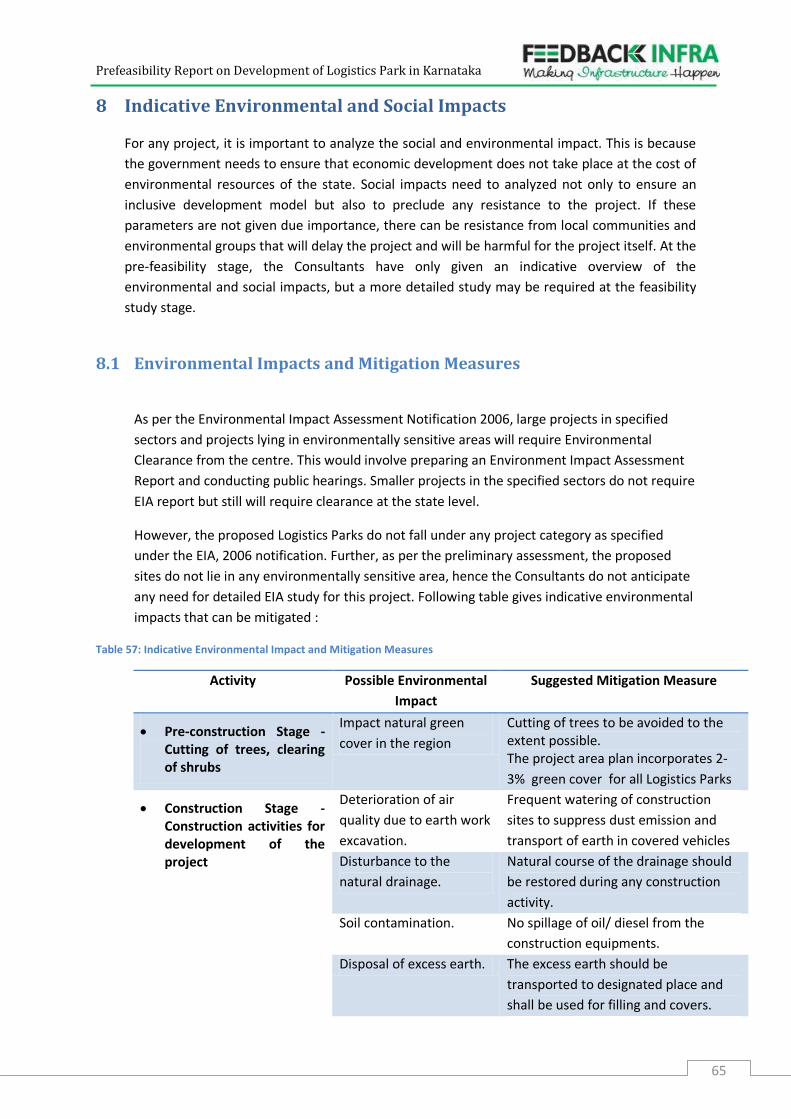
Prefeasibility Report on Development of Logistics Park in Karnataka
65
8 Indicative Environmental and Social Impacts
For any project, it is important to analyze the social and environmental impact. This is because
the government needs to ensure that economic development does not take place at the cost of
environmental resources of the state. Social impacts need to analyzed not only to ensure an
inclusive development model but also to preclude any resistance to the project. If these
parameters are not given due importance, there can be resistance from local communities and
environmental groups that will delay the project and will be harmful for the project itself. At the
pre-feasibility stage, the Consultants have only given an indicative overview of the
environmental and social impacts, but a more detailed study may be required at the feasibility
study stage.
8.1 Environmental Impacts and Mitigation Measures
As per the Environmental Impact Assessment Notification 2006, large projects in specified
sectors and projects lying in environmentally sensitive areas will require Environmental
Clearance from the centre. This would involve preparing an Environment Impact Assessment
Report and conducting public hearings. Smaller projects in the specified sectors do not require
EIA report but still will require clearance at the state level.
However, the proposed Logistics Parks do not fall under any project category as specified
under the EIA, 2006 notification. Further, as per the preliminary assessment, the proposed
sites do not lie in any environmentally sensitive area, hence the Consultants do not anticipate
any need for detailed EIA study for this project. Following table gives indicative environmental
impacts that can be mitigated :
Table 57: Indicative Environmental Impact and Mitigation Measures
Activity Possible Environmental
Impact
Suggested Mitigation Measure
Pre-construction Stage - Cutting of trees, clearing of shrubs
Impact natural green
cover in the region
Cutting of trees to be avoided to the extent possible. The project area plan incorporates 2-
3% green cover for all Logistics Parks
Construction Stage - Construction activities for development of the project
Deterioration of air
quality due to earth work
excavation.
Frequent watering of construction
sites to suppress dust emission and
transport of earth in covered vehicles
Disturbance to the
natural drainage.
Natural course of the drainage should
be restored during any construction
activity.
Soil contamination. No spillage of oil/ diesel from the
construction equipments.
Disposal of excess earth. The excess earth should be
transported to designated place and
shall be used for filling and covers.
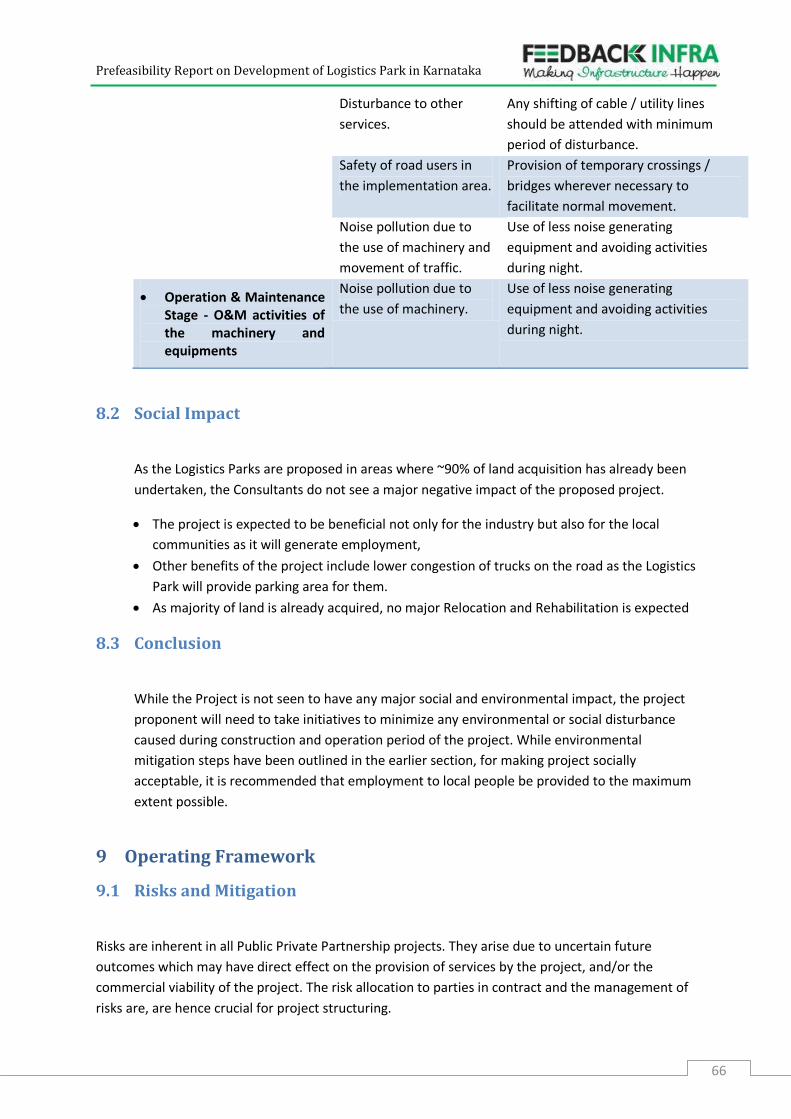
Prefeasibility Report on Development of Logistics Park in Karnataka
66
Disturbance to other
services.
Any shifting of cable / utility lines
should be attended with minimum
period of disturbance.
Safety of road users in
the implementation area.
Provision of temporary crossings /
bridges wherever necessary to
facilitate normal movement.
Noise pollution due to
the use of machinery and
movement of traffic.
Use of less noise generating
equipment and avoiding activities
during night.
Operation & Maintenance Stage - O&M activities of the machinery and equipments
Noise pollution due to
the use of machinery.
Use of less noise generating
equipment and avoiding activities
during night.
8.2 Social Impact
As the Logistics Parks are proposed in areas where ~90% of land acquisition has already been
undertaken, the Consultants do not see a major negative impact of the proposed project.
The project is expected to be beneficial not only for the industry but also for the local
communities as it will generate employment,
Other benefits of the project include lower congestion of trucks on the road as the Logistics
Park will provide parking area for them.
As majority of land is already acquired, no major Relocation and Rehabilitation is expected
8.3 Conclusion
While the Project is not seen to have any major social and environmental impact, the project
proponent will need to take initiatives to minimize any environmental or social disturbance
caused during construction and operation period of the project. While environmental
mitigation steps have been outlined in the earlier section, for making project socially
acceptable, it is recommended that employment to local people be provided to the maximum
extent possible.
9 Operating Framework
9.1 Risks and Mitigation
Risks are inherent in all Public Private Partnership projects. They arise due to uncertain future
outcomes which may have direct effect on the provision of services by the project, and/or the
commercial viability of the project. The risk allocation to parties in contract and the management of
risks are, are hence crucial for project structuring.
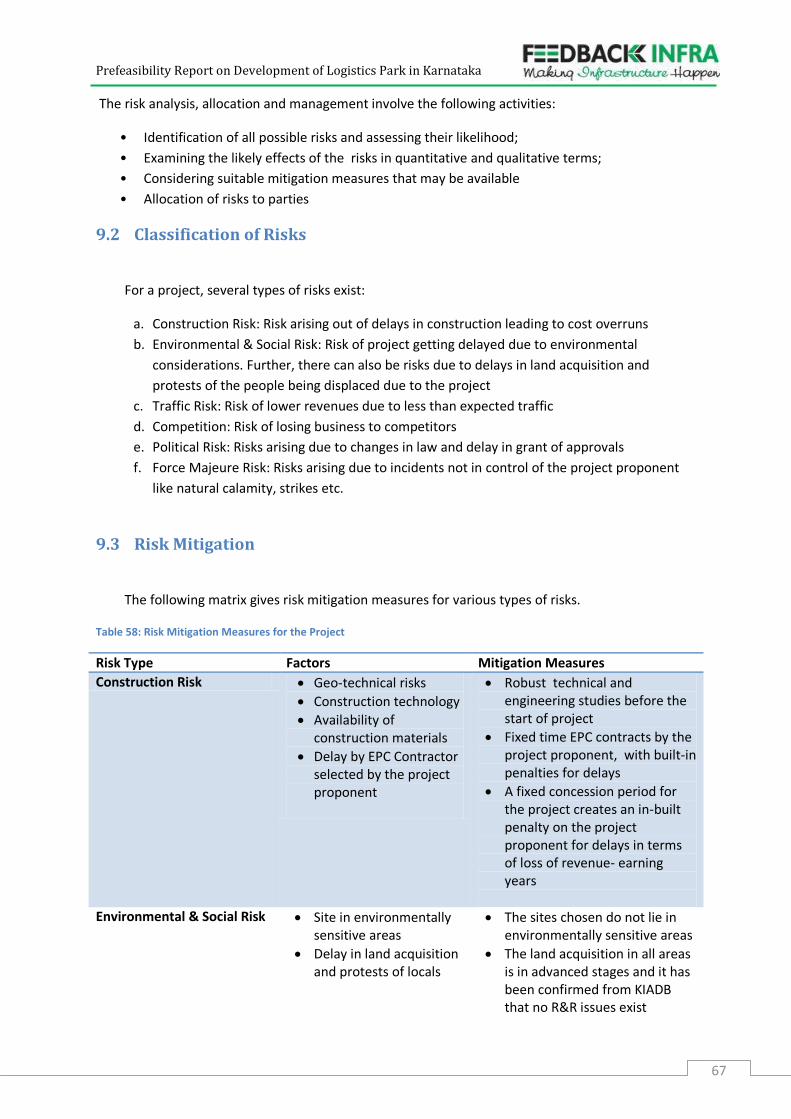
Prefeasibility Report on Development of Logistics Park in Karnataka
67
The risk analysis, allocation and management involve the following activities:
• Identification of all possible risks and assessing their likelihood;
• Examining the likely effects of the risks in quantitative and qualitative terms;
• Considering suitable mitigation measures that may be available
• Allocation of risks to parties
9.2 Classification of Risks
For a project, several types of risks exist:
a. Construction Risk: Risk arising out of delays in construction leading to cost overruns
b. Environmental & Social Risk: Risk of project getting delayed due to environmental
considerations. Further, there can also be risks due to delays in land acquisition and
protests of the people being displaced due to the project
c. Traffic Risk: Risk of lower revenues due to less than expected traffic
d. Competition: Risk of losing business to competitors
e. Political Risk: Risks arising due to changes in law and delay in grant of approvals
f. Force Majeure Risk: Risks arising due to incidents not in control of the project proponent
like natural calamity, strikes etc.
9.3 Risk Mitigation
The following matrix gives risk mitigation measures for various types of risks.
Table 58: Risk Mitigation Measures for the Project
Risk Type Factors Mitigation Measures
Construction Risk Geo-technical risks
Construction technology
Availability of construction materials
Delay by EPC Contractor selected by the project proponent
Robust technical and engineering studies before the start of project
Fixed time EPC contracts by the project proponent, with built-in penalties for delays
A fixed concession period for the project creates an in-built penalty on the project proponent for delays in terms of loss of revenue- earning years
Environmental & Social Risk Site in environmentally
sensitive areas
Delay in land acquisition and protests of locals
The sites chosen do not lie in environmentally sensitive areas
The land acquisition in all areas is in advanced stages and it has been confirmed from KIADB that no R&R issues exist
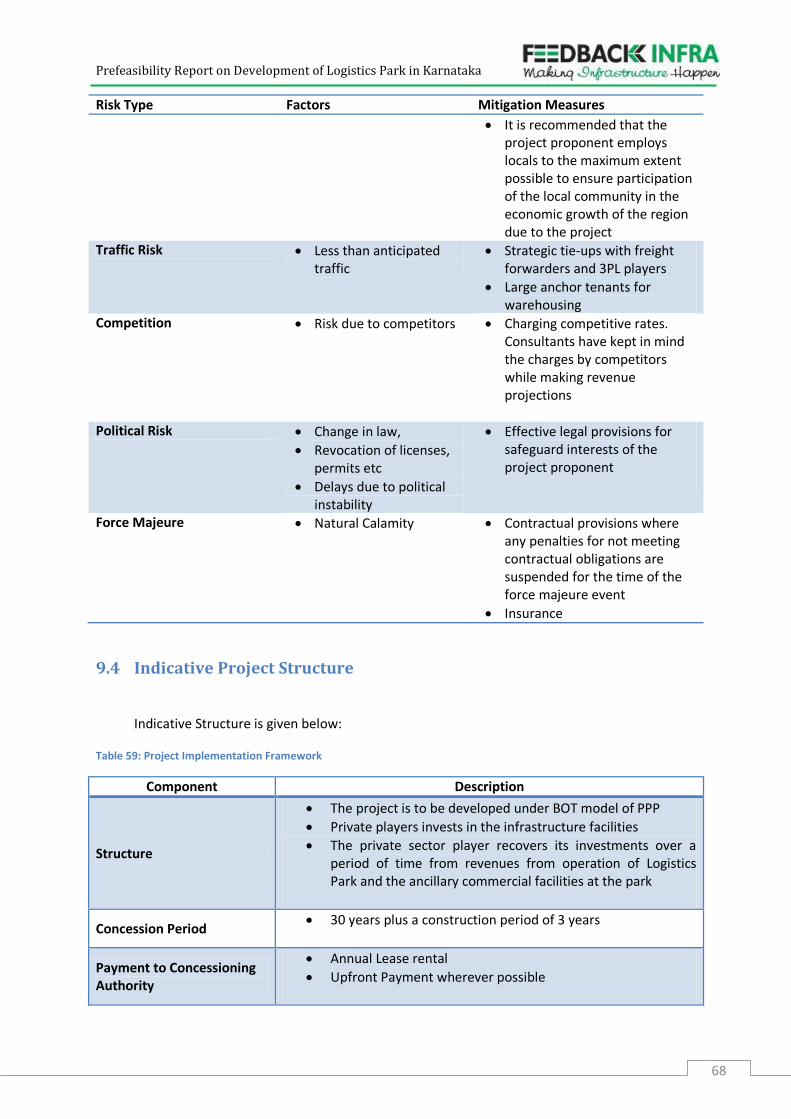
Prefeasibility Report on Development of Logistics Park in Karnataka
68
Risk Type Factors Mitigation Measures
It is recommended that the project proponent employs locals to the maximum extent possible to ensure participation of the local community in the economic growth of the region due to the project
Traffic Risk Less than anticipated traffic
Strategic tie-ups with freight forwarders and 3PL players
Large anchor tenants for warehousing
Competition Risk due to competitors Charging competitive rates. Consultants have kept in mind the charges by competitors while making revenue projections
Political Risk Change in law,
Revocation of licenses, permits etc
Delays due to political instability
Effective legal provisions for safeguard interests of the project proponent
Force Majeure Natural Calamity Contractual provisions where any penalties for not meeting contractual obligations are suspended for the time of the force majeure event
Insurance
9.4 Indicative Project Structure
Indicative Structure is given below:
Table 59: Project Implementation Framework
Component Description
Structure
The project is to be developed under BOT model of PPP
Private players invests in the infrastructure facilities
The private sector player recovers its investments over a period of time from revenues from operation of Logistics Park and the ancillary commercial facilities at the park
Concession Period 30 years plus a construction period of 3 years
Payment to Concessioning Authority
Annual Lease rental
Upfront Payment wherever possible
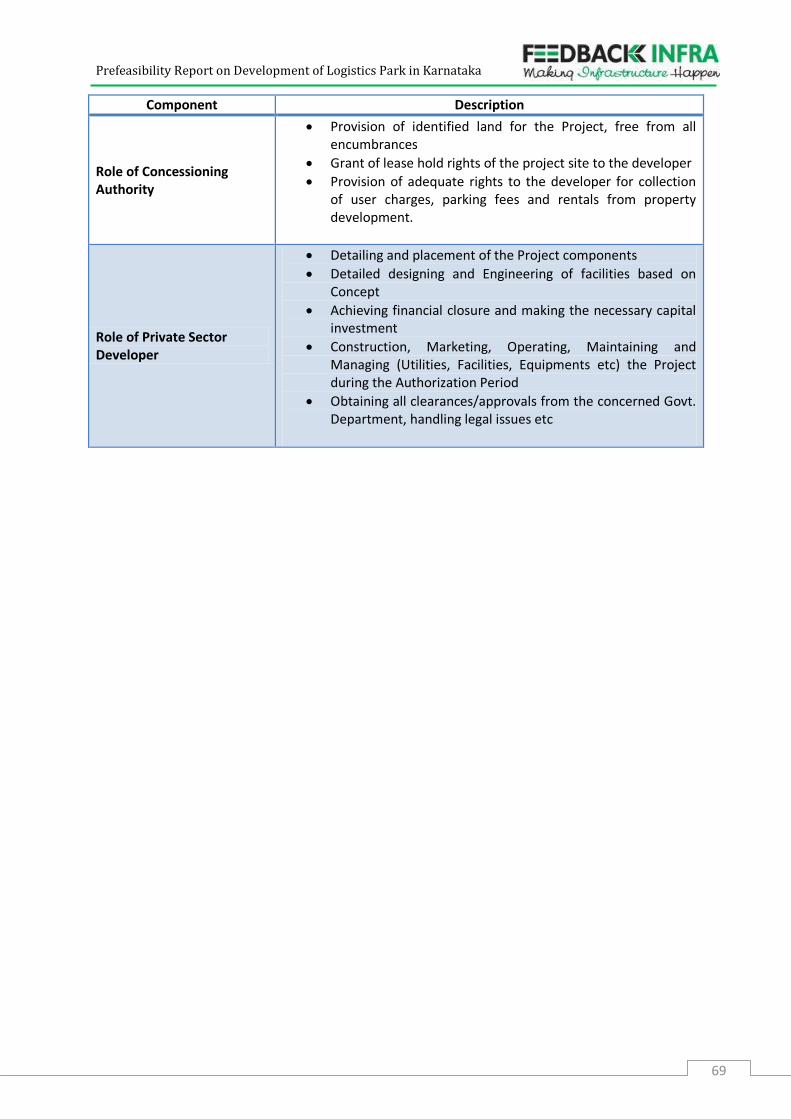
Prefeasibility Report on Development of Logistics Park in Karnataka
69
Component Description
Role of Concessioning Authority
Provision of identified land for the Project, free from all encumbrances
Grant of lease hold rights of the project site to the developer
Provision of adequate rights to the developer for collection of user charges, parking fees and rentals from property development.
Role of Private Sector Developer
Detailing and placement of the Project components
Detailed designing and Engineering of facilities based on Concept
Achieving financial closure and making the necessary capital investment
Construction, Marketing, Operating, Maintaining and Managing (Utilities, Facilities, Equipments etc) the Project during the Authorization Period
Obtaining all clearances/approvals from the concerned Govt. Department, handling legal issues etc
Prefeasibility Report on Development of Logistics Park in Karnataka
70
10 Way Forward
1. Key Milestone for the Project
i. Preparation of Tender Documents for Selection of Transaction Advisor for the Project
Tender documents will be prepared for selection of Transaction Advisors which would
include the following:
o Detailed Scope of Work including deliverables and timelines for submission.
o Outlining the minimum eligibility criteria, which the bidders would necessarily
have to meet before their bids are evaluated in detail.
o Description of Evaluation process elaborating the various evaluation parameters
and their respective weightages.
o A draft Agreement which would spell out the following:
– The Obligations and Scope of Work for the consultant
– Progress Reporting Mechanism
– Dispute Resolution Mechanisms
– Termination of Contracts by either of the parties
– Defining conditions and events leading up to a default in obligations
– Conditions construing Force Majeure
– Conditions leading up to a termination of Contract and invoking of the
Performance Guarantee.
2. Capacity Building of PPP Cell Personnel
Capacity Building Workshops will be conducted for officials who are identified as PPP Cell
personnel by the department. These workshops will be conducted in order to enable these
personnel in understanding the concept of PPP, model procedures and documents related to
implementation of PPP projects, key issues related to PPP etc. Three training sessions will be
organised as a part of capacity building. Various techniques of effective communication like
audio-visual media in form of PowerPoint presentations, videos, notes, interaction dialogues etc
will be used for these capacity building sessions.
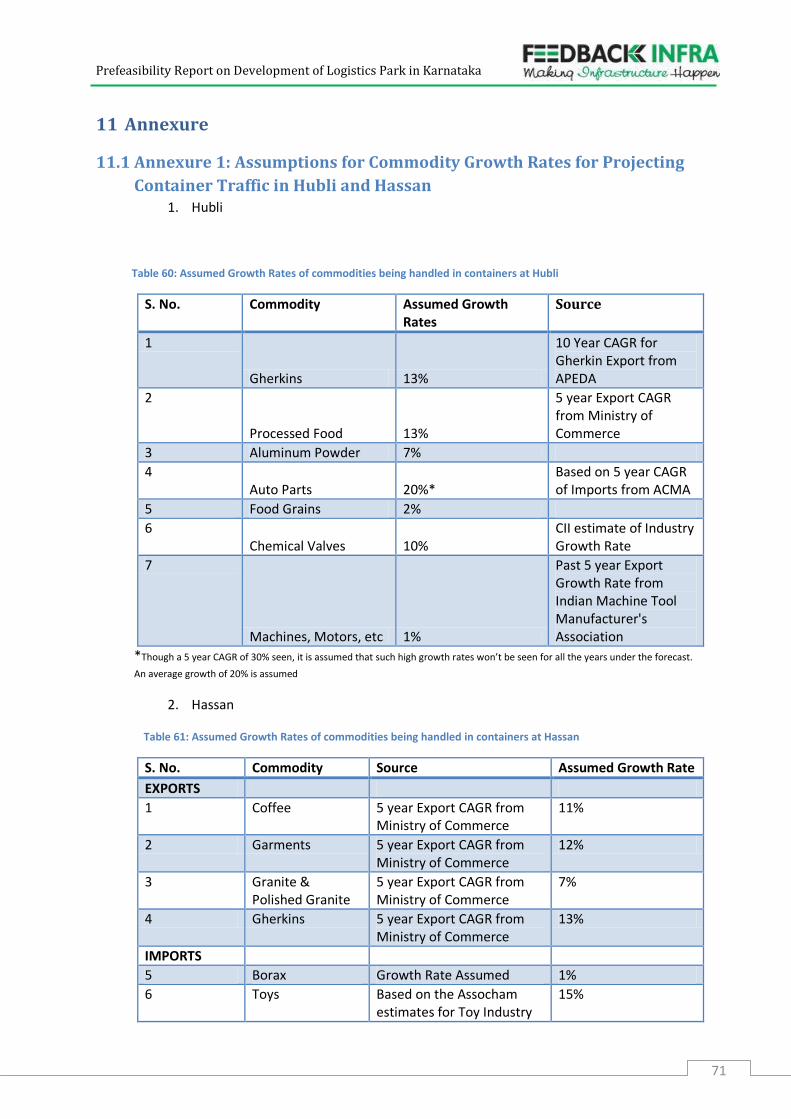
Prefeasibility Report on Development of Logistics Park in Karnataka
71
11 Annexure
11.1 Annexure 1: Assumptions for Commodity Growth Rates for Projecting
Container Traffic in Hubli and Hassan 1. Hubli
Table 60: Assumed Growth Rates of commodities being handled in containers at Hubli
S. No. Commodity Assumed Growth Rates
Source
1
Gherkins 13%
10 Year CAGR for Gherkin Export from APEDA
2
Processed Food 13%
5 year Export CAGR from Ministry of Commerce
3 Aluminum Powder 7%
4 Auto Parts 20%*
Based on 5 year CAGR of Imports from ACMA
5 Food Grains 2%
6 Chemical Valves 10%
CII estimate of Industry Growth Rate
7
Machines, Motors, etc 1%
Past 5 year Export Growth Rate from Indian Machine Tool Manufacturer's Association
*Though a 5 year CAGR of 30% seen, it is assumed that such high growth rates won’t be seen for all the years under the forecast.
An average growth of 20% is assumed
2. Hassan
Table 61: Assumed Growth Rates of commodities being handled in containers at Hassan
S. No. Commodity Source Assumed Growth Rate
EXPORTS
1 Coffee 5 year Export CAGR from Ministry of Commerce
11%
2 Garments 5 year Export CAGR from Ministry of Commerce
12%
3 Granite & Polished Granite
5 year Export CAGR from Ministry of Commerce
7%
4 Gherkins 5 year Export CAGR from Ministry of Commerce
13%
IMPORTS
5 Borax Growth Rate Assumed 1%
6 Toys Based on the Assocham estimates for Toy Industry
15%
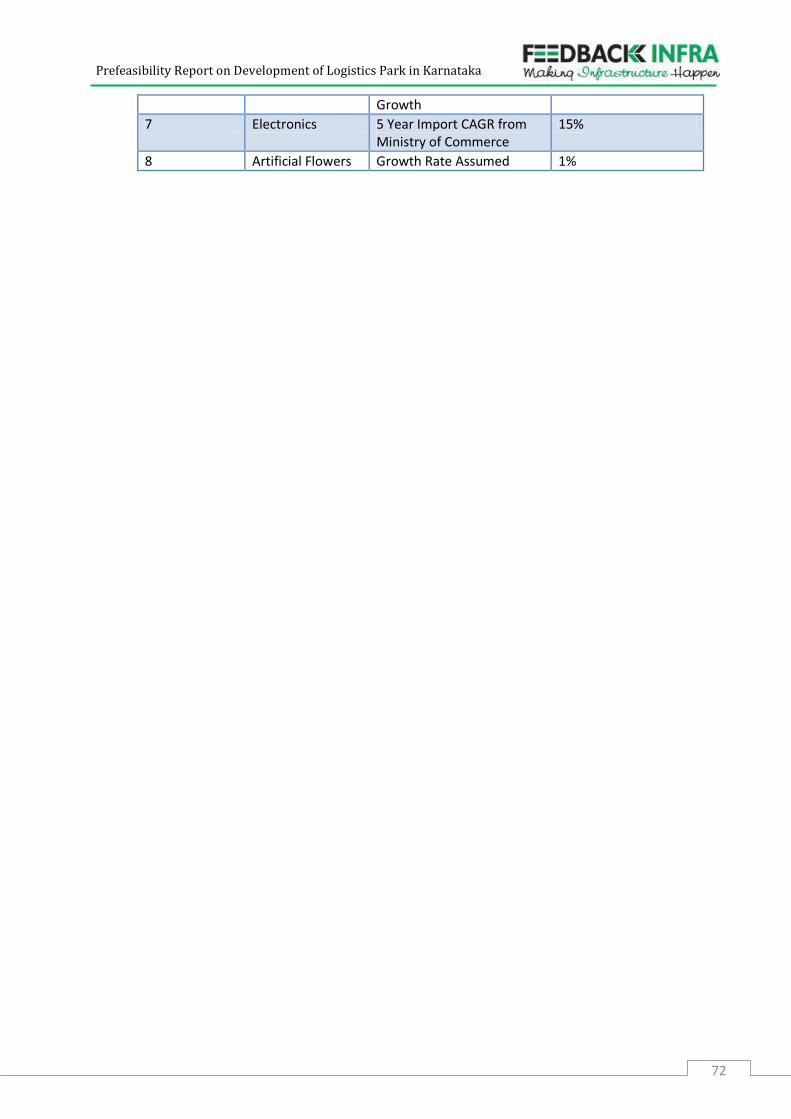
Prefeasibility Report on Development of Logistics Park in Karnataka
72
Growth
7 Electronics 5 Year Import CAGR from Ministry of Commerce
15%
8 Artificial Flowers Growth Rate Assumed 1%
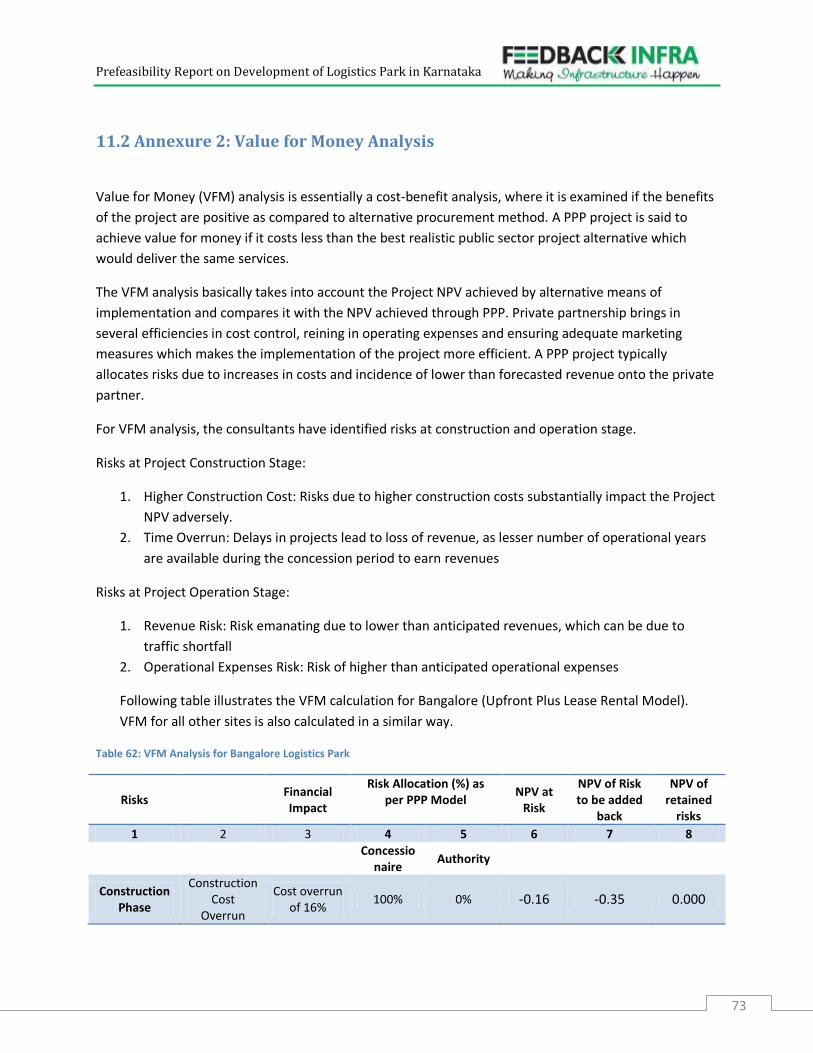
Prefeasibility Report on Development of Logistics Park in Karnataka
73
11.2 Annexure 2: Value for Money Analysis
Value for Money (VFM) analysis is essentially a cost-benefit analysis, where it is examined if the benefits
of the project are positive as compared to alternative procurement method. A PPP project is said to
achieve value for money if it costs less than the best realistic public sector project alternative which
would deliver the same services.
The VFM analysis basically takes into account the Project NPV achieved by alternative means of
implementation and compares it with the NPV achieved through PPP. Private partnership brings in
several efficiencies in cost control, reining in operating expenses and ensuring adequate marketing
measures which makes the implementation of the project more efficient. A PPP project typically
allocates risks due to increases in costs and incidence of lower than forecasted revenue onto the private
partner.
For VFM analysis, the consultants have identified risks at construction and operation stage.
Risks at Project Construction Stage:
1. Higher Construction Cost: Risks due to higher construction costs substantially impact the Project
NPV adversely.
2. Time Overrun: Delays in projects lead to loss of revenue, as lesser number of operational years
are available during the concession period to earn revenues
Risks at Project Operation Stage:
1. Revenue Risk: Risk emanating due to lower than anticipated revenues, which can be due to
traffic shortfall
2. Operational Expenses Risk: Risk of higher than anticipated operational expenses
Following table illustrates the VFM calculation for Bangalore (Upfront Plus Lease Rental Model).
VFM for all other sites is also calculated in a similar way.
Table 62: VFM Analysis for Bangalore Logistics Park
Risks
Financial Impact
Risk Allocation (%) as per PPP Model
NPV at Risk
NPV of Risk to be added
back
NPV of retained
risks
1 2 3 4 5 6 7 8
Concessio
naire Authority
Construction Phase
Construction Cost
Overrun
Cost overrun of 16%
100% 0% -0.16 -0.35 0.000
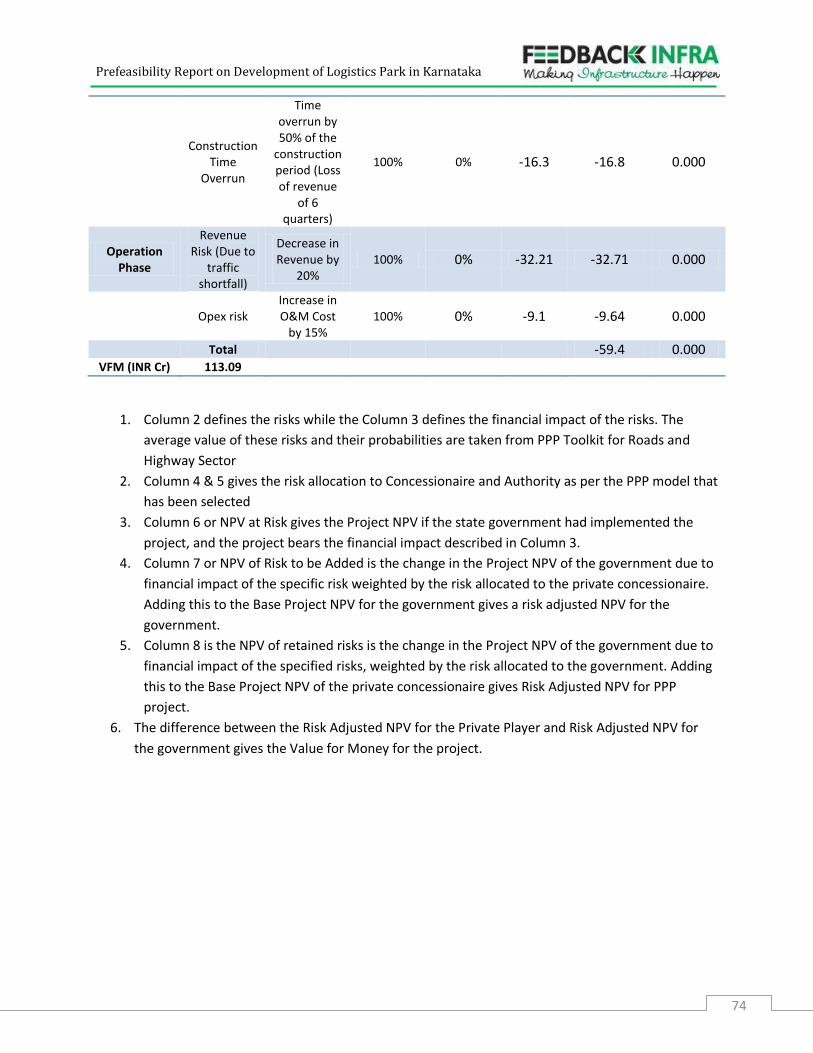
Prefeasibility Report on Development of Logistics Park in Karnataka
74
Construction Time
Overrun
Time overrun by 50% of the
construction period (Loss of revenue
of 6 quarters)
100% 0% -16.3 -16.8 0.000
Operation Phase
Revenue Risk (Due to
traffic shortfall)
Decrease in Revenue by
20% 100% 0% -32.21 -32.71 0.000
Opex risk
Increase in O&M Cost
by 15% 100% 0% -9.1 -9.64 0.000
Total
-59.4 0.000
VFM (INR Cr) 113.09
1. Column 2 defines the risks while the Column 3 defines the financial impact of the risks. The
average value of these risks and their probabilities are taken from PPP Toolkit for Roads and
Highway Sector
2. Column 4 & 5 gives the risk allocation to Concessionaire and Authority as per the PPP model that
has been selected
3. Column 6 or NPV at Risk gives the Project NPV if the state government had implemented the
project, and the project bears the financial impact described in Column 3.
4. Column 7 or NPV of Risk to be Added is the change in the Project NPV of the government due to
financial impact of the specific risk weighted by the risk allocated to the private concessionaire.
Adding this to the Base Project NPV for the government gives a risk adjusted NPV for the
government.
5. Column 8 is the NPV of retained risks is the change in the Project NPV of the government due to
financial impact of the specified risks, weighted by the risk allocated to the government. Adding
this to the Base Project NPV of the private concessionaire gives Risk Adjusted NPV for PPP
project.
6. The difference between the Risk Adjusted NPV for the Private Player and Risk Adjusted NPV for
the government gives the Value for Money for the project.
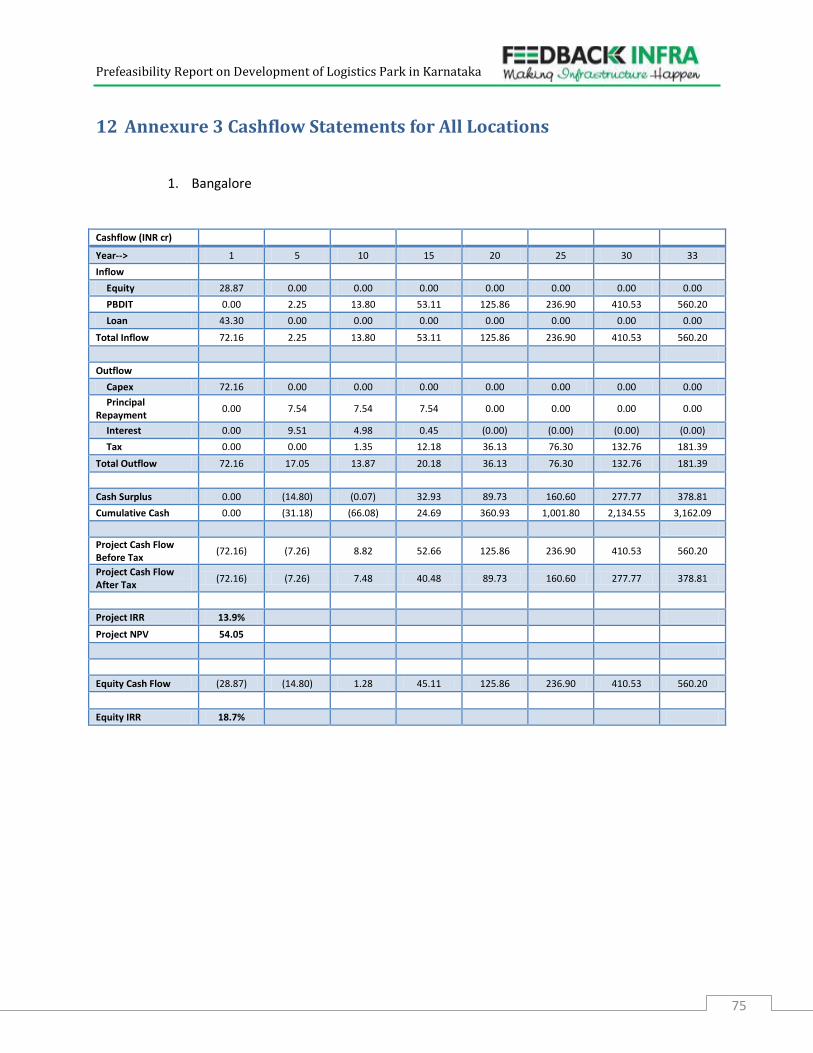
Prefeasibility Report on Development of Logistics Park in Karnataka
75
12 Annexure 3 Cashflow Statements for All Locations
1. Bangalore
Cashflow (INR cr)
Year--> 1 5 10 15 20 25 30 33
Inflow
Equity 28.87 0.00 0.00 0.00 0.00 0.00 0.00 0.00
PBDIT 0.00 2.25 13.80 53.11 125.86 236.90 410.53 560.20
Loan 43.30 0.00 0.00 0.00 0.00 0.00 0.00 0.00
Total Inflow 72.16 2.25 13.80 53.11 125.86 236.90 410.53 560.20
Outflow
Capex 72.16 0.00 0.00 0.00 0.00 0.00 0.00 0.00
Principal Repayment
0.00 7.54 7.54 7.54 0.00 0.00 0.00 0.00
Interest 0.00 9.51 4.98 0.45 (0.00) (0.00) (0.00) (0.00)
Tax 0.00 0.00 1.35 12.18 36.13 76.30 132.76 181.39
Total Outflow 72.16 17.05 13.87 20.18 36.13 76.30 132.76 181.39
Cash Surplus 0.00 (14.80) (0.07) 32.93 89.73 160.60 277.77 378.81
Cumulative Cash 0.00 (31.18) (66.08) 24.69 360.93 1,001.80 2,134.55 3,162.09
Project Cash Flow Before Tax
(72.16) (7.26) 8.82 52.66 125.86 236.90 410.53 560.20
Project Cash Flow After Tax
(72.16) (7.26) 7.48 40.48 89.73 160.60 277.77 378.81
Project IRR 13.9%
Project NPV 54.05
Equity Cash Flow (28.87) (14.80) 1.28 45.11 125.86 236.90 410.53 560.20
Equity IRR 18.7%
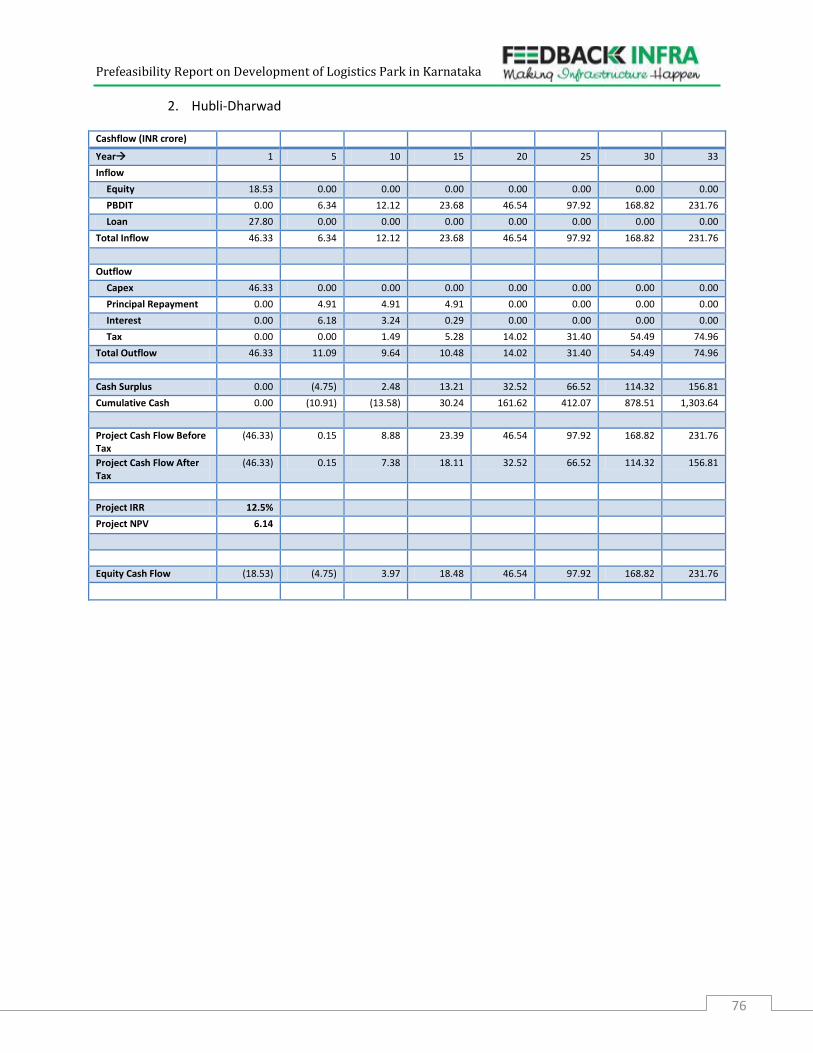
Prefeasibility Report on Development of Logistics Park in Karnataka
76
2. Hubli-Dharwad
Cashflow (INR crore)
Year 1 5 10 15 20 25 30 33
Inflow
Equity 18.53 0.00 0.00 0.00 0.00 0.00 0.00 0.00
PBDIT 0.00 6.34 12.12 23.68 46.54 97.92 168.82 231.76
Loan 27.80 0.00 0.00 0.00 0.00 0.00 0.00 0.00
Total Inflow 46.33 6.34 12.12 23.68 46.54 97.92 168.82 231.76
Outflow
Capex 46.33 0.00 0.00 0.00 0.00 0.00 0.00 0.00
Principal Repayment 0.00 4.91 4.91 4.91 0.00 0.00 0.00 0.00
Interest 0.00 6.18 3.24 0.29 0.00 0.00 0.00 0.00
Tax 0.00 0.00 1.49 5.28 14.02 31.40 54.49 74.96
Total Outflow 46.33 11.09 9.64 10.48 14.02 31.40 54.49 74.96
Cash Surplus 0.00 (4.75) 2.48 13.21 32.52 66.52 114.32 156.81
Cumulative Cash 0.00 (10.91) (13.58) 30.24 161.62 412.07 878.51 1,303.64
Project Cash Flow Before Tax
(46.33) 0.15 8.88 23.39 46.54 97.92 168.82 231.76
Project Cash Flow After Tax
(46.33) 0.15 7.38 18.11 32.52 66.52 114.32 156.81
Project IRR 12.5%
Project NPV 6.14
Equity Cash Flow (18.53) (4.75) 3.97 18.48 46.54 97.92 168.82 231.76
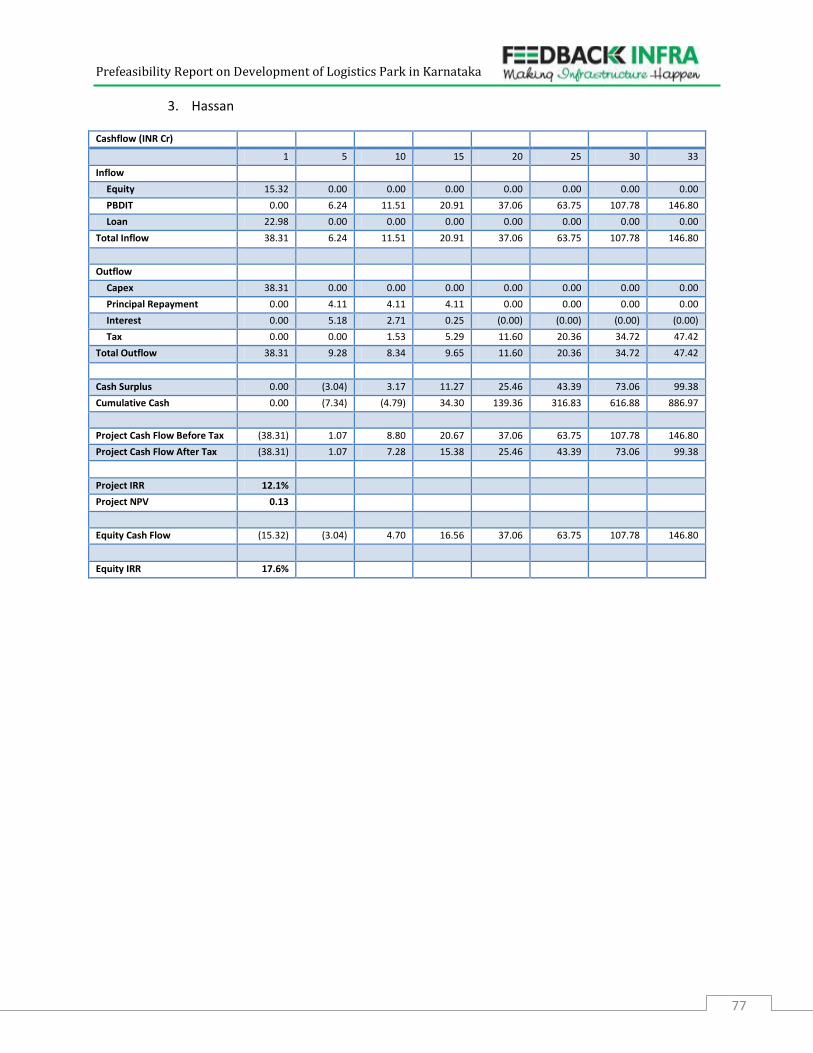
Prefeasibility Report on Development of Logistics Park in Karnataka
77
3. Hassan
Cashflow (INR Cr)
1 5 10 15 20 25 30 33
Inflow
Equity 15.32 0.00 0.00 0.00 0.00 0.00 0.00 0.00
PBDIT 0.00 6.24 11.51 20.91 37.06 63.75 107.78 146.80
Loan 22.98 0.00 0.00 0.00 0.00 0.00 0.00 0.00
Total Inflow 38.31 6.24 11.51 20.91 37.06 63.75 107.78 146.80
Outflow
Capex 38.31 0.00 0.00 0.00 0.00 0.00 0.00 0.00
Principal Repayment 0.00 4.11 4.11 4.11 0.00 0.00 0.00 0.00
Interest 0.00 5.18 2.71 0.25 (0.00) (0.00) (0.00) (0.00)
Tax 0.00 0.00 1.53 5.29 11.60 20.36 34.72 47.42
Total Outflow 38.31 9.28 8.34 9.65 11.60 20.36 34.72 47.42
Cash Surplus 0.00 (3.04) 3.17 11.27 25.46 43.39 73.06 99.38
Cumulative Cash 0.00 (7.34) (4.79) 34.30 139.36 316.83 616.88 886.97
Project Cash Flow Before Tax (38.31) 1.07 8.80 20.67 37.06 63.75 107.78 146.80
Project Cash Flow After Tax (38.31) 1.07 7.28 15.38 25.46 43.39 73.06 99.38
Project IRR 12.1%
Project NPV 0.13
Equity Cash Flow (15.32) (3.04) 4.70 16.56 37.06 63.75 107.78 146.80
Equity IRR 17.6%