Embed Size (px)
DESCRIPTION
Prefrontal cortex: categories, concepts and cognitive control Earl K. Miller Picower Center for Learning and Memory, RIKEN-MIT Neuroscience Research Center, and Department of Brain and Cognitive Sciences, Massachusetts Institute of Technology www.millerlab.org. Sensory. Motor. - PowerPoint PPT Presentation
Citation preview
Prefrontal cortex: categories, concepts and cognitive control
Earl K. Miller
Picower Center for Learning and Memory,RIKEN-MIT Neuroscience Research Center, and
Department of Brain and Cognitive Sciences,Massachusetts Institute of Technology
www.millerlab.org
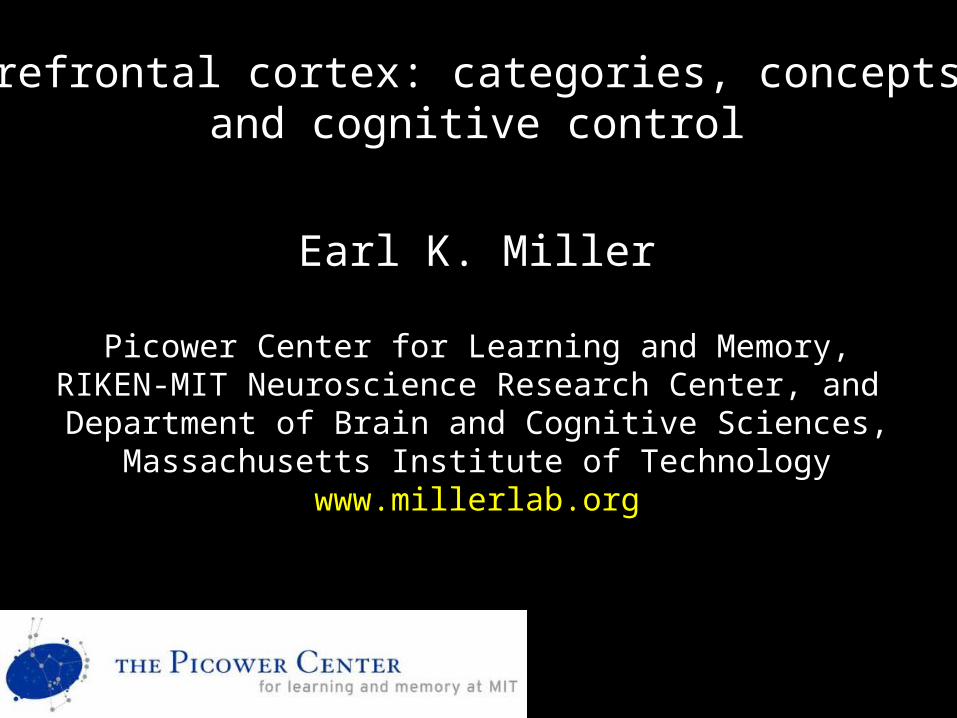
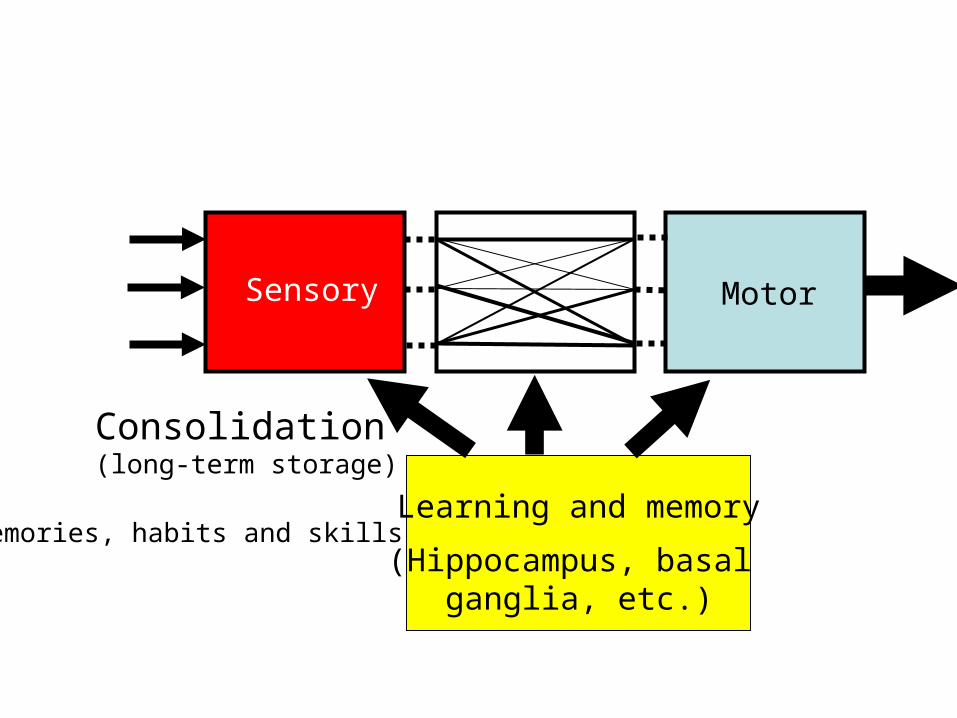
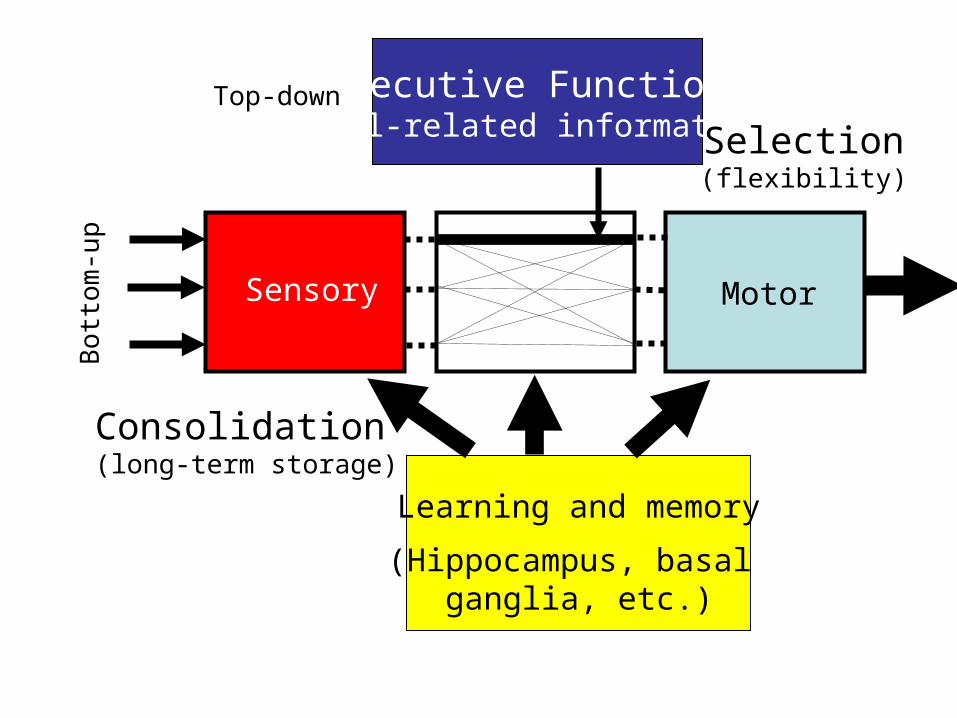
Basic sensory and motor functions
Sensory Motor
Executive (cognitive) control – The ability of the brain to wrest control of its processing from reflexive reactions to the environment in order to direct it toward unseen goals. Volition, goal-direction
Sensory Motor
Learning and memory (Hippocampus, basal
ganglia, etc.)
Memories, habits and skills
Consolidation(long-term storage)
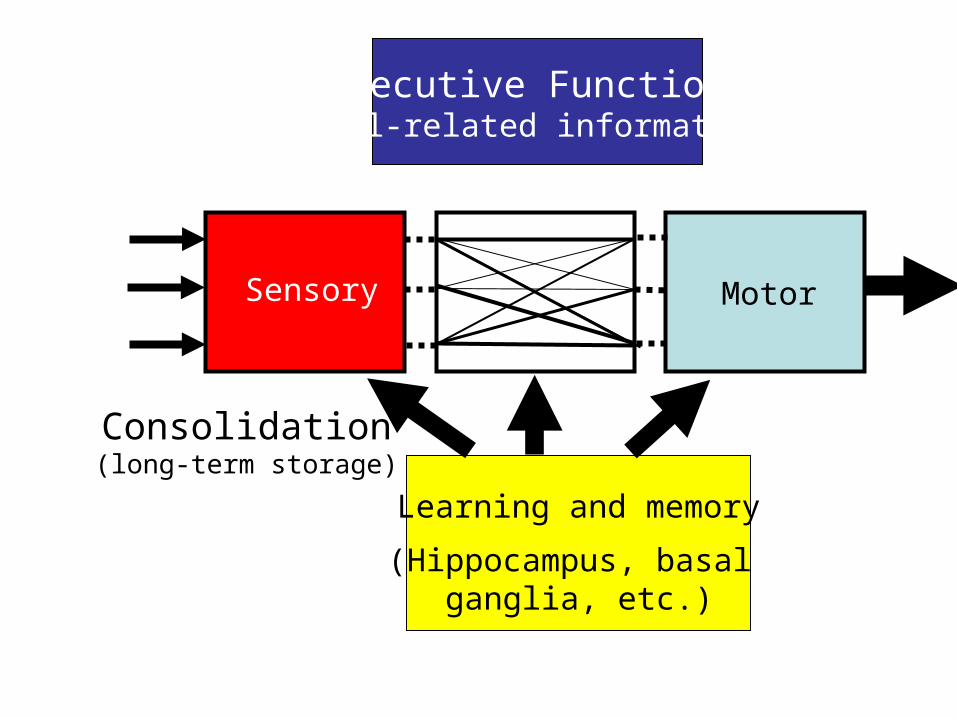
Sensory Motor
Executive Functionsgoal-related information
Learning and memory (Hippocampus, basal
ganglia, etc.)
Consolidation(long-term storage)
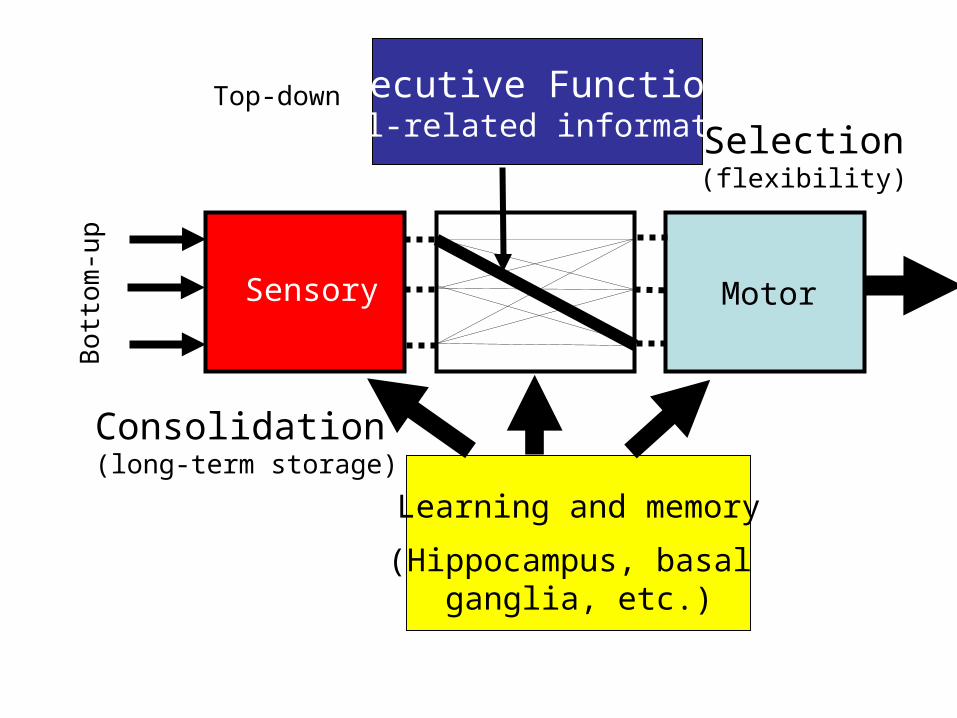
Sensory Motor
Bot
tom
-up
Learning and memory (Hippocampus, basal
ganglia, etc.)
Executive Functionsgoal-related information
Top-down
Selection(flexibility)
Consolidation(long-term storage)

Sensory Motor
Bot
tom
-up
Learning and memory (Hippocampus, basal
ganglia, etc.)
Executive Functionsgoal-related information
Top-down
Consolidation(long-term storage)
Selection(flexibility)

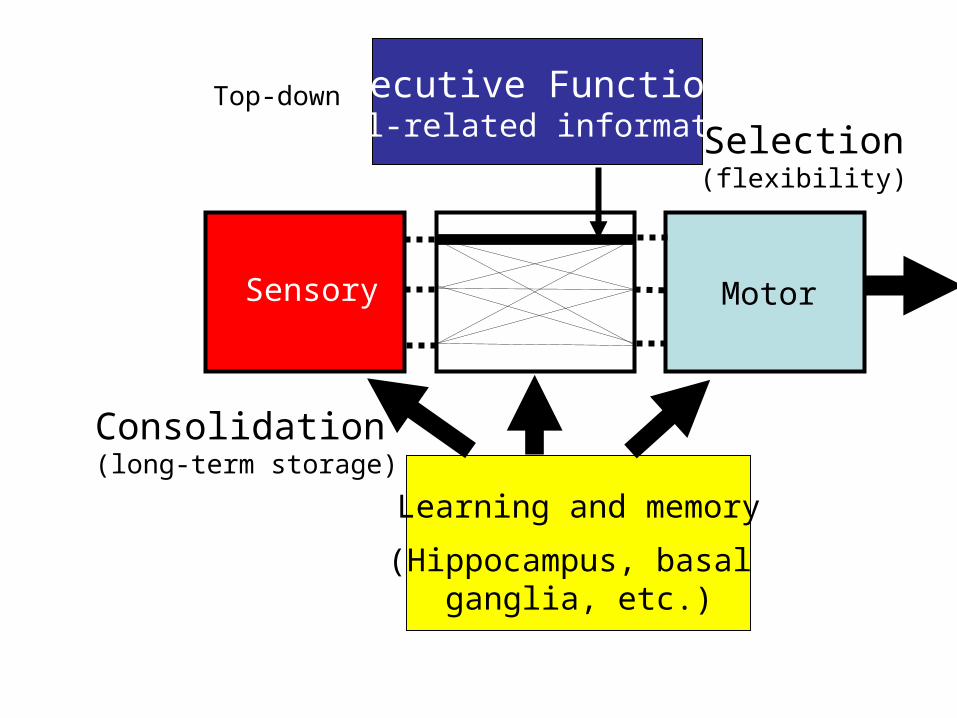
Sensory Motor
Bot
tom
-up
Learning and memory (Hippocampus, basal
ganglia, etc.)
Executive Functionsgoal-related information
Top-down
Consolidation(long-term storage)
Selection(flexibility)

Sensory Motor
Bot
tom
-up
Learning and memory (Hippocampus, basal
ganglia, etc.)
Executive Functionsgoal-related information
Top-down
Selection(flexibility)
Consolidation(long-term storage)

Sensory Motor
Bot
tom
-up
Learning and memory (Hippocampus, basal
ganglia, etc.)
Executive Functionsgoal-related information
Top-down
Consolidation(long-term storage)
Selection(flexibility)

Sensory Motor
Bot
tom
-up
Learning and memory (Hippocampus, basal
ganglia, etc.)
Executive Functionsgoal-related information
Top-down
Consolidation(long-term storage)
Selection(flexibility)

Sensory Motor
Bot
tom
-up
Learning and memory (Hippocampus, basal
ganglia, etc.)
Executive Functionsgoal-related information
Top-down
Selection(flexibility)
Consolidation(long-term storage)

Sensory Motor
Bot
tom
-up
Learning and memory (Hippocampus, basal
ganglia, etc.)
Executive Functionsgoal-related information
Top-down
Consolidation(long-term storage)
Selection(flexibility)
Sensory Motor
Learning and memory (Hippocampus, basal
ganglia, etc.)
Executive Functionsgoal-related information
Top-down
Consolidation(long-term storage)
Selection(flexibility)
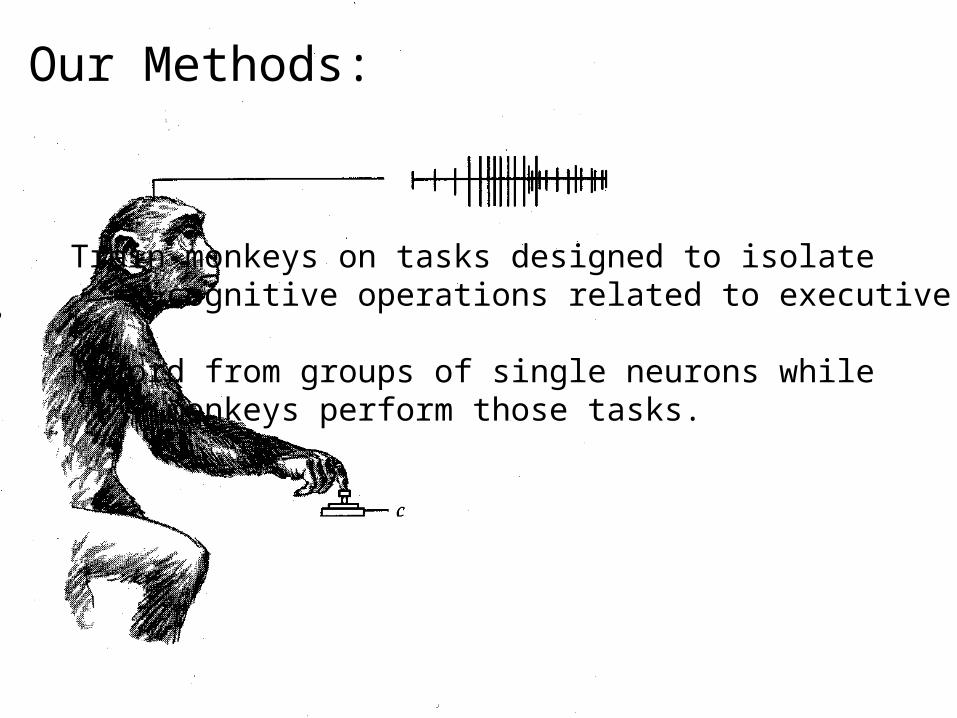
Train monkeys on tasks designed to isolate cognitive operations related to executive control.
Record from groups of single neurons whilemonkeys perform those tasks.
Our Methods:
Sensory Motor
Bot
tom
-up
Learning and memory (Hippocampus, basal
ganglia, etc.)
Executive Functionsgoal-related information
Top-down
Consolidation(long-term storage)
Selection(flexibility)
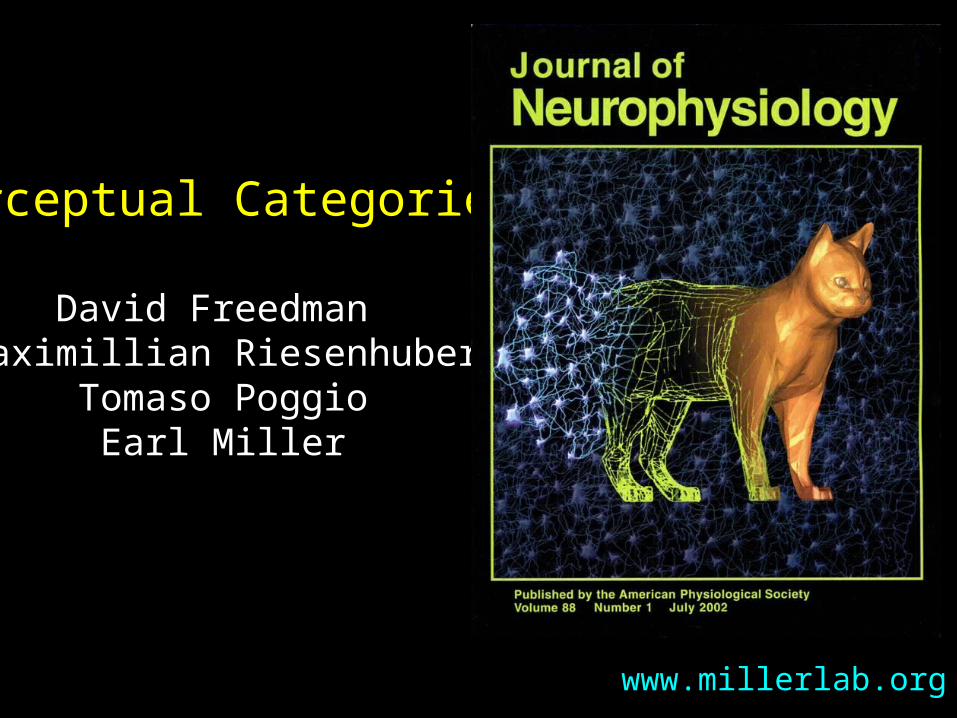
Perceptual Categories
David Freedman Maximillian Riesenhuber
Tomaso PoggioEarl Miller
www.millerlab.org
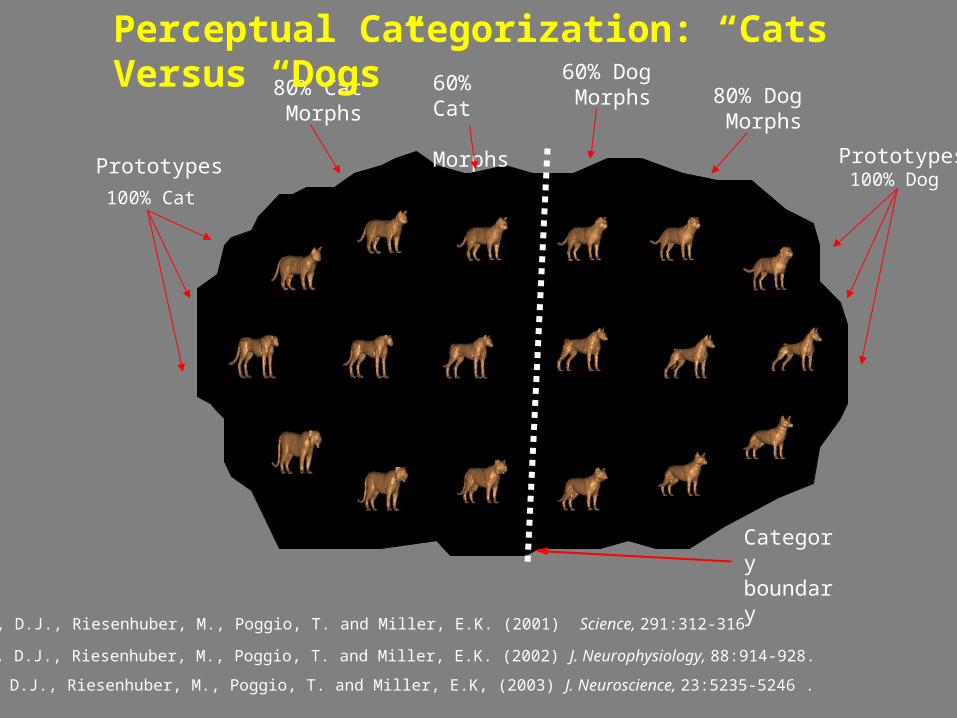
Category boundary
Prototypes
100% Cat
80% Cat Morphs
60% Cat Morphs
60% Dog Morphs 80% Dog
Morphs
Prototypes 100% Dog
Perceptual Categorization: “Cats” Versus “Dogs”
Freedman, D.J., Riesenhuber, M., Poggio, T. and Miller, E.K. (2001) Science, 291:312-316
Freedman, D.J., Riesenhuber, M., Poggio, T. and Miller, E.K. (2002) J. Neurophysiology, 88:914-928.
Freedman, D.J., Riesenhuber, M., Poggio, T. and Miller, E.K, (2003) J. Neuroscience, 23:5235-5246 .
“Cats”
“Dogs”
Category boundary
.. .
.
.
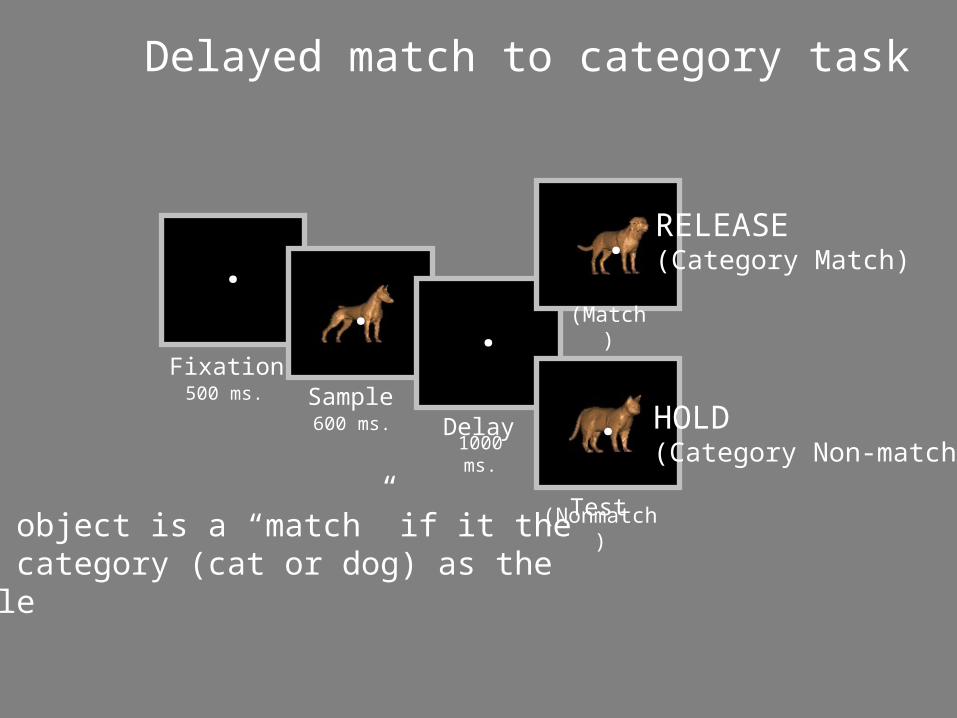
FixationSample
Delay
Test(Nonmatch)
(Match)
600 ms.
1000 ms.
500 ms.
Delayed match to category task
Test object is a “match” if it thesame category (cat or dog) as thesample
RELEASE(Category Match)
HOLD(Category Non-match)
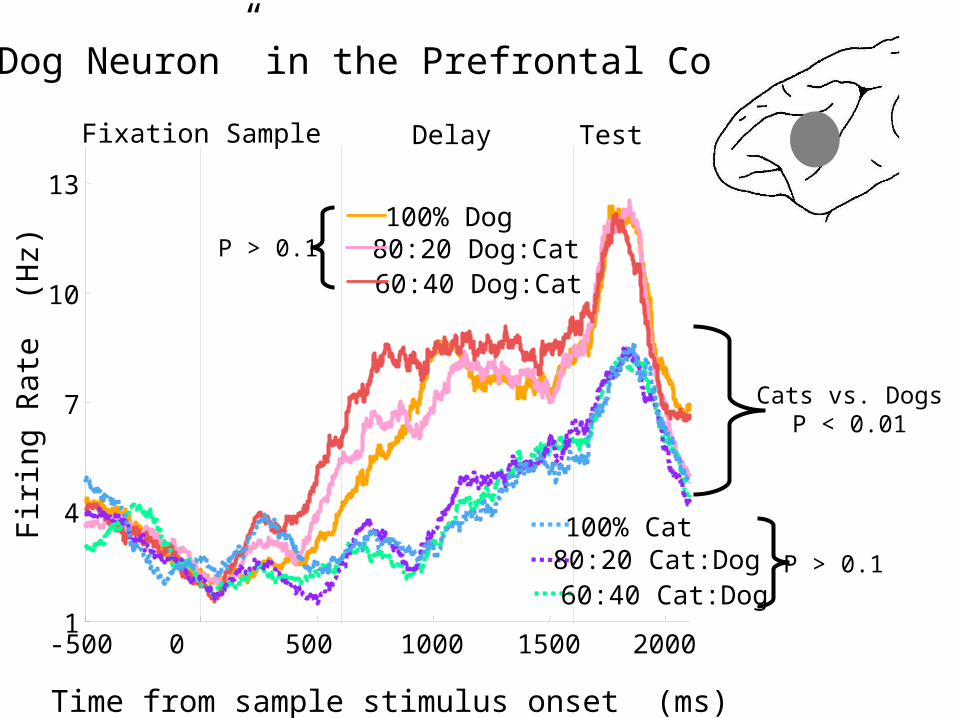
A “Dog Neuron” in the Prefrontal Cortex
-500 0 500 1000 1500 20001
4
7
10
13
Time from sample stimulus onset (ms)
Fir
ing
Ra
te (
Hz)
100% Dog 80:20 Dog:Cat 60:40 Dog:Cat
TestSample Delay
100% Cat
Fixation
60:40 Cat:Dog80:20 Cat:Dog
P > 0.1
P > 0.1
Cats vs. DogsP < 0.01
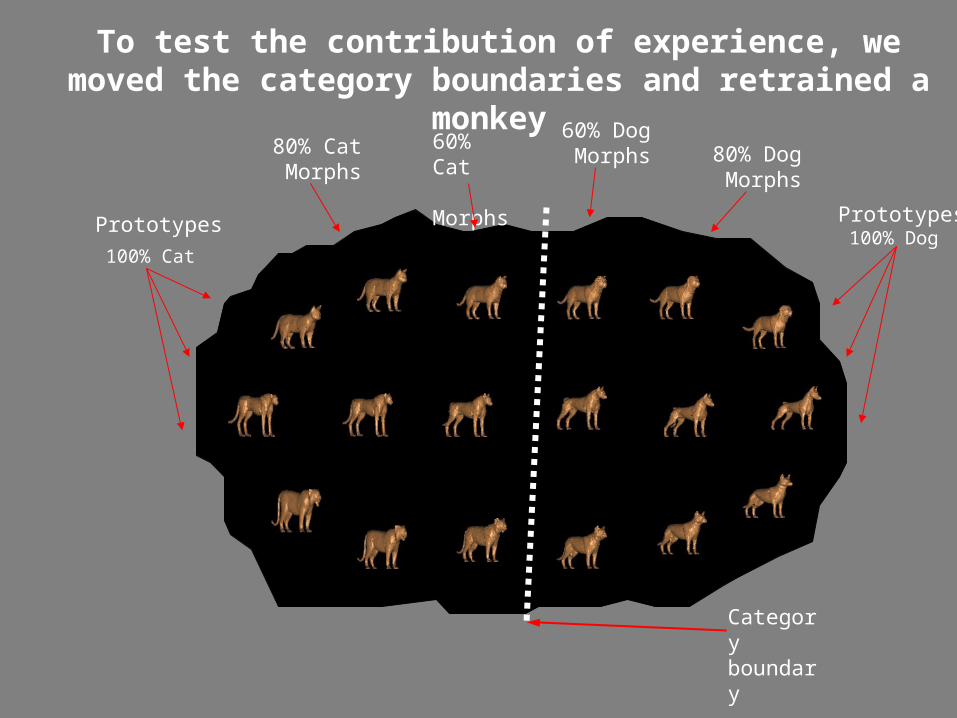
To test the contribution of experience, we moved the category boundaries and retrained a monkey
Category boundary
Prototypes
100% Cat
80% Cat Morphs
60% Cat Morphs
60% Dog Morphs 80% Dog
Morphs
Prototypes 100% Dog

To test the contribution of experience, we moved the category boundaries and retrained a monkey
Old, now-irrelevant, boundary
New, now-relevant, boundary
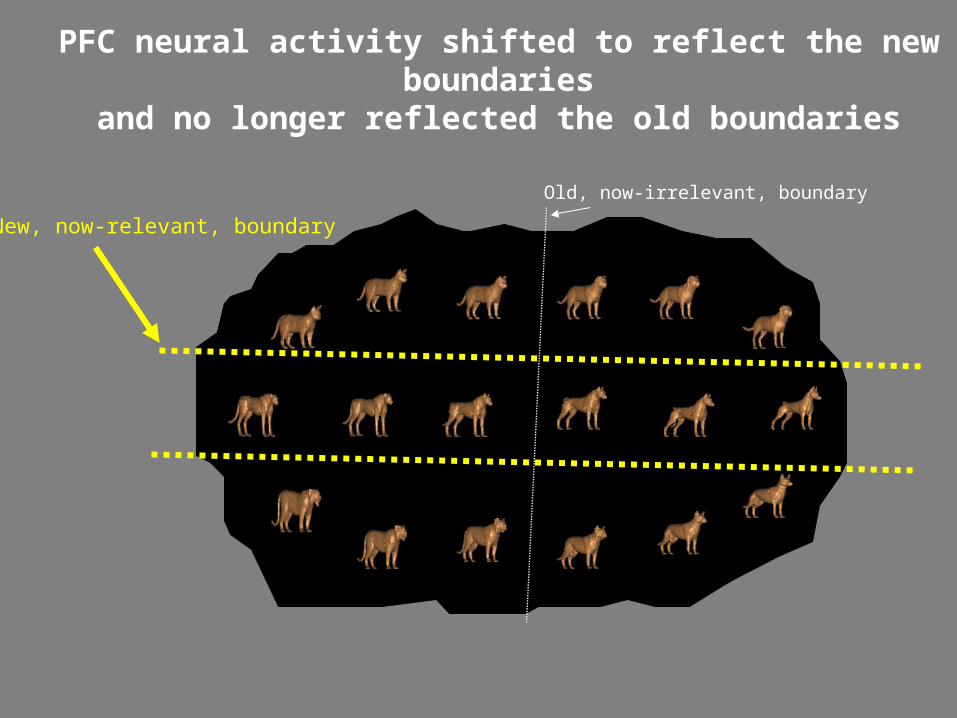
PFC neural activity shifted to reflect the new boundariesand no longer reflected the old boundaries
Old, now-irrelevant, boundary
New, now-relevant, boundary
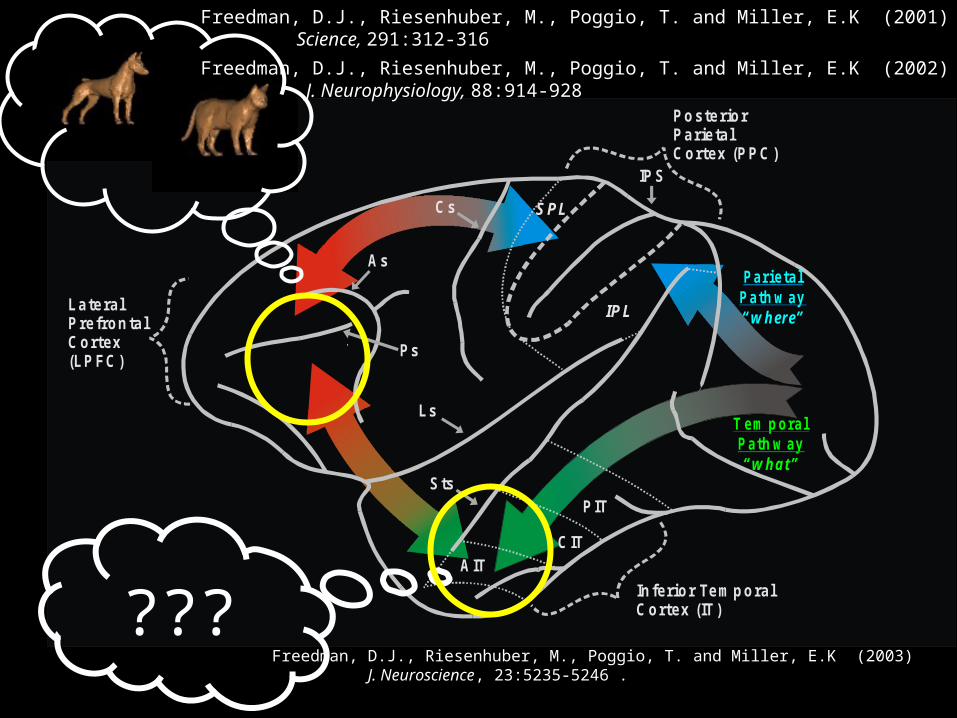
PosteriorParietalCortex (PPC )
Ps
LateralPrefrontalCortex (LPFC)
As
Cs
Ls
IPL
SPL
P arietal P ath w ay“w here”
IPS
Sts
AITCIT
PIT
Inferior TemporalCortex (IT)
T em p oralP ath w ay“w ha t”
???
Freedman, D.J., Riesenhuber, M., Poggio, T. and Miller, E.K. (2001) Science, 291:312-316
Freedman, D.J., Riesenhuber, M., Poggio, T. and Miller, E.K. (2002) J. Neurophysiology, 88:914-928
Freedman, D.J., Riesenhuber, M., Poggio, T. and Miller, E.K, (2003)J. Neuroscience, 23:5235-5246 .
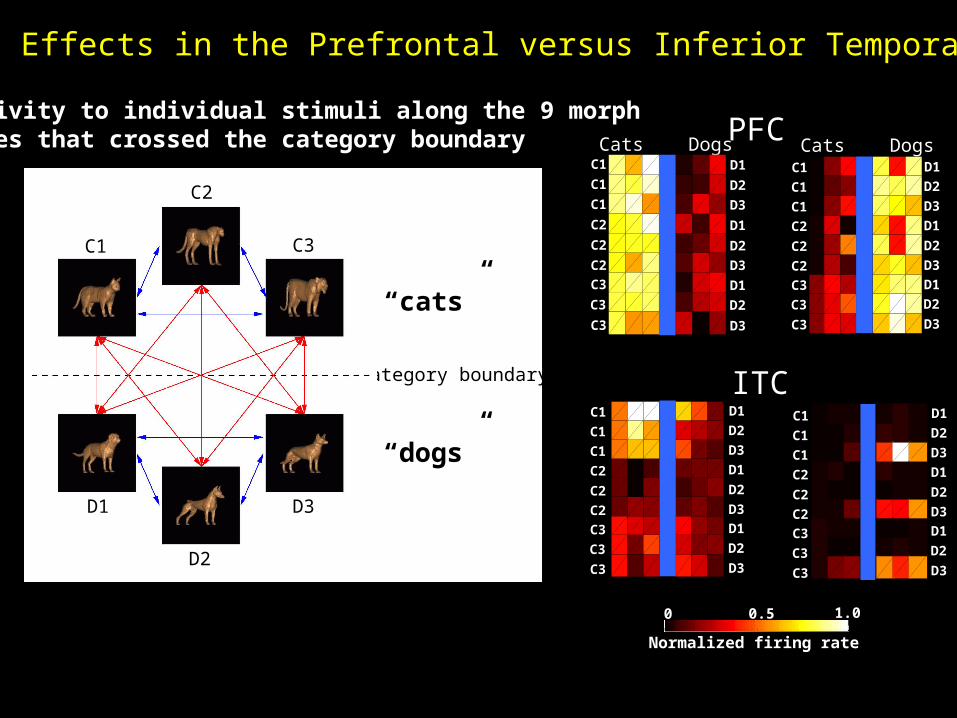
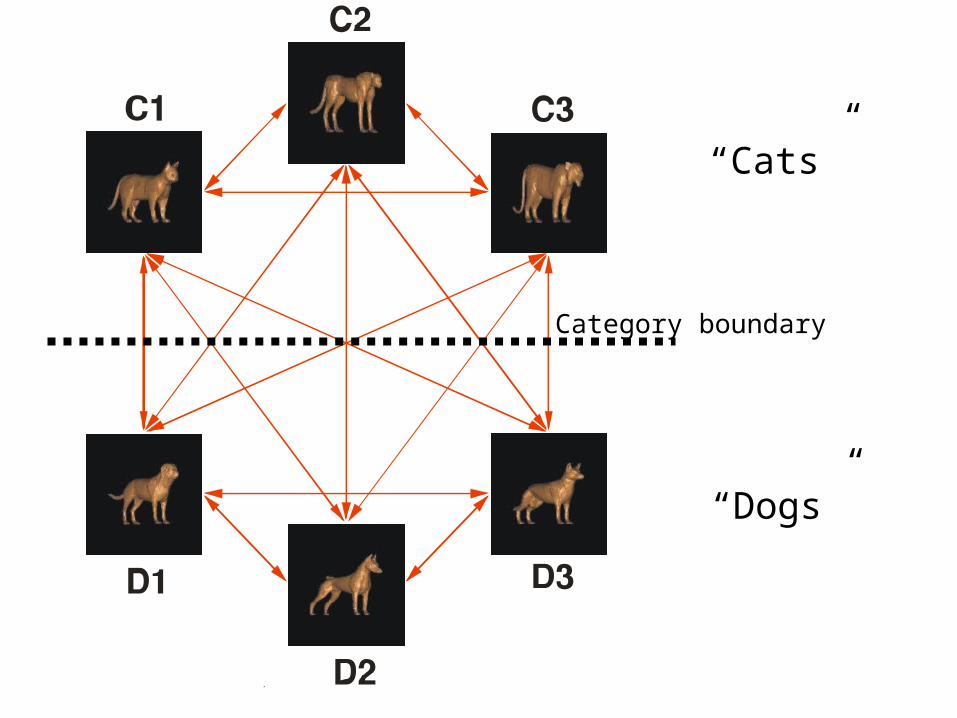
Category Effects in the Prefrontal versus Inferior Temporal Cortex
“cats”
“dogs”
category boundary
C1
C2
C3
D2
D3D1
Activity to individual stimuli along the 9 morph lines that crossed the category boundary PFC
C1
C1
C1
C2
C2
C2
C3
C3
C3
D1
D2
D3
D1
D2
D3
D2
D3
D1
C1
C1
C1
C2
C2
C2
C3
C3
C3
D1
D2
D3
D1
D2
D3
D2
D3
D1
ITC
0 0.5 1.0
Normalized firing rate
Cats Dogs Cats DogsC1
C1
C1
C2
C2
C2
C3
C3
C3
D1
D2
D3
D1
D2
D3
D2
D3
D1
C1
C1
C1
C2
C2
C2
C3
C3
C3
D1
D2
D3
D1
D2
D3
D2
D3
D1
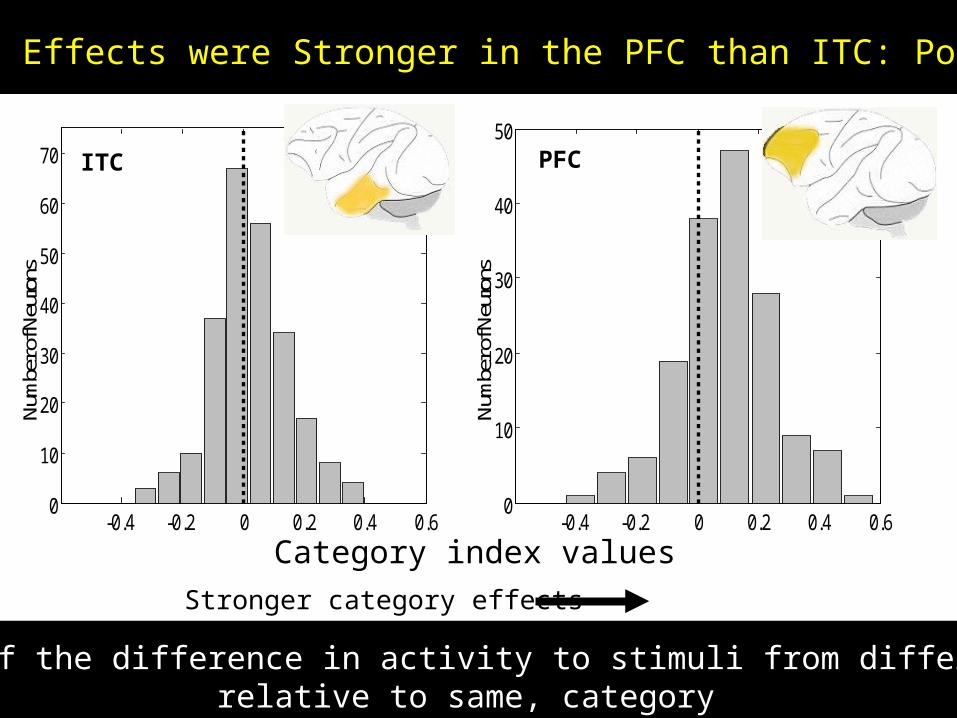
Category Effects were Stronger in the PFC than ITC: Population
Index of the difference in activity to stimuli from different, relative to same, category
-0.4 -0.2 0 0.2 0.4 0.60
10
20
30
40
50
60
70
Category Index Value
Num
ber o
f Neu
rons
-0.4 -0.2 0 0.2 0.4 0.60
10
20
30
40
50
Category Index Value
Num
ber o
f Neu
rons
ITC PFC
Stronger category effects
Category index values
Quantity (numerosity)
Andreas NiederDavid FreedmanEarl Miller
www.millerlab.org
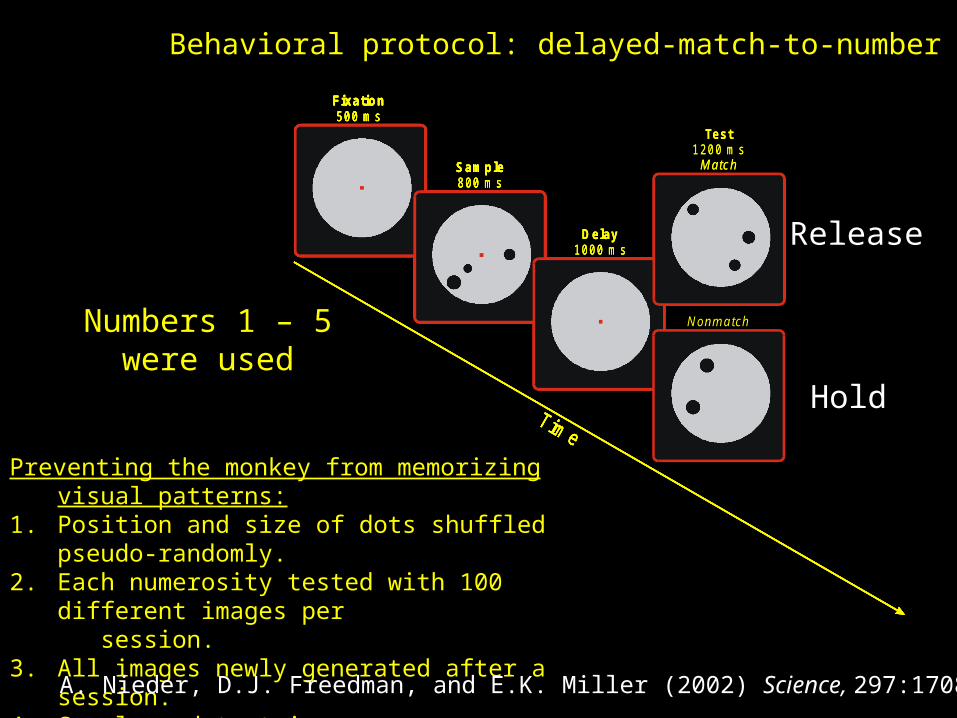
Behavioral protocol: delayed-match-to-number task
Preventing the monkey from memorizing visual patterns:1. Position and size of dots shuffled pseudo-randomly. 2. Each numerosity tested with 100 different images per
session.3. All images newly generated after a session.4. Sample and test images never identical.
Fixation500 m s
Time
Sample800 m s
Fixation500 m s
Time
Sample800 m s
Delay1000 m s
Fixation500 m s
Time
Sample800 m s
Delay1000 m s
Test 1200 m s
M atch
Fixation500 m s
Time
Sample800 m s
Delay1000 m s
Test 1200 m s
M atch
N onm a tch
Fixation500 m s
Time
A. Nieder, D.J. Freedman, and E.K. Miller (2002) Science, 297:1708-1711.
Numbers 1 – 5were used
Release
Hold
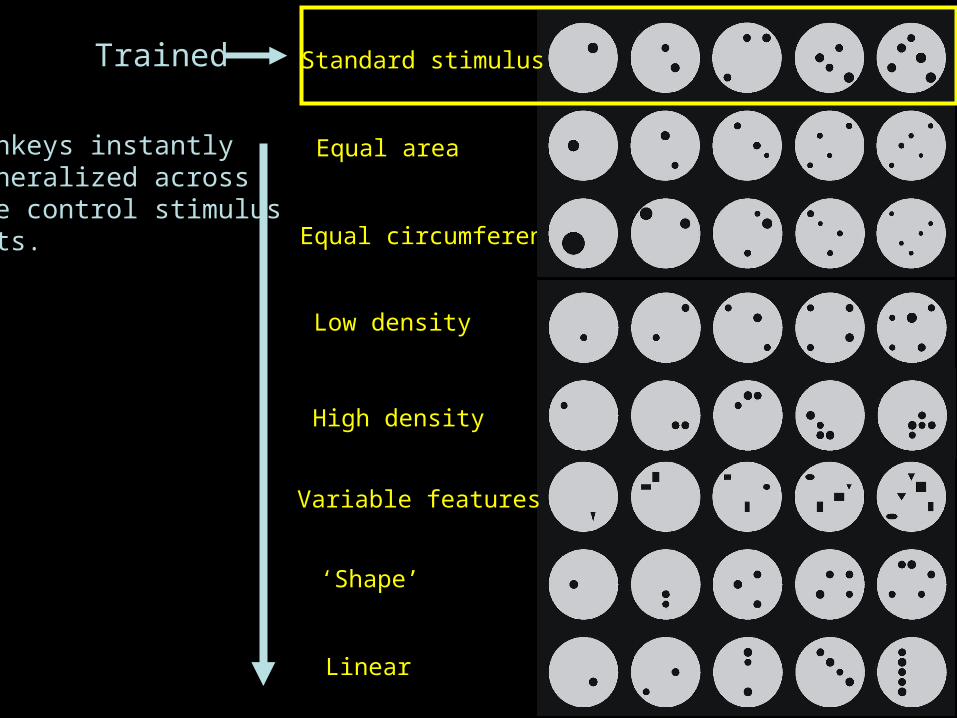
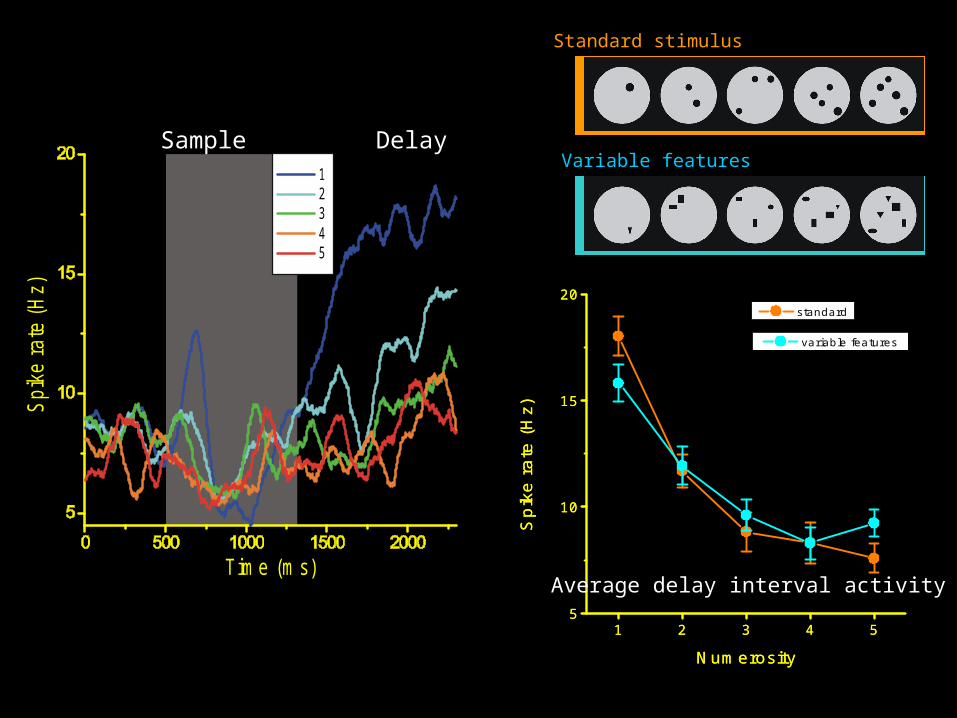
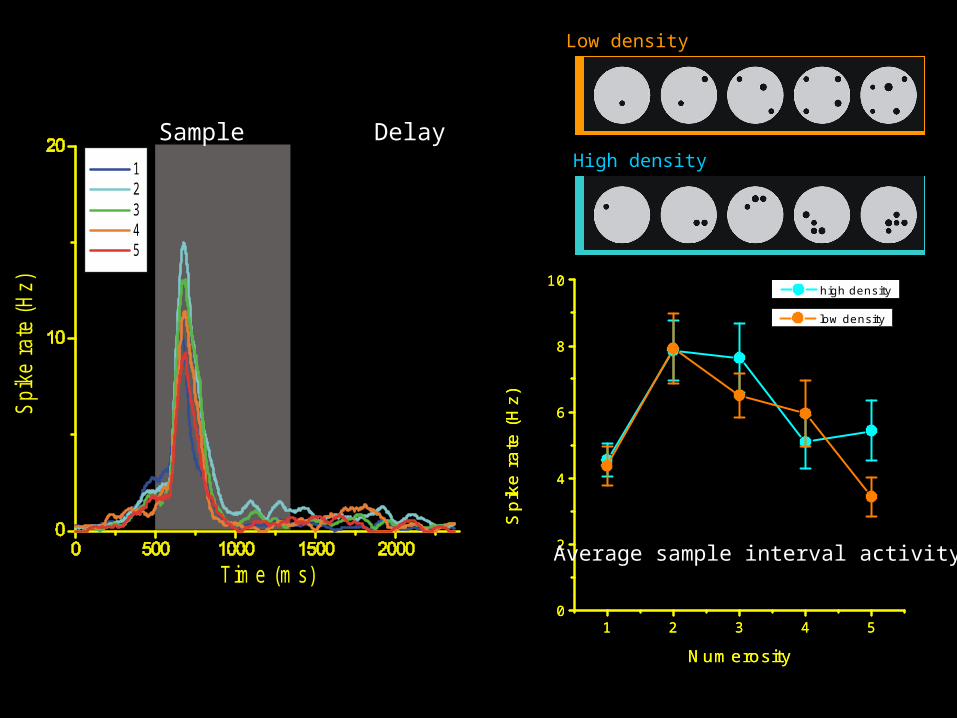
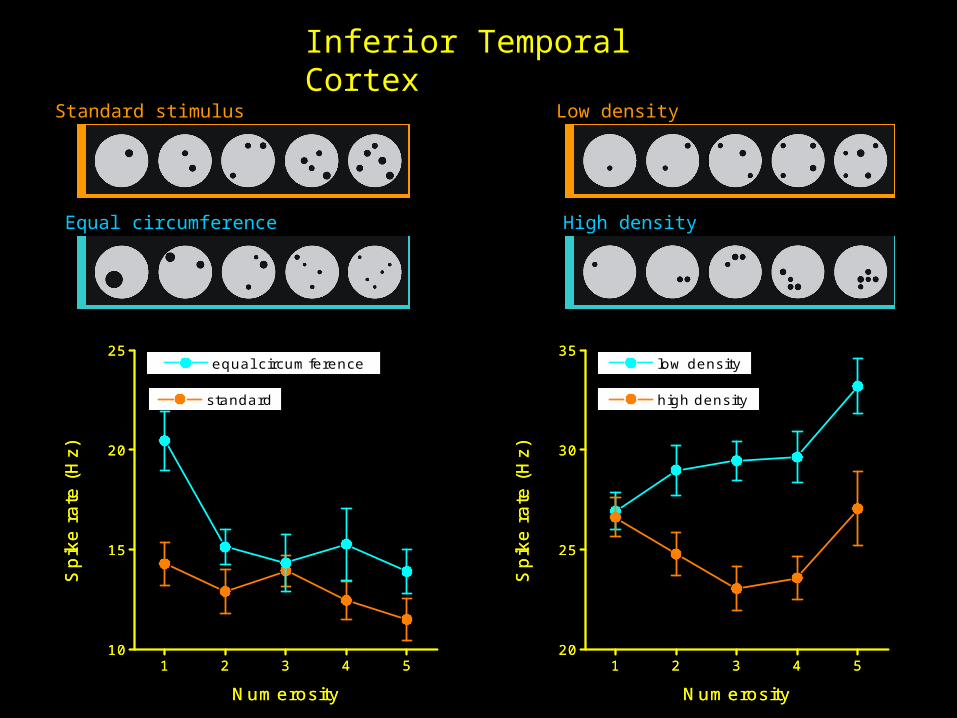
Standard stimulus
Equal area
Equal circumference
Variable features
‘Shape’
Linear
Low density
High density
Trained
Monkeys instantly generalized acrossthe control stimulus sets.
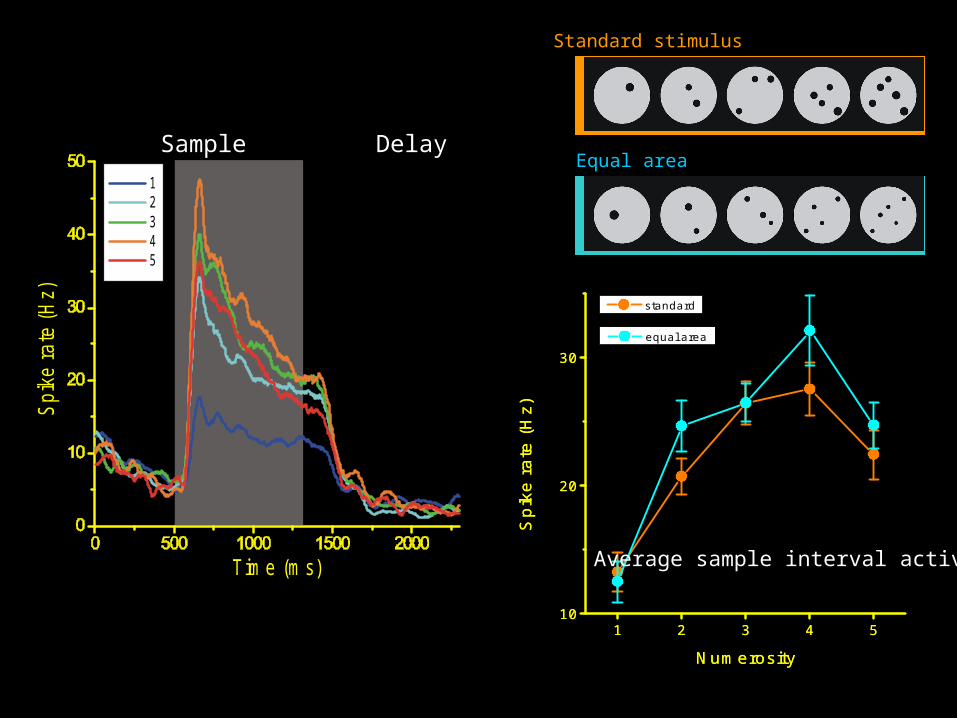
1 2 3 4 510
20
30
standard
Spi
ke r
ate
(Hz)
Numerosity
1 2 3 4 510
20
30 equal area
Spi
ke r
ate
(Hz)
Numerosity
Standard stimulus
Equal area 1 2 3 4 5
Spi
ke ra
te (H
z)
Time (ms)
Sample Delay
Average sample interval activity
Standard stimulus
Variable features
1 2 3 4 55
10
15
20 standard
Spi
ke r
ate
(Hz)
Numerosity
1 2 3 4 55
10
15
20
variable features
Spi
ke r
ate
(Hz)
Numerosity
1 2 3 4 5
Spi
ke ra
te (H
z)
Time (ms)
Sample Delay
Average delay interval activity
1 2 3 4 5
Spi
ke ra
te (H
z)
Time (ms)
Low density
High density
1 2 3 4 50
2
4
6
8
10 high density
Spi
ke r
ate
(Hz)
Numerosity
1 2 3 4 50
2
4
6
8
10
low density
Spi
ke r
ate
(Hz)
Numerosity
Sample Delay
Average sample interval activity
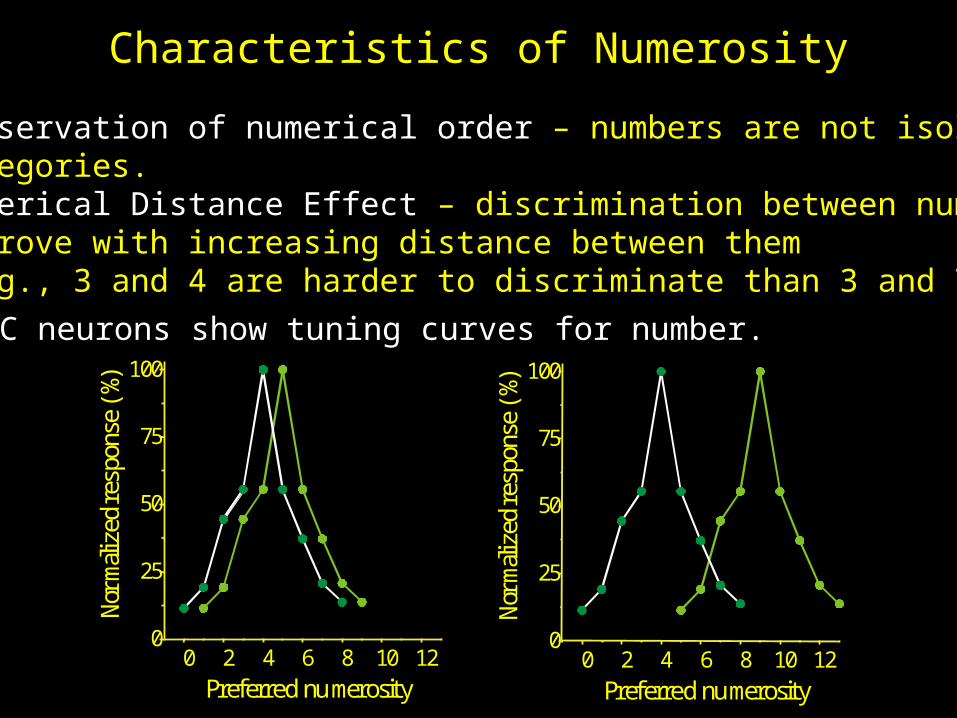
Characteristics of Numerosity
1. Preservation of numerical order – numbers are not isolatedcategories.
2. Numerical Distance Effect – discrimination between numbersimprove with increasing distance between them(e.g., 3 and 4 are harder to discriminate than 3 and 7)
PFC neurons show tuning curves for number.
0 2 4 6 8 10 120
25
50
75
100
Preferred numerosity
Nor
mal
ized
resp
onse
(%)
0 2 4 6 8 10 120
25
50
75
100
Preferred numerosity
Nor
mal
ized
resp
onse
(%)
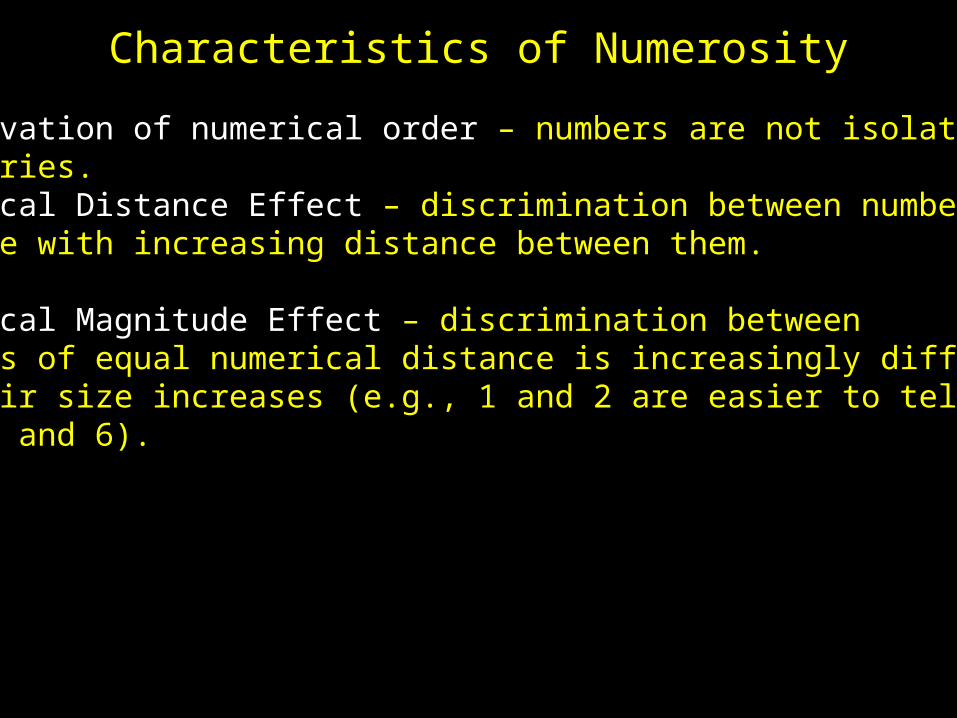
Characteristics of Numerosity
1. Preservation of numerical order – numbers are not isolatedcategories.
2. Numerical Distance Effect – discrimination between numbersimprove with increasing distance between them.
3. Numerical Magnitude Effect – discrimination between numbers of equal numerical distance is increasingly difficult as their size increases (e.g., 1 and 2 are easier to tell apart than 5 and 6).
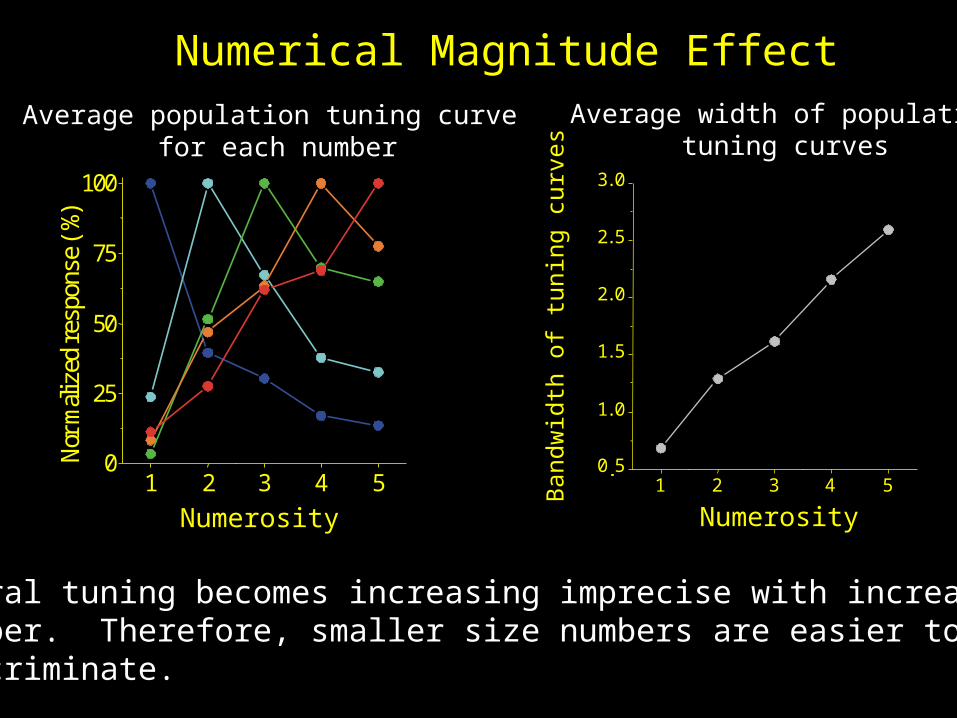
Numerical Magnitude Effect
1 2 3 4 50 5
1.0
1.5
2.0
2.5
3.0
Ban
dwid
th o
f tu
ning
cur
ves
Average population tuning curve for each number
Neural tuning becomes increasing imprecise with increasingnumber. Therefore, smaller size numbers are easier todiscriminate.
Average width of populationtuning curves
Numerosity1 2 3 4 5
0
25
50
75
100
Nor
mal
ized
res
pons
e (%
)
Numerosity
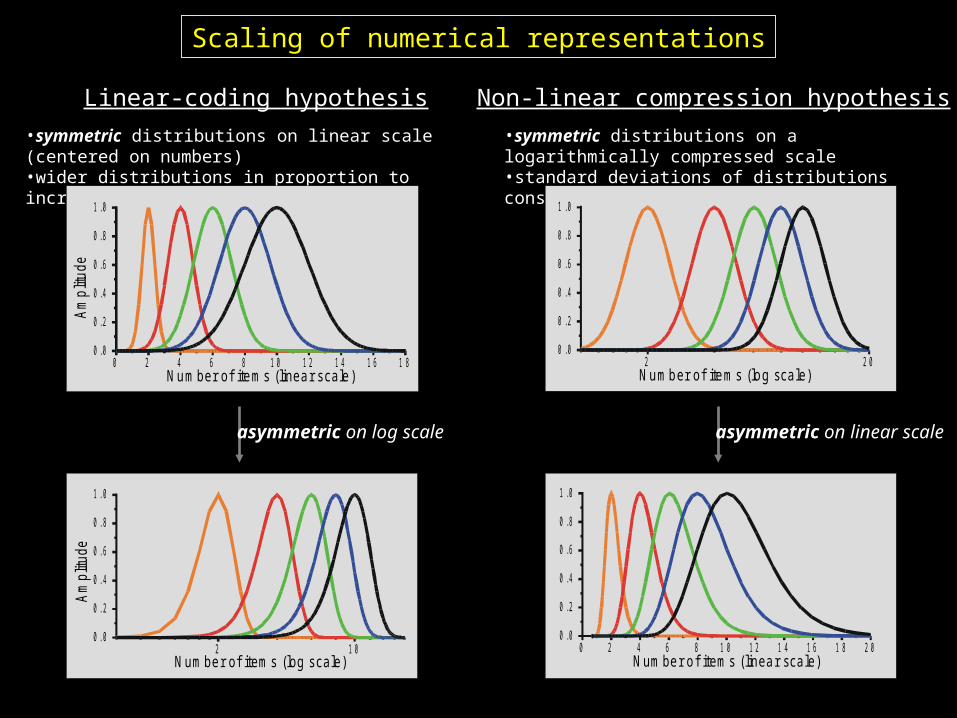
Scaling of numerical representations
Linear-coding hypothesis Non-linear compression hypothesis
•symmetric distributions on linear scale (centered on numbers)•wider distributions in proportion to increasing quantities
•symmetric distributions on a logarithmically compressed scale •standard deviations of distributions constant across quantities
0 2 4 6 8 1 0 1 2 1 4 1 6 1 80 . 0
0 . 2
0 . 4
0 . 6
0 . 8
1 . 0
Am
plitu
de
Number of items (linear scale)
2 1 00 . 0
0 . 2
0 . 4
0 . 6
0 . 8
1 . 0
Am
plitu
de
Number of items (log scale)
2 2 00 . 0
0 . 2
0 . 4
0 . 6
0 . 8
1 . 0
Number of items (log scale)
0 2 4 6 8 1 0 1 2 1 4 1 6 1 8 2 00 . 0
0 . 2
0 . 4
0 . 6
0 . 8
1 . 0
Number of items (linear scale)
asymmetric on log scale asymmetric on linear scale
1 2 3 4 5 6 7 8 9 10 11
0
20
40
60
80
100
monkey Tmonkey PaverageP
erfo
rman
ce (
% c
orre
ct)
Number of items (linear scale)
1 5 10
0
20
40
60
80
100
monkey Tmonkey PaverageP
erfo
rman
ce (
% c
orre
ct)
Number of items (log scale)
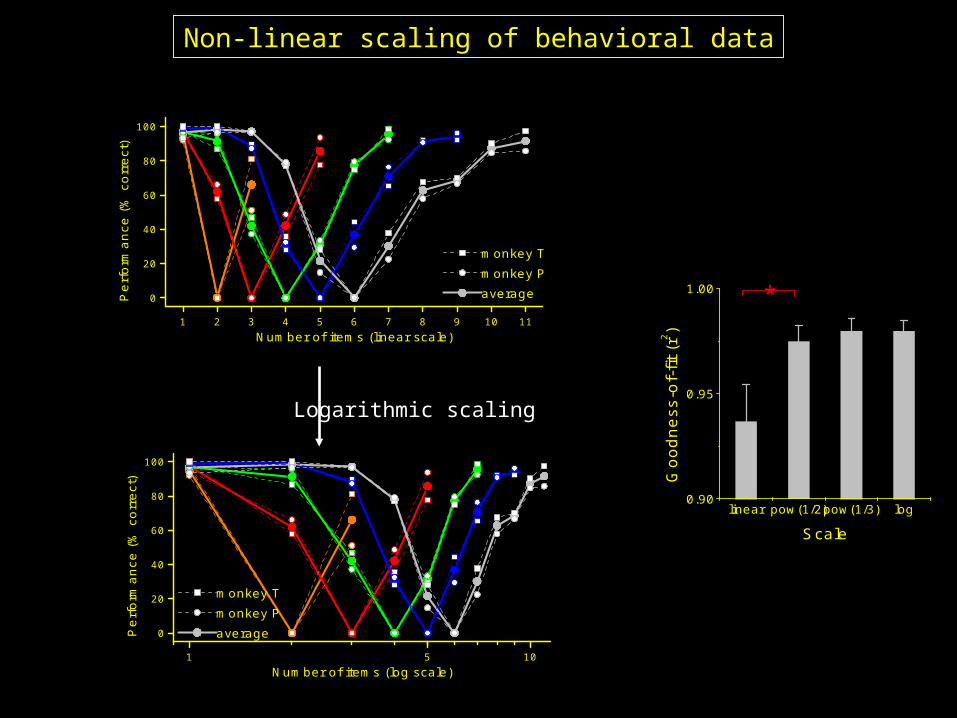
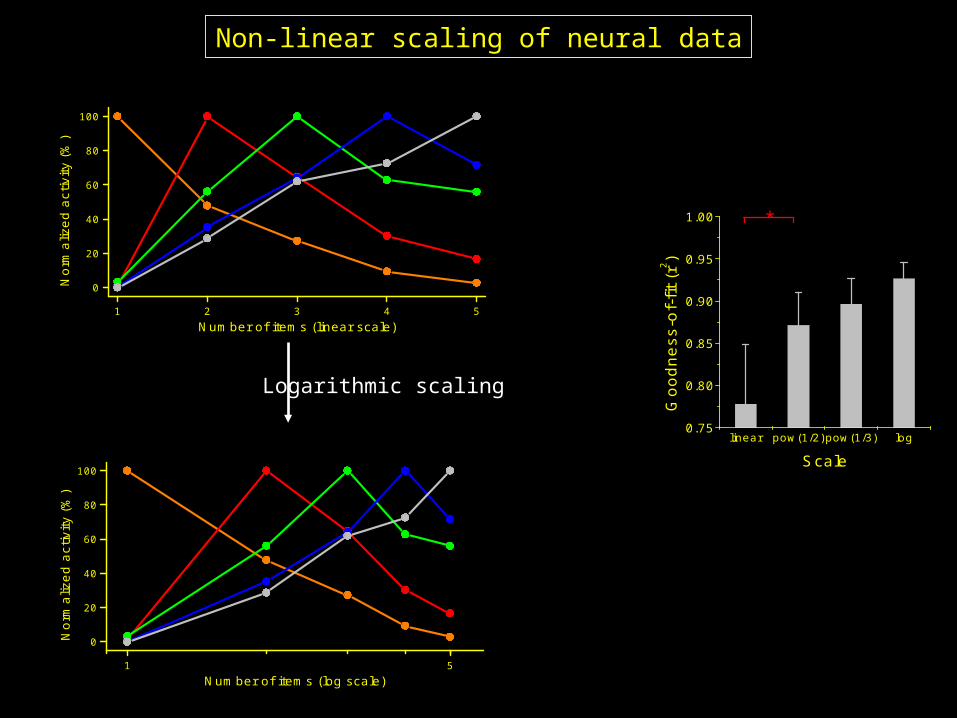
Non-linear scaling of behavioral data
Logarithmic scaling
linear pow(1/2)pow(1/3) log0.90
0.95
1.00 *
Goo
dnes
s-of
-fit
(r2 )
Scale
linear pow(1/2)pow(1/3) log0.75
0.80
0.85
0.90
0.95
1.00 *
Goo
dnes
s-of
-fit
(r2 )
Scale
1 2 3 4 5
0
20
40
60
80
100
Nor
mal
ized
act
ivity
(%
)
Number of items (linear scale)
1 5
0
20
40
60
80
100
Nor
mal
ized
act
ivity
(%
)
Number of items (log scale)
Logarithmic scaling
Non-linear scaling of neural data

Scaling of numerical representations
Linear-coding hypothesis Non-linear compression hypothesis
•symmetric distributions on linear scale (centered on numbers)•wider distributions in proportion to increasing quantities
•symmetric distributions on a logarithmically compressed scale •standard deviations of distributions constant across quantities
0 2 4 6 8 1 0 1 2 1 4 1 6 1 80 . 0
0 . 2
0 . 4
0 . 6
0 . 8
1 . 0
Am
plitu
de
Number of items (linear scale)
2 1 00 . 0
0 . 2
0 . 4
0 . 6
0 . 8
1 . 0
Am
plitu
de
Number of items (log scale)
2 2 00 . 0
0 . 2
0 . 4
0 . 6
0 . 8
1 . 0
Number of items (log scale)
0 2 4 6 8 1 0 1 2 1 4 1 6 1 8 2 00 . 0
0 . 2
0 . 4
0 . 6
0 . 8
1 . 0
Number of items (linear scale)
asymmetric on log scale asymmetric on linear scale
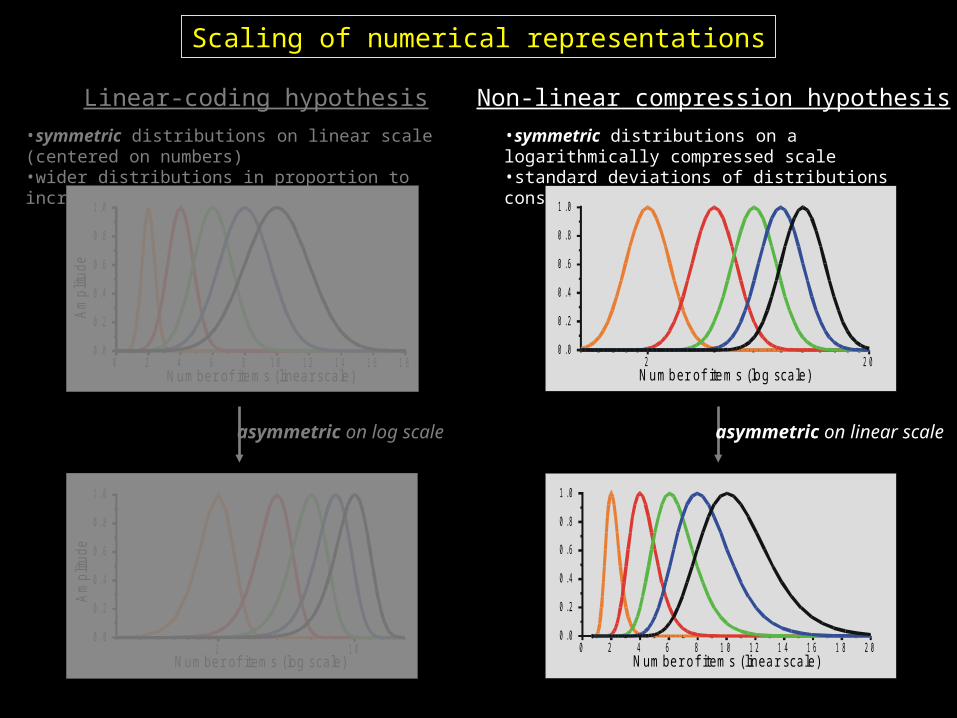
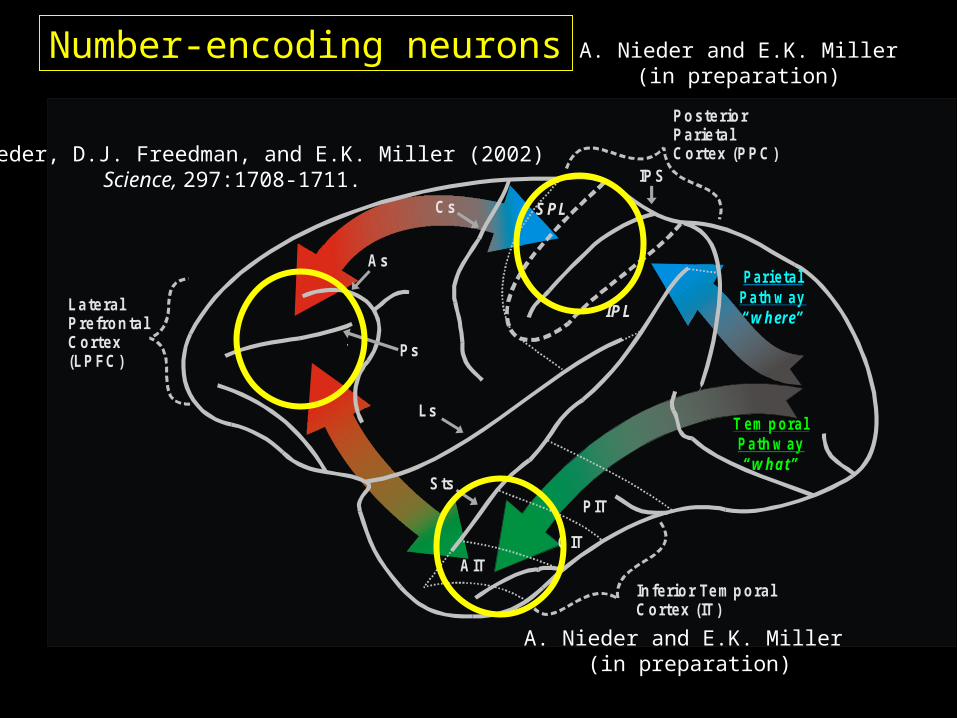
PosteriorParietalCortex (PPC )
Ps
LateralPrefrontalCortex (LPFC)
As
Cs
Ls
IPL
SPL
P arietal P ath w ay“w here”
IPS
Sts
AITCIT
PIT
Inferior TemporalCortex (IT)
T em p oralP ath w ay“w ha t”
Number-encoding neurons
A. Nieder, D.J. Freedman, and E.K. Miller (2002)Science, 297:1708-1711.
A. Nieder and E.K. Miller (in preparation)
A. Nieder and E.K. Miller (in preparation)
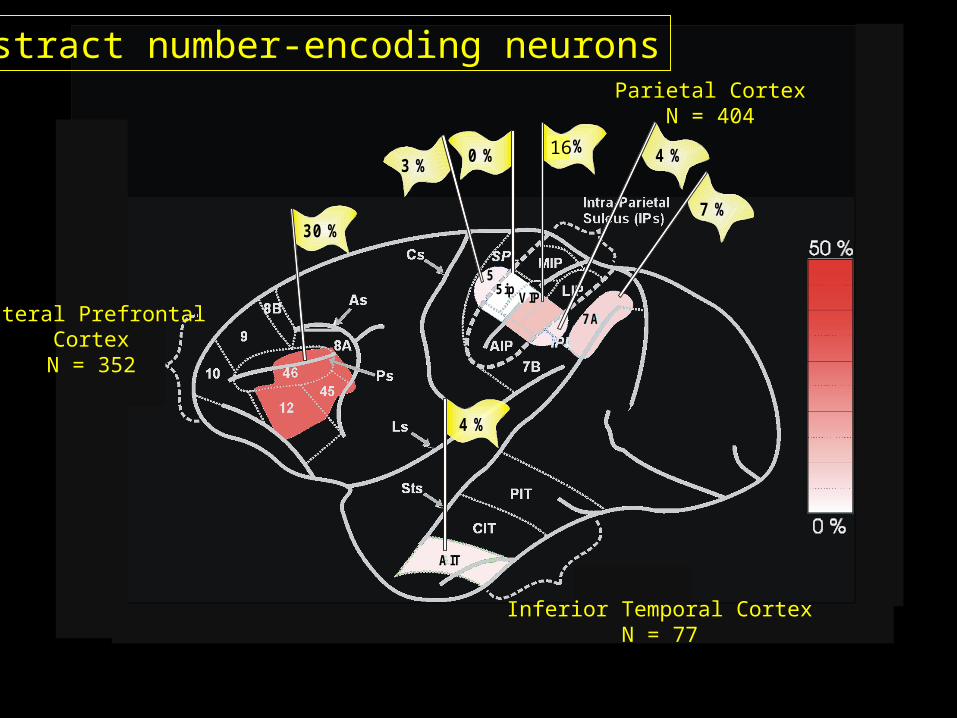
Sts
Ps
As
Cs
Ls
55ip
VIP
7A
AIT
30 %
3 %0 % 12 % 4 %
7 %
4 %
55ip
VIP
7A
AIT
Parietal CortexN = 404
Abstract number-encoding neurons
Lateral PrefrontalCortex
N = 352
Inferior Temporal CortexN = 77
16
1 2 3 4 520
25
30
35 low density
Sp
ike
ra
te (
Hz)
Numerosity
1 2 3 4 520
25
30
35
high density
Sp
ike
ra
te (
Hz)
Numerosity
Low density
Inferior Temporal Cortex
1 2 3 4 510
15
20
25
standard
Sp
ike
ra
te (
Hz)
Numerosity
1 2 3 4 510
15
20
25 equal circumference
Sp
ike
ra
te (
Hz)
Numerosity
High densityEqual circumference
Standard stimulus
Behavior-guiding Rules
Jonathan WallisWael AsaadKathleen AndersonGregor RainerEarl Miller
www.millerlab.org
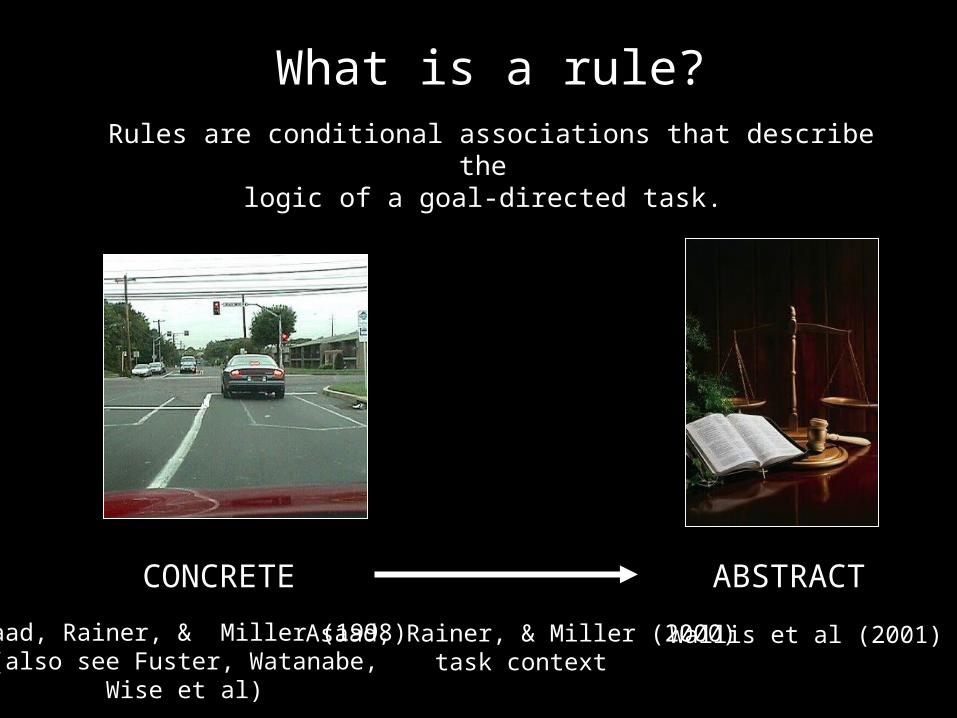
CONCRETE ABSTRACT
What is a rule?Rules are conditional associations that describe the
logic of a goal-directed task.
Asaad, Rainer, & Miller (1998)(also see Fuster, Watanabe,
Wise et al)
Asaad, Rainer, & Miller (2000)task context
Wallis et al (2001)
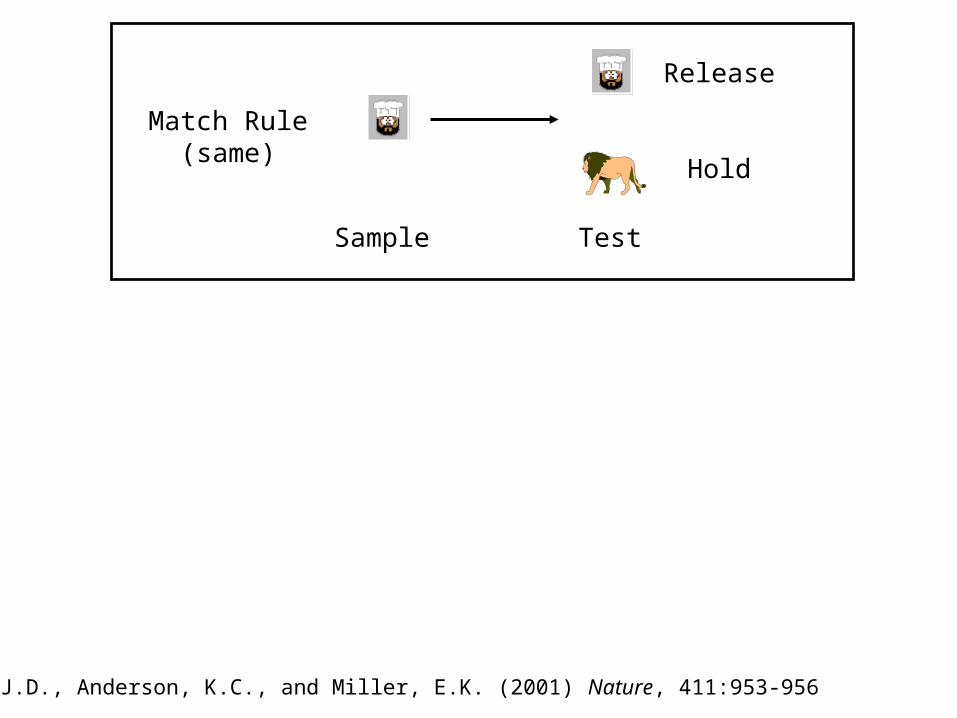
Release
Hold
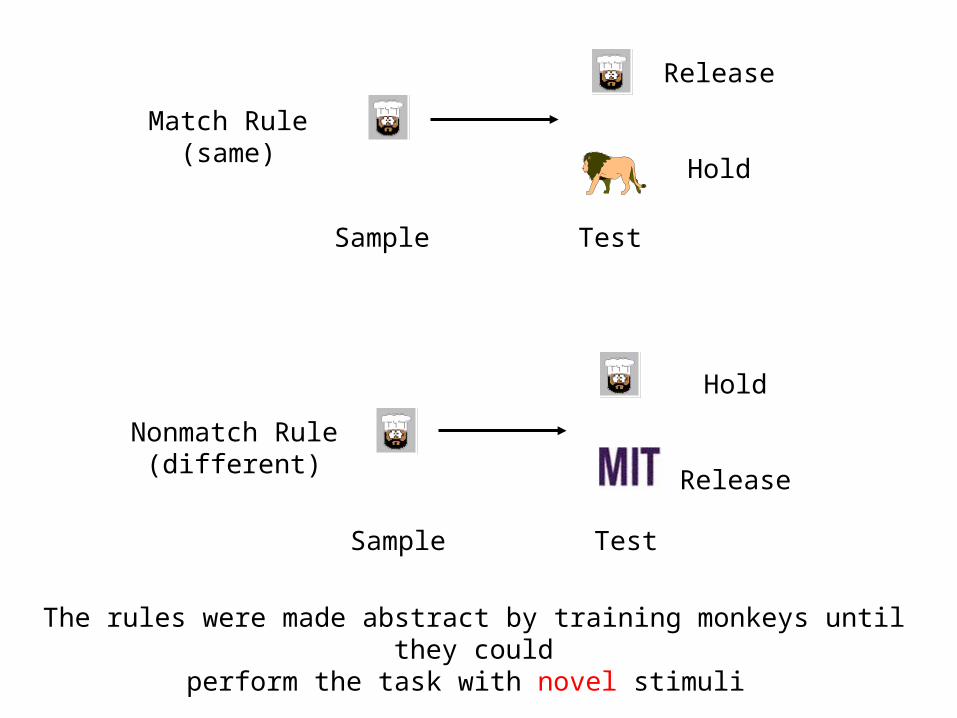
Match Rule(same)
Sample Test
Wallis, J.D., Anderson, K.C., and Miller, E.K. (2001) Nature, 411:953-956
Sample
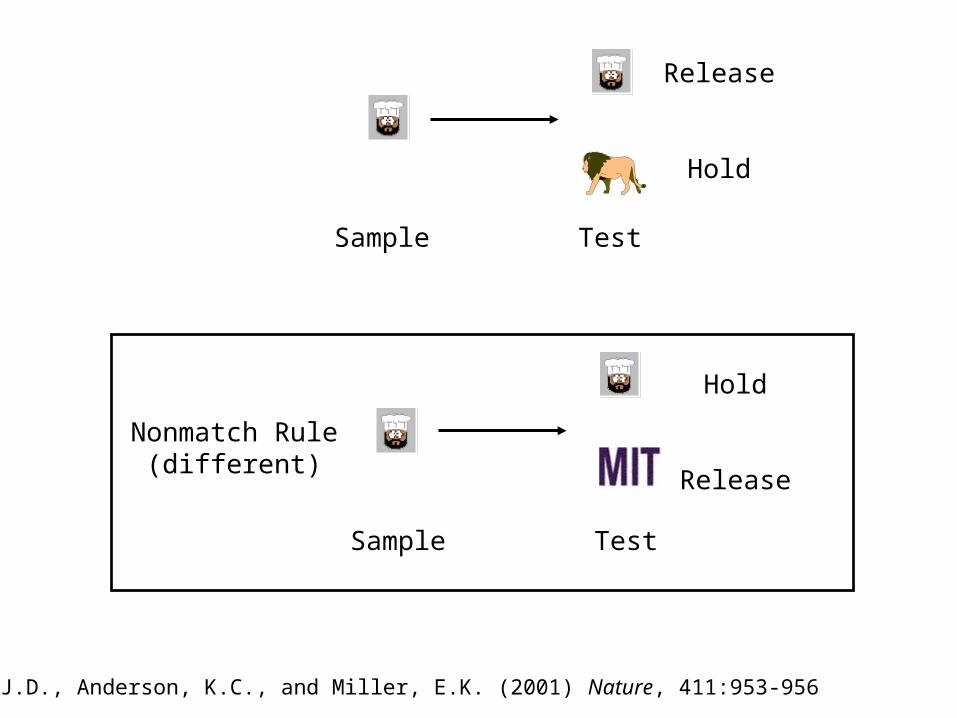
Nonmatch Rule(different)
Test
Wallis, J.D., Anderson, K.C., and Miller, E.K. (2001) Nature, 411:953-956
Release
Hold
Hold
Release
Sample Test
Sample
Sample
Test
Test
Release
Hold
The rules were made abstract by training monkeys until they couldperform the task with novel stimuli
Match Rule(same)
Nonmatch Rule(different)
Hold
Release
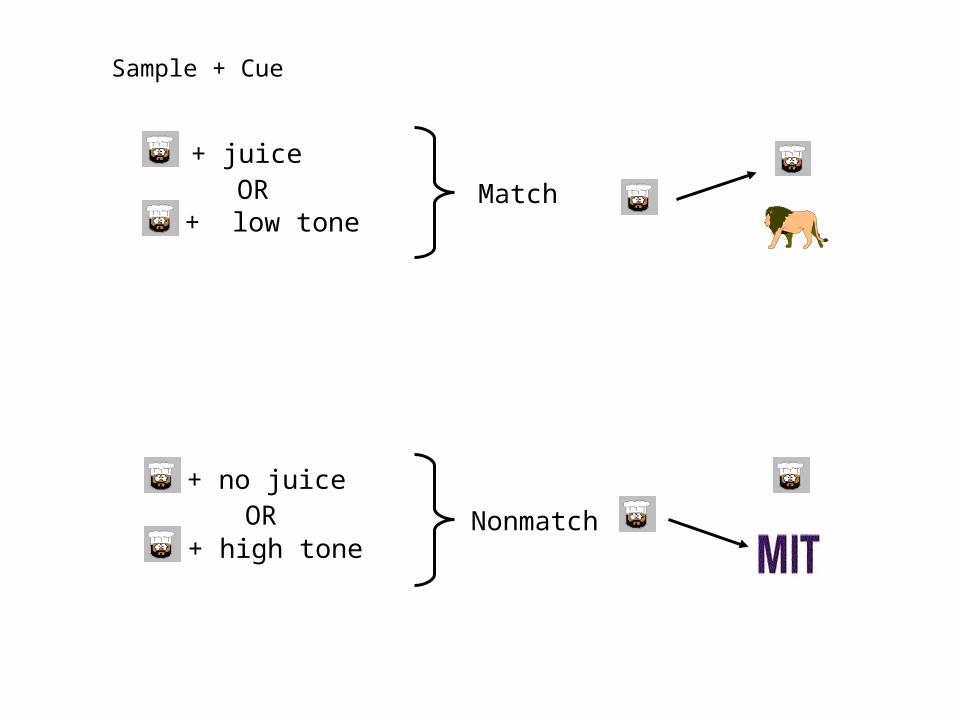
+ juice
+ no juice
Match+ low tone
+ high tone
OR
OR
Sample + Cue
Nonmatch
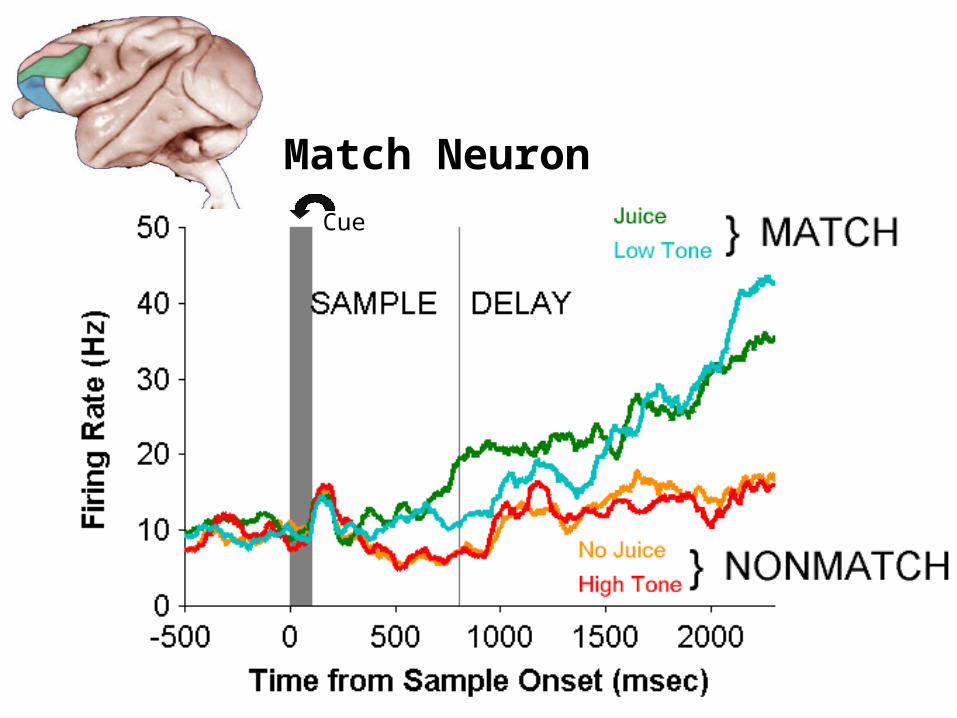
Match Neuron
Cue
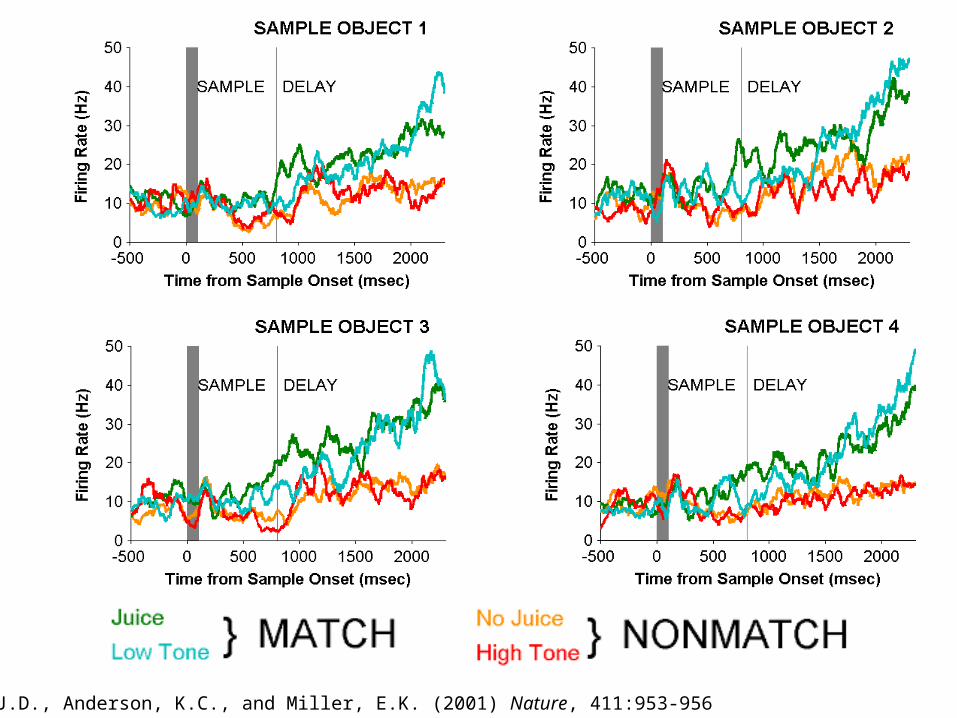
Wallis, J.D., Anderson, K.C., and Miller, E.K. (2001) Nature, 411:953-956

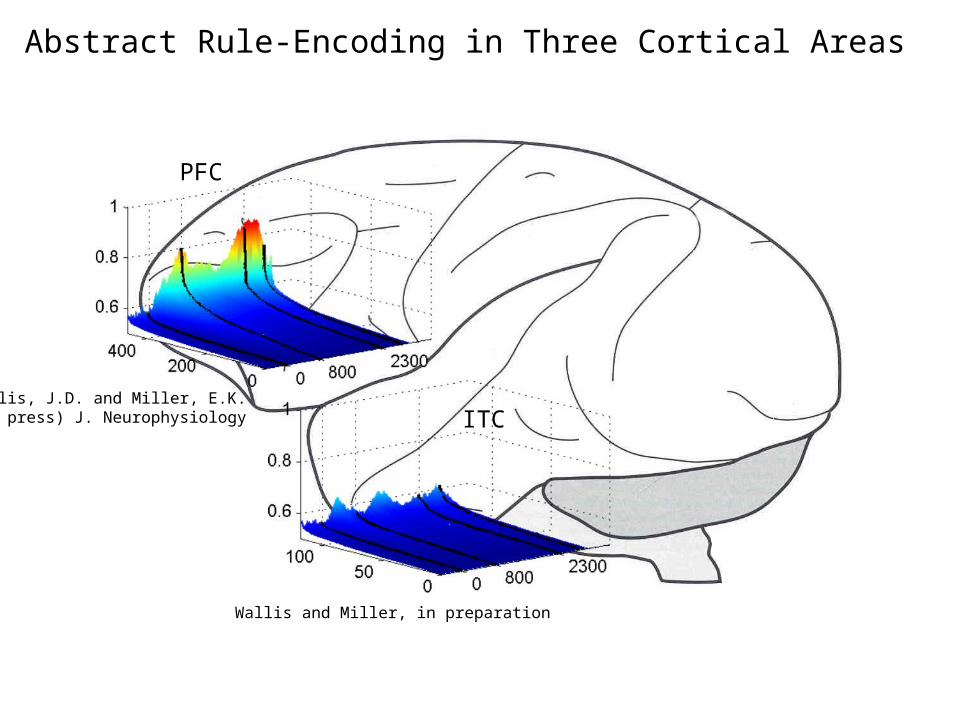
Rule Representation in Other Cortical Areas
PFC
ITC
PMC
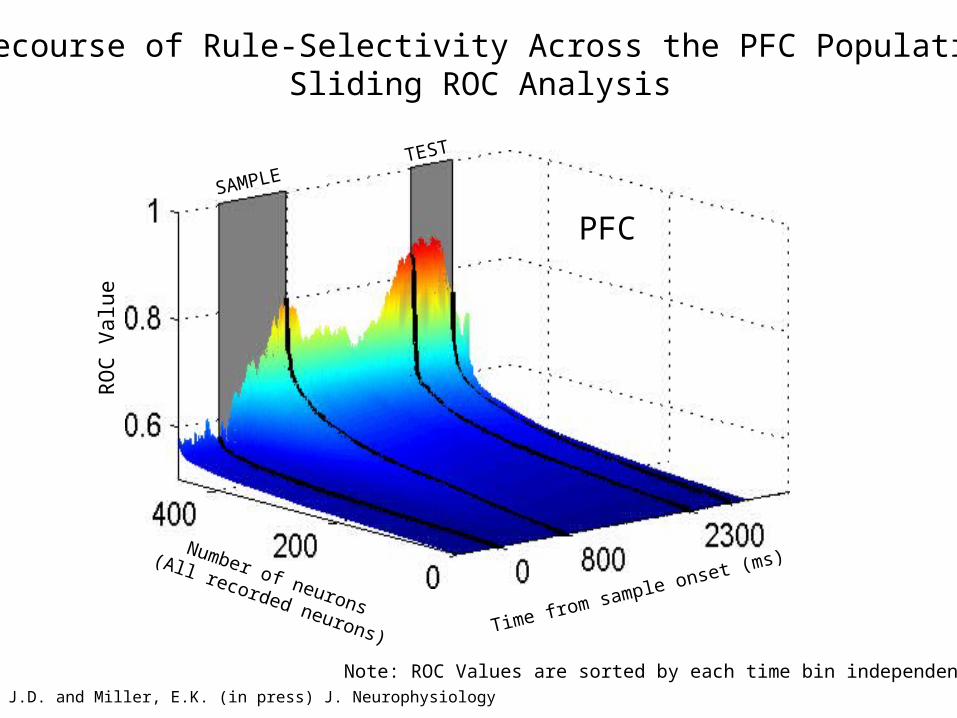
SAMPLETEST
RO
C V
alue
Number of neurons
(All recorded neurons) Time from sample onset (ms)
PFC
Timecourse of Rule-Selectivity Across the PFC Population:Sliding ROC Analysis
Note: ROC Values are sorted by each time bin independentlyWallis, J.D. and Miller, E.K. (in press) J. Neurophysiology
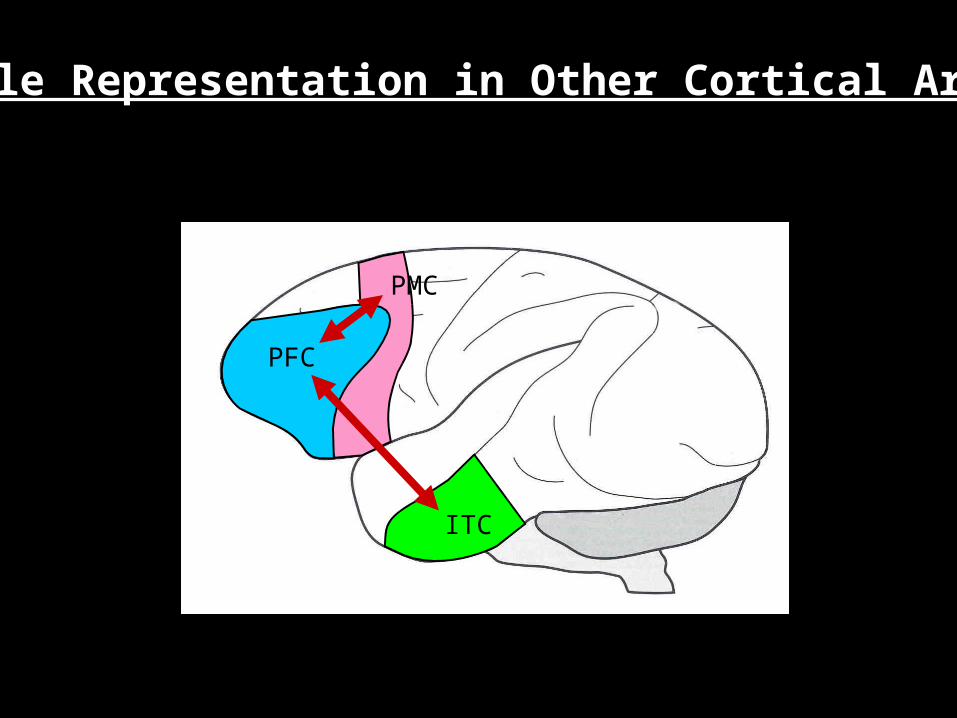
Rule Representation in Other Cortical Areas
PFC
ITC
PMC
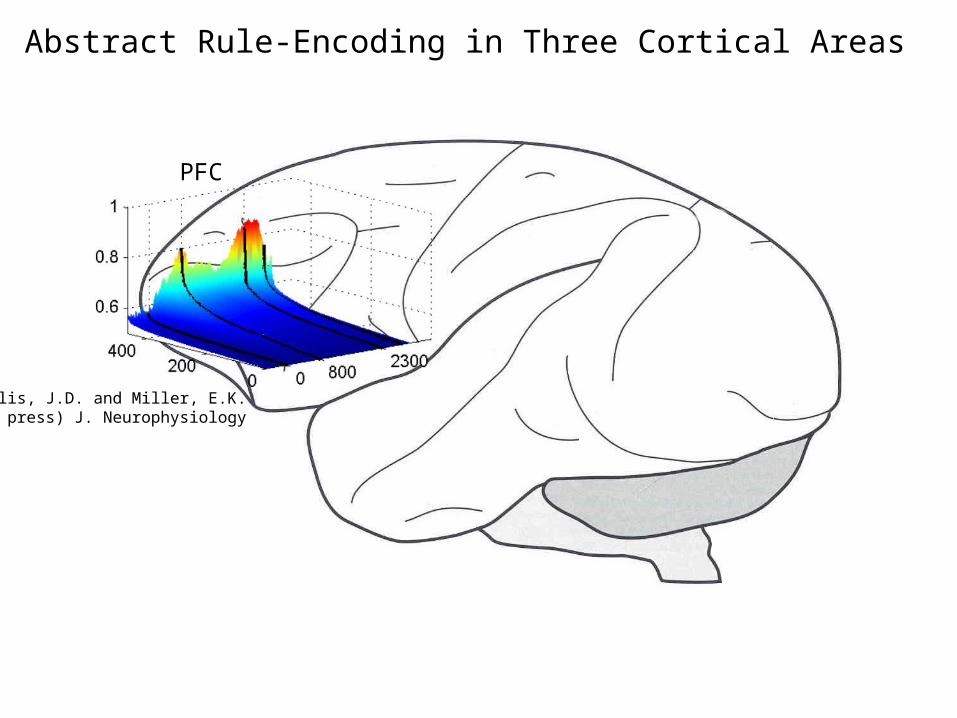
PFC
Abstract Rule-Encoding in Three Cortical Areas
Wallis, J.D. and Miller, E.K. (in press) J. Neurophysiology
PFC
ITC
Abstract Rule-Encoding in Three Cortical Areas
Wallis and Miller, in preparation
Wallis, J.D. and Miller, E.K. (in press) J. Neurophysiology
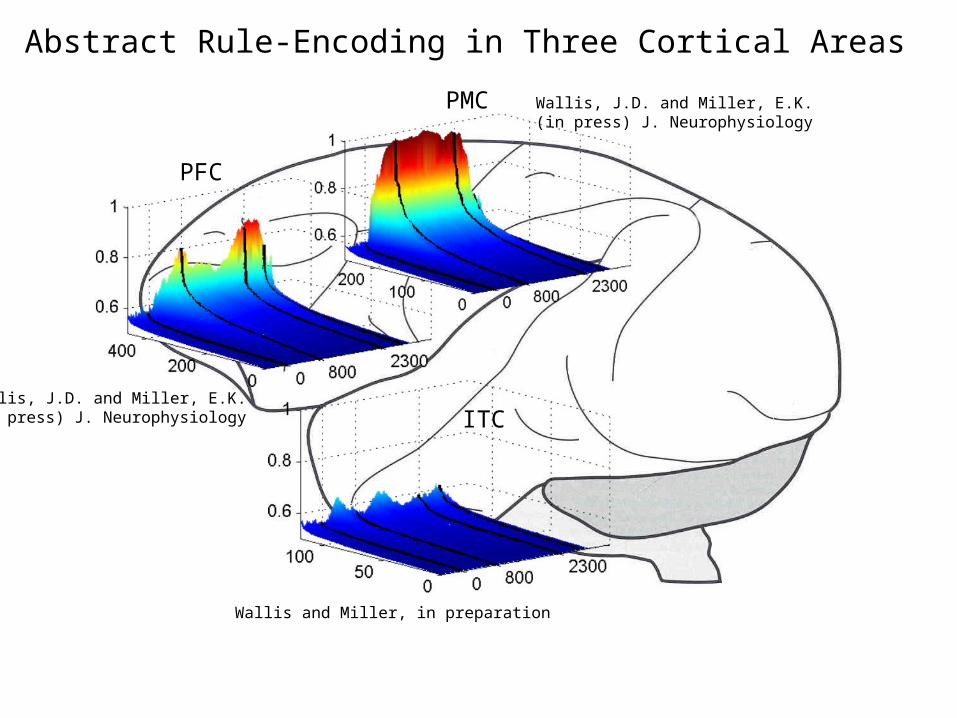
Abstract Rule-Encoding in Three Cortical Areas
PFC
ITC
PMC
Wallis and Miller, in preparation
Wallis, J.D. and Miller, E.K. (in press) J. Neurophysiology
Wallis, J.D. and Miller, E.K. (in press) J. Neurophysiology
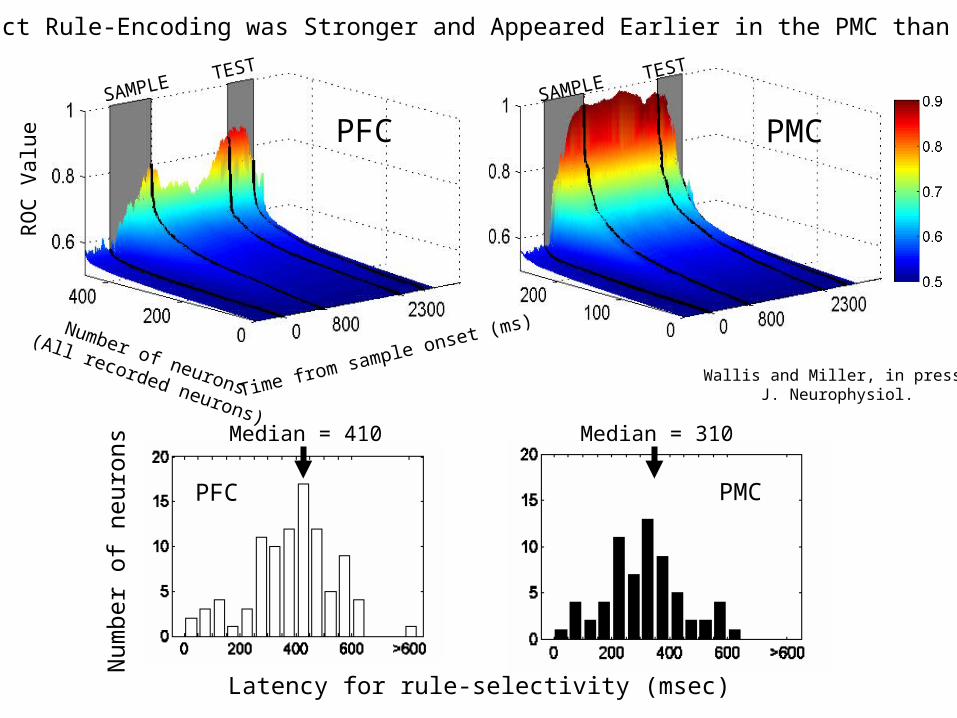
Abstract Rule-Encoding was Stronger and Appeared Earlier in the PMC than PFC
SAMPLE TEST
PMCSAMPLE TEST
RO
C V
alue
Number of neurons
(All recorded neurons)Time from sample onset (ms)
PFC
Latency for rule-selectivity (msec)
Num
ber
of n
euro
ns
Median = 410 Median = 310
PFC PMC
Wallis and Miller, in press, J. Neurophysiol.

Abstract Rule-Encoding in Three Cortical Areas
PFC
ITC
PMC
Wallis and Miller, in preparation
Wallis, J.D. and Miller, E.K. (in press) J. Neurophysiology
Wallis, J.D. and Miller, E.K. (in press) J. Neurophysiology
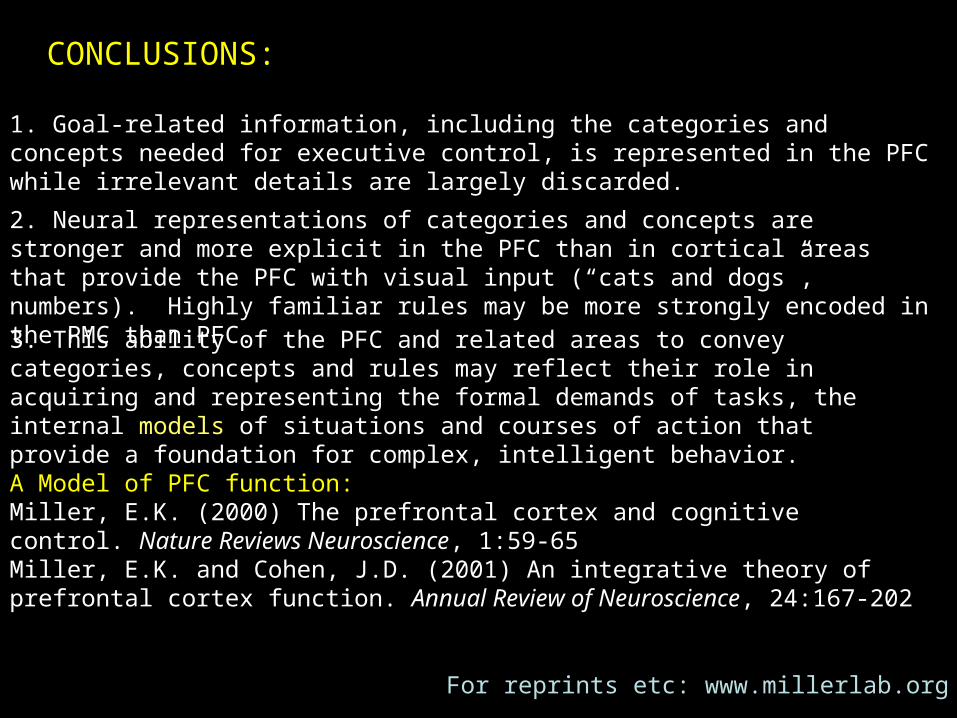
1. Goal-related information, including the categories and concepts needed for executive control, is represented in the PFC while irrelevant details are largely discarded.
3. This ability of the PFC and related areas to convey categories, concepts and rules may reflect their role in acquiring and representing the formal demands of tasks, the internal models of situations and courses of action that provide a foundation for complex, intelligent behavior.
A Model of PFC function:Miller, E.K. (2000) The prefrontal cortex and cognitive control. Nature Reviews Neuroscience, 1:59-65Miller, E.K. and Cohen, J.D. (2001) An integrative theory of prefrontal cortex function. Annual Review of Neuroscience, 24:167-202
For reprints etc: www.millerlab.org
2. Neural representations of categories and concepts are stronger and more explicit in the PFC than in cortical areas that provide the PFC with visual input (“cats and dogs”, numbers). Highly familiar rules may be more strongly encoded in the PMC than PFC.
CONCLUSIONS:
Active Inactive
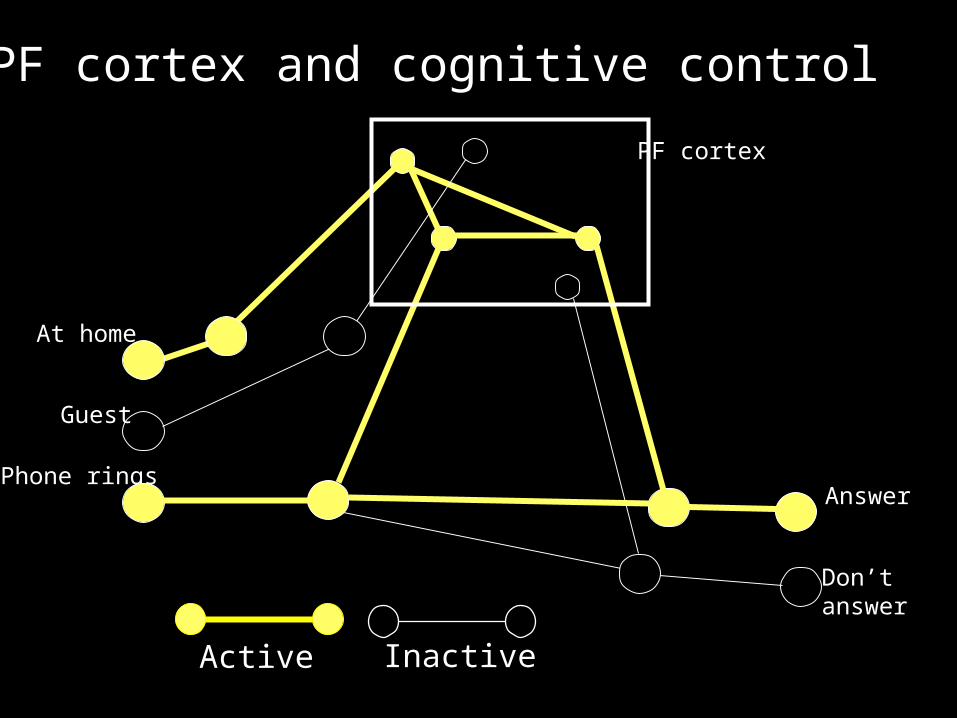
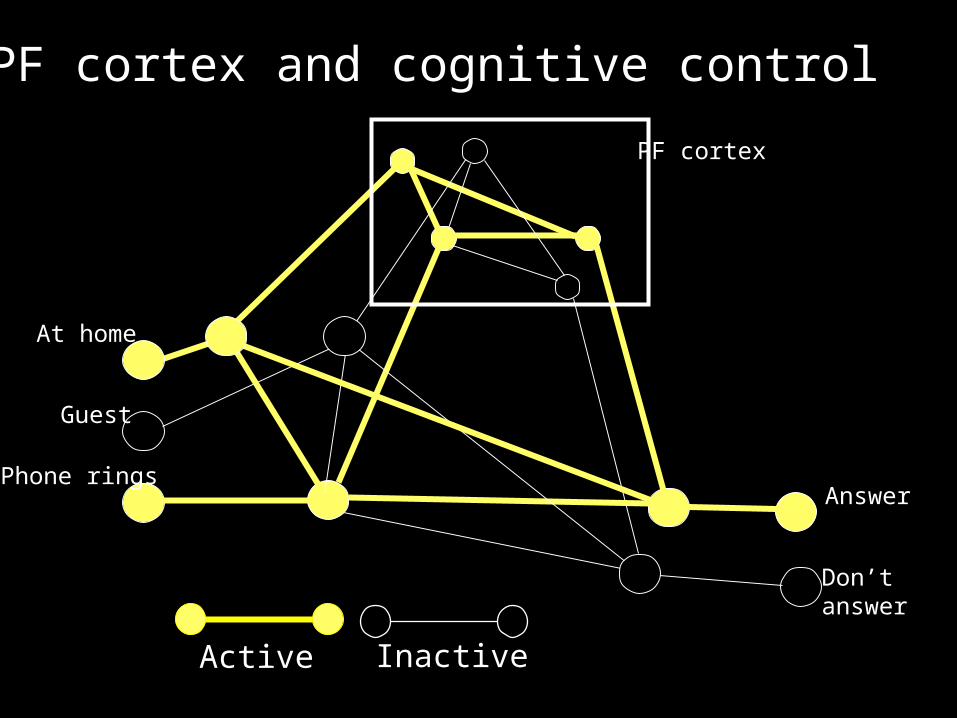
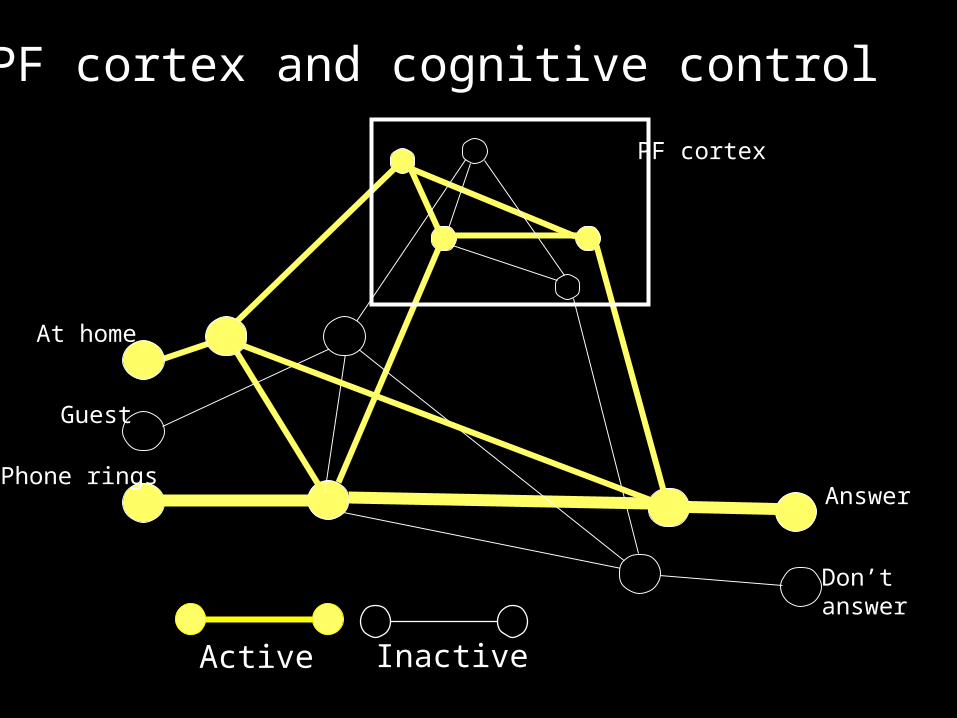
The PF cortex and cognitive control
Phone ringsAnswer
Don’tanswer
Active Inactive
The PF cortex and cognitive control
Phone ringsAnswer
Don’tanswer
At home
Guest
Active Inactive
The PF cortex and cognitive control
Phone ringsAnswer
Don’tanswer
At home
Guest
PF cortex
Active Inactive
The PF cortex and cognitive control
Phone ringsAnswer
Don’tanswer
At home
Guest
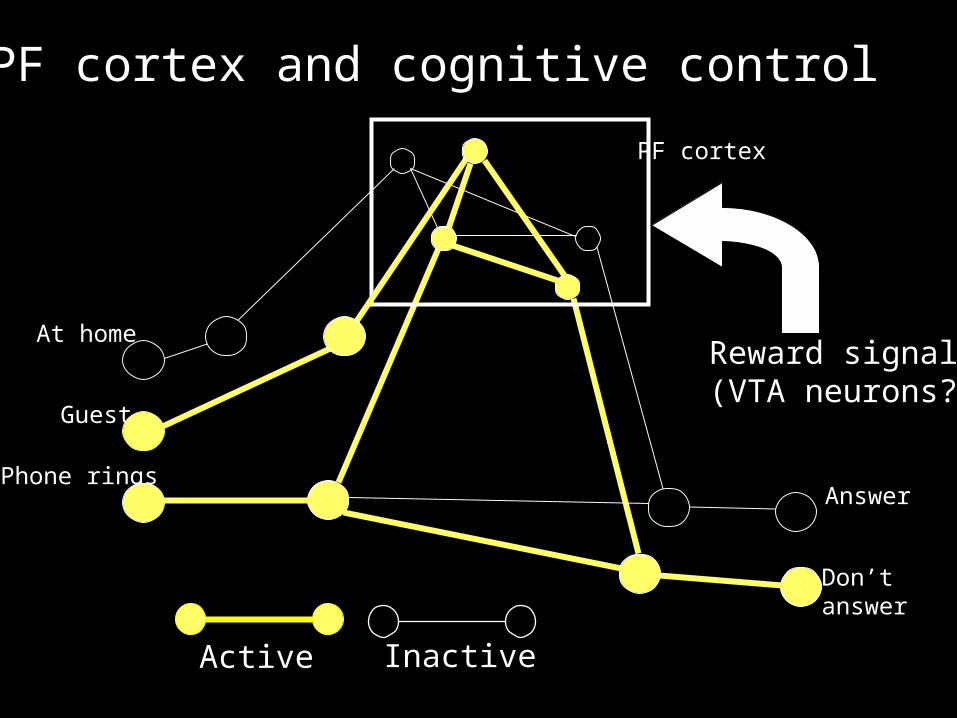
PF cortex
Reward signals(VTA neurons?)
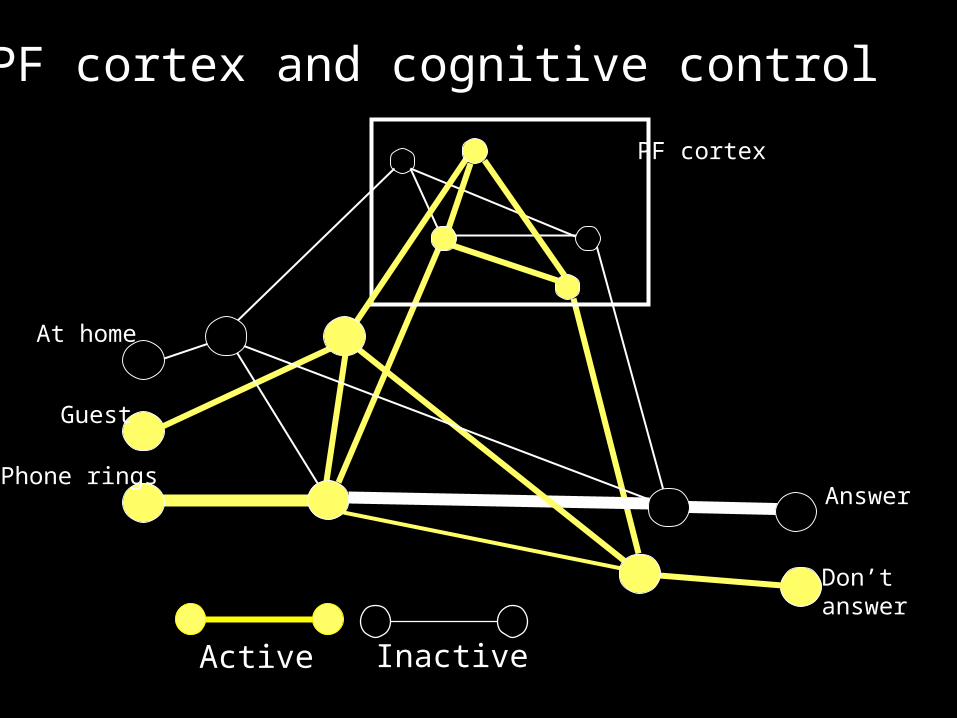
Active Inactive
The PF cortex and cognitive control
Phone ringsAnswer
Don’tanswer
At home
Guest
PF cortex
Active Inactive
The PF cortex and cognitive control
Phone ringsAnswer
Don’tanswer
At home
Guest
PF cortex
Reward signals(VTA neurons?)
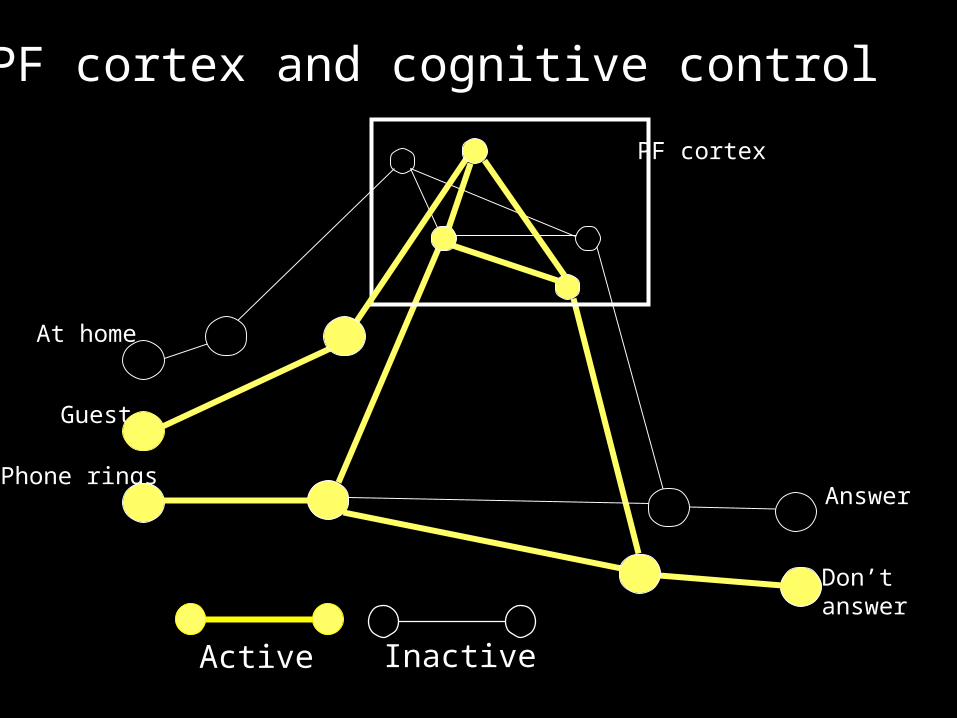
Active Inactive
The PF cortex and cognitive control
Phone ringsAnswer
Don’tanswer
At home
Guest
PF cortex
Active Inactive
The PF cortex and cognitive control
Answer
Don’tanswer
PF cortex
Phone rings
Guest
At home
Active Inactive
The PF cortex and cognitive control
Answer
Don’tanswer
PF cortex
At home
Guest
Phone rings
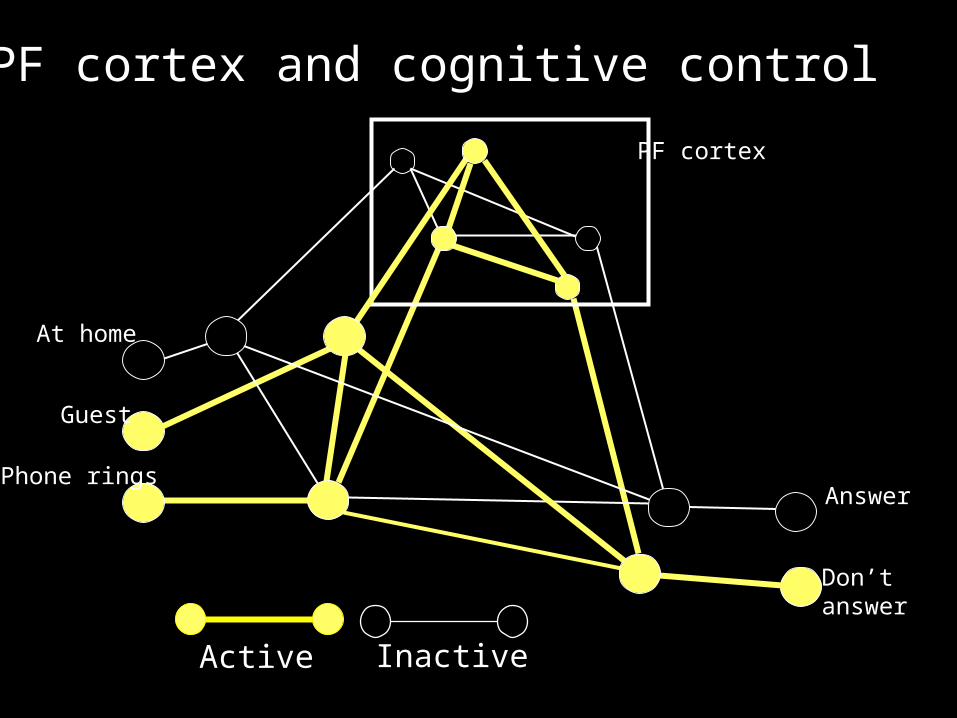
Active Inactive
The PF cortex and cognitive control
Answer
Don’tanswer
PF cortex
At home
Guest
Phone rings
Active Inactive
The PF cortex and cognitive control
Answer
Don’tanswer
PF cortex
Phone rings
Guest
At home
Active Inactive
The PF cortex and cognitive control
Answer
Don’tanswer
PF cortex
At home
Guest
Phone rings
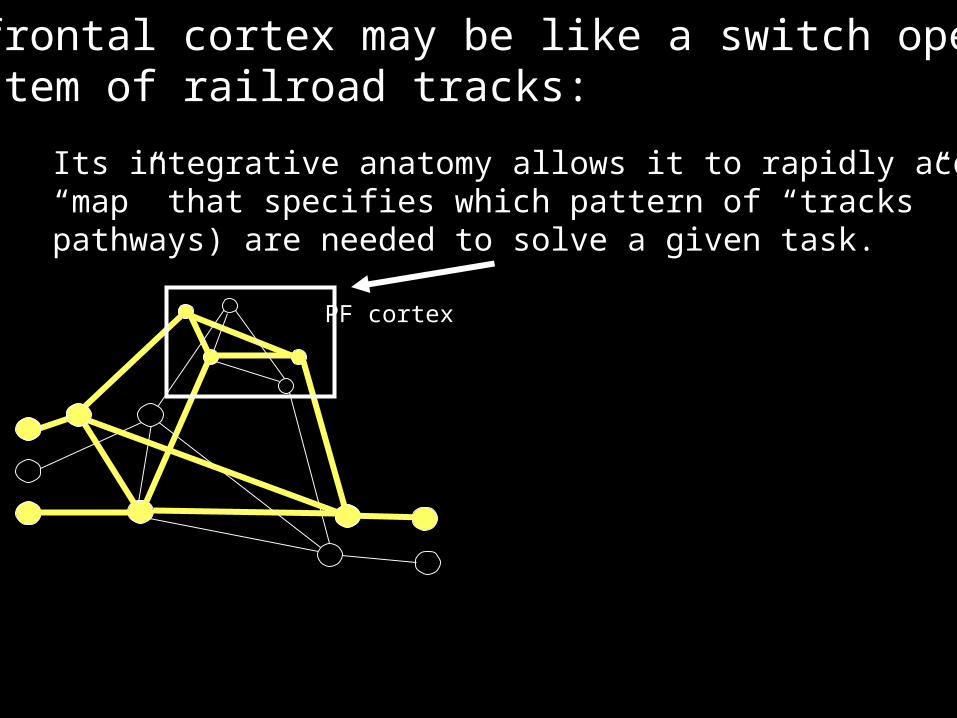
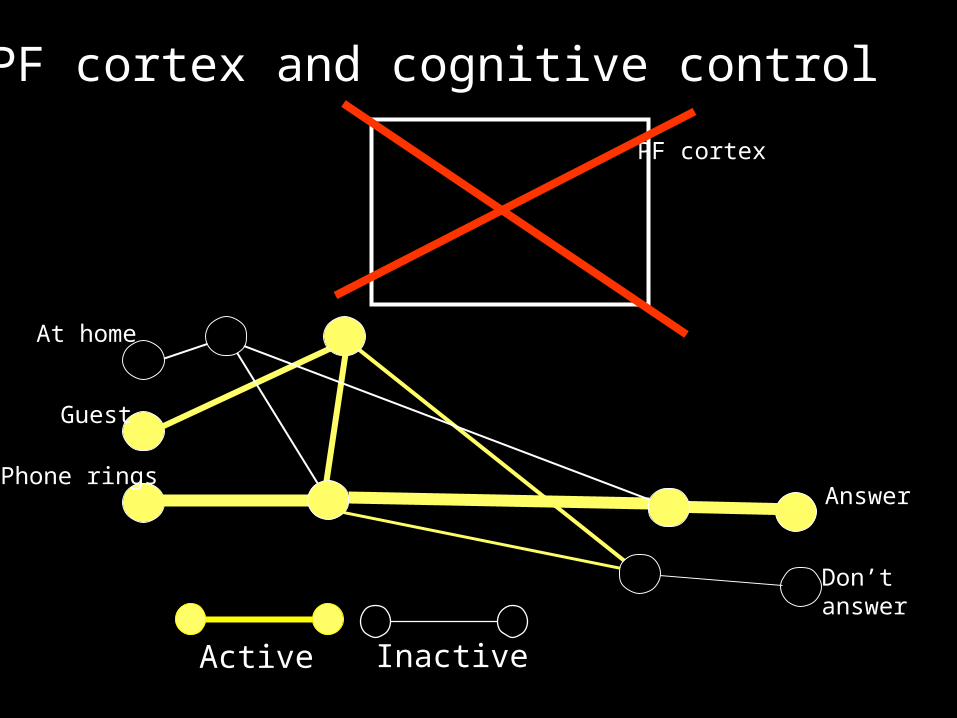
PF cortex
Its integrative anatomy allows it to rapidly acquire a “map” that specifies which pattern of “tracks” (neural pathways) are needed to solve a given task.
The prefrontal cortex may be like a switch operator in a system of railroad tracks:
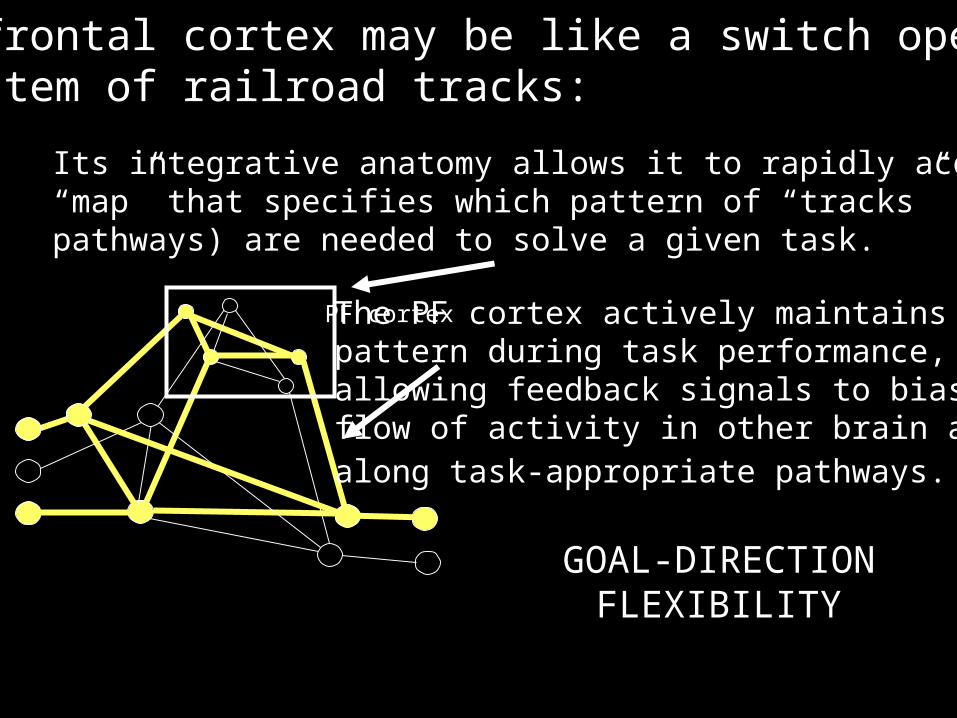
PF cortex
Its integrative anatomy allows it to rapidly acquire a “map” that specifies which pattern of “tracks” (neural pathways) are needed to solve a given task.
The PF cortex actively maintains this pattern during task performance, allowing feedback signals to bias the flow of activity in other brain areas along task-appropriate pathways.
The prefrontal cortex may be like a switch operator in a system of railroad tracks:
GOAL-DIRECTIONFLEXIBILITY
Categories:David FreedmanMax Riesenhuber (Poggio lab)Tomaso Poggio
Numbers:Andreas NiederDavid Freedman
Rules:Jonathan WallisWael AsaadKathy AndersonGregor Rainer
Other Miller Lab members:Tim BuschmanMark HistedChristopher IrvingCindy KiddooKristin Maccully Michelle Machon Anitha PasupathyJefferson RoyMelissa Warden
Miller Lab @ MIT (www.millerlab.org)
![The Prefrontal Cortex: A Basic Embryological, Histological ... · III. Orbital prefrontal cortex [orbitofrontal cortex]: Brodmann’s areas 11, 12, and 13 constitute the orbital PFC](https://img.pdfslide.net/doc/110x75/5fc315edd007e71901019aff/the-prefrontal-cortex-a-basic-embryological-histological-iii-orbital-prefrontal.jpg)