Embed Size (px)
Citation preview
Washington State Pregnancy and Induced Abortion Statistics 2001 December 2002 For more information contact: Center for Health Statistics 1112 SE Quince Street PO Box 47814 Olympia, WA 98504-7814 360 236-4300 Fax 360 753-4135 Mary Selecky Secretary
Center for Health Statistics,Pregnancy & Induced Abortion Statistics report staff: John Whitbeck, Manager, Research Services (360) 236-4321 Phyllis Reed, Research Investigator – Abortions and Deaths (360) 236-4207 Patricia Starzyk, Research Investigator - Births (360) 236-4323 Gregory Newkirk, IT Application Specialist, Research Services (360) 236-4332 Design Consultation: Office of Health Promotion Acknowledgements: We gratefully acknowledge the contributions of the many individuals who participate in the reporting of birth, fetal death, and abortion data. Their contributions are essential to the very important public health indicators contained in this report. We thank Charles Mies in the Center for Health Statistics, Statistical Services Section for his role as data coordinator for the Abortion Reporting System and Margaret Love in the Center for Health Statistics, Research Services Section for her role as publishing coordinator for CHS. Jac Davies Assistant Secretary Epidemiology, Health Statistics & Public Health Laboratories Teresa Jennings State Registrar and Director Center for Health Statistics
Washington Pregnancy and Induced Abortion Statistics, 2001
Table of Contents Introduction.............................................................................................................3
Why is data on Induced Abortion important? ...............................................................................3 Data Reporting Issues.............................................................................................5
Source of Pregnancy and Induced Abortion Data .........................................................................5 1997 Revisions to Abortion Reporting Form ................................................................................7
How To Use Pregnancy and Abortion Data .........................................................8 Why Read this Section?.................................................................................................................8 Issues in Using the Data ................................................................................................................8 Residence vs. Occurrence..............................................................................................................8
Abortions Occurring in Washington & Abortions of Washington Residents During 2001..............................9 Numbers vs. Rates .........................................................................................................................9 Standards for Comparison of Rates .............................................................................................10 Unknowns....................................................................................................................................11 Confidentiality .............................................................................................................................14
Additional Services ...............................................................................................15 Washington State Counties ..................................................................................17 Overview................................................................................................................17
Change Over Time.......................................................................................................................17 Table 1. Induced Abortions, Live Births, and Abortion Ratios, Washington State Residents, 1982-20011 18 Table 2. Pregnancy Statistics1, Washington State Residents, 1982-2001 .................................................18 Table 2. Pregnancy Statistics1, Washington State Residents, 1982-2001 .................................................19 Table 3. Teenage Pregnancy Rates1 by Age Group, Washington State Residents, 1980-2001................20 Table 4. Induced Abortion Rates1 by County of Residence, Washington State, 1995-2001 .......................22 Table 5. Induced Abortion Rates1 with Ranks by County, Washington State Residents, 1997-2001 ........23 Figure 1. General Fertility Rates1, Washington State Residents Compared to National, 1980-2001..........24 Figure 2. Washington State General Fertility Rates by County of Residence, 1998–2001 (Washington State
Rate = 62.27)...............................................................................................................................24 Statistics Tables.....................................................................................................27
Table 01-1. Pregnancy Outcomes of Residents by Woman’s Age, 2001...................................................27 Table 01-2. Age-Specific Rates1 and Abortion Ratios of Residents, 2001.................................................27 Table 01-3. Induced Abortions of Residents by Selected Indicators, 2001 ................................................28 Table 01-4. Induced Abortions of Residents by Woman's Age and Weeks of Gestation, 2001.................29 Table 01-5. Previous Live Births of Women Having Abortions by Age Washington State Residents, 200130 Table 01-6. Previous Induced Abortions of Women Having Abortions by Age Washington State Residents,
2001 ............................................................................................................................................30 Table 01-7. Induced Abortions by Woman's Age and Place of Occurrence or Residence, 2001...............31 Table 01-8. Induced Abortions Occurring Within Washington State by Selected Indicators, 2001 ............32 Table 01-9. Induced Abortions Occurring Within State by Type of Procedure and Weeks of Gestation, 2001
....................................................................................................................................................33 Table 01-10. Induced Abortions with Complications Occurring Within State by Type of Procedure and
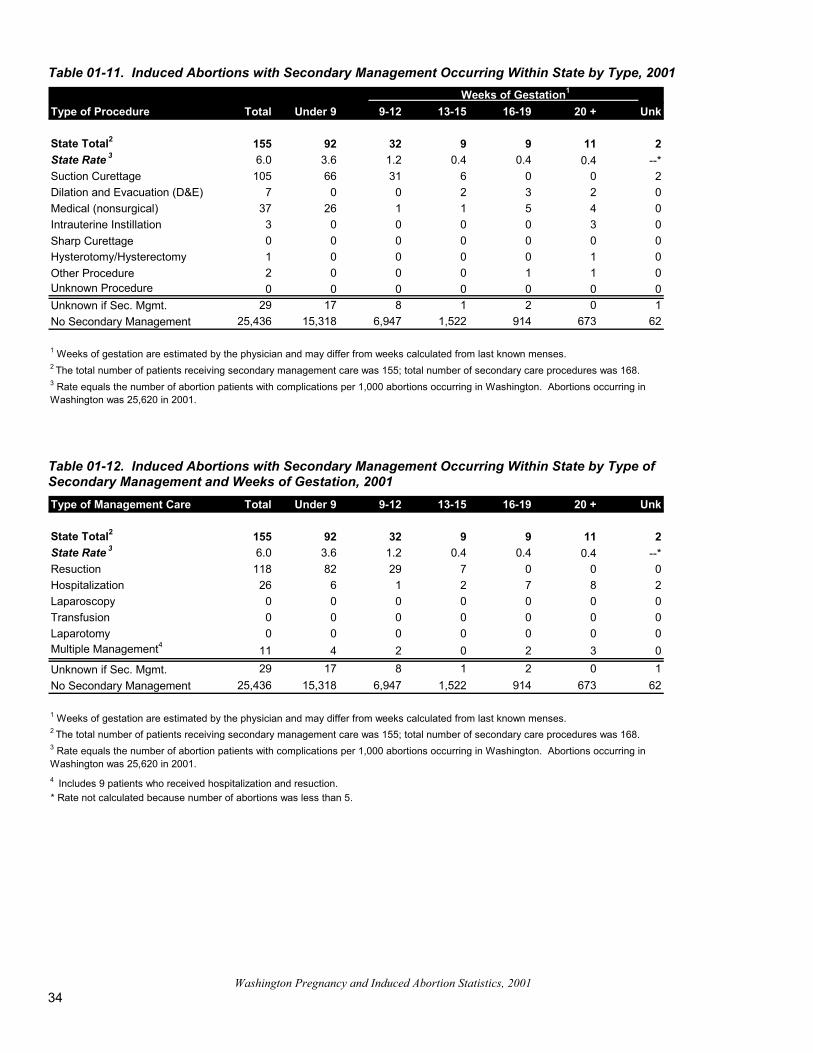
Weeks of Gestation, 2001 ...........................................................................................................33 Table 01-11. Induced Abortions with Secondary Management Occurring Within State by Type, 2001 .....34 Table 01-12. Induced Abortions with Secondary Management Occurring Within State by Type of Secondary
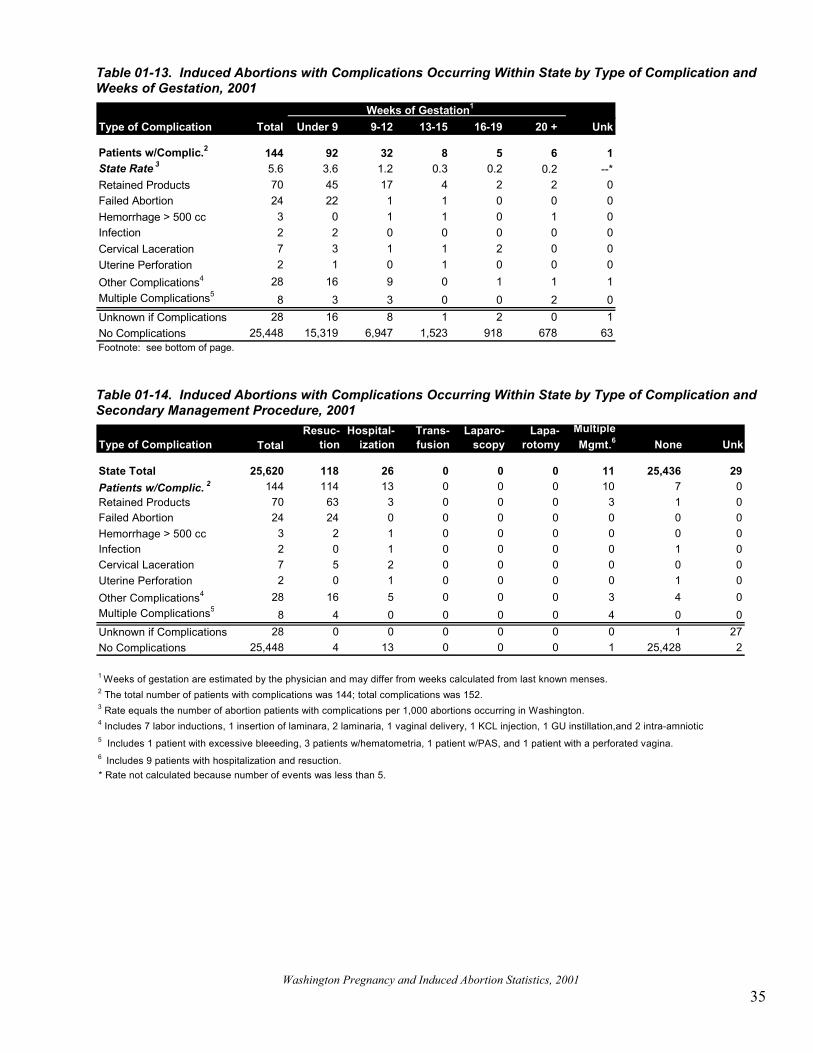
Management and Weeks of Gestation, 2001 ..............................................................................34 Table 01-13. Induced Abortions with Complications Occurring Within State by Type of Complication and
Weeks of Gestation, 2001 ...........................................................................................................35 Table 01-14. Induced Abortions with Complications Occurring Within State by Type of Complication and
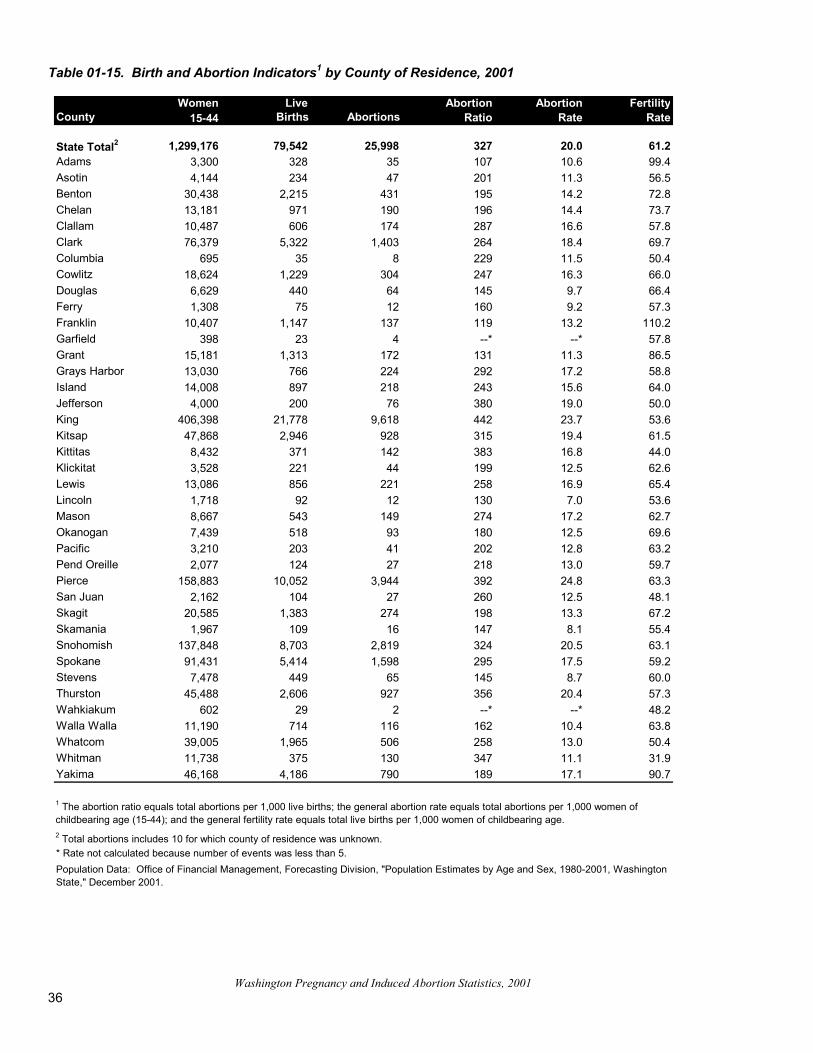
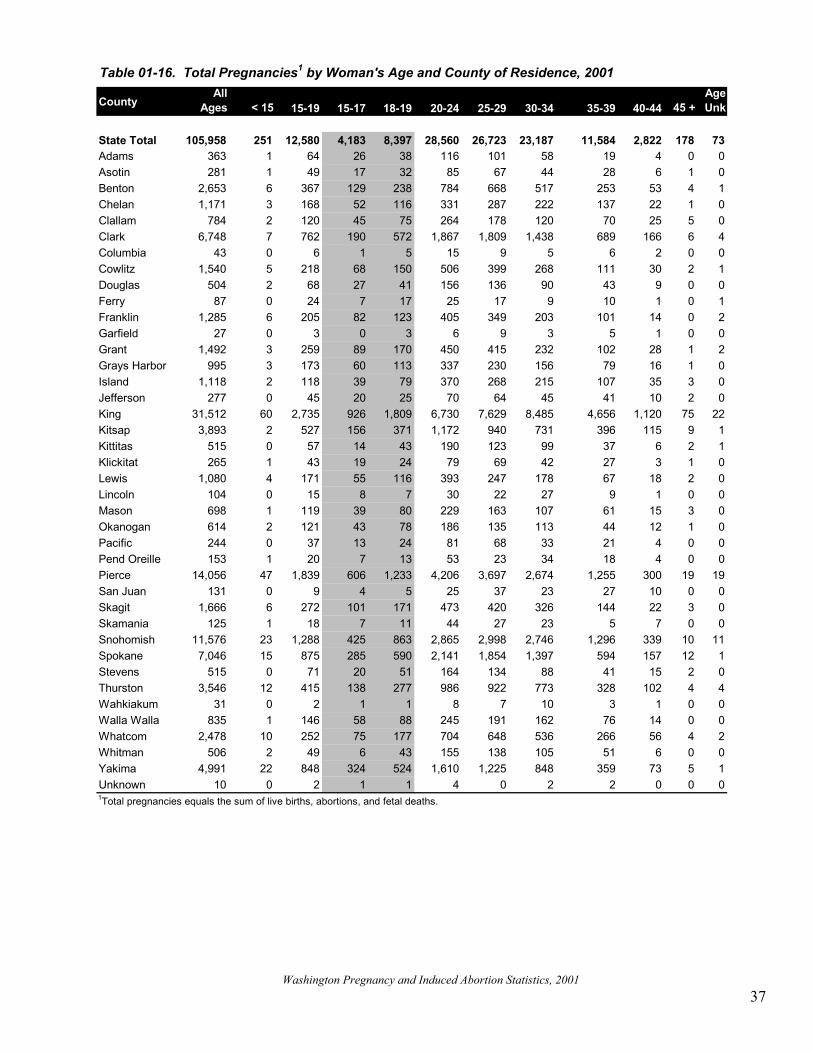
Secondary Management Procedure, 2001..................................................................................35 Table 01-15. Birth and Abortion Indicators1 by County of Residence, 2001...............................................36 Table 01-16. Total Pregnancies1 by Woman's Age and County of Residence, 2001.................................37 Table 01-17. Age-specific Pregnancy Rates1 by County of Residence, 2001............................................38 Table 01-18. Live Births by Woman's Age and County of Residence, 2001 ..............................................39 Table 01-19. Age-specific Live Birth Rates1 by County of Residence, 2001 ..............................................40 Table 01-20. Induced Abortions by Woman's Age and County of Residence, 2001 ..................................41 Table 01-21. Age-specific Abortion Rates1 by County of Residence, 2001................................................42 Table 01-22. Percent of Pregnancies Terminated by Abortion by Woman's Age and County of Residence,
2001 ............................................................................................................................................43 Table 01-23. Abortion Ratio1 by Woman's Age and County of Residence, 2001 .......................................44 Table 01-24. Abortions in Second Trimester or Later1 by Woman's Age and County of Residence, 2001 45 Table 01-25. Repeat Abortions by Woman's Age and County of Residence, 2001 ...................................46 Table 01-26. Induced Abortions, County of Residence by County of Occurrence, 2001 ...........................47
Washington Pregnancy and Induced Abortion Statistics, 2001
Table 01-27. Fetal Deaths by Woman's Age and County of Residence, 2001...........................................48 Table 01-28. Female Population by Age and County of Residence, 2001 .................................................49
Appendix A: Technical Appendix ......................................................................53 Sources of Data.......................................................................................................................... 53 Demographics ............................................................................................................................ 53 Abortion Complications and Secondary Management.......................................................... 55 Adjusted Abortion and Pregnancy Rates, 1992-1995 ............................................................ 56 Definitions................................................................................................................................... 57 Induced Abortion Procedures: .................................................................................................... 58 Rates and Ratios.......................................................................................................................... 61
Appendix B: Sample Certificates and Forms ....................................................63 Certificate of Live Birth .............................................................................................................. 63 Certificate of Fetal Death ............................................................................................................ 64 Report of Induced Termination of Pregnancy............................................................................. 65 Continuation of the Report of Induced Termination of Pregnancy............................................. 66

Washington Pregnancy and Induced Abortion Statistics, 2001
Introduction

Washington Pregnancy and Induced Abortion Statistics, 2001
3
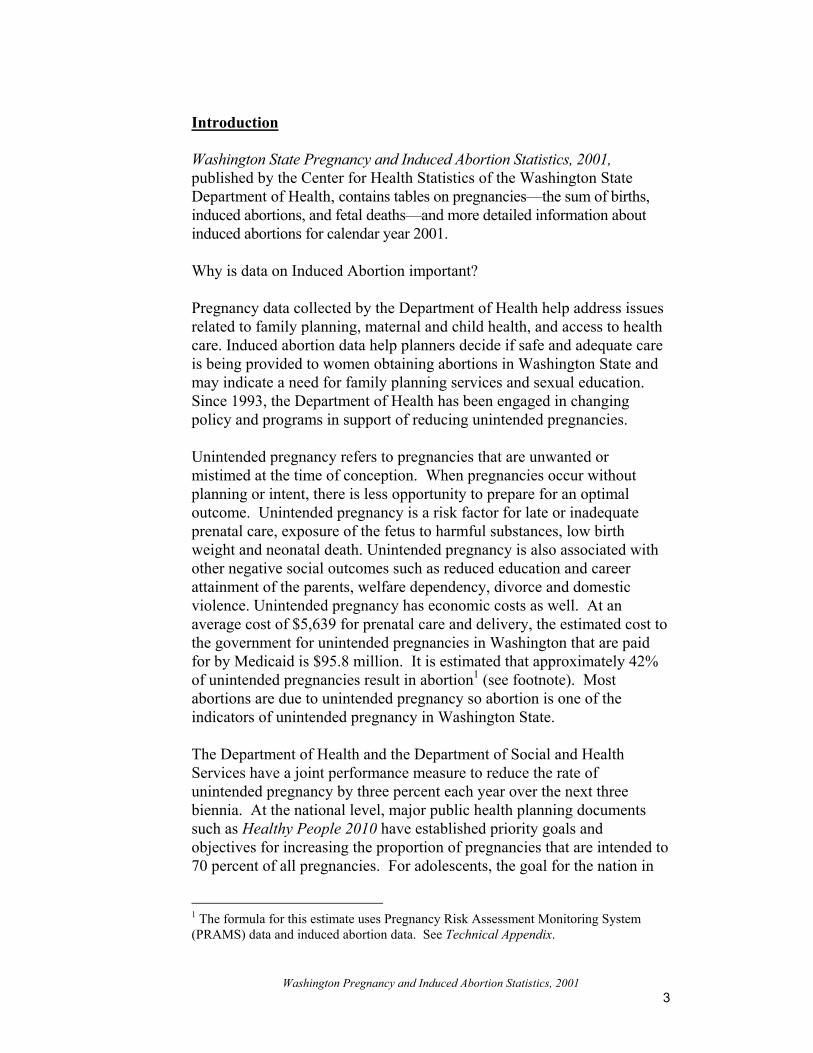
Introduction Washington State Pregnancy and Induced Abortion Statistics, 2001, published by the Center for Health Statistics of the Washington State Department of Health, contains tables on pregnancies—the sum of births, induced abortions, and fetal deaths—and more detailed information about induced abortions for calendar year 2001. Why is data on Induced Abortion important? Pregnancy data collected by the Department of Health help address issues related to family planning, maternal and child health, and access to health care. Induced abortion data help planners decide if safe and adequate care is being provided to women obtaining abortions in Washington State and may indicate a need for family planning services and sexual education. Since 1993, the Department of Health has been engaged in changing policy and programs in support of reducing unintended pregnancies.
Unintended pregnancy refers to pregnancies that are unwanted or mistimed at the time of conception. When pregnancies occur without planning or intent, there is less opportunity to prepare for an optimal outcome. Unintended pregnancy is a risk factor for late or inadequate prenatal care, exposure of the fetus to harmful substances, low birth weight and neonatal death. Unintended pregnancy is also associated with other negative social outcomes such as reduced education and career attainment of the parents, welfare dependency, divorce and domestic violence. Unintended pregnancy has economic costs as well. At an average cost of $5,639 for prenatal care and delivery, the estimated cost to the government for unintended pregnancies in Washington that are paid for by Medicaid is $95.8 million. It is estimated that approximately 42% of unintended pregnancies result in abortion1 (see footnote). Most abortions are due to unintended pregnancy so abortion is one of the indicators of unintended pregnancy in Washington State. The Department of Health and the Department of Social and Health Services have a joint performance measure to reduce the rate of unintended pregnancy by three percent each year over the next three biennia. At the national level, major public health planning documents such as Healthy People 2010 have established priority goals and objectives for increasing the proportion of pregnancies that are intended to 70 percent of all pregnancies. For adolescents, the goal for the nation in
1 The formula for this estimate uses Pregnancy Risk Assessment Monitoring System (PRAMS) data and induced abortion data. See Technical Appendix.
Washington Pregnancy and Induced Abortion Statistics, 2001
4
2010 is to reduce the pregnancy rate to 68 per 1000 women aged 15-17. As induced abortion is one component of a pregnancy rate, public health officials can use these data target interventions. It is perhaps startling to note that the 2001 pregnancy rate among the counties of Washington State for teen-age women varies all the way from 18.4/1,000 to 96.8/1,000 women. Washington State is among 11 states with inadequate data on racial characteristics and among 24 states with inadequate data on Hispanic ethnicity to meet national standards for reporting. National data from 1997 show that the abortion ratio for women of other races (341 per 1,000 live births) was 1.8 times the ratio for white women and the abortion rate for black women (32 per 1,000 women) was 2.9 times the rate for white women (11 per 1,000 women) 1. The induced abortion reporting system provides important information for assessing access and quality of services. The lack of abortion service providers in 28 of the 39 counties within the state leads to concern around access. Women in these counties travel considerable distance to seek providers in distant locations. They are required to expend additional resources for travel and overnight stay. These additional burdens may add delay in the timing of the procedure leading to increased risk of complications. Still in 2001, 88% of induced abortions were performed at 12 or fewer gestational weeks. Legal induced abortion is one of the most frequently performed surgical procedures in the United States 2; yet as a procedure performed by a trained physician, it is one of the most safe. Out of 25,692 abortions performed in Washington State in 2001, there were only 207 procedures with complications reported––a rate of 8.1 per 1,000. Without an abortion reporting system, public health professionals and those interested in public policy surrounding abortion would not be able to assess the volume of abortion, the safety of the procedure or to target interventions to reduce the number through effective family planning, abstinence education, or Emergency Contraceptive Pills (ECPs) programs. Nor would it be possible to evaluate the effectiveness of such programs. The National Centers for Disease Control and Prevention note that ongoing surveillance in the area of induced abortion is essential to: • Monitor trends in the number, ratio and rate of abortions, • Accurately estimate pregnancy rates and calculate other outcome rates,
such as the rate of ectopic pregnancies per 1,000 pregnancies, • Evaluate the effectiveness of family planning and unintended
pregnancy prevention programs, especially teenage pregnancy prevention programs,
• Assess changes in clinical practice patterns over time, and
Washington Pregnancy and Induced Abortion Statistics, 2001
5
• Provide denominators to calculate abortion morbidity and mortality rates2
As advances in medical pharmacologies and technologies are made more available to women making decisions with regards to childbearing, information on induced abortion from the reporting system will remain an important tool in understanding and evaluating the changes in this critical area of women’s health. In 2001, the Center for Health Statistics continued efforts to improve the quality of abortion data and to ensure as complete reporting as possible. As always, monthly query letters were sent to providers for any abortion reporting forms submitted with incomplete or inconsistent information. Also, a year-end summary of activity reported was sent to each provider asking for his or her verification of the information maintained in the system. Any provider who reported over 100 abortions during 2001 but did not reply to the year-end verification letter was contacted directly by the Coordinator of the abortion reporting system. Finally, facilities in which the number of abortions declined by at least 100 were asked to provide a written statement explaining the reason for the decline. Washington State follows the national trend showing that teen birth rates have declined significantly over the past decade. A new National Centers for Disease Control and Prevention report documents that the teen birth rate reached a record low in 2001, with rates steadily declining throughout the 1990’s. Mirroring the national trend, Washington State had a teen birth rate of 53.4 per 1,000 women age 15-19 in 1990, but by 2001 that number declined to a rate of 35.6. For the complete CDC article go to www.cdc.gov/nchs/releases/01facts/teenbirths.htm. Furthermore, the teen abortion rate for Washington State has declined from 41.3 per 1,000 women age 15-19 in 1990, to 23.8 in 2001. Data Reporting Issues Source of Pregnancy and Induced Abortion Data Data used to prepare this report come from Reports of Induced Termination of Pregnancy, Certificates of Live Birth, and Certificates of Fetal Death. The forms for these reports and certificates are provided by the Washington State Department of Health. The following table describes who completes the forms and where they are filed:
Washington Pregnancy and Induced Abortion Statistics, 2001
6
Filing of Washington State Pregnancy-Related Forms
Form Completed by Initially Filed with Abortion Service Provider State Dept. of Health Live Birth Hospital or Birth
Attendant State Dept. of Health
Fetal Death Hospital or Birth Attendant
Local Health Jurisdiction
For each induced abortion performed in Washington State, specified non-identified information about the patient, the procedure performed, and the medical complications must be reported to the Department of Health by the attending physician, hospital, or medical facility within one month of the abortion as required by Washington Administrative Code (WAC 246-490-100). This WAC is based on the statutory authority vested in the Secretary of the Department of Health to collect and utilize health-related data to promote and assess the quality and accessibility of health care throughout the state (RCW’s 43.70.040 and 43.70.050). In addition, information about abortions performed in other states and in Canada for women who are residents of Washington State is obtained through voluntary cooperative arrangements between vital records offices in most states and Canadian provinces. Similarly, RCW 70.58 governs the registration and reporting of vital statistics and requires births and fetal deaths to be reported within a timely fashion. Birth and fetal death certificates are designed to gather information that meet federal reporting requirements of the National Center for Health Statistics. A formal interstate exchange agreement governs the mutual exchange of information on births and fetal deaths between states and Canadian Provinces/Territories, so that events occurring to Washington residents elsewhere are also reported to this state. Starting in 1992, hospitals or birth attendants use the Electronic Birth Certificate System (EBC) to send birth records directly to the Department of Health instead of to registrars of local health jurisdictions.
Washington Pregnancy and Induced Abortion Statistics, 2001
7
1997 Revisions to Abortion Reporting Form The Centers for Disease Control and Prevention (CDC) asked each state to revise its abortion reporting forms by January 1, 1997 to accommodate the reporting of medical (nonsurgical) procedures in anticipation of wider use of these procedures. As a result the following changes were made to the abortion reporting form: 1. Under the primary procedures section, the response category “Medical
(nonsurgical)” was added. Space for listing the medications used (e.g., mifepristone, methotrexate) was also added. Saline and Prostaglandin were combined into the “Intra-Uterine Instillation (Saline or Prostaglandin)” category. Hysterectomy and Hysterotomy were combined into one category. Also, the categories for reporting the primary procedure were re-ordered slightly. All changes to the primary procedure item were recommended by the CDC.
2. Under the demographics section, the responses for the item, Is patient of Hispanic Ethnic Origin?, was modified to distinguish between “No” and “Unknown.”
3. Under complications, changes were made to three response categories. The definition for infection was changed to “inflammation of the endometrium that requires hospitalization for intravenous antibiotics” in accordance with a definition recommended by the National Abortion Federation. The definition of failed abortion was changed to “embryonic death that is not passed from the uterus by four weeks after the death of the embryo,” based on the recommendation of a physician who assisted in the development of the national abortion requirements. Retained Products was added to the complication categories since this was a response frequently provided under Other Complications.
4. Under the secondary management item, space was added after Resuction, to enable providers to specify the nature of the secondary procedures used. This change was made in the event that the medical (nonsurgical) procedure is unsuccessful and a surgical procedure is required for follow-up.
5. Under the section on fetal abnormalities, the item, Anomaly was changed from “Name of anomaly (ies), if known,: to “Name of observed or suspected anomaly (ies)” for internal consistency between the reporting form and the abortion reporting handbook. Responses for the item, Was diagnosis confirmed?, were modified to distinguish between “No” and “Unknown.”
Washington Pregnancy and Induced Abortion Statistics, 2001
8
How To Use Pregnancy and Abortion Data Why Read this Section? Washington State Pregnancy and Induced Abortion Statistics presents commonly used pregnancy and abortion data. These data not only have a variety of uses, but also a variety of users ranging from the beginner to the sophisticated analyst. This section is intended primarily to help those who do not entirely understand how to use pregnancy and abortion data or are not aware of data limitations. Reading this section may help beginning users avoid drawing incorrect conclusions from the data. For other users, this section may serve as a review. Issues in Using the Data ‘Pregnancy’ is the sum of abortions, live births, and fetal deaths reported to the state. This figure underestimates the actual number of pregnancies because fetal deaths are required to be reported to the state only for gestational ages of 20 weeks or more. Thus, early fetal deaths (commonly called ‘miscarriages’) are not included in the total. ‘Abortion’ refers to the induced termination of a pregnancy. Residence vs. Occurrence What's the difference between residence and occurrence? In trying to locate topics of interest in this report, users may notice that data are tabulated in two ways: 1) by residence (where the person lived); or 2) by occurrence (where the event occurred). For example, a woman who lived in Olympia (Thurston County) but had an abortion in Seattle (King County) would be counted in Thurston County on a residence table and in King County on an occurrence table. The Center for Health Statistics actually registers only those events occurring in Washington State. However, thanks to an interstate exchange agreement pertaining to birth and fetal death certificates, we receive data on Washington residents from other states, and Canada. Thus we have complete knowledge of Washington State resident births and fetal deaths. Although no such formal agreement exists for abortion reports, most states, and Canada have agreed to exchange abortion reports as well. Some users may be tempted to add residence and occurrence figures together to get a total for any area, but this would not be correct. There is a great deal of overlap between these two categories, as many residents of a county also have the abortion, birth or fetal death in the same county. Other users try to subtract residence and occurrence data to figure out how many residents have abortions, births or fetal death outside of their county, but this is also incorrect. The only way to determine where county residents are having
Washington Pregnancy and Induced Abortion Statistics, 2001
9
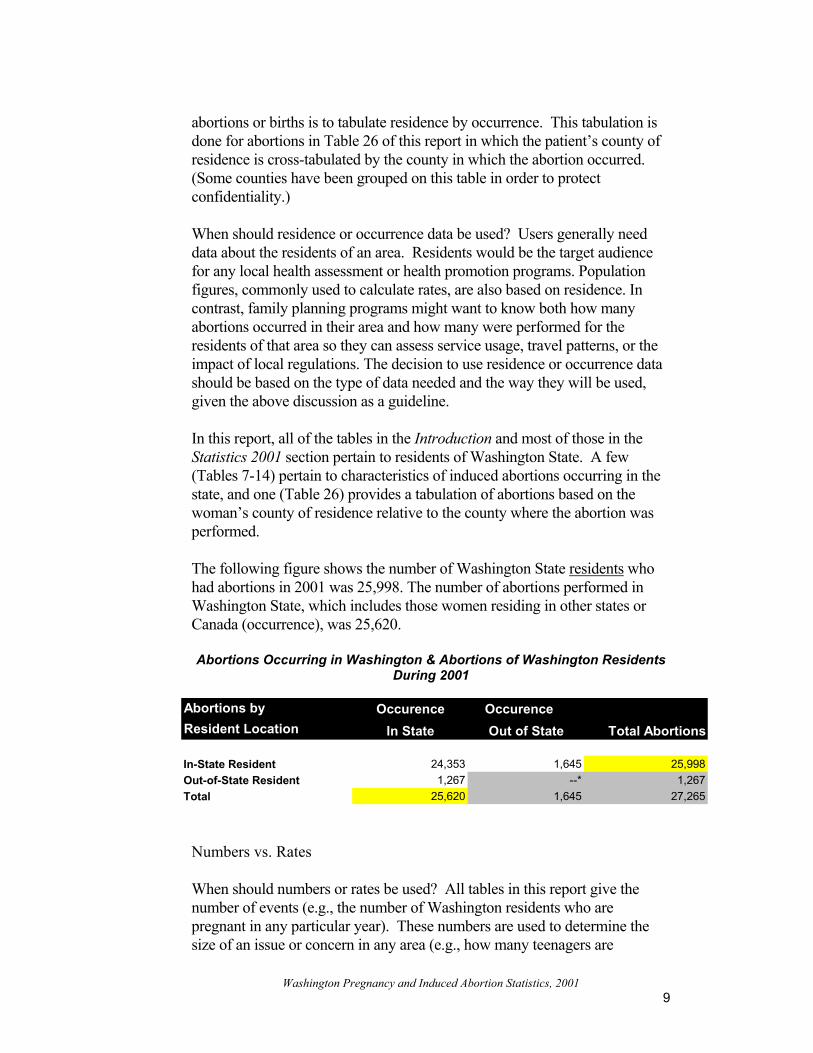
abortions or births is to tabulate residence by occurrence. This tabulation is done for abortions in Table 26 of this report in which the patient’s county of residence is cross-tabulated by the county in which the abortion occurred. (Some counties have been grouped on this table in order to protect confidentiality.) When should residence or occurrence data be used? Users generally need data about the residents of an area. Residents would be the target audience for any local health assessment or health promotion programs. Population figures, commonly used to calculate rates, are also based on residence. In contrast, family planning programs might want to know both how many abortions occurred in their area and how many were performed for the residents of that area so they can assess service usage, travel patterns, or the impact of local regulations. The decision to use residence or occurrence data should be based on the type of data needed and the way they will be used, given the above discussion as a guideline. In this report, all of the tables in the Introduction and most of those in the Statistics 2001 section pertain to residents of Washington State. A few (Tables 7-14) pertain to characteristics of induced abortions occurring in the state, and one (Table 26) provides a tabulation of abortions based on the woman’s county of residence relative to the county where the abortion was performed. The following figure shows the number of Washington State residents who had abortions in 2001 was 25,998. The number of abortions performed in Washington State, which includes those women residing in other states or Canada (occurrence), was 25,620. Abortions Occurring in Washington & Abortions of Washington Residents
During 2001
Numbers vs. Rates When should numbers or rates be used? All tables in this report give the number of events (e.g., the number of Washington residents who are pregnant in any particular year). These numbers are used to determine the size of an issue or concern in any area (e.g., how many teenagers are
Abortions by Occurence OccurenceResident Location In State Out of State Total Abortions
In-State Resident 24,353 1,645 25,998Out-of-State Resident 1,267 --* 1,267Total 25,620 1,645 27,265
Washington Pregnancy and Induced Abortion Statistics, 2001
10
pregnant) or to calculate the percentage change from one year to the next. Such comparisons, however, should also take the size of the population into account to avoid erroneous conclusions. To eliminate the effect of different sized populations, we use crude rates or age-specific rates. A crude rate is the number of events in a specified time period divided by the number of people at risk for these events in that period. This figure is generally multiplied by a constant such as 1,000 or 100,000 to get a number that is easy to read and compare and is reported as ‘per 1,000’ or ‘per 100,000.’ A common natality measure is the crude birth rate which equals the total number of births in a year per 1,000 people living in a specific geographic area (usually the mid-year population estimates).2 (See footnote) Crude birth rates may be affected by the underlying age and sex structure of a population. Therefore, the general fertility rate which equals the total number of births in a year per 1,000 women of child-bearing ages (usually women aged 15-44 years) is often used since the denominator represents more closely the population at risk of giving birth. To further eliminate possible distortions in rates caused by the age structure of the female population, one might use an age-specific birth rate, which equals the number of births to women of a particular age group, usually in one- or five-year intervals, per 1,000 female population of that age group. To the extent that two populations differ significantly in their underlying age structures, age-specific rates would be better measures to use for comparison purposes than either the crude rate or the general fertility rate. Similar rates are also shown in this report for pregnancies and abortions. (See Appendix A.) Researchers and policy-makers often place considerable emphasis on which geographic area has the highest rate, but it is important to remember that rates can mask substantial differences in the numbers on which the rate is based. For example, in 2001 Asotin and Clark Counties have roughly the same teen pregnancy rate of 62 pregnancies per 1,000 women aged 15 to 19. In Clark County, a more populated area, there were 762 teen pregnancies compared to 49 in Asotin. Both the number and the rate should be considered when making policy decisions and designing programs to impact teen pregnancies in these two counties. Standards for Comparison of Rates
2 Population estimates from the Office of Financial Management used as denominators for rates in this report are full year rather than mid-year estimates.
Washington Pregnancy and Induced Abortion Statistics, 2001
11
What are good standards for comparison of rates? To help interpret a particular rate, one may choose to compare it to rates for another county or similar geographical area, national or state data, or an independent goal or standard (such as the Year 2010 goals). Such issues as comparability of the population characteristics and stability of rates from year to year for the standard population should be considered when choosing a base for comparison. No matter what source for comparison is chosen, users should always find out how the rates were calculated to see if the same methods and definitions were used. Otherwise, the rates are not truly comparable and may lead to incorrect conclusions. Some questions to ask might be: Are the rates crude or age-specific? Are they for the same time period? Is the definition of what constitutes an event the same? Is the completeness of reporting events similar? Are the denominators taken from the same or similar data sources? Unknowns Most pregnancy and abortion data are not 100% complete. Sometimes the information is not (or cannot be) collected, and then the item is reported as unknown. When the number of unknowns for a particular characteristic (e.g., race) is large, it can affect rates or percentage distributions based on that characteristic. For example, in 2001, woman’s race was not reported for a fairly small proportion of births (about 4%) but for a sizable proportion of induced abortions (42%). How should unknowns be handled in calculating percentages? If we include unknowns in the total, the percent in any category is smaller than it would be if we subtract unknowns from the total. For example, in the case of abortions performed in 2001, the percent of women classified as black is 4.5 % if unknowns are included in the total, but the percentage is 7.8 % if unknowns are excluded from the total. In deciding which method offers a “truer” representation of the population as a whole, one needs to consider whether the cases with an unknown characteristic are similar to or different from those cases in which the characteristic is known. If it appears likely that the cases with the unknown characteristic are similar to those with the known values, then “unknowns” should be excluded from the total and percentages should be based on the “known” population. To the extent that this assumption seems unlikely, then other methods could be invoked to distribute the cases with unknown values. Assumptions about the probable characteristics of the population with a given unknown attribute could be based on: 1) greater familiarity with local situations by persons in the county or city health community or 2) more in-depth analysis of the source of unknowns in the reporting system.
Washington Pregnancy and Induced Abortion Statistics, 2001
12
For example, if only a few hospitals or medical facilities fail to report a particular variable (as is the case with the reporting of race by abortion providers) one might examine information about the population served by those particular facilities or about those living in the nearby community. Small Numbers How should small numbers be handled? If the state collects all births, fetal deaths, and abortions in a year, then aren't the pregnancy and abortion rates exactly as calculated? It is certainly true that pregnancy and abortion statistics are not based on samples of the population, as many research data are. We do know the actual number of births, fetal deaths, and abortions (assuming complete reporting of events), so we can calculate an exact pregnancy or abortion rate for any one year. However, the data may still be affected by random fluctuations in the number of events between successive measurements (e.g., for different years). The effect of such random fluctuations on birth, pregnancy, and abortion rates is proportionately larger when the number of events is small. For example, one more teenage pregnancy has a larger numerical impact in an area with 10 teenage pregnancies than it does in an area with 1,000 teenage pregnancies. Because of these random fluctuations, the rates based on small numbers may not be as reliable as those based on larger numbers in the sense that they may have limited predictive value. Specifically, knowing one year's rate in such instances may not allow one to reliably anticipate the rate for another year. This instability makes it difficult to use the rates for program planning or assessment purposes. In fact, considerable caution should be used in interpreting any data where the number of events is small. While there are no hard and fast rules as to when numbers are too small for rates to be stable predictors of what's happening, DOH has published a protocol on small numbers3. Also, the Washington State Public Health Improvement Plan (PHIP) guidelines call for suppressing calculation of rates when the number of events is less than five (5). To increase the stability of the rate, one can combine several years of data (as long as there is no strong temporal trend in rates) or one can group several counties in the same geographic area or with similar population characteristics.
Washington Pregnancy and Induced Abortion Statistics, 2001
13
Data Quality How does data quality affect the use of the data? Conclusions and health policy decisions are only as good as the data that go into making them. Pregnancy and abortion data quality has three major components: completeness, validity, and timeliness. Are the data complete, i.e., do we have a record for each event? Although WAC 246-490-100 requires that each hospital or facility that performs induced abortions report them to the Department of Health, there are some reasons to believe that some may not do so, but the number of unreported procedures is unclear. Some indication of the completeness of current reporting can be observed from a periodic national survey conducted by the Alan Guttmacher Institute (AGI) in which indicates they compare the reported number of abortions in Washington State to the number of abortions which were reported to the Institute. In 1996, the most recent year for which the Guttmacher survey was performed, 26,340 abortions were reported to AGI as occurring in Washington State, which compares with 26,138 (occurrences) reported to the Department of Health, Center for Health Statistics, a difference of 1%. The same survey showed 26,950 abortions by residents of Washington State, compared to 26,396 reported to the Center, a difference of 2%.4 Registration of births is currently more than 99% complete, according to National Center for Health Statistics (NCHS) studies. Registration completeness may be slightly lower for births occurring outside of a hospital. A small number of birth certificates are filed after the data files are prepared and thus are not included in the data presented in this report. In addition to determining the completeness of a reporting system, researchers are often concerned with the degree to which people report what is actually happening. This characteristic of data is called its validity. Studies of validity of reporting systems like the birth certificate system usually look for an independent source of the information and determine the consistency with data contained in the reporting system. A previous study of birth certificate data quality conducted by the Center for Health Statistics showed that validity varied with the type of item. Legal information (e.g., names, addresses, ages) is very accurately reported. Unfortunately, medical information (e.g., menses date, prior pregnancy outcomes, complications, and malformations) is less accurate. Comparison to what was actually found in patients’ medical history records for births revealed error rates of 5-20%. Rates for the abortion reporting system are not known. To improve data quality, abortion providers are queried if the information obtained on their reporting forms is incomplete, inconsistent, or falls outside expected ranges. Tables are sent back to each provider annually for a review
Washington Pregnancy and Induced Abortion Statistics, 2001
14
of the completeness and accuracy of information reported for their facility. Birth and Fetal Death certificates are also edited for accuracy, internal consistency, and appropriate range of values (e.g., mother's age should normally be 8-59, so warning flags occur if ages less than 14 or greater than 49 are entered into the electronic birth system). A factor that affects the completeness of the data is the number of unknowns among responses. Sometimes providers do not complete all items on a birth certificate or abortion reporting form. The information may be overlooked or refused by the informant, or the informant may not have been asked for the data. As discussed above, unknowns are a particular problem for race on abortion forms. Preliminary investigation of this reporting problem revealed that several large abortion clinics contribute to most of the unknowns since they do not report race for any of their clients. Discussions with a committee in 1997 established to review the contents of the abortion reporting form revealed several reasons that women are not asked to state their race or ethnicity. The two main reasons cited were: the potential for misrepresenting women of color and the perceived discomfort of clients when asked their race or ethnicity before receiving medical services. (See Appendix A for further discussion of problems with individual items on the birth certificate and the abortion reporting form). Finally, are pregnancy data timely, i.e., are births, abortions, and fetal deaths reported early enough so that the data are available when needed to be most useful for planning and program assessment purposes? There is often a tradeoff between timeliness and accuracy. For example, if abortion reports and birth certificates are filed quickly, there may not be enough time for complications related to the abortion procedure or the delivery to become evident. Indeed, abortion providers are asked to wait four weeks before submitting reports to the state to have time to include any complications that may have occurred in that interval. Despite the potential benefits of waiting, the main thrust - particularly for birth certificates - is to streamline the reporting process and to gather and report information as close to the event as possible. This has been accomplished by the Center for Health Statistics primarily by the development of the Electronic Birth Certificate System. Confidentiality How do we ensure confidentiality of the data? All of the data in this report are presented in aggregate form, which means that individuals cannot be identified from the data. However, it is important for potential data users to be aware of confidentiality issues related to the data. First, such personal information as a patient’s name or address is not asked for on the Report of Induced Termination of Pregnancy. The Washington Administrative Code (WAC 246-490-110) stipulates that information from the abortion reporting
Washington Pregnancy and Induced Abortion Statistics, 2001
15
system cannot be disclosed in such a way that any individual , provider, or facility is identified. The medical and health information about births and fetal deaths is considered confidential and can be used for statistical purposes only (RCW 70.58.055). Hence, such confidential medical information may not be linked to any identifying information except for research projects approved by the Human Research Review Board of the Department of Social and Health Services and the Department of Health. (The Birth and Fetal Death Certificates, and the Report of Induced Termination of Pregnancy are shown in Appendix B.) It is the responsibility of all data users to treat these data in such a way as to respect and protect the privacy of individuals who have allowed information about their personal lives to be used for the good of the public. To ensure continued reporting of important demographic, medical, and health information, data must be handled in a way that ensures the privacy of individuals as required by law. Additional Services Additional tabulations of birth and fetal death data can be found in the publication, Washington State Vital Statistics, published annually by the Center for Health Statistics. Birth and fetal death data are available on the Center’s CD-ROMs: Vital Registration System Annual Statistical Files, Washington State. The CD-ROMs contains data in ASCII format, detailed technical documentation, and annual summary tables of births, deaths, and fetal deaths for 1980-2001. To order a copy of a CD-ROM, call (360) 236-4327. All of the tables for this report are available for 1996-2001 on the Internet, along with copies of this introduction, the overview and the appendices. To access this information, go to the DOH web page at www.doh.wa.gov, click on “Health Data” then click on “Vital Statistics”. At that point a list of items appears. Go to pregnancy and induced abortion tables. The other items in the list pertain to information from the annual summary of vital statistics from 1980 to 2001. The Center also works with data users on a variety of levels: 1) to help users formulate requests so they get the data they need; 2) to provide technical consultation about how to use or interpret data; 3) to perform special analyses to address a specific problem or need; and 4) to help users access raw data files. For more information, call the Center’s research line at (360) 236-4321.
Washington Pregnancy and Induced Abortion Statistics, 2001
16
1MMWR, December 08, 2000 / Vol. 49, No.SS11, Abortion Surveillance United States, 1997, 1-44. 2Wilcox, Lynne S. and James S. Marks, eds., From Data to Action, CDC’s Public Health Surveillance for Women, Infants, and Children, DHHS/PHS/CDCP, pp. 83. 3Assessment Operations Group, Washington State Department of Health. Guidelines for Working With Small Numbers. Nov. 2000. Available from URL: <http://www.doh.wa.gov/Data/guidelines/SmallNumbers.htm>. 4 S.K. Henshaw, “Abortion Incidence and Services in the United States, 1995 -1996,” Family Planning Perspectives, Alan Guttmacher Institute, Vol. 30, no. 6, November/December 1998.
Washington Pregnancy and Induced Abortion Statistics, 2001
17
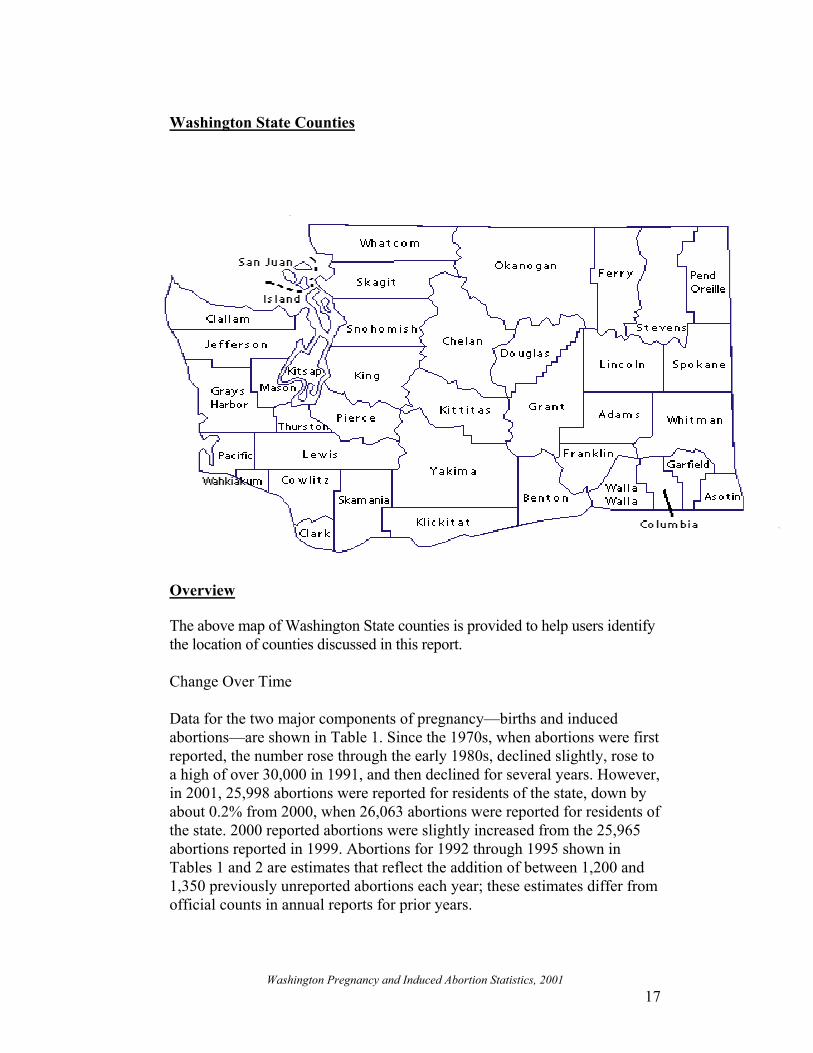
Washington State Counties Overview The above map of Washington State counties is provided to help users identify the location of counties discussed in this report. Change Over Time Data for the two major components of pregnancy—births and induced abortions—are shown in Table 1. Since the 1970s, when abortions were first reported, the number rose through the early 1980s, declined slightly, rose to a high of over 30,000 in 1991, and then declined for several years. However, in 2001, 25,998 abortions were reported for residents of the state, down by about 0.2% from 2000, when 26,063 abortions were reported for residents of the state. 2000 reported abortions were slightly increased from the 25,965 abortions reported in 1999. Abortions for 1992 through 1995 shown in Tables 1 and 2 are estimates that reflect the addition of between 1,200 and 1,350 previously unreported abortions each year; these estimates differ from official counts in annual reports for prior years.
Washington Pregnancy and Induced Abortion Statistics, 2001
18
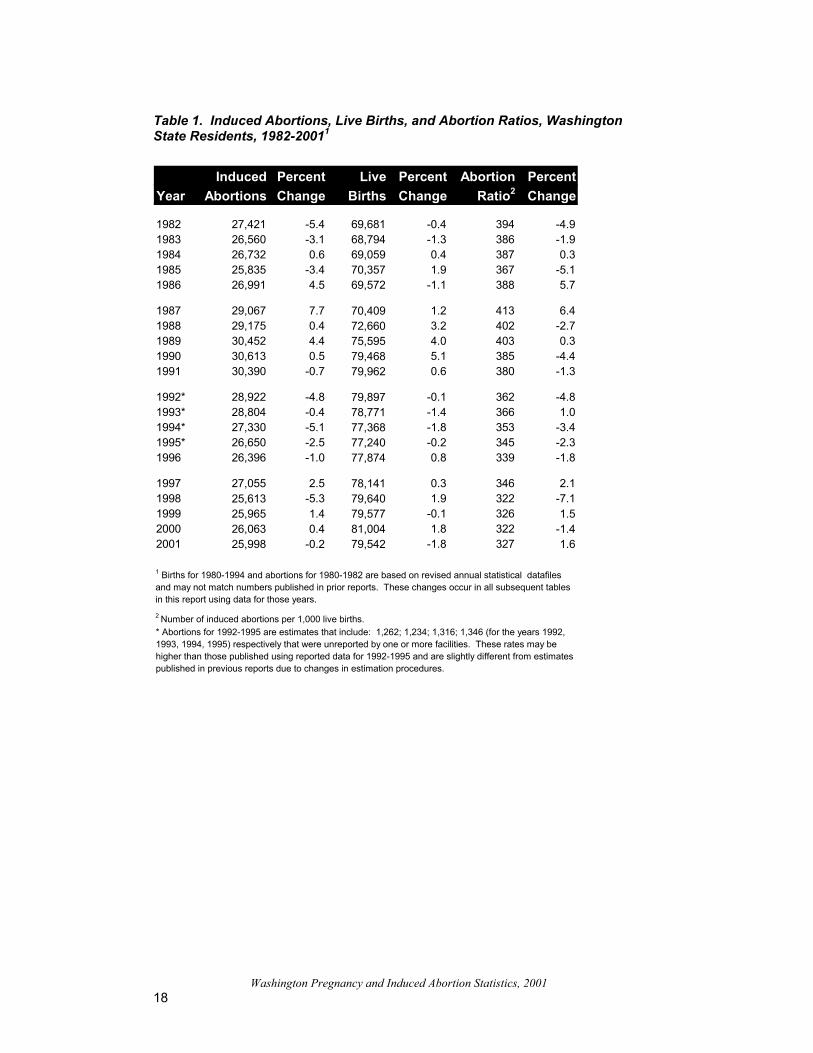
Table 1. Induced Abortions, Live Births, and Abortion Ratios, Washington State Residents, 1982-20011
Induced Percent Live Percent Abortion PercentYear Abortions Change Births Change Ratio2 Change
1982 27,421 -5.4 69,681 -0.4 394 -4.91983 26,560 -3.1 68,794 -1.3 386 -1.91984 26,732 0.6 69,059 0.4 387 0.31985 25,835 -3.4 70,357 1.9 367 -5.11986 26,991 4.5 69,572 -1.1 388 5.7 1987 29,067 7.7 70,409 1.2 413 6.41988 29,175 0.4 72,660 3.2 402 -2.71989 30,452 4.4 75,595 4.0 403 0.31990 30,613 0.5 79,468 5.1 385 -4.41991 30,390 -0.7 79,962 0.6 380 -1.3 1992* 28,922 -4.8 79,897 -0.1 362 -4.81993* 28,804 -0.4 78,771 -1.4 366 1.01994* 27,330 -5.1 77,368 -1.8 353 -3.41995* 26,650 -2.5 77,240 -0.2 345 -2.31996 26,396 -1.0 77,874 0.8 339 -1.8 1997 27,055 2.5 78,141 0.3 346 2.11998 25,613 -5.3 79,640 1.9 322 -7.11999 25,965 1.4 79,577 -0.1 326 1.52000 26,063 0.4 81,004 1.8 322 -1.42001 25,998 -0.2 79,542 -1.8 327 1.6
* Abortions for 1992-1995 are estimates that include: 1,262; 1,234; 1,316; 1,346 (for the years 1992, 1993, 1994, 1995) respectively that were unreported by one or more facilities. These rates may be higher than those published using reported data for 1992-1995 and are slightly different from estimates published in previous reports due to changes in estimation procedures.
2 Number of induced abortions per 1,000 live births.
1 Births for 1980-1994 and abortions for 1980-1982 are based on revised annual statistical datafiles and may not match numbers published in prior reports. These changes occur in all subsequent tables in this report using data for those years.
Washington Pregnancy and Induced Abortion Statistics, 2001
19
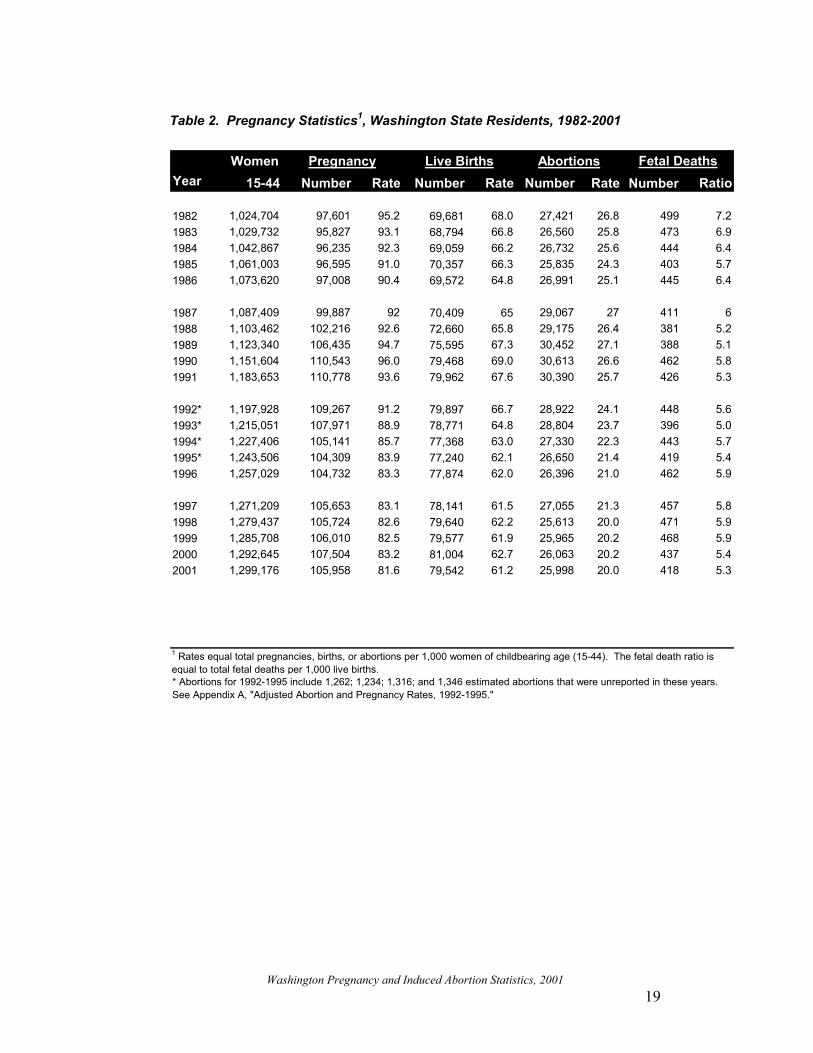
Table 2. Pregnancy Statistics1, Washington State Residents, 1982-2001
Women Pregnancy Live Births Abortions Fetal DeathsYear 15-44 Number Rate Number Rate Number Rate Number Ratio
1982 1,024,704 97,601 95.2 69,681 68.0 27,421 26.8 499 7.21983 1,029,732 95,827 93.1 68,794 66.8 26,560 25.8 473 6.91984 1,042,867 96,235 92.3 69,059 66.2 26,732 25.6 444 6.41985 1,061,003 96,595 91.0 70,357 66.3 25,835 24.3 403 5.71986 1,073,620 97,008 90.4 69,572 64.8 26,991 25.1 445 6.4 1987 1,087,409 99,887 92 70,409 65 29,067 27 411 61988 1,103,462 102,216 92.6 72,660 65.8 29,175 26.4 381 5.21989 1,123,340 106,435 94.7 75,595 67.3 30,452 27.1 388 5.11990 1,151,604 110,543 96.0 79,468 69.0 30,613 26.6 462 5.81991 1,183,653 110,778 93.6 79,962 67.6 30,390 25.7 426 5.3 1992* 1,197,928 109,267 91.2 79,897 66.7 28,922 24.1 448 5.61993* 1,215,051 107,971 88.9 78,771 64.8 28,804 23.7 396 5.01994* 1,227,406 105,141 85.7 77,368 63.0 27,330 22.3 443 5.71995* 1,243,506 104,309 83.9 77,240 62.1 26,650 21.4 419 5.41996 1,257,029 104,732 83.3 77,874 62.0 26,396 21.0 462 5.9 1997 1,271,209 105,653 83.1 78,141 61.5 27,055 21.3 457 5.81998 1,279,437 105,724 82.6 79,640 62.2 25,613 20.0 471 5.91999 1,285,708 106,010 82.5 79,577 61.9 25,965 20.2 468 5.92000 1,292,645 107,504 83.2 81,004 62.7 26,063 20.2 437 5.42001 1,299,176 105,958 81.6 79,542 61.2 25,998 20.0 418 5.3
* Abortions for 1992-1995 include 1,262; 1,234; 1,316; and 1,346 estimated abortions that were unreported in these years. See Appendix A, "Adjusted Abortion and Pregnancy Rates, 1992-1995."
1 Rates equal total pregnancies, births, or abortions per 1,000 women of childbearing age (15-44). The fetal death ratio is equal to total fetal deaths per 1,000 live births.
Washington Pregnancy and Induced Abortion Statistics, 2001
20
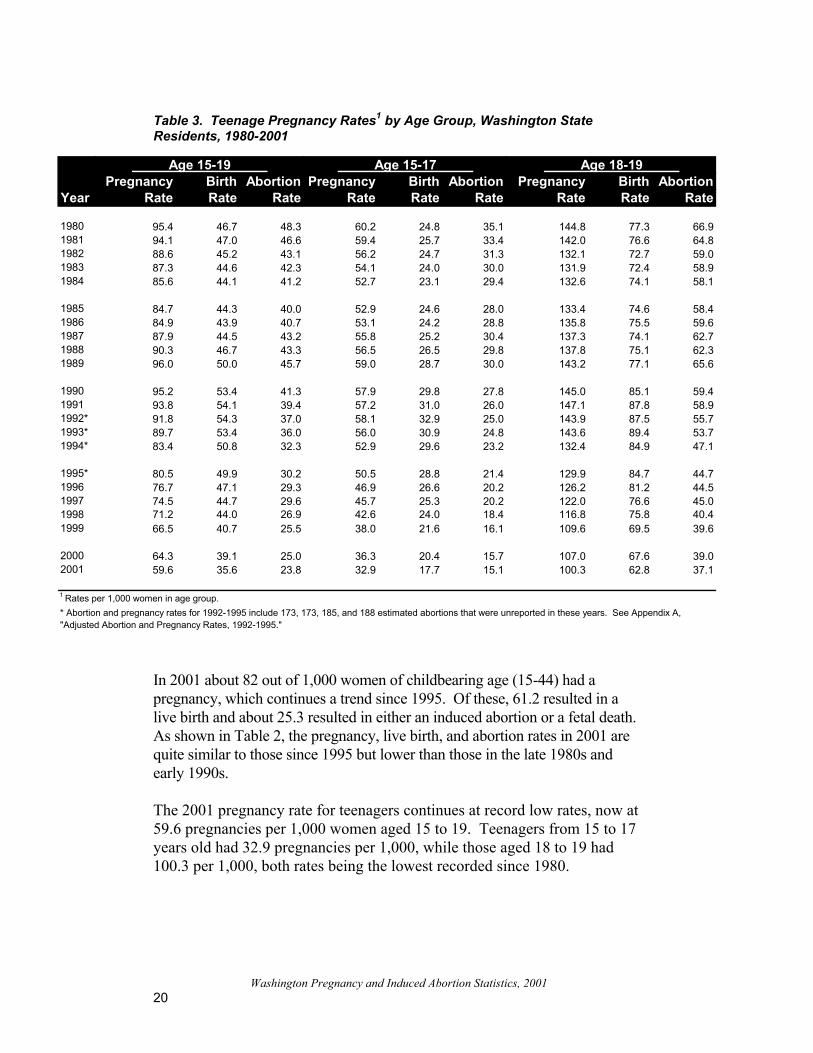
Table 3. Teenage Pregnancy Rates1 by Age Group, Washington State Residents, 1980-2001
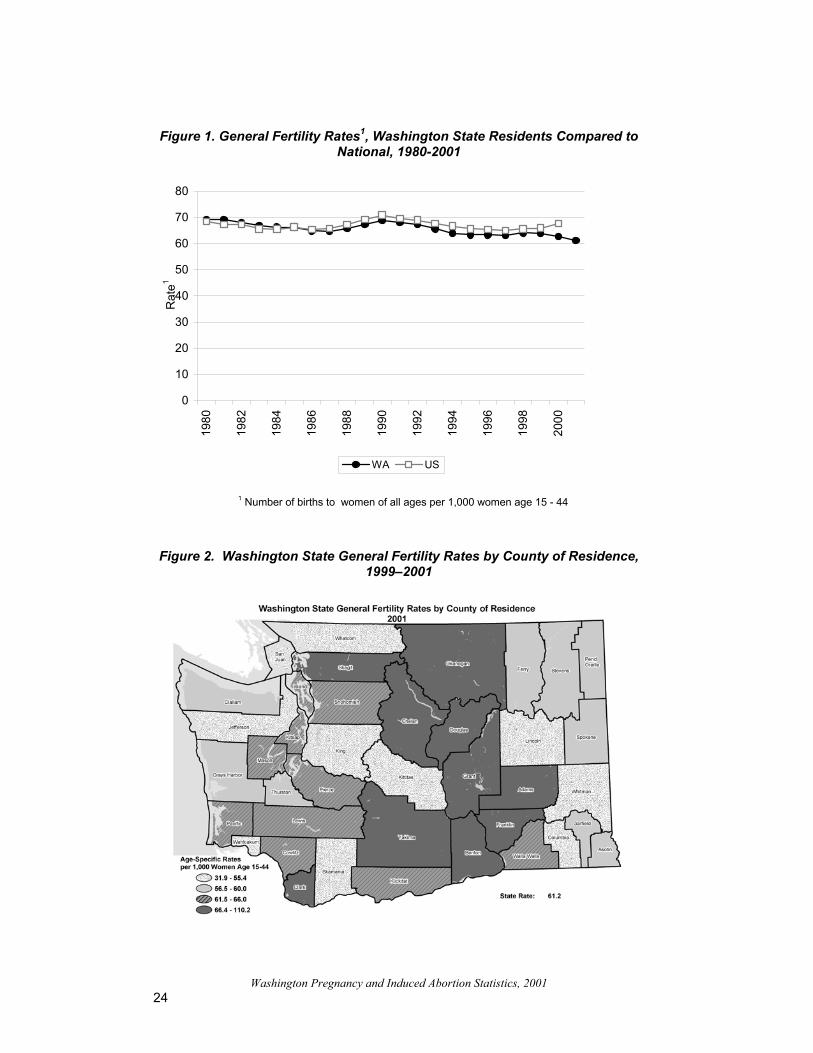
In 2001 about 82 out of 1,000 women of childbearing age (15-44) had a pregnancy, which continues a trend since 1995. Of these, 61.2 resulted in a live birth and about 25.3 resulted in either an induced abortion or a fetal death. As shown in Table 2, the pregnancy, live birth, and abortion rates in 2001 are quite similar to those since 1995 but lower than those in the late 1980s and early 1990s. The 2001 pregnancy rate for teenagers continues at record low rates, now at 59.6 pregnancies per 1,000 women aged 15 to 19. Teenagers from 15 to 17 years old had 32.9 pregnancies per 1,000, while those aged 18 to 19 had 100.3 per 1,000, both rates being the lowest recorded since 1980.
Age 15-19 Age 15-17 Age 18-19 Pregnancy Birth Abortion Pregnancy Birth Abortion Pregnancy Birth AbortionYear Rate Rate Rate Rate Rate Rate Rate Rate Rate
1980 95.4 46.7 48.3 60.2 24.8 35.1 144.8 77.3 66.91981 94.1 47.0 46.6 59.4 25.7 33.4 142.0 76.6 64.81982 88.6 45.2 43.1 56.2 24.7 31.3 132.1 72.7 59.01983 87.3 44.6 42.3 54.1 24.0 30.0 131.9 72.4 58.91984 85.6 44.1 41.2 52.7 23.1 29.4 132.6 74.1 58.1 1985 84.7 44.3 40.0 52.9 24.6 28.0 133.4 74.6 58.41986 84.9 43.9 40.7 53.1 24.2 28.8 135.8 75.5 59.61987 87.9 44.5 43.2 55.8 25.2 30.4 137.3 74.1 62.71988 90.3 46.7 43.3 56.5 26.5 29.8 137.8 75.1 62.31989 96.0 50.0 45.7 59.0 28.7 30.0 143.2 77.1 65.6 1990 95.2 53.4 41.3 57.9 29.8 27.8 145.0 85.1 59.41991 93.8 54.1 39.4 57.2 31.0 26.0 147.1 87.8 58.91992* 91.8 54.3 37.0 58.1 32.9 25.0 143.9 87.5 55.71993* 89.7 53.4 36.0 56.0 30.9 24.8 143.6 89.4 53.71994* 83.4 50.8 32.3 52.9 29.6 23.2 132.4 84.9 47.1 1995* 80.5 49.9 30.2 50.5 28.8 21.4 129.9 84.7 44.71996 76.7 47.1 29.3 46.9 26.6 20.2 126.2 81.2 44.51997 74.5 44.7 29.6 45.7 25.3 20.2 122.0 76.6 45.01998 71.2 44.0 26.9 42.6 24.0 18.4 116.8 75.8 40.41999 66.5 40.7 25.5 38.0 21.6 16.1 109.6 69.5 39.6 2000 64.3 39.1 25.0 36.3 20.4 15.7 107.0 67.6 39.02001 59.6 35.6 23.8 32.9 17.7 15.1 100.3 62.8 37.1
* Abortion and pregnancy rates for 1992-1995 include 173, 173, 185, and 188 estimated abortions that were unreported in these years. See Appendix A, "Adjusted Abortion and Pregnancy Rates, 1992-1995."
1 Rates per 1,000 women in age group.
Washington Pregnancy and Induced Abortion Statistics, 2001
21
Recent County Trends In using Table 4 and Table 5, it is important to recall the warning earlier in this report that rates can mask substantial differences in the numbers on which the rates are based. Counties, which may have the same rate, could have widely disparate actual numbers of abortions. Additionally, small counties may have extremely small numbers, which could vary widely from year to year. Therefore, it is very important to consider both the rate and the number before making policy decisions or designing programs. Table 5: Induced Abortion Rates with Ranks by County, Washington State Residents, 1997-2001 ranks the 39 counties in the state of Washington by their standing, for example, the total number of induced abortions per 1000 women of child-bearing age, 15-44. King County has had the highest abortion rate and Pierce the second highest of any county in the state over the last five years. Snohomish, Thurston, and Yakima counties usually rank in the top ten, while the position of most other counties varies over time.
Washington Pregnancy and Induced Abortion Statistics, 2001
22
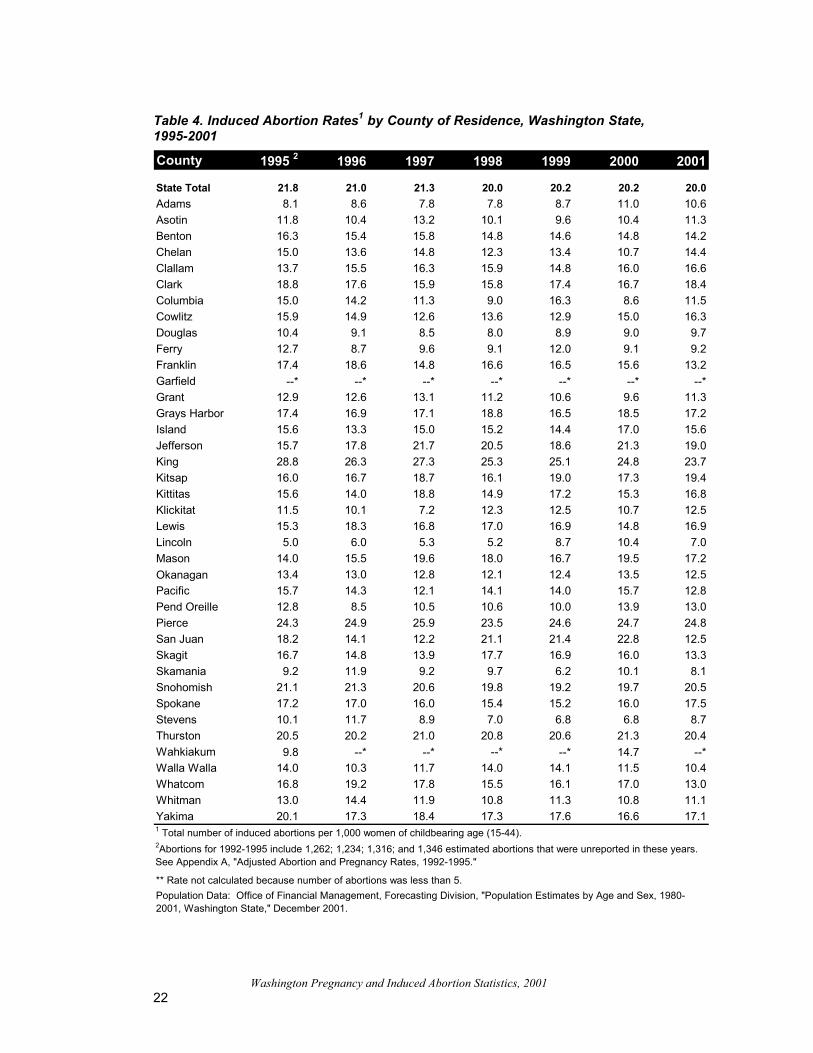
Table 4. Induced Abortion Rates1 by County of Residence, Washington State, 1995-2001
County 1995 2 1996 1997 1998 1999 2000 2001
State Total 21.8 21.0 21.3 20.0 20.2 20.2 20.0Adams 8.1 8.6 7.8 7.8 8.7 11.0 10.6Asotin 11.8 10.4 13.2 10.1 9.6 10.4 11.3Benton 16.3 15.4 15.8 14.8 14.6 14.8 14.2Chelan 15.0 13.6 14.8 12.3 13.4 10.7 14.4Clallam 13.7 15.5 16.3 15.9 14.8 16.0 16.6Clark 18.8 17.6 15.9 15.8 17.4 16.7 18.4Columbia 15.0 14.2 11.3 9.0 16.3 8.6 11.5Cowlitz 15.9 14.9 12.6 13.6 12.9 15.0 16.3Douglas 10.4 9.1 8.5 8.0 8.9 9.0 9.7Ferry 12.7 8.7 9.6 9.1 12.0 9.1 9.2Franklin 17.4 18.6 14.8 16.6 16.5 15.6 13.2Garfield --* --* --* --* --* --* --*Grant 12.9 12.6 13.1 11.2 10.6 9.6 11.3Grays Harbor 17.4 16.9 17.1 18.8 16.5 18.5 17.2Island 15.6 13.3 15.0 15.2 14.4 17.0 15.6Jefferson 15.7 17.8 21.7 20.5 18.6 21.3 19.0King 28.8 26.3 27.3 25.3 25.1 24.8 23.7Kitsap 16.0 16.7 18.7 16.1 19.0 17.3 19.4Kittitas 15.6 14.0 18.8 14.9 17.2 15.3 16.8Klickitat 11.5 10.1 7.2 12.3 12.5 10.7 12.5Lewis 15.3 18.3 16.8 17.0 16.9 14.8 16.9Lincoln 5.0 6.0 5.3 5.2 8.7 10.4 7.0Mason 14.0 15.5 19.6 18.0 16.7 19.5 17.2Okanagan 13.4 13.0 12.8 12.1 12.4 13.5 12.5Pacific 15.7 14.3 12.1 14.1 14.0 15.7 12.8Pend Oreille 12.8 8.5 10.5 10.6 10.0 13.9 13.0Pierce 24.3 24.9 25.9 23.5 24.6 24.7 24.8San Juan 18.2 14.1 12.2 21.1 21.4 22.8 12.5Skagit 16.7 14.8 13.9 17.7 16.9 16.0 13.3Skamania 9.2 11.9 9.2 9.7 6.2 10.1 8.1Snohomish 21.1 21.3 20.6 19.8 19.2 19.7 20.5Spokane 17.2 17.0 16.0 15.4 15.2 16.0 17.5Stevens 10.1 11.7 8.9 7.0 6.8 6.8 8.7Thurston 20.5 20.2 21.0 20.8 20.6 21.3 20.4Wahkiakum 9.8 --* --* --* --* 14.7 --*Walla Walla 14.0 10.3 11.7 14.0 14.1 11.5 10.4Whatcom 16.8 19.2 17.8 15.5 16.1 17.0 13.0Whitman 13.0 14.4 11.9 10.8 11.3 10.8 11.1Yakima 20.1 17.3 18.4 17.3 17.6 16.6 17.1
2Abortions for 1992-1995 include 1,262; 1,234; 1,316; and 1,346 estimated abortions that were unreported in these years. See Appendix A, "Adjusted Abortion and Pregnancy Rates, 1992-1995."
Population Data: Office of Financial Management, Forecasting Division, "Population Estimates by Age and Sex, 1980-2001, Washington State," December 2001.
** Rate not calculated because number of abortions was less than 5.
1 Total number of induced abortions per 1,000 women of childbearing age (15-44).
Washington Pregnancy and Induced Abortion Statistics, 2001
23
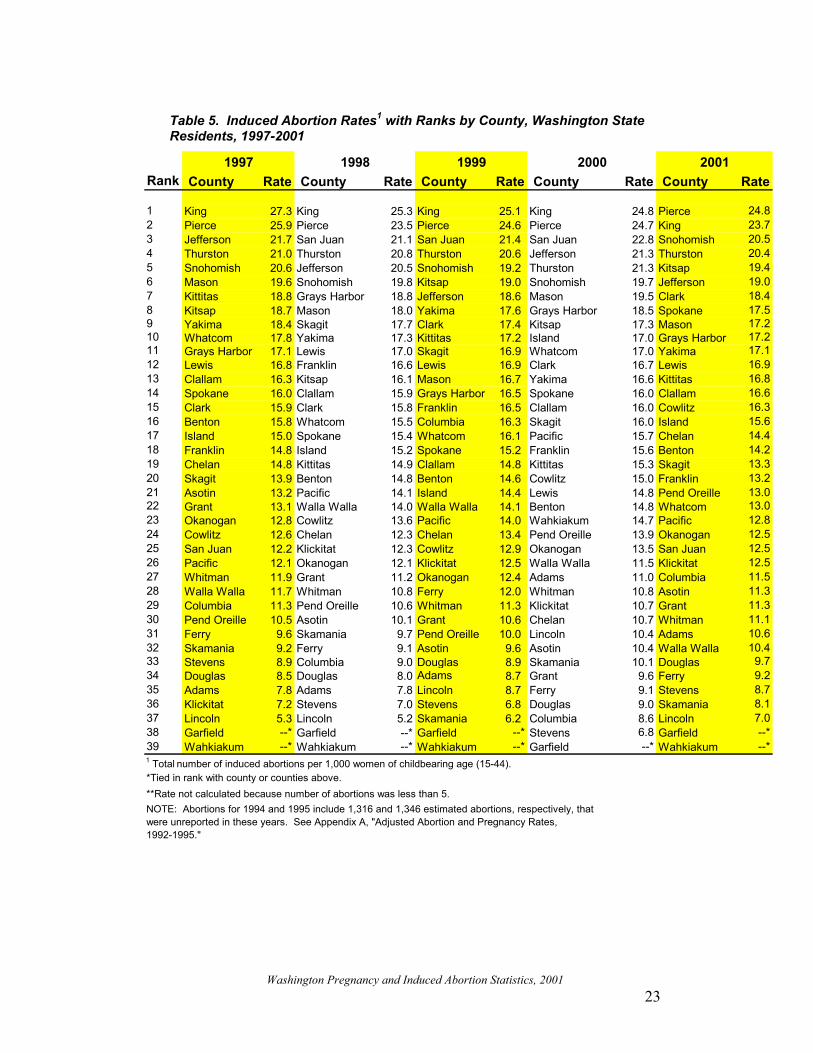
Table 5. Induced Abortion Rates1 with Ranks by County, Washington State Residents, 1997-2001
1997 1998 1999 2000 2001Rank County Rate County Rate County Rate County Rate County Rate
1 King 27.3 King 25.3 King 25.1 King 24.8 Pierce 24.82 Pierce 25.9 Pierce 23.5 Pierce 24.6 Pierce 24.7 King 23.73 Jefferson 21.7 San Juan 21.1 San Juan 21.4 San Juan 22.8 Snohomish 20.54 Thurston 21.0 Thurston 20.8 Thurston 20.6 Jefferson 21.3 Thurston 20.45 Snohomish 20.6 Jefferson 20.5 Snohomish 19.2 Thurston 21.3 Kitsap 19.46 Mason 19.6 Snohomish 19.8 Kitsap 19.0 Snohomish 19.7 Jefferson 19.07 Kittitas 18.8 Grays Harbor 18.8 Jefferson 18.6 Mason 19.5 Clark 18.48 Kitsap 18.7 Mason 18.0 Yakima 17.6 Grays Harbor 18.5 Spokane 17.59 Yakima 18.4 Skagit 17.7 Clark 17.4 Kitsap 17.3 Mason 17.210 Whatcom 17.8 Yakima 17.3 Kittitas 17.2 Island 17.0 Grays Harbor 17.211 Grays Harbor 17.1 Lewis 17.0 Skagit 16.9 Whatcom 17.0 Yakima 17.112 Lewis 16.8 Franklin 16.6 Lewis 16.9 Clark 16.7 Lewis 16.913 Clallam 16.3 Kitsap 16.1 Mason 16.7 Yakima 16.6 Kittitas 16.814 Spokane 16.0 Clallam 15.9 Grays Harbor 16.5 Spokane 16.0 Clallam 16.615 Clark 15.9 Clark 15.8 Franklin 16.5 Clallam 16.0 Cowlitz 16.316 Benton 15.8 Whatcom 15.5 Columbia 16.3 Skagit 16.0 Island 15.617 Island 15.0 Spokane 15.4 Whatcom 16.1 Pacific 15.7 Chelan 14.418 Franklin 14.8 Island 15.2 Spokane 15.2 Franklin 15.6 Benton 14.219 Chelan 14.8 Kittitas 14.9 Clallam 14.8 Kittitas 15.3 Skagit 13.320 Skagit 13.9 Benton 14.8 Benton 14.6 Cowlitz 15.0 Franklin 13.221 Asotin 13.2 Pacific 14.1 Island 14.4 Lewis 14.8 Pend Oreille 13.022 Grant 13.1 Walla Walla 14.0 Walla Walla 14.1 Benton 14.8 Whatcom 13.023 Okanogan 12.8 Cowlitz 13.6 Pacific 14.0 Wahkiakum 14.7 Pacific 12.824 Cowlitz 12.6 Chelan 12.3 Chelan 13.4 Pend Oreille 13.9 Okanogan 12.525 San Juan 12.2 Klickitat 12.3 Cowlitz 12.9 Okanogan 13.5 San Juan 12.526 Pacific 12.1 Okanogan 12.1 Klickitat 12.5 Walla Walla 11.5 Klickitat 12.527 Whitman 11.9 Grant 11.2 Okanogan 12.4 Adams 11.0 Columbia 11.528 Walla Walla 11.7 Whitman 10.8 Ferry 12.0 Whitman 10.8 Asotin 11.329 Columbia 11.3 Pend Oreille 10.6 Whitman 11.3 Klickitat 10.7 Grant 11.330 Pend Oreille 10.5 Asotin 10.1 Grant 10.6 Chelan 10.7 Whitman 11.131 Ferry 9.6 Skamania 9.7 Pend Oreille 10.0 Lincoln 10.4 Adams 10.632 Skamania 9.2 Ferry 9.1 Asotin 9.6 Asotin 10.4 Walla Walla 10.433 Stevens 8.9 Columbia 9.0 Douglas 8.9 Skamania 10.1 Douglas 9.734 Douglas 8.5 Douglas 8.0 Adams 8.7 Grant 9.6 Ferry 9.235 Adams 7.8 Adams 7.8 Lincoln 8.7 Ferry 9.1 Stevens 8.736 Klickitat 7.2 Stevens 7.0 Stevens 6.8 Douglas 9.0 Skamania 8.137 Lincoln 5.3 Lincoln 5.2 Skamania 6.2 Columbia 8.6 Lincoln 7.038 Garfield --* Garfield --* Garfield --* Stevens 6.8 Garfield --*39 Wahkiakum --* Wahkiakum --* Wahkiakum --* Garfield --* Wahkiakum --*
NOTE: Abortions for 1994 and 1995 include 1,316 and 1,346 estimated abortions, respectively, that were unreported in these years. See Appendix A, "Adjusted Abortion and Pregnancy Rates, 1992-1995."
1 Total number of induced abortions per 1,000 women of childbearing age (15-44). *Tied in rank with county or counties above.**Rate not calculated because number of abortions was less than 5.
Washington Pregnancy and Induced Abortion Statistics, 2001
24
0
10
20
30
40
50
60
70
8019
80
1982
1984
1986
1988
1990
1992
1994
1996
1998
2000
Rat
e1
WA US
Figure 1. General Fertility Rates1, Washington State Residents Compared to
National, 1980-2001
Figure 2. Washington State General Fertility Rates by County of Residence,
1999–2001
1 Number of births to women of all ages per 1,000 women age 15 - 44

Washington Pregnancy and Induced Abortion Statistics, 2001
Statistics 2001

Washington Pregnancy and Induced Abortion Statistics, 2001
27
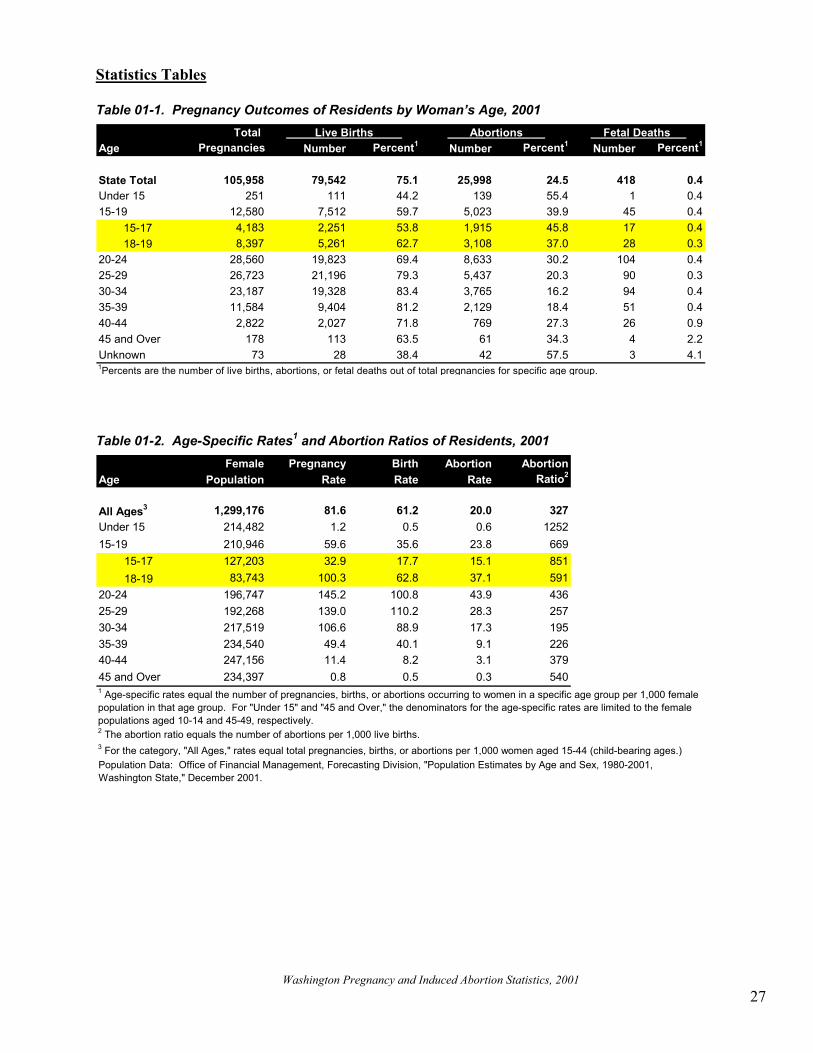
Statistics Tables Table 01-1. Pregnancy Outcomes of Residents by Woman’s Age, 2001
Table 01-2. Age-Specific Rates1 and Abortion Ratios of Residents, 2001
Total Live Births Abortions Fetal Deaths Age Pregnancies Number Percent1 Number Percent1 Number Percent1
State Total 105,958 79,542 75.1 25,998 24.5 418 0.4Under 15 251 111 44.2 139 55.4 1 0.415-19 12,580 7,512 59.7 5,023 39.9 45 0.4
15-17 4,183 2,251 53.8 1,915 45.8 17 0.418-19 8,397 5,261 62.7 3,108 37.0 28 0.3
20-24 28,560 19,823 69.4 8,633 30.2 104 0.425-29 26,723 21,196 79.3 5,437 20.3 90 0.330-34 23,187 19,328 83.4 3,765 16.2 94 0.435-39 11,584 9,404 81.2 2,129 18.4 51 0.440-44 2,822 2,027 71.8 769 27.3 26 0.945 and Over 178 113 63.5 61 34.3 4 2.2Unknown 73 28 38.4 42 57.5 3 4.11Percents are the number of live births, abortions, or fetal deaths out of total pregnancies for specific age group.
Female Pregnancy Birth Abortion AbortionAge Population Rate Rate Rate Ratio2
All Ages3 1,299,176 81.6 61.2 20.0 327Under 15 214,482 1.2 0.5 0.6 125215-19 210,946 59.6 35.6 23.8 669 15-17 127,203 32.9 17.7 15.1 851 18-19 83,743 100.3 62.8 37.1 59120-24 196,747 145.2 100.8 43.9 43625-29 192,268 139.0 110.2 28.3 25730-34 217,519 106.6 88.9 17.3 19535-39 234,540 49.4 40.1 9.1 22640-44 247,156 11.4 8.2 3.1 37945 and Over 234,397 0.8 0.5 0.3 5401 Age-specific rates equal the number of pregnancies, births, or abortions occurring to women in a specific age group per 1,000 female population in that age group. For "Under 15" and "45 and Over," the denominators for the age-specific rates are limited to the female populations aged 10-14 and 45-49, respectively.
3 For the category, "All Ages," rates equal total pregnancies, births, or abortions per 1,000 women aged 15-44 (child-bearing ages.)Population Data: Office of Financial Management, Forecasting Division, "Population Estimates by Age and Sex, 1980-2001, Washington State," December 2001.
2 The abortion ratio equals the number of abortions per 1,000 live births.
Washington Pregnancy and Induced Abortion Statistics, 2001
28
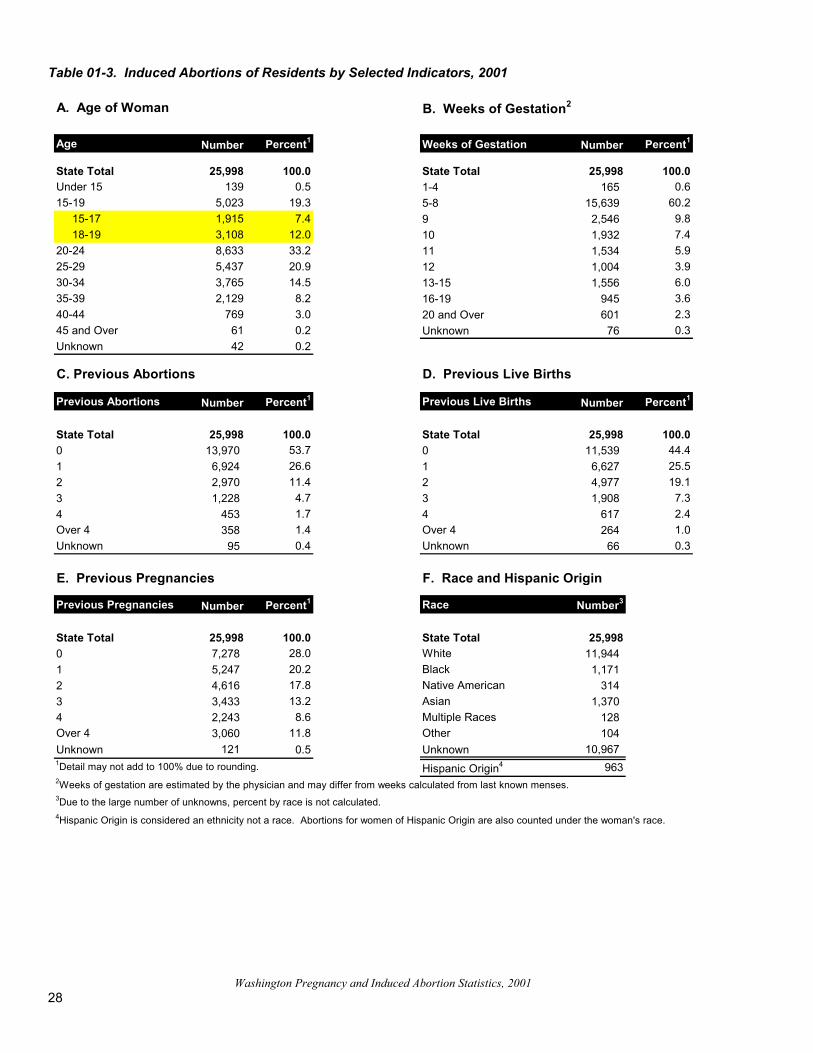
Table 01-3. Induced Abortions of Residents by Selected Indicators, 2001
A. Age of Woman B. Weeks of Gestation2
Age Number Percent1 Weeks of Gestation Number Percent1
State Total 25,998 100.0 State Total 25,998 100.0Under 15 139 0.5 1-4 165 0.615-19 5,023 19.3 5-8 15,639 60.2 15-17 1,915 7.4 9 2,546 9.8 18-19 3,108 12.0 10 1,932 7.420-24 8,633 33.2 11 1,534 5.925-29 5,437 20.9 12 1,004 3.930-34 3,765 14.5 13-15 1,556 6.035-39 2,129 8.2 16-19 945 3.640-44 769 3.0 20 and Over 601 2.345 and Over 61 0.2 Unknown 76 0.3Unknown 42 0.2
C. Previous Abortions D. Previous Live Births
Previous Abortions Number Percent1 Previous Live Births Number Percent1
State Total 25,998 100.0 State Total 25,998 100.00 13,970 53.7 0 11,539 44.41 6,924 26.6 1 6,627 25.52 2,970 11.4 2 4,977 19.13 1,228 4.7 3 1,908 7.34 453 1.7 4 617 2.4Over 4 358 1.4 Over 4 264 1.0Unknown 95 0.4 Unknown 66 0.3
E. Previous Pregnancies F. Race and Hispanic Origin
Previous Pregnancies Number Percent1 Race Number3
State Total 25,998 100.0 State Total 25,9980 7,278 28.0 White 11,944 1 5,247 20.2 Black 1,171 2 4,616 17.8 Native American 314 3 3,433 13.2 Asian 1,370 4 2,243 8.6 Multiple Races 128 Over 4 3,060 11.8 Other 104 Unknown 121 0.5 Unknown 10,967
Hispanic Origin4 9631Detail may not add to 100% due to rounding.
3Due to the large number of unknowns, percent by race is not calculated.4Hispanic Origin is considered an ethnicity not a race. Abortions for women of Hispanic Origin are also counted under the woman's race.
2Weeks of gestation are estimated by the physician and may differ from weeks calculated from last known menses.
Washington Pregnancy and Induced Abortion Statistics, 2001
29
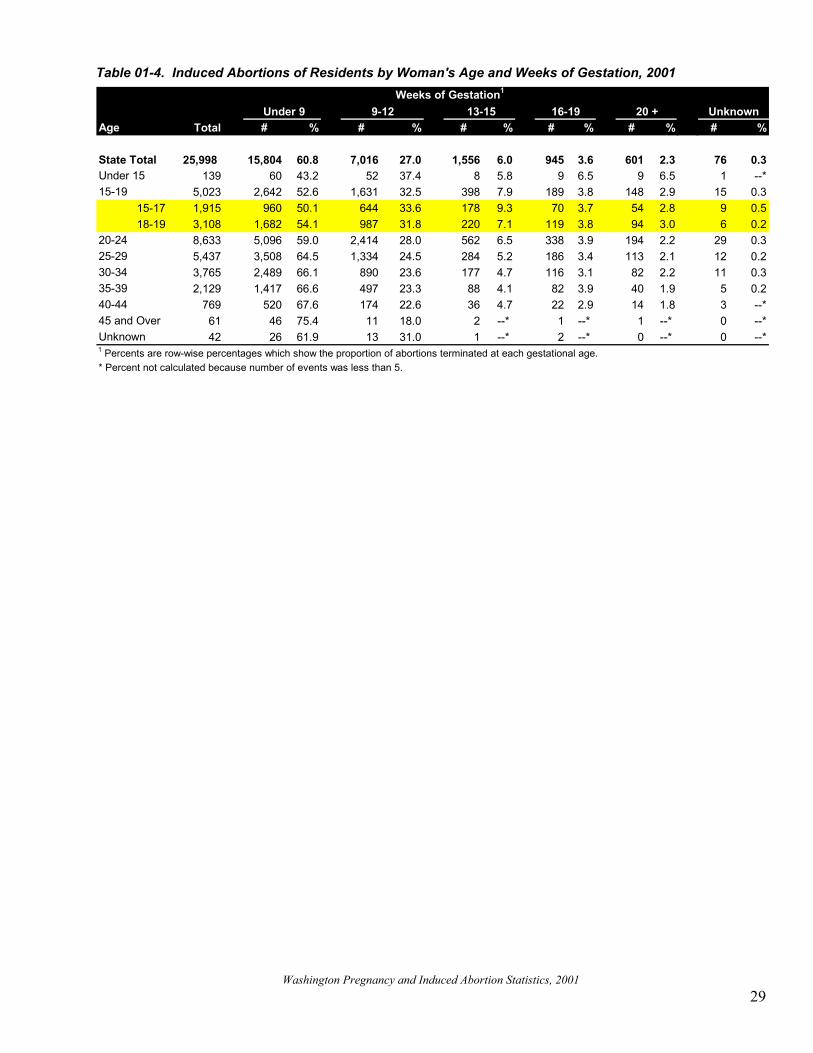
Table 01-4. Induced Abortions of Residents by Woman's Age and Weeks of Gestation, 2001
Weeks of Gestation1
Age Total # % # % # % # % # % # %
State Total 25,998 15,804 60.8 7,016 27.0 1,556 6.0 945 3.6 601 2.3 76 0.3Under 15 139 60 43.2 52 37.4 8 5.8 9 6.5 9 6.5 1 --*15-19 5,023 2,642 52.6 1,631 32.5 398 7.9 189 3.8 148 2.9 15 0.3
15-17 1,915 960 50.1 644 33.6 178 9.3 70 3.7 54 2.8 9 0.518-19 3,108 1,682 54.1 987 31.8 220 7.1 119 3.8 94 3.0 6 0.2
20-24 8,633 5,096 59.0 2,414 28.0 562 6.5 338 3.9 194 2.2 29 0.325-29 5,437 3,508 64.5 1,334 24.5 284 5.2 186 3.4 113 2.1 12 0.230-34 3,765 2,489 66.1 890 23.6 177 4.7 116 3.1 82 2.2 11 0.335-39 2,129 1,417 66.6 497 23.3 88 4.1 82 3.9 40 1.9 5 0.240-44 769 520 67.6 174 22.6 36 4.7 22 2.9 14 1.8 3 --*45 and Over 61 46 75.4 11 18.0 2 --* 1 --* 1 --* 0 --*Unknown 42 26 61.9 13 31.0 1 --* 2 --* 0 --* 0 --*
Unknown
1 Percents are row-wise percentages which show the proportion of abortions terminated at each gestational age.* Percent not calculated because number of events was less than 5.
13-15 16-19 20 + Under 9 9-12
Washington Pregnancy and Induced Abortion Statistics, 2001
30
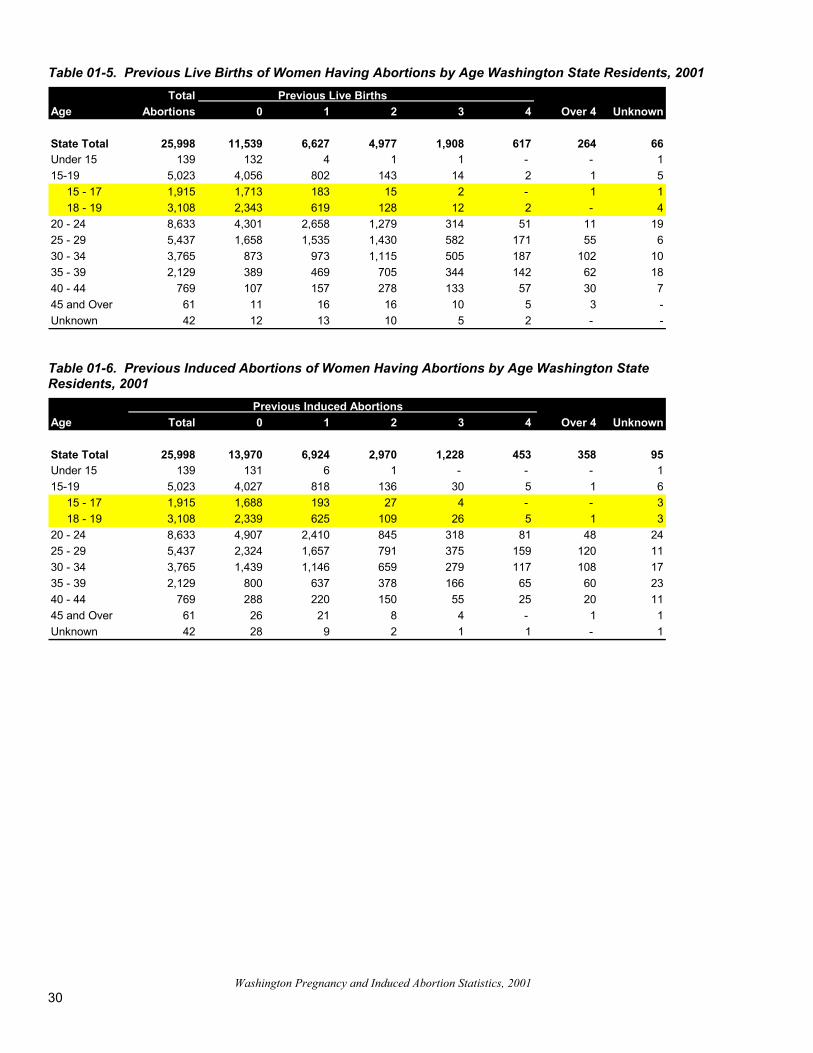
Table 01-5. Previous Live Births of Women Having Abortions by Age Washington State Residents, 2001
Table 01-6. Previous Induced Abortions of Women Having Abortions by Age Washington State Residents, 2001
Total Previous Live Births Age Abortions 0 1 2 3 4 Over 4 Unknown
State Total 25,998 11,539 6,627 4,977 1,908 617 264 66Under 15 139 132 4 1 1 - - 115-19 5,023 4,056 802 143 14 2 1 5 15 - 17 1,915 1,713 183 15 2 - 1 1 18 - 19 3,108 2,343 619 128 12 2 - 420 - 24 8,633 4,301 2,658 1,279 314 51 11 1925 - 29 5,437 1,658 1,535 1,430 582 171 55 630 - 34 3,765 873 973 1,115 505 187 102 1035 - 39 2,129 389 469 705 344 142 62 1840 - 44 769 107 157 278 133 57 30 745 and Over 61 11 16 16 10 5 3 -Unknown 42 12 13 10 5 2 - -
Previous Induced Abortions Age Total 0 1 2 3 4 Over 4 Unknown
State Total 25,998 13,970 6,924 2,970 1,228 453 358 95Under 15 139 131 6 1 - - - 115-19 5,023 4,027 818 136 30 5 1 6 15 - 17 1,915 1,688 193 27 4 - - 3 18 - 19 3,108 2,339 625 109 26 5 1 320 - 24 8,633 4,907 2,410 845 318 81 48 2425 - 29 5,437 2,324 1,657 791 375 159 120 1130 - 34 3,765 1,439 1,146 659 279 117 108 1735 - 39 2,129 800 637 378 166 65 60 2340 - 44 769 288 220 150 55 25 20 1145 and Over 61 26 21 8 4 - 1 1Unknown 42 28 9 2 1 1 - 1
Washington Pregnancy and Induced Abortion Statistics, 2001
31
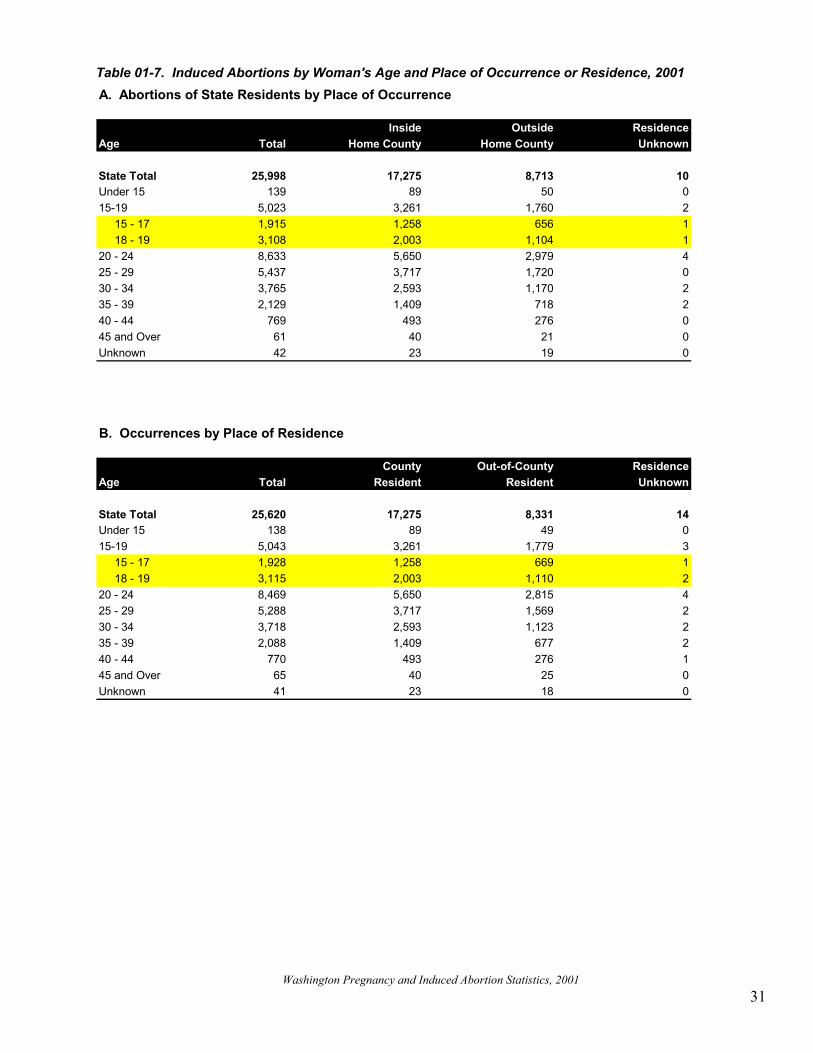
Table 01-7. Induced Abortions by Woman's Age and Place of Occurrence or Residence, 2001
A. Abortions of State Residents by Place of Occurrence
Inside Outside ResidenceAge Total Home County Home County Unknown
State Total 25,998 17,275 8,713 10Under 15 139 89 50 015-19 5,023 3,261 1,760 2 15 - 17 1,915 1,258 656 1 18 - 19 3,108 2,003 1,104 120 - 24 8,633 5,650 2,979 425 - 29 5,437 3,717 1,720 030 - 34 3,765 2,593 1,170 235 - 39 2,129 1,409 718 240 - 44 769 493 276 045 and Over 61 40 21 0Unknown 42 23 19 0
B. Occurrences by Place of Residence
County Out-of-County ResidenceAge Total Resident Resident Unknown
State Total 25,620 17,275 8,331 14Under 15 138 89 49 015-19 5,043 3,261 1,779 3 15 - 17 1,928 1,258 669 1 18 - 19 3,115 2,003 1,110 220 - 24 8,469 5,650 2,815 425 - 29 5,288 3,717 1,569 230 - 34 3,718 2,593 1,123 235 - 39 2,088 1,409 677 240 - 44 770 493 276 145 and Over 65 40 25 0Unknown 41 23 18 0
Washington Pregnancy and Induced Abortion Statistics, 2001
32
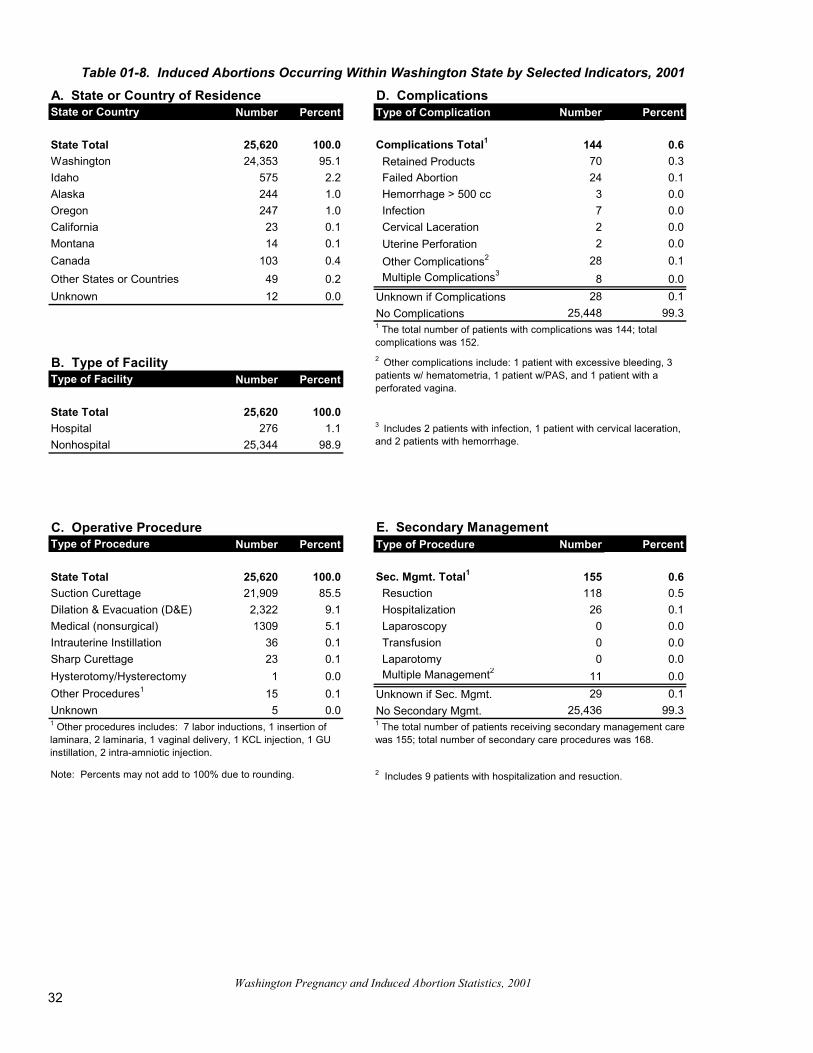
Table 01-8. Induced Abortions Occurring Within Washington State by Selected Indicators, 2001
A. State or Country of Residence D. ComplicationsState or Country Number Percent Type of Complication Number Percent
State Total 25,620 100.0 Complications Total1 144 0.6Washington 24,353 95.1 Retained Products 70 0.3Idaho 575 2.2 Failed Abortion 24 0.1Alaska 244 1.0 Hemorrhage > 500 cc 3 0.0Oregon 247 1.0 Infection 7 0.0California 23 0.1 Cervical Laceration 2 0.0Montana 14 0.1 Uterine Perforation 2 0.0Canada 103 0.4 Other Complications2 28 0.1Other States or Countries 49 0.2 Multiple Complications3 8 0.0Unknown 12 0.0 Unknown if Complications 28 0.1
No Complications 25,448 99.3
B. Type of FacilityType of Facility Number Percent
State Total 25,620 100.0Hospital 276 1.1Nonhospital 25,344 98.9
C. Operative Procedure E. Secondary ManagementType of Procedure Number Percent Type of Procedure Number Percent
State Total 25,620 100.0 Sec. Mgmt. Total1 155 0.6Suction Curettage 21,909 85.5 Resuction 118 0.5Dilation & Evacuation (D&E) 2,322 9.1 Hospitalization 26 0.1Medical (nonsurgical) 1309 5.1 Laparoscopy 0 0.0Intrauterine Instillation 36 0.1 Transfusion 0 0.0Sharp Curettage 23 0.1 Laparotomy 0 0.0Hysterotomy/Hysterectomy 1 0.0 Multiple Management2 11 0.0Other Procedures1 15 0.1 Unknown if Sec. Mgmt. 29 0.1Unknown 5 0.0 No Secondary Mgmt. 25,436 99.31 Other procedures includes: 7 labor inductions, 1 insertion of laminara, 2 laminaria, 1 vaginal delivery, 1 KCL injection, 1 GU instillation, 2 intra-amniotic injection.
1 The total number of patients receiving secondary management care was 155; total number of secondary care procedures was 168.
2 Includes 9 patients with hospitalization and resuction.
1 The total number of patients with complications was 144; total complications was 152.2 Other complications include: 1 patient with excessive bleeding, 3 patients w/ hematometria, 1 patient w/PAS, and 1 patient with a perforated vagina.
3 Includes 2 patients with infection, 1 patient with cervical laceration, and 2 patients with hemorrhage.
Note: Percents may not add to 100% due to rounding.
Washington Pregnancy and Induced Abortion Statistics, 2001
33
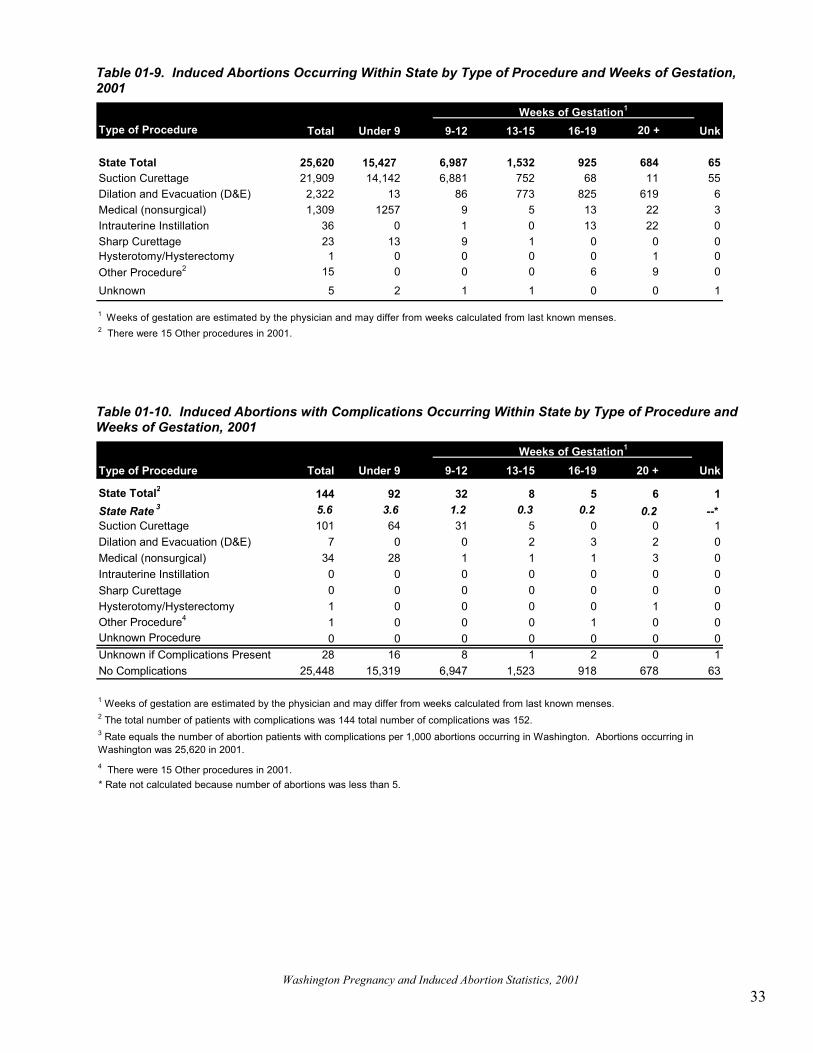
Table 01-9. Induced Abortions Occurring Within State by Type of Procedure and Weeks of Gestation, 2001
Table 01-10. Induced Abortions with Complications Occurring Within State by Type of Procedure and Weeks of Gestation, 2001
Weeks of Gestation1
Type of Procedure Total Under 9 9-12 13-15 16-19 20 + Unk
State Total 25,620 15,427 6,987 1,532 925 684 65Suction Curettage 21,909 14,142 6,881 752 68 11 55Dilation and Evacuation (D&E) 2,322 13 86 773 825 619 6Medical (nonsurgical) 1,309 1257 9 5 13 22 3Intrauterine Instillation 36 0 1 0 13 22 0Sharp Curettage 23 13 9 1 0 0 0Hysterotomy/Hysterectomy 1 0 0 0 0 1 0Other Procedure2 15 0 0 0 6 9 0
Unknown 5 2 1 1 0 0 1
1 Weeks of gestation are estimated by the physician and may differ from weeks calculated from last known menses.2 There were 15 Other procedures in 2001.
Weeks of Gestation1
Type of Procedure Total Under 9 9-12 13-15 16-19 20 + Unk
State Total2 144 92 32 8 5 6 1State Rate 3 5.6 3.6 1.2 0.3 0.2 0.2 --*Suction Curettage 101 64 31 5 0 0 1Dilation and Evacuation (D&E) 7 0 0 2 3 2 0Medical (nonsurgical) 34 28 1 1 1 3 0Intrauterine Instillation 0 0 0 0 0 0 0Sharp Curettage 0 0 0 0 0 0 0Hysterotomy/Hysterectomy 1 0 0 0 0 1 0Other Procedure4 1 0 0 0 1 0 0Unknown Procedure 0 0 0 0 0 0 0Unknown if Complications Present 28 16 8 1 2 0 1No Complications 25,448 15,319 6,947 1,523 918 678 63
2 The total number of patients with complications was 144 total number of complications was 152.
1 Weeks of gestation are estimated by the physician and may differ from weeks calculated from last known menses.
* Rate not calculated because number of abortions was less than 5.
3 Rate equals the number of abortion patients with complications per 1,000 abortions occurring in Washington. Abortions occurring in Washington was 25,620 in 2001.4 There were 15 Other procedures in 2001.
Washington Pregnancy and Induced Abortion Statistics, 2001
34
Table 01-11. Induced Abortions with Secondary Management Occurring Within State by Type, 2001
Table 01-12. Induced Abortions with Secondary Management Occurring Within State by Type of Secondary Management and Weeks of Gestation, 2001
Weeks of Gestation1
Type of Procedure Total Under 9 9-12 13-15 16-19 20 + Unk
State Total2 155 92 32 9 9 11 2State Rate 3 6.0 3.6 1.2 0.4 0.4 0.4 --*Suction Curettage 105 66 31 6 0 0 2Dilation and Evacuation (D&E) 7 0 0 2 3 2 0Medical (nonsurgical) 37 26 1 1 5 4 0Intrauterine Instillation 3 0 0 0 0 3 0Sharp Curettage 0 0 0 0 0 0 0Hysterotomy/Hysterectomy 1 0 0 0 0 1 0Other Procedure 2 0 0 0 1 1 0Unknown Procedure 0 0 0 0 0 0 0Unknown if Sec. Mgmt. 29 17 8 1 2 0 1No Secondary Management 25,436 15,318 6,947 1,522 914 673 62
1 Weeks of gestation are estimated by the physician and may differ from weeks calculated from last known menses.2 The total number of patients receiving secondary management care was 155; total number of secondary care procedures was 168.3 Rate equals the number of abortion patients with complications per 1,000 abortions occurring in Washington. Abortions occurring in Washington was 25,620 in 2001.
Type of Management Care Total Under 9 9-12 13-15 16-19 20 + Unk
State Total2 155 92 32 9 9 11 2State Rate 3 6.0 3.6 1.2 0.4 0.4 0.4 --*Resuction 118 82 29 7 0 0 0Hospitalization 26 6 1 2 7 8 2Laparoscopy 0 0 0 0 0 0 0Transfusion 0 0 0 0 0 0 0Laparotomy 0 0 0 0 0 0 0Multiple Management4 11 4 2 0 2 3 0Unknown if Sec. Mgmt. 29 17 8 1 2 0 1No Secondary Management 25,436 15,318 6,947 1,522 914 673 62
* Rate not calculated because number of abortions was less than 5.
1 Weeks of gestation are estimated by the physician and may differ from weeks calculated from last known menses.
4 Includes 9 patients who received hospitalization and resuction.
2 The total number of patients receiving secondary management care was 155; total number of secondary care procedures was 168.3 Rate equals the number of abortion patients with complications per 1,000 abortions occurring in Washington. Abortions occurring in Washington was 25,620 in 2001.
Washington Pregnancy and Induced Abortion Statistics, 2001
35
Table 01-13. Induced Abortions with Complications Occurring Within State by Type of Complication and Weeks of Gestation, 2001
Table 01-14. Induced Abortions with Complications Occurring Within State by Type of Complication and Secondary Management Procedure, 2001
Weeks of Gestation1
Type of Complication Total Under 9 9-12 13-15 16-19 20 + Unk
Patients w/Complic.2 144 92 32 8 5 6 1State Rate 3 5.6 3.6 1.2 0.3 0.2 0.2 --*Retained Products 70 45 17 4 2 2 0Failed Abortion 24 22 1 1 0 0 0Hemorrhage > 500 cc 3 0 1 1 0 1 0Infection 2 2 0 0 0 0 0Cervical Laceration 7 3 1 1 2 0 0Uterine Perforation 2 1 0 1 0 0 0Other Complications4 28 16 9 0 1 1 1Multiple Complications5 8 3 3 0 0 2 0Unknown if Complications 28 16 8 1 2 0 1No Complications 25,448 15,319 6,947 1,523 918 678 63Footnote: see bottom of page.
Type of Complication TotalResuc-
tionHospital-
izationTrans-fusion
Laparo-scopy
Lapa-rotomy
MultipleMgmt.6 None Unk
State Total 25,620 118 26 0 0 0 11 25,436 29Patients w/Complic. 2 144 114 13 0 0 0 10 7 0Retained Products 70 63 3 0 0 0 3 1 0Failed Abortion 24 24 0 0 0 0 0 0 0Hemorrhage > 500 cc 3 2 1 0 0 0 0 0 0Infection 2 0 1 0 0 0 0 1 0Cervical Laceration 7 5 2 0 0 0 0 0 0Uterine Perforation 2 0 1 0 0 0 0 1 0Other Complications4 28 16 5 0 0 0 3 4 0Multiple Complications5 8 4 0 0 0 0 4 0 0Unknown if Complications 28 0 0 0 0 0 0 1 27No Complications 25,448 4 13 0 0 0 1 25,428 2
1 Weeks of gestation are estimated by the physician and may differ from weeks calculated from last known menses.2 The total number of patients with complications was 144; total complications was 152.3 Rate equals the number of abortion patients with complications per 1,000 abortions occurring in Washington.
* Rate not calculated because number of events was less than 5.
6 Includes 9 patients with hospitalization and resuction.
4 Includes 7 labor inductions, 1 insertion of laminara, 2 laminaria, 1 vaginal delivery, 1 KCL injection, 1 GU instillation,and 2 intra-amniotic i j i5 Includes 1 patient with excessive bleeeding, 3 patients w/hematometria, 1 patient w/PAS, and 1 patient with a perforated vagina.
Washington Pregnancy and Induced Abortion Statistics, 2001
36
Table 01-15. Birth and Abortion Indicators1 by County of Residence, 2001
Women Live Abortion Abortion FertilityCounty 15-44 Births Abortions Ratio Rate Rate
State Total2 1,299,176 79,542 25,998 327 20.0 61.2Adams 3,300 328 35 107 10.6 99.4Asotin 4,144 234 47 201 11.3 56.5Benton 30,438 2,215 431 195 14.2 72.8Chelan 13,181 971 190 196 14.4 73.7Clallam 10,487 606 174 287 16.6 57.8Clark 76,379 5,322 1,403 264 18.4 69.7Columbia 695 35 8 229 11.5 50.4Cowlitz 18,624 1,229 304 247 16.3 66.0Douglas 6,629 440 64 145 9.7 66.4Ferry 1,308 75 12 160 9.2 57.3Franklin 10,407 1,147 137 119 13.2 110.2Garfield 398 23 4 --* --* 57.8Grant 15,181 1,313 172 131 11.3 86.5Grays Harbor 13,030 766 224 292 17.2 58.8Island 14,008 897 218 243 15.6 64.0Jefferson 4,000 200 76 380 19.0 50.0King 406,398 21,778 9,618 442 23.7 53.6Kitsap 47,868 2,946 928 315 19.4 61.5Kittitas 8,432 371 142 383 16.8 44.0Klickitat 3,528 221 44 199 12.5 62.6Lewis 13,086 856 221 258 16.9 65.4Lincoln 1,718 92 12 130 7.0 53.6Mason 8,667 543 149 274 17.2 62.7Okanogan 7,439 518 93 180 12.5 69.6Pacific 3,210 203 41 202 12.8 63.2Pend Oreille 2,077 124 27 218 13.0 59.7Pierce 158,883 10,052 3,944 392 24.8 63.3San Juan 2,162 104 27 260 12.5 48.1Skagit 20,585 1,383 274 198 13.3 67.2Skamania 1,967 109 16 147 8.1 55.4Snohomish 137,848 8,703 2,819 324 20.5 63.1Spokane 91,431 5,414 1,598 295 17.5 59.2Stevens 7,478 449 65 145 8.7 60.0Thurston 45,488 2,606 927 356 20.4 57.3Wahkiakum 602 29 2 --* --* 48.2Walla Walla 11,190 714 116 162 10.4 63.8Whatcom 39,005 1,965 506 258 13.0 50.4Whitman 11,738 375 130 347 11.1 31.9Yakima 46,168 4,186 790 189 17.1 90.7
1 The abortion ratio equals total abortions per 1,000 live births; the general abortion rate equals total abortions per 1,000 women of childbearing age (15-44); and the general fertility rate equals total live births per 1,000 women of childbearing age.
Population Data: Office of Financial Management, Forecasting Division, "Population Estimates by Age and Sex, 1980-2001, Washington State," December 2001.
2 Total abortions includes 10 for which county of residence was unknown.* Rate not calculated because number of events was less than 5.
Washington Pregnancy and Induced Abortion Statistics, 2001
37
Table 01-16. Total Pregnancies1 by Woman's Age and County of Residence, 2001
CountyAll
Ages < 15 15-19 15-17 18-19 20-24 25-29 30-34 35-39 40-44 45 +AgeUnk
State Total 105,958 251 12,580 4,183 8,397 28,560 26,723 23,187 11,584 2,822 178 73Adams 363 1 64 26 38 116 101 58 19 4 0 0Asotin 281 1 49 17 32 85 67 44 28 6 1 0Benton 2,653 6 367 129 238 784 668 517 253 53 4 1Chelan 1,171 3 168 52 116 331 287 222 137 22 1 0Clallam 784 2 120 45 75 264 178 120 70 25 5 0Clark 6,748 7 762 190 572 1,867 1,809 1,438 689 166 6 4Columbia 43 0 6 1 5 15 9 5 6 2 0 0Cowlitz 1,540 5 218 68 150 506 399 268 111 30 2 1Douglas 504 2 68 27 41 156 136 90 43 9 0 0Ferry 87 0 24 7 17 25 17 9 10 1 0 1Franklin 1,285 6 205 82 123 405 349 203 101 14 0 2Garfield 27 0 3 0 3 6 9 3 5 1 0 0Grant 1,492 3 259 89 170 450 415 232 102 28 1 2Grays Harbor 995 3 173 60 113 337 230 156 79 16 1 0Island 1,118 2 118 39 79 370 268 215 107 35 3 0Jefferson 277 0 45 20 25 70 64 45 41 10 2 0King 31,512 60 2,735 926 1,809 6,730 7,629 8,485 4,656 1,120 75 22Kitsap 3,893 2 527 156 371 1,172 940 731 396 115 9 1Kittitas 515 0 57 14 43 190 123 99 37 6 2 1Klickitat 265 1 43 19 24 79 69 42 27 3 1 0Lewis 1,080 4 171 55 116 393 247 178 67 18 2 0Lincoln 104 0 15 8 7 30 22 27 9 1 0 0Mason 698 1 119 39 80 229 163 107 61 15 3 0Okanogan 614 2 121 43 78 186 135 113 44 12 1 0Pacific 244 0 37 13 24 81 68 33 21 4 0 0Pend Oreille 153 1 20 7 13 53 23 34 18 4 0 0Pierce 14,056 47 1,839 606 1,233 4,206 3,697 2,674 1,255 300 19 19San Juan 131 0 9 4 5 25 37 23 27 10 0 0Skagit 1,666 6 272 101 171 473 420 326 144 22 3 0Skamania 125 1 18 7 11 44 27 23 5 7 0 0Snohomish 11,576 23 1,288 425 863 2,865 2,998 2,746 1,296 339 10 11Spokane 7,046 15 875 285 590 2,141 1,854 1,397 594 157 12 1Stevens 515 0 71 20 51 164 134 88 41 15 2 0Thurston 3,546 12 415 138 277 986 922 773 328 102 4 4Wahkiakum 31 0 2 1 1 8 7 10 3 1 0 0Walla Walla 835 1 146 58 88 245 191 162 76 14 0 0Whatcom 2,478 10 252 75 177 704 648 536 266 56 4 2Whitman 506 2 49 6 43 155 138 105 51 6 0 0Yakima 4,991 22 848 324 524 1,610 1,225 848 359 73 5 1Unknown 10 0 2 1 1 4 0 2 2 0 0 01Total pregnancies equals the sum of live births, abortions, and fetal deaths.
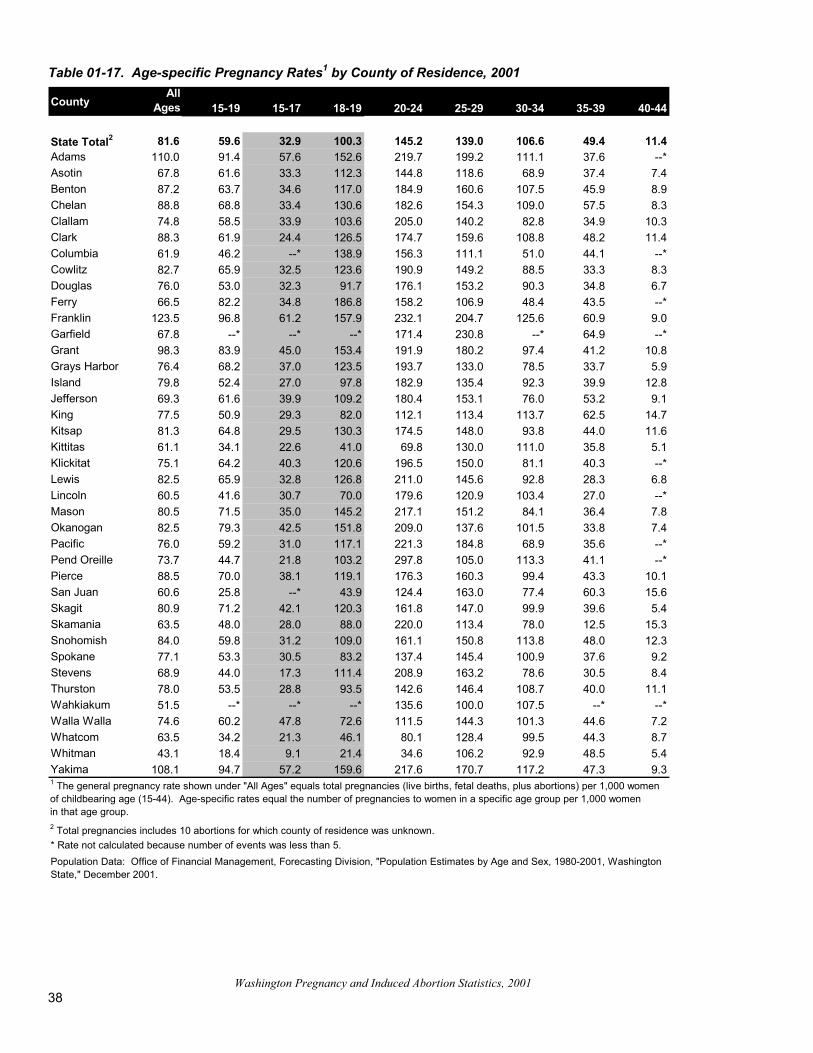
Washington Pregnancy and Induced Abortion Statistics, 2001
38
Table 01-17. Age-specific Pregnancy Rates1 by County of Residence, 2001
CountyAll
Ages 15-19 15-17 18-19 20-24 25-29 30-34 35-39 40-44
State Total2 81.6 59.6 32.9 100.3 145.2 139.0 106.6 49.4 11.4Adams 110.0 91.4 57.6 152.6 219.7 199.2 111.1 37.6 --*Asotin 67.8 61.6 33.3 112.3 144.8 118.6 68.9 37.4 7.4Benton 87.2 63.7 34.6 117.0 184.9 160.6 107.5 45.9 8.9Chelan 88.8 68.8 33.4 130.6 182.6 154.3 109.0 57.5 8.3Clallam 74.8 58.5 33.9 103.6 205.0 140.2 82.8 34.9 10.3Clark 88.3 61.9 24.4 126.5 174.7 159.6 108.8 48.2 11.4Columbia 61.9 46.2 --* 138.9 156.3 111.1 51.0 44.1 --*Cowlitz 82.7 65.9 32.5 123.6 190.9 149.2 88.5 33.3 8.3Douglas 76.0 53.0 32.3 91.7 176.1 153.2 90.3 34.8 6.7Ferry 66.5 82.2 34.8 186.8 158.2 106.9 48.4 43.5 --*Franklin 123.5 96.8 61.2 157.9 232.1 204.7 125.6 60.9 9.0Garfield 67.8 --* --* --* 171.4 230.8 --* 64.9 --*Grant 98.3 83.9 45.0 153.4 191.9 180.2 97.4 41.2 10.8Grays Harbor 76.4 68.2 37.0 123.5 193.7 133.0 78.5 33.7 5.9Island 79.8 52.4 27.0 97.8 182.9 135.4 92.3 39.9 12.8Jefferson 69.3 61.6 39.9 109.2 180.4 153.1 76.0 53.2 9.1King 77.5 50.9 29.3 82.0 112.1 113.4 113.7 62.5 14.7Kitsap 81.3 64.8 29.5 130.3 174.5 148.0 93.8 44.0 11.6Kittitas 61.1 34.1 22.6 41.0 69.8 130.0 111.0 35.8 5.1Klickitat 75.1 64.2 40.3 120.6 196.5 150.0 81.1 40.3 --*Lewis 82.5 65.9 32.8 126.8 211.0 145.6 92.8 28.3 6.8Lincoln 60.5 41.6 30.7 70.0 179.6 120.9 103.4 27.0 --*Mason 80.5 71.5 35.0 145.2 217.1 151.2 84.1 36.4 7.8Okanogan 82.5 79.3 42.5 151.8 209.0 137.6 101.5 33.8 7.4Pacific 76.0 59.2 31.0 117.1 221.3 184.8 68.9 35.6 --*Pend Oreille 73.7 44.7 21.8 103.2 297.8 105.0 113.3 41.1 --*Pierce 88.5 70.0 38.1 119.1 176.3 160.3 99.4 43.3 10.1San Juan 60.6 25.8 --* 43.9 124.4 163.0 77.4 60.3 15.6Skagit 80.9 71.2 42.1 120.3 161.8 147.0 99.9 39.6 5.4Skamania 63.5 48.0 28.0 88.0 220.0 113.4 78.0 12.5 15.3Snohomish 84.0 59.8 31.2 109.0 161.1 150.8 113.8 48.0 12.3Spokane 77.1 53.3 30.5 83.2 137.4 145.4 100.9 37.6 9.2Stevens 68.9 44.0 17.3 111.4 208.9 163.2 78.6 30.5 8.4Thurston 78.0 53.5 28.8 93.5 142.6 146.4 108.7 40.0 11.1Wahkiakum 51.5 --* --* --* 135.6 100.0 107.5 --* --*Walla Walla 74.6 60.2 47.8 72.6 111.5 144.3 101.3 44.6 7.2Whatcom 63.5 34.2 21.3 46.1 80.1 128.4 99.5 44.3 8.7Whitman 43.1 18.4 9.1 21.4 34.6 106.2 92.9 48.5 5.4Yakima 108.1 94.7 57.2 159.6 217.6 170.7 117.2 47.3 9.31 The general pregnancy rate shown under "All Ages" equals total pregnancies (live births, fetal deaths, plus abortions) per 1,000 women of childbearing age (15-44). Age-specific rates equal the number of pregnancies to women in a specific age group per 1,000 women in that age group.
Population Data: Office of Financial Management, Forecasting Division, "Population Estimates by Age and Sex, 1980-2001, Washington State," December 2001.
* Rate not calculated because number of events was less than 5.
2 Total pregnancies includes 10 abortions for which county of residence was unknown.
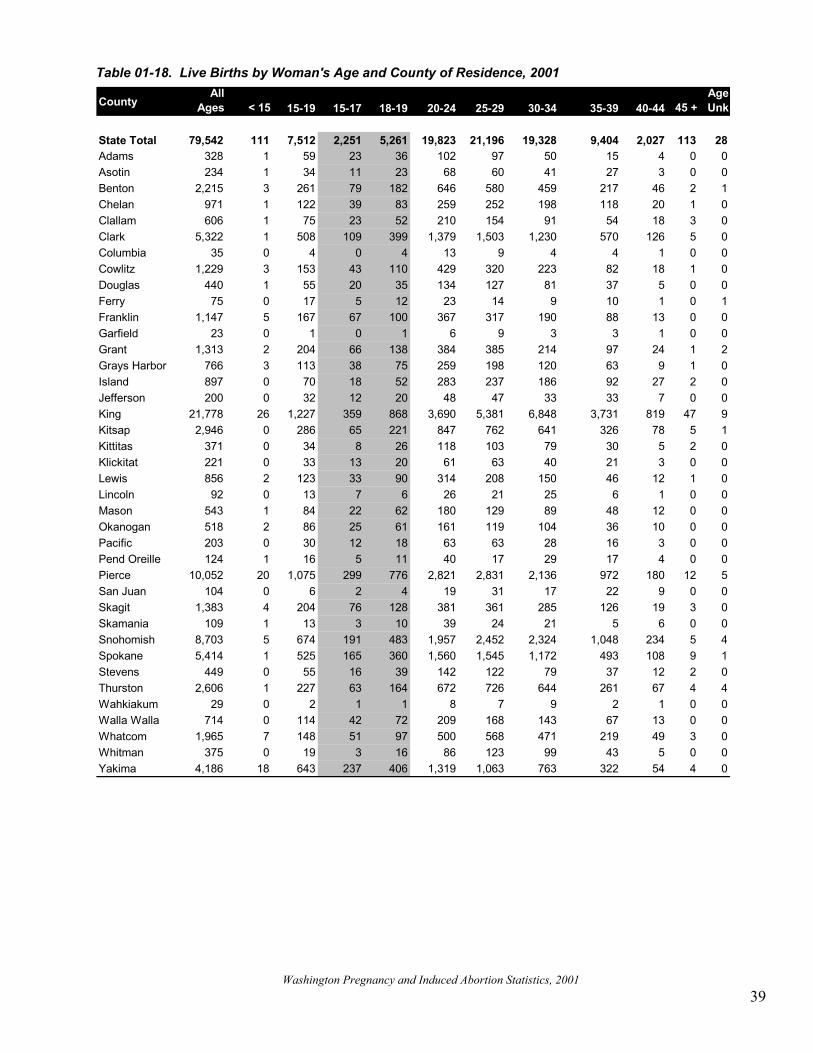
Washington Pregnancy and Induced Abortion Statistics, 2001
39
Table 01-18. Live Births by Woman's Age and County of Residence, 2001
CountyAll
Ages < 15 15-19 15-17 18-19 20-24 25-29 30-34 35-39 40-44 45 +AgeUnk
State Total 79,542 111 7,512 2,251 5,261 19,823 21,196 19,328 9,404 2,027 113 28Adams 328 1 59 23 36 102 97 50 15 4 0 0Asotin 234 1 34 11 23 68 60 41 27 3 0 0Benton 2,215 3 261 79 182 646 580 459 217 46 2 1Chelan 971 1 122 39 83 259 252 198 118 20 1 0Clallam 606 1 75 23 52 210 154 91 54 18 3 0Clark 5,322 1 508 109 399 1,379 1,503 1,230 570 126 5 0Columbia 35 0 4 0 4 13 9 4 4 1 0 0Cowlitz 1,229 3 153 43 110 429 320 223 82 18 1 0Douglas 440 1 55 20 35 134 127 81 37 5 0 0Ferry 75 0 17 5 12 23 14 9 10 1 0 1Franklin 1,147 5 167 67 100 367 317 190 88 13 0 0Garfield 23 0 1 0 1 6 9 3 3 1 0 0Grant 1,313 2 204 66 138 384 385 214 97 24 1 2Grays Harbor 766 3 113 38 75 259 198 120 63 9 1 0Island 897 0 70 18 52 283 237 186 92 27 2 0Jefferson 200 0 32 12 20 48 47 33 33 7 0 0King 21,778 26 1,227 359 868 3,690 5,381 6,848 3,731 819 47 9Kitsap 2,946 0 286 65 221 847 762 641 326 78 5 1Kittitas 371 0 34 8 26 118 103 79 30 5 2 0Klickitat 221 0 33 13 20 61 63 40 21 3 0 0Lewis 856 2 123 33 90 314 208 150 46 12 1 0Lincoln 92 0 13 7 6 26 21 25 6 1 0 0Mason 543 1 84 22 62 180 129 89 48 12 0 0Okanogan 518 2 86 25 61 161 119 104 36 10 0 0Pacific 203 0 30 12 18 63 63 28 16 3 0 0Pend Oreille 124 1 16 5 11 40 17 29 17 4 0 0Pierce 10,052 20 1,075 299 776 2,821 2,831 2,136 972 180 12 5San Juan 104 0 6 2 4 19 31 17 22 9 0 0Skagit 1,383 4 204 76 128 381 361 285 126 19 3 0Skamania 109 1 13 3 10 39 24 21 5 6 0 0Snohomish 8,703 5 674 191 483 1,957 2,452 2,324 1,048 234 5 4Spokane 5,414 1 525 165 360 1,560 1,545 1,172 493 108 9 1Stevens 449 0 55 16 39 142 122 79 37 12 2 0Thurston 2,606 1 227 63 164 672 726 644 261 67 4 4Wahkiakum 29 0 2 1 1 8 7 9 2 1 0 0Walla Walla 714 0 114 42 72 209 168 143 67 13 0 0Whatcom 1,965 7 148 51 97 500 568 471 219 49 3 0Whitman 375 0 19 3 16 86 123 99 43 5 0 0Yakima 4,186 18 643 237 406 1,319 1,063 763 322 54 4 0
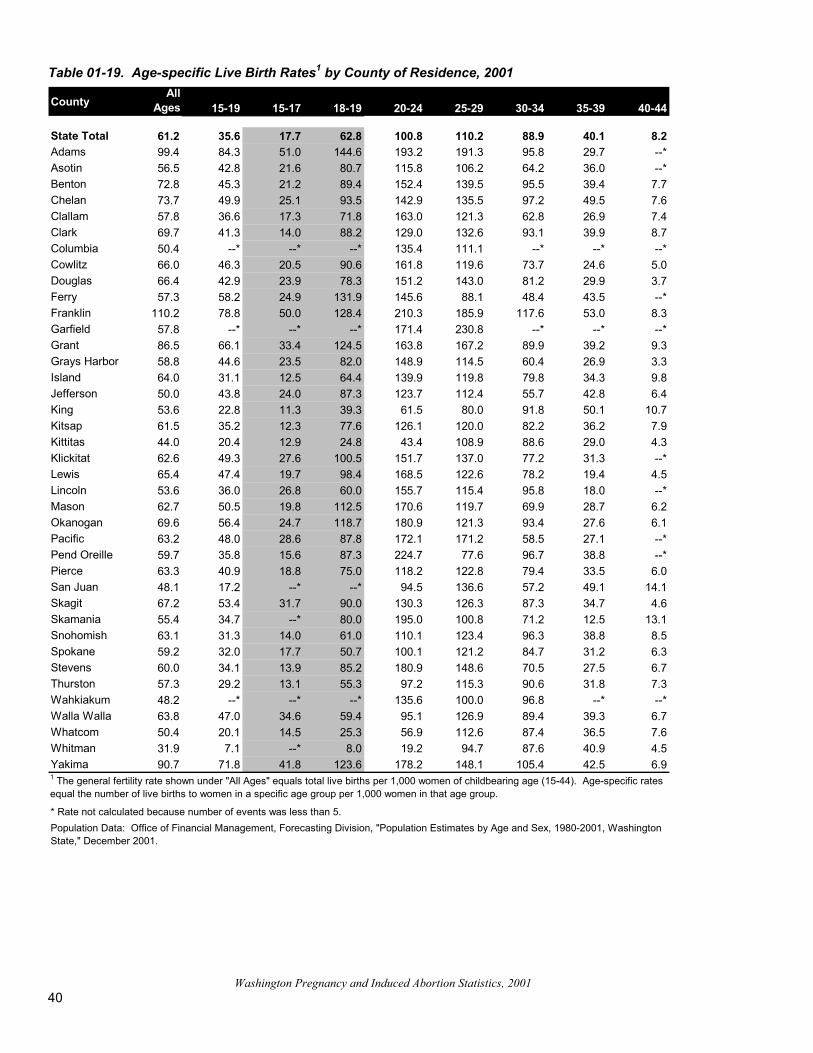
Washington Pregnancy and Induced Abortion Statistics, 2001
40
Table 01-19. Age-specific Live Birth Rates1 by County of Residence, 2001
CountyAll
Ages 15-19 15-17 18-19 20-24 25-29 30-34 35-39 40-44
State Total 61.2 35.6 17.7 62.8 100.8 110.2 88.9 40.1 8.2Adams 99.4 84.3 51.0 144.6 193.2 191.3 95.8 29.7 --*Asotin 56.5 42.8 21.6 80.7 115.8 106.2 64.2 36.0 --*Benton 72.8 45.3 21.2 89.4 152.4 139.5 95.5 39.4 7.7Chelan 73.7 49.9 25.1 93.5 142.9 135.5 97.2 49.5 7.6Clallam 57.8 36.6 17.3 71.8 163.0 121.3 62.8 26.9 7.4Clark 69.7 41.3 14.0 88.2 129.0 132.6 93.1 39.9 8.7Columbia 50.4 --* --* --* 135.4 111.1 --* --* --*Cowlitz 66.0 46.3 20.5 90.6 161.8 119.6 73.7 24.6 5.0Douglas 66.4 42.9 23.9 78.3 151.2 143.0 81.2 29.9 3.7Ferry 57.3 58.2 24.9 131.9 145.6 88.1 48.4 43.5 --*Franklin 110.2 78.8 50.0 128.4 210.3 185.9 117.6 53.0 8.3Garfield 57.8 --* --* --* 171.4 230.8 --* --* --*Grant 86.5 66.1 33.4 124.5 163.8 167.2 89.9 39.2 9.3Grays Harbor 58.8 44.6 23.5 82.0 148.9 114.5 60.4 26.9 3.3Island 64.0 31.1 12.5 64.4 139.9 119.8 79.8 34.3 9.8Jefferson 50.0 43.8 24.0 87.3 123.7 112.4 55.7 42.8 6.4King 53.6 22.8 11.3 39.3 61.5 80.0 91.8 50.1 10.7Kitsap 61.5 35.2 12.3 77.6 126.1 120.0 82.2 36.2 7.9Kittitas 44.0 20.4 12.9 24.8 43.4 108.9 88.6 29.0 4.3Klickitat 62.6 49.3 27.6 100.5 151.7 137.0 77.2 31.3 --*Lewis 65.4 47.4 19.7 98.4 168.5 122.6 78.2 19.4 4.5Lincoln 53.6 36.0 26.8 60.0 155.7 115.4 95.8 18.0 --*Mason 62.7 50.5 19.8 112.5 170.6 119.7 69.9 28.7 6.2Okanogan 69.6 56.4 24.7 118.7 180.9 121.3 93.4 27.6 6.1Pacific 63.2 48.0 28.6 87.8 172.1 171.2 58.5 27.1 --*Pend Oreille 59.7 35.8 15.6 87.3 224.7 77.6 96.7 38.8 --*Pierce 63.3 40.9 18.8 75.0 118.2 122.8 79.4 33.5 6.0San Juan 48.1 17.2 --* --* 94.5 136.6 57.2 49.1 14.1Skagit 67.2 53.4 31.7 90.0 130.3 126.3 87.3 34.7 4.6Skamania 55.4 34.7 --* 80.0 195.0 100.8 71.2 12.5 13.1Snohomish 63.1 31.3 14.0 61.0 110.1 123.4 96.3 38.8 8.5Spokane 59.2 32.0 17.7 50.7 100.1 121.2 84.7 31.2 6.3Stevens 60.0 34.1 13.9 85.2 180.9 148.6 70.5 27.5 6.7Thurston 57.3 29.2 13.1 55.3 97.2 115.3 90.6 31.8 7.3Wahkiakum 48.2 --* --* --* 135.6 100.0 96.8 --* --*Walla Walla 63.8 47.0 34.6 59.4 95.1 126.9 89.4 39.3 6.7Whatcom 50.4 20.1 14.5 25.3 56.9 112.6 87.4 36.5 7.6Whitman 31.9 7.1 --* 8.0 19.2 94.7 87.6 40.9 4.5Yakima 90.7 71.8 41.8 123.6 178.2 148.1 105.4 42.5 6.91 The general fertility rate shown under "All Ages" equals total live births per 1,000 women of childbearing age (15-44). Age-specific rates equal the number of live births to women in a specific age group per 1,000 women in that age group.
Population Data: Office of Financial Management, Forecasting Division, "Population Estimates by Age and Sex, 1980-2001, Washington State," December 2001.
* Rate not calculated because number of events was less than 5.
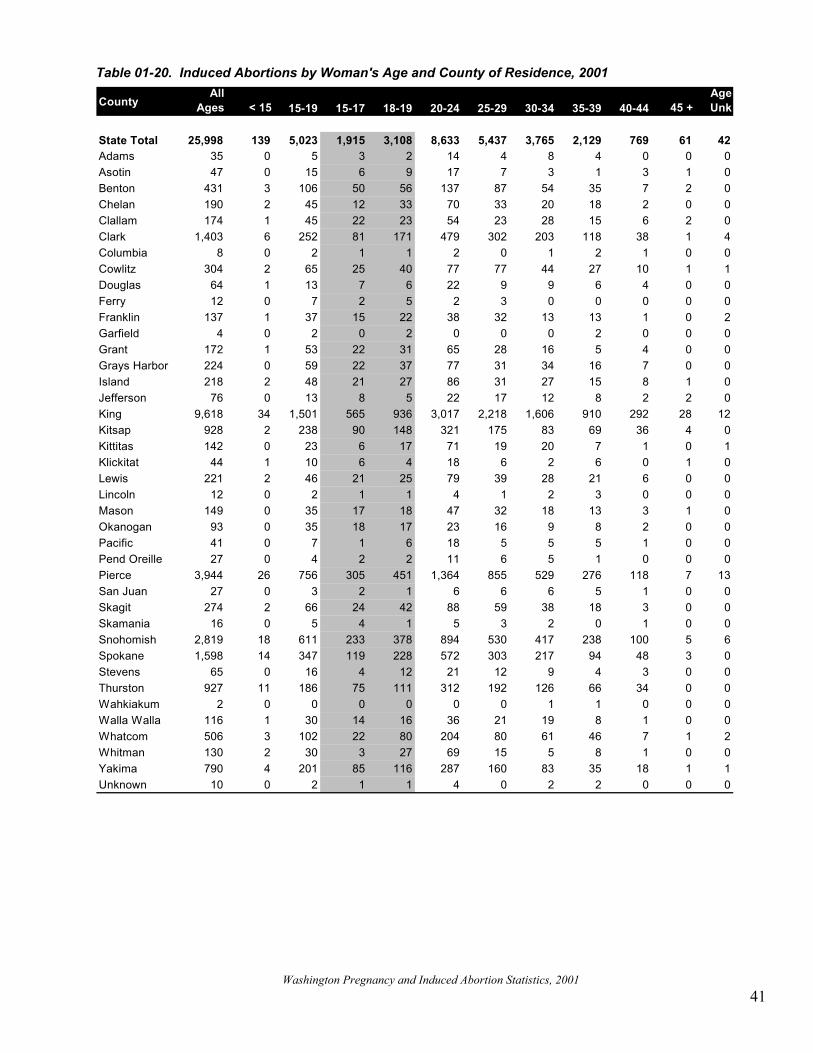
Washington Pregnancy and Induced Abortion Statistics, 2001
41
Table 01-20. Induced Abortions by Woman's Age and County of Residence, 2001
CountyAll
Ages < 15 15-19 15-17 18-19 20-24 25-29 30-34 35-39 40-44 45 +AgeUnk
State Total 25,998 139 5,023 1,915 3,108 8,633 5,437 3,765 2,129 769 61 42Adams 35 0 5 3 2 14 4 8 4 0 0 0Asotin 47 0 15 6 9 17 7 3 1 3 1 0Benton 431 3 106 50 56 137 87 54 35 7 2 0Chelan 190 2 45 12 33 70 33 20 18 2 0 0Clallam 174 1 45 22 23 54 23 28 15 6 2 0Clark 1,403 6 252 81 171 479 302 203 118 38 1 4Columbia 8 0 2 1 1 2 0 1 2 1 0 0Cowlitz 304 2 65 25 40 77 77 44 27 10 1 1Douglas 64 1 13 7 6 22 9 9 6 4 0 0Ferry 12 0 7 2 5 2 3 0 0 0 0 0Franklin 137 1 37 15 22 38 32 13 13 1 0 2Garfield 4 0 2 0 2 0 0 0 2 0 0 0Grant 172 1 53 22 31 65 28 16 5 4 0 0Grays Harbor 224 0 59 22 37 77 31 34 16 7 0 0Island 218 2 48 21 27 86 31 27 15 8 1 0Jefferson 76 0 13 8 5 22 17 12 8 2 2 0King 9,618 34 1,501 565 936 3,017 2,218 1,606 910 292 28 12Kitsap 928 2 238 90 148 321 175 83 69 36 4 0Kittitas 142 0 23 6 17 71 19 20 7 1 0 1Klickitat 44 1 10 6 4 18 6 2 6 0 1 0Lewis 221 2 46 21 25 79 39 28 21 6 0 0Lincoln 12 0 2 1 1 4 1 2 3 0 0 0Mason 149 0 35 17 18 47 32 18 13 3 1 0Okanogan 93 0 35 18 17 23 16 9 8 2 0 0Pacific 41 0 7 1 6 18 5 5 5 1 0 0Pend Oreille 27 0 4 2 2 11 6 5 1 0 0 0Pierce 3,944 26 756 305 451 1,364 855 529 276 118 7 13San Juan 27 0 3 2 1 6 6 6 5 1 0 0Skagit 274 2 66 24 42 88 59 38 18 3 0 0Skamania 16 0 5 4 1 5 3 2 0 1 0 0Snohomish 2,819 18 611 233 378 894 530 417 238 100 5 6Spokane 1,598 14 347 119 228 572 303 217 94 48 3 0Stevens 65 0 16 4 12 21 12 9 4 3 0 0Thurston 927 11 186 75 111 312 192 126 66 34 0 0Wahkiakum 2 0 0 0 0 0 0 1 1 0 0 0Walla Walla 116 1 30 14 16 36 21 19 8 1 0 0Whatcom 506 3 102 22 80 204 80 61 46 7 1 2Whitman 130 2 30 3 27 69 15 5 8 1 0 0Yakima 790 4 201 85 116 287 160 83 35 18 1 1Unknown 10 0 2 1 1 4 0 2 2 0 0 0
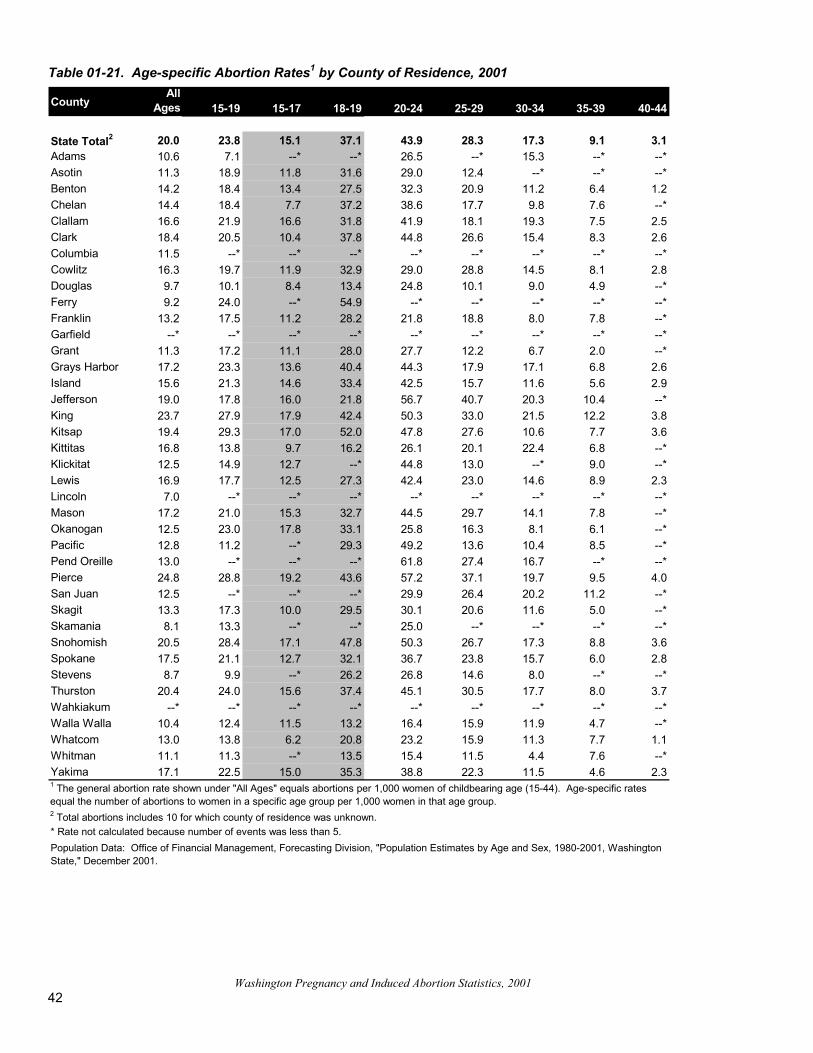
Washington Pregnancy and Induced Abortion Statistics, 2001
42
Table 01-21. Age-specific Abortion Rates1 by County of Residence, 2001
CountyAll
Ages 15-19 15-17 18-19 20-24 25-29 30-34 35-39 40-44
State Total2 20.0 23.8 15.1 37.1 43.9 28.3 17.3 9.1 3.1Adams 10.6 7.1 --* --* 26.5 --* 15.3 --* --*Asotin 11.3 18.9 11.8 31.6 29.0 12.4 --* --* --*Benton 14.2 18.4 13.4 27.5 32.3 20.9 11.2 6.4 1.2Chelan 14.4 18.4 7.7 37.2 38.6 17.7 9.8 7.6 --*Clallam 16.6 21.9 16.6 31.8 41.9 18.1 19.3 7.5 2.5Clark 18.4 20.5 10.4 37.8 44.8 26.6 15.4 8.3 2.6Columbia 11.5 --* --* --* --* --* --* --* --*Cowlitz 16.3 19.7 11.9 32.9 29.0 28.8 14.5 8.1 2.8Douglas 9.7 10.1 8.4 13.4 24.8 10.1 9.0 4.9 --*Ferry 9.2 24.0 --* 54.9 --* --* --* --* --*Franklin 13.2 17.5 11.2 28.2 21.8 18.8 8.0 7.8 --*Garfield --* --* --* --* --* --* --* --* --*Grant 11.3 17.2 11.1 28.0 27.7 12.2 6.7 2.0 --*Grays Harbor 17.2 23.3 13.6 40.4 44.3 17.9 17.1 6.8 2.6Island 15.6 21.3 14.6 33.4 42.5 15.7 11.6 5.6 2.9Jefferson 19.0 17.8 16.0 21.8 56.7 40.7 20.3 10.4 --*King 23.7 27.9 17.9 42.4 50.3 33.0 21.5 12.2 3.8Kitsap 19.4 29.3 17.0 52.0 47.8 27.6 10.6 7.7 3.6Kittitas 16.8 13.8 9.7 16.2 26.1 20.1 22.4 6.8 --*Klickitat 12.5 14.9 12.7 --* 44.8 13.0 --* 9.0 --*Lewis 16.9 17.7 12.5 27.3 42.4 23.0 14.6 8.9 2.3Lincoln 7.0 --* --* --* --* --* --* --* --*Mason 17.2 21.0 15.3 32.7 44.5 29.7 14.1 7.8 --*Okanogan 12.5 23.0 17.8 33.1 25.8 16.3 8.1 6.1 --*Pacific 12.8 11.2 --* 29.3 49.2 13.6 10.4 8.5 --*Pend Oreille 13.0 --* --* --* 61.8 27.4 16.7 --* --*Pierce 24.8 28.8 19.2 43.6 57.2 37.1 19.7 9.5 4.0San Juan 12.5 --* --* --* 29.9 26.4 20.2 11.2 --*Skagit 13.3 17.3 10.0 29.5 30.1 20.6 11.6 5.0 --*Skamania 8.1 13.3 --* --* 25.0 --* --* --* --*Snohomish 20.5 28.4 17.1 47.8 50.3 26.7 17.3 8.8 3.6Spokane 17.5 21.1 12.7 32.1 36.7 23.8 15.7 6.0 2.8Stevens 8.7 9.9 --* 26.2 26.8 14.6 8.0 --* --*Thurston 20.4 24.0 15.6 37.4 45.1 30.5 17.7 8.0 3.7Wahkiakum --* --* --* --* --* --* --* --* --*Walla Walla 10.4 12.4 11.5 13.2 16.4 15.9 11.9 4.7 --*Whatcom 13.0 13.8 6.2 20.8 23.2 15.9 11.3 7.7 1.1Whitman 11.1 11.3 --* 13.5 15.4 11.5 4.4 7.6 --*Yakima 17.1 22.5 15.0 35.3 38.8 22.3 11.5 4.6 2.31 The general abortion rate shown under "All Ages" equals abortions per 1,000 women of childbearing age (15-44). Age-specific rates equal the number of abortions to women in a specific age group per 1,000 women in that age group.
Population Data: Office of Financial Management, Forecasting Division, "Population Estimates by Age and Sex, 1980-2001, Washington State," December 2001.
2 Total abortions includes 10 for which county of residence was unknown.* Rate not calculated because number of events was less than 5.
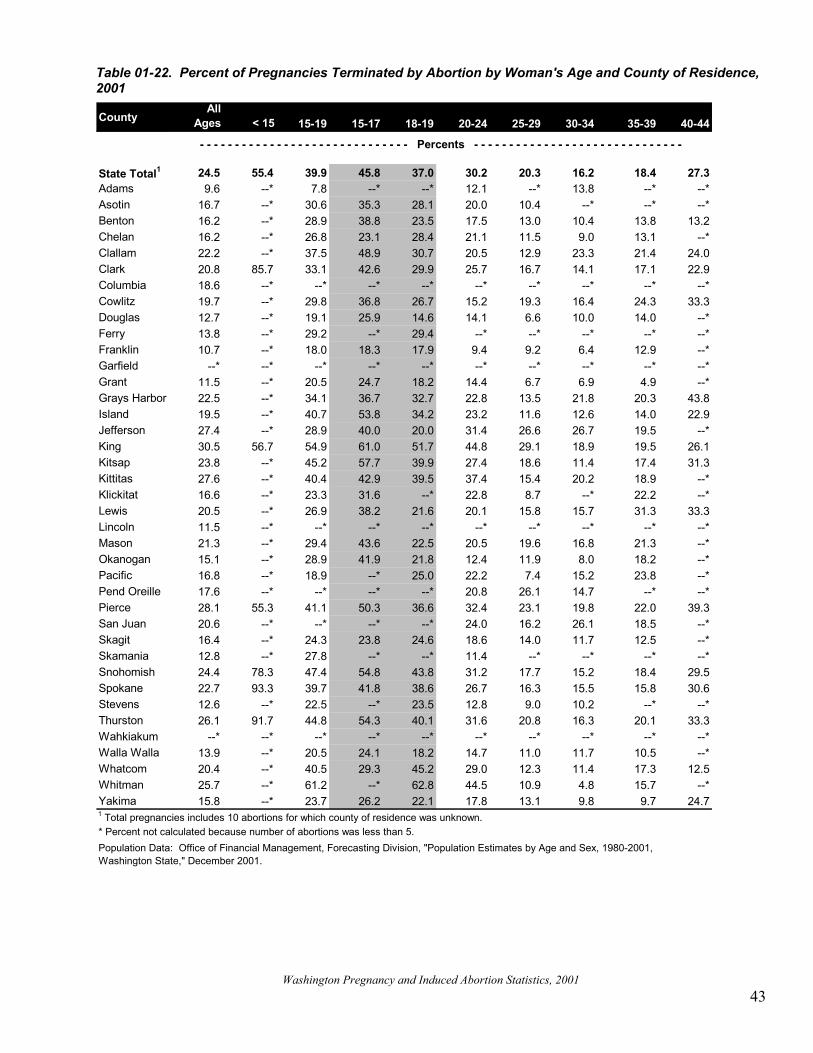
Washington Pregnancy and Induced Abortion Statistics, 2001
43
Table 01-22. Percent of Pregnancies Terminated by Abortion by Woman's Age and County of Residence, 2001
CountyAll
Ages < 15 15-19 15-17 18-19 20-24 25-29 30-34 35-39 40-44
- - - - - - - - - - - - - - - - - - - - - - - - - - - - - - Percents - - - - - - - - - - - - - - - - - - - - - - - - - - - - - -
State Total1 24.5 55.4 39.9 45.8 37.0 30.2 20.3 16.2 18.4 27.3Adams 9.6 --* 7.8 --* --* 12.1 --* 13.8 --* --*Asotin 16.7 --* 30.6 35.3 28.1 20.0 10.4 --* --* --*Benton 16.2 --* 28.9 38.8 23.5 17.5 13.0 10.4 13.8 13.2Chelan 16.2 --* 26.8 23.1 28.4 21.1 11.5 9.0 13.1 --*Clallam 22.2 --* 37.5 48.9 30.7 20.5 12.9 23.3 21.4 24.0Clark 20.8 85.7 33.1 42.6 29.9 25.7 16.7 14.1 17.1 22.9Columbia 18.6 --* --* --* --* --* --* --* --* --*Cowlitz 19.7 --* 29.8 36.8 26.7 15.2 19.3 16.4 24.3 33.3Douglas 12.7 --* 19.1 25.9 14.6 14.1 6.6 10.0 14.0 --*Ferry 13.8 --* 29.2 --* 29.4 --* --* --* --* --*Franklin 10.7 --* 18.0 18.3 17.9 9.4 9.2 6.4 12.9 --*Garfield --* --* --* --* --* --* --* --* --* --*Grant 11.5 --* 20.5 24.7 18.2 14.4 6.7 6.9 4.9 --*Grays Harbor 22.5 --* 34.1 36.7 32.7 22.8 13.5 21.8 20.3 43.8Island 19.5 --* 40.7 53.8 34.2 23.2 11.6 12.6 14.0 22.9Jefferson 27.4 --* 28.9 40.0 20.0 31.4 26.6 26.7 19.5 --*King 30.5 56.7 54.9 61.0 51.7 44.8 29.1 18.9 19.5 26.1Kitsap 23.8 --* 45.2 57.7 39.9 27.4 18.6 11.4 17.4 31.3Kittitas 27.6 --* 40.4 42.9 39.5 37.4 15.4 20.2 18.9 --*Klickitat 16.6 --* 23.3 31.6 --* 22.8 8.7 --* 22.2 --*Lewis 20.5 --* 26.9 38.2 21.6 20.1 15.8 15.7 31.3 33.3Lincoln 11.5 --* --* --* --* --* --* --* --* --*Mason 21.3 --* 29.4 43.6 22.5 20.5 19.6 16.8 21.3 --*Okanogan 15.1 --* 28.9 41.9 21.8 12.4 11.9 8.0 18.2 --*Pacific 16.8 --* 18.9 --* 25.0 22.2 7.4 15.2 23.8 --*Pend Oreille 17.6 --* --* --* --* 20.8 26.1 14.7 --* --*Pierce 28.1 55.3 41.1 50.3 36.6 32.4 23.1 19.8 22.0 39.3San Juan 20.6 --* --* --* --* 24.0 16.2 26.1 18.5 --*Skagit 16.4 --* 24.3 23.8 24.6 18.6 14.0 11.7 12.5 --*Skamania 12.8 --* 27.8 --* --* 11.4 --* --* --* --*Snohomish 24.4 78.3 47.4 54.8 43.8 31.2 17.7 15.2 18.4 29.5Spokane 22.7 93.3 39.7 41.8 38.6 26.7 16.3 15.5 15.8 30.6Stevens 12.6 --* 22.5 --* 23.5 12.8 9.0 10.2 --* --*Thurston 26.1 91.7 44.8 54.3 40.1 31.6 20.8 16.3 20.1 33.3Wahkiakum --* --* --* --* --* --* --* --* --* --*Walla Walla 13.9 --* 20.5 24.1 18.2 14.7 11.0 11.7 10.5 --*Whatcom 20.4 --* 40.5 29.3 45.2 29.0 12.3 11.4 17.3 12.5Whitman 25.7 --* 61.2 --* 62.8 44.5 10.9 4.8 15.7 --*Yakima 15.8 --* 23.7 26.2 22.1 17.8 13.1 9.8 9.7 24.7
Population Data: Office of Financial Management, Forecasting Division, "Population Estimates by Age and Sex, 1980-2001, Washington State," December 2001.
1 Total pregnancies includes 10 abortions for which county of residence was unknown.* Percent not calculated because number of abortions was less than 5.
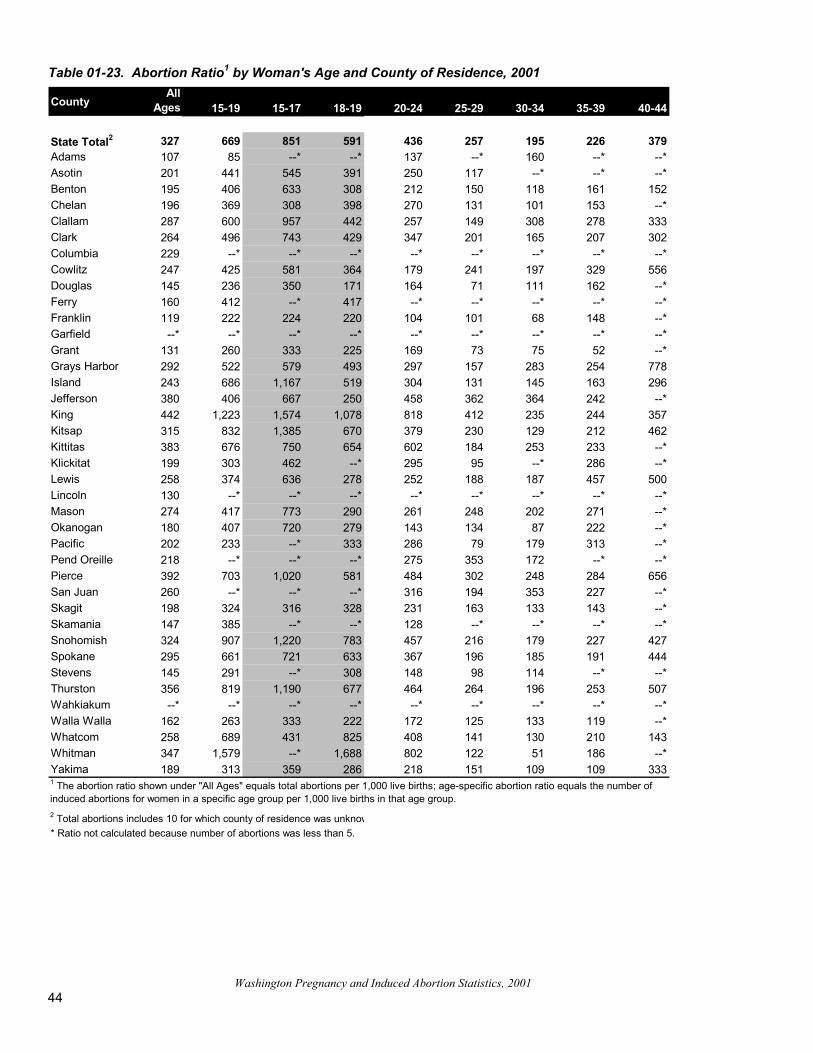
Washington Pregnancy and Induced Abortion Statistics, 2001
44
Table 01-23. Abortion Ratio1 by Woman's Age and County of Residence, 2001
CountyAll
Ages 15-19 15-17 18-19 20-24 25-29 30-34 35-39 40-44
State Total2 327 669 851 591 436 257 195 226 379Adams 107 85 --* --* 137 --* 160 --* --*Asotin 201 441 545 391 250 117 --* --* --*Benton 195 406 633 308 212 150 118 161 152Chelan 196 369 308 398 270 131 101 153 --*Clallam 287 600 957 442 257 149 308 278 333Clark 264 496 743 429 347 201 165 207 302Columbia 229 --* --* --* --* --* --* --* --*Cowlitz 247 425 581 364 179 241 197 329 556Douglas 145 236 350 171 164 71 111 162 --*Ferry 160 412 --* 417 --* --* --* --* --*Franklin 119 222 224 220 104 101 68 148 --*Garfield --* --* --* --* --* --* --* --* --*Grant 131 260 333 225 169 73 75 52 --*Grays Harbor 292 522 579 493 297 157 283 254 778Island 243 686 1,167 519 304 131 145 163 296Jefferson 380 406 667 250 458 362 364 242 --*King 442 1,223 1,574 1,078 818 412 235 244 357Kitsap 315 832 1,385 670 379 230 129 212 462Kittitas 383 676 750 654 602 184 253 233 --*Klickitat 199 303 462 --* 295 95 --* 286 --*Lewis 258 374 636 278 252 188 187 457 500Lincoln 130 --* --* --* --* --* --* --* --*Mason 274 417 773 290 261 248 202 271 --*Okanogan 180 407 720 279 143 134 87 222 --*Pacific 202 233 --* 333 286 79 179 313 --*Pend Oreille 218 --* --* --* 275 353 172 --* --*Pierce 392 703 1,020 581 484 302 248 284 656San Juan 260 --* --* --* 316 194 353 227 --*Skagit 198 324 316 328 231 163 133 143 --*Skamania 147 385 --* --* 128 --* --* --* --*Snohomish 324 907 1,220 783 457 216 179 227 427Spokane 295 661 721 633 367 196 185 191 444Stevens 145 291 --* 308 148 98 114 --* --*Thurston 356 819 1,190 677 464 264 196 253 507Wahkiakum --* --* --* --* --* --* --* --* --*Walla Walla 162 263 333 222 172 125 133 119 --*Whatcom 258 689 431 825 408 141 130 210 143Whitman 347 1,579 --* 1,688 802 122 51 186 --*Yakima 189 313 359 286 218 151 109 109 3331 The abortion ratio shown under "All Ages" equals total abortions per 1,000 live births; age-specific abortion ratio equals the number of induced abortions for women in a specific age group per 1,000 live births in that age group. 2 Total abortions includes 10 for which county of residence was unknow* Ratio not calculated because number of abortions was less than 5.
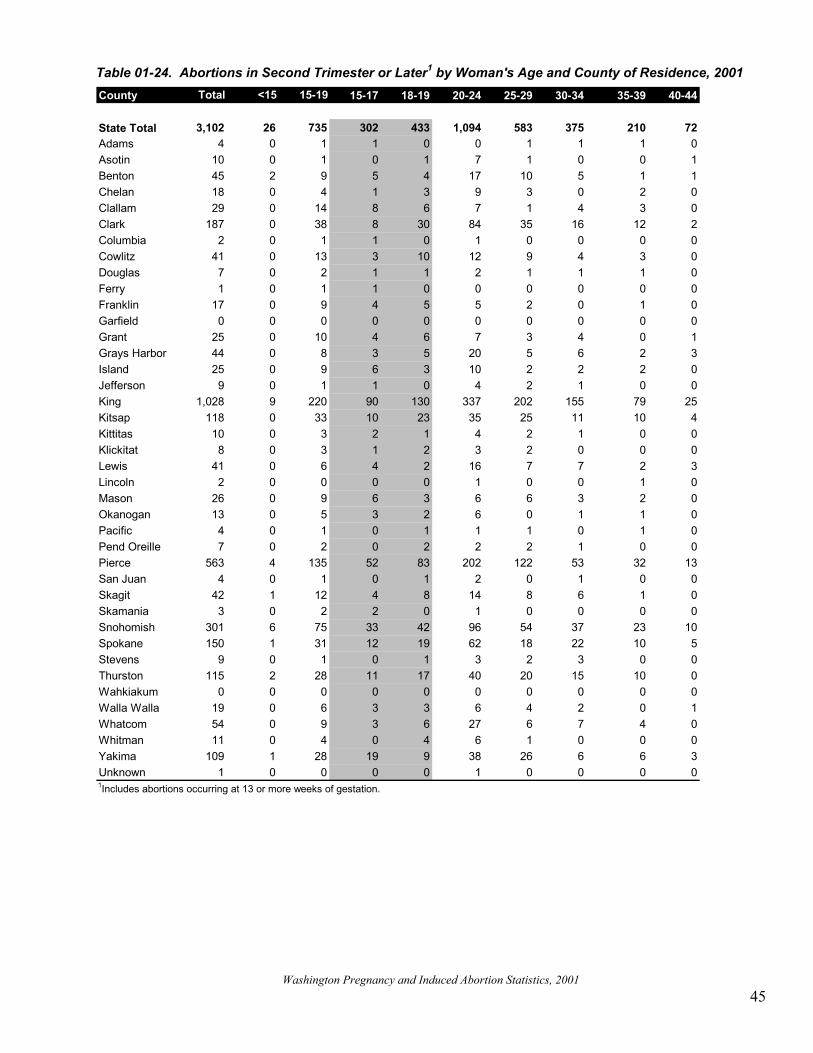
Washington Pregnancy and Induced Abortion Statistics, 2001
45
Table 01-24. Abortions in Second Trimester or Later1 by Woman's Age and County of Residence, 2001
County Total <15 15-19 15-17 18-19 20-24 25-29 30-34 35-39 40-44
State Total 3,102 26 735 302 433 1,094 583 375 210 72Adams 4 0 1 1 0 0 1 1 1 0Asotin 10 0 1 0 1 7 1 0 0 1Benton 45 2 9 5 4 17 10 5 1 1Chelan 18 0 4 1 3 9 3 0 2 0Clallam 29 0 14 8 6 7 1 4 3 0Clark 187 0 38 8 30 84 35 16 12 2Columbia 2 0 1 1 0 1 0 0 0 0Cowlitz 41 0 13 3 10 12 9 4 3 0Douglas 7 0 2 1 1 2 1 1 1 0Ferry 1 0 1 1 0 0 0 0 0 0Franklin 17 0 9 4 5 5 2 0 1 0Garfield 0 0 0 0 0 0 0 0 0 0Grant 25 0 10 4 6 7 3 4 0 1Grays Harbor 44 0 8 3 5 20 5 6 2 3Island 25 0 9 6 3 10 2 2 2 0Jefferson 9 0 1 1 0 4 2 1 0 0King 1,028 9 220 90 130 337 202 155 79 25Kitsap 118 0 33 10 23 35 25 11 10 4Kittitas 10 0 3 2 1 4 2 1 0 0Klickitat 8 0 3 1 2 3 2 0 0 0Lewis 41 0 6 4 2 16 7 7 2 3Lincoln 2 0 0 0 0 1 0 0 1 0Mason 26 0 9 6 3 6 6 3 2 0Okanogan 13 0 5 3 2 6 0 1 1 0Pacific 4 0 1 0 1 1 1 0 1 0Pend Oreille 7 0 2 0 2 2 2 1 0 0Pierce 563 4 135 52 83 202 122 53 32 13San Juan 4 0 1 0 1 2 0 1 0 0Skagit 42 1 12 4 8 14 8 6 1 0Skamania 3 0 2 2 0 1 0 0 0 0Snohomish 301 6 75 33 42 96 54 37 23 10Spokane 150 1 31 12 19 62 18 22 10 5Stevens 9 0 1 0 1 3 2 3 0 0Thurston 115 2 28 11 17 40 20 15 10 0Wahkiakum 0 0 0 0 0 0 0 0 0 0Walla Walla 19 0 6 3 3 6 4 2 0 1Whatcom 54 0 9 3 6 27 6 7 4 0Whitman 11 0 4 0 4 6 1 0 0 0Yakima 109 1 28 19 9 38 26 6 6 3Unknown 1 0 0 0 0 1 0 0 0 01Includes abortions occurring at 13 or more weeks of gestation.
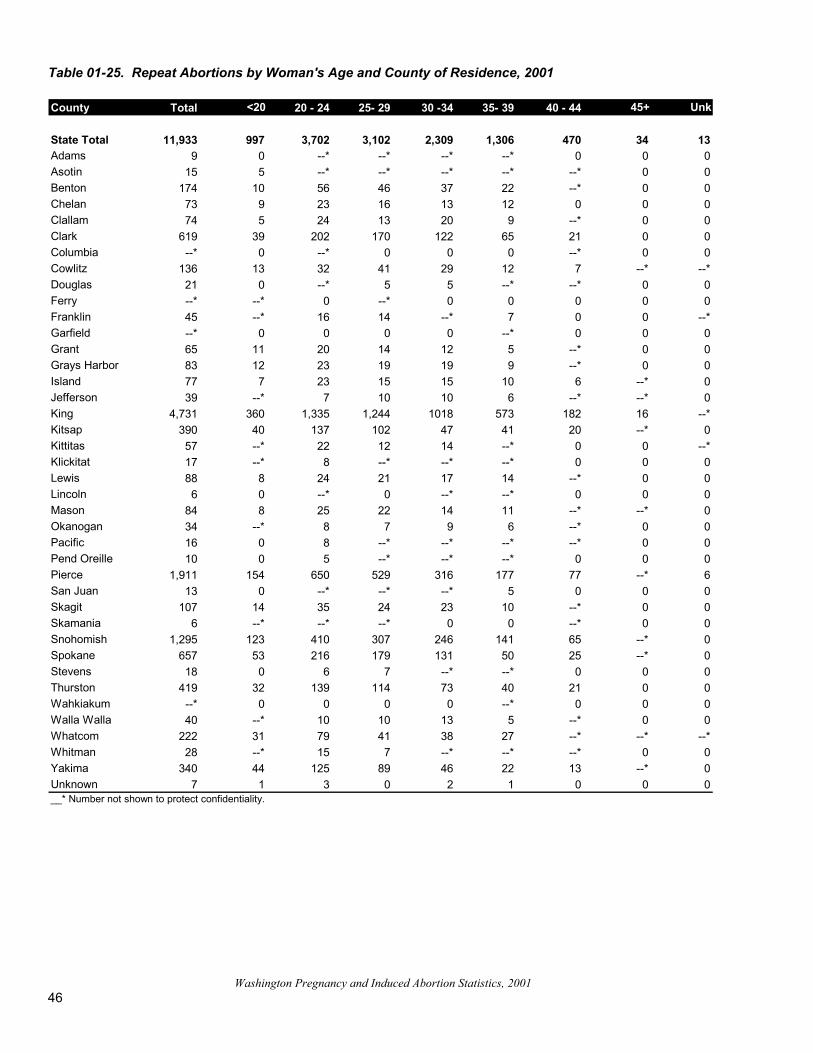
Washington Pregnancy and Induced Abortion Statistics, 2001
46
Table 01-25. Repeat Abortions by Woman's Age and County of Residence, 2001
County Total <20 20 - 24 25- 29 30 -34 35- 39 40 - 44 45+ Unk
State Total 11,933 997 3,702 3,102 2,309 1,306 470 34 13Adams 9 0 --* --* --* --* 0 0 0Asotin 15 5 --* --* --* --* --* 0 0Benton 174 10 56 46 37 22 --* 0 0Chelan 73 9 23 16 13 12 0 0 0Clallam 74 5 24 13 20 9 --* 0 0Clark 619 39 202 170 122 65 21 0 0Columbia --* 0 --* 0 0 0 --* 0 0Cowlitz 136 13 32 41 29 12 7 --* --*Douglas 21 0 --* 5 5 --* --* 0 0Ferry --* --* 0 --* 0 0 0 0 0Franklin 45 --* 16 14 --* 7 0 0 --*Garfield --* 0 0 0 0 --* 0 0 0Grant 65 11 20 14 12 5 --* 0 0Grays Harbor 83 12 23 19 19 9 --* 0 0Island 77 7 23 15 15 10 6 --* 0Jefferson 39 --* 7 10 10 6 --* --* 0King 4,731 360 1,335 1,244 1018 573 182 16 --*Kitsap 390 40 137 102 47 41 20 --* 0Kittitas 57 --* 22 12 14 --* 0 0 --*Klickitat 17 --* 8 --* --* --* 0 0 0Lewis 88 8 24 21 17 14 --* 0 0Lincoln 6 0 --* 0 --* --* 0 0 0Mason 84 8 25 22 14 11 --* --* 0Okanogan 34 --* 8 7 9 6 --* 0 0Pacific 16 0 8 --* --* --* --* 0 0Pend Oreille 10 0 5 --* --* --* 0 0 0Pierce 1,911 154 650 529 316 177 77 --* 6San Juan 13 0 --* --* --* 5 0 0 0Skagit 107 14 35 24 23 10 --* 0 0Skamania 6 --* --* --* 0 0 --* 0 0Snohomish 1,295 123 410 307 246 141 65 --* 0Spokane 657 53 216 179 131 50 25 --* 0Stevens 18 0 6 7 --* --* 0 0 0Thurston 419 32 139 114 73 40 21 0 0Wahkiakum --* 0 0 0 0 --* 0 0 0Walla Walla 40 --* 10 10 13 5 --* 0 0Whatcom 222 31 79 41 38 27 --* --* --*Whitman 28 --* 15 7 --* --* --* 0 0Yakima 340 44 125 89 46 22 13 --* 0Unknown 7 1 3 0 2 1 0 0 0__* Number not shown to protect confidentiality.
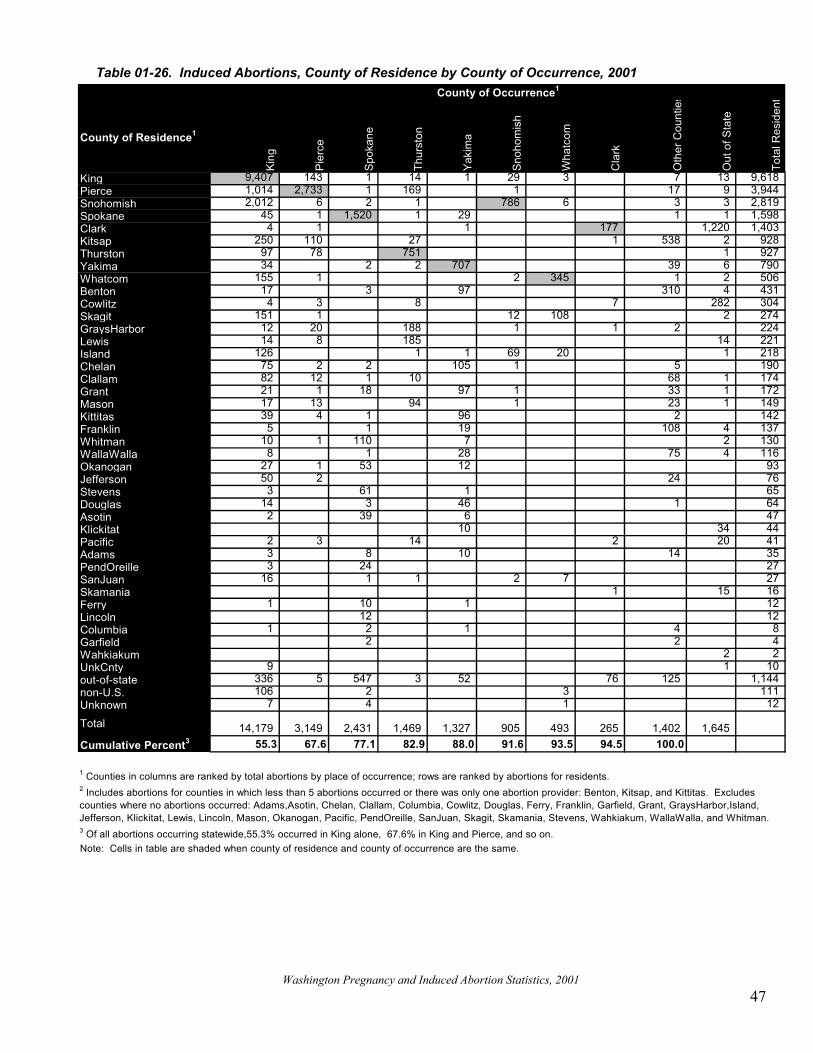
Washington Pregnancy and Induced Abortion Statistics, 2001
47
Table 01-26. Induced Abortions, County of Residence by County of Occurrence, 2001
County of Residence1
King
Pier
ce
Spok
ane
Thur
ston
Yaki
ma
Snoh
omis
h
Wha
tcom
Cla
rk
Oth
er C
ount
ies
Out
of S
tate
Tota
l Res
iden
t
King 9,407 143 1 14 1 29 3 7 13 9,618 Pierce 1,014 2,733 1 169 1 17 9 3,944 Snohomish 2,012 6 2 1 786 6 3 3 2,819 Spokane 45 1 1,520 1 29 1 1 1,598 Clark 4 1 1 177 1,220 1,403 Kitsap 250 110 27 1 538 2 928 Thurston 97 78 751 1 927 Yakima 34 2 2 707 39 6 790 Whatcom 155 1 2 345 1 2 506 Benton 17 3 97 310 4 431 Cowlitz 4 3 8 7 282 304 Skagit 151 1 12 108 2 274 GraysHarbor 12 20 188 1 1 2 224 Lewis 14 8 185 14 221 Island 126 1 1 69 20 1 218 Chelan 75 2 2 105 1 5 190 Clallam 82 12 1 10 68 1 174 Grant 21 1 18 97 1 33 1 172 Mason 17 13 94 1 23 1 149 Kittitas 39 4 1 96 2 142 Franklin 5 1 19 108 4 137 Whitman 10 1 110 7 2 130 WallaWalla 8 1 28 75 4 116 Okanogan 27 1 53 12 93 Jefferson 50 2 24 76 Stevens 3 61 1 65 Douglas 14 3 46 1 64 Asotin 2 39 6 47 Klickitat 10 34 44 Pacific 2 3 14 2 20 41 Adams 3 8 10 14 35 PendOreille 3 24 27 SanJuan 16 1 1 2 7 27 Skamania 1 15 16 Ferry 1 10 1 12 Lincoln 12 12 Columbia 1 2 1 4 8 Garfield 2 2 4 Wahkiakum 2 2 UnkCnty 9 1 10 out-of-state 336 5 547 3 52 76 125 1,144 non-U.S. 106 2 3 111 Unknown 7 4 1 12
Total 14,179 3,149 2,431 1,469 1,327 905 493 265 1,402 1,645 Cumulative Percent3 55.3 67.6 77.1 82.9 88.0 91.6 93.5 94.5 100.0
Note: Cells in table are shaded when county of residence and county of occurrence are the same.
County of Occurrence1
2 Includes abortions for counties in which less than 5 abortions occurred or there was only one abortion provider: Benton, Kitsap, and Kittitas. Excludes counties where no abortions occurred: Adams,Asotin, Chelan, Clallam, Columbia, Cowlitz, Douglas, Ferry, Franklin, Garfield, Grant, GraysHarbor,Island, Jefferson, Klickitat, Lewis, Lincoln, Mason, Okanogan, Pacific, PendOreille, SanJuan, Skagit, Skamania, Stevens, Wahkiakum, WallaWalla, and Whitman.
1 Counties in columns are ranked by total abortions by place of occurrence; rows are ranked by abortions for residents.
3 Of all abortions occurring statewide,55.3% occurred in King alone, 67.6% in King and Pierce, and so on.
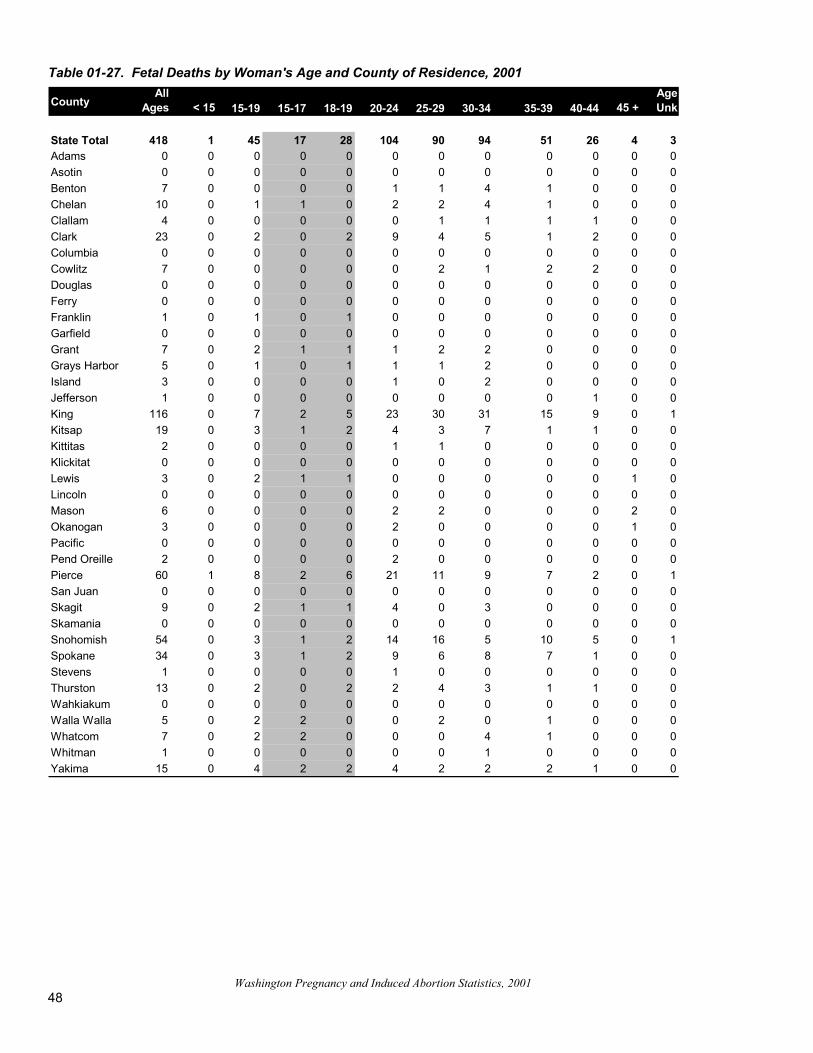
Washington Pregnancy and Induced Abortion Statistics, 2001
48
Table 01-27. Fetal Deaths by Woman's Age and County of Residence, 2001
CountyAll
Ages < 15 15-19 15-17 18-19 20-24 25-29 30-34 35-39 40-44 45 +AgeUnk
State Total 418 1 45 17 28 104 90 94 51 26 4 3Adams 0 0 0 0 0 0 0 0 0 0 0 0Asotin 0 0 0 0 0 0 0 0 0 0 0 0Benton 7 0 0 0 0 1 1 4 1 0 0 0Chelan 10 0 1 1 0 2 2 4 1 0 0 0Clallam 4 0 0 0 0 0 1 1 1 1 0 0Clark 23 0 2 0 2 9 4 5 1 2 0 0Columbia 0 0 0 0 0 0 0 0 0 0 0 0Cowlitz 7 0 0 0 0 0 2 1 2 2 0 0Douglas 0 0 0 0 0 0 0 0 0 0 0 0Ferry 0 0 0 0 0 0 0 0 0 0 0 0Franklin 1 0 1 0 1 0 0 0 0 0 0 0Garfield 0 0 0 0 0 0 0 0 0 0 0 0Grant 7 0 2 1 1 1 2 2 0 0 0 0Grays Harbor 5 0 1 0 1 1 1 2 0 0 0 0Island 3 0 0 0 0 1 0 2 0 0 0 0Jefferson 1 0 0 0 0 0 0 0 0 1 0 0King 116 0 7 2 5 23 30 31 15 9 0 1Kitsap 19 0 3 1 2 4 3 7 1 1 0 0Kittitas 2 0 0 0 0 1 1 0 0 0 0 0Klickitat 0 0 0 0 0 0 0 0 0 0 0 0Lewis 3 0 2 1 1 0 0 0 0 0 1 0Lincoln 0 0 0 0 0 0 0 0 0 0 0 0Mason 6 0 0 0 0 2 2 0 0 0 2 0Okanogan 3 0 0 0 0 2 0 0 0 0 1 0Pacific 0 0 0 0 0 0 0 0 0 0 0 0Pend Oreille 2 0 0 0 0 2 0 0 0 0 0 0Pierce 60 1 8 2 6 21 11 9 7 2 0 1San Juan 0 0 0 0 0 0 0 0 0 0 0 0Skagit 9 0 2 1 1 4 0 3 0 0 0 0Skamania 0 0 0 0 0 0 0 0 0 0 0 0Snohomish 54 0 3 1 2 14 16 5 10 5 0 1Spokane 34 0 3 1 2 9 6 8 7 1 0 0Stevens 1 0 0 0 0 1 0 0 0 0 0 0Thurston 13 0 2 0 2 2 4 3 1 1 0 0Wahkiakum 0 0 0 0 0 0 0 0 0 0 0 0Walla Walla 5 0 2 2 0 0 2 0 1 0 0 0Whatcom 7 0 2 2 0 0 0 4 1 0 0 0Whitman 1 0 0 0 0 0 0 1 0 0 0 0Yakima 15 0 4 2 2 4 2 2 2 1 0 0
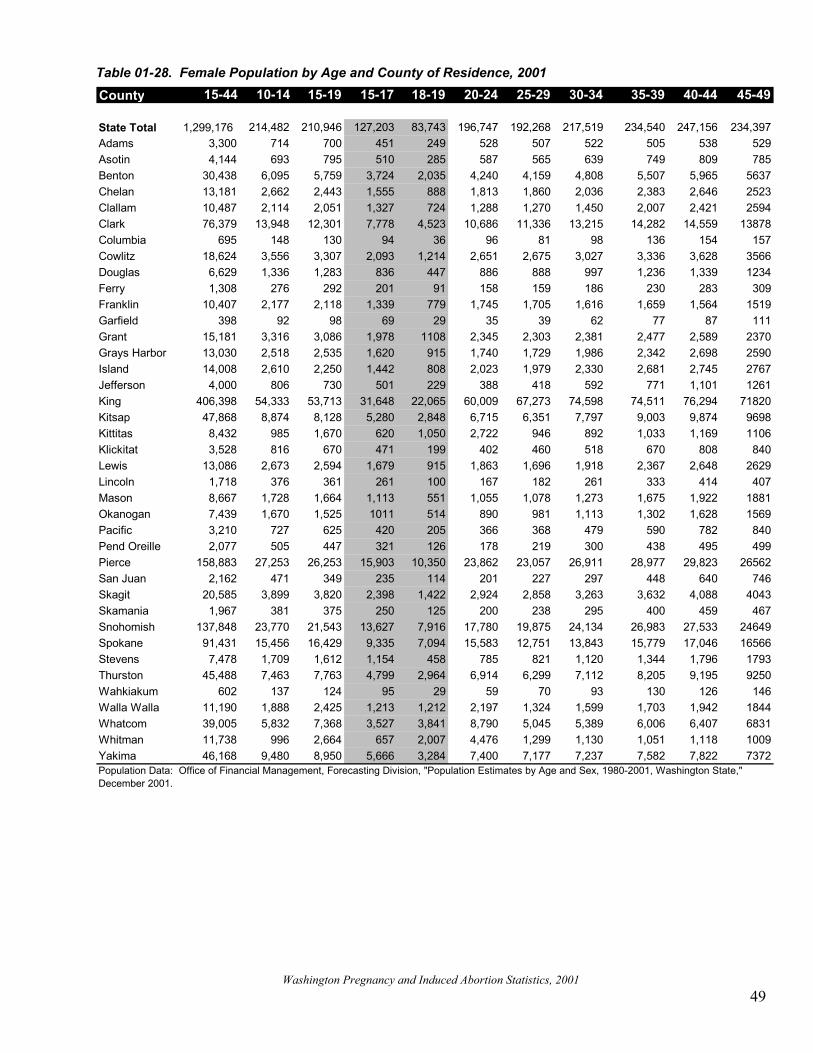
Washington Pregnancy and Induced Abortion Statistics, 2001
49
Table 01-28. Female Population by Age and County of Residence, 2001
County 15-44 10-14 15-19 15-17 18-19 20-24 25-29 30-34 35-39 40-44 45-49
State Total 1,299,176 214,482 210,946 127,203 83,743 196,747 192,268 217,519 234,540 247,156 234,397Adams 3,300 714 700 451 249 528 507 522 505 538 529Asotin 4,144 693 795 510 285 587 565 639 749 809 785Benton 30,438 6,095 5,759 3,724 2,035 4,240 4,159 4,808 5,507 5,965 5637Chelan 13,181 2,662 2,443 1,555 888 1,813 1,860 2,036 2,383 2,646 2523Clallam 10,487 2,114 2,051 1,327 724 1,288 1,270 1,450 2,007 2,421 2594Clark 76,379 13,948 12,301 7,778 4,523 10,686 11,336 13,215 14,282 14,559 13878Columbia 695 148 130 94 36 96 81 98 136 154 157Cowlitz 18,624 3,556 3,307 2,093 1,214 2,651 2,675 3,027 3,336 3,628 3566Douglas 6,629 1,336 1,283 836 447 886 888 997 1,236 1,339 1234Ferry 1,308 276 292 201 91 158 159 186 230 283 309Franklin 10,407 2,177 2,118 1,339 779 1,745 1,705 1,616 1,659 1,564 1519Garfield 398 92 98 69 29 35 39 62 77 87 111Grant 15,181 3,316 3,086 1,978 1108 2,345 2,303 2,381 2,477 2,589 2370Grays Harbor 13,030 2,518 2,535 1,620 915 1,740 1,729 1,986 2,342 2,698 2590Island 14,008 2,610 2,250 1,442 808 2,023 1,979 2,330 2,681 2,745 2767Jefferson 4,000 806 730 501 229 388 418 592 771 1,101 1261King 406,398 54,333 53,713 31,648 22,065 60,009 67,273 74,598 74,511 76,294 71820Kitsap 47,868 8,874 8,128 5,280 2,848 6,715 6,351 7,797 9,003 9,874 9698Kittitas 8,432 985 1,670 620 1,050 2,722 946 892 1,033 1,169 1106Klickitat 3,528 816 670 471 199 402 460 518 670 808 840Lewis 13,086 2,673 2,594 1,679 915 1,863 1,696 1,918 2,367 2,648 2629Lincoln 1,718 376 361 261 100 167 182 261 333 414 407Mason 8,667 1,728 1,664 1,113 551 1,055 1,078 1,273 1,675 1,922 1881Okanogan 7,439 1,670 1,525 1011 514 890 981 1,113 1,302 1,628 1569Pacific 3,210 727 625 420 205 366 368 479 590 782 840Pend Oreille 2,077 505 447 321 126 178 219 300 438 495 499Pierce 158,883 27,253 26,253 15,903 10,350 23,862 23,057 26,911 28,977 29,823 26562San Juan 2,162 471 349 235 114 201 227 297 448 640 746Skagit 20,585 3,899 3,820 2,398 1,422 2,924 2,858 3,263 3,632 4,088 4043Skamania 1,967 381 375 250 125 200 238 295 400 459 467Snohomish 137,848 23,770 21,543 13,627 7,916 17,780 19,875 24,134 26,983 27,533 24649Spokane 91,431 15,456 16,429 9,335 7,094 15,583 12,751 13,843 15,779 17,046 16566Stevens 7,478 1,709 1,612 1,154 458 785 821 1,120 1,344 1,796 1793Thurston 45,488 7,463 7,763 4,799 2,964 6,914 6,299 7,112 8,205 9,195 9250Wahkiakum 602 137 124 95 29 59 70 93 130 126 146Walla Walla 11,190 1,888 2,425 1,213 1,212 2,197 1,324 1,599 1,703 1,942 1844Whatcom 39,005 5,832 7,368 3,527 3,841 8,790 5,045 5,389 6,006 6,407 6831Whitman 11,738 996 2,664 657 2,007 4,476 1,299 1,130 1,051 1,118 1009Yakima 46,168 9,480 8,950 5,666 3,284 7,400 7,177 7,237 7,582 7,822 7372Population Data: Office of Financial Management, Forecasting Division, "Population Estimates by Age and Sex, 1980-2001, Washington State," December 2001.


Washington Pregnancy and Induced Abortion Statistics, 2001
Appendices

Washington Pregnancy and Induced Abortion Statistics, 2001
53
Appendix A: Technical Appendix Sources of Data Collection Year Data for this report are compiled from abortion reports received by September, 2001 and from birth and fetal death certificates received by September, 2001. (See Appendix B for samples of certificates and forms.) Population Population estimates for 2001 are from the Office of Financial Management, Forecasting Division, “Intercensal and Postcensal Estimates of Population by Age and Sex, State of Washington: 1981-2001, Washington State,” October 2001. Demographics Age For abortions, the woman’s age is based on her reported age. For births and fetal deaths, the woman’s age is computed from mother’s date of birth and the date of delivery or the date of the fetal death beginning in 1989. Before that, mother’s age was based on reported age since mother’s date of birth was not recorded on the birth or fetal death certificate until 1989. A comparison of mothers’ age distributions before and after the change showed that ages calculated from birth dates are consistent with ages determined by asking the mother to report her age and that there is no substantial increase in missing data as a result of asking for her date of birth. Race Race on abortion, birth, and fetal death forms follow the U.S. Census: The concept of race as used by the Census Bureau reflects self-identification; it does not denote any clear-cut scientific definition of biological stock. The data for race represents self-classification by people according to the race with which they most closely identify. Furthermore, it is recognized that the categories of the race item include both racial and national origin or socio-cultural groups.3 For abortion reports, race is to be determined by patient’s self-identification and placed into one of the Bureau of the Census race categories: White, Black, American Indian or Native Alaskan, Asian/Pacific Islander, or Other. If more than one racial category is checked or reported under “Other,” the person’s racial background is
1 U.S. Bureau of the Census, 1990 Census of Population: General Population Characteristics, Washington, Report 1990 CP-1-49, Washington, D.C., June 1992.
Washington Pregnancy and Induced Abortion Statistics, 2001
54
classified as “Multiple Races” in the reporting system, and the specific racial categories are recorded in the database. Race data on abortion reports continues to be so incomplete that the data cannot be used to study racial patterns in use of abortion services. In 2001, as Table 01-3F shows 10,967 of the 25,998 abortion reports (42%) were submitted by abortion providers with the patient’s race shown as blank or unknown. This number is down slightly from 45.5% blank or unknown in 2000. Birth and fetal death certificates use open-ended categories for reporting race, and multiple racial entries are stored on the database. When more than one racial category is reported, mother’s race is classified according to decision rules set by the National Center for Health Statistics (NCHS): If more than one race is listed and one is Hawaiian, then Hawaiian is selected. For other races, the first race listed is selected. Prior to 1990, the first non-white race listed was selected (unless Hawaiian was listed somewhere in the item). Hispanic Origin ‘Origin’ as used by the Census Bureau refers to "the ancestry, nationality group, lineage, or country of birth of the person or the person's parents or ancestors before their arrival in the United States." Persons of Hispanic origin have their origins in a Hispanic or Spanish-speaking country such as Mexico, Cuba, or Puerto Rico, or the Spanish-speaking countries of Central or South America. Persons of Hispanic origin may be of any race. Prior to 1985, Hispanic data on abortion reporting forms were provided by a racial category of ‘Spanish Origin or Descent’. Hispanic origin was added as an ethnic category and collected as a separate item (in addition to race) in 1985. However, this item only asks, ‘Is patient of HISPANIC ethnic origin? - Yes’. A ‘No’ box (meaning not Hispanic) was not provided on the form. Thus, blanks (which are found on 98% of the forms) may mean either ‘Not Hispanic’ or ‘Origin Unknown’, making the data difficult, if not impossible, to interpret. For birth and fetal death certificates, Hispanic origin was added as an ethnic category and collected as a separate item (in addition to race) in 1988. For the first year of data collection (1988), some hospitals did not include the ethnicity item on the worksheet used to collect birth data. For this reason, Hispanic ethnicity data are less complete for 1988 than they are for later years. Rates calculated using these 1988 data will be lower than rates for other years because of this underreporting and should thus not be used to study changes in Hispanic birth rates. Prior to 1988, Hispanic data on birth and fetal death certificates were provided by a racial category of "Mexican/Chicano" or "Mexican
Washington Pregnancy and Induced Abortion Statistics, 2001
55
American". Data based on Hispanic origin from those years are not comparable with data collected in 1988 or thereafter and should not be used for trend analysis or year-to-year comparisons. Abortion Complications and Secondary Management The abortion reporting form provides pre-coded categories for complications related to the abortion procedure. Abortion complications are likely to be under-reported because follow-up care may be administered after abortion reports are filed or by a second facility or physician. Also, because Washington’s reporting form asks specifically about complications of the abortion procedure, complications attributed to something other than the procedure (such as pre-existing conditions) are not necessarily reported. For these reasons, complication totals and rates presented in this report should be interpreted as a low estimate of complications and used with caution. Changes to the abortion reporting form may have affected the reporting of complications over time. Before 1990, the form had a separate check box for retained products, which is the most common type of complication reported. In 1990, retained products was removed as a separate check box item for consistency with the National Abortion Federation (NAF), the private national organization promoting standards of care. Many facilities still provide this information by checking the box for ‘Other’ complications and then writing in ‘Retained Products.’ These write-in responses are used to tabulate data on retained products. The absence of an explicit category for retained products, however, is believed to cause under-reporting of this complication. Since retained products was removed as a category on the form, the number of abortions with ‘retained products’ noted as a complication has decreased, as follows: 1989 - 62, 1990 - 40, 1991 - 40, 1992 - 48, 1993 - 23, 1994 - 18, 1995 - 39, 1996 - 36. As a result of work by the committee that formed to review the abortion reporting system (see the introduction for details), there was an increase in the reporting of complications in 1997. This is reflected in the ‘retained products’ category which increased to 56 in 1997 and was 55 in 1998. A new item called, “Secondary Management,” was added to Washington’s abortion reporting form in 1990 to provide data on the treatment of abortion complications. The categories were “resuction or other secondary procedure”, “hospitalization”, “ transfusion”, “laparotomy”, “laparoscopy”, and “none”. This information probably under estimates the amount of secondary care since abortion patients may receive such care after the abortion report is completed or at facilities other than the one where the primary abortion procedure was performed.
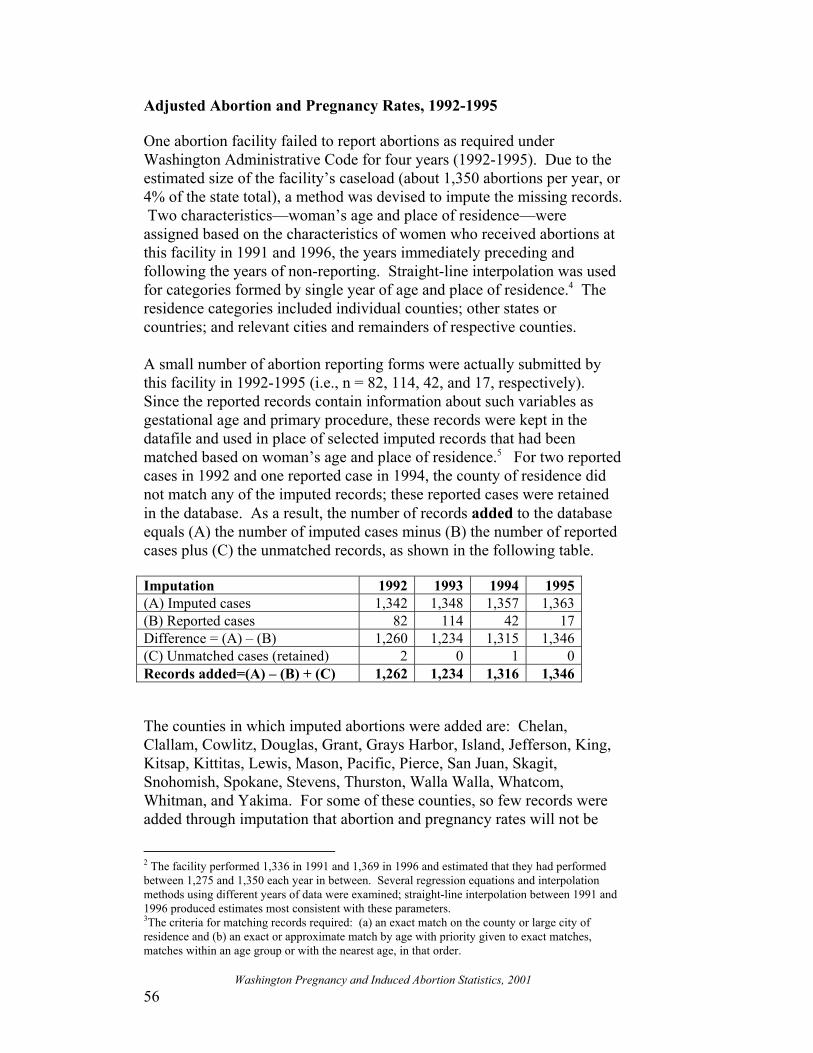
Washington Pregnancy and Induced Abortion Statistics, 2001
56
Adjusted Abortion and Pregnancy Rates, 1992-1995 One abortion facility failed to report abortions as required under Washington Administrative Code for four years (1992-1995). Due to the estimated size of the facility’s caseload (about 1,350 abortions per year, or 4% of the state total), a method was devised to impute the missing records. Two characteristics—woman’s age and place of residence—were assigned based on the characteristics of women who received abortions at this facility in 1991 and 1996, the years immediately preceding and following the years of non-reporting. Straight-line interpolation was used for categories formed by single year of age and place of residence.4 The residence categories included individual counties; other states or countries; and relevant cities and remainders of respective counties. A small number of abortion reporting forms were actually submitted by this facility in 1992-1995 (i.e., n = 82, 114, 42, and 17, respectively). Since the reported records contain information about such variables as gestational age and primary procedure, these records were kept in the datafile and used in place of selected imputed records that had been matched based on woman’s age and place of residence.5 For two reported cases in 1992 and one reported case in 1994, the county of residence did not match any of the imputed records; these reported cases were retained in the database. As a result, the number of records added to the database equals (A) the number of imputed cases minus (B) the number of reported cases plus (C) the unmatched records, as shown in the following table. Imputation 1992 1993 1994 1995 (A) Imputed cases 1,342 1,348 1,357 1,363 (B) Reported cases 82 114 42 17 Difference = (A) – (B) 1,260 1,234 1,315 1,346 (C) Unmatched cases (retained) 2 0 1 0 Records added=(A) – (B) + (C) 1,262 1,234 1,316 1,346 The counties in which imputed abortions were added are: Chelan, Clallam, Cowlitz, Douglas, Grant, Grays Harbor, Island, Jefferson, King, Kitsap, Kittitas, Lewis, Mason, Pacific, Pierce, San Juan, Skagit, Snohomish, Spokane, Stevens, Thurston, Walla Walla, Whatcom, Whitman, and Yakima. For some of these counties, so few records were added through imputation that abortion and pregnancy rates will not be
2 The facility performed 1,336 in 1991 and 1,369 in 1996 and estimated that they had performed between 1,275 and 1,350 each year in between. Several regression equations and interpolation methods using different years of data were examined; straight-line interpolation between 1991 and 1996 produced estimates most consistent with these parameters. 3The criteria for matching records required: (a) an exact match on the county or large city of residence and (b) an exact or approximate match by age with priority given to exact matches, matches within an age group or with the nearest age, in that order.
Washington Pregnancy and Induced Abortion Statistics, 2001
57
different from those previously published. In the remaining counties, no imputed records were added. Definitions Abortion - The termination (spontaneous or induced) of a pregnancy before the fetus has attained viability. Consistent with common usage and understanding, when the term abortion is used in this report, it refers to induced abortion. Abortion-related Complications - An unfavorable medical condition arising from induced abortion. Only complications that are: 1) known by the reporting provider or, 2) known before the abortion report has been filed are included in the state’s count of complications. Specific complications on Washington’s abortion reporting form include: Cervical laceration - A tear wound of the cervix which requires sutures. Perforation - unintentional puncture of the uterine wall which requires intervention.
Hemorrhage (more than 500 cc) - Clinical assessment of copious or excessive blood loss (more than 500cc).
Infection - Inflammation of the endometrium (the mucous coat of the uterus) that requires hospitalization for intravenous antibiotics.
Failed abortion (continuing pregnancy) - The products of conception fail to be expelled from the uterus after induction. The patient was still pregnant following the initial procedure and a second procedure is required to terminate the pregnancy.
Death-The patient died as a result of complications of the procedure.
Retained products - A portion of the products of conception was not expelled from the uterus after induction. A second procedure is required to prevent further medical complications. (Not the same as a Failed Abortion (continuing pregnancy); see # 5 above).
Other (specify)- Occurrence of any other complication, such as peritonitis or drug reaction.
Fetal Death - Death prior to the complete expulsion or extraction from its mother of a product of human conception, irrespective of the duration of pregnancy. The death is indicated by the fact that after such expulsion or
Washington Pregnancy and Induced Abortion Statistics, 2001
58
extraction, the fetus does not breathe or show any other evidence of life such as beating of the heart, pulsation of the umbilical cord, or definite movement of voluntary muscles. Reporting of fetal deaths to the state is required only when the gestational period is twenty weeks or more. Gestational Period - Number of weeks elapsed between the first day of the last menstrual period and date of delivery or date of pregnancy termination. The term gestational period is interchangeable with weeks of gestation, gestational age, and duration of pregnancy. This report uses the physician’s estimate of gestational age. Induced Abortion - The purposeful interruption of pregnancy, irrespective of the duration of pregnancy, with the intention other than to produce a live born infant or to remove a dead fetus, the result of which is not a live birth. Procedures for false pregnancy, ectopic pregnancy, and missed abortion (dead ovum retained in uterus in intended pregnancy) are not included in the definition. The term is used in this report interchangeably with induced termination of pregnancy, induced termination, and abortion. Induced Abortion Procedures: Dilation and Evacuation (D&E) - Involves opening the cervix (dilation) and using primarily sharp techniques, but also suction and other instrumentation such as forceps for evacuation. (Dilation is performed by means of laminaria tents (sterile dried seaweed) until the cervical opening is large enough to allow removal of the uterine contents by means of a sponge forceps or some other specially designed instrument. Hysterotomy /Hysterectomy - Hysterotomy involves surgical entry into the uterus, as in a Cesarean section, that removes a fetus that is too immature to survive, even with extraordinary life support measures. Hysterotomy is usually performed only if other abortion procedures fail. Hysterectomy is a procedure in which the uterus is removed either with the fetus inside or after the fetus has been removed. It is usually performed only when a pathological condition of the uterus, such as fibroid tumors, warrants its removal or when a woman desires sterilization. Intra-Uterine Instillation (Saline or Prostaglandin) - Involves either withdrawing a portion of amniotic fluid from the uterine cavity by a needle inserted through the abdominal wall and replacing this fluid with a concentrated salt solution (known as saline instillation, saline abortion, or saline amniotic fluid exchange) or injecting a prostaglandin-- a substance with hormone-like activity--into the uterine cavity through a needle inserted through the abdominal wall (known as intra-uterine prostaglandin
Washington Pregnancy and Induced Abortion Statistics, 2001
59
instillation). The saline instillation process induces labor, which results in the expulsion of the usually dead fetus approximately 24 to 48 hours later. The interval between prostaglandin injection and expulsion tends to be shorter than in a saline abortion. Medical (Nonsurgical)- Involves the administration of a medication or medications to induce an abortion. Medications (e.g., methotrexate, mifepristone, misoprostol, etc.) are used most frequently early in the first trimester of pregnancy. However, some medications (e.g., prostaglandin suppositories, injectable prostaglandins, etc.) may also be administered during the second trimester of pregnancy to induce abortion. Medications may be administered orally, by injection or intra-vaginally. Sharp Curettage (D&C) – Involves dilation of the cervix as in suction, although usually to a larger diameter. The fetal and placental tissues are then scraped out with a curette, which resembles a small spoon. Also, surgical D&C or surgical curettage. Suction Curettage – The cervical canal is dilated by the successive insertion of instruments of increasing diameter called dilators. When the opening is large enough, a flexible tube (cannula) is inserted into the uterine cavity and the fetal and placental tissues are then suctioned out by an electric vacuum pump. Also, vacuum aspiration, suction D&C, or early uterine evacuation. Other(specify)- All other procedures not included in the preceding categories should be shown as “Other” and the procedure used should be described after “specify.” This category includes procedures using a combination of agents, such as laminaria and prostaglandin, urea and prostaglandin, prostaglandin and oxytocin, or prostaglandin and saline. Induced Abortion Management - Medical care consequent and secondary to the primary abortion procedure. The specific types of management care listed on Washington’s abortion reporting form are:
Resuction or other secondary procedure - Resuction of the uterus to remove remaining fetal tissue. (Note that providers are instructed to check this management category only for cases where a resuction or other secondary procedure was required for removal of retained products or failed abortion and performed following initial discharge of patient.)
Hospitalization - Hospitalization became necessary following the termination as a result of complications or for any other reason.
Transfusion - Transfusion of whole blood or plasma.
Washington Pregnancy and Induced Abortion Statistics, 2001
60
Laparotomy - A surgical incision through the abdominal wall as part of an examination.
Laparoscopy - Examination of the abdominal cavity by the introduction of a laparoscope through a small abdominal incision.
Live Birth - The complete expulsion or extraction from its mother of a product of human conception, irrespective of the duration of pregnancy, which, after such expulsion or extraction, breathes, or shows any other evidence of life such as beating of the heart, pulsation of the umbilical cord, or definite movement of voluntary muscles, whether or not the umbilical cord has been cut or the placenta is attached. Maternal Death - Death attributed to complications of pregnancy, childbirth, or the puerperium (ICD-9, 630-676); includes abortion-related death. The death must occur within six weeks of the live birth or abortion to be considered a maternal death. Occurrence Data - Data allocated by place where the event occurred, regardless of the person's place of residence. Provider - Facility where induced abortions are performed. Facilities performing induced abortions may be clinics, doctors’ offices, or hospitals. Residence Data - Data allocated by place of residence of the child's mother (births, fetal deaths), or by place of residence of the patient (abortions), regardless of where the event occurred. Spontaneous Abortion - An unintended interruption of pregnancy, the result of which is a fetal death of any gestational age. Other terms used: miscarriage, miscarried pregnancy. Trimester - The duration of human pregnancy, approximately 266 days, divided by 3, resulting in three equal time periods equaling 88.67 days, or 12.67 weeks, or approximately three months, each. As a useful rule-of-thumb, gestation weeks 1 through 12 are considered the first trimester of pregnancy; weeks 13 through 24, the second trimester; and over 24 weeks, the third trimester.
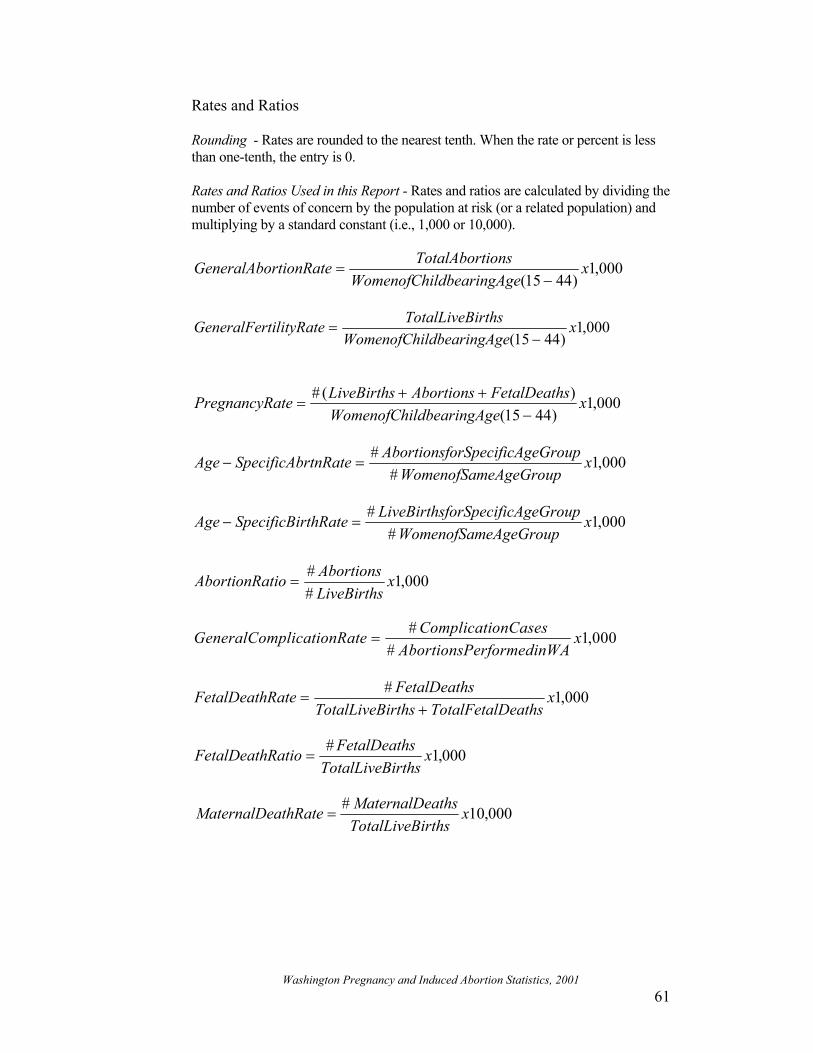
Washington Pregnancy and Induced Abortion Statistics, 2001
61
Rates and Ratios Rounding - Rates are rounded to the nearest tenth. When the rate or percent is less than one-tenth, the entry is 0. Rates and Ratios Used in this Report - Rates and ratios are calculated by dividing the number of events of concern by the population at risk (or a related population) and multiplying by a standard constant (i.e., 1,000 or 10,000).
GeneralAbortionRate TotalAbortionsWomenofChildbearingAge
x=−( )
,15 44
1 000
GeneralFertilityRate TotalLiveBirthsWomenofChildbearingAge
x=−( )
,15 44
1 000
PregnancyRate LiveBirths Abortions FetalDeathsWomenofChildbearingAge
x=+ +
−# ( )
( ),
15 441 000
Age SpecificAbrtnRate AbortionsforSpecificAgeGroupWomenofSameAgeGroup
x− =#
#,1 000
Age SpecificBirthRate LiveBirthsforSpecificAgeGroupWomenofSameAgeGroup
x− =#
#,1 000
AbortionRatio AbortionsLiveBirths
x=##
,1 000
GeneralComplicationRate ComplicationCasesAbortionsPerformedinWA
x=#
#,1 000
FetalDeathRate FetalDeathsTotalLiveBirths TotalFetalDeaths
x=+
# ,1 000
FetalDeathRatio FetalDeathsTotalLiveBirths
x=# ,1 000
MaternalDeathRate MaternalDeathsTotalLiveBirths
x=# ,10 000


Washington Pregnancy and Induced Abortion Statistics, 2001
63
Appendix B: Sample Certificates and Forms Certificate of Live Birth

Washington Pregnancy and Induced Abortion Statistics, 2001
64
Certificate of Fetal Death

Washington Pregnancy and Induced Abortion Statistics, 2001
65
Report of Induced Termination of Pregnancy

Washington Pregnancy and Induced Abortion Statistics, 2001
66
Continuation of the Report of Induced Termination of Pregnancy .