Embed Size (px)
Citation preview
Catalogue no. 82-223-X
Induced AbortionStatistics2005
How to obtain more information
For information about this product or the wide range of services and data available from Statistics Canada, visit our websiteat www.statcan.ca, e-mail us at [email protected], or telephone us, Monday to Friday from 8:30 a.m. to 4:30 p.m., at thefollowing numbers:
Statistics Canada’s National Contact Centre
Toll-free telephone (Canada and the United States):Inquiries line 1-800-263-1136National telecommunications device for the hearing impaired 1-800-363-7629Fax line 1-877-287-4369
Local or international calls:Inquiries line 1-613-951-8116Fax line 1-613-951-0581
Depository Services ProgramInquiries line 1-800-635-7943Fax line 1-800-565-7757
To access this product
This product, Catalogue no. 82-223-X, is available free in electronic format. To obtain a single issue, visit our website atwww.statcan.ca and select “Publications” > “Free Internet publications.”
Standards of service to the public
Statistics Canada is committed to serving its clients in a prompt, reliable and courteous manner. To this end, Statistics Canadahas developed standards of service that its employees observe. To obtain a copy of these service standards, please contactStatistics Canada toll-free at 1-800-263-1136. The service standards are also published on www.statcan.ca under “About us” >“Providing services to Canadians.”
Statistics CanadaHealth Statistics Division
Induced Abortion Statistics2005
Published by authority of the Minister responsible for Statistics Canada
© Minister of Industry, 2008
All rights reserved. The content of this electronic publication may be reproduced, inwhole or in part, and by any means, without further permission from Statistics Canada,subject to the following conditions: that it be done solely for the purposes of privatestudy, research, criticism, review or newspaper summary, and/or for non-commercialpurposes; and that Statistics Canada be fully acknowledged as follows: Source (or“Adapted from”, if appropriate): Statistics Canada, year of publication, name ofproduct, catalogue number, volume and issue numbers, reference period and page(s).Otherwise, no part of this publication may be reproduced, stored in a retrieval systemor transmitted in any form, by any means—electronic, mechanical or photocopy—orfor any purposes without prior written permission of Licensing Services, ClientServices Division, Statistics Canada, Ottawa, Ontario, Canada K1A 0T6.
May 2008
Catalogue no. 82-223-X
ISSN 1708-7856
Frequency: Annual
Ottawa
La version française de cette publication est disponible sur demande (no 82-223-Xau catalogue).
Note of appreciation
Canada owes the success of its statistical system to a long standing partnership betweenStatistics Canada, the citizens of Canada, its businesses, governments and otherinstitutions. Accurate and timely statistical information could not be produced withouttheir continued cooperation and goodwill.

User information
Symbols
The following standard symbols are used in Statistics Canada publications:
. not available for any reference period
.. not available for a specific reference period
... not applicable
0 true zero or a value rounded to zero
0s value rounded to 0 (zero) where there is a meaningful distinction between true zero and the value that wasrounded
p preliminary
r revised
x suppressed to meet the confidentiality requirements of the Statistics Act
E use with caution
F too unreliable to be published
2 Statistics Canada – Catalogue no. 82-223-X
Introduction
This product provides annual statistics on induced abortions performed in Canada on Canadian and non-Canadianresidents. Where applicable for data years prior to 2004, data on induced abortions performed on Canadian womenin selected American states are also provided.
Counts, rates per 1,000 women and ratios per 100 live births of induced abortions at the national, provincial andterritorial levels are provided. Certain tables indicate the number of abortions performed in a hospital or in a clinicsetting. Other tables indicate the counts, rates and ratios per 100 live births of induced abortions across age groups.
Some CANSIM tables provide data back to 1970, while others provide data back to 1974. These tables are updatedannually to include the most current data year available. The Internet publication provides data for the latest 10 yearsavailable.
The data source for these tables is the Therapeutic Abortion Survey.
Free access to the data is provided through a special CANSIM interface. The CANSIM tables can be linked directlyfrom three different locations in the HTML product:
Tables section:
• Related CANSIM tables
• Individual tables, in the Source
Related products section:
• Selected CANSIM tables from Statistics Canada
Statistics Canada – Catalogue no. 82-223-X 3
Table of contents
Highlights 6
Analysis 7
Related products 8
Statistical tables
1 Induced abortions, by area of report and type of facility performing the abortion 101-1 Hospitals and clinics 101-2 Hospitals 101-3 Clinics 11
2 Induced abortions, by type of facility and area of residence of patient 112-1 Hospitals and clinics 112-2 Hospitals 122-3 Clinics 13
3 Selected induced abortions statistics, by age group and area of residence of patient 143-1 Canada 143-2 Newfoundland and Labrador 153-3 Prince Edward Island 163-4 Nova Scotia 173-5 New Brunswick 183-6 Quebec 193-7 Ontario 203-8 Manitoba 213-9 Saskatchewan 223-10 Alberta 233-11 British Columbia 243-12 Yukon Territory 253-13 Northwest Territories including Nunavut 263-14 Northwest Territories 273-15 Nunavut 283-16 Unknown province or territory 29
4 Statistics Canada – Catalogue no. 82-223-X

Induced Abortion Statistics – 2005
Table of contents – continued
Data quality, concepts and methodology
Definitions 30Explanatory notes for the tables 31
Statistics Canada – Catalogue no. 82-223-X 5
Highlights
• Canadian women obtained fewer induced abortions in 2005 compared with the previous year, and the declineoccurred mostly among teenage women under 20.
• A total of 96,815 induced abortions were performed on Canadian women in 2005, down 3.2 %from 100,039 in 2004. As a result, the induced abortion rate edged down from 14.6 abortions in 2004 forevery 1,000 women aged 15 to 44, to 14.1 in 2005.
• Induced abortion rates fell in every age group, except among women aged 35 to 39, where it remained the same.Women under 20 experienced the largest decline in rates from 13.8 for every 1000 women in 2004 to 13.0 in 2005.
6 Statistics Canada – Catalogue no. 82-223-X
Analysis
Canadian women obtained fewer induced abortions in 2005 compared with the previous year, and the declineoccurred mostly among women under the age of 20.
A total of 96,815 induced abortions were performed on Canadian women in 2005, down 3.2% from 100,039 in 2004.As a result, the induced abortion rate edged down from 14.6 abortions in 2004 for every 1,000 women aged 15 to 44,to 14.1 in 2005.
Induced abortion rates fell in every age group, except among women aged 35 to 39, where it remained the same.Teenage women under the age of 20 experienced the largest decline in rates from 13.8 for every 1000 womenin 2004 to 13.0 in 2005. The induced abortion rate for these women has declined gradually since 1996 when itpeaked at 18.9.
The crude birth rate for teenaged women has also continued to decline. In 1996, there were 18.6 live births forevery 1,000 women under 20. By 2005, this had dropped to 11.1.
The number of induced abortions for every 100 live births fell to 28.3 in 2005 from 29.7 in 2004.
Induced abortions continued to be most common among women in their early 20s. They accounted for 31% of allwomen who obtained an induced abortion in 2005. On average, 28 women out of every 1,000 aged 20 to 24 obtainedan induced abortion.
Induced abortion rates remained about the same, or increased, among women in Nova Scotia, New Brunswick,British Columbia, and in the combined Nunavut, Yukon, and Northwest Territories.
They declined in Newfoundland and Labrador, Prince Edward Island, Quebec, Ontario, Manitoba, Saskatchewanand Alberta.
Note:
Data for 2005 cover induced abortions performed in hospitals and clinics in provinces and territories, except thoseperformed in Manitoba clinics, which have been unavailable since 2004. As of 2004, induced abortions obtainedby Canadian women in some American states are no longer collected. Users should be aware of certain limitationswith the Therapeutic Abortion Survey. There are recognized issues concerning coverage, increased submission ofaggregate counts instead of detailed records, and an increased reliance on age estimates.
Statistics Canada – Catalogue no. 82-223-X 7
Related products
Selected publications from Statistics Canada
82-224-X Pregnancy Outcomes
Selected CANSIM tables from Statistics Canada
106-9005 Induced abortions, by area of report and type of facility performing the abortion, Canada,provinces and territories, annual
106-9013 Induced abortions, by area of residence of patient, Canada, provinces and territories, annual
106-9034 Induced abortions, by age group and area of residence of patient, Canada, provinces andterritories, annual
Selected surveys from Statistics Canada
3209 Therapeutic Abortion Survey (http://www.statcan.ca/english/sdds/3209.htm)
Selected summary tables from Statistics Canada
• Induced abortions by province and territory of report
• Induced abortions by area of residence of patients
• Induced abortions per 100 live births
• Induced abortions by age group
• Pregnancy outcomes by province or territory of residence
• Pregnancy outcomes by age group
8 Statistics Canada – Catalogue no. 82-223-X

Statistical tables
Induced Abortion Statistics – 2005
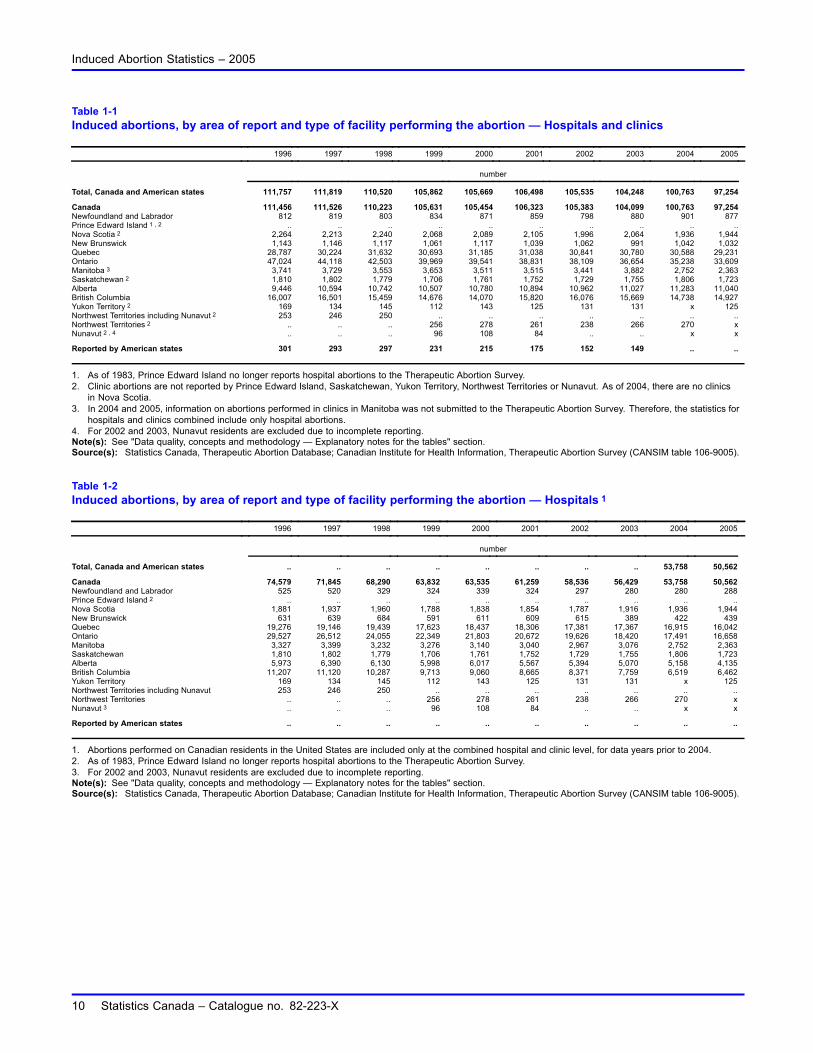
Table 1-1Induced abortions, by area of report and type of facility performing the abortion — Hospitals and clinics
1996 1997 1998 1999 2000 2001 2002 2003 2004 2005
number
Total, Canada and American states 111,757 111,819 110,520 105,862 105,669 106,498 105,535 104,248 100,763 97,254
Canada 111,456 111,526 110,223 105,631 105,454 106,323 105,383 104,099 100,763 97,254Newfoundland and Labrador 812 819 803 834 871 859 798 880 901 877Prince Edward Island 1 , 2 .. .. .. .. .. .. .. .. .. ..Nova Scotia 2 2,264 2,213 2,240 2,068 2,089 2,105 1,996 2,064 1,936 1,944New Brunswick 1,143 1,146 1,117 1,061 1,117 1,039 1,062 991 1,042 1,032Quebec 28,787 30,224 31,632 30,693 31,185 31,038 30,841 30,780 30,588 29,231Ontario 47,024 44,118 42,503 39,969 39,541 38,831 38,109 36,654 35,238 33,609Manitoba 3 3,741 3,729 3,553 3,653 3,511 3,515 3,441 3,882 2,752 2,363Saskatchewan 2 1,810 1,802 1,779 1,706 1,761 1,752 1,729 1,755 1,806 1,723Alberta 9,446 10,594 10,742 10,507 10,780 10,894 10,962 11,027 11,283 11,040British Columbia 16,007 16,501 15,459 14,676 14,070 15,820 16,076 15,669 14,738 14,927Yukon Territory 2 169 134 145 112 143 125 131 131 x 125Northwest Territories including Nunavut 2 253 246 250 .. .. .. .. .. .. ..Northwest Territories 2 .. .. .. 256 278 261 238 266 270 xNunavut 2 , 4 .. .. .. 96 108 84 .. .. x x
Reported by American states 301 293 297 231 215 175 152 149 .. ..
1. As of 1983, Prince Edward Island no longer reports hospital abortions to the Therapeutic Abortion Survey.2. Clinic abortions are not reported by Prince Edward Island, Saskatchewan, Yukon Territory, Northwest Territories or Nunavut. As of 2004, there are no clinics
in Nova Scotia.3. In 2004 and 2005, information on abortions performed in clinics in Manitoba was not submitted to the Therapeutic Abortion Survey. Therefore, the statistics for
hospitals and clinics combined include only hospital abortions.4. For 2002 and 2003, Nunavut residents are excluded due to incomplete reporting.Note(s): See "Data quality, concepts and methodology — Explanatory notes for the tables" section.Source(s): Statistics Canada, Therapeutic Abortion Database; Canadian Institute for Health Information, Therapeutic Abortion Survey (CANSIM table 106-9005).
Table 1-2Induced abortions, by area of report and type of facility performing the abortion — Hospitals 1
1996 1997 1998 1999 2000 2001 2002 2003 2004 2005
number
Total, Canada and American states .. .. .. .. .. .. .. .. 53,758 50,562
Canada 74,579 71,845 68,290 63,832 63,535 61,259 58,536 56,429 53,758 50,562Newfoundland and Labrador 525 520 329 324 339 324 297 280 280 288Prince Edward Island 2 .. .. .. .. .. .. .. .. .. ..Nova Scotia 1,881 1,937 1,960 1,788 1,838 1,854 1,787 1,916 1,936 1,944New Brunswick 631 639 684 591 611 609 615 389 422 439Quebec 19,276 19,146 19,439 17,623 18,437 18,306 17,381 17,367 16,915 16,042Ontario 29,527 26,512 24,055 22,349 21,803 20,672 19,626 18,420 17,491 16,658Manitoba 3,327 3,399 3,232 3,276 3,140 3,040 2,967 3,076 2,752 2,363Saskatchewan 1,810 1,802 1,779 1,706 1,761 1,752 1,729 1,755 1,806 1,723Alberta 5,973 6,390 6,130 5,998 6,017 5,567 5,394 5,070 5,158 4,135British Columbia 11,207 11,120 10,287 9,713 9,060 8,665 8,371 7,759 6,519 6,462Yukon Territory 169 134 145 112 143 125 131 131 x 125Northwest Territories including Nunavut 253 246 250 .. .. .. .. .. .. ..Northwest Territories .. .. .. 256 278 261 238 266 270 xNunavut 3 .. .. .. 96 108 84 .. .. x x
Reported by American states .. .. .. .. .. .. .. .. .. ..
1. Abortions performed on Canadian residents in the United States are included only at the combined hospital and clinic level, for data years prior to 2004.2. As of 1983, Prince Edward Island no longer reports hospital abortions to the Therapeutic Abortion Survey.3. For 2002 and 2003, Nunavut residents are excluded due to incomplete reporting.Note(s): See "Data quality, concepts and methodology — Explanatory notes for the tables" section.Source(s): Statistics Canada, Therapeutic Abortion Database; Canadian Institute for Health Information, Therapeutic Abortion Survey (CANSIM table 106-9005).
10 Statistics Canada – Catalogue no. 82-223-X
Induced Abortion Statistics – 2005
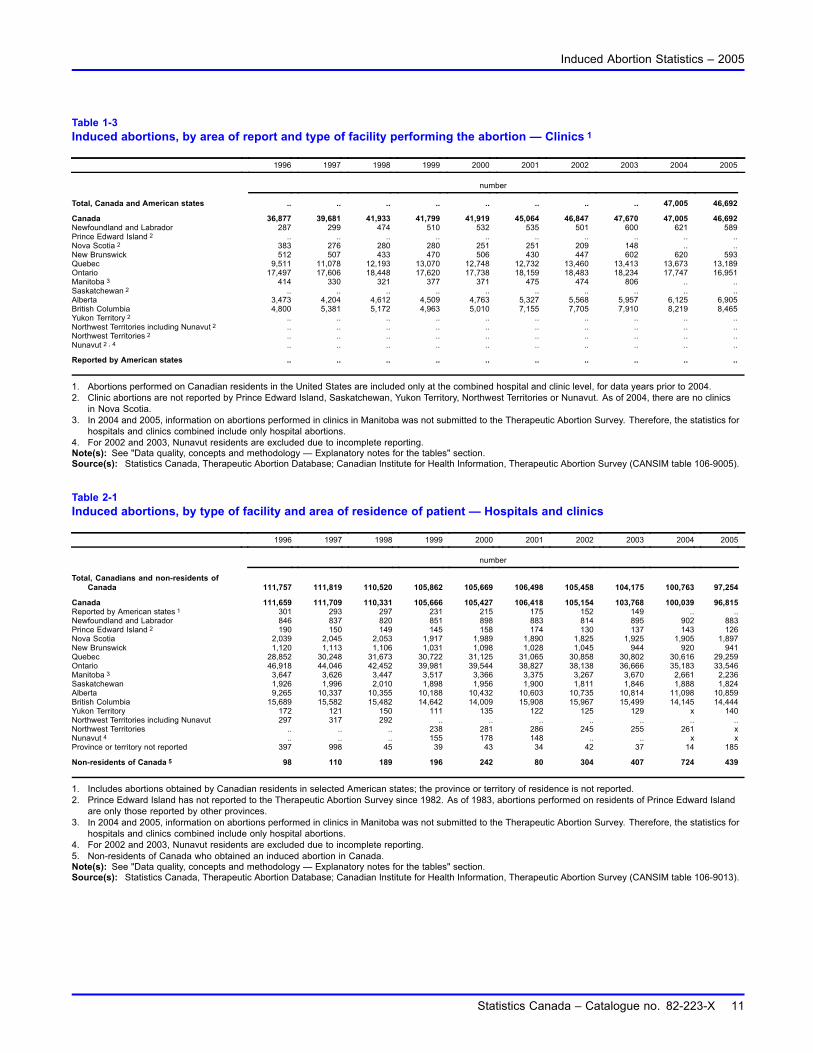
Table 1-3Induced abortions, by area of report and type of facility performing the abortion — Clinics 1
1996 1997 1998 1999 2000 2001 2002 2003 2004 2005
number
Total, Canada and American states .. .. .. .. .. .. .. .. 47,005 46,692
Canada 36,877 39,681 41,933 41,799 41,919 45,064 46,847 47,670 47,005 46,692Newfoundland and Labrador 287 299 474 510 532 535 501 600 621 589Prince Edward Island 2 .. .. .. .. .. .. .. .. .. ..Nova Scotia 2 383 276 280 280 251 251 209 148 .. ..New Brunswick 512 507 433 470 506 430 447 602 620 593Quebec 9,511 11,078 12,193 13,070 12,748 12,732 13,460 13,413 13,673 13,189Ontario 17,497 17,606 18,448 17,620 17,738 18,159 18,483 18,234 17,747 16,951Manitoba 3 414 330 321 377 371 475 474 806 .. ..Saskatchewan 2 .. .. .. .. .. .. .. .. .. ..Alberta 3,473 4,204 4,612 4,509 4,763 5,327 5,568 5,957 6,125 6,905British Columbia 4,800 5,381 5,172 4,963 5,010 7,155 7,705 7,910 8,219 8,465Yukon Territory 2 .. .. .. .. .. .. .. .. .. ..Northwest Territories including Nunavut 2 .. .. .. .. .. .. .. .. .. ..Northwest Territories 2 .. .. .. .. .. .. .. .. .. ..Nunavut 2 , 4 .. .. .. .. .. .. .. .. .. ..
Reported by American states .. .. .. .. .. .. .. .. .. ..
1. Abortions performed on Canadian residents in the United States are included only at the combined hospital and clinic level, for data years prior to 2004.2. Clinic abortions are not reported by Prince Edward Island, Saskatchewan, Yukon Territory, Northwest Territories or Nunavut. As of 2004, there are no clinics
in Nova Scotia.3. In 2004 and 2005, information on abortions performed in clinics in Manitoba was not submitted to the Therapeutic Abortion Survey. Therefore, the statistics for
hospitals and clinics combined include only hospital abortions.4. For 2002 and 2003, Nunavut residents are excluded due to incomplete reporting.Note(s): See "Data quality, concepts and methodology — Explanatory notes for the tables" section.Source(s): Statistics Canada, Therapeutic Abortion Database; Canadian Institute for Health Information, Therapeutic Abortion Survey (CANSIM table 106-9005).
Table 2-1Induced abortions, by type of facility and area of residence of patient — Hospitals and clinics
1996 1997 1998 1999 2000 2001 2002 2003 2004 2005
number
Total, Canadians and non-residents ofCanada 111,757 111,819 110,520 105,862 105,669 106,498 105,458 104,175 100,763 97,254
Canada 111,659 111,709 110,331 105,666 105,427 106,418 105,154 103,768 100,039 96,815Reported by American states 1 301 293 297 231 215 175 152 149 .. ..Newfoundland and Labrador 846 837 820 851 898 883 814 895 902 883Prince Edward Island 2 190 150 149 145 158 174 130 137 143 126Nova Scotia 2,039 2,045 2,053 1,917 1,989 1,890 1,825 1,925 1,905 1,897New Brunswick 1,120 1,113 1,106 1,031 1,098 1,028 1,045 944 920 941Quebec 28,852 30,248 31,673 30,722 31,125 31,065 30,858 30,802 30,616 29,259Ontario 46,918 44,046 42,452 39,981 39,544 38,827 38,138 36,666 35,183 33,546Manitoba 3 3,647 3,626 3,447 3,517 3,366 3,375 3,267 3,670 2,661 2,236Saskatchewan 1,926 1,996 2,010 1,898 1,956 1,900 1,811 1,846 1,888 1,824Alberta 9,265 10,337 10,355 10,188 10,432 10,603 10,735 10,814 11,098 10,859British Columbia 15,689 15,582 15,482 14,642 14,009 15,908 15,967 15,499 14,145 14,444Yukon Territory 172 121 150 111 135 122 125 129 x 140Northwest Territories including Nunavut 297 317 292 .. .. .. .. .. .. ..Northwest Territories .. .. .. 238 281 286 245 255 261 xNunavut 4 .. .. .. 155 178 148 .. .. x xProvince or territory not reported 397 998 45 39 43 34 42 37 14 185
Non-residents of Canada 5 98 110 189 196 242 80 304 407 724 439
1. Includes abortions obtained by Canadian residents in selected American states; the province or territory of residence is not reported.2. Prince Edward Island has not reported to the Therapeutic Abortion Survey since 1982. As of 1983, abortions performed on residents of Prince Edward Island
are only those reported by other provinces.3. In 2004 and 2005, information on abortions performed in clinics in Manitoba was not submitted to the Therapeutic Abortion Survey. Therefore, the statistics for
hospitals and clinics combined include only hospital abortions.4. For 2002 and 2003, Nunavut residents are excluded due to incomplete reporting.5. Non-residents of Canada who obtained an induced abortion in Canada.Note(s): See "Data quality, concepts and methodology — Explanatory notes for the tables" section.Source(s): Statistics Canada, Therapeutic Abortion Database; Canadian Institute for Health Information, Therapeutic Abortion Survey (CANSIM table 106-9013).
Statistics Canada – Catalogue no. 82-223-X 11
Induced Abortion Statistics – 2005
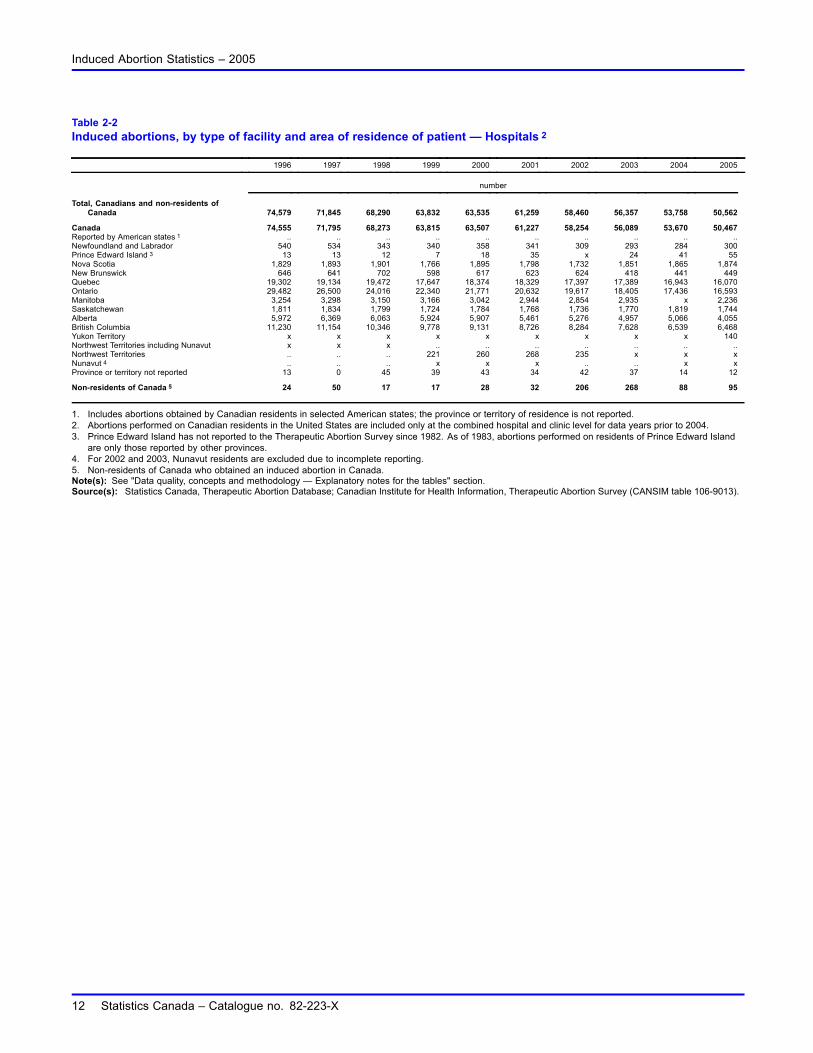
Table 2-2Induced abortions, by type of facility and area of residence of patient — Hospitals 2
1996 1997 1998 1999 2000 2001 2002 2003 2004 2005
number
Total, Canadians and non-residents ofCanada 74,579 71,845 68,290 63,832 63,535 61,259 58,460 56,357 53,758 50,562
Canada 74,555 71,795 68,273 63,815 63,507 61,227 58,254 56,089 53,670 50,467Reported by American states 1 .. .. .. .. .. .. .. .. .. ..Newfoundland and Labrador 540 534 343 340 358 341 309 293 284 300Prince Edward Island 3 13 13 12 7 18 35 x 24 41 55Nova Scotia 1,829 1,893 1,901 1,766 1,895 1,798 1,732 1,851 1,865 1,874New Brunswick 646 641 702 598 617 623 624 418 441 449Quebec 19,302 19,134 19,472 17,647 18,374 18,329 17,397 17,389 16,943 16,070Ontario 29,482 26,500 24,016 22,340 21,771 20,632 19,617 18,405 17,436 16,593Manitoba 3,254 3,298 3,150 3,166 3,042 2,944 2,854 2,935 x 2,236Saskatchewan 1,811 1,834 1,799 1,724 1,784 1,768 1,736 1,770 1,819 1,744Alberta 5,972 6,369 6,063 5,924 5,907 5,461 5,276 4,957 5,066 4,055British Columbia 11,230 11,154 10,346 9,778 9,131 8,726 8,284 7,628 6,539 6,468Yukon Territory x x x x x x x x x 140Northwest Territories including Nunavut x x x .. .. .. .. .. .. ..Northwest Territories .. .. .. 221 260 268 235 x x xNunavut 4 .. .. .. x x x .. .. x xProvince or territory not reported 13 0 45 39 43 34 42 37 14 12
Non-residents of Canada 5 24 50 17 17 28 32 206 268 88 95
1. Includes abortions obtained by Canadian residents in selected American states; the province or territory of residence is not reported.2. Abortions performed on Canadian residents in the United States are included only at the combined hospital and clinic level for data years prior to 2004.3. Prince Edward Island has not reported to the Therapeutic Abortion Survey since 1982. As of 1983, abortions performed on residents of Prince Edward Island
are only those reported by other provinces.4. For 2002 and 2003, Nunavut residents are excluded due to incomplete reporting.5. Non-residents of Canada who obtained an induced abortion in Canada.Note(s): See "Data quality, concepts and methodology — Explanatory notes for the tables" section.Source(s): Statistics Canada, Therapeutic Abortion Database; Canadian Institute for Health Information, Therapeutic Abortion Survey (CANSIM table 106-9013).
12 Statistics Canada – Catalogue no. 82-223-X
Induced Abortion Statistics – 2005
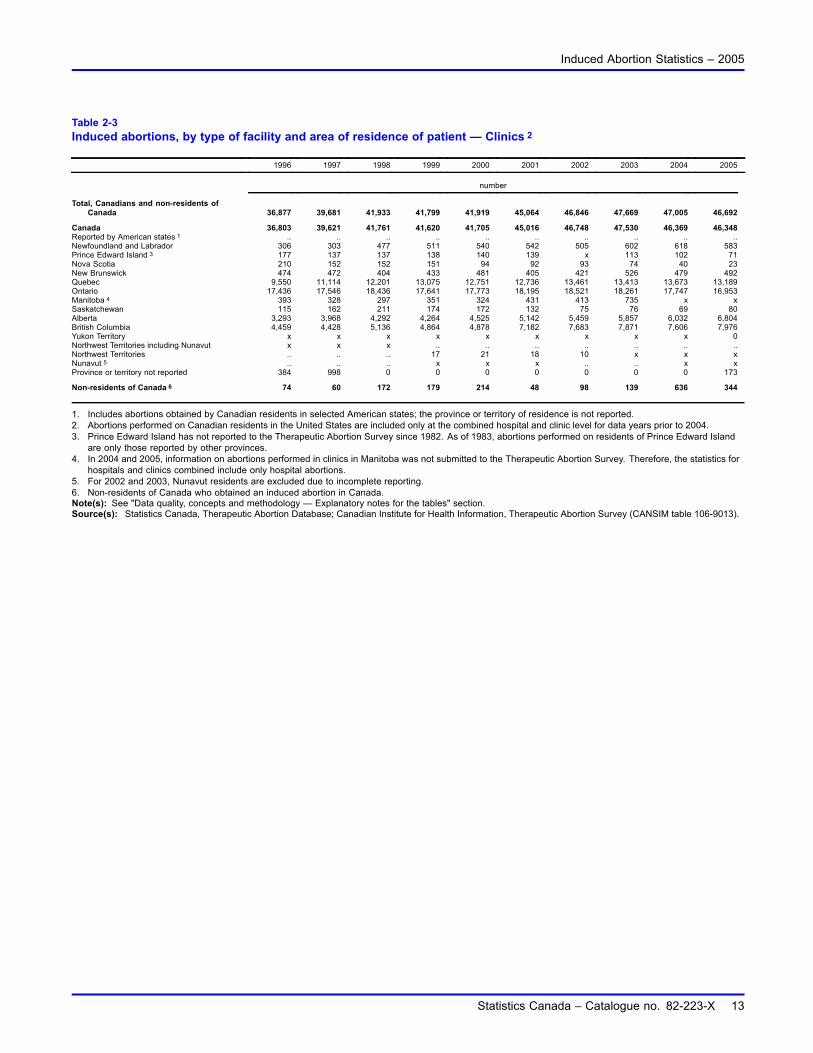
Table 2-3Induced abortions, by type of facility and area of residence of patient — Clinics 2
1996 1997 1998 1999 2000 2001 2002 2003 2004 2005
number
Total, Canadians and non-residents ofCanada 36,877 39,681 41,933 41,799 41,919 45,064 46,846 47,669 47,005 46,692
Canada 36,803 39,621 41,761 41,620 41,705 45,016 46,748 47,530 46,369 46,348Reported by American states 1 .. .. .. .. .. .. .. .. .. ..Newfoundland and Labrador 306 303 477 511 540 542 505 602 618 583Prince Edward Island 3 177 137 137 138 140 139 x 113 102 71Nova Scotia 210 152 152 151 94 92 93 74 40 23New Brunswick 474 472 404 433 481 405 421 526 479 492Quebec 9,550 11,114 12,201 13,075 12,751 12,736 13,461 13,413 13,673 13,189Ontario 17,436 17,546 18,436 17,641 17,773 18,195 18,521 18,261 17,747 16,953Manitoba 4 393 328 297 351 324 431 413 735 x xSaskatchewan 115 162 211 174 172 132 75 76 69 80Alberta 3,293 3,968 4,292 4,264 4,525 5,142 5,459 5,857 6,032 6,804British Columbia 4,459 4,428 5,136 4,864 4,878 7,182 7,683 7,871 7,606 7,976Yukon Territory x x x x x x x x x 0Northwest Territories including Nunavut x x x .. .. .. .. .. .. ..Northwest Territories .. .. .. 17 21 18 10 x x xNunavut 5 .. .. .. x x x .. .. x xProvince or territory not reported 384 998 0 0 0 0 0 0 0 173
Non-residents of Canada 6 74 60 172 179 214 48 98 139 636 344
1. Includes abortions obtained by Canadian residents in selected American states; the province or territory of residence is not reported.2. Abortions performed on Canadian residents in the United States are included only at the combined hospital and clinic level for data years prior to 2004.3. Prince Edward Island has not reported to the Therapeutic Abortion Survey since 1982. As of 1983, abortions performed on residents of Prince Edward Island
are only those reported by other provinces.4. In 2004 and 2005, information on abortions performed in clinics in Manitoba was not submitted to the Therapeutic Abortion Survey. Therefore, the statistics for
hospitals and clinics combined include only hospital abortions.5. For 2002 and 2003, Nunavut residents are excluded due to incomplete reporting.6. Non-residents of Canada who obtained an induced abortion in Canada.Note(s): See "Data quality, concepts and methodology — Explanatory notes for the tables" section.Source(s): Statistics Canada, Therapeutic Abortion Database; Canadian Institute for Health Information, Therapeutic Abortion Survey (CANSIM table 106-9013).
Statistics Canada – Catalogue no. 82-223-X 13
Induced Abortion Statistics – 2005
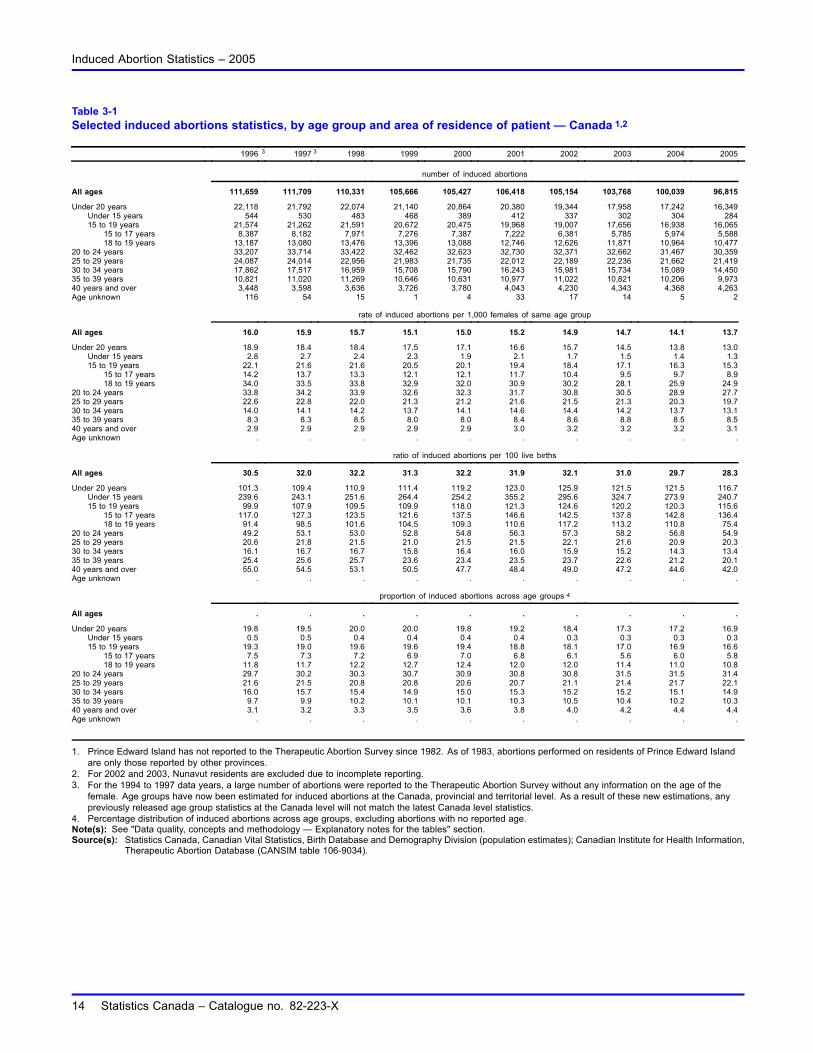
Table 3-1Selected induced abortions statistics, by age group and area of residence of patient — Canada 1,2
1996 3 1997 3 1998 1999 2000 2001 2002 2003 2004 2005
number of induced abortions
All ages 111,659 111,709 110,331 105,666 105,427 106,418 105,154 103,768 100,039 96,815
Under 20 years 22,118 21,792 22,074 21,140 20,864 20,380 19,344 17,958 17,242 16,349Under 15 years 544 530 483 468 389 412 337 302 304 28415 to 19 years 21,574 21,262 21,591 20,672 20,475 19,968 19,007 17,656 16,938 16,065
15 to 17 years 8,387 8,182 7,971 7,276 7,387 7,222 6,381 5,785 5,974 5,58818 to 19 years 13,187 13,080 13,476 13,396 13,088 12,746 12,626 11,871 10,964 10,477
20 to 24 years 33,207 33,714 33,422 32,462 32,623 32,730 32,371 32,662 31,467 30,35925 to 29 years 24,087 24,014 22,956 21,983 21,735 22,012 22,189 22,236 21,662 21,41930 to 34 years 17,862 17,517 16,959 15,708 15,790 16,243 15,981 15,734 15,089 14,45035 to 39 years 10,821 11,020 11,269 10,646 10,631 10,977 11,022 10,821 10,206 9,97340 years and over 3,448 3,598 3,636 3,726 3,780 4,043 4,230 4,343 4,368 4,263Age unknown 116 54 15 1 4 33 17 14 5 2
rate of induced abortions per 1,000 females of same age group
All ages 16.0 15.9 15.7 15.1 15.0 15.2 14.9 14.7 14.1 13.7
Under 20 years 18.9 18.4 18.4 17.5 17.1 16.6 15.7 14.5 13.8 13.0Under 15 years 2.8 2.7 2.4 2.3 1.9 2.1 1.7 1.5 1.4 1.315 to 19 years 22.1 21.6 21.6 20.5 20.1 19.4 18.4 17.1 16.3 15.3
15 to 17 years 14.2 13.7 13.3 12.1 12.1 11.7 10.4 9.5 9.7 8.918 to 19 years 34.0 33.5 33.8 32.9 32.0 30.9 30.2 28.1 25.9 24.9
20 to 24 years 33.8 34.2 33.9 32.6 32.3 31.7 30.8 30.5 28.9 27.725 to 29 years 22.6 22.8 22.0 21.3 21.2 21.6 21.5 21.3 20.3 19.730 to 34 years 14.0 14.1 14.2 13.7 14.1 14.6 14.4 14.2 13.7 13.135 to 39 years 8.3 8.3 8.5 8.0 8.0 8.4 8.6 8.8 8.5 8.540 years and over 2.9 2.9 2.9 2.9 2.9 3.0 3.2 3.2 3.2 3.1Age unknown . . . . . . . . . .
ratio of induced abortions per 100 live births
All ages 30.5 32.0 32.2 31.3 32.2 31.9 32.1 31.0 29.7 28.3
Under 20 years 101.3 109.4 110.9 111.4 119.2 123.0 125.9 121.5 121.5 116.7Under 15 years 239.6 243.1 251.6 264.4 254.2 355.2 295.6 324.7 273.9 240.715 to 19 years 99.9 107.9 109.5 109.9 118.0 121.3 124.6 120.2 120.3 115.6
15 to 17 years 117.0 127.3 123.5 121.6 137.5 146.6 142.5 137.8 142.8 136.418 to 19 years 91.4 98.5 101.6 104.5 109.3 110.6 117.2 113.2 110.8 75.4
20 to 24 years 49.2 53.1 53.0 52.8 54.8 56.3 57.3 58.2 56.8 54.925 to 29 years 20.6 21.8 21.5 21.0 21.5 21.5 22.1 21.6 20.9 20.330 to 34 years 16.1 16.7 16.7 15.8 16.4 16.0 15.9 15.2 14.3 13.435 to 39 years 25.4 25.6 25.7 23.6 23.4 23.5 23.7 22.6 21.2 20.140 years and over 55.0 54.5 53.1 50.5 47.7 48.4 49.0 47.2 44.6 42.0Age unknown . . . . . . . . . .
proportion of induced abortions across age groups 4
All ages . . . . . . . . . .
Under 20 years 19.8 19.5 20.0 20.0 19.8 19.2 18.4 17.3 17.2 16.9Under 15 years 0.5 0.5 0.4 0.4 0.4 0.4 0.3 0.3 0.3 0.315 to 19 years 19.3 19.0 19.6 19.6 19.4 18.8 18.1 17.0 16.9 16.6
15 to 17 years 7.5 7.3 7.2 6.9 7.0 6.8 6.1 5.6 6.0 5.818 to 19 years 11.8 11.7 12.2 12.7 12.4 12.0 12.0 11.4 11.0 10.8
20 to 24 years 29.7 30.2 30.3 30.7 30.9 30.8 30.8 31.5 31.5 31.425 to 29 years 21.6 21.5 20.8 20.8 20.6 20.7 21.1 21.4 21.7 22.130 to 34 years 16.0 15.7 15.4 14.9 15.0 15.3 15.2 15.2 15.1 14.935 to 39 years 9.7 9.9 10.2 10.1 10.1 10.3 10.5 10.4 10.2 10.340 years and over 3.1 3.2 3.3 3.5 3.6 3.8 4.0 4.2 4.4 4.4Age unknown . . . . . . . . . .
1. Prince Edward Island has not reported to the Therapeutic Abortion Survey since 1982. As of 1983, abortions performed on residents of Prince Edward Islandare only those reported by other provinces.
2. For 2002 and 2003, Nunavut residents are excluded due to incomplete reporting.3. For the 1994 to 1997 data years, a large number of abortions were reported to the Therapeutic Abortion Survey without any information on the age of the
female. Age groups have now been estimated for induced abortions at the Canada, provincial and territorial level. As a result of these new estimations, anypreviously released age group statistics at the Canada level will not match the latest Canada level statistics.
4. Percentage distribution of induced abortions across age groups, excluding abortions with no reported age.Note(s): See "Data quality, concepts and methodology — Explanatory notes for the tables" section.Source(s): Statistics Canada, Canadian Vital Statistics, Birth Database and Demography Division (population estimates); Canadian Institute for Health Information,
Therapeutic Abortion Database (CANSIM table 106-9034).
14 Statistics Canada – Catalogue no. 82-223-X
Induced Abortion Statistics – 2005
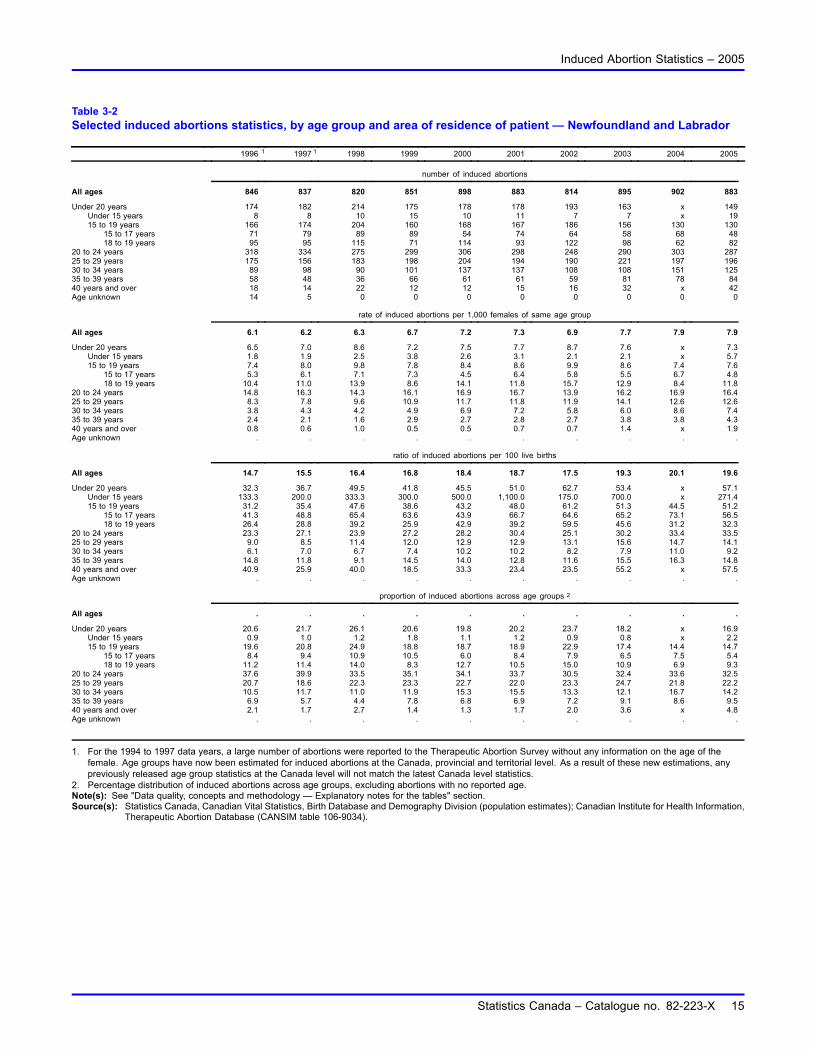
Table 3-2Selected induced abortions statistics, by age group and area of residence of patient — Newfoundland and Labrador
1996 1 1997 1 1998 1999 2000 2001 2002 2003 2004 2005
number of induced abortions
All ages 846 837 820 851 898 883 814 895 902 883
Under 20 years 174 182 214 175 178 178 193 163 x 149Under 15 years 8 8 10 15 10 11 7 7 x 1915 to 19 years 166 174 204 160 168 167 186 156 130 130
15 to 17 years 71 79 89 89 54 74 64 58 68 4818 to 19 years 95 95 115 71 114 93 122 98 62 82
20 to 24 years 318 334 275 299 306 298 248 290 303 28725 to 29 years 175 156 183 198 204 194 190 221 197 19630 to 34 years 89 98 90 101 137 137 108 108 151 12535 to 39 years 58 48 36 66 61 61 59 81 78 8440 years and over 18 14 22 12 12 15 16 32 x 42Age unknown 14 5 0 0 0 0 0 0 0 0
rate of induced abortions per 1,000 females of same age group
All ages 6.1 6.2 6.3 6.7 7.2 7.3 6.9 7.7 7.9 7.9
Under 20 years 6.5 7.0 8.6 7.2 7.5 7.7 8.7 7.6 x 7.3Under 15 years 1.8 1.9 2.5 3.8 2.6 3.1 2.1 2.1 x 5.715 to 19 years 7.4 8.0 9.8 7.8 8.4 8.6 9.9 8.6 7.4 7.6
15 to 17 years 5.3 6.1 7.1 7.3 4.5 6.4 5.8 5.5 6.7 4.818 to 19 years 10.4 11.0 13.9 8.6 14.1 11.8 15.7 12.9 8.4 11.8
20 to 24 years 14.8 16.3 14.3 16.1 16.9 16.7 13.9 16.2 16.9 16.425 to 29 years 8.3 7.8 9.6 10.9 11.7 11.8 11.9 14.1 12.6 12.630 to 34 years 3.8 4.3 4.2 4.9 6.9 7.2 5.8 6.0 8.6 7.435 to 39 years 2.4 2.1 1.6 2.9 2.7 2.8 2.7 3.8 3.8 4.340 years and over 0.8 0.6 1.0 0.5 0.5 0.7 0.7 1.4 x 1.9Age unknown . . . . . . . . . .
ratio of induced abortions per 100 live births
All ages 14.7 15.5 16.4 16.8 18.4 18.7 17.5 19.3 20.1 19.6
Under 20 years 32.3 36.7 49.5 41.8 45.5 51.0 62.7 53.4 x 57.1Under 15 years 133.3 200.0 333.3 300.0 500.0 1,100.0 175.0 700.0 x 271.415 to 19 years 31.2 35.4 47.6 38.6 43.2 48.0 61.2 51.3 44.5 51.2
15 to 17 years 41.3 48.8 65.4 63.6 43.9 66.7 64.6 65.2 73.1 56.518 to 19 years 26.4 28.8 39.2 25.9 42.9 39.2 59.5 45.6 31.2 32.3
20 to 24 years 23.3 27.1 23.9 27.2 28.2 30.4 25.1 30.2 33.4 33.525 to 29 years 9.0 8.5 11.4 12.0 12.9 12.9 13.1 15.6 14.7 14.130 to 34 years 6.1 7.0 6.7 7.4 10.2 10.2 8.2 7.9 11.0 9.235 to 39 years 14.8 11.8 9.1 14.5 14.0 12.8 11.6 15.5 16.3 14.840 years and over 40.9 25.9 40.0 18.5 33.3 23.4 23.5 55.2 x 57.5Age unknown . . . . . . . . . .
proportion of induced abortions across age groups 2
All ages . . . . . . . . . .
Under 20 years 20.6 21.7 26.1 20.6 19.8 20.2 23.7 18.2 x 16.9Under 15 years 0.9 1.0 1.2 1.8 1.1 1.2 0.9 0.8 x 2.215 to 19 years 19.6 20.8 24.9 18.8 18.7 18.9 22.9 17.4 14.4 14.7
15 to 17 years 8.4 9.4 10.9 10.5 6.0 8.4 7.9 6.5 7.5 5.418 to 19 years 11.2 11.4 14.0 8.3 12.7 10.5 15.0 10.9 6.9 9.3
20 to 24 years 37.6 39.9 33.5 35.1 34.1 33.7 30.5 32.4 33.6 32.525 to 29 years 20.7 18.6 22.3 23.3 22.7 22.0 23.3 24.7 21.8 22.230 to 34 years 10.5 11.7 11.0 11.9 15.3 15.5 13.3 12.1 16.7 14.235 to 39 years 6.9 5.7 4.4 7.8 6.8 6.9 7.2 9.1 8.6 9.540 years and over 2.1 1.7 2.7 1.4 1.3 1.7 2.0 3.6 x 4.8Age unknown . . . . . . . . . .
1. For the 1994 to 1997 data years, a large number of abortions were reported to the Therapeutic Abortion Survey without any information on the age of thefemale. Age groups have now been estimated for induced abortions at the Canada, provincial and territorial level. As a result of these new estimations, anypreviously released age group statistics at the Canada level will not match the latest Canada level statistics.
2. Percentage distribution of induced abortions across age groups, excluding abortions with no reported age.Note(s): See "Data quality, concepts and methodology — Explanatory notes for the tables" section.Source(s): Statistics Canada, Canadian Vital Statistics, Birth Database and Demography Division (population estimates); Canadian Institute for Health Information,
Therapeutic Abortion Database (CANSIM table 106-9034).
Statistics Canada – Catalogue no. 82-223-X 15
Induced Abortion Statistics – 2005
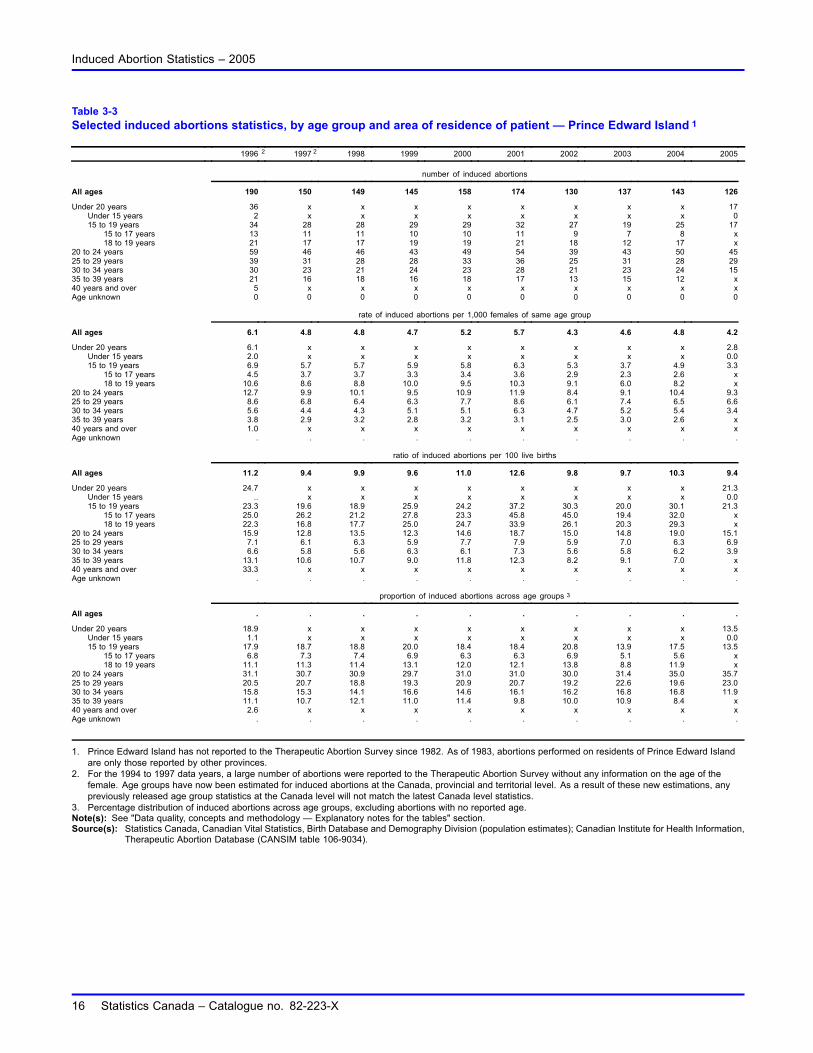
Table 3-3Selected induced abortions statistics, by age group and area of residence of patient — Prince Edward Island 1
1996 2 1997 2 1998 1999 2000 2001 2002 2003 2004 2005
number of induced abortions
All ages 190 150 149 145 158 174 130 137 143 126
Under 20 years 36 x x x x x x x x 17Under 15 years 2 x x x x x x x x 015 to 19 years 34 28 28 29 29 32 27 19 25 17
15 to 17 years 13 11 11 10 10 11 9 7 8 x18 to 19 years 21 17 17 19 19 21 18 12 17 x
20 to 24 years 59 46 46 43 49 54 39 43 50 4525 to 29 years 39 31 28 28 33 36 25 31 28 2930 to 34 years 30 23 21 24 23 28 21 23 24 1535 to 39 years 21 16 18 16 18 17 13 15 12 x40 years and over 5 x x x x x x x x xAge unknown 0 0 0 0 0 0 0 0 0 0
rate of induced abortions per 1,000 females of same age group
All ages 6.1 4.8 4.8 4.7 5.2 5.7 4.3 4.6 4.8 4.2
Under 20 years 6.1 x x x x x x x x 2.8Under 15 years 2.0 x x x x x x x x 0.015 to 19 years 6.9 5.7 5.7 5.9 5.8 6.3 5.3 3.7 4.9 3.3
15 to 17 years 4.5 3.7 3.7 3.3 3.4 3.6 2.9 2.3 2.6 x18 to 19 years 10.6 8.6 8.8 10.0 9.5 10.3 9.1 6.0 8.2 x
20 to 24 years 12.7 9.9 10.1 9.5 10.9 11.9 8.4 9.1 10.4 9.325 to 29 years 8.6 6.8 6.4 6.3 7.7 8.6 6.1 7.4 6.5 6.630 to 34 years 5.6 4.4 4.3 5.1 5.1 6.3 4.7 5.2 5.4 3.435 to 39 years 3.8 2.9 3.2 2.8 3.2 3.1 2.5 3.0 2.6 x40 years and over 1.0 x x x x x x x x xAge unknown . . . . . . . . . .
ratio of induced abortions per 100 live births
All ages 11.2 9.4 9.9 9.6 11.0 12.6 9.8 9.7 10.3 9.4
Under 20 years 24.7 x x x x x x x x 21.3Under 15 years .. x x x x x x x x 0.015 to 19 years 23.3 19.6 18.9 25.9 24.2 37.2 30.3 20.0 30.1 21.3
15 to 17 years 25.0 26.2 21.2 27.8 23.3 45.8 45.0 19.4 32.0 x18 to 19 years 22.3 16.8 17.7 25.0 24.7 33.9 26.1 20.3 29.3 x
20 to 24 years 15.9 12.8 13.5 12.3 14.6 18.7 15.0 14.8 19.0 15.125 to 29 years 7.1 6.1 6.3 5.9 7.7 7.9 5.9 7.0 6.3 6.930 to 34 years 6.6 5.8 5.6 6.3 6.1 7.3 5.6 5.8 6.2 3.935 to 39 years 13.1 10.6 10.7 9.0 11.8 12.3 8.2 9.1 7.0 x40 years and over 33.3 x x x x x x x x xAge unknown . . . . . . . . . .
proportion of induced abortions across age groups 3
All ages . . . . . . . . . .
Under 20 years 18.9 x x x x x x x x 13.5Under 15 years 1.1 x x x x x x x x 0.015 to 19 years 17.9 18.7 18.8 20.0 18.4 18.4 20.8 13.9 17.5 13.5
15 to 17 years 6.8 7.3 7.4 6.9 6.3 6.3 6.9 5.1 5.6 x18 to 19 years 11.1 11.3 11.4 13.1 12.0 12.1 13.8 8.8 11.9 x
20 to 24 years 31.1 30.7 30.9 29.7 31.0 31.0 30.0 31.4 35.0 35.725 to 29 years 20.5 20.7 18.8 19.3 20.9 20.7 19.2 22.6 19.6 23.030 to 34 years 15.8 15.3 14.1 16.6 14.6 16.1 16.2 16.8 16.8 11.935 to 39 years 11.1 10.7 12.1 11.0 11.4 9.8 10.0 10.9 8.4 x40 years and over 2.6 x x x x x x x x xAge unknown . . . . . . . . . .
1. Prince Edward Island has not reported to the Therapeutic Abortion Survey since 1982. As of 1983, abortions performed on residents of Prince Edward Islandare only those reported by other provinces.
2. For the 1994 to 1997 data years, a large number of abortions were reported to the Therapeutic Abortion Survey without any information on the age of thefemale. Age groups have now been estimated for induced abortions at the Canada, provincial and territorial level. As a result of these new estimations, anypreviously released age group statistics at the Canada level will not match the latest Canada level statistics.
3. Percentage distribution of induced abortions across age groups, excluding abortions with no reported age.Note(s): See "Data quality, concepts and methodology — Explanatory notes for the tables" section.Source(s): Statistics Canada, Canadian Vital Statistics, Birth Database and Demography Division (population estimates); Canadian Institute for Health Information,
Therapeutic Abortion Database (CANSIM table 106-9034).
16 Statistics Canada – Catalogue no. 82-223-X
Induced Abortion Statistics – 2005
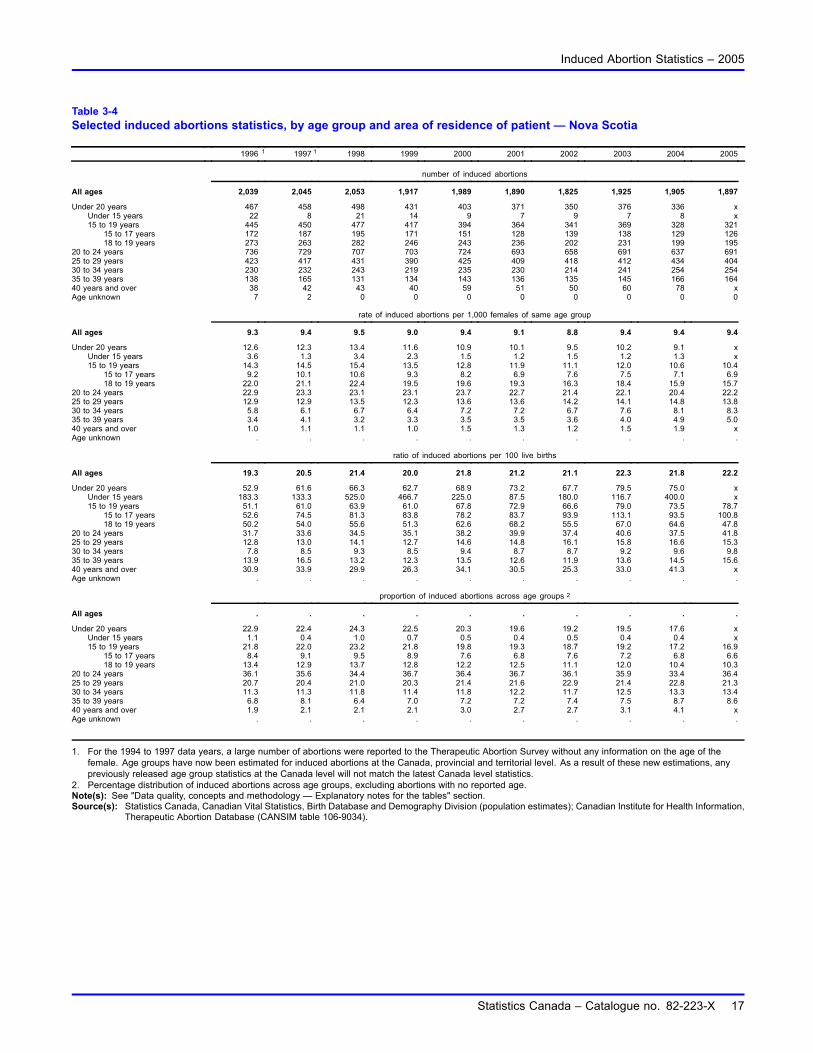
Table 3-4Selected induced abortions statistics, by age group and area of residence of patient — Nova Scotia
1996 1 1997 1 1998 1999 2000 2001 2002 2003 2004 2005
number of induced abortions
All ages 2,039 2,045 2,053 1,917 1,989 1,890 1,825 1,925 1,905 1,897
Under 20 years 467 458 498 431 403 371 350 376 336 xUnder 15 years 22 8 21 14 9 7 9 7 8 x15 to 19 years 445 450 477 417 394 364 341 369 328 321
15 to 17 years 172 187 195 171 151 128 139 138 129 12618 to 19 years 273 263 282 246 243 236 202 231 199 195
20 to 24 years 736 729 707 703 724 693 658 691 637 69125 to 29 years 423 417 431 390 425 409 418 412 434 40430 to 34 years 230 232 243 219 235 230 214 241 254 25435 to 39 years 138 165 131 134 143 136 135 145 166 16440 years and over 38 42 43 40 59 51 50 60 78 xAge unknown 7 2 0 0 0 0 0 0 0 0
rate of induced abortions per 1,000 females of same age group
All ages 9.3 9.4 9.5 9.0 9.4 9.1 8.8 9.4 9.4 9.4
Under 20 years 12.6 12.3 13.4 11.6 10.9 10.1 9.5 10.2 9.1 xUnder 15 years 3.6 1.3 3.4 2.3 1.5 1.2 1.5 1.2 1.3 x15 to 19 years 14.3 14.5 15.4 13.5 12.8 11.9 11.1 12.0 10.6 10.4
15 to 17 years 9.2 10.1 10.6 9.3 8.2 6.9 7.6 7.5 7.1 6.918 to 19 years 22.0 21.1 22.4 19.5 19.6 19.3 16.3 18.4 15.9 15.7
20 to 24 years 22.9 23.3 23.1 23.1 23.7 22.7 21.4 22.1 20.4 22.225 to 29 years 12.9 12.9 13.5 12.3 13.6 13.6 14.2 14.1 14.8 13.830 to 34 years 5.8 6.1 6.7 6.4 7.2 7.2 6.7 7.6 8.1 8.335 to 39 years 3.4 4.1 3.2 3.3 3.5 3.5 3.6 4.0 4.9 5.040 years and over 1.0 1.1 1.1 1.0 1.5 1.3 1.2 1.5 1.9 xAge unknown . . . . . . . . . .
ratio of induced abortions per 100 live births
All ages 19.3 20.5 21.4 20.0 21.8 21.2 21.1 22.3 21.8 22.2
Under 20 years 52.9 61.6 66.3 62.7 68.9 73.2 67.7 79.5 75.0 xUnder 15 years 183.3 133.3 525.0 466.7 225.0 87.5 180.0 116.7 400.0 x15 to 19 years 51.1 61.0 63.9 61.0 67.8 72.9 66.6 79.0 73.5 78.7
15 to 17 years 52.6 74.5 81.3 83.8 78.2 83.7 93.9 113.1 93.5 100.818 to 19 years 50.2 54.0 55.6 51.3 62.6 68.2 55.5 67.0 64.6 47.8
20 to 24 years 31.7 33.6 34.5 35.1 38.2 39.9 37.4 40.6 37.5 41.825 to 29 years 12.8 13.0 14.1 12.7 14.6 14.8 16.1 15.8 16.6 15.330 to 34 years 7.8 8.5 9.3 8.5 9.4 8.7 8.7 9.2 9.6 9.835 to 39 years 13.9 16.5 13.2 12.3 13.5 12.6 11.9 13.6 14.5 15.640 years and over 30.9 33.9 29.9 26.3 34.1 30.5 25.3 33.0 41.3 xAge unknown . . . . . . . . . .
proportion of induced abortions across age groups 2
All ages . . . . . . . . . .
Under 20 years 22.9 22.4 24.3 22.5 20.3 19.6 19.2 19.5 17.6 xUnder 15 years 1.1 0.4 1.0 0.7 0.5 0.4 0.5 0.4 0.4 x15 to 19 years 21.8 22.0 23.2 21.8 19.8 19.3 18.7 19.2 17.2 16.9
15 to 17 years 8.4 9.1 9.5 8.9 7.6 6.8 7.6 7.2 6.8 6.618 to 19 years 13.4 12.9 13.7 12.8 12.2 12.5 11.1 12.0 10.4 10.3
20 to 24 years 36.1 35.6 34.4 36.7 36.4 36.7 36.1 35.9 33.4 36.425 to 29 years 20.7 20.4 21.0 20.3 21.4 21.6 22.9 21.4 22.8 21.330 to 34 years 11.3 11.3 11.8 11.4 11.8 12.2 11.7 12.5 13.3 13.435 to 39 years 6.8 8.1 6.4 7.0 7.2 7.2 7.4 7.5 8.7 8.640 years and over 1.9 2.1 2.1 2.1 3.0 2.7 2.7 3.1 4.1 xAge unknown . . . . . . . . . .
1. For the 1994 to 1997 data years, a large number of abortions were reported to the Therapeutic Abortion Survey without any information on the age of thefemale. Age groups have now been estimated for induced abortions at the Canada, provincial and territorial level. As a result of these new estimations, anypreviously released age group statistics at the Canada level will not match the latest Canada level statistics.
2. Percentage distribution of induced abortions across age groups, excluding abortions with no reported age.Note(s): See "Data quality, concepts and methodology — Explanatory notes for the tables" section.Source(s): Statistics Canada, Canadian Vital Statistics, Birth Database and Demography Division (population estimates); Canadian Institute for Health Information,
Therapeutic Abortion Database (CANSIM table 106-9034).
Statistics Canada – Catalogue no. 82-223-X 17
Induced Abortion Statistics – 2005
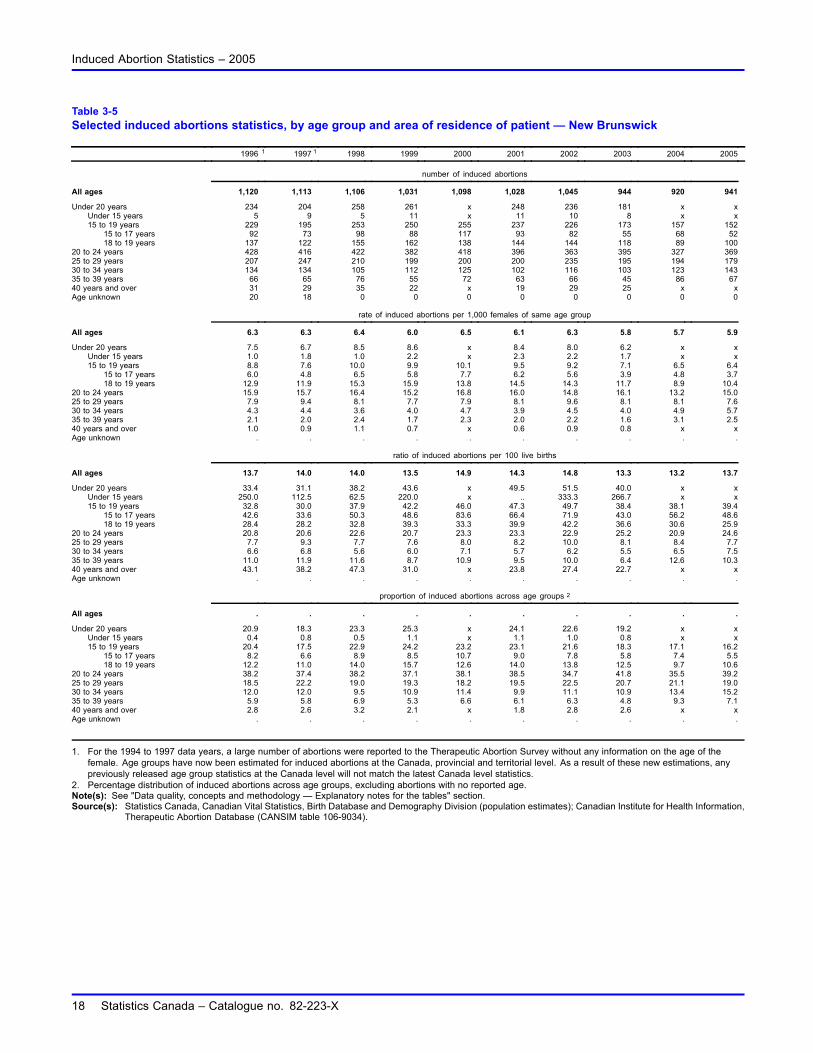
Table 3-5Selected induced abortions statistics, by age group and area of residence of patient — New Brunswick
1996 1 1997 1 1998 1999 2000 2001 2002 2003 2004 2005
number of induced abortions
All ages 1,120 1,113 1,106 1,031 1,098 1,028 1,045 944 920 941
Under 20 years 234 204 258 261 x 248 236 181 x xUnder 15 years 5 9 5 11 x 11 10 8 x x15 to 19 years 229 195 253 250 255 237 226 173 157 152
15 to 17 years 92 73 98 88 117 93 82 55 68 5218 to 19 years 137 122 155 162 138 144 144 118 89 100
20 to 24 years 428 416 422 382 418 396 363 395 327 36925 to 29 years 207 247 210 199 200 200 235 195 194 17930 to 34 years 134 134 105 112 125 102 116 103 123 14335 to 39 years 66 65 76 55 72 63 66 45 86 6740 years and over 31 29 35 22 x 19 29 25 x xAge unknown 20 18 0 0 0 0 0 0 0 0
rate of induced abortions per 1,000 females of same age group
All ages 6.3 6.3 6.4 6.0 6.5 6.1 6.3 5.8 5.7 5.9
Under 20 years 7.5 6.7 8.5 8.6 x 8.4 8.0 6.2 x xUnder 15 years 1.0 1.8 1.0 2.2 x 2.3 2.2 1.7 x x15 to 19 years 8.8 7.6 10.0 9.9 10.1 9.5 9.2 7.1 6.5 6.4
15 to 17 years 6.0 4.8 6.5 5.8 7.7 6.2 5.6 3.9 4.8 3.718 to 19 years 12.9 11.9 15.3 15.9 13.8 14.5 14.3 11.7 8.9 10.4
20 to 24 years 15.9 15.7 16.4 15.2 16.8 16.0 14.8 16.1 13.2 15.025 to 29 years 7.9 9.4 8.1 7.7 7.9 8.1 9.6 8.1 8.1 7.630 to 34 years 4.3 4.4 3.6 4.0 4.7 3.9 4.5 4.0 4.9 5.735 to 39 years 2.1 2.0 2.4 1.7 2.3 2.0 2.2 1.6 3.1 2.540 years and over 1.0 0.9 1.1 0.7 x 0.6 0.9 0.8 x xAge unknown . . . . . . . . . .
ratio of induced abortions per 100 live births
All ages 13.7 14.0 14.0 13.5 14.9 14.3 14.8 13.3 13.2 13.7
Under 20 years 33.4 31.1 38.2 43.6 x 49.5 51.5 40.0 x xUnder 15 years 250.0 112.5 62.5 220.0 x .. 333.3 266.7 x x15 to 19 years 32.8 30.0 37.9 42.2 46.0 47.3 49.7 38.4 38.1 39.4
15 to 17 years 42.6 33.6 50.3 48.6 83.6 66.4 71.9 43.0 56.2 48.618 to 19 years 28.4 28.2 32.8 39.3 33.3 39.9 42.2 36.6 30.6 25.9
20 to 24 years 20.8 20.6 22.6 20.7 23.3 23.3 22.9 25.2 20.9 24.625 to 29 years 7.7 9.3 7.7 7.6 8.0 8.2 10.0 8.1 8.4 7.730 to 34 years 6.6 6.8 5.6 6.0 7.1 5.7 6.2 5.5 6.5 7.535 to 39 years 11.0 11.9 11.6 8.7 10.9 9.5 10.0 6.4 12.6 10.340 years and over 43.1 38.2 47.3 31.0 x 23.8 27.4 22.7 x xAge unknown . . . . . . . . . .
proportion of induced abortions across age groups 2
All ages . . . . . . . . . .
Under 20 years 20.9 18.3 23.3 25.3 x 24.1 22.6 19.2 x xUnder 15 years 0.4 0.8 0.5 1.1 x 1.1 1.0 0.8 x x15 to 19 years 20.4 17.5 22.9 24.2 23.2 23.1 21.6 18.3 17.1 16.2
15 to 17 years 8.2 6.6 8.9 8.5 10.7 9.0 7.8 5.8 7.4 5.518 to 19 years 12.2 11.0 14.0 15.7 12.6 14.0 13.8 12.5 9.7 10.6
20 to 24 years 38.2 37.4 38.2 37.1 38.1 38.5 34.7 41.8 35.5 39.225 to 29 years 18.5 22.2 19.0 19.3 18.2 19.5 22.5 20.7 21.1 19.030 to 34 years 12.0 12.0 9.5 10.9 11.4 9.9 11.1 10.9 13.4 15.235 to 39 years 5.9 5.8 6.9 5.3 6.6 6.1 6.3 4.8 9.3 7.140 years and over 2.8 2.6 3.2 2.1 x 1.8 2.8 2.6 x xAge unknown . . . . . . . . . .
1. For the 1994 to 1997 data years, a large number of abortions were reported to the Therapeutic Abortion Survey without any information on the age of thefemale. Age groups have now been estimated for induced abortions at the Canada, provincial and territorial level. As a result of these new estimations, anypreviously released age group statistics at the Canada level will not match the latest Canada level statistics.
2. Percentage distribution of induced abortions across age groups, excluding abortions with no reported age.Note(s): See "Data quality, concepts and methodology — Explanatory notes for the tables" section.Source(s): Statistics Canada, Canadian Vital Statistics, Birth Database and Demography Division (population estimates); Canadian Institute for Health Information,
Therapeutic Abortion Database (CANSIM table 106-9034).
18 Statistics Canada – Catalogue no. 82-223-X
Induced Abortion Statistics – 2005
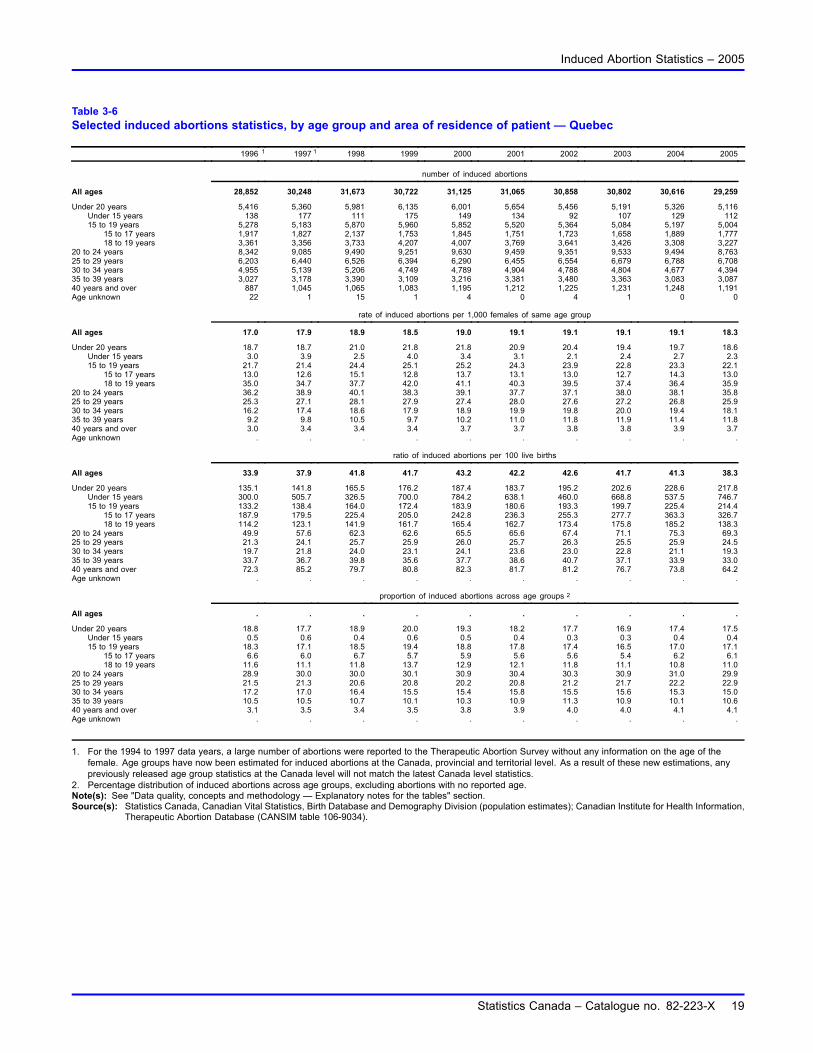
Table 3-6Selected induced abortions statistics, by age group and area of residence of patient — Quebec
1996 1 1997 1 1998 1999 2000 2001 2002 2003 2004 2005
number of induced abortions
All ages 28,852 30,248 31,673 30,722 31,125 31,065 30,858 30,802 30,616 29,259
Under 20 years 5,416 5,360 5,981 6,135 6,001 5,654 5,456 5,191 5,326 5,116Under 15 years 138 177 111 175 149 134 92 107 129 11215 to 19 years 5,278 5,183 5,870 5,960 5,852 5,520 5,364 5,084 5,197 5,004
15 to 17 years 1,917 1,827 2,137 1,753 1,845 1,751 1,723 1,658 1,889 1,77718 to 19 years 3,361 3,356 3,733 4,207 4,007 3,769 3,641 3,426 3,308 3,227
20 to 24 years 8,342 9,085 9,490 9,251 9,630 9,459 9,351 9,533 9,494 8,76325 to 29 years 6,203 6,440 6,526 6,394 6,290 6,455 6,554 6,679 6,788 6,70830 to 34 years 4,955 5,139 5,206 4,749 4,789 4,904 4,788 4,804 4,677 4,39435 to 39 years 3,027 3,178 3,390 3,109 3,216 3,381 3,480 3,363 3,083 3,08740 years and over 887 1,045 1,065 1,083 1,195 1,212 1,225 1,231 1,248 1,191Age unknown 22 1 15 1 4 0 4 1 0 0
rate of induced abortions per 1,000 females of same age group
All ages 17.0 17.9 18.9 18.5 19.0 19.1 19.1 19.1 19.1 18.3
Under 20 years 18.7 18.7 21.0 21.8 21.8 20.9 20.4 19.4 19.7 18.6Under 15 years 3.0 3.9 2.5 4.0 3.4 3.1 2.1 2.4 2.7 2.315 to 19 years 21.7 21.4 24.4 25.1 25.2 24.3 23.9 22.8 23.3 22.1
15 to 17 years 13.0 12.6 15.1 12.8 13.7 13.1 13.0 12.7 14.3 13.018 to 19 years 35.0 34.7 37.7 42.0 41.1 40.3 39.5 37.4 36.4 35.9
20 to 24 years 36.2 38.9 40.1 38.3 39.1 37.7 37.1 38.0 38.1 35.825 to 29 years 25.3 27.1 28.1 27.9 27.4 28.0 27.6 27.2 26.8 25.930 to 34 years 16.2 17.4 18.6 17.9 18.9 19.9 19.8 20.0 19.4 18.135 to 39 years 9.2 9.8 10.5 9.7 10.2 11.0 11.8 11.9 11.4 11.840 years and over 3.0 3.4 3.4 3.4 3.7 3.7 3.8 3.8 3.9 3.7Age unknown . . . . . . . . . .
ratio of induced abortions per 100 live births
All ages 33.9 37.9 41.8 41.7 43.2 42.2 42.6 41.7 41.3 38.3
Under 20 years 135.1 141.8 165.5 176.2 187.4 183.7 195.2 202.6 228.6 217.8Under 15 years 300.0 505.7 326.5 700.0 784.2 638.1 460.0 668.8 537.5 746.715 to 19 years 133.2 138.4 164.0 172.4 183.9 180.6 193.3 199.7 225.4 214.4
15 to 17 years 187.9 179.5 225.4 205.0 242.8 236.3 255.3 277.7 363.3 326.718 to 19 years 114.2 123.1 141.9 161.7 165.4 162.7 173.4 175.8 185.2 138.3
20 to 24 years 49.9 57.6 62.3 62.6 65.5 65.6 67.4 71.1 75.3 69.325 to 29 years 21.3 24.1 25.7 25.9 26.0 25.7 26.3 25.5 25.9 24.530 to 34 years 19.7 21.8 24.0 23.1 24.1 23.6 23.0 22.8 21.1 19.335 to 39 years 33.7 36.7 39.8 35.6 37.7 38.6 40.7 37.1 33.9 33.040 years and over 72.3 85.2 79.7 80.8 82.3 81.7 81.2 76.7 73.8 64.2Age unknown . . . . . . . . . .
proportion of induced abortions across age groups 2
All ages . . . . . . . . . .
Under 20 years 18.8 17.7 18.9 20.0 19.3 18.2 17.7 16.9 17.4 17.5Under 15 years 0.5 0.6 0.4 0.6 0.5 0.4 0.3 0.3 0.4 0.415 to 19 years 18.3 17.1 18.5 19.4 18.8 17.8 17.4 16.5 17.0 17.1
15 to 17 years 6.6 6.0 6.7 5.7 5.9 5.6 5.6 5.4 6.2 6.118 to 19 years 11.6 11.1 11.8 13.7 12.9 12.1 11.8 11.1 10.8 11.0
20 to 24 years 28.9 30.0 30.0 30.1 30.9 30.4 30.3 30.9 31.0 29.925 to 29 years 21.5 21.3 20.6 20.8 20.2 20.8 21.2 21.7 22.2 22.930 to 34 years 17.2 17.0 16.4 15.5 15.4 15.8 15.5 15.6 15.3 15.035 to 39 years 10.5 10.5 10.7 10.1 10.3 10.9 11.3 10.9 10.1 10.640 years and over 3.1 3.5 3.4 3.5 3.8 3.9 4.0 4.0 4.1 4.1Age unknown . . . . . . . . . .
1. For the 1994 to 1997 data years, a large number of abortions were reported to the Therapeutic Abortion Survey without any information on the age of thefemale. Age groups have now been estimated for induced abortions at the Canada, provincial and territorial level. As a result of these new estimations, anypreviously released age group statistics at the Canada level will not match the latest Canada level statistics.
2. Percentage distribution of induced abortions across age groups, excluding abortions with no reported age.Note(s): See "Data quality, concepts and methodology — Explanatory notes for the tables" section.Source(s): Statistics Canada, Canadian Vital Statistics, Birth Database and Demography Division (population estimates); Canadian Institute for Health Information,
Therapeutic Abortion Database (CANSIM table 106-9034).
Statistics Canada – Catalogue no. 82-223-X 19
Induced Abortion Statistics – 2005
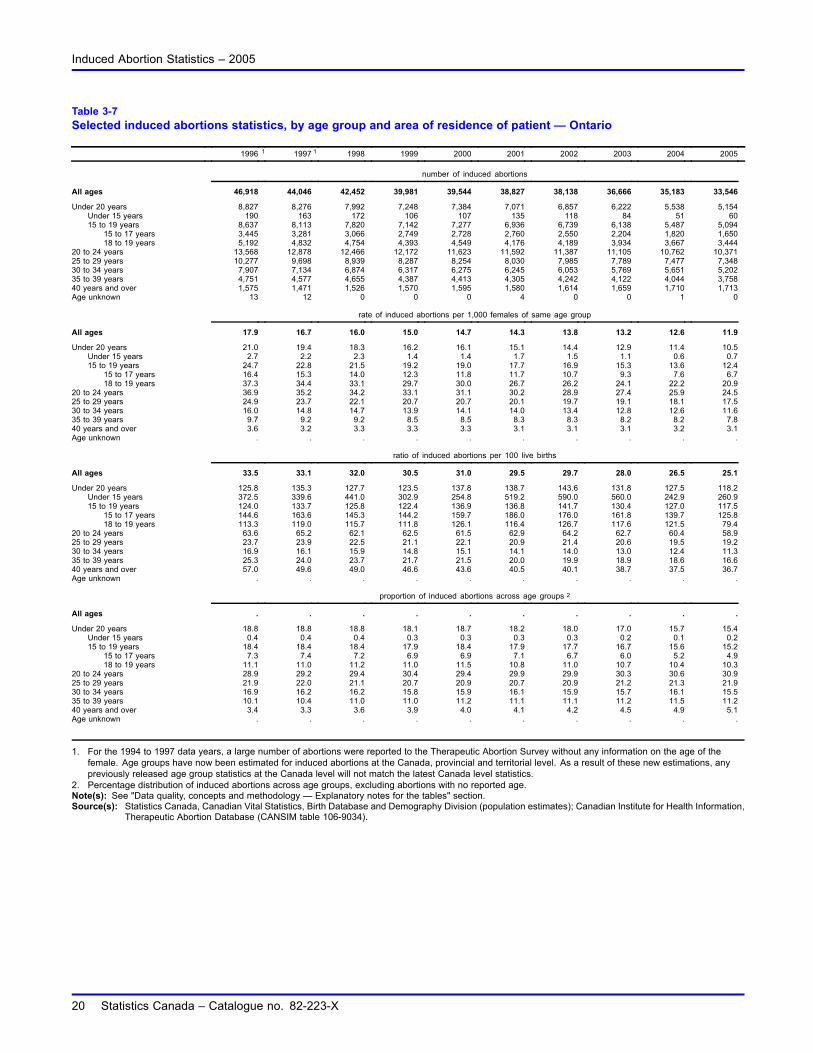
Table 3-7Selected induced abortions statistics, by age group and area of residence of patient — Ontario
1996 1 1997 1 1998 1999 2000 2001 2002 2003 2004 2005
number of induced abortions
All ages 46,918 44,046 42,452 39,981 39,544 38,827 38,138 36,666 35,183 33,546
Under 20 years 8,827 8,276 7,992 7,248 7,384 7,071 6,857 6,222 5,538 5,154Under 15 years 190 163 172 106 107 135 118 84 51 6015 to 19 years 8,637 8,113 7,820 7,142 7,277 6,936 6,739 6,138 5,487 5,094
15 to 17 years 3,445 3,281 3,066 2,749 2,728 2,760 2,550 2,204 1,820 1,65018 to 19 years 5,192 4,832 4,754 4,393 4,549 4,176 4,189 3,934 3,667 3,444
20 to 24 years 13,568 12,878 12,466 12,172 11,623 11,592 11,387 11,105 10,762 10,37125 to 29 years 10,277 9,698 8,939 8,287 8,254 8,030 7,985 7,789 7,477 7,34830 to 34 years 7,907 7,134 6,874 6,317 6,275 6,245 6,053 5,769 5,651 5,20235 to 39 years 4,751 4,577 4,655 4,387 4,413 4,305 4,242 4,122 4,044 3,75840 years and over 1,575 1,471 1,526 1,570 1,595 1,580 1,614 1,659 1,710 1,713Age unknown 13 12 0 0 0 4 0 0 1 0
rate of induced abortions per 1,000 females of same age group
All ages 17.9 16.7 16.0 15.0 14.7 14.3 13.8 13.2 12.6 11.9
Under 20 years 21.0 19.4 18.3 16.2 16.1 15.1 14.4 12.9 11.4 10.5Under 15 years 2.7 2.2 2.3 1.4 1.4 1.7 1.5 1.1 0.6 0.715 to 19 years 24.7 22.8 21.5 19.2 19.0 17.7 16.9 15.3 13.6 12.4
15 to 17 years 16.4 15.3 14.0 12.3 11.8 11.7 10.7 9.3 7.6 6.718 to 19 years 37.3 34.4 33.1 29.7 30.0 26.7 26.2 24.1 22.2 20.9
20 to 24 years 36.9 35.2 34.2 33.1 31.1 30.2 28.9 27.4 25.9 24.525 to 29 years 24.9 23.7 22.1 20.7 20.7 20.1 19.7 19.1 18.1 17.530 to 34 years 16.0 14.8 14.7 13.9 14.1 14.0 13.4 12.8 12.6 11.635 to 39 years 9.7 9.2 9.2 8.5 8.5 8.3 8.3 8.2 8.2 7.840 years and over 3.6 3.2 3.3 3.3 3.3 3.1 3.1 3.1 3.2 3.1Age unknown . . . . . . . . . .
ratio of induced abortions per 100 live births
All ages 33.5 33.1 32.0 30.5 31.0 29.5 29.7 28.0 26.5 25.1
Under 20 years 125.8 135.3 127.7 123.5 137.8 138.7 143.6 131.8 127.5 118.2Under 15 years 372.5 339.6 441.0 302.9 254.8 519.2 590.0 560.0 242.9 260.915 to 19 years 124.0 133.7 125.8 122.4 136.9 136.8 141.7 130.4 127.0 117.5
15 to 17 years 144.6 163.6 145.3 144.2 159.7 186.0 176.0 161.8 139.7 125.818 to 19 years 113.3 119.0 115.7 111.8 126.1 116.4 126.7 117.6 121.5 79.4
20 to 24 years 63.6 65.2 62.1 62.5 61.5 62.9 64.2 62.7 60.4 58.925 to 29 years 23.7 23.9 22.5 21.1 22.1 20.9 21.4 20.6 19.5 19.230 to 34 years 16.9 16.1 15.9 14.8 15.1 14.1 14.0 13.0 12.4 11.335 to 39 years 25.3 24.0 23.7 21.7 21.5 20.0 19.9 18.9 18.6 16.640 years and over 57.0 49.6 49.0 46.6 43.6 40.5 40.1 38.7 37.5 36.7Age unknown . . . . . . . . . .
proportion of induced abortions across age groups 2
All ages . . . . . . . . . .
Under 20 years 18.8 18.8 18.8 18.1 18.7 18.2 18.0 17.0 15.7 15.4Under 15 years 0.4 0.4 0.4 0.3 0.3 0.3 0.3 0.2 0.1 0.215 to 19 years 18.4 18.4 18.4 17.9 18.4 17.9 17.7 16.7 15.6 15.2
15 to 17 years 7.3 7.4 7.2 6.9 6.9 7.1 6.7 6.0 5.2 4.918 to 19 years 11.1 11.0 11.2 11.0 11.5 10.8 11.0 10.7 10.4 10.3
20 to 24 years 28.9 29.2 29.4 30.4 29.4 29.9 29.9 30.3 30.6 30.925 to 29 years 21.9 22.0 21.1 20.7 20.9 20.7 20.9 21.2 21.3 21.930 to 34 years 16.9 16.2 16.2 15.8 15.9 16.1 15.9 15.7 16.1 15.535 to 39 years 10.1 10.4 11.0 11.0 11.2 11.1 11.1 11.2 11.5 11.240 years and over 3.4 3.3 3.6 3.9 4.0 4.1 4.2 4.5 4.9 5.1Age unknown . . . . . . . . . .
1. For the 1994 to 1997 data years, a large number of abortions were reported to the Therapeutic Abortion Survey without any information on the age of thefemale. Age groups have now been estimated for induced abortions at the Canada, provincial and territorial level. As a result of these new estimations, anypreviously released age group statistics at the Canada level will not match the latest Canada level statistics.
2. Percentage distribution of induced abortions across age groups, excluding abortions with no reported age.Note(s): See "Data quality, concepts and methodology — Explanatory notes for the tables" section.Source(s): Statistics Canada, Canadian Vital Statistics, Birth Database and Demography Division (population estimates); Canadian Institute for Health Information,
Therapeutic Abortion Database (CANSIM table 106-9034).
20 Statistics Canada – Catalogue no. 82-223-X
Induced Abortion Statistics – 2005
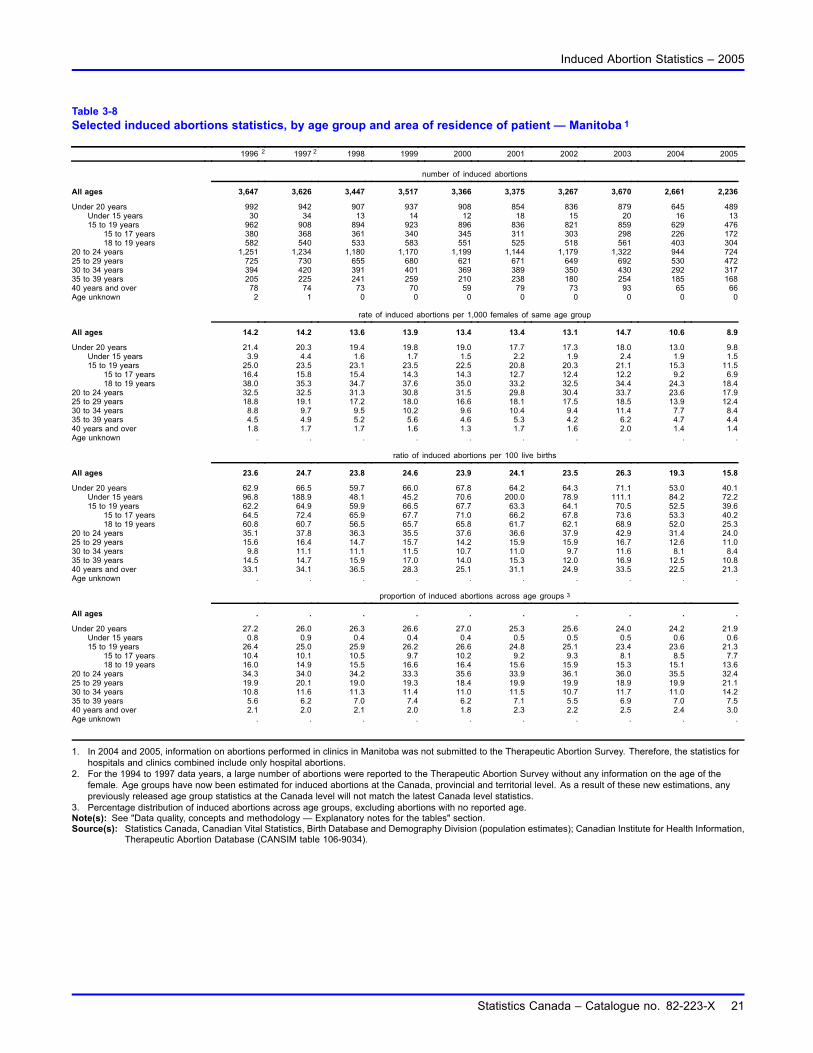
Table 3-8Selected induced abortions statistics, by age group and area of residence of patient — Manitoba 1
1996 2 1997 2 1998 1999 2000 2001 2002 2003 2004 2005
number of induced abortions
All ages 3,647 3,626 3,447 3,517 3,366 3,375 3,267 3,670 2,661 2,236
Under 20 years 992 942 907 937 908 854 836 879 645 489Under 15 years 30 34 13 14 12 18 15 20 16 1315 to 19 years 962 908 894 923 896 836 821 859 629 476
15 to 17 years 380 368 361 340 345 311 303 298 226 17218 to 19 years 582 540 533 583 551 525 518 561 403 304
20 to 24 years 1,251 1,234 1,180 1,170 1,199 1,144 1,179 1,322 944 72425 to 29 years 725 730 655 680 621 671 649 692 530 47230 to 34 years 394 420 391 401 369 389 350 430 292 31735 to 39 years 205 225 241 259 210 238 180 254 185 16840 years and over 78 74 73 70 59 79 73 93 65 66Age unknown 2 1 0 0 0 0 0 0 0 0
rate of induced abortions per 1,000 females of same age group
All ages 14.2 14.2 13.6 13.9 13.4 13.4 13.1 14.7 10.6 8.9
Under 20 years 21.4 20.3 19.4 19.8 19.0 17.7 17.3 18.0 13.0 9.8Under 15 years 3.9 4.4 1.6 1.7 1.5 2.2 1.9 2.4 1.9 1.515 to 19 years 25.0 23.5 23.1 23.5 22.5 20.8 20.3 21.1 15.3 11.5
15 to 17 years 16.4 15.8 15.4 14.3 14.3 12.7 12.4 12.2 9.2 6.918 to 19 years 38.0 35.3 34.7 37.6 35.0 33.2 32.5 34.4 24.3 18.4
20 to 24 years 32.5 32.5 31.3 30.8 31.5 29.8 30.4 33.7 23.6 17.925 to 29 years 18.8 19.1 17.2 18.0 16.6 18.1 17.5 18.5 13.9 12.430 to 34 years 8.8 9.7 9.5 10.2 9.6 10.4 9.4 11.4 7.7 8.435 to 39 years 4.5 4.9 5.2 5.6 4.6 5.3 4.2 6.2 4.7 4.440 years and over 1.8 1.7 1.7 1.6 1.3 1.7 1.6 2.0 1.4 1.4Age unknown . . . . . . . . . .
ratio of induced abortions per 100 live births
All ages 23.6 24.7 23.8 24.6 23.9 24.1 23.5 26.3 19.3 15.8
Under 20 years 62.9 66.5 59.7 66.0 67.8 64.2 64.3 71.1 53.0 40.1Under 15 years 96.8 188.9 48.1 45.2 70.6 200.0 78.9 111.1 84.2 72.215 to 19 years 62.2 64.9 59.9 66.5 67.7 63.3 64.1 70.5 52.5 39.6
15 to 17 years 64.5 72.4 65.9 67.7 71.0 66.2 67.8 73.6 53.3 40.218 to 19 years 60.8 60.7 56.5 65.7 65.8 61.7 62.1 68.9 52.0 25.3
20 to 24 years 35.1 37.8 36.3 35.5 37.6 36.6 37.9 42.9 31.4 24.025 to 29 years 15.6 16.4 14.7 15.7 14.2 15.9 15.9 16.7 12.6 11.030 to 34 years 9.8 11.1 11.1 11.5 10.7 11.0 9.7 11.6 8.1 8.435 to 39 years 14.5 14.7 15.9 17.0 14.0 15.3 12.0 16.9 12.5 10.840 years and over 33.1 34.1 36.5 28.3 25.1 31.1 24.9 33.5 22.5 21.3Age unknown . . . . . . . . . .
proportion of induced abortions across age groups 3
All ages . . . . . . . . . .
Under 20 years 27.2 26.0 26.3 26.6 27.0 25.3 25.6 24.0 24.2 21.9Under 15 years 0.8 0.9 0.4 0.4 0.4 0.5 0.5 0.5 0.6 0.615 to 19 years 26.4 25.0 25.9 26.2 26.6 24.8 25.1 23.4 23.6 21.3
15 to 17 years 10.4 10.1 10.5 9.7 10.2 9.2 9.3 8.1 8.5 7.718 to 19 years 16.0 14.9 15.5 16.6 16.4 15.6 15.9 15.3 15.1 13.6
20 to 24 years 34.3 34.0 34.2 33.3 35.6 33.9 36.1 36.0 35.5 32.425 to 29 years 19.9 20.1 19.0 19.3 18.4 19.9 19.9 18.9 19.9 21.130 to 34 years 10.8 11.6 11.3 11.4 11.0 11.5 10.7 11.7 11.0 14.235 to 39 years 5.6 6.2 7.0 7.4 6.2 7.1 5.5 6.9 7.0 7.540 years and over 2.1 2.0 2.1 2.0 1.8 2.3 2.2 2.5 2.4 3.0Age unknown . . . . . . . . . .
1. In 2004 and 2005, information on abortions performed in clinics in Manitoba was not submitted to the Therapeutic Abortion Survey. Therefore, the statistics forhospitals and clinics combined include only hospital abortions.
2. For the 1994 to 1997 data years, a large number of abortions were reported to the Therapeutic Abortion Survey without any information on the age of thefemale. Age groups have now been estimated for induced abortions at the Canada, provincial and territorial level. As a result of these new estimations, anypreviously released age group statistics at the Canada level will not match the latest Canada level statistics.
3. Percentage distribution of induced abortions across age groups, excluding abortions with no reported age.Note(s): See "Data quality, concepts and methodology — Explanatory notes for the tables" section.Source(s): Statistics Canada, Canadian Vital Statistics, Birth Database and Demography Division (population estimates); Canadian Institute for Health Information,
Therapeutic Abortion Database (CANSIM table 106-9034).
Statistics Canada – Catalogue no. 82-223-X 21
Induced Abortion Statistics – 2005
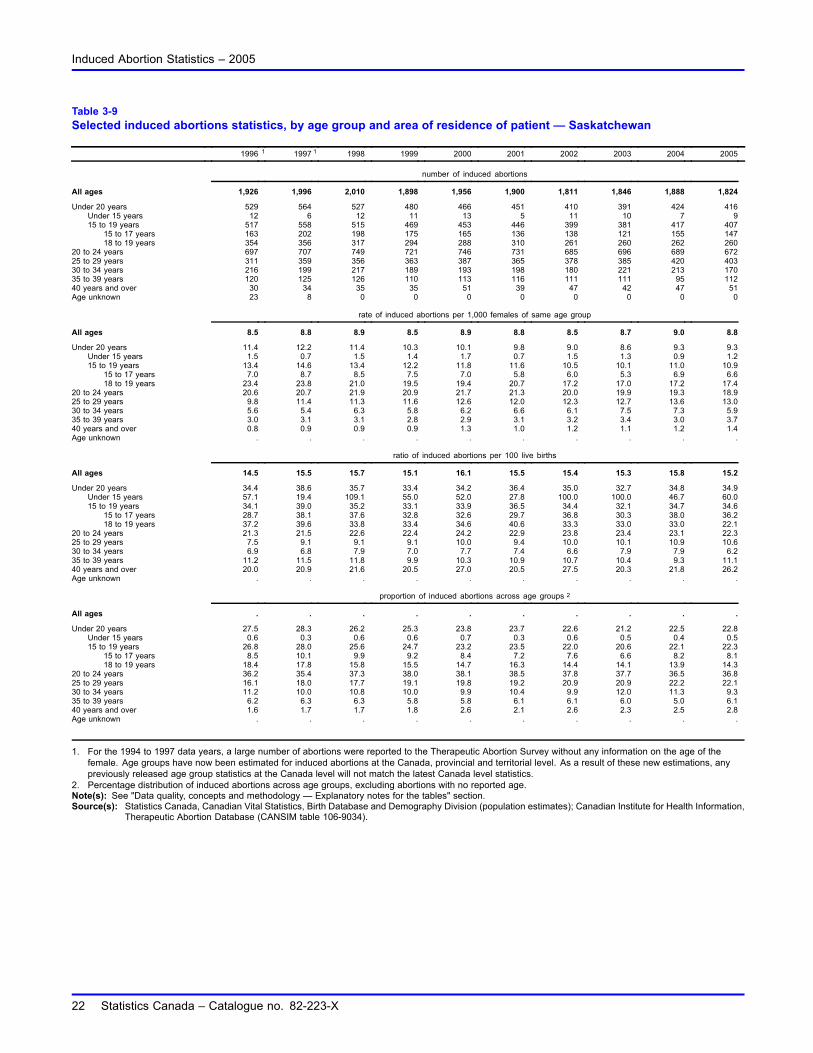
Table 3-9Selected induced abortions statistics, by age group and area of residence of patient — Saskatchewan
1996 1 1997 1 1998 1999 2000 2001 2002 2003 2004 2005
number of induced abortions
All ages 1,926 1,996 2,010 1,898 1,956 1,900 1,811 1,846 1,888 1,824
Under 20 years 529 564 527 480 466 451 410 391 424 416Under 15 years 12 6 12 11 13 5 11 10 7 915 to 19 years 517 558 515 469 453 446 399 381 417 407
15 to 17 years 163 202 198 175 165 136 138 121 155 14718 to 19 years 354 356 317 294 288 310 261 260 262 260
20 to 24 years 697 707 749 721 746 731 685 696 689 67225 to 29 years 311 359 356 363 387 365 378 385 420 40330 to 34 years 216 199 217 189 193 198 180 221 213 17035 to 39 years 120 125 126 110 113 116 111 111 95 11240 years and over 30 34 35 35 51 39 47 42 47 51Age unknown 23 8 0 0 0 0 0 0 0 0
rate of induced abortions per 1,000 females of same age group
All ages 8.5 8.8 8.9 8.5 8.9 8.8 8.5 8.7 9.0 8.8
Under 20 years 11.4 12.2 11.4 10.3 10.1 9.8 9.0 8.6 9.3 9.3Under 15 years 1.5 0.7 1.5 1.4 1.7 0.7 1.5 1.3 0.9 1.215 to 19 years 13.4 14.6 13.4 12.2 11.8 11.6 10.5 10.1 11.0 10.9
15 to 17 years 7.0 8.7 8.5 7.5 7.0 5.8 6.0 5.3 6.9 6.618 to 19 years 23.4 23.8 21.0 19.5 19.4 20.7 17.2 17.0 17.2 17.4
20 to 24 years 20.6 20.7 21.9 20.9 21.7 21.3 20.0 19.9 19.3 18.925 to 29 years 9.8 11.4 11.3 11.6 12.6 12.0 12.3 12.7 13.6 13.030 to 34 years 5.6 5.4 6.3 5.8 6.2 6.6 6.1 7.5 7.3 5.935 to 39 years 3.0 3.1 3.1 2.8 2.9 3.1 3.2 3.4 3.0 3.740 years and over 0.8 0.9 0.9 0.9 1.3 1.0 1.2 1.1 1.2 1.4Age unknown . . . . . . . . . .
ratio of induced abortions per 100 live births
All ages 14.5 15.5 15.7 15.1 16.1 15.5 15.4 15.3 15.8 15.2
Under 20 years 34.4 38.6 35.7 33.4 34.2 36.4 35.0 32.7 34.8 34.9Under 15 years 57.1 19.4 109.1 55.0 52.0 27.8 100.0 100.0 46.7 60.015 to 19 years 34.1 39.0 35.2 33.1 33.9 36.5 34.4 32.1 34.7 34.6
15 to 17 years 28.7 38.1 37.6 32.8 32.6 29.7 36.8 30.3 38.0 36.218 to 19 years 37.2 39.6 33.8 33.4 34.6 40.6 33.3 33.0 33.0 22.1
20 to 24 years 21.3 21.5 22.6 22.4 24.2 22.9 23.8 23.4 23.1 22.325 to 29 years 7.5 9.1 9.1 9.1 10.0 9.4 10.0 10.1 10.9 10.630 to 34 years 6.9 6.8 7.9 7.0 7.7 7.4 6.6 7.9 7.9 6.235 to 39 years 11.2 11.5 11.8 9.9 10.3 10.9 10.7 10.4 9.3 11.140 years and over 20.0 20.9 21.6 20.5 27.0 20.5 27.5 20.3 21.8 26.2Age unknown . . . . . . . . . .
proportion of induced abortions across age groups 2
All ages . . . . . . . . . .
Under 20 years 27.5 28.3 26.2 25.3 23.8 23.7 22.6 21.2 22.5 22.8Under 15 years 0.6 0.3 0.6 0.6 0.7 0.3 0.6 0.5 0.4 0.515 to 19 years 26.8 28.0 25.6 24.7 23.2 23.5 22.0 20.6 22.1 22.3
15 to 17 years 8.5 10.1 9.9 9.2 8.4 7.2 7.6 6.6 8.2 8.118 to 19 years 18.4 17.8 15.8 15.5 14.7 16.3 14.4 14.1 13.9 14.3
20 to 24 years 36.2 35.4 37.3 38.0 38.1 38.5 37.8 37.7 36.5 36.825 to 29 years 16.1 18.0 17.7 19.1 19.8 19.2 20.9 20.9 22.2 22.130 to 34 years 11.2 10.0 10.8 10.0 9.9 10.4 9.9 12.0 11.3 9.335 to 39 years 6.2 6.3 6.3 5.8 5.8 6.1 6.1 6.0 5.0 6.140 years and over 1.6 1.7 1.7 1.8 2.6 2.1 2.6 2.3 2.5 2.8Age unknown . . . . . . . . . .
1. For the 1994 to 1997 data years, a large number of abortions were reported to the Therapeutic Abortion Survey without any information on the age of thefemale. Age groups have now been estimated for induced abortions at the Canada, provincial and territorial level. As a result of these new estimations, anypreviously released age group statistics at the Canada level will not match the latest Canada level statistics.
2. Percentage distribution of induced abortions across age groups, excluding abortions with no reported age.Note(s): See "Data quality, concepts and methodology — Explanatory notes for the tables" section.Source(s): Statistics Canada, Canadian Vital Statistics, Birth Database and Demography Division (population estimates); Canadian Institute for Health Information,
Therapeutic Abortion Database (CANSIM table 106-9034).
22 Statistics Canada – Catalogue no. 82-223-X
Induced Abortion Statistics – 2005
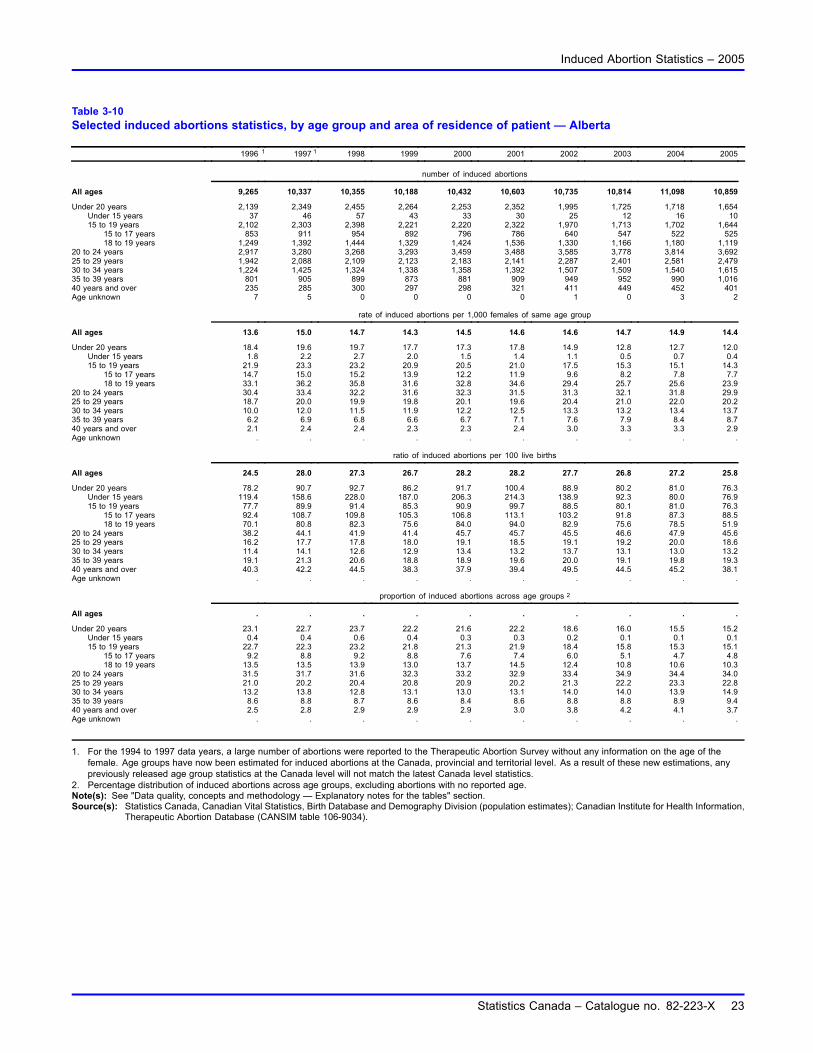
Table 3-10Selected induced abortions statistics, by age group and area of residence of patient — Alberta
1996 1 1997 1 1998 1999 2000 2001 2002 2003 2004 2005
number of induced abortions
All ages 9,265 10,337 10,355 10,188 10,432 10,603 10,735 10,814 11,098 10,859
Under 20 years 2,139 2,349 2,455 2,264 2,253 2,352 1,995 1,725 1,718 1,654Under 15 years 37 46 57 43 33 30 25 12 16 1015 to 19 years 2,102 2,303 2,398 2,221 2,220 2,322 1,970 1,713 1,702 1,644
15 to 17 years 853 911 954 892 796 786 640 547 522 52518 to 19 years 1,249 1,392 1,444 1,329 1,424 1,536 1,330 1,166 1,180 1,119
20 to 24 years 2,917 3,280 3,268 3,293 3,459 3,488 3,585 3,778 3,814 3,69225 to 29 years 1,942 2,088 2,109 2,123 2,183 2,141 2,287 2,401 2,581 2,47930 to 34 years 1,224 1,425 1,324 1,338 1,358 1,392 1,507 1,509 1,540 1,61535 to 39 years 801 905 899 873 881 909 949 952 990 1,01640 years and over 235 285 300 297 298 321 411 449 452 401Age unknown 7 5 0 0 0 0 1 0 3 2
rate of induced abortions per 1,000 females of same age group
All ages 13.6 15.0 14.7 14.3 14.5 14.6 14.6 14.7 14.9 14.4
Under 20 years 18.4 19.6 19.7 17.7 17.3 17.8 14.9 12.8 12.7 12.0Under 15 years 1.8 2.2 2.7 2.0 1.5 1.4 1.1 0.5 0.7 0.415 to 19 years 21.9 23.3 23.2 20.9 20.5 21.0 17.5 15.3 15.1 14.3
15 to 17 years 14.7 15.0 15.2 13.9 12.2 11.9 9.6 8.2 7.8 7.718 to 19 years 33.1 36.2 35.8 31.6 32.8 34.6 29.4 25.7 25.6 23.9
20 to 24 years 30.4 33.4 32.2 31.6 32.3 31.5 31.3 32.1 31.8 29.925 to 29 years 18.7 20.0 19.9 19.8 20.1 19.6 20.4 21.0 22.0 20.230 to 34 years 10.0 12.0 11.5 11.9 12.2 12.5 13.3 13.2 13.4 13.735 to 39 years 6.2 6.9 6.8 6.6 6.7 7.1 7.6 7.9 8.4 8.740 years and over 2.1 2.4 2.4 2.3 2.3 2.4 3.0 3.3 3.3 2.9Age unknown . . . . . . . . . .
ratio of induced abortions per 100 live births
All ages 24.5 28.0 27.3 26.7 28.2 28.2 27.7 26.8 27.2 25.8
Under 20 years 78.2 90.7 92.7 86.2 91.7 100.4 88.9 80.2 81.0 76.3Under 15 years 119.4 158.6 228.0 187.0 206.3 214.3 138.9 92.3 80.0 76.915 to 19 years 77.7 89.9 91.4 85.3 90.9 99.7 88.5 80.1 81.0 76.3
15 to 17 years 92.4 108.7 109.8 105.3 106.8 113.1 103.2 91.8 87.3 88.518 to 19 years 70.1 80.8 82.3 75.6 84.0 94.0 82.9 75.6 78.5 51.9
20 to 24 years 38.2 44.1 41.9 41.4 45.7 45.7 45.5 46.6 47.9 45.625 to 29 years 16.2 17.7 17.8 18.0 19.1 18.5 19.1 19.2 20.0 18.630 to 34 years 11.4 14.1 12.6 12.9 13.4 13.2 13.7 13.1 13.0 13.235 to 39 years 19.1 21.3 20.6 18.8 18.9 19.6 20.0 19.1 19.8 19.340 years and over 40.3 42.2 44.5 38.3 37.9 39.4 49.5 44.5 45.2 38.1Age unknown . . . . . . . . . .
proportion of induced abortions across age groups 2
All ages . . . . . . . . . .
Under 20 years 23.1 22.7 23.7 22.2 21.6 22.2 18.6 16.0 15.5 15.2Under 15 years 0.4 0.4 0.6 0.4 0.3 0.3 0.2 0.1 0.1 0.115 to 19 years 22.7 22.3 23.2 21.8 21.3 21.9 18.4 15.8 15.3 15.1
15 to 17 years 9.2 8.8 9.2 8.8 7.6 7.4 6.0 5.1 4.7 4.818 to 19 years 13.5 13.5 13.9 13.0 13.7 14.5 12.4 10.8 10.6 10.3
20 to 24 years 31.5 31.7 31.6 32.3 33.2 32.9 33.4 34.9 34.4 34.025 to 29 years 21.0 20.2 20.4 20.8 20.9 20.2 21.3 22.2 23.3 22.830 to 34 years 13.2 13.8 12.8 13.1 13.0 13.1 14.0 14.0 13.9 14.935 to 39 years 8.6 8.8 8.7 8.6 8.4 8.6 8.8 8.8 8.9 9.440 years and over 2.5 2.8 2.9 2.9 2.9 3.0 3.8 4.2 4.1 3.7Age unknown . . . . . . . . . .
1. For the 1994 to 1997 data years, a large number of abortions were reported to the Therapeutic Abortion Survey without any information on the age of thefemale. Age groups have now been estimated for induced abortions at the Canada, provincial and territorial level. As a result of these new estimations, anypreviously released age group statistics at the Canada level will not match the latest Canada level statistics.
2. Percentage distribution of induced abortions across age groups, excluding abortions with no reported age.Note(s): See "Data quality, concepts and methodology — Explanatory notes for the tables" section.Source(s): Statistics Canada, Canadian Vital Statistics, Birth Database and Demography Division (population estimates); Canadian Institute for Health Information,
Therapeutic Abortion Database (CANSIM table 106-9034).
Statistics Canada – Catalogue no. 82-223-X 23
Induced Abortion Statistics – 2005
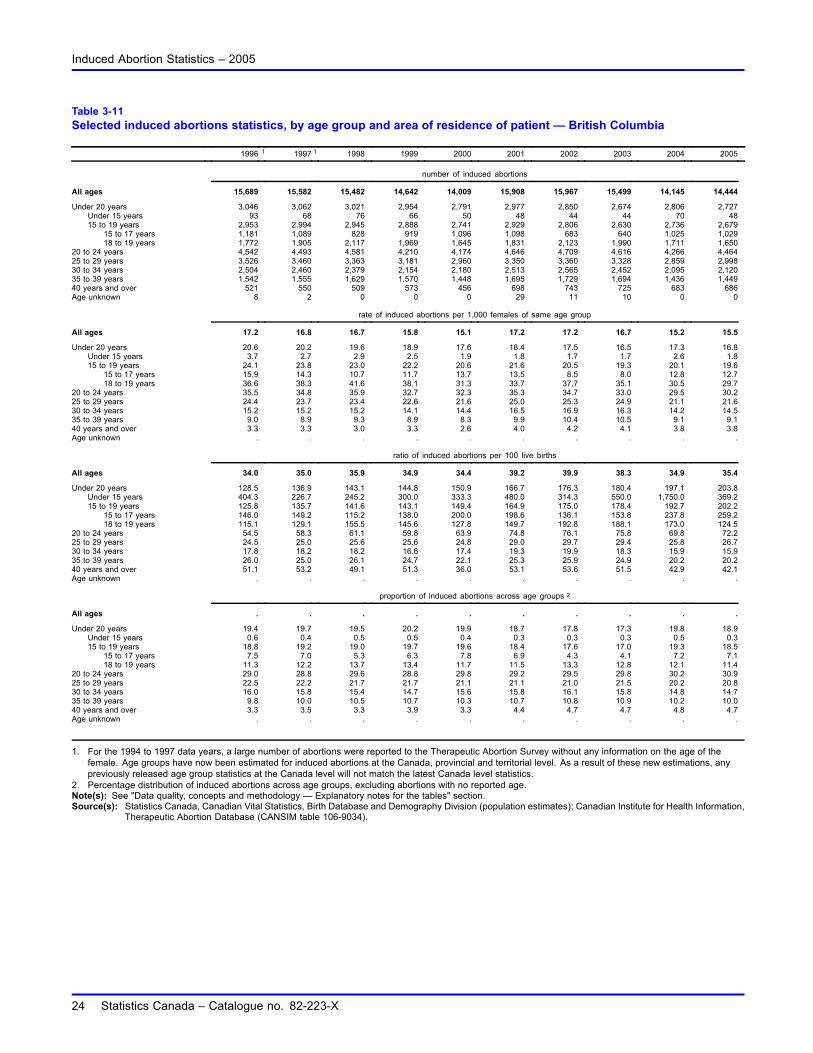
Table 3-11Selected induced abortions statistics, by age group and area of residence of patient — British Columbia
1996 1 1997 1 1998 1999 2000 2001 2002 2003 2004 2005
number of induced abortions
All ages 15,689 15,582 15,482 14,642 14,009 15,908 15,967 15,499 14,145 14,444
Under 20 years 3,046 3,062 3,021 2,954 2,791 2,977 2,850 2,674 2,806 2,727Under 15 years 93 68 76 66 50 48 44 44 70 4815 to 19 years 2,953 2,994 2,945 2,888 2,741 2,929 2,806 2,630 2,736 2,679
15 to 17 years 1,181 1,089 828 919 1,096 1,098 683 640 1,025 1,02918 to 19 years 1,772 1,905 2,117 1,969 1,645 1,831 2,123 1,990 1,711 1,650
20 to 24 years 4,542 4,493 4,581 4,210 4,174 4,646 4,709 4,616 4,266 4,46425 to 29 years 3,526 3,460 3,363 3,181 2,960 3,350 3,360 3,328 2,859 2,99830 to 34 years 2,504 2,460 2,379 2,154 2,180 2,513 2,565 2,452 2,095 2,12035 to 39 years 1,542 1,555 1,629 1,570 1,448 1,695 1,729 1,694 1,436 1,44940 years and over 521 550 509 573 456 698 743 725 683 686Age unknown 8 2 0 0 0 29 11 10 0 0
rate of induced abortions per 1,000 females of same age group
All ages 17.2 16.8 16.7 15.8 15.1 17.2 17.2 16.7 15.2 15.5
Under 20 years 20.6 20.2 19.6 18.9 17.6 18.4 17.5 16.5 17.3 16.8Under 15 years 3.7 2.7 2.9 2.5 1.9 1.8 1.7 1.7 2.6 1.815 to 19 years 24.1 23.8 23.0 22.2 20.6 21.6 20.5 19.3 20.1 19.6
15 to 17 years 15.9 14.3 10.7 11.7 13.7 13.5 8.5 8.0 12.8 12.718 to 19 years 36.6 38.3 41.6 38.1 31.3 33.7 37.7 35.1 30.5 29.7
20 to 24 years 35.5 34.8 35.9 32.7 32.3 35.3 34.7 33.0 29.5 30.225 to 29 years 24.4 23.7 23.4 22.6 21.6 25.0 25.3 24.9 21.1 21.630 to 34 years 15.2 15.2 15.2 14.1 14.4 16.5 16.9 16.3 14.2 14.535 to 39 years 9.0 8.9 9.3 8.9 8.3 9.9 10.4 10.5 9.1 9.140 years and over 3.3 3.3 3.0 3.3 2.6 4.0 4.2 4.1 3.8 3.8Age unknown . . . . . . . . . .
ratio of induced abortions per 100 live births
All ages 34.0 35.0 35.9 34.9 34.4 39.2 39.9 38.3 34.9 35.4
Under 20 years 128.5 136.9 143.1 144.8 150.9 166.7 176.3 180.4 197.1 203.8Under 15 years 404.3 226.7 245.2 300.0 333.3 480.0 314.3 550.0 1,750.0 369.215 to 19 years 125.8 135.7 141.6 143.1 149.4 164.9 175.0 178.4 192.7 202.2
15 to 17 years 146.0 149.2 115.2 138.0 200.0 198.6 136.1 153.8 237.8 259.218 to 19 years 115.1 129.1 155.5 145.6 127.8 149.7 192.8 188.1 173.0 124.5
20 to 24 years 54.5 58.3 61.1 59.8 63.9 74.8 76.1 75.8 69.8 72.225 to 29 years 24.5 25.0 25.6 25.6 24.8 29.0 29.7 29.4 25.8 26.730 to 34 years 17.8 18.2 18.2 16.6 17.4 19.3 19.9 18.3 15.9 15.935 to 39 years 26.0 25.0 26.1 24.7 22.1 25.3 25.9 24.9 20.2 20.240 years and over 51.1 53.2 49.1 51.3 36.0 53.1 53.6 51.5 42.9 42.1Age unknown . . . . . . . . . .
proportion of induced abortions across age groups 2
All ages . . . . . . . . . .
Under 20 years 19.4 19.7 19.5 20.2 19.9 18.7 17.8 17.3 19.8 18.9Under 15 years 0.6 0.4 0.5 0.5 0.4 0.3 0.3 0.3 0.5 0.315 to 19 years 18.8 19.2 19.0 19.7 19.6 18.4 17.6 17.0 19.3 18.5
15 to 17 years 7.5 7.0 5.3 6.3 7.8 6.9 4.3 4.1 7.2 7.118 to 19 years 11.3 12.2 13.7 13.4 11.7 11.5 13.3 12.8 12.1 11.4
20 to 24 years 29.0 28.8 29.6 28.8 29.8 29.2 29.5 29.8 30.2 30.925 to 29 years 22.5 22.2 21.7 21.7 21.1 21.1 21.0 21.5 20.2 20.830 to 34 years 16.0 15.8 15.4 14.7 15.6 15.8 16.1 15.8 14.8 14.735 to 39 years 9.8 10.0 10.5 10.7 10.3 10.7 10.8 10.9 10.2 10.040 years and over 3.3 3.5 3.3 3.9 3.3 4.4 4.7 4.7 4.8 4.7Age unknown . . . . . . . . . .
1. For the 1994 to 1997 data years, a large number of abortions were reported to the Therapeutic Abortion Survey without any information on the age of thefemale. Age groups have now been estimated for induced abortions at the Canada, provincial and territorial level. As a result of these new estimations, anypreviously released age group statistics at the Canada level will not match the latest Canada level statistics.
2. Percentage distribution of induced abortions across age groups, excluding abortions with no reported age.Note(s): See "Data quality, concepts and methodology — Explanatory notes for the tables" section.Source(s): Statistics Canada, Canadian Vital Statistics, Birth Database and Demography Division (population estimates); Canadian Institute for Health Information,
Therapeutic Abortion Database (CANSIM table 106-9034).
24 Statistics Canada – Catalogue no. 82-223-X
Induced Abortion Statistics – 2005
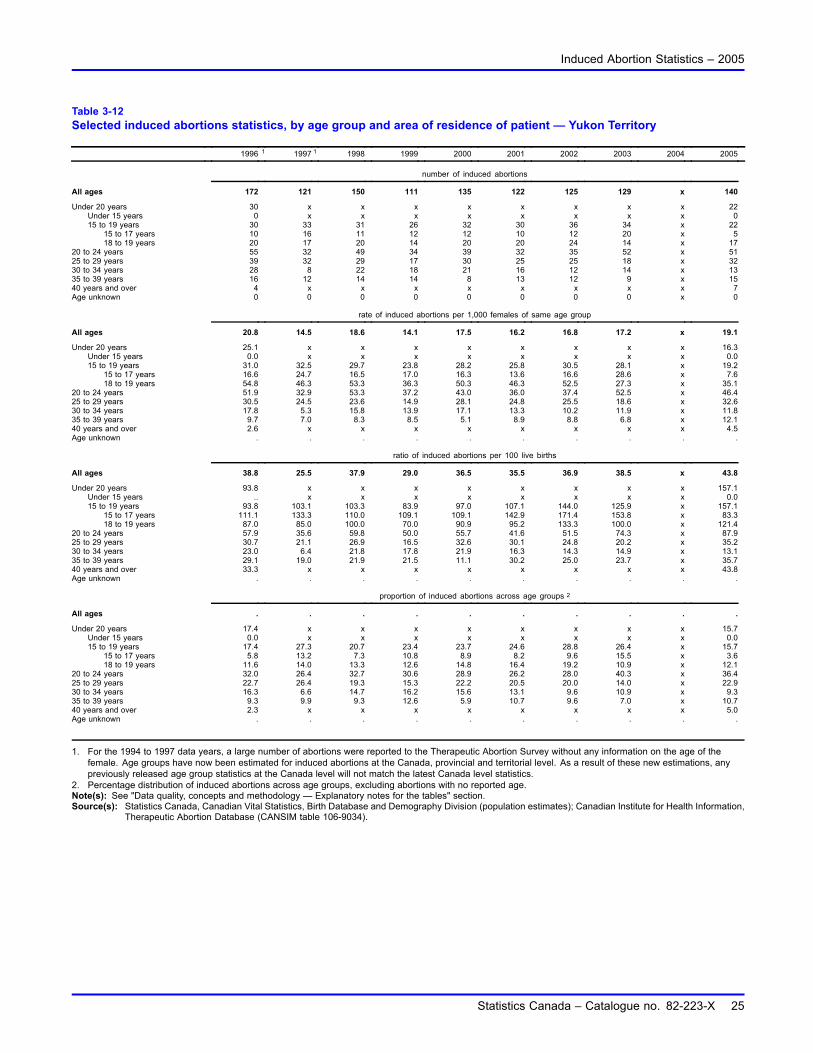
Table 3-12Selected induced abortions statistics, by age group and area of residence of patient — Yukon Territory
1996 1 1997 1 1998 1999 2000 2001 2002 2003 2004 2005
number of induced abortions
All ages 172 121 150 111 135 122 125 129 x 140
Under 20 years 30 x x x x x x x x 22Under 15 years 0 x x x x x x x x 015 to 19 years 30 33 31 26 32 30 36 34 x 22
15 to 17 years 10 16 11 12 12 10 12 20 x 518 to 19 years 20 17 20 14 20 20 24 14 x 17
20 to 24 years 55 32 49 34 39 32 35 52 x 5125 to 29 years 39 32 29 17 30 25 25 18 x 3230 to 34 years 28 8 22 18 21 16 12 14 x 1335 to 39 years 16 12 14 14 8 13 12 9 x 1540 years and over 4 x x x x x x x x 7Age unknown 0 0 0 0 0 0 0 0 x 0
rate of induced abortions per 1,000 females of same age group
All ages 20.8 14.5 18.6 14.1 17.5 16.2 16.8 17.2 x 19.1
Under 20 years 25.1 x x x x x x x x 16.3Under 15 years 0.0 x x x x x x x x 0.015 to 19 years 31.0 32.5 29.7 23.8 28.2 25.8 30.5 28.1 x 19.2
15 to 17 years 16.6 24.7 16.5 17.0 16.3 13.6 16.6 28.6 x 7.618 to 19 years 54.8 46.3 53.3 36.3 50.3 46.3 52.5 27.3 x 35.1
20 to 24 years 51.9 32.9 53.3 37.2 43.0 36.0 37.4 52.5 x 46.425 to 29 years 30.5 24.5 23.6 14.9 28.1 24.8 25.5 18.6 x 32.630 to 34 years 17.8 5.3 15.8 13.9 17.1 13.3 10.2 11.9 x 11.835 to 39 years 9.7 7.0 8.3 8.5 5.1 8.9 8.8 6.8 x 12.140 years and over 2.6 x x x x x x x x 4.5Age unknown . . . . . . . . . .
ratio of induced abortions per 100 live births
All ages 38.8 25.5 37.9 29.0 36.5 35.5 36.9 38.5 x 43.8
Under 20 years 93.8 x x x x x x x x 157.1Under 15 years .. x x x x x x x x 0.015 to 19 years 93.8 103.1 103.3 83.9 97.0 107.1 144.0 125.9 x 157.1
15 to 17 years 111.1 133.3 110.0 109.1 109.1 142.9 171.4 153.8 x 83.318 to 19 years 87.0 85.0 100.0 70.0 90.9 95.2 133.3 100.0 x 121.4
20 to 24 years 57.9 35.6 59.8 50.0 55.7 41.6 51.5 74.3 x 87.925 to 29 years 30.7 21.1 26.9 16.5 32.6 30.1 24.8 20.2 x 35.230 to 34 years 23.0 6.4 21.8 17.8 21.9 16.3 14.3 14.9 x 13.135 to 39 years 29.1 19.0 21.9 21.5 11.1 30.2 25.0 23.7 x 35.740 years and over 33.3 x x x x x x x x 43.8Age unknown . . . . . . . . . .
proportion of induced abortions across age groups 2
All ages . . . . . . . . . .
Under 20 years 17.4 x x x x x x x x 15.7Under 15 years 0.0 x x x x x x x x 0.015 to 19 years 17.4 27.3 20.7 23.4 23.7 24.6 28.8 26.4 x 15.7
15 to 17 years 5.8 13.2 7.3 10.8 8.9 8.2 9.6 15.5 x 3.618 to 19 years 11.6 14.0 13.3 12.6 14.8 16.4 19.2 10.9 x 12.1
20 to 24 years 32.0 26.4 32.7 30.6 28.9 26.2 28.0 40.3 x 36.425 to 29 years 22.7 26.4 19.3 15.3 22.2 20.5 20.0 14.0 x 22.930 to 34 years 16.3 6.6 14.7 16.2 15.6 13.1 9.6 10.9 x 9.335 to 39 years 9.3 9.9 9.3 12.6 5.9 10.7 9.6 7.0 x 10.740 years and over 2.3 x x x x x x x x 5.0Age unknown . . . . . . . . . .
1. For the 1994 to 1997 data years, a large number of abortions were reported to the Therapeutic Abortion Survey without any information on the age of thefemale. Age groups have now been estimated for induced abortions at the Canada, provincial and territorial level. As a result of these new estimations, anypreviously released age group statistics at the Canada level will not match the latest Canada level statistics.
2. Percentage distribution of induced abortions across age groups, excluding abortions with no reported age.Note(s): See "Data quality, concepts and methodology — Explanatory notes for the tables" section.Source(s): Statistics Canada, Canadian Vital Statistics, Birth Database and Demography Division (population estimates); Canadian Institute for Health Information,
Therapeutic Abortion Database (CANSIM table 106-9034).
Statistics Canada – Catalogue no. 82-223-X 25
Induced Abortion Statistics – 2005
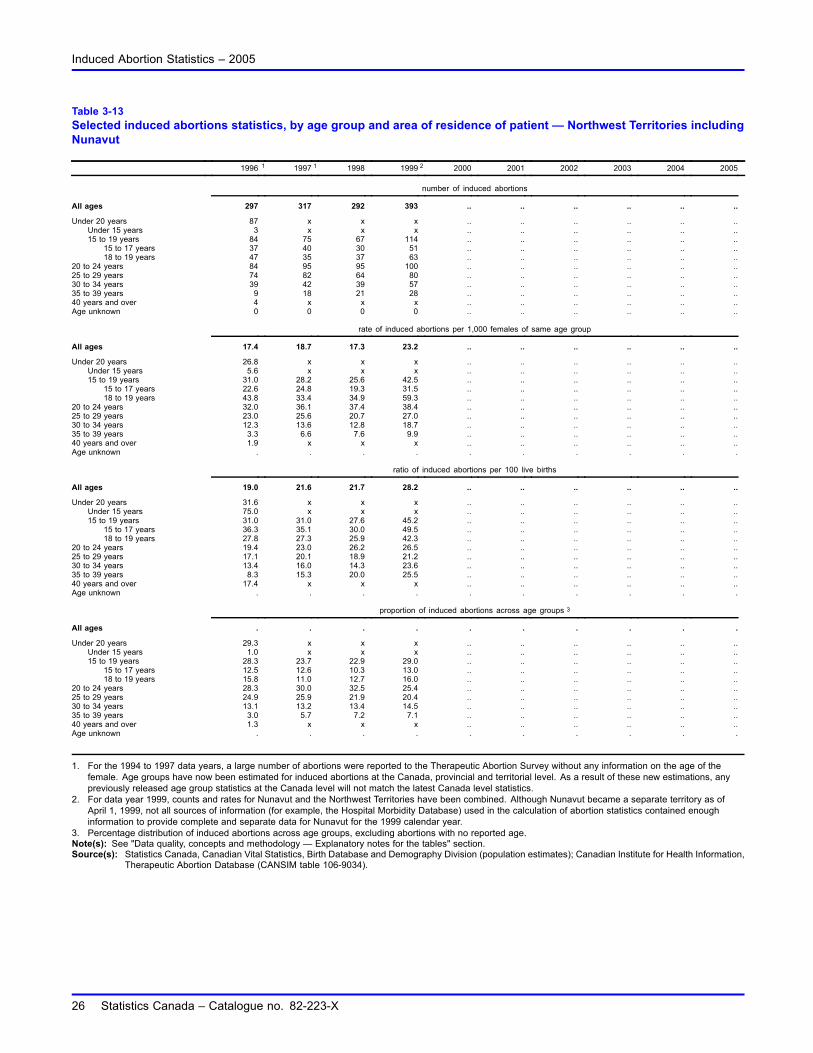
Table 3-13Selected induced abortions statistics, by age group and area of residence of patient — Northwest Territories includingNunavut
1996 1 1997 1 1998 1999 2 2000 2001 2002 2003 2004 2005
number of induced abortions
All ages 297 317 292 393 .. .. .. .. .. ..
Under 20 years 87 x x x .. .. .. .. .. ..Under 15 years 3 x x x .. .. .. .. .. ..15 to 19 years 84 75 67 114 .. .. .. .. .. ..
15 to 17 years 37 40 30 51 .. .. .. .. .. ..18 to 19 years 47 35 37 63 .. .. .. .. .. ..
20 to 24 years 84 95 95 100 .. .. .. .. .. ..25 to 29 years 74 82 64 80 .. .. .. .. .. ..30 to 34 years 39 42 39 57 .. .. .. .. .. ..35 to 39 years 9 18 21 28 .. .. .. .. .. ..40 years and over 4 x x x .. .. .. .. .. ..Age unknown 0 0 0 0 .. .. .. .. .. ..
rate of induced abortions per 1,000 females of same age group
All ages 17.4 18.7 17.3 23.2 .. .. .. .. .. ..
Under 20 years 26.8 x x x .. .. .. .. .. ..Under 15 years 5.6 x x x .. .. .. .. .. ..15 to 19 years 31.0 28.2 25.6 42.5 .. .. .. .. .. ..
15 to 17 years 22.6 24.8 19.3 31.5 .. .. .. .. .. ..18 to 19 years 43.8 33.4 34.9 59.3 .. .. .. .. .. ..
20 to 24 years 32.0 36.1 37.4 38.4 .. .. .. .. .. ..25 to 29 years 23.0 25.6 20.7 27.0 .. .. .. .. .. ..30 to 34 years 12.3 13.6 12.8 18.7 .. .. .. .. .. ..35 to 39 years 3.3 6.6 7.6 9.9 .. .. .. .. .. ..40 years and over 1.9 x x x .. .. .. .. .. ..Age unknown . . . . . . . . . .
ratio of induced abortions per 100 live births
All ages 19.0 21.6 21.7 28.2 .. .. .. .. .. ..
Under 20 years 31.6 x x x .. .. .. .. .. ..Under 15 years 75.0 x x x .. .. .. .. .. ..15 to 19 years 31.0 31.0 27.6 45.2 .. .. .. .. .. ..
15 to 17 years 36.3 35.1 30.0 49.5 .. .. .. .. .. ..18 to 19 years 27.8 27.3 25.9 42.3 .. .. .. .. .. ..
20 to 24 years 19.4 23.0 26.2 26.5 .. .. .. .. .. ..25 to 29 years 17.1 20.1 18.9 21.2 .. .. .. .. .. ..30 to 34 years 13.4 16.0 14.3 23.6 .. .. .. .. .. ..35 to 39 years 8.3 15.3 20.0 25.5 .. .. .. .. .. ..40 years and over 17.4 x x x .. .. .. .. .. ..Age unknown . . . . . . . . . .
proportion of induced abortions across age groups 3
All ages . . . . . . . . . .
Under 20 years 29.3 x x x .. .. .. .. .. ..Under 15 years 1.0 x x x .. .. .. .. .. ..15 to 19 years 28.3 23.7 22.9 29.0 .. .. .. .. .. ..
15 to 17 years 12.5 12.6 10.3 13.0 .. .. .. .. .. ..18 to 19 years 15.8 11.0 12.7 16.0 .. .. .. .. .. ..
20 to 24 years 28.3 30.0 32.5 25.4 .. .. .. .. .. ..25 to 29 years 24.9 25.9 21.9 20.4 .. .. .. .. .. ..30 to 34 years 13.1 13.2 13.4 14.5 .. .. .. .. .. ..35 to 39 years 3.0 5.7 7.2 7.1 .. .. .. .. .. ..40 years and over 1.3 x x x .. .. .. .. .. ..Age unknown . . . . . . . . . .
1. For the 1994 to 1997 data years, a large number of abortions were reported to the Therapeutic Abortion Survey without any information on the age of thefemale. Age groups have now been estimated for induced abortions at the Canada, provincial and territorial level. As a result of these new estimations, anypreviously released age group statistics at the Canada level will not match the latest Canada level statistics.
2. For data year 1999, counts and rates for Nunavut and the Northwest Territories have been combined. Although Nunavut became a separate territory as ofApril 1, 1999, not all sources of information (for example, the Hospital Morbidity Database) used in the calculation of abortion statistics contained enoughinformation to provide complete and separate data for Nunavut for the 1999 calendar year.
3. Percentage distribution of induced abortions across age groups, excluding abortions with no reported age.Note(s): See "Data quality, concepts and methodology — Explanatory notes for the tables" section.Source(s): Statistics Canada, Canadian Vital Statistics, Birth Database and Demography Division (population estimates); Canadian Institute for Health Information,
Therapeutic Abortion Database (CANSIM table 106-9034).
26 Statistics Canada – Catalogue no. 82-223-X
Induced Abortion Statistics – 2005
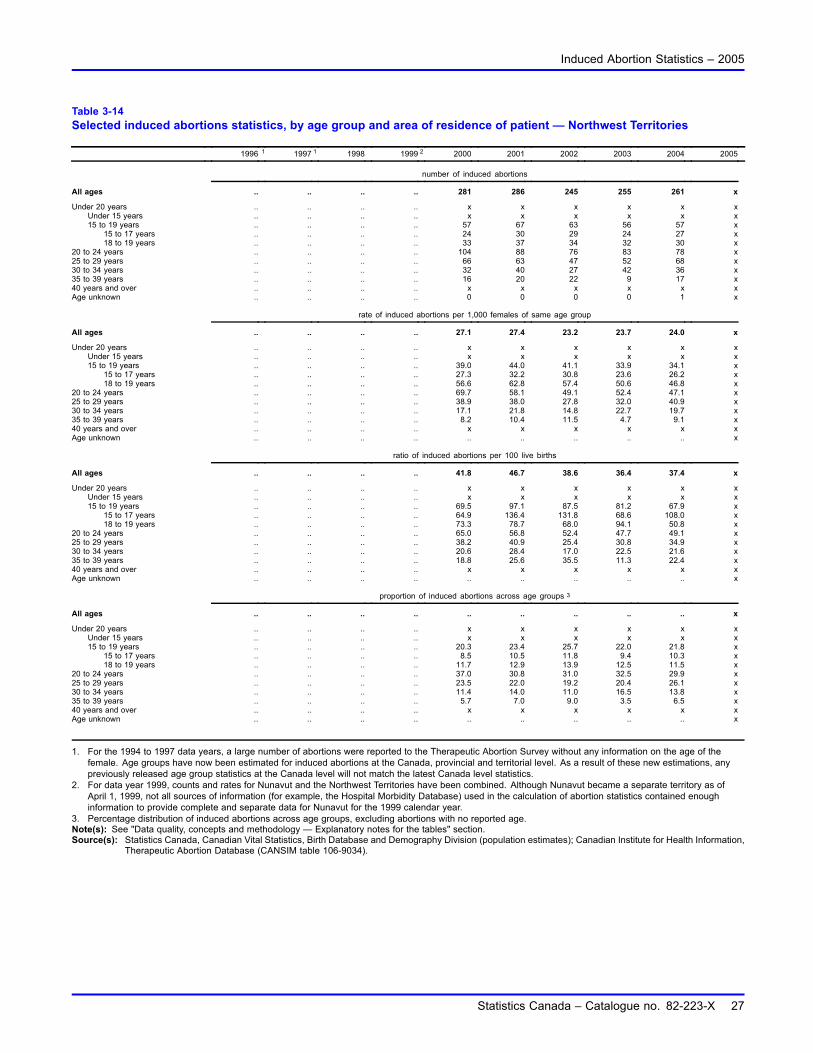
Table 3-14Selected induced abortions statistics, by age group and area of residence of patient — Northwest Territories
1996 1 1997 1 1998 1999 2 2000 2001 2002 2003 2004 2005
number of induced abortions
All ages .. .. .. .. 281 286 245 255 261 x
Under 20 years .. .. .. .. x x x x x xUnder 15 years .. .. .. .. x x x x x x15 to 19 years .. .. .. .. 57 67 63 56 57 x
15 to 17 years .. .. .. .. 24 30 29 24 27 x18 to 19 years .. .. .. .. 33 37 34 32 30 x
20 to 24 years .. .. .. .. 104 88 76 83 78 x25 to 29 years .. .. .. .. 66 63 47 52 68 x30 to 34 years .. .. .. .. 32 40 27 42 36 x35 to 39 years .. .. .. .. 16 20 22 9 17 x40 years and over .. .. .. .. x x x x x xAge unknown .. .. .. .. 0 0 0 0 1 x
rate of induced abortions per 1,000 females of same age group
All ages .. .. .. .. 27.1 27.4 23.2 23.7 24.0 x
Under 20 years .. .. .. .. x x x x x xUnder 15 years .. .. .. .. x x x x x x15 to 19 years .. .. .. .. 39.0 44.0 41.1 33.9 34.1 x
15 to 17 years .. .. .. .. 27.3 32.2 30.8 23.6 26.2 x18 to 19 years .. .. .. .. 56.6 62.8 57.4 50.6 46.8 x
20 to 24 years .. .. .. .. 69.7 58.1 49.1 52.4 47.1 x25 to 29 years .. .. .. .. 38.9 38.0 27.8 32.0 40.9 x30 to 34 years .. .. .. .. 17.1 21.8 14.8 22.7 19.7 x35 to 39 years .. .. .. .. 8.2 10.4 11.5 4.7 9.1 x40 years and over .. .. .. .. x x x x x xAge unknown .. .. .. .. .. .. .. .. .. x
ratio of induced abortions per 100 live births
All ages .. .. .. .. 41.8 46.7 38.6 36.4 37.4 x
Under 20 years .. .. .. .. x x x x x xUnder 15 years .. .. .. .. x x x x x x15 to 19 years .. .. .. .. 69.5 97.1 87.5 81.2 67.9 x
15 to 17 years .. .. .. .. 64.9 136.4 131.8 68.6 108.0 x18 to 19 years .. .. .. .. 73.3 78.7 68.0 94.1 50.8 x
20 to 24 years .. .. .. .. 65.0 56.8 52.4 47.7 49.1 x25 to 29 years .. .. .. .. 38.2 40.9 25.4 30.8 34.9 x30 to 34 years .. .. .. .. 20.6 28.4 17.0 22.5 21.6 x35 to 39 years .. .. .. .. 18.8 25.6 35.5 11.3 22.4 x40 years and over .. .. .. .. x x x x x xAge unknown .. .. .. .. .. .. .. .. .. x
proportion of induced abortions across age groups 3
All ages .. .. .. .. .. .. .. .. .. x
Under 20 years .. .. .. .. x x x x x xUnder 15 years .. .. .. .. x x x x x x15 to 19 years .. .. .. .. 20.3 23.4 25.7 22.0 21.8 x
15 to 17 years .. .. .. .. 8.5 10.5 11.8 9.4 10.3 x18 to 19 years .. .. .. .. 11.7 12.9 13.9 12.5 11.5 x
20 to 24 years .. .. .. .. 37.0 30.8 31.0 32.5 29.9 x25 to 29 years .. .. .. .. 23.5 22.0 19.2 20.4 26.1 x30 to 34 years .. .. .. .. 11.4 14.0 11.0 16.5 13.8 x35 to 39 years .. .. .. .. 5.7 7.0 9.0 3.5 6.5 x40 years and over .. .. .. .. x x x x x xAge unknown .. .. .. .. .. .. .. .. .. x
1. For the 1994 to 1997 data years, a large number of abortions were reported to the Therapeutic Abortion Survey without any information on the age of thefemale. Age groups have now been estimated for induced abortions at the Canada, provincial and territorial level. As a result of these new estimations, anypreviously released age group statistics at the Canada level will not match the latest Canada level statistics.
2. For data year 1999, counts and rates for Nunavut and the Northwest Territories have been combined. Although Nunavut became a separate territory as ofApril 1, 1999, not all sources of information (for example, the Hospital Morbidity Database) used in the calculation of abortion statistics contained enoughinformation to provide complete and separate data for Nunavut for the 1999 calendar year.
3. Percentage distribution of induced abortions across age groups, excluding abortions with no reported age.Note(s): See "Data quality, concepts and methodology — Explanatory notes for the tables" section.Source(s): Statistics Canada, Canadian Vital Statistics, Birth Database and Demography Division (population estimates); Canadian Institute for Health Information,
Therapeutic Abortion Database (CANSIM table 106-9034).
Statistics Canada – Catalogue no. 82-223-X 27
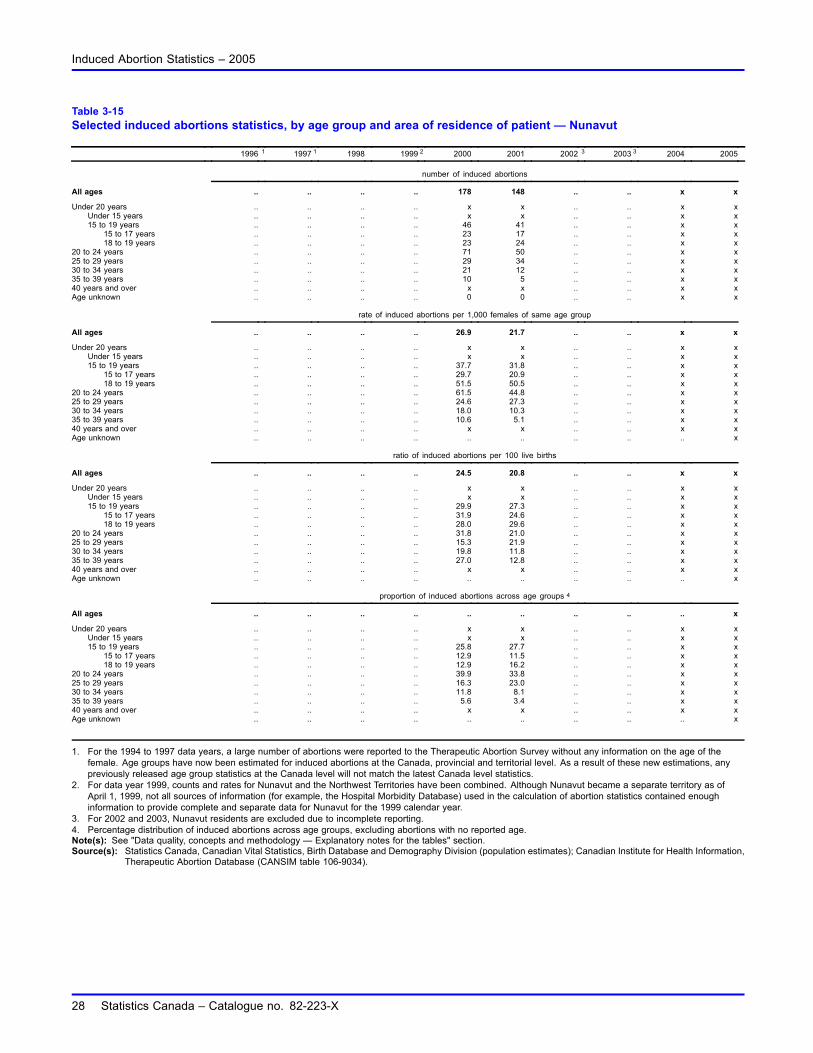
Induced Abortion Statistics – 2005
Table 3-15Selected induced abortions statistics, by age group and area of residence of patient — Nunavut
1996 1 1997 1 1998 1999 2 2000 2001 2002 3 2003 3 2004 2005
number of induced abortions
All ages .. .. .. .. 178 148 .. .. x x
Under 20 years .. .. .. .. x x .. .. x xUnder 15 years .. .. .. .. x x .. .. x x15 to 19 years .. .. .. .. 46 41 .. .. x x
15 to 17 years .. .. .. .. 23 17 .. .. x x18 to 19 years .. .. .. .. 23 24 .. .. x x
20 to 24 years .. .. .. .. 71 50 .. .. x x25 to 29 years .. .. .. .. 29 34 .. .. x x30 to 34 years .. .. .. .. 21 12 .. .. x x35 to 39 years .. .. .. .. 10 5 .. .. x x40 years and over .. .. .. .. x x .. .. x xAge unknown .. .. .. .. 0 0 .. .. x x
rate of induced abortions per 1,000 females of same age group
All ages .. .. .. .. 26.9 21.7 .. .. x x
Under 20 years .. .. .. .. x x .. .. x xUnder 15 years .. .. .. .. x x .. .. x x15 to 19 years .. .. .. .. 37.7 31.8 .. .. x x
15 to 17 years .. .. .. .. 29.7 20.9 .. .. x x18 to 19 years .. .. .. .. 51.5 50.5 .. .. x x
20 to 24 years .. .. .. .. 61.5 44.8 .. .. x x25 to 29 years .. .. .. .. 24.6 27.3 .. .. x x30 to 34 years .. .. .. .. 18.0 10.3 .. .. x x35 to 39 years .. .. .. .. 10.6 5.1 .. .. x x40 years and over .. .. .. .. x x .. .. x xAge unknown .. .. .. .. .. .. .. .. .. x
ratio of induced abortions per 100 live births
All ages .. .. .. .. 24.5 20.8 .. .. x x
Under 20 years .. .. .. .. x x .. .. x xUnder 15 years .. .. .. .. x x .. .. x x15 to 19 years .. .. .. .. 29.9 27.3 .. .. x x
15 to 17 years .. .. .. .. 31.9 24.6 .. .. x x18 to 19 years .. .. .. .. 28.0 29.6 .. .. x x
20 to 24 years .. .. .. .. 31.8 21.0 .. .. x x25 to 29 years .. .. .. .. 15.3 21.9 .. .. x x30 to 34 years .. .. .. .. 19.8 11.8 .. .. x x35 to 39 years .. .. .. .. 27.0 12.8 .. .. x x40 years and over .. .. .. .. x x .. .. x xAge unknown .. .. .. .. .. .. .. .. .. x
proportion of induced abortions across age groups 4
All ages .. .. .. .. .. .. .. .. .. x
Under 20 years .. .. .. .. x x .. .. x xUnder 15 years .. .. .. .. x x .. .. x x15 to 19 years .. .. .. .. 25.8 27.7 .. .. x x
15 to 17 years .. .. .. .. 12.9 11.5 .. .. x x18 to 19 years .. .. .. .. 12.9 16.2 .. .. x x
20 to 24 years .. .. .. .. 39.9 33.8 .. .. x x25 to 29 years .. .. .. .. 16.3 23.0 .. .. x x30 to 34 years .. .. .. .. 11.8 8.1 .. .. x x35 to 39 years .. .. .. .. 5.6 3.4 .. .. x x40 years and over .. .. .. .. x x .. .. x xAge unknown .. .. .. .. .. .. .. .. .. x
1. For the 1994 to 1997 data years, a large number of abortions were reported to the Therapeutic Abortion Survey without any information on the age of thefemale. Age groups have now been estimated for induced abortions at the Canada, provincial and territorial level. As a result of these new estimations, anypreviously released age group statistics at the Canada level will not match the latest Canada level statistics.
2. For data year 1999, counts and rates for Nunavut and the Northwest Territories have been combined. Although Nunavut became a separate territory as ofApril 1, 1999, not all sources of information (for example, the Hospital Morbidity Database) used in the calculation of abortion statistics contained enoughinformation to provide complete and separate data for Nunavut for the 1999 calendar year.
3. For 2002 and 2003, Nunavut residents are excluded due to incomplete reporting.4. Percentage distribution of induced abortions across age groups, excluding abortions with no reported age.Note(s): See "Data quality, concepts and methodology — Explanatory notes for the tables" section.Source(s): Statistics Canada, Canadian Vital Statistics, Birth Database and Demography Division (population estimates); Canadian Institute for Health Information,
Therapeutic Abortion Database (CANSIM table 106-9034).
28 Statistics Canada – Catalogue no. 82-223-X
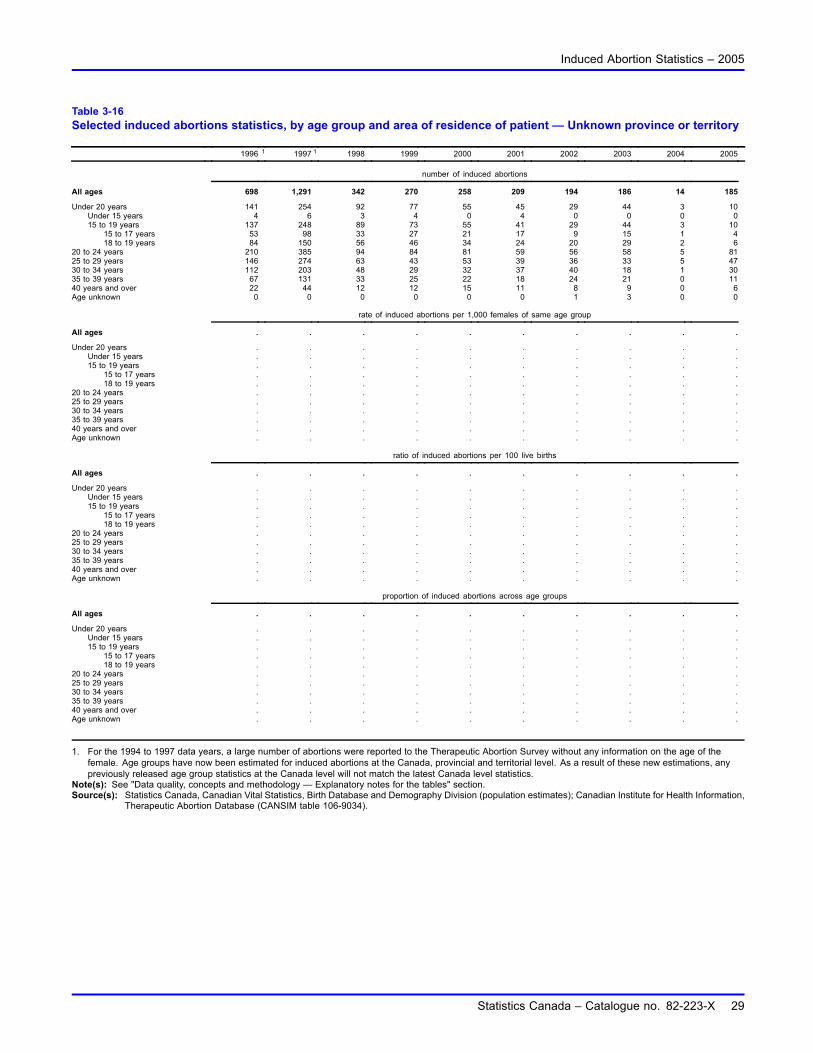
Induced Abortion Statistics – 2005
Table 3-16Selected induced abortions statistics, by age group and area of residence of patient — Unknown province or territory
1996 1 1997 1 1998 1999 2000 2001 2002 2003 2004 2005
number of induced abortions
All ages 698 1,291 342 270 258 209 194 186 14 185
Under 20 years 141 254 92 77 55 45 29 44 3 10Under 15 years 4 6 3 4 0 4 0 0 0 015 to 19 years 137 248 89 73 55 41 29 44 3 10
15 to 17 years 53 98 33 27 21 17 9 15 1 418 to 19 years 84 150 56 46 34 24 20 29 2 6
20 to 24 years 210 385 94 84 81 59 56 58 5 8125 to 29 years 146 274 63 43 53 39 36 33 5 4730 to 34 years 112 203 48 29 32 37 40 18 1 3035 to 39 years 67 131 33 25 22 18 24 21 0 1140 years and over 22 44 12 12 15 11 8 9 0 6Age unknown 0 0 0 0 0 0 1 3 0 0
rate of induced abortions per 1,000 females of same age group
All ages . . . . . . . . . .
Under 20 years . . . . . . . . . .Under 15 years . . . . . . . . . .15 to 19 years . . . . . . . . . .
15 to 17 years . . . . . . . . . .18 to 19 years . . . . . . . . . .
20 to 24 years . . . . . . . . . .25 to 29 years . . . . . . . . . .30 to 34 years . . . . . . . . . .35 to 39 years . . . . . . . . . .40 years and over . . . . . . . . . .Age unknown . . . . . . . . . .
ratio of induced abortions per 100 live births
All ages . . . . . . . . . .
Under 20 years . . . . . . . . . .Under 15 years . . . . . . . . . .15 to 19 years . . . . . . . . . .
15 to 17 years . . . . . . . . . .18 to 19 years . . . . . . . . . .
20 to 24 years . . . . . . . . . .25 to 29 years . . . . . . . . . .30 to 34 years . . . . . . . . . .35 to 39 years . . . . . . . . . .40 years and over . . . . . . . . . .Age unknown . . . . . . . . . .
proportion of induced abortions across age groups
All ages . . . . . . . . . .
Under 20 years . . . . . . . . . .Under 15 years . . . . . . . . . .15 to 19 years . . . . . . . . . .
15 to 17 years . . . . . . . . . .18 to 19 years . . . . . . . . . .
20 to 24 years . . . . . . . . . .25 to 29 years . . . . . . . . . .30 to 34 years . . . . . . . . . .35 to 39 years . . . . . . . . . .40 years and over . . . . . . . . . .Age unknown . . . . . . . . . .
1. For the 1994 to 1997 data years, a large number of abortions were reported to the Therapeutic Abortion Survey without any information on the age of thefemale. Age groups have now been estimated for induced abortions at the Canada, provincial and territorial level. As a result of these new estimations, anypreviously released age group statistics at the Canada level will not match the latest Canada level statistics.
Note(s): See "Data quality, concepts and methodology — Explanatory notes for the tables" section.Source(s): Statistics Canada, Canadian Vital Statistics, Birth Database and Demography Division (population estimates); Canadian Institute for Health Information,
Therapeutic Abortion Database (CANSIM table 106-9034).
Statistics Canada – Catalogue no. 82-223-X 29
Definitions
Abortion (induced). The Therapeutic Abortion Survey collects data on legally induced abortions. The surveyexcludes illegal abortions and spontaneous abortions (that is, miscarriages).
Induced abortion is defined as the medical termination of pregnancy. Equivalent terms include: artificial abortion,therapeutic abortion, voluntary termination of pregnancy, elective termination of pregnancy, and active terminationof pregnancy.
The term ’therapeutic’ remains in the title of the survey for the sake of historical consistency. From late 1969 (whenthe survey first began) until 1988, a woman could only obtain an induced abortion if a committee of at least threephysicians determined that the pregnancy was a risk to the woman’s life or health (including mental health). InJanuary 1988, the Supreme Court of Canada struck down the 1969 abortion law, thus removing the requirement ofa health or therapeutic reason to obtain an abortion.
Age. Age (in completed years) of the woman undergoing an abortion procedure, on the date the pregnancy wasterminated.
Area of report. Area of report refers to the province or territory in which the abortion was performed. Prior to 2004,reports of abortions performed on Canadian residents in the United States are also included where applicable.
Area of residence. Area of residence refers to the usual province or territory of residence of the woman obtainingthe abortion. Statistics on non-residents of Canada who obtained an abortion in Canada are also included whereapplicable.
Type of facility. The Therapeutic Abortion Survey collects information on abortions performed in two types offacilities: hospitals and clinics.
Measures and rates
Abortion rate. In tables that contain no age group breakdowns, the abortion rate is calculated as the annual numberof induced abortions performed per 1,000 women aged 15 to 44.
In tables that contain age group breakdowns, the abortion rate is calculated as the annual number of inducedabortions performed per 1,000 women aged 14 to 44.
Age-specific abortion rate. This rate is calculated as the annual number of induced abortions performed on womenin a specified age group per 1,000 women of the same age.
Abortions per 100 live births. A ratio indicating the number of abortions performed for every 100 live births.
30 Statistics Canada – Catalogue no. 82-223-X
Explanatory notes for the tables
Table 1 Induced abortions, by area of report and type of facility performing the abortion
Sources: Statistics Canada, Therapeutic Abortion Database; Canadian Institute for Health Information,Therapeutic Abortion Survey. Data users should be aware of certain limitations to the Therapeutic AbortionSurvey. There are recognized issues concerning coverage, increased submission of aggregate counts insteadof detailed records and an increased reliance on age estimation. Further information on methods and dataquality is available in the "Definitions, data sources and methods" section on the Statistics Canada website,under the survey number 3209.
The number of induced abortions is provided by the province or territory in which the abortion was performed.Counts include abortions performed in Canadian hospitals and clinics on Canadian residents and non-residentsof Canada. Where indicated, the counts also include abortions performed in the United States on Canadianresidents, for data years prior to 2004.
From 1971 to 2003, health departments in several American states, especially those along the Canada and UnitedStates border supplied information about abortions obtained by Canadian residents. These counts, however,should be regarded as a minimum estimate because not all American states submitted reports, some privateclinics may not report to the state health department or the residence of the patient was not reported. The reportsdid not specify if the abortion took place in a hospital or clinic. As of 2004, this information is no longer collected.
Abortions performed in clinics were first reported by Quebec in 1978. In other provinces such clinics came intooperation soon after January 1988, when the Supreme Court of Canada struck down the 1969 amended abortionlaw.
Caution should be taken when comparing 1999 and later data years with data from 1998 and earlier. As of 1999,the Ontario Ministry of Health and Long-term Care no longer maintains a system for the collection of detailedinformation on abortions performed in clinics in Ontario. Ontario now uses the billing system of the OntarioHealth Insurance Plan (OHIP) to provide counts of clinic abortions to the Therapeutic Abortion Survey. As aresult, information is no longer available for clinic abortions performed on non-residents of Ontario or on Ontarioresidents who do not submit a claim to OHIP. A comparison of the data collected using both sources for theyears 1995 to 1998 shows that the new data source underestimated the clinic abortions performed on Ontarioresidents by an average of 5.4% (950 cases) per year, or approximately 1% of all abortions performed in Canada.The new source does not include non-resident cases which averaged 70 cases per year or .4% of total clinicabortions performed in Ontario.
For the 2003 and 2005 data year, a facility in British Columbia did not report to the Therapeutic Abortion Survey.Counts were estimated for these two facilities based on the number of abortions reported by them in previousyears.
Nunavut came into being officially as a Territory of Canada on April 1, 1999. Reports of abortions for 1999,however, are based on the full calendar year (January to December). In previous years, the totals for the NorthwestTerritories included residents of what became Nunavut.
Statistics Canada – Catalogue no. 82-223-X 31
Induced Abortion Statistics – 2005
Table 2 Induced abortions, by type of facility and area of residence of patient
Sources: Statistics Canada, Therapeutic Abortion Database and Demography Division (population estimates);Canadian Institute for Health Information, Therapeutic Abortion Survey. Data users should be aware of certainlimitations to the Therapeutic Abortion Survey. There are recognized issues concerning coverage, increasedsubmission of aggregate counts instead of detailed records and an increased reliance on age estimation. Furtherinformation on methods and data quality is available in the "Definitions, data sources and methods" section onthe Statistics Canada website, under the survey number 3209.
Induced abortions by the usual area of residence of the person obtaining the abortion. Counts include abortionsperformed on Canadian residents in hospitals and clinics in Canada. Where indicated, the counts also includeabortions performed on non-residents of Canada obtaining an abortion in Canada and abortions performed inthe United States on Canadian residents, for data years prior to 2004. Rates and ratios exclude non-residents ofCanada.
From 1971 to 2003, health departments in several American states, especially those along the Canada and UnitedStates border supplied information about abortions obtained by Canadian residents. These counts, however,should be regarded as a minimum estimate because not all American states submitted reports, some privateclinics may not report to the state health department or the residence of the patient was not reported. The reportsdid not specify if the abortion took place in a hospital or clinic. As of 2004, this information is no longer collected.
Abortions performed in clinics were first reported by Quebec in 1978. In other provinces such clinics came intooperation soon after January 1988, when the Supreme Court of Canada struck down the 1969 amended abortionlaw.
Caution should be taken when comparing 1999 and later data years with data from 1998 and earlier. As of 1999,the Ontario Ministry of Health and Long-term Care no longer maintains a system for the collection of detailedinformation on abortions performed in clinics in Ontario. Ontario now uses the billing system of the OntarioHealth Insurance Plan (OHIP) to provide counts of clinic abortions to the Therapeutic Abortion Survey. As aresult, information is no longer available for clinic abortions performed on non-residents of Ontario or on Ontarioresidents who do not submit a claim to OHIP. A comparison of the data collected using both sources for theyears 1995 to 1998 shows that the new data source underestimated the clinic abortions performed on Ontarioresidents by an average of 5.4% (950 cases) per year, or approximately 1% of all abortions performed in Canada.The new source does not include non-resident cases which averaged 70 cases per year or 0.4% of total clinicabortions performed in Ontario.
For the 2003 and 2005 data year, a facility in British Columbia did not report to the Therapeutic Abortion Survey.Counts were estimated for these two facilities based on the number of abortions reported by them in previousyears.
Nunavut came into being officially as a Territory of Canada on April 1, 1999. Reports of abortions for 1999,however, are based on the full calendar year (January to December). In previous years, the totals for the NorthwestTerritories included residents of what became Nunavut.
Table 3 Selected induced abortions statistics, by age group and area of residence of patient
Sources: Statistics Canada, Canadian Vital Statistics, Birth Database; Canadian Institute for Health Information,Therapeutic Abortion Database. Data users should be aware of certain limitations to the Therapeutic AbortionSurvey. There are recognized issues concerning coverage, increased submission of aggregate counts instead ofdetailed records and an increased reliance on age estimation. Further information on methods and data qualityis available in the "Definitions, data sources and methods" section on the Statistics Canada website, under thesurvey number 3209.
32 Statistics Canada – Catalogue no. 82-223-X
Induced Abortion Statistics – 2005
Induced abortion counts are taken from the Therapeutic Abortion Survey that collects information on abortionsperformed in hospitals and clinics in Canada, as well as on abortions performed on Canadian residents in selectedAmerican states, for data years prior to 2004. Abortions performed on non-residents of Canada are excluded.
The "All ages" group is the total number of induced abortions performed on Canadian residents. Rates for the"All ages" group is based on the population of females aged 14 to 44. For the number of abortions per 100 livebirths to females in the "All ages" group, the denominator is the total number of births reported for all ages.
Rates for the "Under 20 years" age group are based on the female population aged 14 to 19 years.
Rates for the "Under 15 years" age group are based on the female population aged 14.
Rates for the "40 years and over" age group are based on the female population aged 40 to 44.
For the "All ages" category, the "Proportion of induced abortions across age groups" is not calculated. For the"Age unknown" category, only the "Number of induced abortions" is provided.
When data years 1995, 1996 and 1997 were originally released, age estimations were not calculated for thecounts of clinic abortions where the area of residence was unknown and the age was unknown. Age estimationshave now been calculated for these counts, using the known national age distribution for hospital abortions.
The population estimates used to calculate the rates for data years 1974 to present were taken from CANSIMtable 051-0001: Estimates of population, by age group and sex, Canada, provinces and territories, annual.
Percentage distribution of induced abortions across age groups, excluding abortions with no reported age.
Caution should be taken when comparing 1999 and later data years with data from 1998 and earlier. As of 1999,the Ontario Ministry of Health and Long-term Care no longer maintains a system for the collection of detailedinformation on abortions performed in clinics in Ontario. Ontario now uses the billing system of the OntarioHealth Insurance Plan (OHIP) to provide counts of clinic abortions to the Therapeutic Abortion Survey. As aresult, information is no longer available for clinic abortions performed on non-residents of Ontario or on Ontarioresidents who do not submit a claim to OHIP. A comparison of the data collected using both sources for theyears 1995 to 1998 shows that the new data source underestimated the clinic abortions performed on Ontarioresidents by an average of 5.4% (950 cases) per year, or approximately 1% of all abortions performed in Canada.The new source does not include non-resident cases which averaged 70 cases per year or 0.4% of total clinicabortions performed in Ontario.
For the 1998 data year, Ontario reported 2,795 clinic abortions with no age group information. The knownproportion of Ontario residents who obtained an abortion in hospital was used to estimate the age group ofthese clinic counts. British Columbia also reported 725 clinic counts with no age group information. The knownproportion of British Columbia residents who obtained an abortion in hospital was used to estimate the agegroup of these clinic counts.
For the 2003 and 2005 data year, a facility in British Columbia did not report to the Therapeutic Abortion Survey.Counts were estimated for these two facilities based on the number of abortions reported by them in previousyears.
Statistics Canada – Catalogue no. 82-223-X 33