Embed Size (px)
Citation preview

THIRD STANDING COMMITTEE ON TUNA AND BILLFISH
6-8 June 1990 Noumea, New Caledonia
WORKING PAPER 4
PRELIMINARY ANALYSIS OF SOLOMON ISLANDS IN-COUNTRY TAGGING PROJECT DATA
Tuna and Billfish Assessment Programme South Pacific Commission Noumea, New Caledonia
June 1990

1. INTRODUCTION
The Solomon Islands In-Country Tuna Tagging Project (SITP) was developed jointly by the Fisheries Division, Ministry of Natural Resources, Solomon Islands and the South Pacific Commission Tuna and Billfish Assessment Programme, and is funded by the Australian International Development Assistance Bureau. The more broadly directed Regional Tuna Tagging Project (RTTP), funded by the Sixth European Development Fund, will also contribute to the SITP with specific tagging cruises in the Solomon Islands EEZ.
The aim of the SITP is to provide information on skipjack population dynamics and fishery interaction necessary to guide the rational development of the Solomon Islands tuna fishery, currently the largest of its type in the Pacific Islands region. The specific objectives are:
(i) To estimate skipjack population parameters (natural mortality, fishing mortality, transfer rates, tag shedding rates, tag reporting rate) necessary to assess the existing and/or potential interactions between the Solomon Islands pole-and-line and purse-seine fisheries. If artisanal statistics are available for the period of the tagging programme, artisanal-industrial interaction can also be addressed.
(ii) To update SSAP estimates of skipjack standing stock, turnover, throughput and harvest ratio in the Solomon Islands region.
(iii) To estimate other skipjack population parameters of interest (e.g., growth, long range movements, school integrity).
(iv) To obtain preliminary information on the attraction of tagged skipjack to fish aggregation devices (FADs), movement to FADs and residence time on FADs.
(v) To train a local Solomon Islands fisheries officer in all aspects of conducting a tagging experiment, including experimental design, tagging and field sampling methods, tag return data collection and processing, data analysis and report writing, so as to enhance the research capability of the Solomon Islands Fisheries Division.
To date, three cruises on Solomon Taiyo Ltd (STL) pole-and-line vessels and two cruises on the RTTP chartered vessel, Te Tautai, have been completed. The final cruise, using a STL vessel, is scheduled to take place in June 1990. In this paper, a preliminary analysis of the results of cruise 1 is presented in order to demonstrate some of the techniques that can be used to analyse data of this nature. The analysis was also undertaken so as to assess the appropriateness of these standard analytical techniques and to indicate directions for further methodological development, if required (as requested in Action Item 1 of the 1989 SCTB meeting).
1
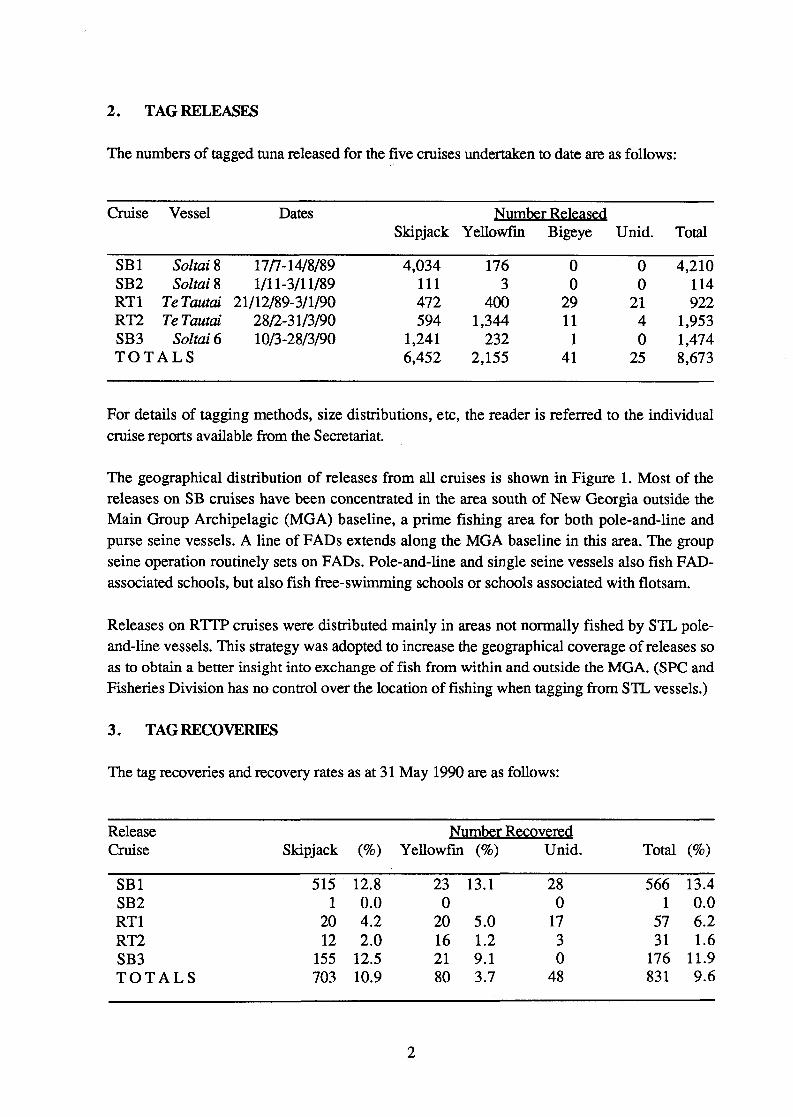
2. TAG RELEASES
The numbers of tagged tuna released for the five cruises undertaken to date are as follows:
Cruise Vessel
SB1 Soltai S SB2 Soltai 8 RT1 Te Touted RT2 TeTautai SB3 Soltai 6 T O T A L S
Dates
17/7-14/8/89 1/11-3/11/89
21/12/89-3/1/90 28/2-31/3/90 10/3-28/3/90
Skipjack
4,034 111 472 594
1,241 6,452
Number Released Yellowfin
176 3
400 1,344
232 2,155
Bigeye
0 0
29 11
1 41
Unid.
0 0
21 4 0
25
Total
4,210 114 922
1,953 1,474 8,673
For details of tagging methods, size distributions, etc, the reader is referred to the individual cruise reports available from the Secretariat.
The geographical distribution of releases from all cruises is shown in Figure 1. Most of the releases on SB cruises have been concentrated in the area south of New Georgia outside the Main Group Archipelagic (MGA) baseline, a prime fishing area for both pole-and-line and purse seine vessels. A line of FADs extends along the MGA baseline in this area. The group seine operation routinely sets on FADs. Pole-and-line and single seine vessels also fish FAD-associated schools, but also fish free-swimming schools or schools associated with flotsam.
Releases on RTTP cruises were distributed mainly in areas not normally fished by STL pole-and-line vessels. This strategy was adopted to increase the geographical coverage of releases so as to obtain a better insight into exchange of fish from within and outside the MGA. (SPC and Fisheries Division has no control over the location of fishing when tagging from STL vessels.)
3 . TAG RECOVERIES
The tag recoveries and recovery rates as at 31 May 1990 are as follows:
Release Cruise
Number Recovered Skipjack (%) Yellowfin (%) Unid. Total (%)
SB1 SB2 RT1 RT2 SB3 T O T A L S
515 1
20 12
155 703
12.8 0.0 4.2 2.0
12.5 10.9
23 0
20 16 21 80
13.1
5.0 1.2 9.1 3.7
28 0
17 3 0
48
566 1
57 31
176 831
13.4 0.0 6.2 1.6
11.9 9.6
2
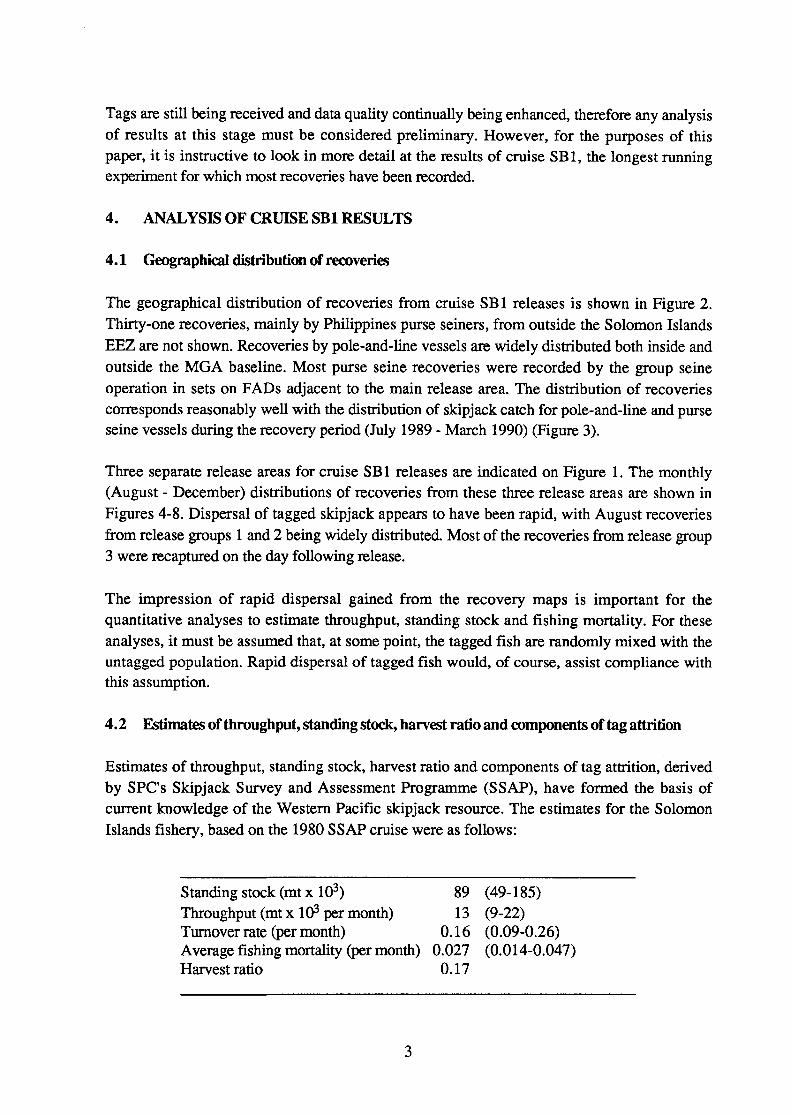
Tags are still being received and data quality continually being enhanced, therefore any analysis of results at this stage must be considered preliminary. However, for the purposes of this paper, it is instructive to look in more detail at the results of cruise SB 1, the longest running experiment for which most recoveries have been recorded.
4 . ANALYSIS OF CRUISE SB1 RESULTS
4.1 Geographical distribution of recoveries
The geographical distribution of recoveries from cruise SB1 releases is shown in Figure 2. Thirty-one recoveries, mainly by Philippines purse seiners, from outside the Solomon Islands EEZ are not shown. Recoveries by pole-and-line vessels are widely distributed both inside and outside the MGA baseline. Most purse seine recoveries were recorded by the group seine operation in sets on FADs adjacent to the main release area. The distribution of recoveries corresponds reasonably well with the distribution of skipjack catch for pole-and-line and purse seine vessels during the recovery period (July 1989 - March 1990) (Figure 3).
Three separate release areas for cruise SB1 releases are indicated on Figure 1. The monthly (August - December) distributions of recoveries from these three release areas are shown in Figures 4-8. Dispersal of tagged skipjack appears to have been rapid, with August recoveries from release groups 1 and 2 being widely distributed. Most of the recoveries from release group 3 were recaptured on the day following release.
The impression of rapid dispersal gained from the recovery maps is important for the quantitative analyses to estimate throughput, standing stock and fishing mortality. For these analyses, it must be assumed that, at some point, the tagged fish are randomly mixed with the untagged population. Rapid dispersal of tagged fish would, of course, assist compliance with this assumption.
4.2 Estimates of throughput, standing stock, harvest ratio and components of tag attrition
Estimates of throughput, standing stock, harvest ratio and components of tag attrition, derived by SPC's Skipjack Survey and Assessment Programme (SSAP), have formed the basis of current knowledge of the Western Pacific skipjack resource. The estimates for the Solomon Islands fishery, based on the 1980 SSAP cruise were as follows:
Standing stock (mt x 103) 89 (49-185) Throughput (mt x 103 per month) 13 (9-22) Turnover rate (per month) 0.16 (0.09-0.26) Average fishing mortality (per month) 0.027 (0.014-0.047) Harvest ratio 0.17
3

It is possible to repeat this analysis using the results of cruise SB1.
4.2.1 The simple tag attrition model
Kleiber et al. (1987) used a least squares procedure to obtain parameter estimates for the tag attrition model, where the expected number of returns during the jth period after mixing of tagged fish in the untagged population is assumed to have taken place may be written as
r i=N» e T ^ L 1 - J (1)
where N0 is the number of fish alive at the beginning of the time period in which complete mixing is assumed to have occurred, q is the catchability coefficient, fj is the fishing effort during period i, M is the rate of natural mortality, tagging mortality, continuous tag shedding and emigration combined and |3 is the probability that a recaptured tag will be returned. The use of fishing effort to parameterize fishing mortality, F, assumes that
E = qf.. (2)
This parameterization poses difficulties in the case of the Solomon Islands fishery because two gear types (having different catchability coefficients) are used, therefore no single value of total effective effort can be easily obtained. The alternative parameterization is one involving catch instead of effort:
C. F = T T (3)
1 p v /
where C{ is the catch in period i and P is the equilibrium standing stock (expressed in the same units as Cj). The use of equation (3) in the tag attrition model fitted to the present data set involves the implicit assumption that there is a single population of skipjack simultaneously vulnerable to both gears. Using equation (3) to parameterize F, the expected number of returns during the jth period becomes
( ^ C ^ - D M ) CJ
rj " No e C.+PM j
•£*) 1-e
(4)
4
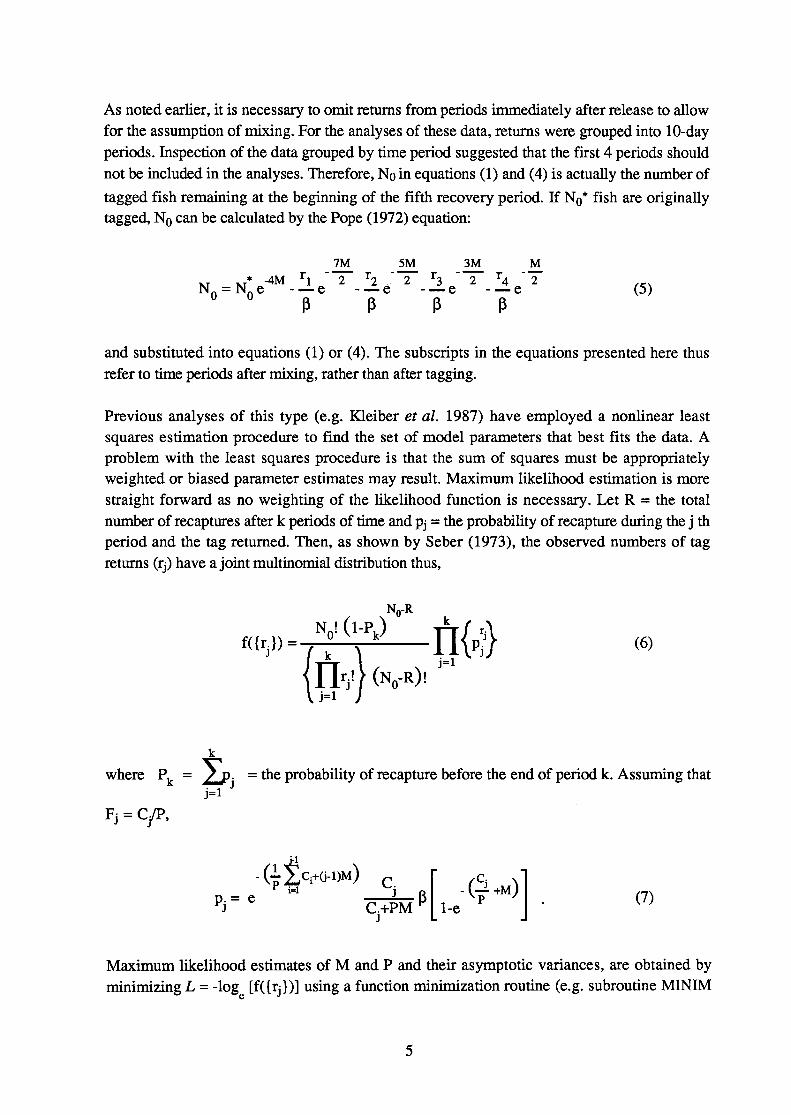
As noted earlier, it is necessary to omit returns from periods immediately after release to allow for the assumption of mixing. For the analyses of these data, returns were grouped into 10-day periods. Inspection of the data grouped by time period suggested that the first 4 periods should not be included in the analyses. Therefore, No in equations (1) and (4) is actually the number of tagged fish remaining at the beginning of the fifth recovery period. If N0* fish are originally tagged, N0 can be calculated by the Pope (1972) equation:
7M
XT * -4M r i " 2 r2 N o = N o e • — e • — e
5M 2
3M 2 2
P (5)
and substituted into equations (1) or (4). The subscripts in the equations presented here thus refer to time periods after mixing, rather than after tagging.
Previous analyses of this type (e.g. Kleiber et al. 1987) have employed a nonlinear least squares estimation procedure to find the set of model parameters that best fits the data. A problem with the least squares procedure is that the sum of squares must be appropriately weighted or biased parameter estimates may result. Maximum likelihood estimation is more straight forward as no weighting of the likelihood function is necessary. Let R = the total number of recaptures after k periods of time and pj = the probability of recapture during the j th period and the tag returned. Then, as shown by Seber (1973), the observed numbers of tag returns (rj) have a joint multinomial distribution thus,
fCty)-Nn! ( l-Pk)
Nn-R
(N0-R)I
(6)
where P. = /p. = the probability of recapture before the end of period k. Assuming that
Fj = C/P,
p.= e
(|:£ci+(j-i)M) * i=i c. krP C+PM
J 1-e
£+M) (7)
Maximum likelihood estimates of M and P and their asymptotic variances, are obtained by minimizing L = -log [f({rj})] using a function minimization routine (e.g. subroutine MINIM
5
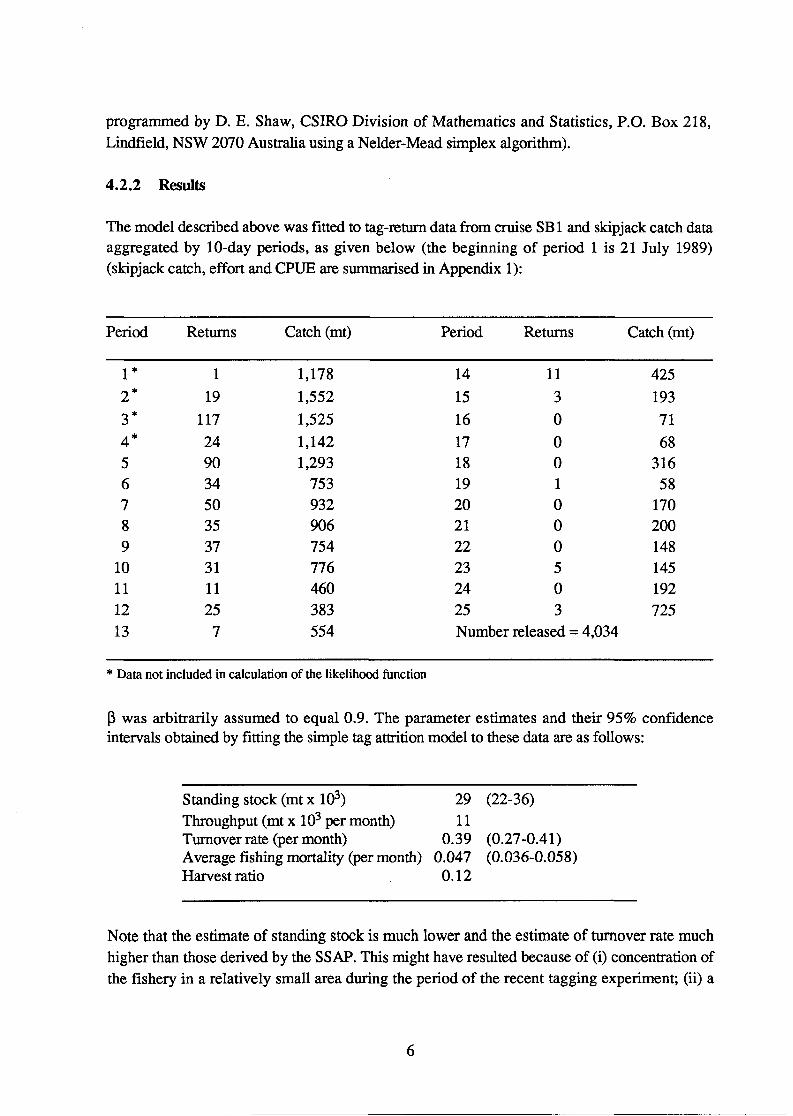
programmed by D. E. Shaw, CSIRO Division of Mathematics and Statistics, P.O. Box 218, Lindfield, NSW 2070 Australia using a Nelder-Mead simplex algorithm).
4.2.2 Results
The model described above was fitted to tag-return data from cruise SBl and skipjack catch data aggregated by 10-day periods, as given below (the beginning of period 1 is 21 July 1989) (skipjack catch, effort and CPUE are summarised in Appendix 1):
Period
1*
2*
3* 4* 5 6 7 8 9
10 11 12 13
Returns
1
19
117
24 90 34 50 35 37 31 11 25
7
Catch (mt)
1,178
1,552
1,525
1,142 1,293
753 932 906 754 776 460 383 554
Period
14
15
16
17 18 19 20 21 22 23 24 25
Returns
11
3
0
0 0 1 0 0 0 5 0 3
Number released = 4,034
Catch (mt)
425
193
71
68 316
58 170 200 148 145 192 725
* Data not included in calculation of the likelihood function
P was arbitrarily assumed to equal 0.9. The parameter estimates and their 95% confidence intervals obtained by fitting the simple tag attrition model to these data are as follows:
Standing stock (mt x 103) 29 Throughput (mt x 103 per month) 11 Turnover rate (per month) 0.39 Average fishing mortality (per month) 0.047
(22-36)
(0.27-0.41) (0.036-0.058)
Harvest ratio 0.12
Note that the estimate of standing stock is much lower and the estimate of turnover rate much higher than those derived by the SSAP. This might have resulted because of (i) concentration of the fishery in a relatively small area during the period of the recent tagging experiment; (ii) a
6
greater tendency for skipjack to move away from Solomon Islands waters during the recent experiment (as evidenced by the large number of international recoveries); or (iii) the preliminary nature of the present data. Partly because of the high correlation between P and M (-0.87), the estimate of throughput is similar to the previous estimate, while harvest ratio (proportion of total attrition due to fishing) is somewhat lower. The plot of observed and expected r- (Figure 9) indicates that the fitted model describes the data reasonably well.
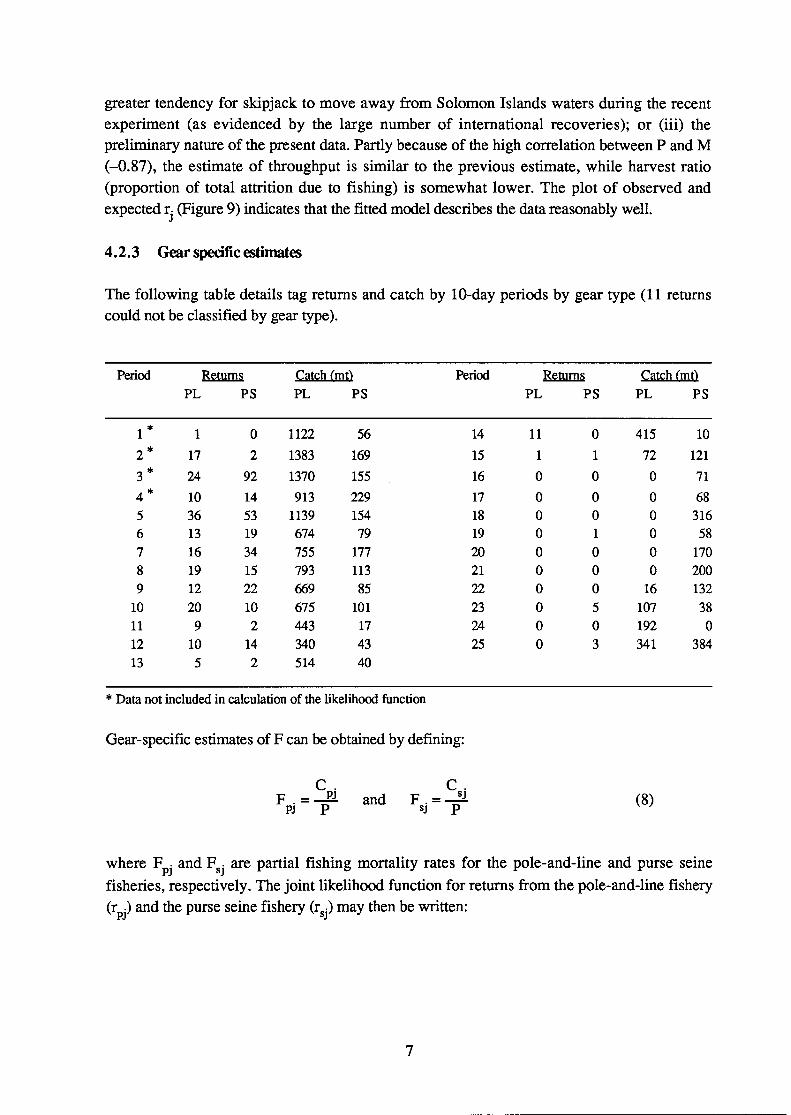
4.2.3 Gear specific estimates
The following table details tag returns and catch by 10-day periods by gear type (11 returns could not be classified by gear type).
Period Returns Catch (mO Period Returns Catch (mi) PL PS PL PS PL PS PL PS
1*
2*
3*
4* 5 6 7 8 9 10 11 12 13
1
17
24
10 36 13 16 19 12 20 9 10 5
0
2
92
14 53 19 34 15 22 10 2 14 2
1122
1383
1370
913 1139
674 755 793 669 675 443 340 514
56
169
155
229 154 79 177 113 85 101 17 43 40
14
15
16
17 18 19 20 21 22 23 24 25
11
1
0
0 0 0 0 0 0 0 0 0
0
1
0
0 0 1 0 0 0 5 0 3
415
72
0
0 0 0 0 0 16 107 192 341
10
121
71
68 316 58 170 200 132 38 0
384
* Data not included in calculation of the likelihood function
Gear-specific estimates of F can be obtained by defining:
C C F . = J 1 and F . = - ^ i (8)
pj p sj p v '
where F • and F • are partial fishing mortality rates for the pole-and-line and purse seine fisheries, respectively. The joint likelihood function for returns from the pole-and-line fishery (r •) and the purse seine fishery (r •) may then be written:
7
f({r . ,r .}) = V l PJ s j J / , k
N0-R
N0 ( l -P j "
n ^ v j (N0-R) n{P;i4 (9)
where
p . = e *PJ
(i£ci-KH)M) v i=l PJ
C.+PM J
P 1-e £ + M )
(10)
p . = e r i=l ±- p
C.+PM j
1-e - p- +M)
(11)
and
K
=SpPi i=l
+ P (12)
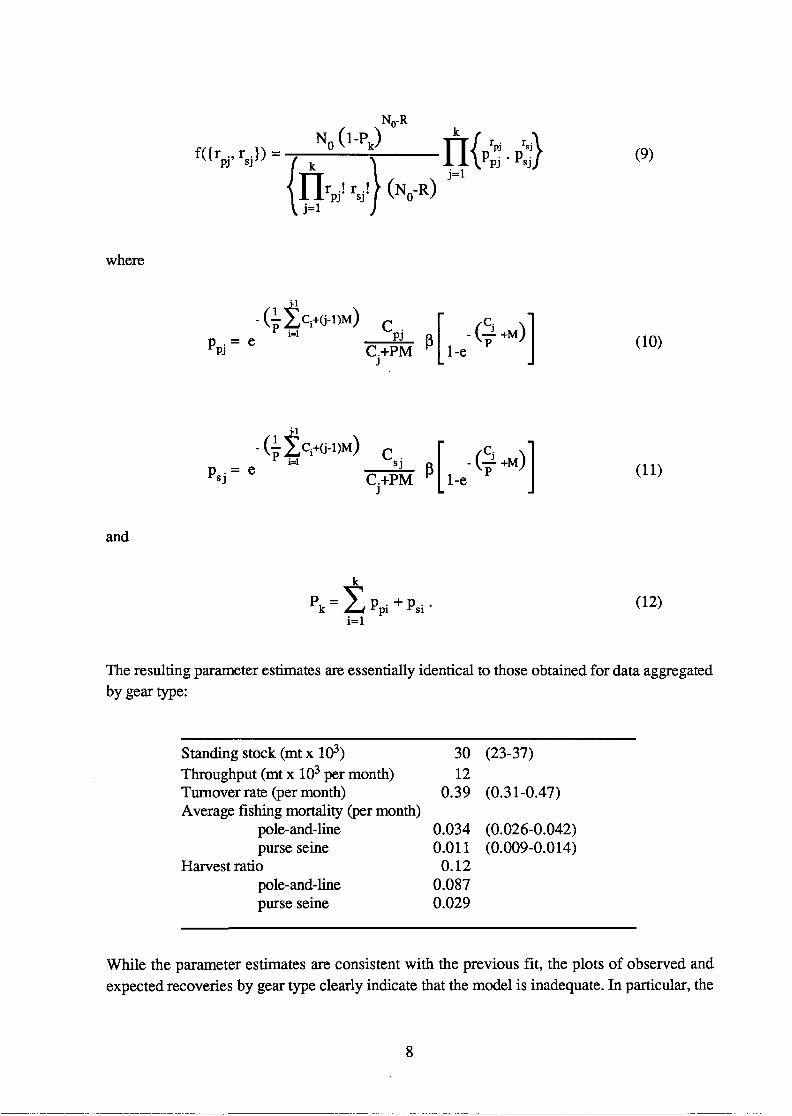
The resulting parameter estimates are essentially identical to those obtained for data aggregated by gear type:
Standing stock (mt x 103) 30 (23-37) Throughput (mt x 103 per month) 12 Turnover rate (per month) 0.39 (0.31-0.47) Average fishing mortality (per month)
pole-and-line 0.034 (0.026-0.042) purse seine 0.011 (0.009-0.014)
Harvest ratio 0.12 pole-and-line 0.087 purse seine 0.029
While the parameter estimates are consistent with the previous fit, the plots of observed and expected recoveries by gear type clearly indicate that the model is inadequate. In particular, the
8
observed numbers of recoveries by pole-and-line vessels (Figure 10) are much less than those that are predicted by the model. Conversely, the observed numbers of purse seine recoveries (Figure 11) are much higher than those expected. This suggests that the tagged skipjack were consistently more available to purse seiners than to pole-and-liners. A possible explanation for this is that most of the skipjack tagged during cruise SB1 were released in the vicinity of FADs. If the tagged skipjack tended to remain associated with these FADs for some time after release, the probability of their capture by purse seine would be greater than by pole-and-line. More complex models of tagged fish dynamics therefore need to be developed to adequately describe this situation.
5. DISCUSSION
5.1 Interpretation of parameter estimates
As explained by Hilborn (1990), throughput is an estimate of the maximum possible average monthly yield (assuming, as is reasonable for skipjack, that recruitment is insensitive to exploitation at levels likely to be achieved under realistic conditions). As such, it is probably the single most useful estimate to consider from a fisheries development viewpoint. It also has the advantage of being statistically precise and stable, being the product of two highly correlated parameters Z (= M+F) and P.
Using the estimated monthly throughput (11,000 mt) as an estimate of maximum yield, the absolute maximum possible yield of skipjack from the Solomon Islands fishery as it is currently distributed would be approximately 130,000 mt. This yield could only be taken at very high levels of F (ignoring the possibility of growth overfishing, with a harvest ratio approaching 1.0) and a very low standing stock that would almost certainly render the fishery uneconomic. Kleiber et al. (1987) suggested that harvest ratios of 0.5-0.7 would result in a fully exploited skipjack resource. Harvest ratios of this magnitude in the Solomon Islands would produce annual yields of approximately 65,000-90,000 mt, although there is no guarantee that such yields could be economically taken. More detailed analyses to produce a reasonable development target for the Solomon Islands fishery are not appropriate at this stage, given the preliminary nature of the data and the deficiencies identified in the simple models used.
5.2 Estimation of fishery interaction
The initial indications obtained from the examination of the geographical distribution of tag recoveries was that skipjack mixed rapidly over much of the area of the Solomon Islands fishery. This, and the overlapping distributions of the pole-and-line and purse seine fisheries suggested that the skipjack resource was simultaneously vulnerable to both gears. In this case, the assessment of interaction would reduce to a simple multi-gear yield-per-recruit problem. However, the predominance of tag returns from the purse seine fishery suggest the the tagged population was not randomly distributed with respect to the two gears and that FADs played a
9
significant role in this observation. This would suggest that the tag release data need to be stratified into FAD-associated and non-FAD-associated components. In any case, further consideration therefore needs to be given to developing models that better account for the effect of FADs on the interaction between the purse seine and pole-and-line fisheries.
REFERENCES
Hilborn, R. 1990. Models of tag dynamics with exchange between available and unavailable populations. Can. J. Fish. Aquat. Sci. 46:1356-1366.
Kleiber, P., A. W. Argue and R. E. Kearney. 1987. Assessment of Pacific skipjack tuna (Katsuwonus pelamis) resources by estimating standing stock and components of population turnover from tagging data. Can. J. Fish. Aquat. Sci. 44:1122-1134.
Pope, J. G. 1972. An investigation of the accuracy of virtual population analysis using cohort analysis. ICNAF Res. Bull. 9: 65-74.
Seber, G. A. F. 1973. Estimation of animal abundance and related parameters. Charles Griffin and Co. Ltd., London. 654 pp.
10
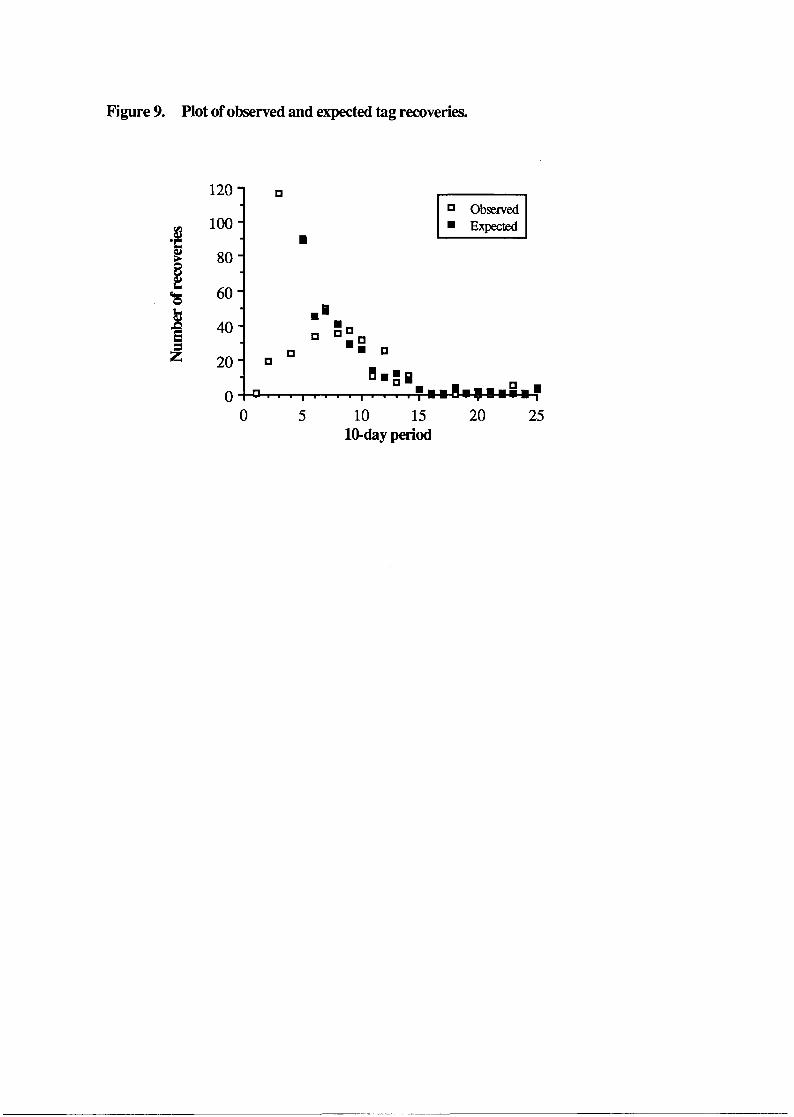
Figure 9. Plot of observed and expected tag recoveries.
1?0i
100"
80-
60"
40 -
20"
0 "I (
D
D
)
Q Observed • Expected
•
• _
a • D
D • • D
5 10 15 10-day period
20
, 1 1 i
2i
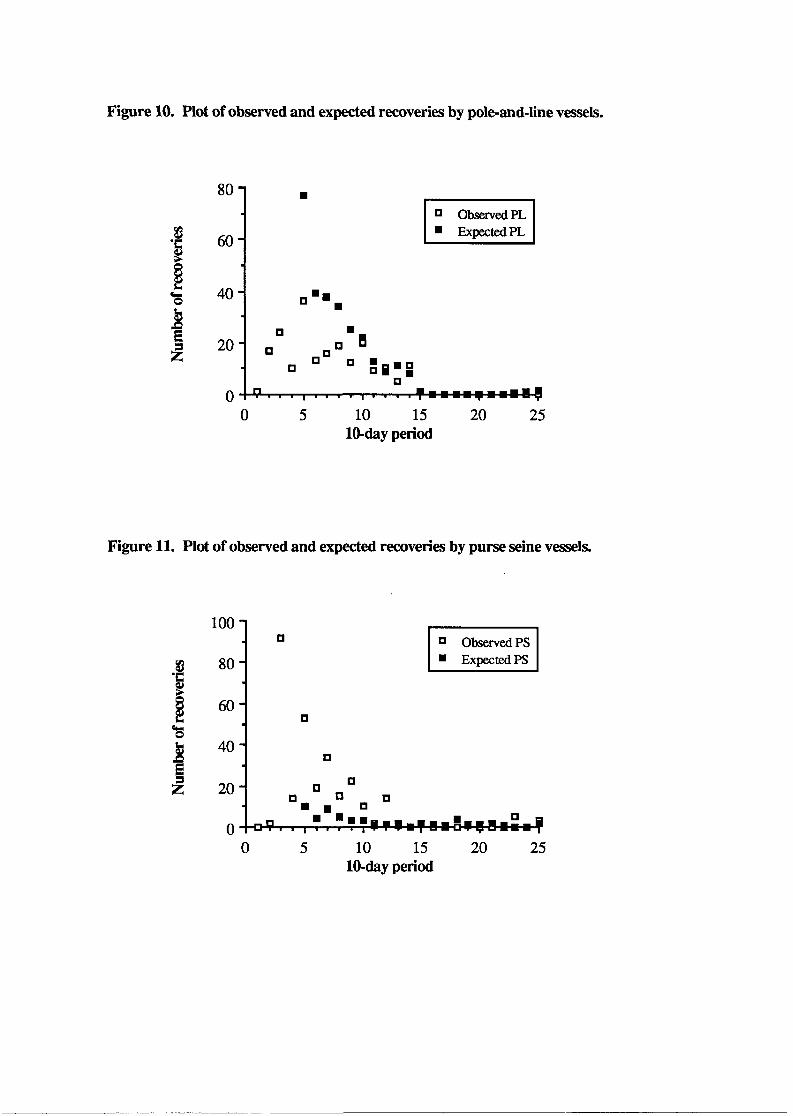
Figure 10. Plot of observed and expected recoveries by pole-and-line vessels.
1
I
80 1
60
40
20"
0
Q Observed PL • Expected PL
a D
• I I • ^ • • • • ^ • • • i g 0 10 15
10-day period 20 25
Figure 11. Plot of observed and expected recoveries by purse seine vessels.
!
I
uu_
80-
60-
40-
20"
0 -
•
-0*-r
a
° Observed PS • Expected PS
a
D ° a • D
• • °
0 10 15 10-day period
20 25
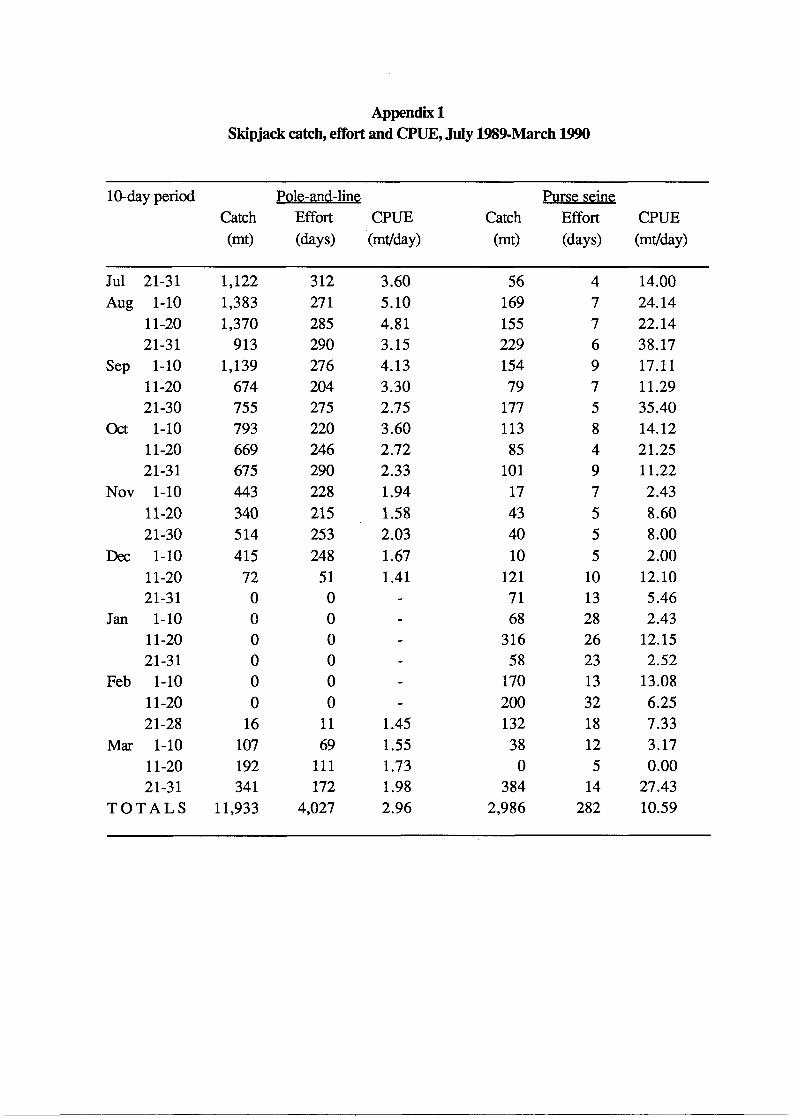
Appendix 1 Skipjack catch, effort and CPUE, July 1989-March 1990
10-day period Pole-and-line Purse seine Catch Effort CPUE Catch Effort CPUE (mt) (days) (mt/day) (mt) (days) (mt/day)
56 169 155 229 154 79 177 113 85 101 17 43 40 10 121 71 68 316 58 170 200 132 38 0
384 2,986
4 7 7 6 9 7 5 8 4 9 7 5 5 5 10 13 28 26 23 13 32 18 12 5 14 282
14.00
24.14
22.14
38.17
17.11
11.29
35.40
14.12
21.25
11.22
2.43
8.60
8.00
2.00
12.10
5.46
2.43
12.15
2.52
13.08
6.25
7.33
3.17
0.00
27.43
10.59
Jul 21-31
Aug 1-10
11-20
21-31
Sep 1-10
11-20
21-30
Oct 1-10
11-20
21-31
Nov 1-10
11-20
21-30
Dec 1-10
11-20
21-31
Jan 1-10
11-20
21-31
Feb 1-10
11-20
21-28
Mar 1-10
11-20
21-31
TOTALS
1,122
1,383
1,370
913 1,139
674 755 793 669 675 443 340 514 415 72 0 0 0 0 0 0 16 107 192 341
11,933
312 271 285 290 276 204 275 220 246 290 228 215 253 248 51 0 0 0 0 0 0 11 69 111 172
4,027
3.60
5.10
4.81
3.15
4.13
3.30
2.75
3.60
2.72
2.33
1.94
1.58
2.03
1.67
1.41
-
-
-
-
-
-
1.45
1.55
1.73
1.98
2.96