Embed Size (px)
Citation preview

Preliminary observation of environmental factorsaround offshore cage system in Jeju island
18th July 2005
Won Chan Lee, Rae Hong Jung, Hyun Taik Oh

Contents
I. Introduction
III. Preliminary observation
IV. Future work
II. Case Study
Offshore fish cage NFRDI

Ⅰ. IntroductionⅠ. Introduction
Offshore fish cageOffshore fish cage NFRDI
Fish culture in the coastal waters of many countries has grown dramatically
in recent years, and further growth is expected in coming decade (FAO) - Fish culture production : 2,000 ton (’96) → 37,000 ton (2003)
The rapid growth led to growing concerns on environmental impact
1) Dispersion high organic and nutrients → Eutrophication, HAB
- 85% of P, 80-88% of C, 52-95% of N as feed supply to environment
- add organic load of cleaning fouled cage to water
2) Deposition high organic matter → anoxic, changing benthic ecosystem
- organic contents of sediment is10 times higher than another coastal zone
- macrofauna is lower species diversity & opportunistic species
3) Chemicals (therapeutants, vitamins and antifoulants) , pathogens and
new gene strains are raising environmental concerns

Offshore fish cageOffshore fish cage NFRDI
To prevent environmental effect of fish cage, there is a general tendency to force
marine fish-farming offshore in USA, Scotland and Hong Kong etc
to establish monitoring methodology for environmental impact of offshore
fish cage
- physical, chemical and benthic animal factors
Ⅰ. IntroductionⅠ. Introduction

Ⅱ. Case study : Mass balanceⅡ. Case study : Mass balance
Offshore fish cage NFRDI
Farm site : Hakdong, 16 net cage(6x6m wide, 5m deep)
Culturing period : Feb. to Dec., 1998
N, P in fish and fish food : CHN analyzer/ Acid digestion
Sedimentation flux : U-type sediment trap, 10m, 1day
Benthic flux : Chamber (50cm x 7cm diameter)
Fish cage
Parameters used in mass balance
Total Environmental Loss (TEL)
: (fish food and juveniles) – (harvest and fish loss) Introduction Environmental Loss : TEL - sediment accumulation Dispersion release from the cage : TEL - sedimentation Sedimentation accumulation : Sedimentation - benthic flux

Ⅱ. Case study : Mass balanceⅡ. Case study : Mass balance
Offshore fish cage NFRDI
ResultsNitrogen is key element in aquatic environments and aquaculture systems
N contents is 3.5% of fish food and 2.5% of fish body
Sedimentation flux : 1055 Nmg/m2/day
Benthic flux : 47 Nmg/m2/day
Summary of nitrogen mass balance in % of total input unit (kg N)
Fish food : 2,548 (95.5%), Juveniles : 121 (4.5%)
Harvest : 704 (26.4), Fish loss : 63 (2.4%)
Sedimentation flux : 218 (8.2), Benthic flux : 11 (0.4)
- Total environmental loss : 1,901 (71.3) - Introduction environmental loss : 1,694 (63.5) - Dispersion release : 1,683 (63.1) - Sediment accumulation : 207 (7.8)

Ⅱ. Case study : Mass balanceⅡ. Case study : Mass balance
Offshore fish cage NFRDI
Fig. Nitrogen mass balance in the cage farm
- TEL : 71.3%

Ⅱ. Case study : Spatial extentⅡ. Case study : Spatial extent
Offshore fish cage NFRDI
Monitoring method to assess the environmental impact by Carroll et al (2003)
- visual diving survey, benthic faunal analysis, sediment chemistry, sediment profile imagery
- All method is very well agreement on impact zone , but BFA is the most sensitive method

Ⅱ. Case study : Spatial extentⅡ. Case study : Spatial extent
Offshore fish cage NFRDI
0%
20%
40%
60%
80%
100%
0m 2m 5m 10m 15m 20m 30m 60m
Distance(m)
0%20%
40%
60%
80%100%
0m 5m 15m 30m 50m
Distance
TS
0%
20%
40%
60%
80%
100%
0m 5m 15m 30m 50m
Distance
TE
Polychaeta Crustacea Mollusca Echinodermata Others
Farm A
Farm B
Numerical Composition of Major Taxonomic Groups

Offshore fish cage NFRDI
0.0
0.5
1.0
1.5
2.0
2.5
3.0
0 2 5 10 15 20 30 60
Distance(m)
Div
ersi
ty(H
')
0.0
0.5
1.0
1.5
2.0
2.5
3.0
0 5 15 30 50
Distance(m)
TS TE
Distribution of Ecological Index
0
5000
10000
15000
20000
Abu
ndan
ce(in
d./m
2 )
0
10
20
30
40
50
Num
ber
of S
peci
es
0
5
10
15
20
25
0
1000
2000
3000
4000
5000
6000
7000
Farm A Farm B
Ⅱ. Case study : Spatial extentⅡ. Case study : Spatial extent

Offshore fish cage NFRDI
Ⅱ. Case study : Spatial extentⅡ. Case study : Spatial extent
0
400
800
1200
1600
2000
0 2 5 10 15 20 30 60
Distance(m)
Cirratulidae sp.
0
200
400
600
800
0 5 15 30 50
Distance(m)
Sigambra tentaculata
0
5000
10000
15000
20000
Capitella cpitata
0
400
800
1200
1600
2000
Lumbrineris longifolia
0
400
800
1200
1600
2000
Tharyx multifilis
0
200
400
600
800
Ab
un
da
nce(i
nd
./m
2 )
Dorvillea rudolphi
0
100
200
300
400
500
Mediomastus californiensis
0100200300400500600
TS TE
Capitella cpitata
0300600900
120015001800
Lumbrineris longifolia
0
1000
2000
3000
4000
5000
6000
Tharyx multifilis
0
50
100
150
200
250
Dorvillea rudolphi
0
30
60
90
120
150 Mediomastus californiensis
Distribution of dominant species

Offshore fish cage NFRDI
Ⅱ. Case study : Spatial extentⅡ. Case study : Spatial extent
T-0mT-2m
T-5m
T-10m
T-15m
T-20m T-30m
T-60m
TE-0mTE-5m
TE-15m TE-30m
TE-50m
TS-0mTS-5m
TS-15m
TS-30mTS-50m
Stress: 0.05
Farm A
Farm B
Highly enriched Slightly enriched
Results of MDS (Multi-Dimensional Scaling)
Offshore fish cage NFRDI
Ⅱ. Case study : Spatial extentⅡ. Case study : Spatial extent
0
20
40
60
80
100
0 2 5 10 15 20 30 60
Distance(m)
ITI
Ind
ex
0
20
40
60
80
100
0 5 15 30 50
Distance(m)
ITI
Inde
x
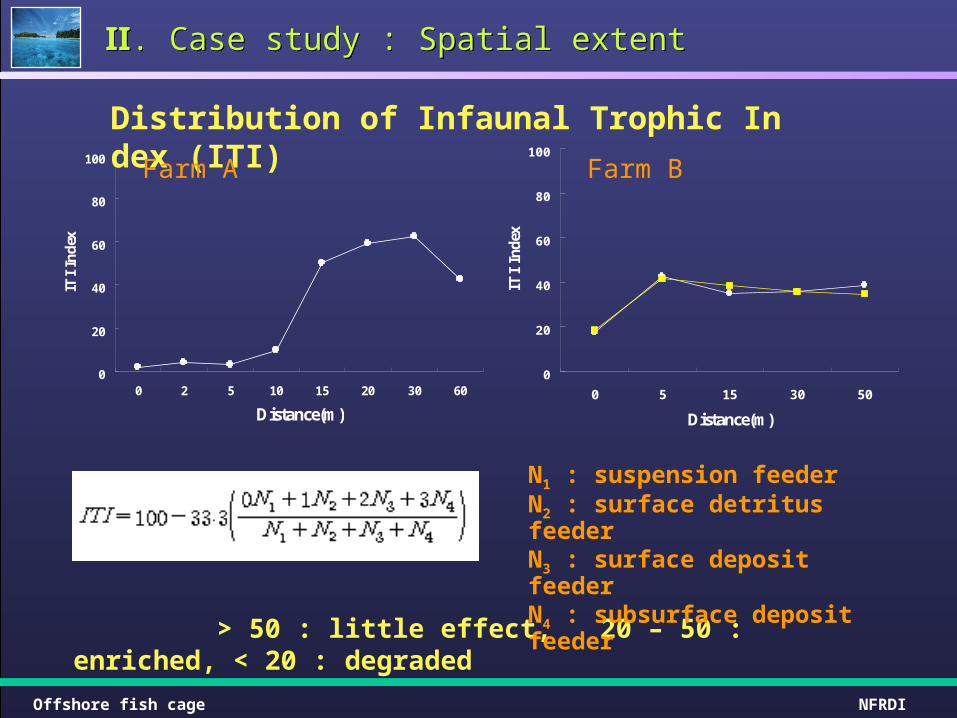
> 50 : little effect, 20 – 50 : enriched, < 20 : degraded
N1 : suspension feederN2 : surface detritus feederN3 : surface deposit feederN4 : subsurface deposit feeder
Distribution of Infaunal Trophic Index (ITI)
Farm A Farm B

Offshore fish cage NFRDI
Ⅲ. Preliminary observation Ⅲ. Preliminary observation
1st monitoring : 15th – 16th June 2005 - physical factors : WT, salinity etc.
- current : draft (1hr), RCM 9 Mk (25hr)Ⅱ
2nd monitoring : 13th – 14th July 2005 - physical and chemical factors - benthic fauna
- current : ADCP (16 days) 18th July

Offshore fish cage NFRDI
Ⅲ. Preliminary observation Ⅲ. Preliminary observation
W.T. (oC)
16 18 20 22 24
Dep
th (m
)
50
40
30
20
10
0
(Cage)
W.T. (oC)
16 18 20 22 24
50
40
30
20
10
0
(100m)
W.T. (oC)
16 18 20 22 24
50
40
30
20
10
0
(500m)
Sal.
31.5 32.0 32.5 33.0 33.5 34.0 34.5 35.0
Dep
th (m
)
50
40
30
20
10
0
(Cage)
Sal.
31.5 32.0 32.5 33.0 33.5 34.0 34.5 35.0
50
40
30
20
10
0
(100 m)
Sal.
31.5 32.0 32.5 33.0 33.5 34.0 34.5 35.0
50
40
30
20
10
0
(500 m)
Distribution of physical factors around offshore cage in June
Offshore fish cage NFRDI
Ⅲ. Preliminary observation Ⅲ. Preliminary observation
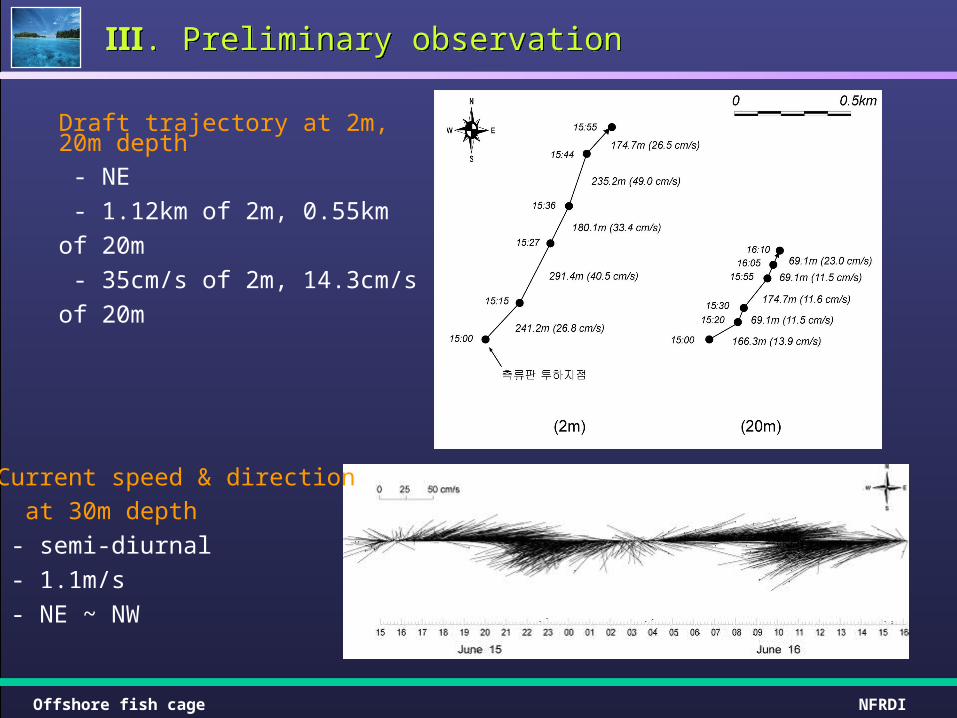
Current speed & direction
at 30m depth
- semi-diurnal
- 1.1m/s
- NE ~ NW
Draft trajectory at 2m, 20m depth
- NE
- 1.12km of 2m, 0.55km of 20m
- 35cm/s of 2m, 14.3cm/s of 20m

Offshore fish cage NFRDI
Ⅳ. Future workⅣ. Future work
establish monitoring methodology : 1st stage
- gathering & analyzing previous research paper
- co-work with NOAA
assess environmental effect : 2nd stage
- sediment chemistry
- benthic fauna analysis
estimate mass balance : 3rd stage
- nitrogen or phosphorus

Thank you for your attention !