Embed Size (px)
Citation preview
Preliminary Research on
2 November, 2017Maryono, Yukie Ochi, Satria Utama, M. Luthfi, Intan Hapsari, Nugroho Budi S, FujinoJunichi,
1
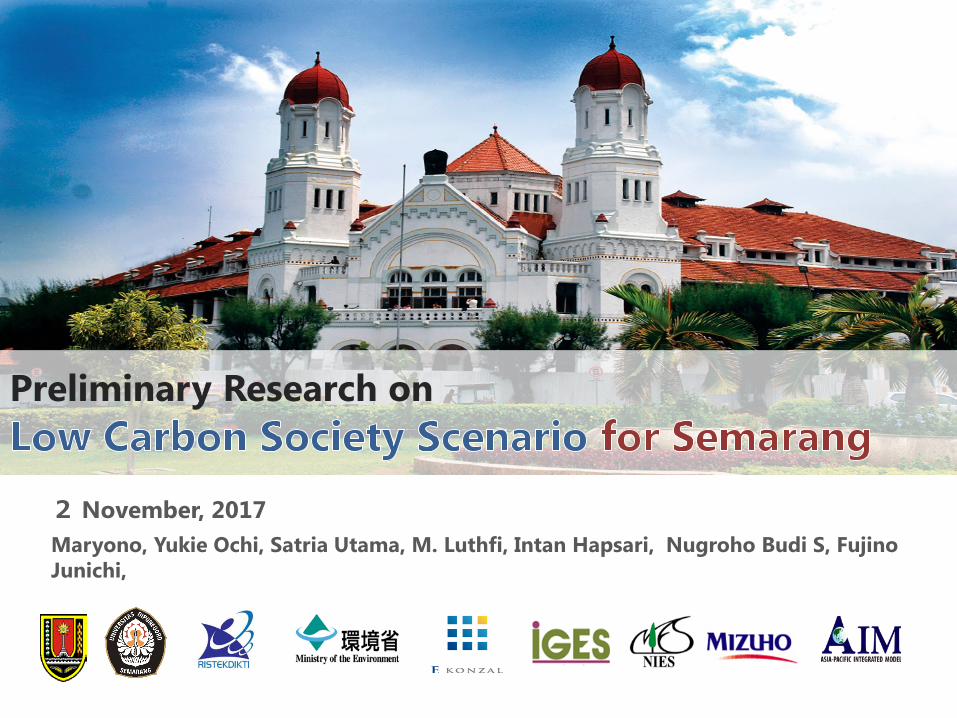
We are here
Semarang City
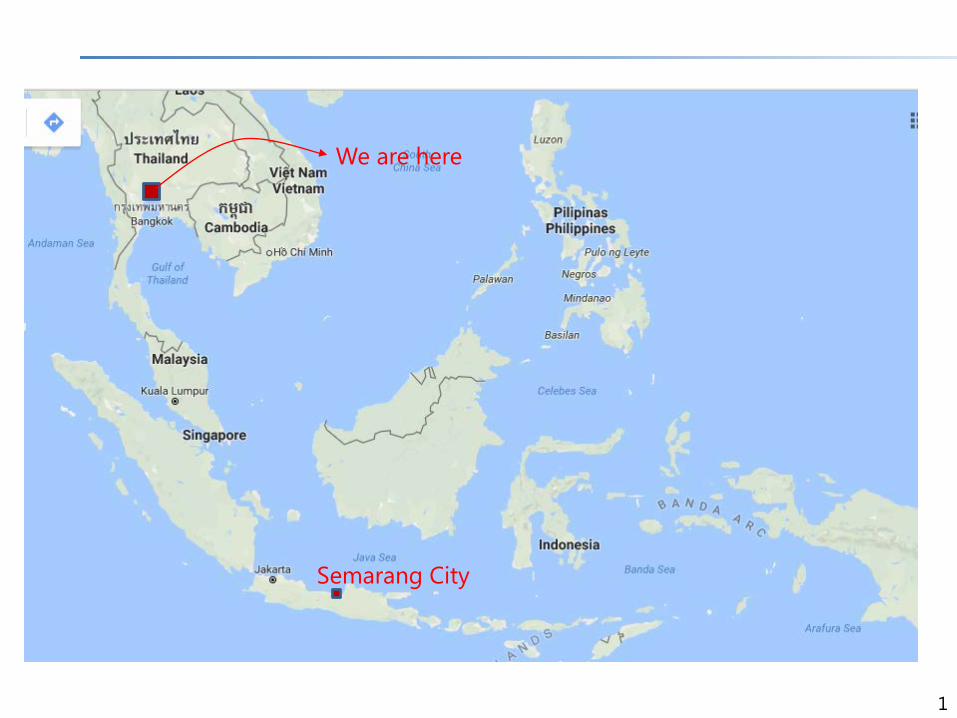
Semarang in 100RC program
2
100RC is initiated by the Rockefeller Foundation aim to helping cities around the world become more resilient
Semarang is the first city in Indonesia who join in 100RC network with the other 99 cities
100RC program adopts a comprehensive definition of urban resilience in the face of shocks and stresses in various fields
Semarang has a City Resilience Strategy in the context of climate change in 2010, need to be updated with more comprehensive and inclusive approach in the making.
The City Resilience Strategy is in parallel with the Semarang Mid Term Development Plan 2016-2021 who is also in the making
100RC Semarang team
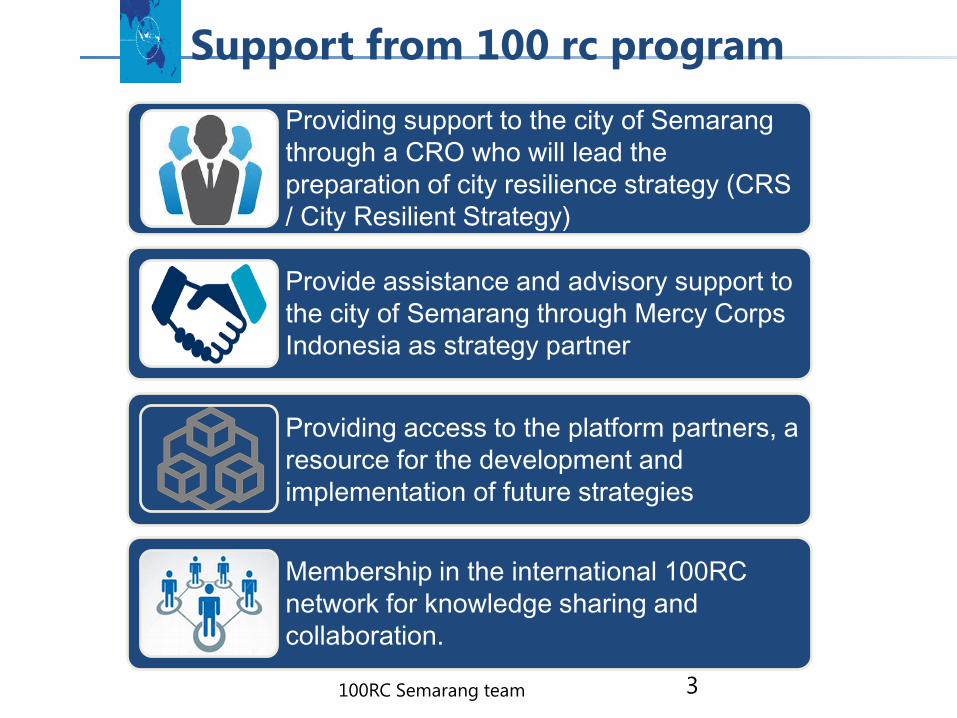
Support from 100 rc program
3
Providing support to the city of Semarang through a CRO who will lead the preparation of city resilience strategy (CRS / City Resilient Strategy)
Provide assistance and advisory support to the city of Semarang through Mercy Corps Indonesia as strategy partner
Providing access to the platform partners, a resource for the development and implementation of future strategies
Membership in the international 100RC network for knowledge sharing and collaboration.
100RC Semarang team
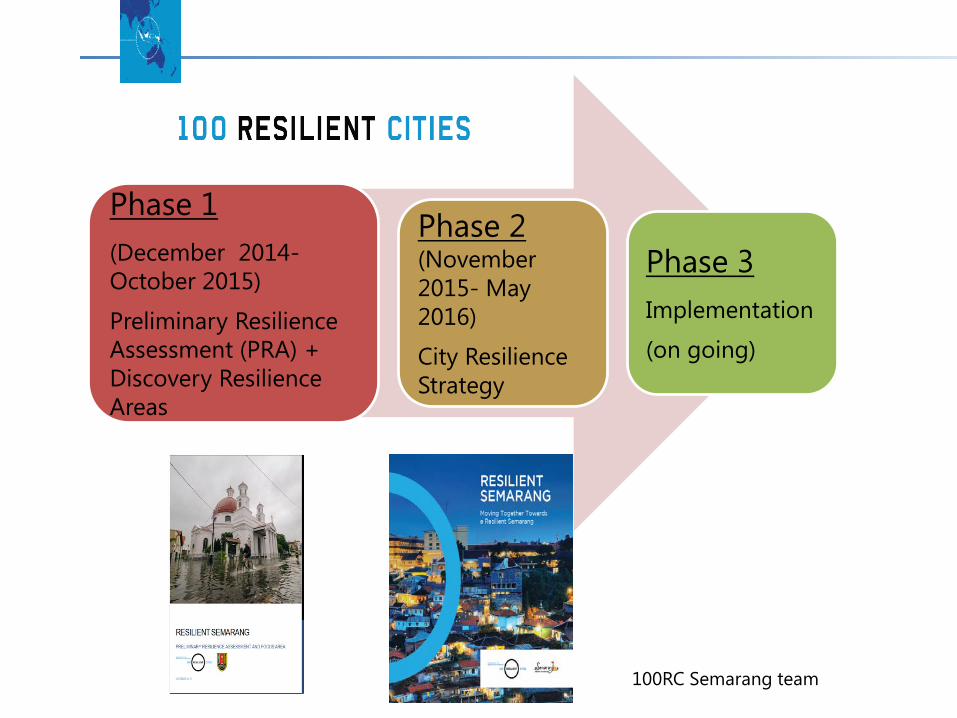
Phase 1 (December 2014-October 2015)
Preliminary Resilience Assessment (PRA) + Discovery Resilience Areas
Phase 2 (November 2015- May 2016)
City Resilience Strategy
Phase 3Implementation
(on going)
100RC Semarang team
LCS : Part of Initial action toward Semarang City resilience
5
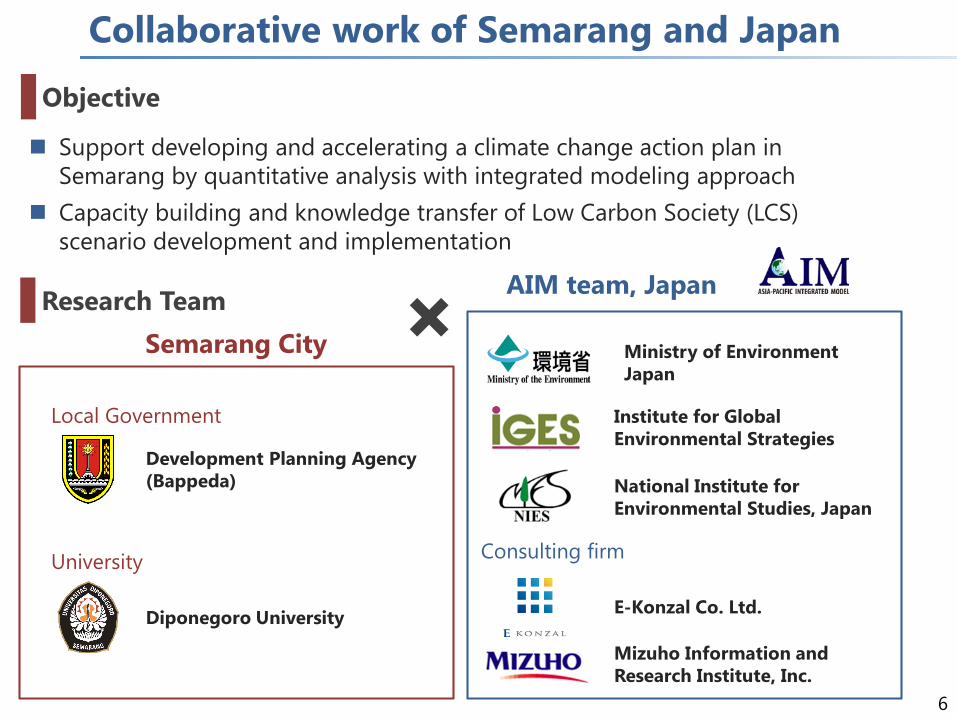
Collaborative work of Semarang and Japan
6
Objective
Support developing and accelerating a climate change action plan in Semarang by quantitative analysis with integrated modeling approach
Capacity building and knowledge transfer of Low Carbon Society (LCS) scenario development and implementation
Research Team
Development Planning Agency (Bappeda)
Diponegoro University
Institute for Global Environmental Strategies
National Institute for Environmental Studies, Japan
E-Konzal Co. Ltd.
Mizuho Information and Research Institute, Inc.
Semarang City
AIM team, Japan
University
Local Government
Consulting firm
Ministry of Environment Japan
7
Before Joint with
LCS team
4
TE
Time or Scenario
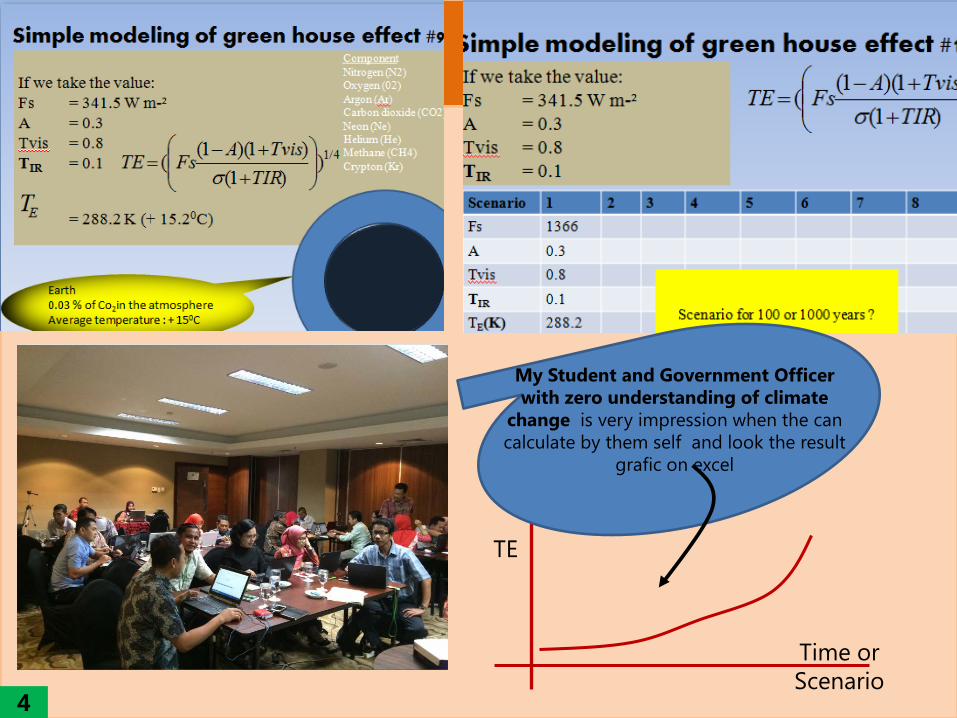
My Student and Government Officer with zero understanding of climate
change is very impression when the can calculate by them self and look the result
grafic on excel
9
Joint with LCS team
7
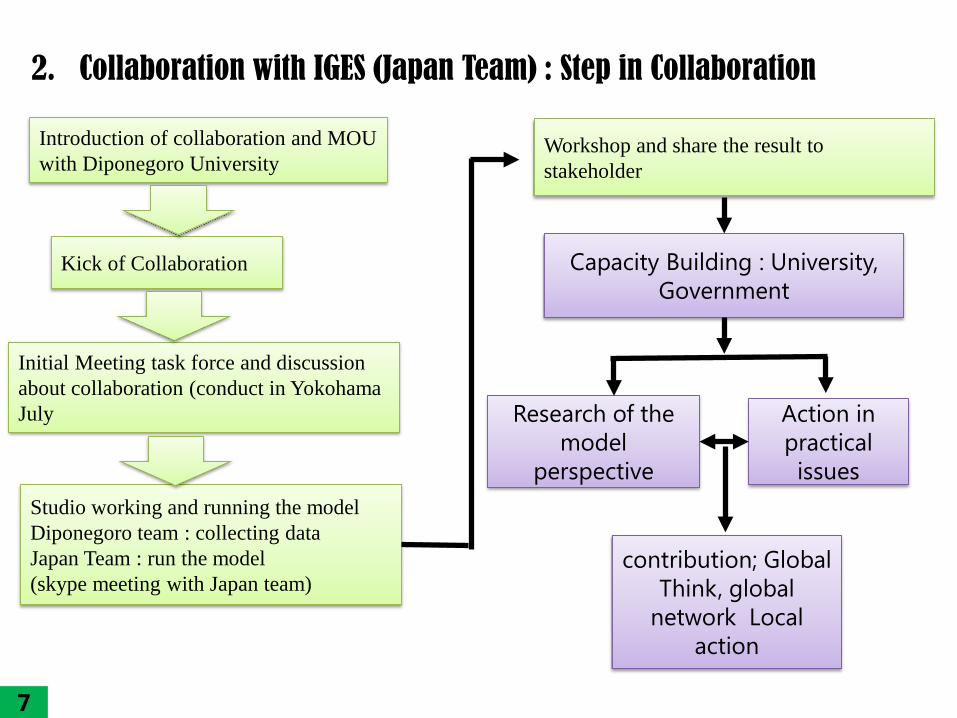
2. Collaboration with IGES (Japan Team) : Step in Collaboration
Introduction of collaboration and MOU with Diponegoro University
Initial Meeting task force and discussion about collaboration (conduct in Yokohama July
Kick of Collaboration
Studio working and running the model Diponegoro team : collecting dataJapan Team : run the model (skype meeting with Japan team)
Workshop and share the result to stakeholder
Capacity Building : University, Government
Research of the model
perspective
Action in practical issues
contribution; Global Think, global
network Local action
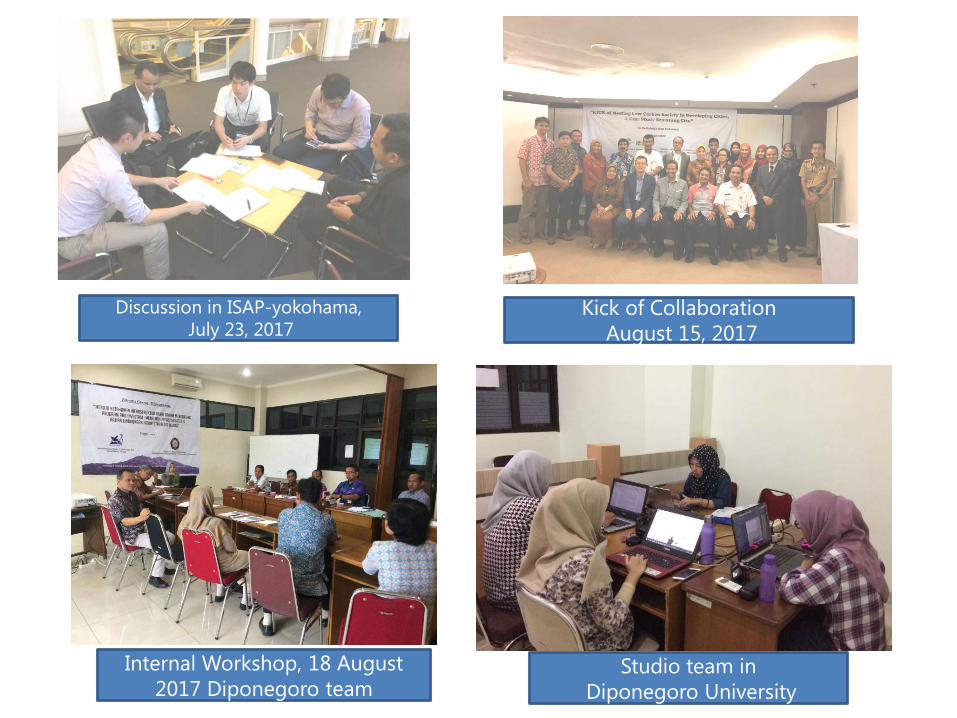
Kick of CollaborationAugust 15, 2017
Discussion in ISAP-yokohama,July 23, 2017
Internal Workshop, 18 August 2017 Diponegoro team
Studio team inDiponegoro University
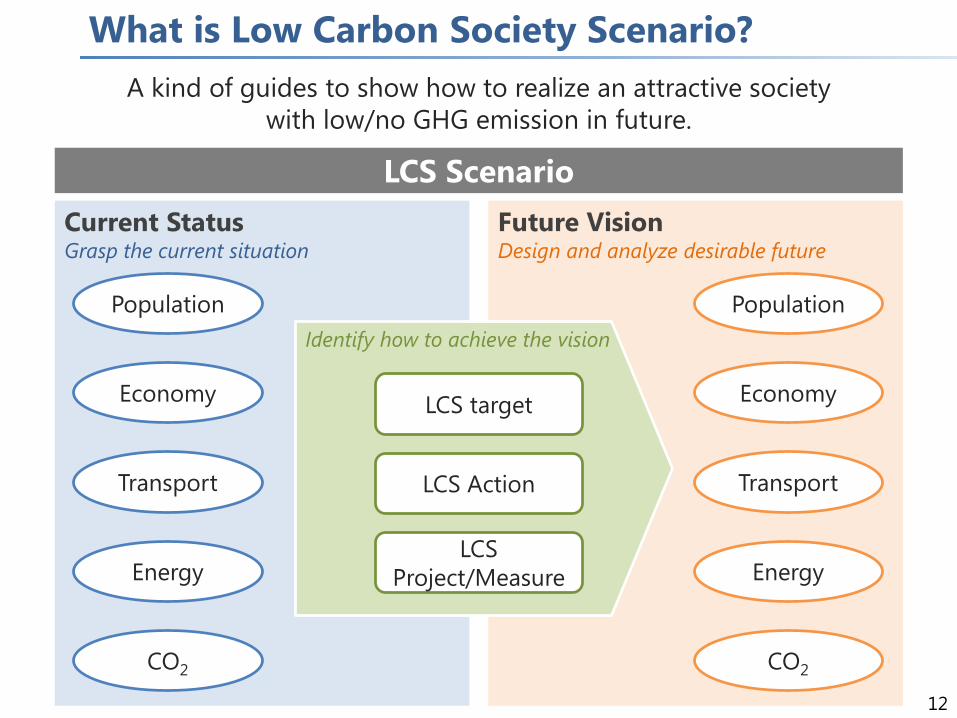
What is Low Carbon Society Scenario?
12
A kind of guides to show how to realize an attractive society with low/no GHG emission in future.
LCS ScenarioCurrent StatusGrasp the current situation
Future VisionDesign and analyze desirable future
Identify how to achieve the visionPopulation
Economy
Transport
Energy
CO2
Population
Economy
Transport
Energy
CO2
LCS target
LCS Action
LCS Project/Measure
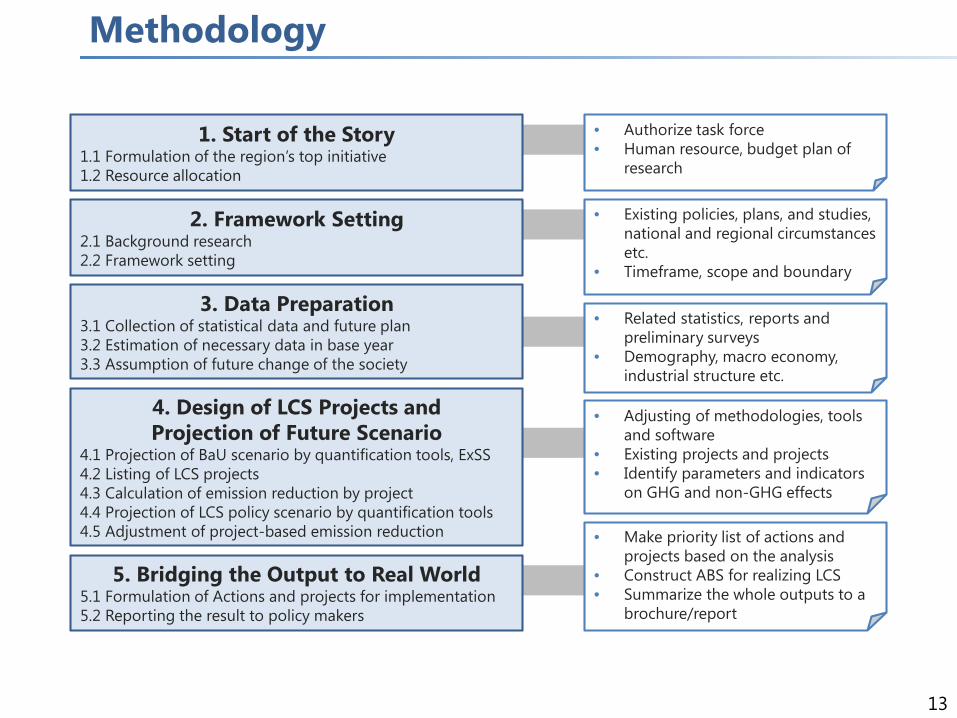
Methodology
13
1. Start of the Story1.1 Formulation of the region’s top initiative1.2 Resource allocation
2. Framework Setting2.1 Background research2.2 Framework setting
3. Data Preparation3.1 Collection of statistical data and future plan3.2 Estimation of necessary data in base year3.3 Assumption of future change of the society
4. Design of LCS Projects andProjection of Future Scenario
4.1 Projection of BaU scenario by quantification tools, ExSS4.2 Listing of LCS projects4.3 Calculation of emission reduction by project4.4 Projection of LCS policy scenario by quantification tools4.5 Adjustment of project-based emission reduction
5. Bridging the Output to Real World 5.1 Formulation of Actions and projects for implementation5.2 Reporting the result to policy makers
• Authorize task force• Human resource, budget plan of
research
• Existing policies, plans, and studies, national and regional circumstances etc.
• Timeframe, scope and boundary
• Related statistics, reports and preliminary surveys
• Demography, macro economy, industrial structure etc.
• Adjusting of methodologies, tools and software
• Existing projects and projects• Identify parameters and indicators
on GHG and non-GHG effects
• Make priority list of actions and projects based on the analysis
• Construct ABS for realizing LCS• Summarize the whole outputs to a
brochure/report
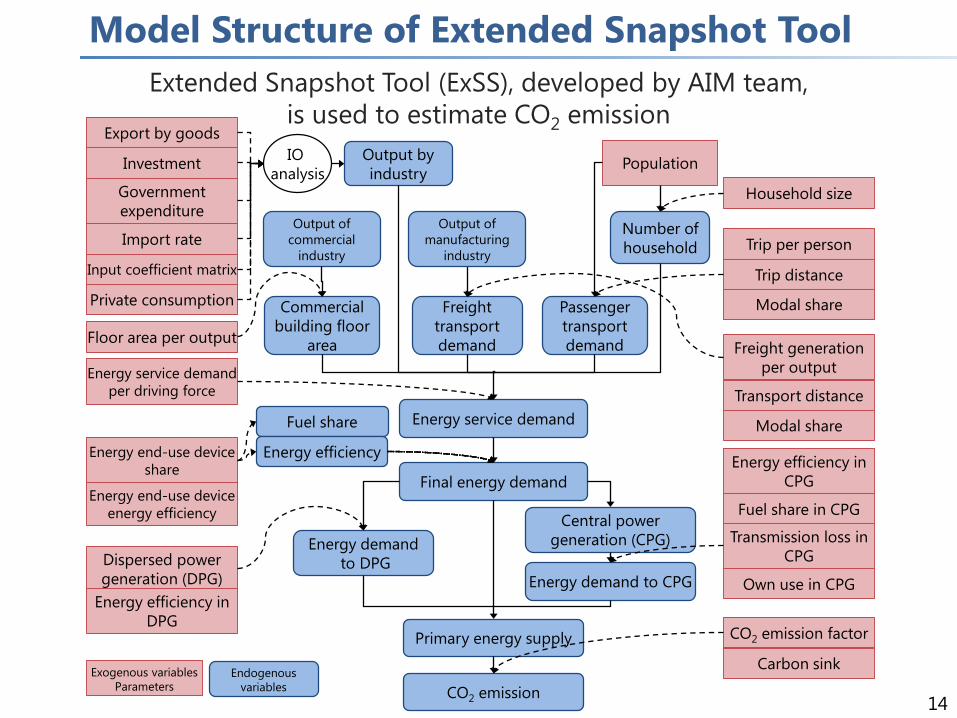
Model Structure of Extended Snapshot Tool
14
Export by goods
Government expenditure
Investment
Import rate
Input coefficient matrix
Household size
Floor area per outputFreight generation
per output
Transport distance
Modal share
Trip per person
Trip distance
Modal share
Energy service demand per driving force
Fuel share
Energy efficiency
CO2 emission factor
IO analysis
Output by industry
Population
Number of household
Output of commercial
industry
Commercial building floor
area
Freight transport demand
Passenger transport demand
Energy service demand
Output of manufacturing
industry
Exogenous variablesParameters
Endogenous variables
Final energy demand
Energy demandto DPG
Central power generation (CPG)
Energy demand to CPG
Primary energy supply
Dispersed power generation (DPG)
CO2 emission
Energy efficiency in DPG
Energy efficiency in CPG
Fuel share in CPG
Transmission loss in CPG
Own use in CPG
Energy end-use device share
Energy end-use device energy efficiency
Carbon sink
Private consumption
Extended Snapshot Tool (ExSS), developed by AIM team, is used to estimate CO2 emission
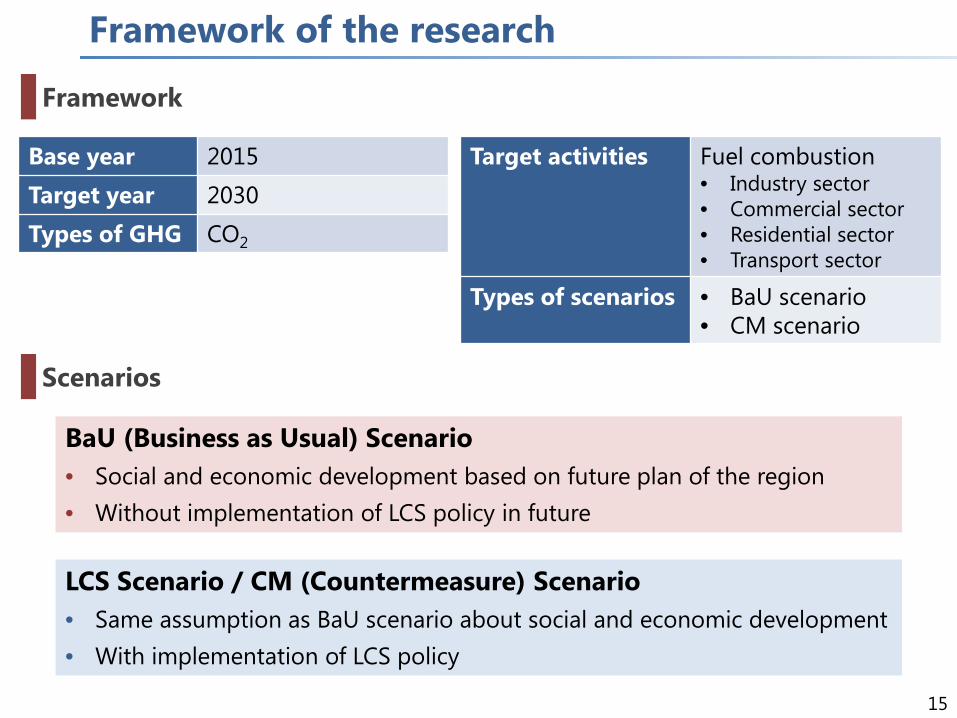
Framework of the research
15
Base year 2015Target year 2030Types of GHG CO2
Framework
Scenarios
BaU (Business as Usual) Scenario• Social and economic development based on future plan of the region• Without implementation of LCS policy in future
LCS Scenario / CM (Countermeasure) Scenario• Same assumption as BaU scenario about social and economic development• With implementation of LCS policy
Target activities Fuel combustion• Industry sector• Commercial sector• Residential sector• Transport sector
Types of scenarios • BaU scenario• CM scenario
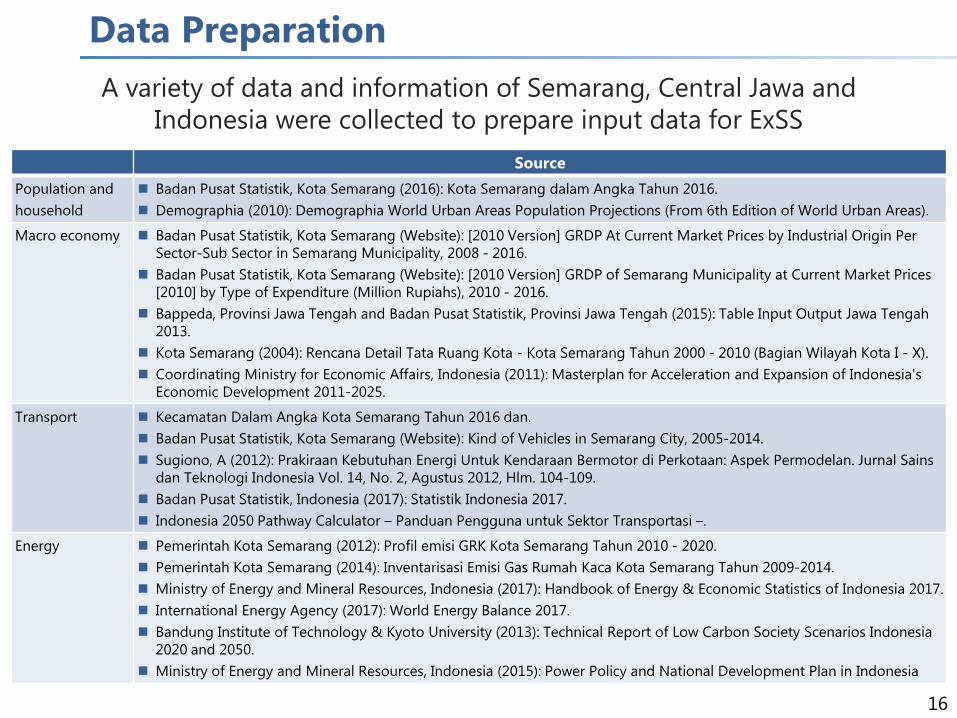
Data Preparation
16
SourcePopulation and household
Badan Pusat Statistik, Kota Semarang (2016): Kota Semarang dalam Angka Tahun 2016. Demographia (2010): Demographia World Urban Areas Population Projections (From 6th Edition of World Urban Areas).
Macro economy Badan Pusat Statistik, Kota Semarang (Website): [2010 Version] GRDP At Current Market Prices by Industrial Origin Per Sector-Sub Sector in Semarang Municipality, 2008 - 2016.
Badan Pusat Statistik, Kota Semarang (Website): [2010 Version] GRDP of Semarang Municipality at Current Market Prices [2010] by Type of Expenditure (Million Rupiahs), 2010 - 2016.
Bappeda, Provinsi Jawa Tengah and Badan Pusat Statistik, Provinsi Jawa Tengah (2015): Table Input Output Jawa Tengah 2013.
Kota Semarang (2004): Rencana Detail Tata Ruang Kota - Kota Semarang Tahun 2000 - 2010 (Bagian Wilayah Kota I - X). Coordinating Ministry for Economic Affairs, Indonesia (2011): Masterplan for Acceleration and Expansion of Indonesia's
Economic Development 2011-2025.
Transport Kecamatan Dalam Angka Kota Semarang Tahun 2016 dan. Badan Pusat Statistik, Kota Semarang (Website): Kind of Vehicles in Semarang City, 2005-2014. Sugiono, A (2012): Prakiraan Kebutuhan Energi Untuk Kendaraan Bermotor di Perkotaan: Aspek Permodelan. Jurnal Sains
dan Teknologi Indonesia Vol. 14, No. 2, Agustus 2012, Hlm. 104-109. Badan Pusat Statistik, Indonesia (2017): Statistik Indonesia 2017. Indonesia 2050 Pathway Calculator – Panduan Pengguna untuk Sektor Transportasi –.
Energy Pemerintah Kota Semarang (2012): Profil emisi GRK Kota Semarang Tahun 2010 - 2020. Pemerintah Kota Semarang (2014): Inventarisasi Emisi Gas Rumah Kaca Kota Semarang Tahun 2009-2014. Ministry of Energy and Mineral Resources, Indonesia (2017): Handbook of Energy & Economic Statistics of Indonesia 2017. International Energy Agency (2017): World Energy Balance 2017. Bandung Institute of Technology & Kyoto University (2013): Technical Report of Low Carbon Society Scenarios Indonesia
2020 and 2050. Ministry of Energy and Mineral Resources, Indonesia (2015): Power Policy and National Development Plan in Indonesia
A variety of data and information of Semarang, Central Jawa and Indonesia were collected to prepare input data for ExSS
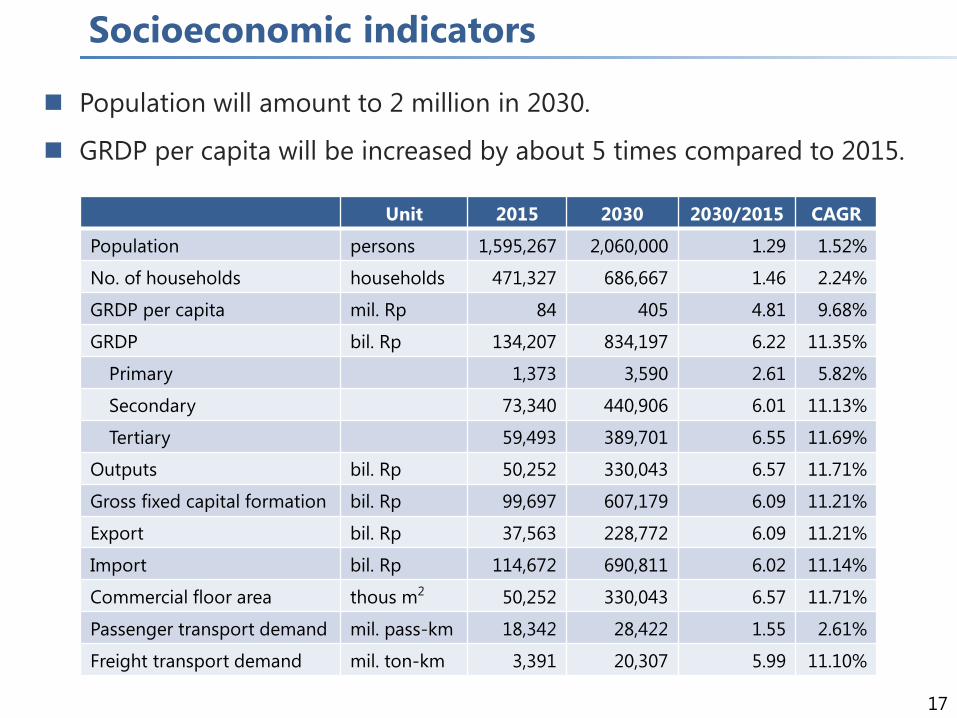
Socioeconomic indicators
17
Unit 2015 2030 2030/2015 CAGR
Population persons 1,595,267 2,060,000 1.29 1.52%
No. of households households 471,327 686,667 1.46 2.24%
GRDP per capita mil. Rp 84 405 4.81 9.68%
GRDP bil. Rp 134,207 834,197 6.22 11.35%
Primary 1,373 3,590 2.61 5.82%
Secondary 73,340 440,906 6.01 11.13%
Tertiary 59,493 389,701 6.55 11.69%
Outputs bil. Rp 50,252 330,043 6.57 11.71%
Gross fixed capital formation bil. Rp 99,697 607,179 6.09 11.21%
Export bil. Rp 37,563 228,772 6.09 11.21%
Import bil. Rp 114,672 690,811 6.02 11.14%
Commercial floor area thous m2 50,252 330,043 6.57 11.71%
Passenger transport demand mil. pass-km 18,342 28,422 1.55 2.61%
Freight transport demand mil. ton-km 3,391 20,307 5.99 11.10%
Population will amount to 2 million in 2030.
GRDP per capita will be increased by about 5 times compared to 2015.
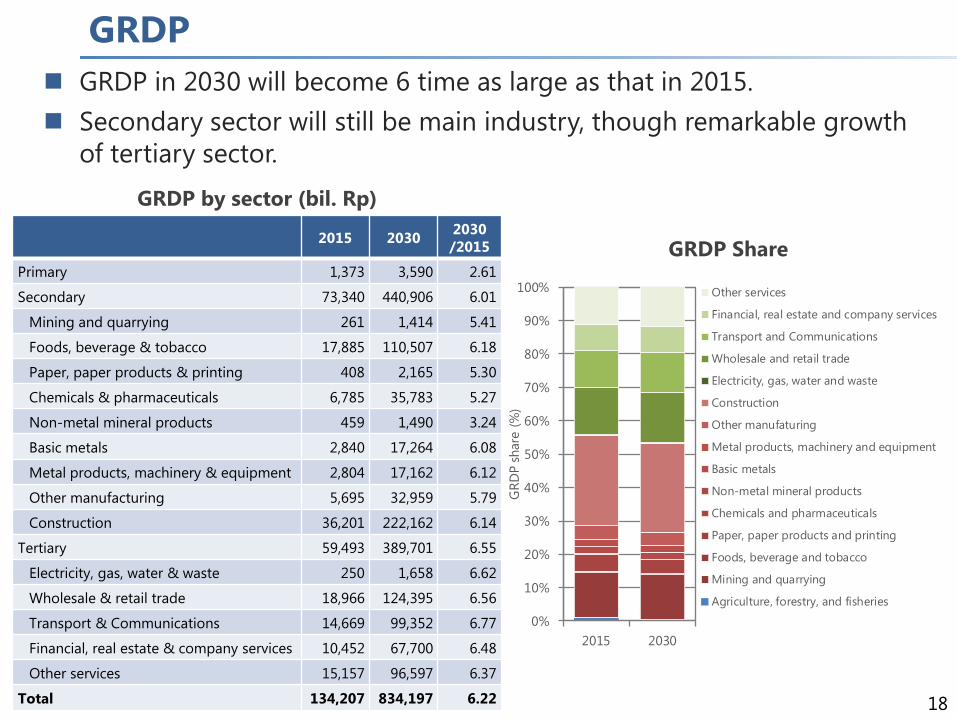
GRDP
18
2015 2030 2030/2015
Primary 1,373 3,590 2.61
Secondary 73,340 440,906 6.01
Mining and quarrying 261 1,414 5.41
Foods, beverage & tobacco 17,885 110,507 6.18
Paper, paper products & printing 408 2,165 5.30
Chemicals & pharmaceuticals 6,785 35,783 5.27
Non-metal mineral products 459 1,490 3.24
Basic metals 2,840 17,264 6.08
Metal products, machinery & equipment 2,804 17,162 6.12
Other manufacturing 5,695 32,959 5.79
Construction 36,201 222,162 6.14
Tertiary 59,493 389,701 6.55
Electricity, gas, water & waste 250 1,658 6.62
Wholesale & retail trade 18,966 124,395 6.56
Transport & Communications 14,669 99,352 6.77
Financial, real estate & company services 10,452 67,700 6.48
Other services 15,157 96,597 6.37
Total 134,207 834,197 6.22
0%
10%
20%
30%
40%
50%
60%
70%
80%
90%
100%
2015 2030
GRD
P sh
are
(%)
Other services
Financial, real estate and company services
Transport and Communications
Wholesale and retail trade
Electricity, gas, water and waste
Construction
Other manufaturing
Metal products, machinery and equipment
Basic metals
Non-metal mineral products
Chemicals and pharmaceuticals
Paper, paper products and printing
Foods, beverage and tobacco
Mining and quarrying
Agriculture, forestry, and fisheries
GRDP in 2030 will become 6 time as large as that in 2015. Secondary sector will still be main industry, though remarkable growth
of tertiary sector.
GRDP Share
GRDP by sector (bil. Rp)
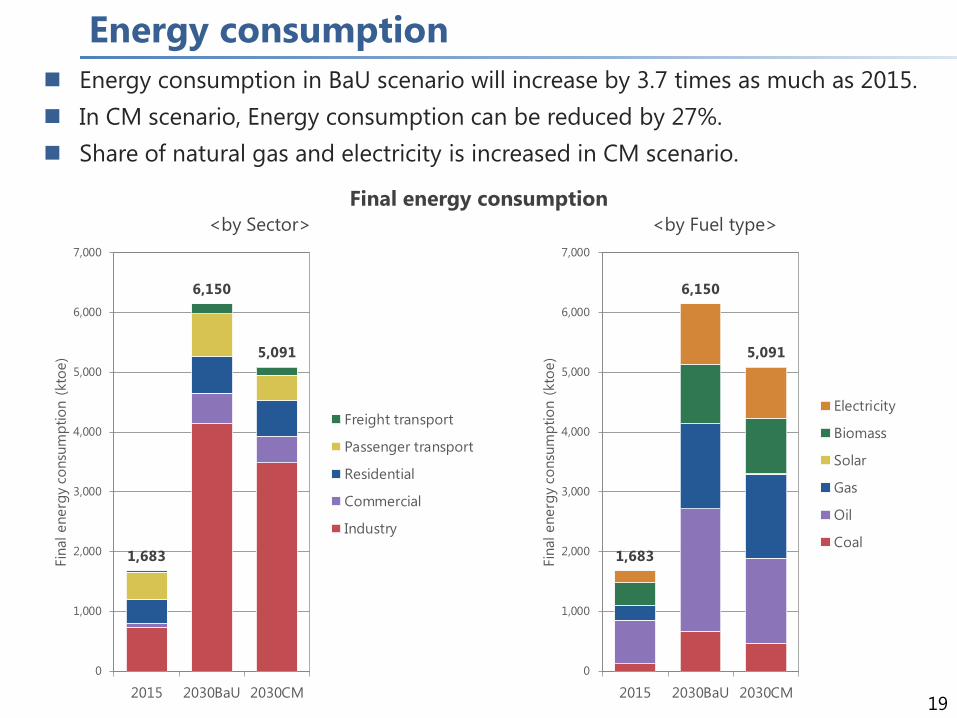
Energy consumption
19
Final energy consumption<by Sector> <by Fuel type>
Energy consumption in BaU scenario will increase by 3.7 times as much as 2015. In CM scenario, Energy consumption can be reduced by 27%. Share of natural gas and electricity is increased in CM scenario.
1,683
6,150
5,091
0
1,000
2,000
3,000
4,000
5,000
6,000
7,000
2015 2030BaU 2030CM
Fina
l ene
rgy
cons
umpt
ion
(kto
e)
Freight transport
Passenger transport
Residential
Commercial
Industry
1,683
6,150
5,091
0
1,000
2,000
3,000
4,000
5,000
6,000
7,000
2015 2030BaU 2030CM
Fina
l ene
rgy
cons
umpt
ion
(kto
e)
Electricity
Biomass
Solar
Gas
Oil
Coal
Carbon emission
20
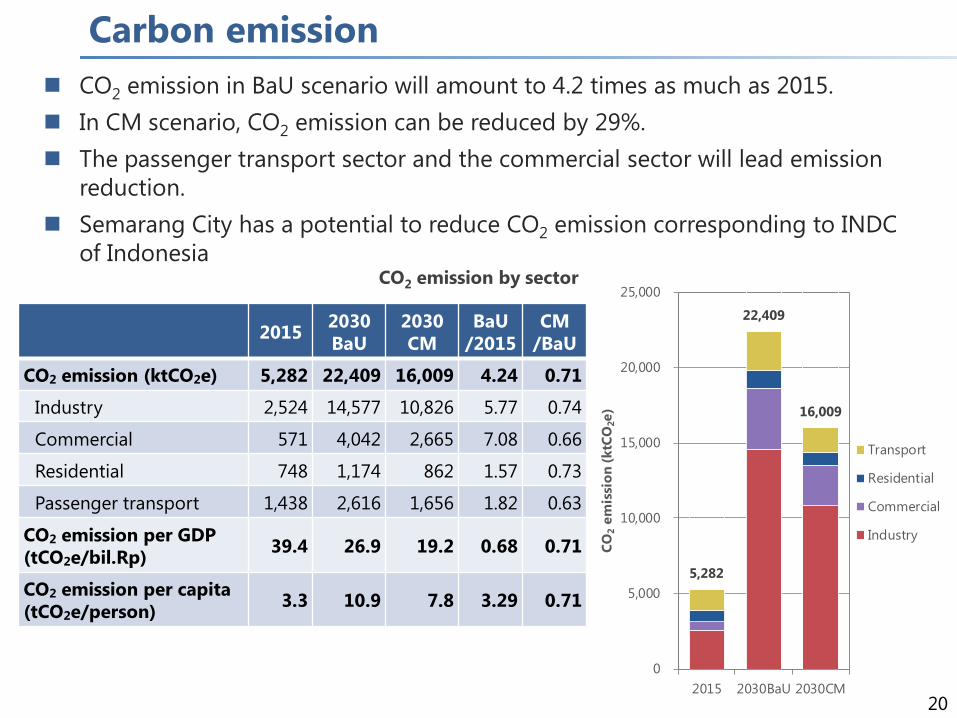
CO2 emission by sector
2015 2030BaU
2030CM
BaU/2015
CM/BaU
CO2 emission (ktCO2e) 5,282 22,409 16,009 4.24 0.71
Industry 2,524 14,577 10,826 5.77 0.74
Commercial 571 4,042 2,665 7.08 0.66
Residential 748 1,174 862 1.57 0.73
Passenger transport 1,438 2,616 1,656 1.82 0.63
CO2 emission per GDP(tCO2e/bil.Rp) 39.4 26.9 19.2 0.68 0.71
CO2 emission per capita(tCO2e/person) 3.3 10.9 7.8 3.29 0.71
CO2 emission in BaU scenario will amount to 4.2 times as much as 2015. In CM scenario, CO2 emission can be reduced by 29%. The passenger transport sector and the commercial sector will lead emission
reduction. Semarang City has a potential to reduce CO2 emission corresponding to INDC
of Indonesia
5,282
22,409
16,009
0
5,000
10,000
15,000
20,000
25,000
2015 2030BaU 2030CM
CO2
emis
sion
(ktC
O2e
)
Transport
Residential
Commercial
Industry
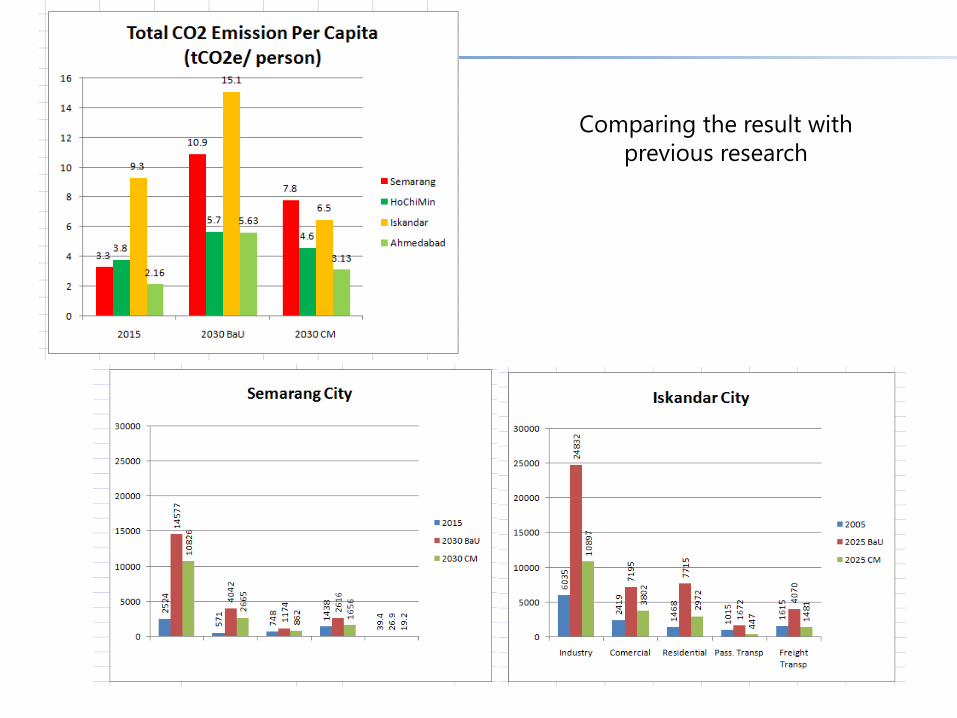
Comparing the result with previous research
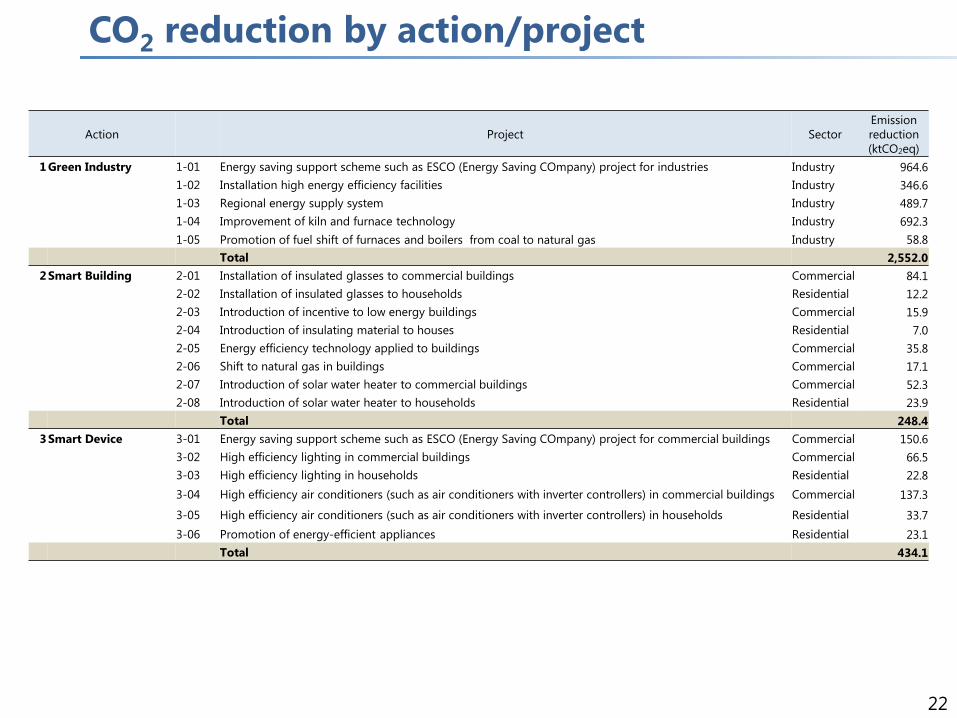
CO2 reduction by action/project
22
Action Project SectorEmission reduction(ktCO2eq)
1Green Industry 1-01 Energy saving support scheme such as ESCO (Energy Saving COmpany) project for industries Industry 964.61-02 Installation high energy efficiency facilities Industry 346.61-03 Regional energy supply system Industry 489.71-04 Improvement of kiln and furnace technology Industry 692.31-05 Promotion of fuel shift of furnaces and boilers from coal to natural gas Industry 58.8
Total 2,552.02Smart Building 2-01 Installation of insulated glasses to commercial buildings Commercial 84.1
2-02 Installation of insulated glasses to households Residential 12.22-03 Introduction of incentive to low energy buildings Commercial 15.92-04 Introduction of insulating material to houses Residential 7.02-05 Energy efficiency technology applied to buildings Commercial 35.82-06 Shift to natural gas in buildings Commercial 17.12-07 Introduction of solar water heater to commercial buildings Commercial 52.32-08 Introduction of solar water heater to households Residential 23.9
Total 248.43Smart Device 3-01 Energy saving support scheme such as ESCO (Energy Saving COmpany) project for commercial buildings Commercial 150.6
3-02 High efficiency lighting in commercial buildings Commercial 66.53-03 High efficiency lighting in households Residential 22.83-04 High efficiency air conditioners (such as air conditioners with inverter controllers) in commercial buildings Commercial 137.3
3-05 High efficiency air conditioners (such as air conditioners with inverter controllers) in households Residential 33.73-06 Promotion of energy-efficient appliances Residential 23.1
Total 434.1
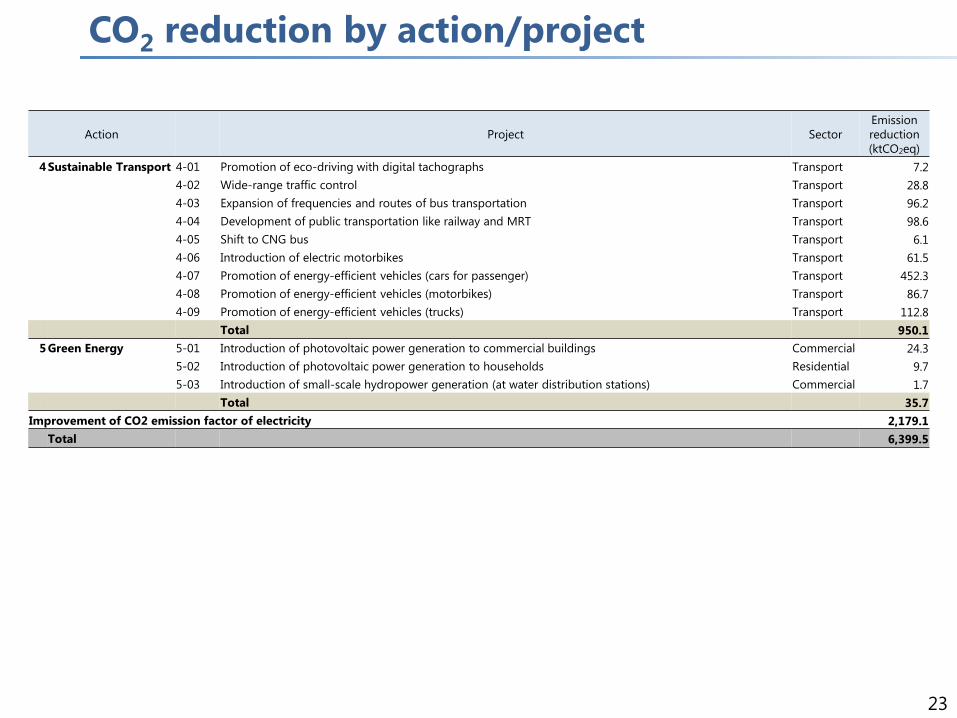
CO2 reduction by action/project
23
Action Project SectorEmission reduction(ktCO2eq)
4Sustainable Transport 4-01 Promotion of eco-driving with digital tachographs Transport 7.24-02 Wide-range traffic control Transport 28.84-03 Expansion of frequencies and routes of bus transportation Transport 96.24-04 Development of public transportation like railway and MRT Transport 98.64-05 Shift to CNG bus Transport 6.14-06 Introduction of electric motorbikes Transport 61.54-07 Promotion of energy-efficient vehicles (cars for passenger) Transport 452.34-08 Promotion of energy-efficient vehicles (motorbikes) Transport 86.74-09 Promotion of energy-efficient vehicles (trucks) Transport 112.8
Total 950.15Green Energy 5-01 Introduction of photovoltaic power generation to commercial buildings Commercial 24.3
5-02 Introduction of photovoltaic power generation to households Residential 9.75-03 Introduction of small-scale hydropower generation (at water distribution stations) Commercial 1.7
Total 35.7Improvement of CO2 emission factor of electricity 2,179.1
Total 6,399.5
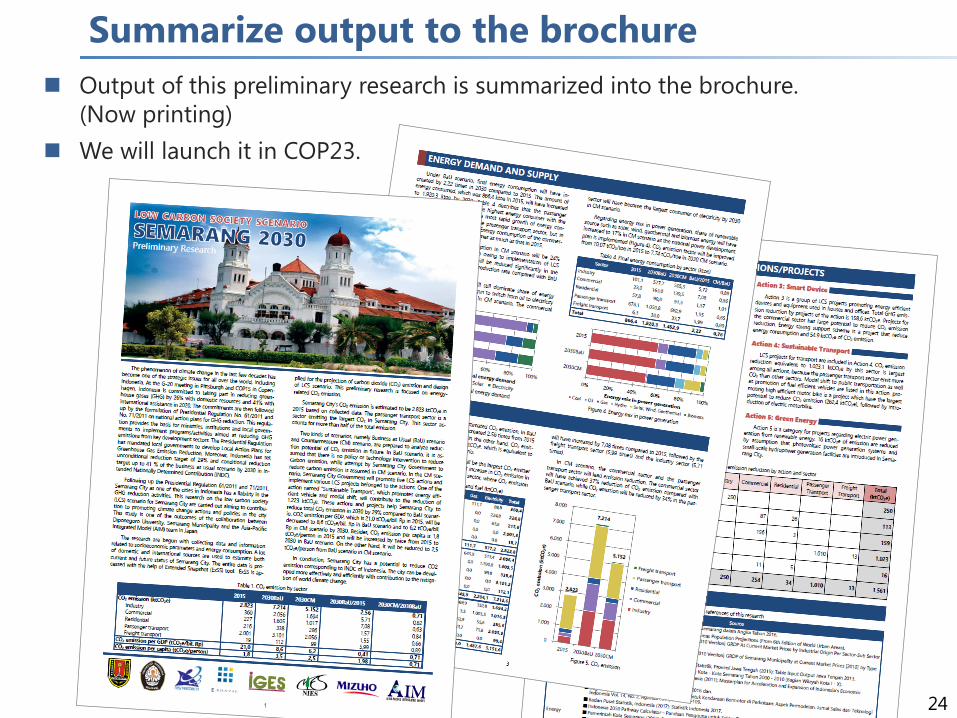
Summarize output to the brochure
24
Output of this preliminary research is summarized into the brochure.(Now printing)
We will launch it in COP23.
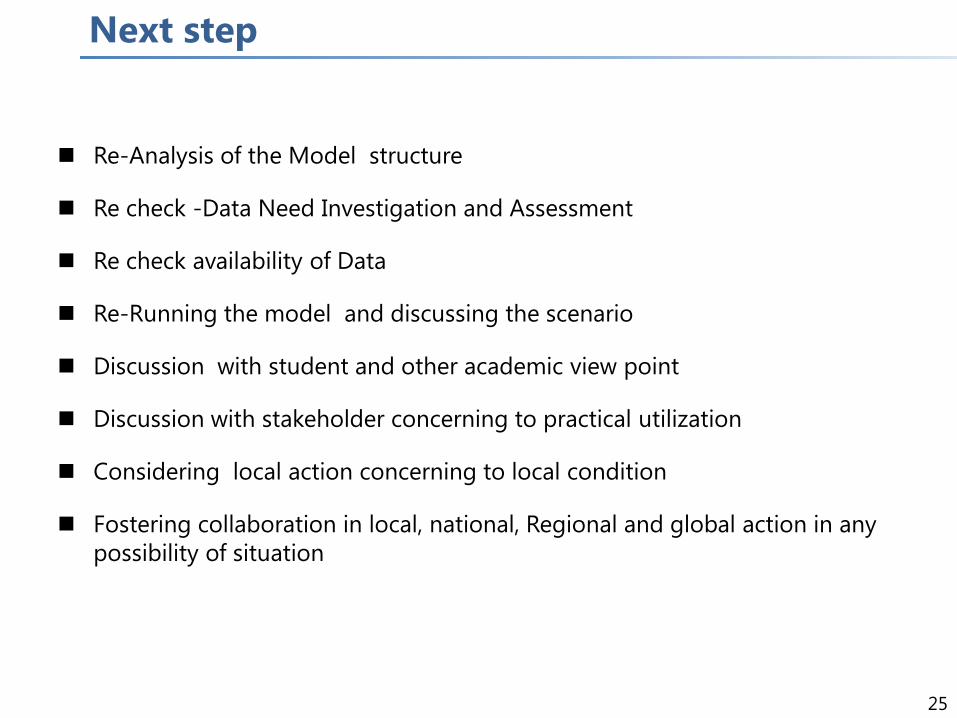
Next step
25
Re-Analysis of the Model structure
Re check -Data Need Investigation and Assessment
Re check availability of Data
Re-Running the model and discussing the scenario
Discussion with student and other academic view point
Discussion with stakeholder concerning to practical utilization
Considering local action concerning to local condition
Fostering collaboration in local, national, Regional and global action in any possibility of situation

26