Embed Size (px)
Citation preview
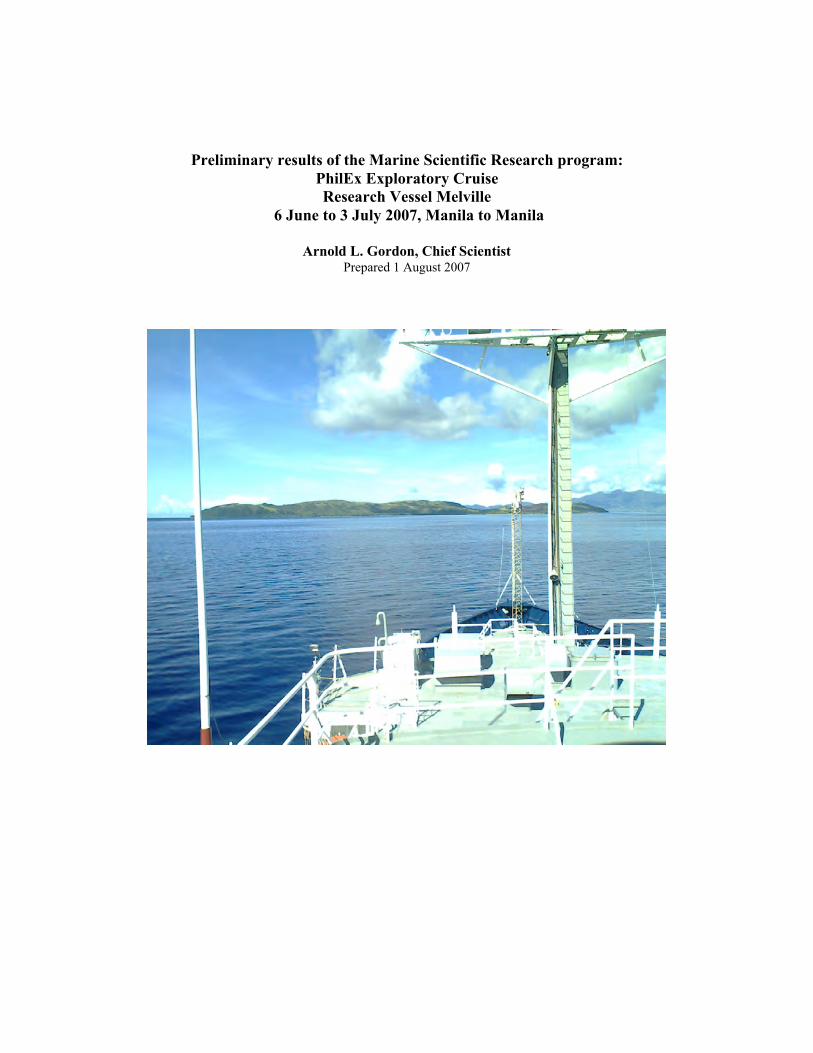
Preliminary results of the Marine Scientific Research program:PhilEx Exploratory CruiseResearch Vessel Melville
6 June to 3 July 2007, Manila to Manila
Arnold L. Gordon, Chief ScientistPrepared 1 August 2007
Preliminary results of the PhilEx Exploratory Cruise
2
I Introduction:
This report filed by the cruise Chief Scientist Arnold L. Gordon, presents thepreliminary results of the Marine Scientific Research program entitled PhilExExploratory Cruise, which took place from the US research vessel Melville from 6 Juneto 3 July 2007, Manila to Manila. However, before presenting the preliminary results abrief overview of the PhilEx program is presented, including the relationship of theExploratory Cruise to the other field cruises of PhilEx.
II PhilEx Objectives:
The complex land/water configuration characteristic of an archipelago leads to anoceanic dynamic regime that is not fully understood and only poorly simulated innumerical models. Philippines Straits Dynamics Experiment [PhilEx], organized andimplemented by a group of university and research institution scientists, is a basicresearch oceanographic project that has been formulated to improve our understandingand ability to model the circulation within the Philippine archipelagos. The complexity ofthe oceanography within the Philippine archipelago present daunting challenges not justto the observational program, but also to proper numerical simulation. These challengesarise from the difficulty in distinguishing between the competing processes that shape theocean circulation, all of which have spatial and temporal characteristics.
The PhilEx goal is to enhance our understanding of the oceanographic processesand features arising in and around straits, and improve our capability to predict theinherent spatial and temporal variability of these regions using models and advanced dataassimilation techniques. Features and processes of interest are those which drive the localspatial variability on short time scales, via their relation to abrupt topography and theirinteraction with the mean flow, tidal and seasonal cycles.
The resultant numerical model, honed by observations, and the enhancedunderstanding of the oceanography of the Philippine waters to be produced by the PhilExprogram will have a multitude of applications in managing marine resources and themarine environment of the Philippines, as well as for issues of marine safety andprediction of marine pollution dispersion.
PhilEx involves many researchers from the USA and from The Philippines. TheUS PhilEx Chief Scientist is Arnold L. Gordon of the Lamont-Doherty Earth Observatoryof Columbia University, Palisades NY. The PhilEx Philippine Chief Scientist is CesarVillanoy of the Marine Science Institute, University of the Philippines, Diliman, QuezonCity 1101.
Fluctuations of circulation and ocean stratification, including small scale [<10km] structures, within the Philippine archipelago are quite vigorous at tidal cycles,along/across the many passages and between seas. The research ship can make many
Preliminary results of the PhilEx Exploratory Cruise
3
important observations but it moves slowly relative to the tides, the ‘spatial’ structures weobserve may actually be changes in time- the question remains: how do we know what isa spatial structure or a time fluctuation?
In order to answer this question, to quantitatively investigate the complex oceancirculation patterns a blend of methods is brought together into an ‘experimental design’,which includes ship based observations linked with time series data obtained fromsatellite, and from in situ moorings, Lagrangian platforms plus model output.
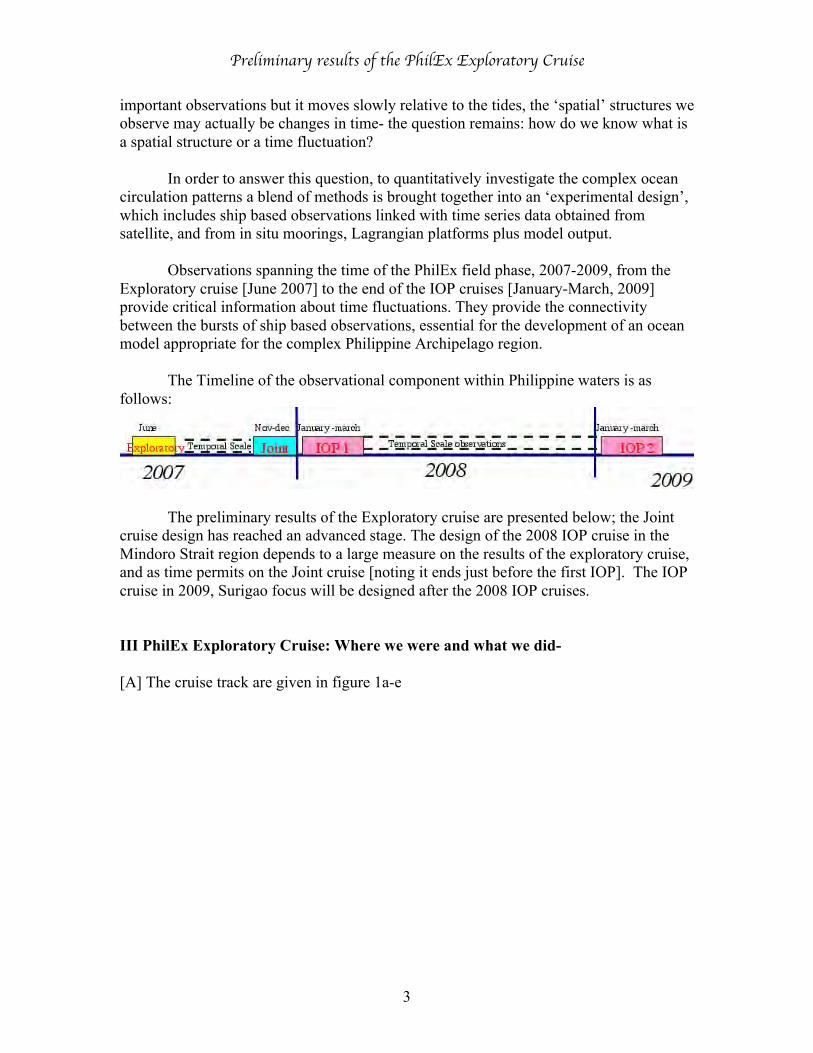
Observations spanning the time of the PhilEx field phase, 2007-2009, from theExploratory cruise [June 2007] to the end of the IOP cruises [January-March, 2009]provide critical information about time fluctuations. They provide the connectivitybetween the bursts of ship based observations, essential for the development of an oceanmodel appropriate for the complex Philippine Archipelago region.
The Timeline of the observational component within Philippine waters is asfollows:
The preliminary results of the Exploratory cruise are presented below; the Jointcruise design has reached an advanced stage. The design of the 2008 IOP cruise in theMindoro Strait region depends to a large measure on the results of the exploratory cruise,and as time permits on the Joint cruise [noting it ends just before the first IOP]. The IOPcruise in 2009, Surigao focus will be designed after the 2008 IOP cruises.
III PhilEx Exploratory Cruise: Where we were and what we did-
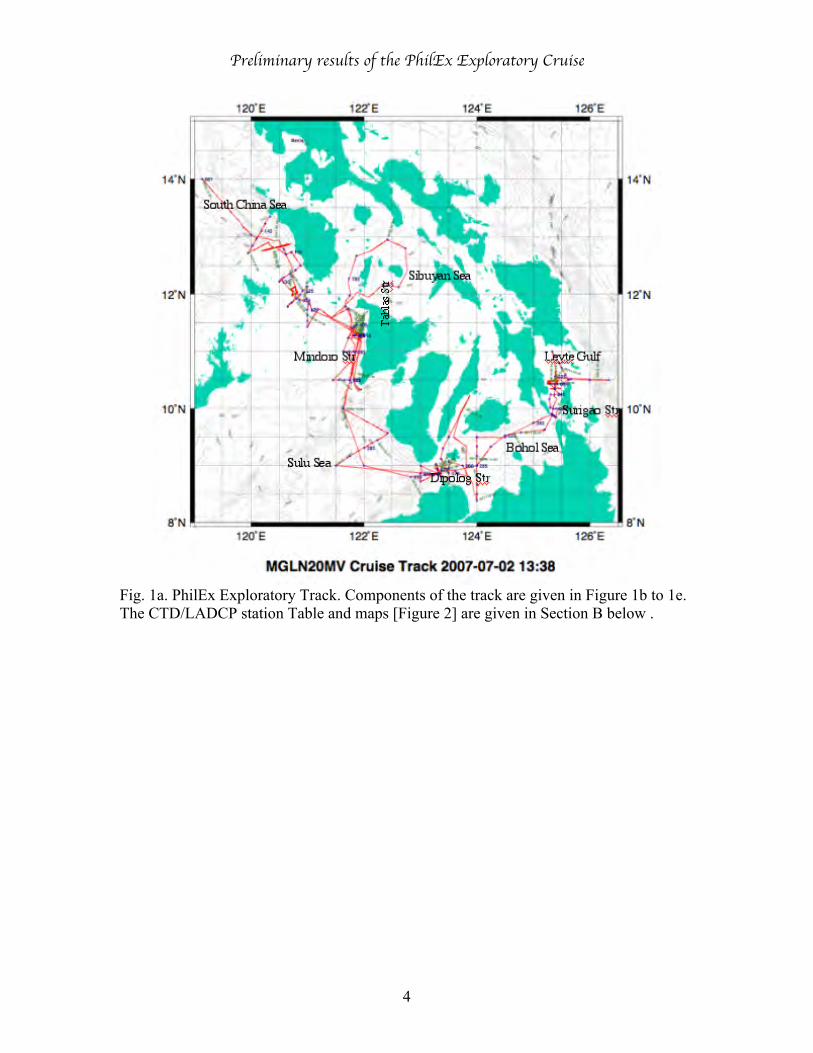
[A] The cruise track are given in figure 1a-e
Preliminary results of the PhilEx Exploratory Cruise
4
Fig. 1a. PhilEx Exploratory Track. Components of the track are given in Figure 1b to 1e.The CTD/LADCP station Table and maps [Figure 2] are given in Section B below .
Preliminary results of the PhilEx Exploratory Cruise
5
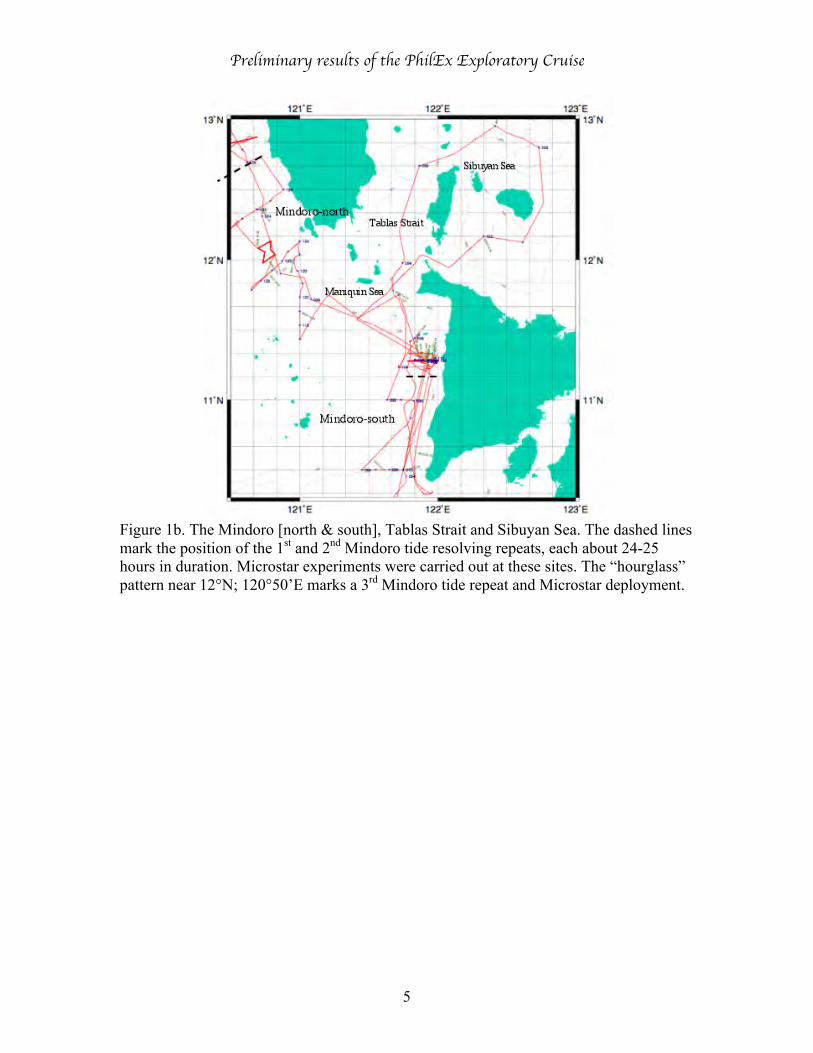
Figure 1b. The Mindoro [north & south], Tablas Strait and Sibuyan Sea. The dashed linesmark the position of the 1st and 2nd Mindoro tide resolving repeats, each about 24-25hours in duration. Microstar experiments were carried out at these sites. The “hourglass”pattern near 12°N; 120°50’E marks a 3rd Mindoro tide repeat and Microstar deployment.
Preliminary results of the PhilEx Exploratory Cruise
6
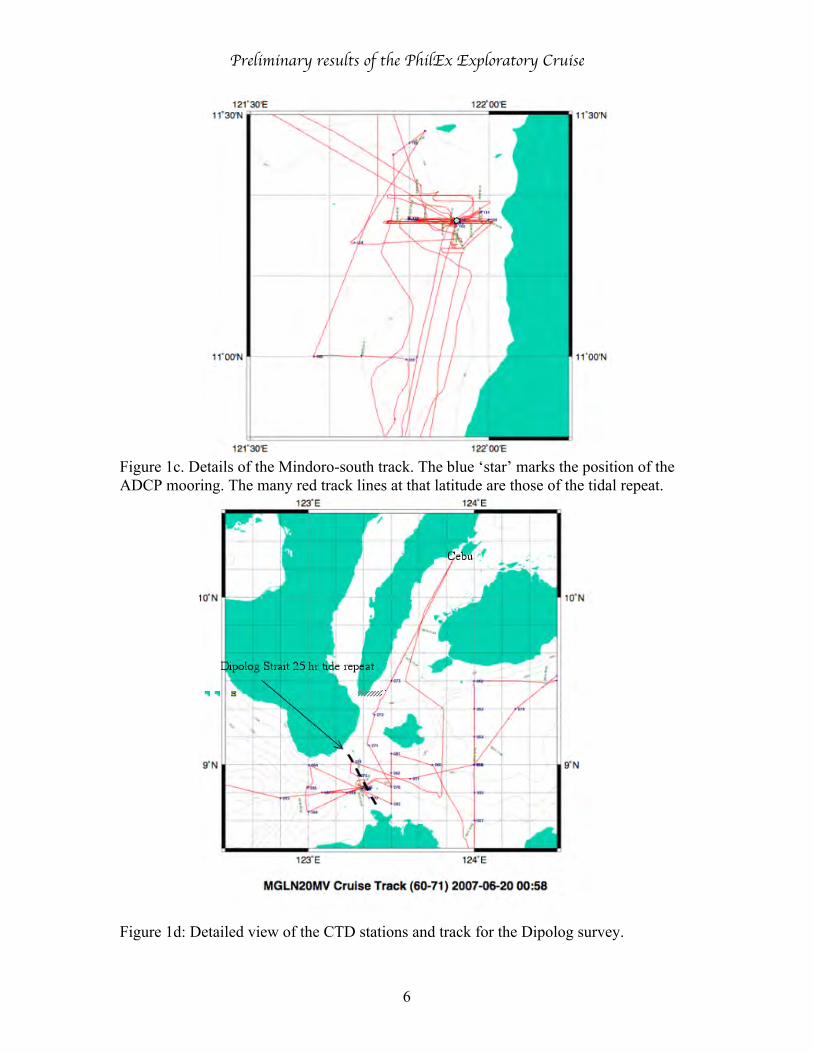
Figure 1c. Details of the Mindoro-south track. The blue ‘star’ marks the position of theADCP mooring. The many red track lines at that latitude are those of the tidal repeat.
Figure 1d: Detailed view of the CTD stations and track for the Dipolog survey.
Preliminary results of the PhilEx Exploratory Cruise
7
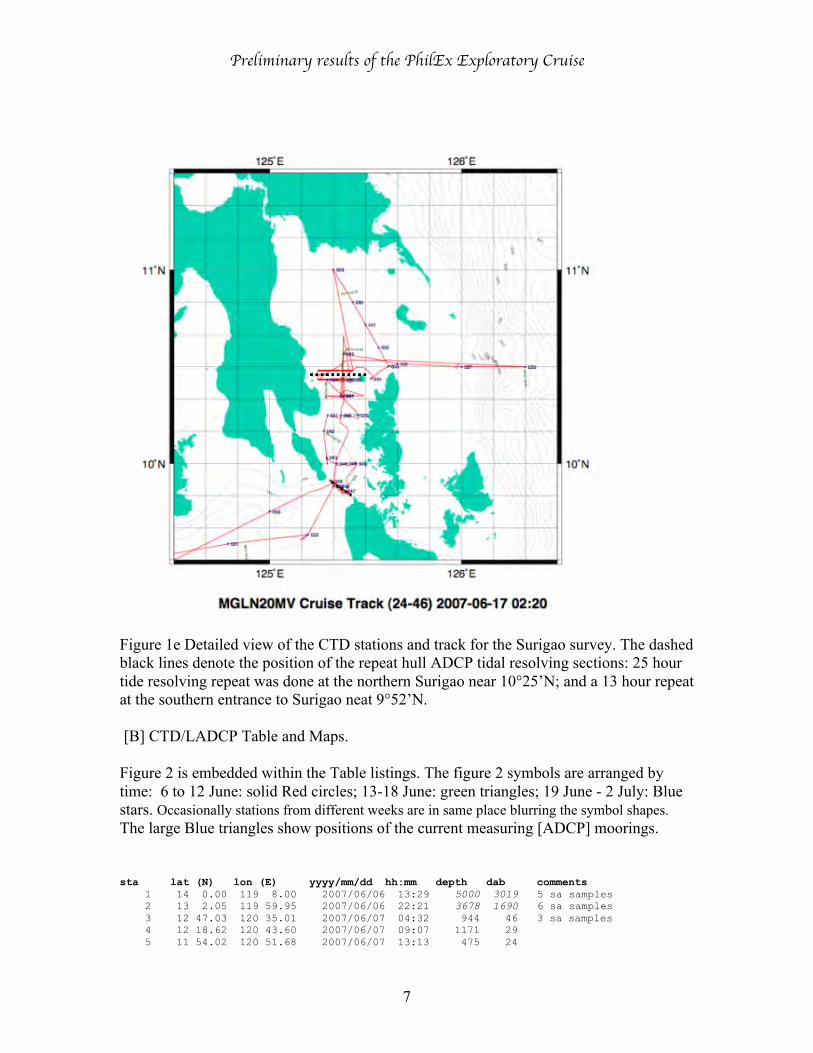
Figure 1e Detailed view of the CTD stations and track for the Surigao survey. The dashedblack lines denote the position of the repeat hull ADCP tidal resolving sections: 25 hourtide resolving repeat was done at the northern Surigao near 10°25’N; and a 13 hour repeatat the southern entrance to Surigao neat 9°52’N.
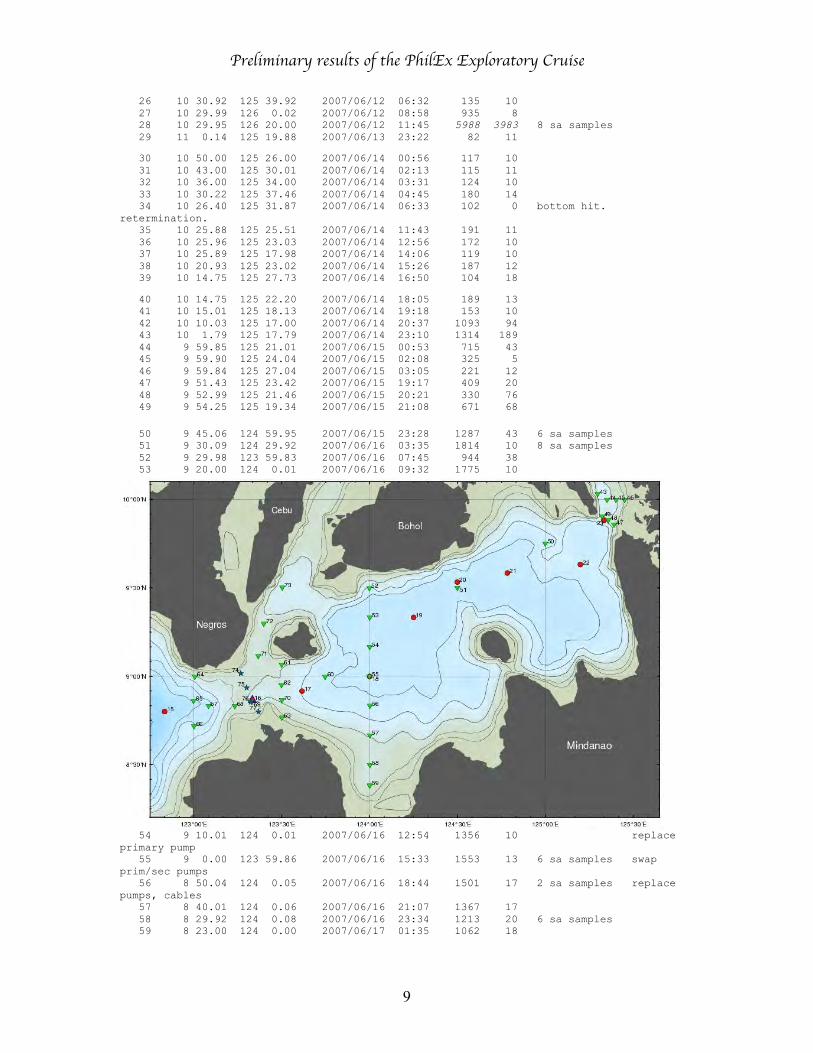
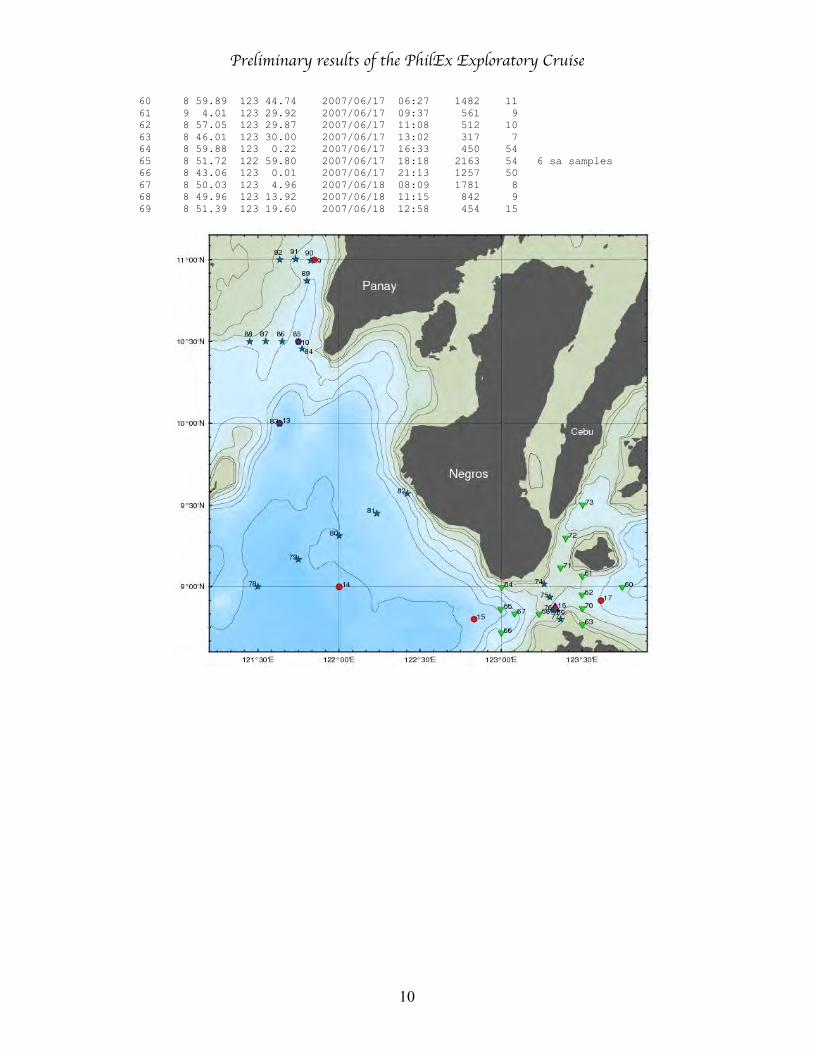
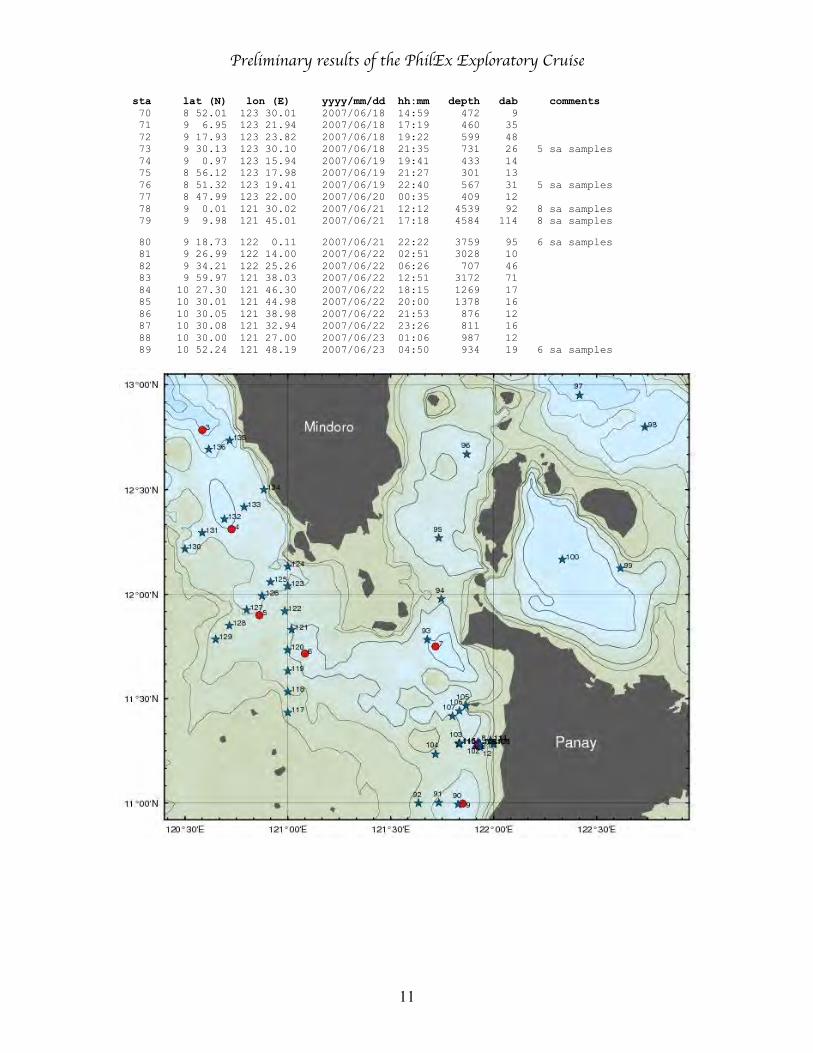
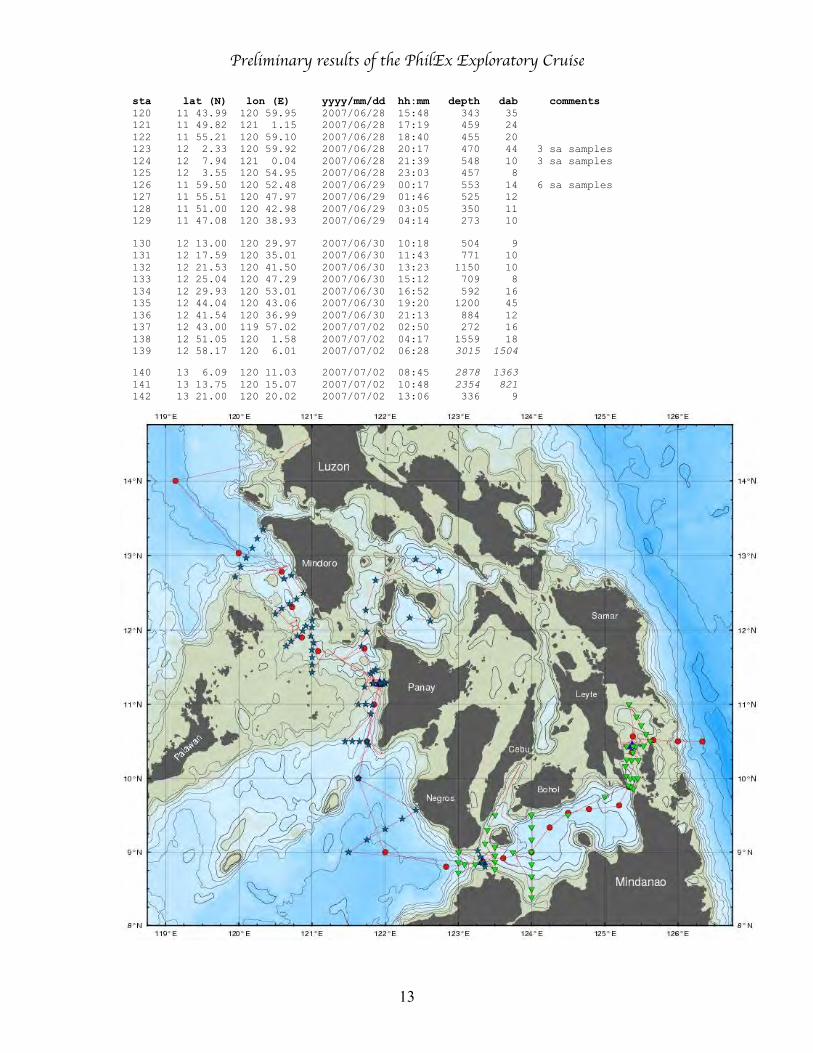
[B] CTD/LADCP Table and Maps.
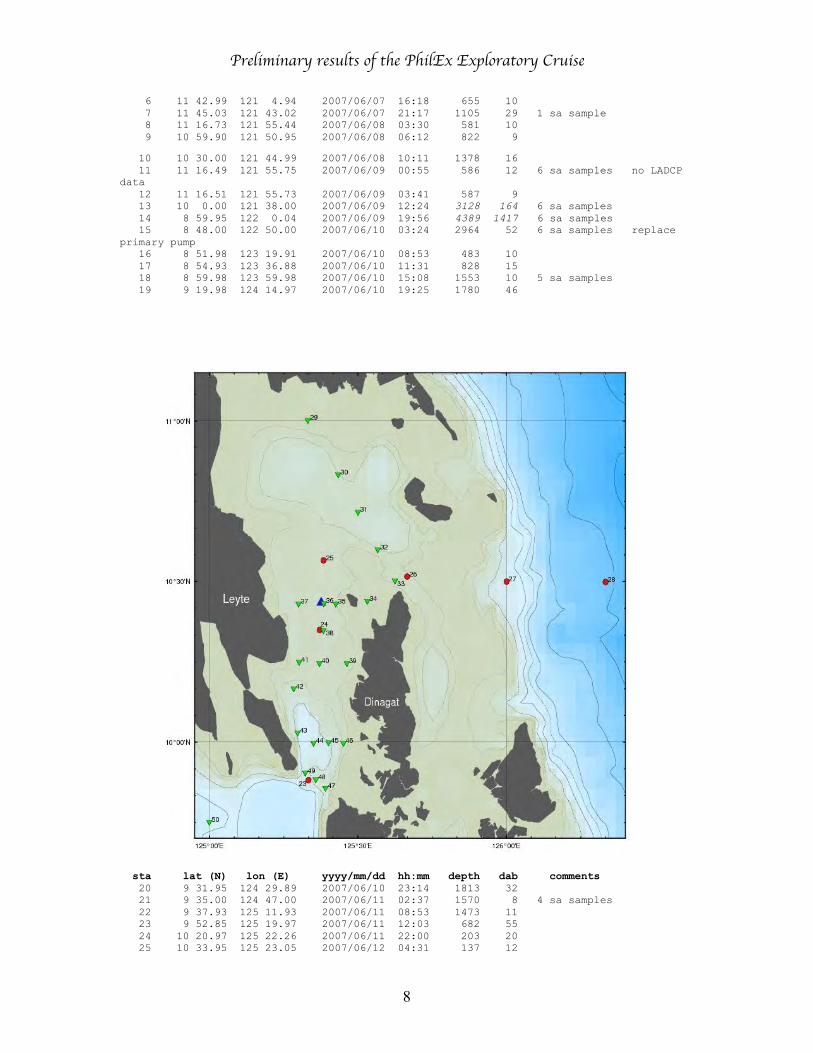
Figure 2 is embedded within the Table listings. The figure 2 symbols are arranged bytime: 6 to 12 June: solid Red circles; 13-18 June: green triangles; 19 June - 2 July: Bluestars. Occasionally stations from different weeks are in same place blurring the symbol shapes.The large Blue triangles show positions of the current measuring [ADCP] moorings.
sta lat (N) lon (E) yyyy/mm/dd hh:mm depth dab comments 1 14 0.00 119 8.00 2007/06/06 13:29 5000 3019 5 sa samples 2 13 2.05 119 59.95 2007/06/06 22:21 3678 1690 6 sa samples 3 12 47.03 120 35.01 2007/06/07 04:32 944 46 3 sa samples 4 12 18.62 120 43.60 2007/06/07 09:07 1171 29 5 11 54.02 120 51.68 2007/06/07 13:13 475 24
Preliminary results of the PhilEx Exploratory Cruise
8
6 11 42.99 121 4.94 2007/06/07 16:18 655 10 7 11 45.03 121 43.02 2007/06/07 21:17 1105 29 1 sa sample 8 11 16.73 121 55.44 2007/06/08 03:30 581 10 9 10 59.90 121 50.95 2007/06/08 06:12 822 9
10 10 30.00 121 44.99 2007/06/08 10:11 1378 16 11 11 16.49 121 55.75 2007/06/09 00:55 586 12 6 sa samples no LADCPdata 12 11 16.51 121 55.73 2007/06/09 03:41 587 9 13 10 0.00 121 38.00 2007/06/09 12:24 3128 164 6 sa samples 14 8 59.95 122 0.04 2007/06/09 19:56 4389 1417 6 sa samples 15 8 48.00 122 50.00 2007/06/10 03:24 2964 52 6 sa samples replaceprimary pump 16 8 51.98 123 19.91 2007/06/10 08:53 483 10 17 8 54.93 123 36.88 2007/06/10 11:31 828 15 18 8 59.98 123 59.98 2007/06/10 15:08 1553 10 5 sa samples 19 9 19.98 124 14.97 2007/06/10 19:25 1780 46
sta lat (N) lon (E) yyyy/mm/dd hh:mm depth dab comments 20 9 31.95 124 29.89 2007/06/10 23:14 1813 32 21 9 35.00 124 47.00 2007/06/11 02:37 1570 8 4 sa samples 22 9 37.93 125 11.93 2007/06/11 08:53 1473 11 23 9 52.85 125 19.97 2007/06/11 12:03 682 55 24 10 20.97 125 22.26 2007/06/11 22:00 203 20 25 10 33.95 125 23.05 2007/06/12 04:31 137 12
Preliminary results of the PhilEx Exploratory Cruise
9
26 10 30.92 125 39.92 2007/06/12 06:32 135 10 27 10 29.99 126 0.02 2007/06/12 08:58 935 8 28 10 29.95 126 20.00 2007/06/12 11:45 5988 3983 8 sa samples 29 11 0.14 125 19.88 2007/06/13 23:22 82 11
30 10 50.00 125 26.00 2007/06/14 00:56 117 10 31 10 43.00 125 30.01 2007/06/14 02:13 115 11 32 10 36.00 125 34.00 2007/06/14 03:31 124 10 33 10 30.22 125 37.46 2007/06/14 04:45 180 14 34 10 26.40 125 31.87 2007/06/14 06:33 102 0 bottom hit.retermination. 35 10 25.88 125 25.51 2007/06/14 11:43 191 11 36 10 25.96 125 23.03 2007/06/14 12:56 172 10 37 10 25.89 125 17.98 2007/06/14 14:06 119 10 38 10 20.93 125 23.02 2007/06/14 15:26 187 12 39 10 14.75 125 27.73 2007/06/14 16:50 104 18
40 10 14.75 125 22.20 2007/06/14 18:05 189 13 41 10 15.01 125 18.13 2007/06/14 19:18 153 10 42 10 10.03 125 17.00 2007/06/14 20:37 1093 94 43 10 1.79 125 17.79 2007/06/14 23:10 1314 189 44 9 59.85 125 21.01 2007/06/15 00:53 715 43 45 9 59.90 125 24.04 2007/06/15 02:08 325 5 46 9 59.84 125 27.04 2007/06/15 03:05 221 12 47 9 51.43 125 23.42 2007/06/15 19:17 409 20 48 9 52.99 125 21.46 2007/06/15 20:21 330 76 49 9 54.25 125 19.34 2007/06/15 21:08 671 68
50 9 45.06 124 59.95 2007/06/15 23:28 1287 43 6 sa samples 51 9 30.09 124 29.92 2007/06/16 03:35 1814 10 8 sa samples 52 9 29.98 123 59.83 2007/06/16 07:45 944 38 53 9 20.00 124 0.01 2007/06/16 09:32 1775 10
54 9 10.01 124 0.01 2007/06/16 12:54 1356 10 replaceprimary pump 55 9 0.00 123 59.86 2007/06/16 15:33 1553 13 6 sa samples swapprim/sec pumps 56 8 50.04 124 0.05 2007/06/16 18:44 1501 17 2 sa samples replacepumps, cables 57 8 40.01 124 0.06 2007/06/16 21:07 1367 17 58 8 29.92 124 0.08 2007/06/16 23:34 1213 20 6 sa samples 59 8 23.00 124 0.00 2007/06/17 01:35 1062 18
Preliminary results of the PhilEx Exploratory Cruise
10
60 8 59.89 123 44.74 2007/06/17 06:27 1482 11 61 9 4.01 123 29.92 2007/06/17 09:37 561 9 62 8 57.05 123 29.87 2007/06/17 11:08 512 10 63 8 46.01 123 30.00 2007/06/17 13:02 317 7 64 8 59.88 123 0.22 2007/06/17 16:33 450 54 65 8 51.72 122 59.80 2007/06/17 18:18 2163 54 6 sa samples 66 8 43.06 123 0.01 2007/06/17 21:13 1257 50 67 8 50.03 123 4.96 2007/06/18 08:09 1781 8 68 8 49.96 123 13.92 2007/06/18 11:15 842 9 69 8 51.39 123 19.60 2007/06/18 12:58 454 15
Preliminary results of the PhilEx Exploratory Cruise
11
sta lat (N) lon (E) yyyy/mm/dd hh:mm depth dab comments 70 8 52.01 123 30.01 2007/06/18 14:59 472 9 71 9 6.95 123 21.94 2007/06/18 17:19 460 35 72 9 17.93 123 23.82 2007/06/18 19:22 599 48 73 9 30.13 123 30.10 2007/06/18 21:35 731 26 5 sa samples 74 9 0.97 123 15.94 2007/06/19 19:41 433 14 75 8 56.12 123 17.98 2007/06/19 21:27 301 13 76 8 51.32 123 19.41 2007/06/19 22:40 567 31 5 sa samples 77 8 47.99 123 22.00 2007/06/20 00:35 409 12 78 9 0.01 121 30.02 2007/06/21 12:12 4539 92 8 sa samples 79 9 9.98 121 45.01 2007/06/21 17:18 4584 114 8 sa samples
80 9 18.73 122 0.11 2007/06/21 22:22 3759 95 6 sa samples 81 9 26.99 122 14.00 2007/06/22 02:51 3028 10 82 9 34.21 122 25.26 2007/06/22 06:26 707 46 83 9 59.97 121 38.03 2007/06/22 12:51 3172 71 84 10 27.30 121 46.30 2007/06/22 18:15 1269 17 85 10 30.01 121 44.98 2007/06/22 20:00 1378 16 86 10 30.05 121 38.98 2007/06/22 21:53 876 12 87 10 30.08 121 32.94 2007/06/22 23:26 811 16 88 10 30.00 121 27.00 2007/06/23 01:06 987 12 89 10 52.24 121 48.19 2007/06/23 04:50 934 19 6 sa samples
Preliminary results of the PhilEx Exploratory Cruise
12
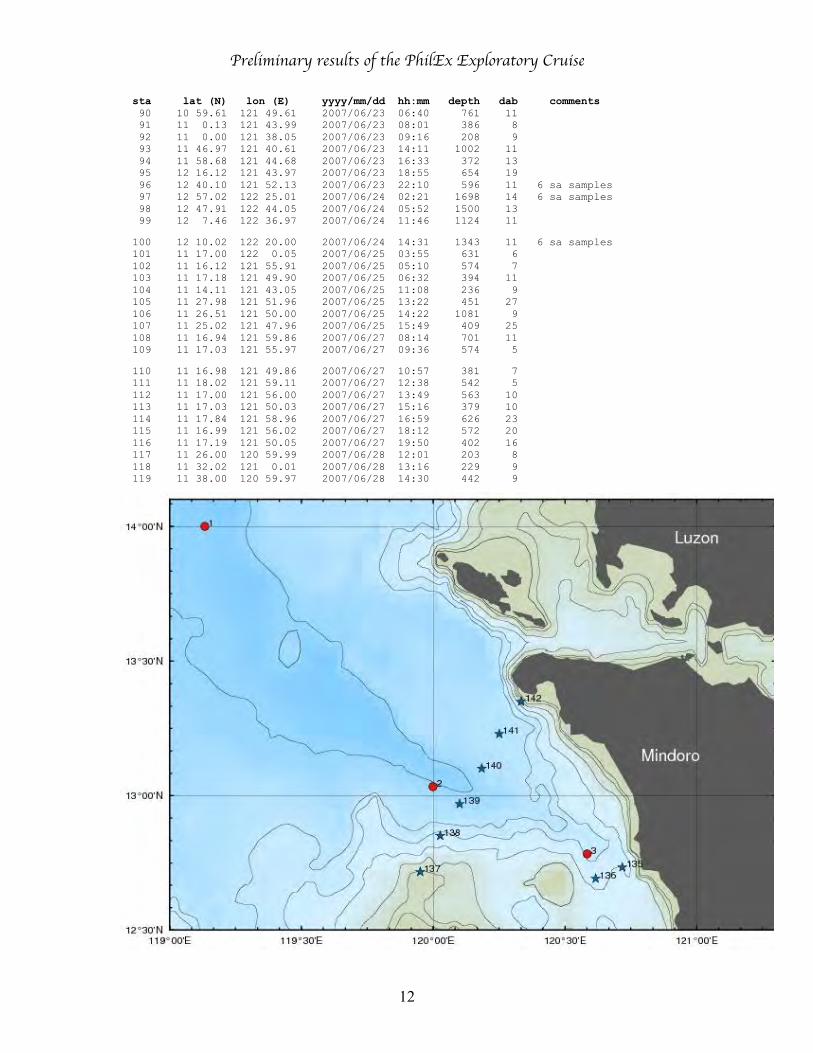
sta lat (N) lon (E) yyyy/mm/dd hh:mm depth dab comments 90 10 59.61 121 49.61 2007/06/23 06:40 761 11 91 11 0.13 121 43.99 2007/06/23 08:01 386 8 92 11 0.00 121 38.05 2007/06/23 09:16 208 9 93 11 46.97 121 40.61 2007/06/23 14:11 1002 11 94 11 58.68 121 44.68 2007/06/23 16:33 372 13 95 12 16.12 121 43.97 2007/06/23 18:55 654 19 96 12 40.10 121 52.13 2007/06/23 22:10 596 11 6 sa samples 97 12 57.02 122 25.01 2007/06/24 02:21 1698 14 6 sa samples 98 12 47.91 122 44.05 2007/06/24 05:52 1500 13 99 12 7.46 122 36.97 2007/06/24 11:46 1124 11
100 12 10.02 122 20.00 2007/06/24 14:31 1343 11 6 sa samples 101 11 17.00 122 0.05 2007/06/25 03:55 631 6 102 11 16.12 121 55.91 2007/06/25 05:10 574 7 103 11 17.18 121 49.90 2007/06/25 06:32 394 11 104 11 14.11 121 43.05 2007/06/25 11:08 236 9 105 11 27.98 121 51.96 2007/06/25 13:22 451 27 106 11 26.51 121 50.00 2007/06/25 14:22 1081 9 107 11 25.02 121 47.96 2007/06/25 15:49 409 25 108 11 16.94 121 59.86 2007/06/27 08:14 701 11 109 11 17.03 121 55.97 2007/06/27 09:36 574 5
110 11 16.98 121 49.86 2007/06/27 10:57 381 7 111 11 18.02 121 59.11 2007/06/27 12:38 542 5 112 11 17.00 121 56.00 2007/06/27 13:49 563 10 113 11 17.03 121 50.03 2007/06/27 15:16 379 10 114 11 17.84 121 58.96 2007/06/27 16:59 626 23 115 11 16.99 121 56.02 2007/06/27 18:12 572 20 116 11 17.19 121 50.05 2007/06/27 19:50 402 16 117 11 26.00 120 59.99 2007/06/28 12:01 203 8 118 11 32.02 121 0.01 2007/06/28 13:16 229 9 119 11 38.00 120 59.97 2007/06/28 14:30 442 9
Preliminary results of the PhilEx Exploratory Cruise
13
sta lat (N) lon (E) yyyy/mm/dd hh:mm depth dab comments 120 11 43.99 120 59.95 2007/06/28 15:48 343 35 121 11 49.82 121 1.15 2007/06/28 17:19 459 24 122 11 55.21 120 59.10 2007/06/28 18:40 455 20 123 12 2.33 120 59.92 2007/06/28 20:17 470 44 3 sa samples 124 12 7.94 121 0.04 2007/06/28 21:39 548 10 3 sa samples 125 12 3.55 120 54.95 2007/06/28 23:03 457 8 126 11 59.50 120 52.48 2007/06/29 00:17 553 14 6 sa samples 127 11 55.51 120 47.97 2007/06/29 01:46 525 12 128 11 51.00 120 42.98 2007/06/29 03:05 350 11 129 11 47.08 120 38.93 2007/06/29 04:14 273 10
130 12 13.00 120 29.97 2007/06/30 10:18 504 9 131 12 17.59 120 35.01 2007/06/30 11:43 771 10 132 12 21.53 120 41.50 2007/06/30 13:23 1150 10 133 12 25.04 120 47.29 2007/06/30 15:12 709 8 134 12 29.93 120 53.01 2007/06/30 16:52 592 16 135 12 44.04 120 43.06 2007/06/30 19:20 1200 45 136 12 41.54 120 36.99 2007/06/30 21:13 884 12 137 12 43.00 119 57.02 2007/07/02 02:50 272 16 138 12 51.05 120 1.58 2007/07/02 04:17 1559 18 139 12 58.17 120 6.01 2007/07/02 06:28 3015 1504
140 13 6.09 120 11.03 2007/07/02 08:45 2878 1363 141 13 13.75 120 15.07 2007/07/02 10:48 2354 821 142 13 21.00 120 20.02 2007/07/02 13:06 336 9
Preliminary results of the PhilEx Exploratory Cruise
14
[C] Weather during the cruise: Winds were generally <10 kts and waves <0.5 m withinfrequent rain showers. On the 26th June, with overcast to all horizons and heavy rain attimes, some white capping, winds of 20 kts. The weather and sea conditions werereported 4 times per day to the PAGASA-DOST as required in the Consent to performMSR within Philippine waters.
IV Listing of Exploratory Cruise Activities [chronological order]:
[A] Week of 6 June:
En route from the South China Sea to the western Pacific we took 28CTD/LADCP stations.
We deployed a mooring on the southern Mindoro sill: lat/long @ 11° 16' N,121°55' E, 9 June, 578-m, within the energetic sill overflow benthic layer.
We deployed the Surigao mooring on 12 June @ 10°26’N, 125°2’E in 169 metersof water.
Glider #1 and EM profiler #1 were deployed in the northern Sulu Sea at thesouthern entrance of the Mindoro Strait; Glider #1 @ 10°30’N, 121° 45’E; EM profiler@ 10°49’N. 121°49’E. Glider #2 was set out on 11 June @ 09°39’N, 125 12’E, in theeastern Bohol Sea where the Surigao through-flow enters the Bohol Sea. The 2nd EMprofile had a malfunction and was not deployed.
En route was the normal suite of underway data collected by the Melville,including the kHz hull ADCP, which can reach as deep as 600-800 m and a 150 kHznarrowband system, 200-300 m. Two 25 hour repeat hull ADCP sections were obtainedin Surigao [see figure 1e].
[B] Week of 13 June:
• Obtained CTD/LADCP stations from the Surigao to Dipolog, the Bohol sea includingmeridional section across Bohol Sea at 124°E.
• An EM-APEX profiler was deployed on 1522z 06/16/07 at 09 00.020N, 123 59.980E,to be recovered early on 20 June after we leave Cebu.
• We deployed the third ADCP mooring in Dipolog Strait on 18 June near at: 8°51.921'N, 123° 19.970' E in 504 m, ~0.1 nm from CTD station 16. The mooring site fallsbetween an Island to the ESE, Silino Island, and a reef to the WNW. The distancebetween the reef and the Island is ~6 nm. North and south of this gap the sea floor isslightly shallower. The Dipolog and Surigao moorings remain in place for recovery andredeployment during the Joint Cruise.
Preliminary results of the PhilEx Exploratory Cruise
15
• The EM-APEX profiler deployed in southern entrance of Mindoro Strait has been foundby a fisherman off of Panay. It has been recovered and will be sent to Manila for us topick up when we return to Manila on 3 July.
• At Cebu we preformed a personnel transfer on June 19th. Joining the ship was CarterOhlmann and Andrew Sybrandy who will oversee a drifter experiment in the MindoroStrait. Bruce Huber and Olivia Cabrera left the ship. Directly after the Cebu stop werecover the EM profiler in western Bohol Sea, obtain the 25 hour tide resolving repeatsection and a CTD/LADCP section across Dipolog Strait, then onto the Sulu Sea for a~zonal section around 9.25°N.
[C] Week of 19 June:
• Completed the Dipolog Strait survey, including the tidal resolving 25 hour repeat atDipolog Strait [race track: 8°50.34’N , 123°20.37’E to 9°02.28’N, 13°16.31’E]; a crossStrait CTD/LADCP along the same line.
• The recovered Bohol EM profiler was re-deployed on 24 June in the Mindoro Strait[2233z 06/24/07 11°34.398N. 121°24.986E. EM-Profiler #1636].
• CTD/LADCP in the eastern Sulu Sea to determine the sense of the basin scalecirculation and into the southern Mindoro Strait to inspect the connectivity of theMindoro with the Sulu circulation and stratification.
• Eight SVP [Surface Velocity Program, Argo tracked] drifters were deployed in DipologStrait and eastern Sulu Sea. Two were picked up [by one may assume] by fishermen, andone failed to work. The remaining SVP will be deployed in the northern Mindoro to trackthe spread of surface water into the South China Sea.
• A 10 Microstar fine scale array [~100 m separation] was carried out on 25 June ranquite smoothly [indication of anticyclonic shear, see Appendix B].
• Upon completion of the CTD/LADCP section , stations 105-107, within a constrictionnear 11°25’N at mid-night 25 June, we head south to the malfunctioning glider off thesouthern tip of Panay for retrieval in the morning light. [Snagged from the Melville andbrought aboard the ship at 0036z 06/26/07 10 19.833N. 121 57.071E]. We then returnedto the mooring latitude 11°17’N for a larger scale [1 km] microstar experiment; 25 hourtide resolving line; rotation of the ADCP mooring; additional CTD/LADCP stations.
[D] Week of 26 June to cruise end on 3 July:
• Tidal resolving repeat at two lines cross channel lines were performed in the MindoroStrait region [figures 1b and 1c]. The Mindoro south line, 25 hours, at the mooringlatitude, from 11°17’N; a Mindoro north line just north of Apo Reef, the largest of thereefs in the Strait, for ~23 hours [we aimed for 24 hours, but the ever diminishing cruise
Preliminary results of the PhilEx Exploratory Cruise
16
time argued for breaking away from the repeat line after 23 hours, near the position atwhich we began the repeat lines]. This line was positioned to investigating the interactionof Apo reef with the strong northward flow surface layer flow. A special 24 hour repeatwas performed in an hourglass shape near 12°N in Mindoro north to investigate reef-circulation interaction at a smaller reef.
• The EM profiler #1636 deployed at 2233z 06/24/07 11°34.398N. 121°24.986E, wasrecovered 28 June in the Mindoro Strait ~0300z, 11 41.5098 N 121 18.9701 E.
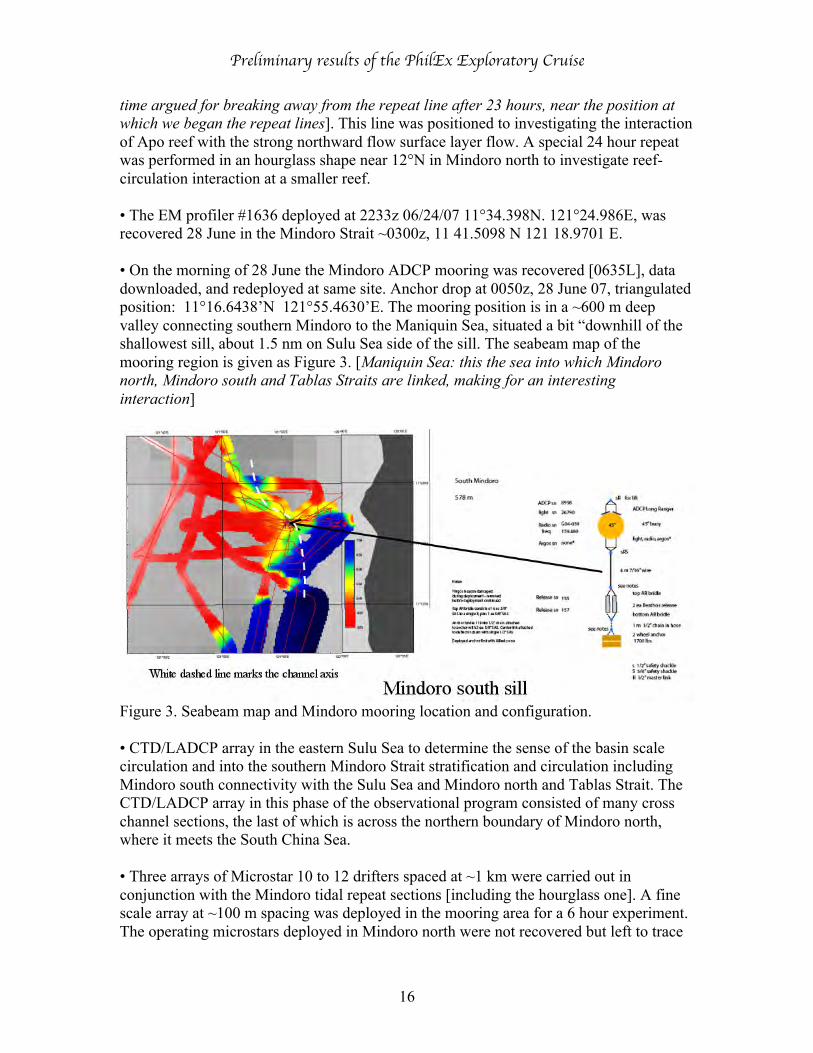
• On the morning of 28 June the Mindoro ADCP mooring was recovered [0635L], datadownloaded, and redeployed at same site. Anchor drop at 0050z, 28 June 07, triangulatedposition: 11°16.6438’N 121°55.4630’E. The mooring position is in a ~600 m deepvalley connecting southern Mindoro to the Maniquin Sea, situated a bit “downhill of theshallowest sill, about 1.5 nm on Sulu Sea side of the sill. The seabeam map of themooring region is given as Figure 3. [Maniquin Sea: this the sea into which Mindoronorth, Mindoro south and Tablas Straits are linked, making for an interestinginteraction]
Figure 3. Seabeam map and Mindoro mooring location and configuration.
• CTD/LADCP array in the eastern Sulu Sea to determine the sense of the basin scalecirculation and into the southern Mindoro Strait stratification and circulation includingMindoro south connectivity with the Sulu Sea and Mindoro north and Tablas Strait. TheCTD/LADCP array in this phase of the observational program consisted of many crosschannel sections, the last of which is across the northern boundary of Mindoro north,where it meets the South China Sea.
• Three arrays of Microstar 10 to 12 drifters spaced at ~1 km were carried out inconjunction with the Mindoro tidal repeat sections [including the hourglass one]. A finescale array at ~100 m spacing was deployed in the mooring area for a 6 hour experiment.The operating microstars deployed in Mindoro north were not recovered but left to trace

Preliminary results of the PhilEx Exploratory Cruise
17
the surface flow patterns of the Mindoro water entering into the South China Sea, withtheir 3 to 4 days of remaining battery left.
V Preliminary Scientific Results of the PhilEx Exploratory Cruise
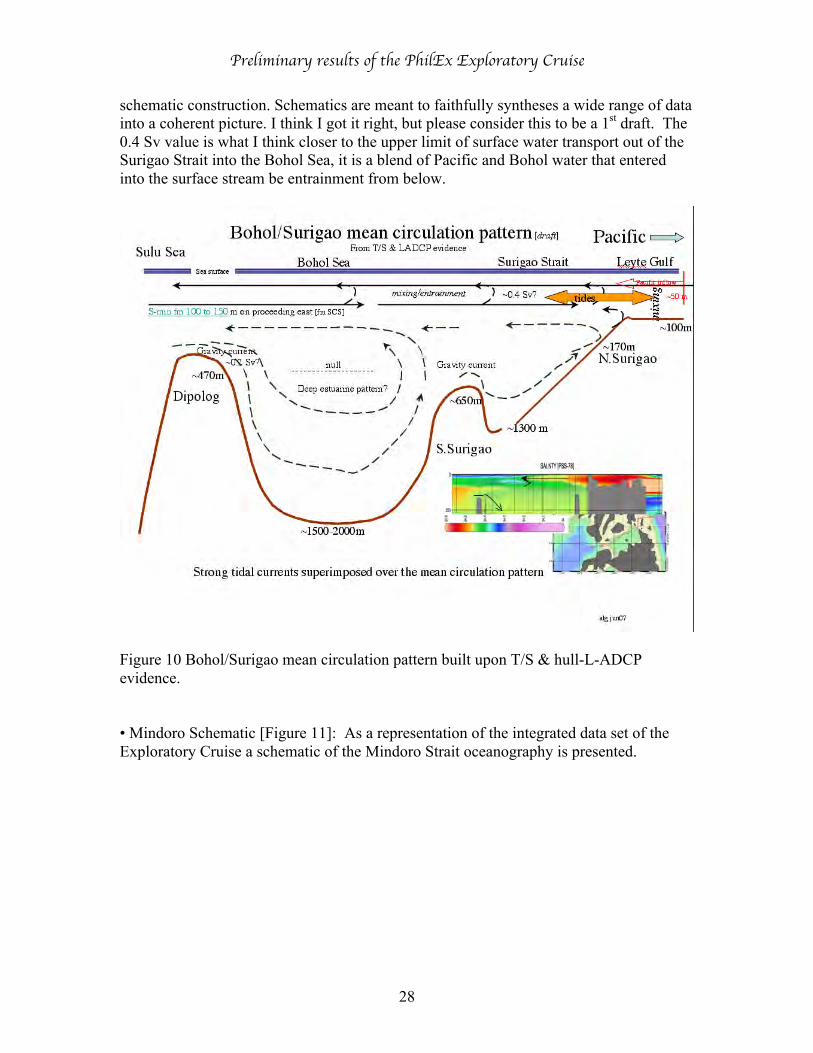
[A] Bohol [Mindanao] Sea [see- Summary Schematic of the mean circulation pattern fromDipolog to Leyte Gulf, Fig. 10]:
• The Bohol Sea appears to have an estuary circulation pattern, with surface flowingwestward in the upper 100 m over an overturning cell of Sulu water drawn into the BoholSea through the Dipolog Strait. The westward flowing surface water is drawn from theSurigao Strait and represents a mix of Pacific water and entrained subsurface Bohol Seawater.
• The salinity-minimum [S-min] entering the Bohol Sea through Dipolog shifts to greaterdepth and its core to higher density on proceeding eastward, a likely sign of entrainmentinto the westward flowing surface layer out of Leyte Gulf. In the western Bohol Sea it is24°C, 34.29, 100 m, 23.1 sigma-0; at the southern entrance to Surigao Strait [easternBohol Sea] the S-min is at 18°C, 34.42, 175 m, 26.0 sigma-0. This appears to be classicalestuarine type circulation, with the Pacific water analogous to the “River” water, and theSulu Sea water analogous to the “Ocean” water.
• I suspect that the S-min near 150 m within the Bohol Sea is derived from winter coolingof low salinity surface water off the coast of China. The S-min falls in the same densityrange as the S-max of the subtropical North Pacific, which enters the South China Sea viaLuzon Strait. The generation of the low salinity surface water off the coast of China mustbe fairly robust to counter the Pacific S-max.
• The 124°E section within the Bohol Sea reveals a counter-clockwise gyre, ~20 cm/ssurface speeds. With the Surigao surface layer tracking along the northern Bohol Seatowards Dipolog Strait. Water masses and hull ADCP indicate that the surface water flowfrom Surigao is funneled into Dipolog between Siquijor and Negros Islands, which iscalled Bohol Strait, ~400 m deep. Within this passage the subsurface S-min drawn intothe Bohol Sea from the Sulu Sea via Dipolog is much attenuated, as expected- this S-minwater tracks eastward south of Siquijor. Current profile within Bohol Strait is generallyless than 20 cm/s, net transport is low [0.1 or 0.2 Sv, this is close to the suspected netintake of Pacific water via Surigao].
• At depths, below ~200 m within the Bohol Sea there is a deep reaching estuarine typeflow pattern, with the bottom ventilation derived from gravity current spill-over inDipolog Strait. The null depth, where the westward flow from Dipolog is separated fromthe deeper eastward flow, in keeping with the estuary patterns is 600 to 1000 m.
[B] Surigao Strait
Preliminary results of the PhilEx Exploratory Cruise
18
• The Surigao Strait survey was conducted during the spring tide. The spring tide signal,primary a diurnal character, was a dominant presence. Tidal flow in the upper ~80 mtowards the Bohol Sea, speeds of 3 kts flood tide, Pacific bound at ~0.5 kt in slack tide.At mooring site the temperature/salinity profiles show lots of small scale [highfrequency] reversals and steps in the T/S profiles, indicative of active microstructure andmixing as the Pacific water passes over the regional subsurface water. The mooring wasplaced in 168 m of water in the passage between Dinagot Island and Leytes Island. To thenorth, before the open Pacific is met, there is a broad shallow embayment, with typicaldepths of <130 m, and a very homogenous water column [e.g. station 26].
• Thermohaline stratification feeding into Surigao Strait: In the Leytes Gulf, the shallowembayment north of Surigao Strait, the water column is composed of Pacific surfacewater drawn from the 0-50 m levels from the adjacent western Pacific. This water mixesdownward to the ~100 m floor of the Gulf, before passing through the Surigao Strait. Themixture includes freshwater brought into the region by inflow along the bottom of theSurigao Strait of lower salinity lower oxygen water from the Bohol Sea.
• Within Surigao Strait the mean [sub-tidal frequency] speed at ~50 m during the tidalresolving repeat [barotropic] is 44 cm/sec southward, leading to an estimate of thesouthward transport over the diurnal cycle of ~0.4 Sv [Sv = 106 m3/s]. It is possible thatthere is some return mean flow east of Hinunan Island, the ~90 m deep channel in thatpassage is narrow, about 3 km, but it could reach 0.1 Sv. Additionally, not all of the 0.4Sv need be derived from the Pacific: within the northern entrance of Surigao Strait isbottom water of relatively low salinity derived from the Bohol Sea. This water may beentrained into the surface layer and compose part of the 0.4 Sv. “Guess”: a net Pacificthroughflow into the Bohol Sea of 0.2 to 0.3 Sv is likely.
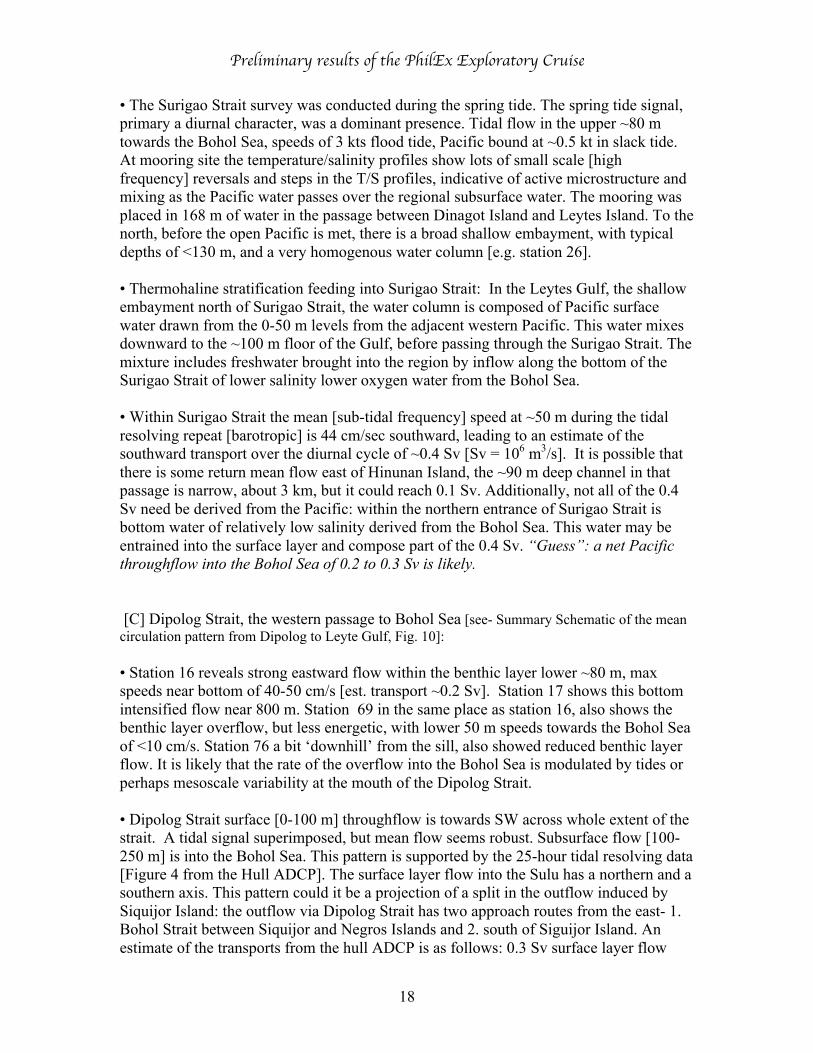
[C] Dipolog Strait, the western passage to Bohol Sea [see- Summary Schematic of the meancirculation pattern from Dipolog to Leyte Gulf, Fig. 10]:
• Station 16 reveals strong eastward flow within the benthic layer lower ~80 m, maxspeeds near bottom of 40-50 cm/s [est. transport ~0.2 Sv]. Station 17 shows this bottomintensified flow near 800 m. Station 69 in the same place as station 16, also shows thebenthic layer overflow, but less energetic, with lower 50 m speeds towards the Bohol Seaof <10 cm/s. Station 76 a bit ‘downhill’ from the sill, also showed reduced benthic layerflow. It is likely that the rate of the overflow into the Bohol Sea is modulated by tides orperhaps mesoscale variability at the mouth of the Dipolog Strait.
• Dipolog Strait surface [0-100 m] throughflow is towards SW across whole extent of thestrait. A tidal signal superimposed, but mean flow seems robust. Subsurface flow [100-250 m] is into the Bohol Sea. This pattern is supported by the 25-hour tidal resolving data[Figure 4 from the Hull ADCP]. The surface layer flow into the Sulu has a northern and asouthern axis. This pattern could it be a projection of a split in the outflow induced bySiquijor Island: the outflow via Dipolog Strait has two approach routes from the east- 1.Bohol Strait between Siquijor and Negros Islands and 2. south of Siguijor Island. Anestimate of the transports from the hull ADCP is as follows: 0.3 Sv surface layer flow
Preliminary results of the PhilEx Exploratory Cruise
19
from Bohol Sea to Sulu Sea; 0.2 Sv subsurface layer flow from Sulu to Bohol, with a netoutflow of 0.1 Sv. Of course the errors is large [for all sorts of reasons], but I think this isthe ‘ball-park’ throughflow value.
Figure 4 zonal and meridional speeds in Dipolog Strait during the 25 hour tideresolving repeat line. The Red Box delineates the time of the tide repeat lines.
[D] Sulu Sea
• The Sulu Sea water column below ~1200 m, is nearly isothermal at ~9.8°C withincreasing salinity and decreasing oxygen to the sea floor, ~4500 m. The reduced oxygenis easy to explain- oxidation of organics, but the salinity explanation requires someimagination. The density profile has an exponential form from ~1000 m to the sea floor,which may be considered as the standard overflow profile within an isolated basin. Thebenthic density observed at station 8, near the southern sill of Mindoro Strait, is sufficienthigh to reach the bottom of Sulu. However, its salinity and temperature are lower thanthe bottom water in Sulu. Entrainment of Sulu water into the overflow from the 600-700m level would dilute the overflow characteristics, making for less dense, saltier andwarmer. I conclude that deep reaching ventilation continues, perhaps modulated by thebaroclinic tide. The strange form [an almost isothermal layer, coupled with a salinity andoxygen gradient] of the T/S below 1200 meters may be explained as follows: Whilegeothermal heating is likely a factor in governing the deep water profile within the SuluSea, the observed profile below 1200 m may best be explained by variable T/S propertiesof the overflow of South China Sea water via the Mindoro. When SCS pycnocline is
Preliminary results of the PhilEx Exploratory Cruise
20
shallower as during the great El Niño episode of 1997, the overflow into the Sulu wouldhave been cooler and saltier [denser]. Geothermal heating, most likely from the side wallsof the basin [lots of volcanic Islands and shallow ridges in the western Sulu Sea toprovide such a source], may have warmed the overflow water, but not induced a deephomogeneous layer, as would be expected if the geothermal heat is derived from thedeepest sea floor. At station #4 just south of the Apo Reef region ~12°40’N, has athermometric depth of ~800 m, with bottom water equal to the saline bottom water in theSulu Sea. If this water gained access to the Sulu Sea across what are most likelyshallower sills between station 4 and the Sulu Sea it would deliver the needed overflowwater to explain the salty bottom water in the Sulu Sea. The “coolness” would then haveto be removed by the side wall geothermal heating. So bottom line: continued deepventilation, punctuated by occasional blasts of more salinity overflow, though not enoughto cause temporary stagnation, with side wall geothermal heating [rather than deepcentral basin geothermal warming].
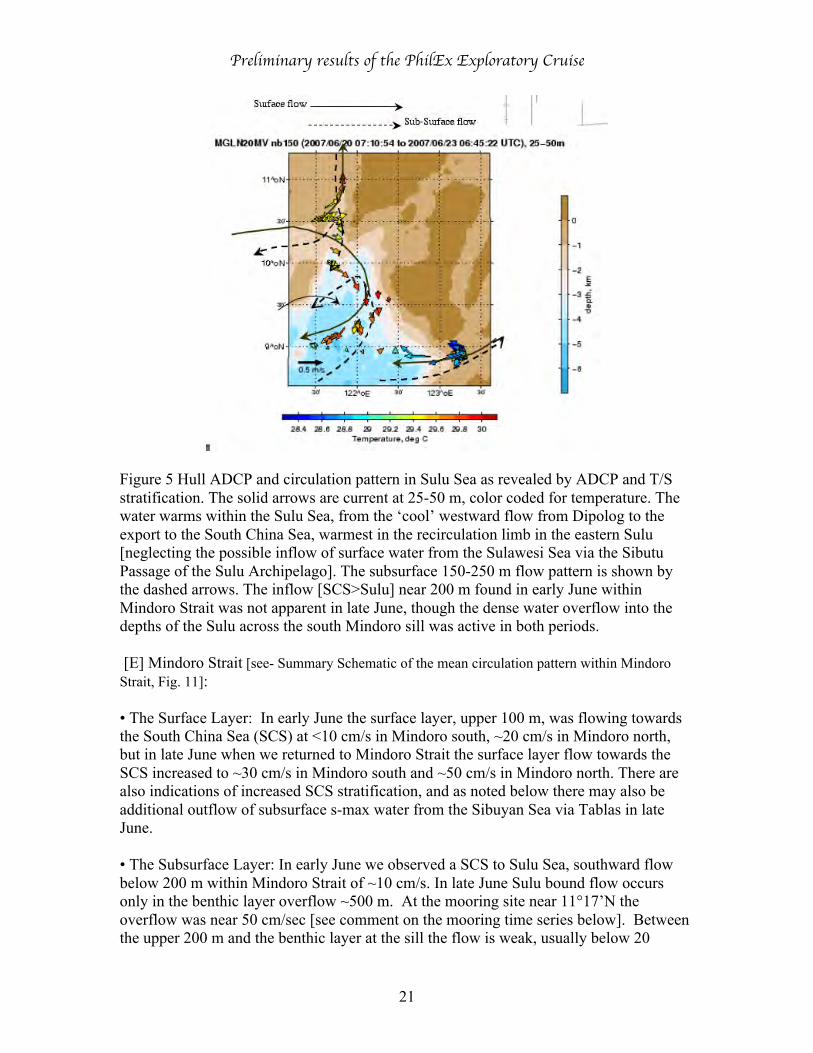
• Surface vs. subsurface gyres [Figure 5]: The hull and LADCP data as well as the T/Sstratification reveal a surface flow pattern in eastern Sulu that depicts a basin scaleclockwise, anticyclonic pattern. The surface water export via Mindoro into the SouthChina Sea is derived from the western Sulu Sea, from the region between Palawan andTubbataha Reef/Cagayan Island, with closure in the passage west of Tubbataha Reef.This flow pattern does not extend into the deep water. At 100 m the sense of the gyrechanges taking on a counterclockwise, cyclonic flow pattern. It is this circulation layerthat advects the subsurface s-min that enters the Bohol Sea via Dipolog Strait. Thesubsurface flow that carries the s-min water into the Sulu Sea via Mindoro, turnswestward upon entering the Sulu Sea to trace along the Sulu in a cyclonic sense. Theinflow [SCS>Sulu] near 200 m found in early June within Mindoro Strait was notapparent in late June, though the dense water overflow into the depths of the Sulu acrossthe south Mindoro sill was active in both periods. If this is the mark of the maturing ofthe summer monsoon or higher frequency forcing is not yet known.
Preliminary results of the PhilEx Exploratory Cruise
21
Figure 5 Hull ADCP and circulation pattern in Sulu Sea as revealed by ADCP and T/Sstratification. The solid arrows are current at 25-50 m, color coded for temperature. Thewater warms within the Sulu Sea, from the ‘cool’ westward flow from Dipolog to theexport to the South China Sea, warmest in the recirculation limb in the eastern Sulu[neglecting the possible inflow of surface water from the Sulawesi Sea via the SibutuPassage of the Sulu Archipelago]. The subsurface 150-250 m flow pattern is shown bythe dashed arrows. The inflow [SCS>Sulu] near 200 m found in early June withinMindoro Strait was not apparent in late June, though the dense water overflow into thedepths of the Sulu across the south Mindoro sill was active in both periods.
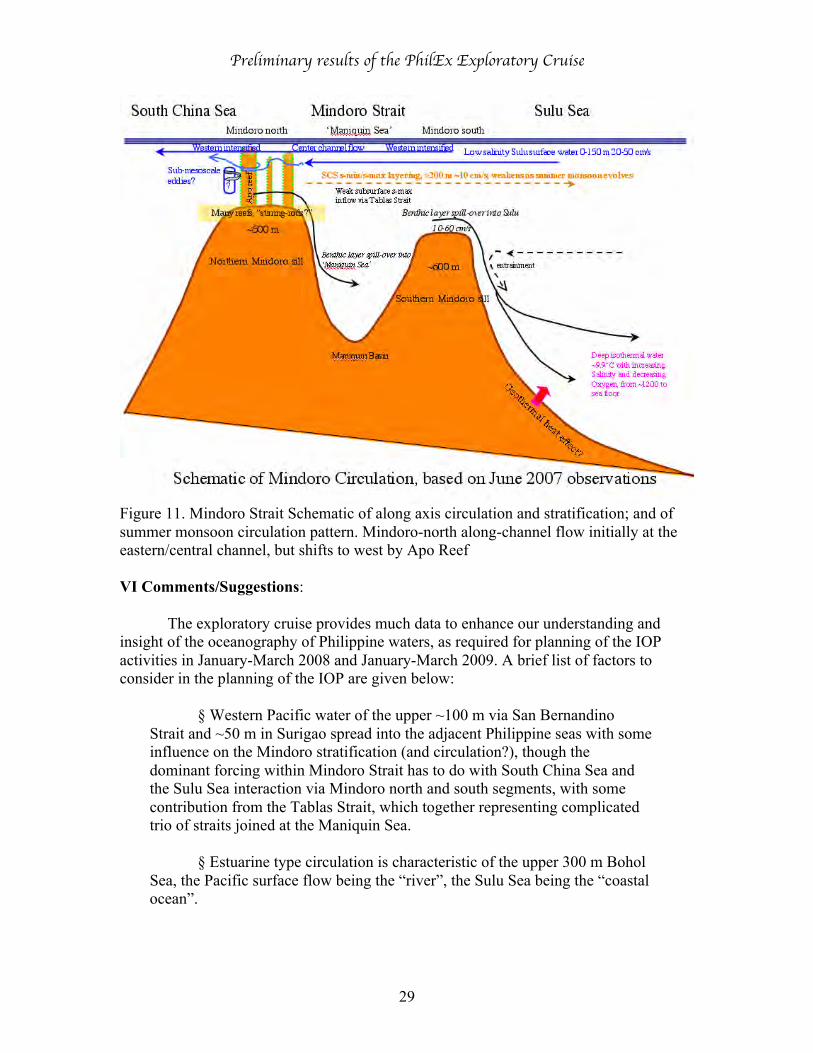
[E] Mindoro Strait [see- Summary Schematic of the mean circulation pattern within MindoroStrait, Fig. 11]:
• The Surface Layer: In early June the surface layer, upper 100 m, was flowing towardsthe South China Sea (SCS) at <10 cm/s in Mindoro south, ~20 cm/s in Mindoro north,but in late June when we returned to Mindoro Strait the surface layer flow towards theSCS increased to ~30 cm/s in Mindoro south and ~50 cm/s in Mindoro north. There arealso indications of increased SCS stratification, and as noted below there may also beadditional outflow of subsurface s-max water from the Sibuyan Sea via Tablas in lateJune.
• The Subsurface Layer: In early June we observed a SCS to Sulu Sea, southward flowbelow 200 m within Mindoro Strait of ~10 cm/s. In late June Sulu bound flow occursonly in the benthic layer overflow ~500 m. At the mooring site near 11°17’N theoverflow was near 50 cm/sec [see comment on the mooring time series below]. Betweenthe upper 200 m and the benthic layer at the sill the flow is weak, usually below 20
Preliminary results of the PhilEx Exploratory Cruise
22
cm/sec though peaks of 30 cm/sec occur, but towards the north. Might we in June haveobserved the transition of subsurface flow into the summer monsoon condition? Or mightit be other remote forcing effects? The IOP can investigate.
• Within the southern Mindoro Strait there is a slight relaxation of the temperature profilenear 13°C near 300 m. This layer is marked by a local oxygen-min and salinity-min. Thiswater type is most pronounced in the Sulu Sea, and absent in the northern Mindoro. It canbe traced to outflow from the Bohol Sea, via Dipolog Strait. The ADCP data from the lateJune occupation indicates northward flow at this level in the southern Mindoro Strait.During the initial pass thru the Mindoro in early June, the flow was southward and the13°C oxy-min, S-min was absent. The ADCP mooring also indicates more commonsouthward flow at this level in early June than in late June. Speculation: The 13°C Suluwater invades the southern Mindoro as the flow subsurface flow from the SCS relaxes, inwhat is likely a onset of the summer monsoon effect. One may assume that this layer willcreep northward as the summer monsoon continues. If true, then the monsoon effect oncirculation affects the subsurface. Does the subsurface cyclonic flow [see Sulu Sea resultssection] in the Sulu Sea also reverse in the summer monsoon?
• There is very vigorous [bottom intensified] overflow of South China Sea water into theSulu Sea across the southern sill in Mindoro Strait, near 11°17’N; 121°55’E, depth ~580m. This is where the South Mindoro mooring was placed. Navigation maps and datacollected on cruise show that this is the shallowest sill in the southern Mindoro Strait[south of Tablas Strait]. Stations 5 and 6 [average ~11°54’N, 121°E, see figure 1]straddle the northern Mindoro sill. Station 6 shows some bottom intensified flow of ~40cm/s near 500-600 m suggesting it is downstream, spill-over side of the sill. In thenorthern segment of Mindoro Strait, between stations 5 and 6 the thermometric depth isabout 460 m, but the bathy data suggest a complex ‘braided’ arrangement of channels, somaybe the real sill is deeper. Thermometric deduced sill depth, a classical oceanographicprocedure in which T/S stratification on either side of a sill is compared, is shallower thanreal sill depth, assuming the flow is not purely laminar as mixing within the sill tends tolead to a warmer overflow product.
• Mindoro to Sulu Gravity Current: CTD/LADCP # 8 and its repeat #12 show nearly thesame profile: a ~100 m thick benthic [well mixed] layer with southward speeds of 1 to 2kts, amounting to a transport of ~0.5 Sv. Near 600 m in the Sulu Sea [station 10, see fig1] at the southern entrance to the Mindoro Strait, there is a jet [~15-20 cm/s] of waterflow towards the Mindoro Strait: possible induced by entrainment of ambient water bythe sill overflow gravity current. The well mixed benthic layer is an example of howactual sill depths are greater than thermometric sill depths. As mentioned in the previousreport in Mindoro Strait, at depths above the benthic gravity current, the flow is mostlytowards the South China Sea in the upper 150 m; towards the Sulu Sea below 200 m.
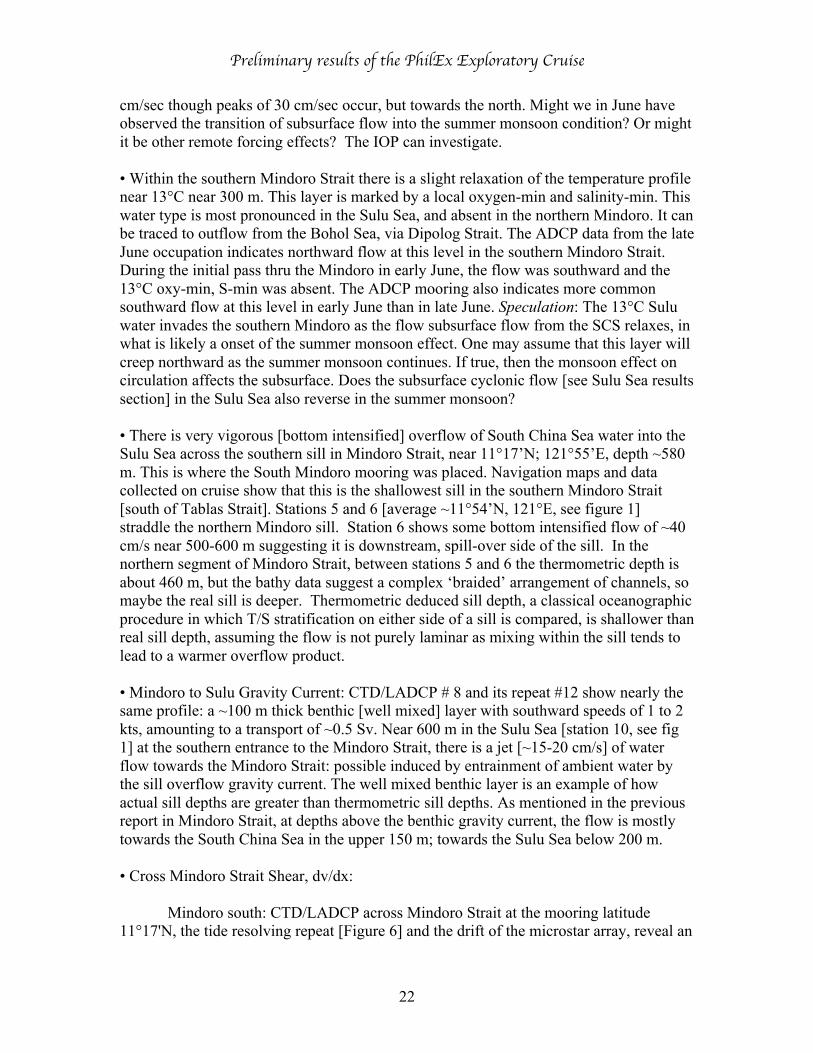
• Cross Mindoro Strait Shear, dv/dx:
Mindoro south: CTD/LADCP across Mindoro Strait at the mooring latitude11°17'N, the tide resolving repeat [Figure 6] and the drift of the microstar array, reveal an
Preliminary results of the PhilEx Exploratory Cruise
23
east - west structure of the along-axis flow, with stronger northward flow on the westside. The amplitude of west-east asymmetry in the surface layer is ~ 20 to 30 cm/s, ~ 40cm/s at the west, ~10 cm/s on the east boundary. On the east side there is often a weak [0to 10 cm/s] southward flow near 150-200 m. The western intensified northward flow ofthe upper 150 m reaches a maximum speed of ~60 cm/sec at around 90 m, not at thesurface. A diurnal tidal barotropic current of ~10-15 cm/s is superimposed on the pattern.This asymmetry is also found at the three closely spaced cross channel CTD/LADCPstations at the mooring latitude, to the north near 11°25'N, and to the south near 11°00'N.The cross channel density gradient appears to be "geotropically" consistent with thealong-axis flow pattern.
Figure 6. Meridional speeds across the latitude of the Mindoro south mooring, 11°17’N.Upper panel is an ensemble of all of the 18 sections over 25 hours. The lower panels areexamples of sections that show weaker [left] and stronger [right] northward flow.
Mindoro north [Figure 7]: Here too the flow becomes western intensified, shortlyafter the inflow from the southeast adjusts to the Strait confines. A characteristic ofMindoro north are the many reefs, which act as obstacles to the flow. They may induceturbulence and wake features, and so I refer to them as “stirring rods”. Apo Reef is thegiant one, and clearly has an effect on the northward flow observed in late June 2007 [seethe Drifter Report, Appendix B].

Preliminary results of the PhilEx Exploratory Cruise
24
Fig. 7. Hull-ADCP 150 KHz measured flow, 25-50 m interval within Mindoro north.
• How well do the models capture the western intensification of the northward flow, andweak subsurface southward flow? Figure 8 shows examples provided by ShelleyRiedlinger. It, as well as the HyCom 1/12 [pc Joe Metzger] and ROM model [pc JuliaLevin] output while not perfect are encouraging.
Fig. 8 Daily mean velocity within Mindoro Strait north and south, EAS16 model.
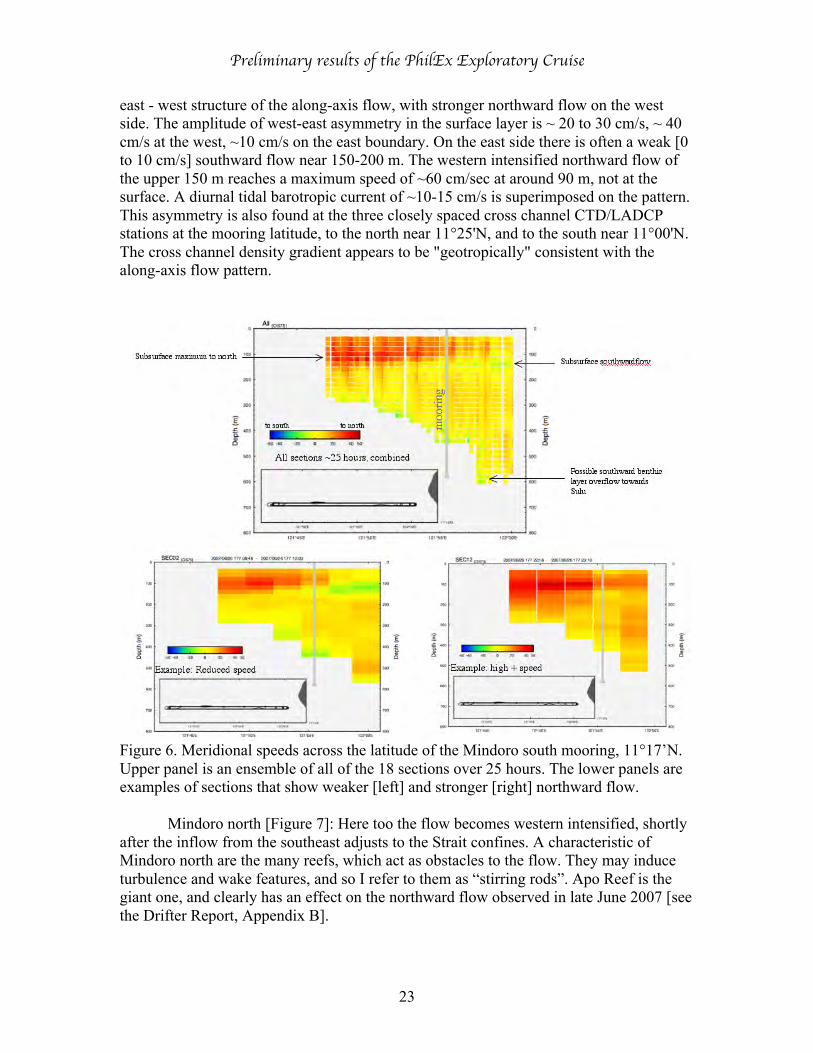
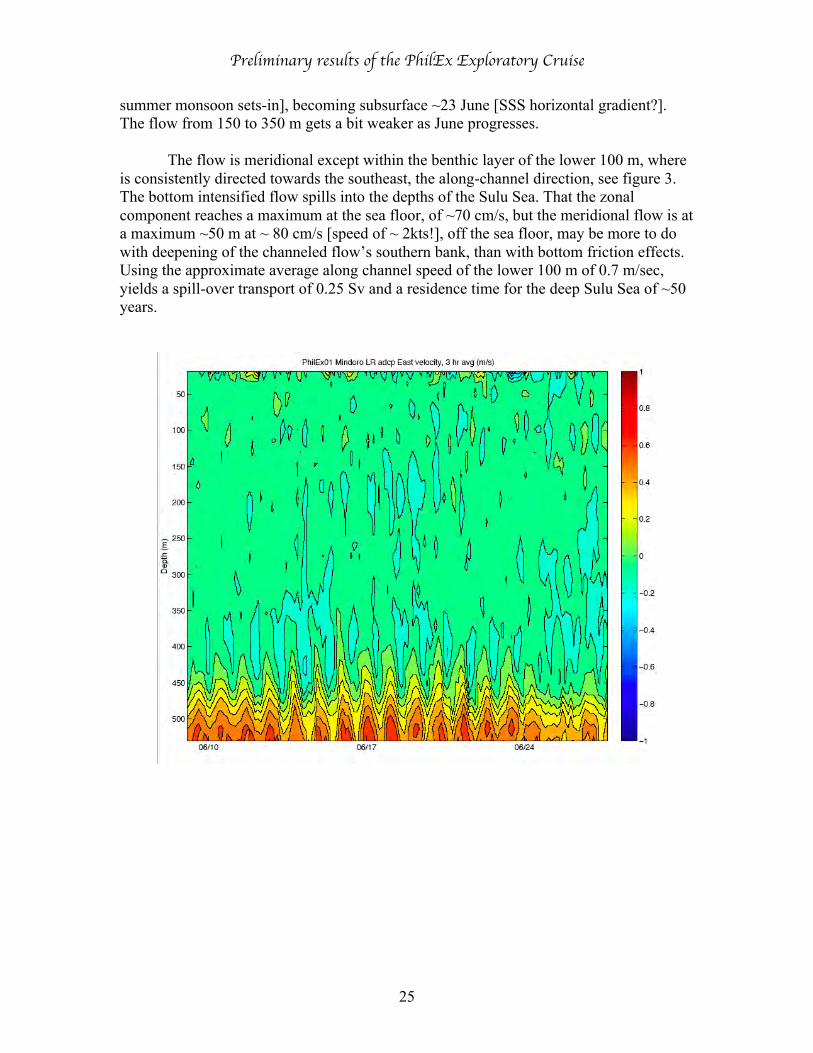
• Time Series, 8-27 June in Mindoro south [Figure 9]:
Clear tidal beat, with diurnal and fortnightly tidal overtones.
Southward flow increases during the deployment period [presumable as the
Preliminary results of the PhilEx Exploratory Cruise
25
summer monsoon sets-in], becoming subsurface ~23 June [SSS horizontal gradient?].The flow from 150 to 350 m gets a bit weaker as June progresses.
The flow is meridional except within the benthic layer of the lower 100 m, whereis consistently directed towards the southeast, the along-channel direction, see figure 3.The bottom intensified flow spills into the depths of the Sulu Sea. That the zonalcomponent reaches a maximum at the sea floor, of ~70 cm/s, but the meridional flow is ata maximum ~50 m at ~ 80 cm/s [speed of ~ 2kts!], off the sea floor, may be more to dowith deepening of the channeled flow’s southern bank, than with bottom friction effects.Using the approximate average along channel speed of the lower 100 m of 0.7 m/sec,yields a spill-over transport of 0.25 Sv and a residence time for the deep Sulu Sea of ~50years.
Preliminary results of the PhilEx Exploratory Cruise
26
Figure 9. Zonal [upper panel] and meridional [lower panel] speeds recorded by theMindoro ADCP mooring 11° 16.646’ N 121° 55.456’ E, ~mid-channel. Note the vigorof the benthic layer, also its SE direction, in contrast to the meridional flow in the rest ofthe water column. All show tidal signature. [prepared by B.A.Huber]
[F] Tablas Strait and Sibuyan Sea
• The Sibuyan Sea, a San Bernardino signature: The low salinity surface flow throughTablas Strait is towards the north, with likely export via Verde Island Passage. From ~80to ~110 meters within the Sibuyan Sea basin north of Sibuyan Island, there is a salinitymaximum, approaching 34.5, at a temperature of 25-28°C. The source of this watercannot be the South China Sea via Verde Island Passage or from Mindoro Strait via theTablas Strait, that water is too fresh. The source must be San Bernardino Strait; derivedfrom the upper 100 m of western Pacific stratification. There, as with Surigao Strait,surface layer water from the western Pacific can enter into the interior seas of the

Preliminary results of the PhilEx Exploratory Cruise
27
Philippines [the Surigao may allow for only the upper 50 m of Pacific water to enter theBohol Sea]. Consistent with this inference is that the s-max signature is stronger in theeastern Sibuyan Sea. In the Sibuyan Sea basin south of Sibuyan Island the subsurface s-max is absent, indicating that the San Bernardino inflow tracks to the north of SibuyanIsland. The San Bernardino s-max is observed in weaken form in Tablas Strait and inManiquin Sea and along the eastern side of Mindoro north. The EAS16th model showssomething like this at the 100 m level. The early June data in Maniquin Sea does notshow the San Bernardino s-max, but it is evident in late June- another indication of theevolving summer monsoon effect?
• The formation of an s-max near 100 m indicates that San Bernardino allows for athicker layer of western Pacific surface water to flow westward, than observed viaSurigao Strait, which allows only the upper 50 m of Pacific water to enter into the interiorBohol Sea. It is possible that the difference is not just a sill depth issue as the westernPacific baroclinic geostrophic boundary condition differences at 13°N versus 10°N maybe a factor.
• Deep Basin ventilation. There are two basins within the Sibuyan Sea: one north, onesouth of Sibuyan Island; Tablas Strait is west of Tablas Island. The deep isolated basinsof the Sibuyan Sea are ventilated via the Tablas Strait [though we observed no activespill-over benthic layer structures]. Tablas Strait has a bottom potential temperature of9.75°C. the basin north of Sibuyan Island at a bottom θ of 10.45°C. has a controlling sillof 460 m [thermometric sill depths, which is likely shallower than the actual deepestconnecting depth to the west]; and the basin south of the Sibuyan Island at bottom θ of10.70°C, has a sill of 420 m. Current below 400 m is generally less than 5 cm/sec. In theconfines of the deep basins the oxygen concentration drops off without a change in T/S.This indicates oxygen loss of oxidation. In the northern basin the oxygen is 1.5 ml/l near800 m [perhaps the recent depth of overflow ventilation], dropping off within theisothermal profile to 0.7 ml/l at the basin floor. In the southern basin the oxygen is quitea bit lower, as it is more removed from the open ocean oxygen source. At 600 m theoxygen is 0.5 ml/l, at the floor of the southern basin, ~1320 m, the oxygen drops to 0.3ml/l, without change of potential temperature. Speculation: the basins are ventilatedmore effectively during El Niño when the regional stratification shallows. Might it be thatthe deep basin oxygen reduction, 0.8 ml/l in the northern basin, 0.2 ml/l in the southernbasin been developed since the 1997 El Niño, 0.08 ml/l-yr, and 0.03 ml/l-yr,respectively? Of course, the actual consumption rate depends not just on oceanventilation, but also supply of organics.
[G] Summary Schematics:
Figure 10 presents a schematic based on the PhilEx Exploratory Cruise of themean [non-tidal] circulation pattern along a ~zonal plane for the region from the DipologStrait, across the Bohol Sea and through the Surigao Strait, into the Leyte Gulf, andwestern Pacific. A salinity section is inserted to provide some context, but the fullT/S/Oxy stratification as well as the LADCP and hull ADCP info were brought into the
Preliminary results of the PhilEx Exploratory Cruise
28
schematic construction. Schematics are meant to faithfully syntheses a wide range of datainto a coherent picture. I think I got it right, but please consider this to be a 1st draft. The0.4 Sv value is what I think closer to the upper limit of surface water transport out of theSurigao Strait into the Bohol Sea, it is a blend of Pacific and Bohol water that enteredinto the surface stream be entrainment from below.
Figure 10 Bohol/Surigao mean circulation pattern built upon T/S & hull-L-ADCPevidence.
• Mindoro Schematic [Figure 11]: As a representation of the integrated data set of theExploratory Cruise a schematic of the Mindoro Strait oceanography is presented.
Preliminary results of the PhilEx Exploratory Cruise
29
Figure 11. Mindoro Strait Schematic of along axis circulation and stratification; and ofsummer monsoon circulation pattern. Mindoro-north along-channel flow initially at theeastern/central channel, but shifts to west by Apo Reef
VI Comments/Suggestions:
The exploratory cruise provides much data to enhance our understanding andinsight of the oceanography of Philippine waters, as required for planning of the IOPactivities in January-March 2008 and January-March 2009. A brief list of factors toconsider in the planning of the IOP are given below:
§ Western Pacific water of the upper ~100 m via San BernandinoStrait and ~50 m in Surigao spread into the adjacent Philippine seas with someinfluence on the Mindoro stratification (and circulation?), though thedominant forcing within Mindoro Strait has to do with South China Sea andthe Sulu Sea interaction via Mindoro north and south segments, with somecontribution from the Tablas Strait, which together representing complicatedtrio of straits joined at the Maniquin Sea.
§ Estuarine type circulation is characteristic of the upper 300 m BoholSea, the Pacific surface flow being the “river”, the Sulu Sea being the “coastalocean”.
Preliminary results of the PhilEx Exploratory Cruise
30
§ Overflow of relatively dense water into the confines of the Sulu Sea,Bohol Sea, Maniquin Sea and Sibuyan Sea are energetic features of thecirculation and shape the stratification below associated sill depths. The deepisolated Sulu Sea may experience effects of geothermal heating, and perhapsventilation timing linked to El Niño episodes.
§ Tides are very much in evidence in the circulation and overflowthroughout the Philippine waters, but they are really strong in the SurigaoStrait region, shaping the estuarine circulation pattern of Bohol Sea, and thespreading of the Pacific inflow.
§ The numerous reefs in Mindoro north may act as “stirring rods”creating a field of eddies and wake phenomena within the mean flow, and assuch may deserve attention during the Mindoro IOP.
§ The Mindoro circulation in late June differed from that of early June,which may mark the maturing of the summer monsoon regional forcing.
§ During the Exploratory cruise we experienced very low wind andwaves, generally ~10 kts though winds of slightly over 20 kts were morecommon in the northern Mindoro Strait at the end of June. Thus we observedocean processes under minimal local wind action, exposing ocean processesdriven by tides and remote forcing from the surrounding large water bodies.The winter season timing of the IOP will see much larger wind stress curlconditions.
• Small fishing boats and poorly marked fish aggregators abound in the Philippine waters.This will force some deviations of well planned observations along repeat and towedvehicle operations during the IOP. Additionally, permission to work within 15 km of thecoasts of many regions is required.
VII Acknowledgements:
Living up to the name “Exploratory Cruise”, we explored the regional and straitoceanography. This meant that while we had a conceptual strategy, the details of our day-to-day observational activities depended to a large extent on those of the previous day ortwo. We had to respond fairly quickly to what the data suggested, so as not to missopportunity. This made for a very intense cruise. The team of researchers and supportstaff and ship officers and crew displayed remarkable level of teamwork in a mostcongenial manner. Everyone aboard is a true professional.
The Philippine researchers, particularly their leaders, Cesar Villanoy and LauraDavid, are to be especially commended. Their cheerful attitude, their ability to anticipate,their sense of responsibility to their watches are truly admirable.
Preliminary results of the PhilEx Exploratory Cruise
31
I must say I never had a more agreeable group of official Observers on myprevious cruises. They pitched right into the work, becoming integral members of theteam. Very impressive. Fernando “Ding” Magno played an essential role incommunicating with fishing fleets that we encountered, including returning of ‘rescued’microstar drifters.
The US researchers displayed a positive sense of sharing information andexpertise. The Scripps techs, Robert Palomares and Drew Cole are just excellent, alwaysthere when needed.
The many graduate students on the research staff will all make in their timewonderful oceanographers.
My thanks to Captain Christopher ‘Rip’ Curl and the mates for safe passagethrough all of the hazards of archipelago waters, with its many small fishing boats andnets and the poorly marked fish aggregators; and to the Engineers who kept the ship cooland comfortable in the tropical clime.
VIII Science Personnel list
Last, First Name Institution 1. Gordon, Arnold Lamont-Doherty Earth Observatory Chief Scientist2. Huber, Bruce Lamont-Doherty Earth Observatory Scientist3. Mele, Philip Lamont-Doherty Earth Observatory Scientist4. Giulivi, Claudia Lamont-Doherty Earth Observatory Scientist5. Tessler, Zachary Lamont-Doherty Earth Observatory Graduate Student6. Tillinger, Debra Lamont-Doherty Earth Observatory Graduate Student7. Pujiana, Kandaga Lamont-Doherty Earth Observatory Graduate Student8. Ohlmann, Carter University of California Santa Barbara Scientist9. Sybrandy, Andrew Pacific Gyre Scientist10. Engel, Patricia MIT/Woods Hole Oceanographic Inst. Graduate Student11. Villanoy, Cesar University of the Philippines Scientist12. David, Laura University of the Philippines Scientist13. Cabrera, Olivia University of the Philippines Scientist14. Alabia, Irene University of the Philippines Scientist15. Floren, Adonis Silliman University Scientist16. Palermo, Joseph University of the Philippines Scientist17. Martin, Joseph University of Washington Scientist18. Galang, Juanito Philippine Atmospheric Geophysical and Astronomical Services
Administration, Observer19. San Joaquin, Arnold Philippine Navy Observer20. Magno, Fernando Philippine Coast Guard Observer
Huber and Cabrera left the ship in Cebu;

Preliminary results of the PhilEx Exploratory Cruise
32
Ohlmann and Sybrandy joined the ship in Cebu.
Appendices [figure numbers referred to in each appendix are the figures incorporated intoeach appendix, not those of the main text]:
[A] Cesar Villanoy and Laura David: Bio-optical.[B] Carter Ohlmann: SVP and microstar drifters
Preliminary results of the PhilEx Exploratory Cruise
33
APPENDIX ABio-optical Measurements
Cesar Villanoy and Laura DavidMarine Science Institute
University of the PhilippinesDiliman, Quezon City 1101 Philippines
Bio-optics measurements made during the cruise include the transmissometer,fluorometer and CDOM Fluorometer deployed with the CTD rosette. The ship’sunderway system also measures fluorescence and other parameters and logged every 30secs. Details about the instrument specs are shown in Table 1 and 2. The CTDfluorometer did not work properly during the first nine casts but worked reasonably wellfor the rest of the CTD casts. Phytoplankton samples were also collected by filteringthrough a 20µm sieve water collected from 10m and from the depth of the deepchlorophyll maximum (DCM). Samples were preserved with formalin.
• Underway system
A summary of the data collected using the underway system is shown in Figure 1.Surface salinity values are higher in the eastern Bohol Sea showing the entry of Pacificsurface water through the Surigao Strait. The eastern part of the Sibuyan Sea also showshigher salinity compared to areas in the west. Again, this may also be Pacific surfacewater but entering the internal seas via the San Bernardino Strait.
Preliminary results of the PhilEx Exploratory Cruise
34
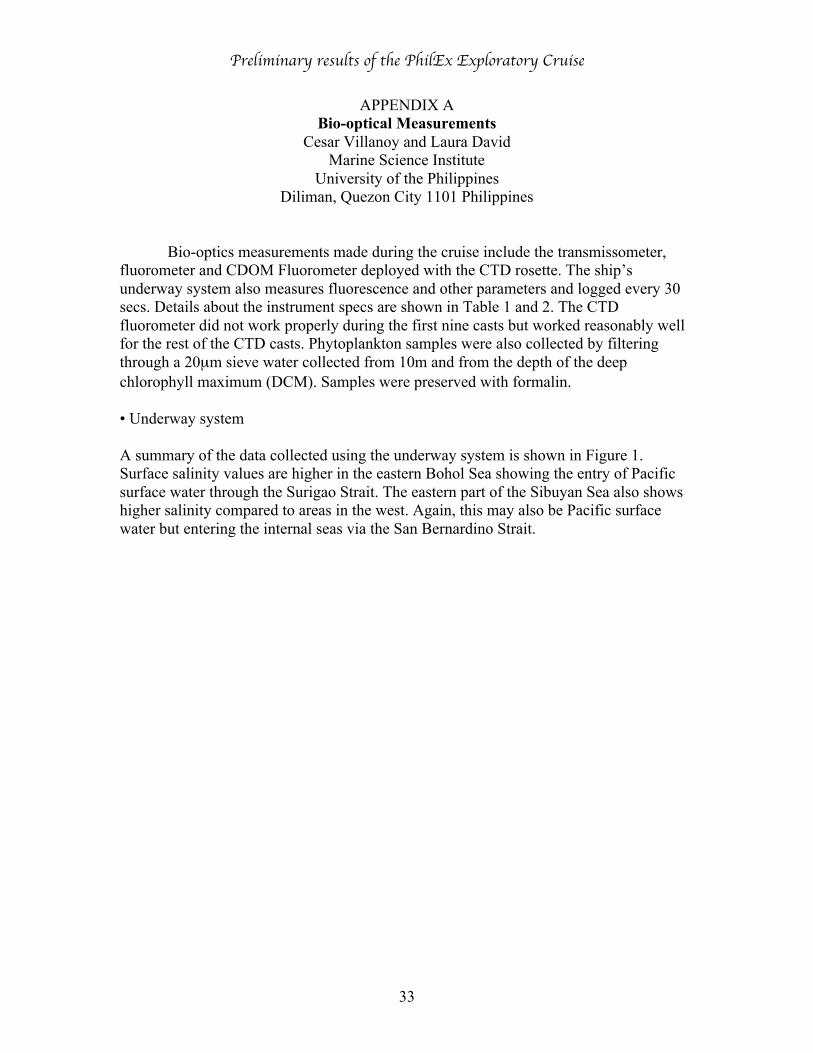
Figure 1. Hourly average values of underway parameters
Sea surface temperature and dissolved oxygen concentrations show distinct differencesbetween basins with cooler temperatures and higher dissolved oxygen concentrations atthe surface in the Bohol Sea compared to the Sulu Sea. These two parameters showstrong diurnal variations and therefore may also reflect both temporal and spatialvariations. Underway fluorometer readings show the highest chlorophyll concentrationsin Surigao Strait and relatively higher concentrations within straits, most likely due tomore vertical mixing as will be seen in chlorophyll profiles from the CTD casts.
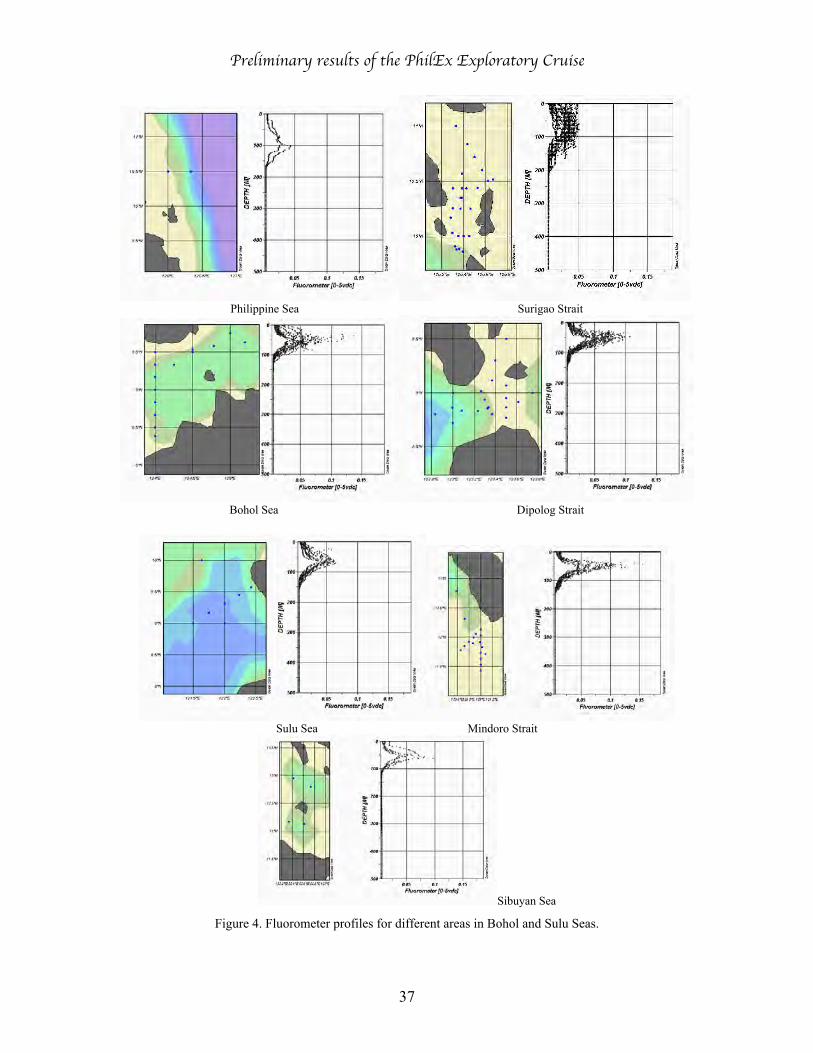
• Bio-optical measurements from CTD casts.
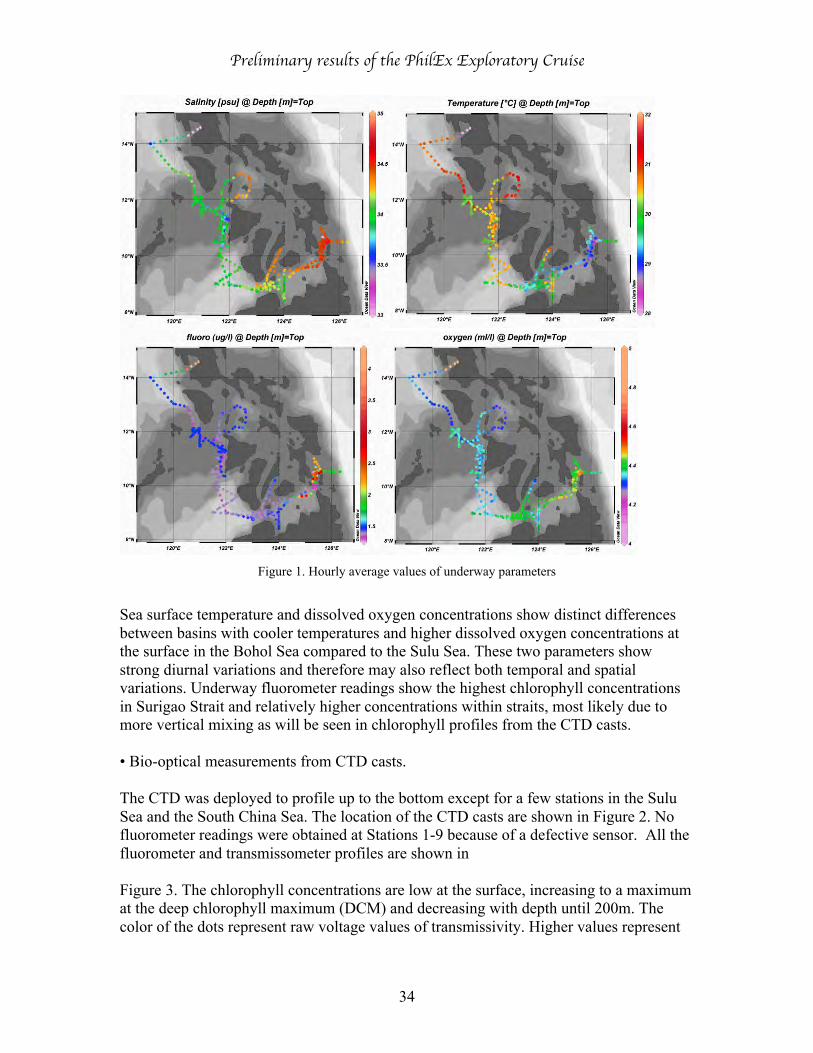
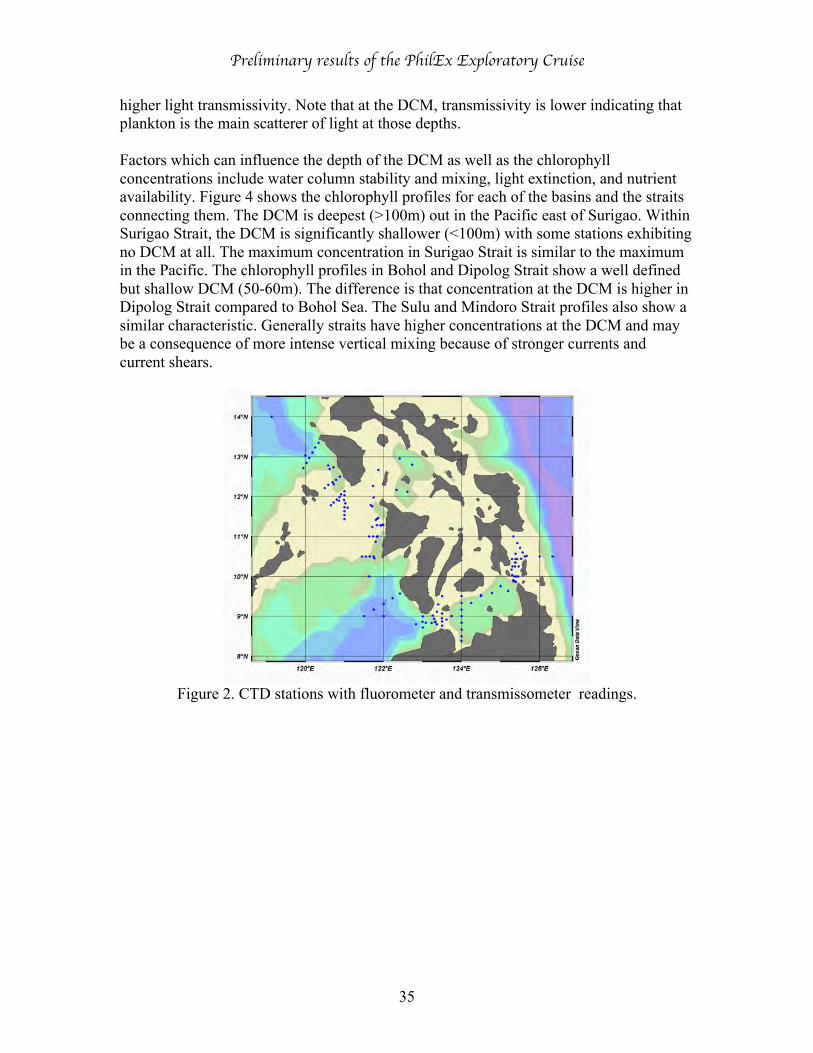
The CTD was deployed to profile up to the bottom except for a few stations in the SuluSea and the South China Sea. The location of the CTD casts are shown in Figure 2. Nofluorometer readings were obtained at Stations 1-9 because of a defective sensor. All thefluorometer and transmissometer profiles are shown in
Figure 3. The chlorophyll concentrations are low at the surface, increasing to a maximumat the deep chlorophyll maximum (DCM) and decreasing with depth until 200m. Thecolor of the dots represent raw voltage values of transmissivity. Higher values represent
Preliminary results of the PhilEx Exploratory Cruise
35
higher light transmissivity. Note that at the DCM, transmissivity is lower indicating thatplankton is the main scatterer of light at those depths.
Factors which can influence the depth of the DCM as well as the chlorophyllconcentrations include water column stability and mixing, light extinction, and nutrientavailability. Figure 4 shows the chlorophyll profiles for each of the basins and the straitsconnecting them. The DCM is deepest (>100m) out in the Pacific east of Surigao. WithinSurigao Strait, the DCM is significantly shallower (<100m) with some stations exhibitingno DCM at all. The maximum concentration in Surigao Strait is similar to the maximumin the Pacific. The chlorophyll profiles in Bohol and Dipolog Strait show a well definedbut shallow DCM (50-60m). The difference is that concentration at the DCM is higher inDipolog Strait compared to Bohol Sea. The Sulu and Mindoro Strait profiles also show asimilar characteristic. Generally straits have higher concentrations at the DCM and maybe a consequence of more intense vertical mixing because of stronger currents andcurrent shears.
Figure 2. CTD stations with fluorometer and transmissometer readings.
Preliminary results of the PhilEx Exploratory Cruise
36
Figure 3. Scatter plot of all fluorometer & transmissometer measurements. Values are inraw voltages.
Preliminary results of the PhilEx Exploratory Cruise
37
Philippine Sea Surigao Strait
Bohol Sea Dipolog Strait
Sulu Sea Mindoro Strait
Sibuyan Sea
Figure 4. Fluorometer profiles for different areas in Bohol and Sulu Seas.
Preliminary results of the PhilEx Exploratory Cruise
38
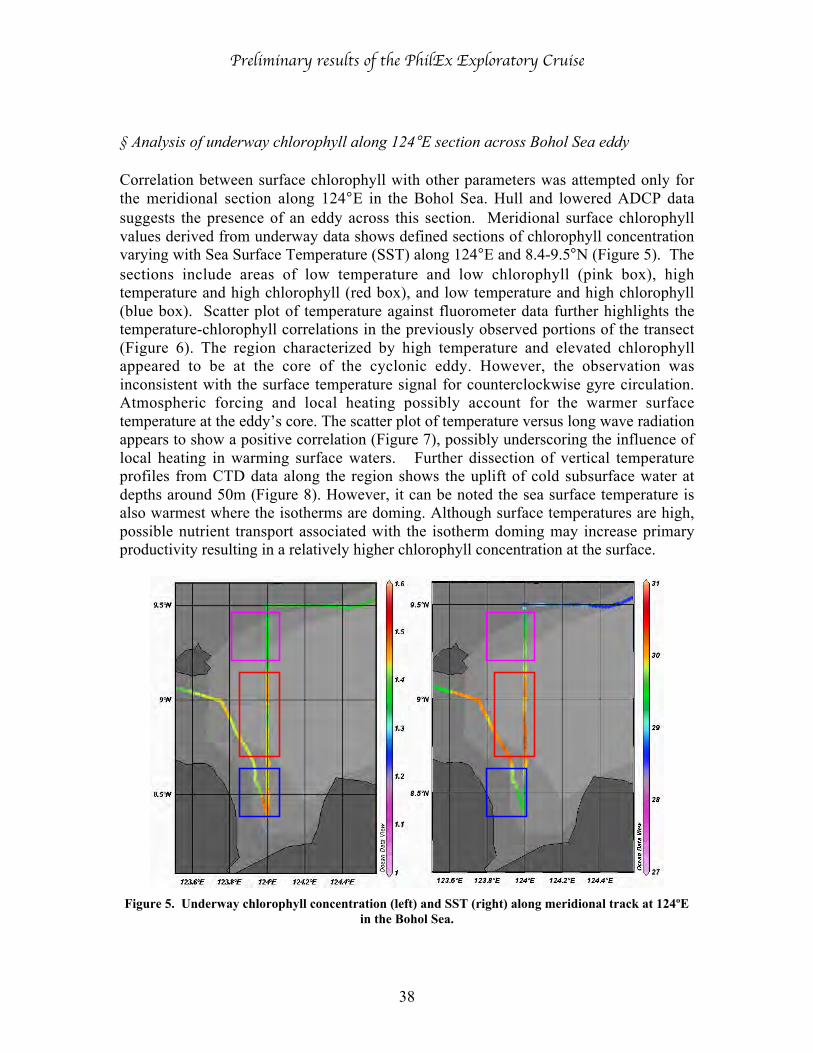
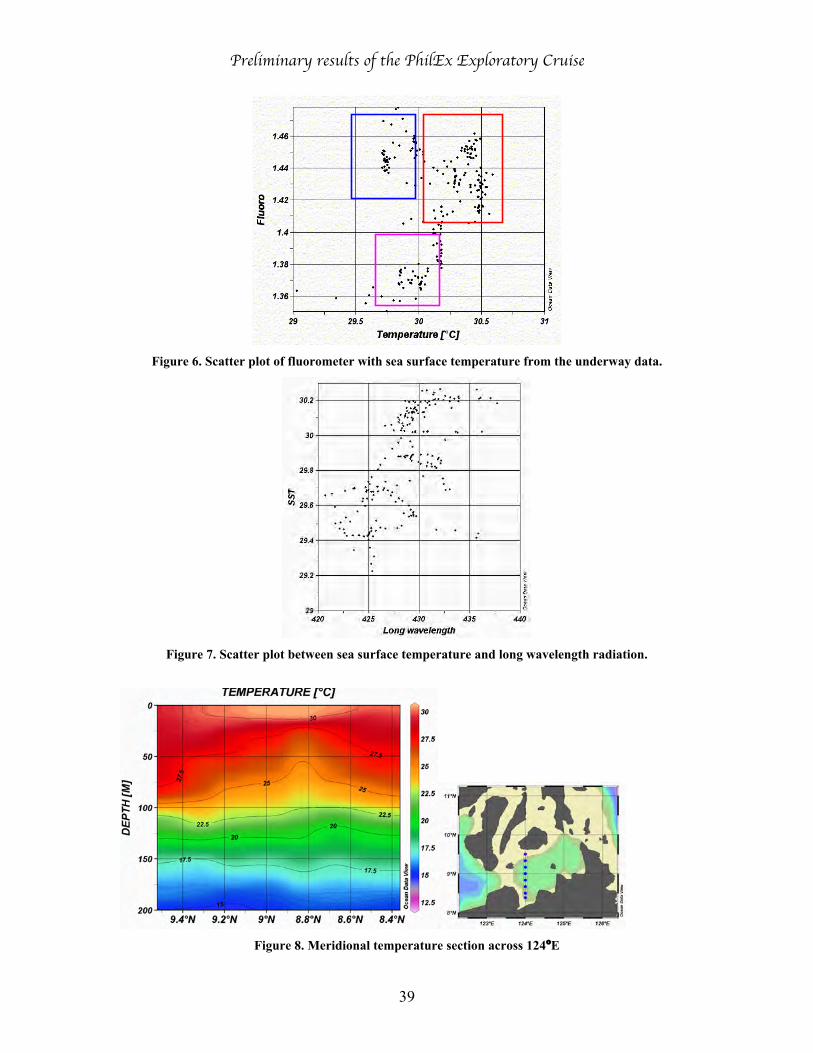
§ Analysis of underway chlorophyll along 124°E section across Bohol Sea eddy
Correlation between surface chlorophyll with other parameters was attempted only forthe meridional section along 124°E in the Bohol Sea. Hull and lowered ADCP datasuggests the presence of an eddy across this section. Meridional surface chlorophyllvalues derived from underway data shows defined sections of chlorophyll concentrationvarying with Sea Surface Temperature (SST) along 124°E and 8.4-9.5°N (Figure 5). Thesections include areas of low temperature and low chlorophyll (pink box), hightemperature and high chlorophyll (red box), and low temperature and high chlorophyll(blue box). Scatter plot of temperature against fluorometer data further highlights thetemperature-chlorophyll correlations in the previously observed portions of the transect(Figure 6). The region characterized by high temperature and elevated chlorophyllappeared to be at the core of the cyclonic eddy. However, the observation wasinconsistent with the surface temperature signal for counterclockwise gyre circulation.Atmospheric forcing and local heating possibly account for the warmer surfacetemperature at the eddy’s core. The scatter plot of temperature versus long wave radiationappears to show a positive correlation (Figure 7), possibly underscoring the influence oflocal heating in warming surface waters. Further dissection of vertical temperatureprofiles from CTD data along the region shows the uplift of cold subsurface water atdepths around 50m (Figure 8). However, it can be noted the sea surface temperature isalso warmest where the isotherms are doming. Although surface temperatures are high,possible nutrient transport associated with the isotherm doming may increase primaryproductivity resulting in a relatively higher chlorophyll concentration at the surface.
Figure 5. Underway chlorophyll concentration (left) and SST (right) along meridional track at 124ºEin the Bohol Sea.
Preliminary results of the PhilEx Exploratory Cruise
39
Figure 6. Scatter plot of fluorometer with sea surface temperature from the underway data.
Figure 7. Scatter plot between sea surface temperature and long wavelength radiation.
Figure 8. Meridional temperature section across 124°E
Preliminary results of the PhilEx Exploratory Cruise
40
APPENDIX BPhilEx Exploratory Cruise Drifter Data
Carter OhlmannR/V Melville
PhilEx Exploratory Cruise3 July 2007
1. Goal
The primary goal of PhilEx Exploratory Cruise is to “provide information on the regionaland strait sub-regional circulation to enhance design of the ’08 and ’09 IOP’s”. Towardsthis end, a set of drifting buoy deployments were performed to observe the surfacecirculation over a wide range of scales. The drifters measure “surface” currents at depthsshallower than resolved with cruise ADCP data, they sample on higher frequencies thanwith averaged ADCP data, and record data in locations beyond the cruise track. Inaddition, they measure velocities in a Lagrangian framework. These drifter experimentsare described here.
2. Instrumentation
Two types of drifting buoys were utilized, Surface Velocity Program (SVP) drifters forsampling the regional circulation or the large scale, and Microstar drifters for the straitsub-regional, or small scale.
SVP drifters are comprised of a holey sock drogue roughly 0.6 m in diameter and 6meters in length, and centered at a depth of 15 m. The drogue is attached to an ABSplastic surface float with a diameter of near 0.4 m that houses electronics. SVP driftersobtain their position every 1 hour with GPS, and by Doppler ranging with the Argossystem whenever an Argos satellite is in view (pass intervals variable between ~30minutes and 4 hours). Data, including position and SST, are transmitted via ServiceArgos and available from a host computer roughly 2-3 hours after collection.
The SVP drifters are similar in style to the roughly 1250 units presently sampling theworld ocean as part of the Global Drifter Program, with the addition of hourly GPSposition data necessary to properly resolve semi-diurnal tides. The half-life of SVPdrifters with hourly GPS data is roughly 1 year, making them an adequate tool forsampling the regional circulation. The utility of the SVP drifters for this project is insampling the regional scale circulation of the Sulu Sea and determining the fate of waterparcels entering the South China Sea, where drifters must sample for long periods. Forthe strait sub-regional circulation, where water parcels enter and exit in a few days orless, the sampling times (both frequency and life) are too long.
Microstar Drifters use a corner-radar-reflector type drogue roughly 1 m in diametercentered at a depth 1 meter below the sea surface. Electronics are housed in an ABS

Preliminary results of the PhilEx Exploratory Cruise
41
plastic surface float roughly 20 cm in diameter. Microstar drifters obtain their positionevery 10 minutes with GPS and transmit their data every 30 minutes through the Iridiumcommunications system. Data are received aboard the R/V Melville while at sea using aportable Iridium modem, or base station. The availability of near real-time data (every 30minutes) allows the drifters to be recovered and redeployed. Using the drifters in a catch-and-release manner greatly improves the economy of drifter experiments as a singleinstrument can be repetitively placed within a region/feature. The half-life of Microstardrifters is roughly 8 days, constrained by float size (i.e. batteries) and samplingfrequency. The utility of the Microstars for PhilEx is in repetitive sampling of fine scale(hours-days, 0.1 – 10’s km)) sub-regional circulation.
2. Deployments
A set of 6 drifter deployments were performed during the PhilEx Exploratory cruise.Each deployment was characterized by the release of between 2 and 12 drifters within aspecified region. Track lengths ranged from 5 hours to 4 days for the Microstar drifters.SVP drifters sampled during the last 2 to 14 days of the cruise and are expected tocontinue their measurements over the coming months.
The deployments marked a number of “firsts” that include: the first data collected fromsubstantial numbers of drifters deployed together within the Philippines Archipelago (afew mostly individual tracks have been collected over the years); the first time that largenumbers of drifters using Iridium communications have been used in a scientificexperiment; and the first time sets of more than a few buoys have been deployed,retrieved, and redeployed from a large research vessel with efficiency and ease. The keyto the novelty of the measurements lies in the Iridium SBD communications systemwhich allows high frequency data to be obtained economically in near real-time aboard aresearch vessel.
Dipolog Strait – Sulu Sea SVP deploymentA set of 8 SVP drifters were deployed in the region of the Dipolog Strait. Exactdeployment locations were selected to be along the ship’s CTD/ADCP sampling trackwhere drifters would hopefully be advected westward and into a presumed large scalegyre in the north-east Sulu Sea. SVP sampling details are given in Table 1 and tracksthrough the end of the cruise (writing of this report) are illustrated in Figure 1.
Drifters deployed in the Dipolog Strait (#’s 28, 32, and 33) show west-southwestmovement into the Sulu at a mean velocity near 0.25 m s-1. Drifter #28 did notsuccessfully transmit GPS data, so Argos position data is shown. Drifter # 32 was pickedup by a local boat and taken to Negros 1 day after deployment. Drifter #33 hassuccessfully transmitted both GPS and Argos position data during the course of itsmission and continues to do so. Drifters deployed to the west and northwest of theDipolog Strait show southerly and western movement. The two drifters that move mostlywest do so at only ~0.05 m s-1, a velocity that has remained consistently low during thecourse of deployment. The two drifters deployed nearest shore (Negros) show southward
Preliminary results of the PhilEx Exploratory Cruise
42
movement at ~0.10 – 0.20 m s-1 and were entrained in the westward moving Dipologoutflow and into the Sulu Sea.
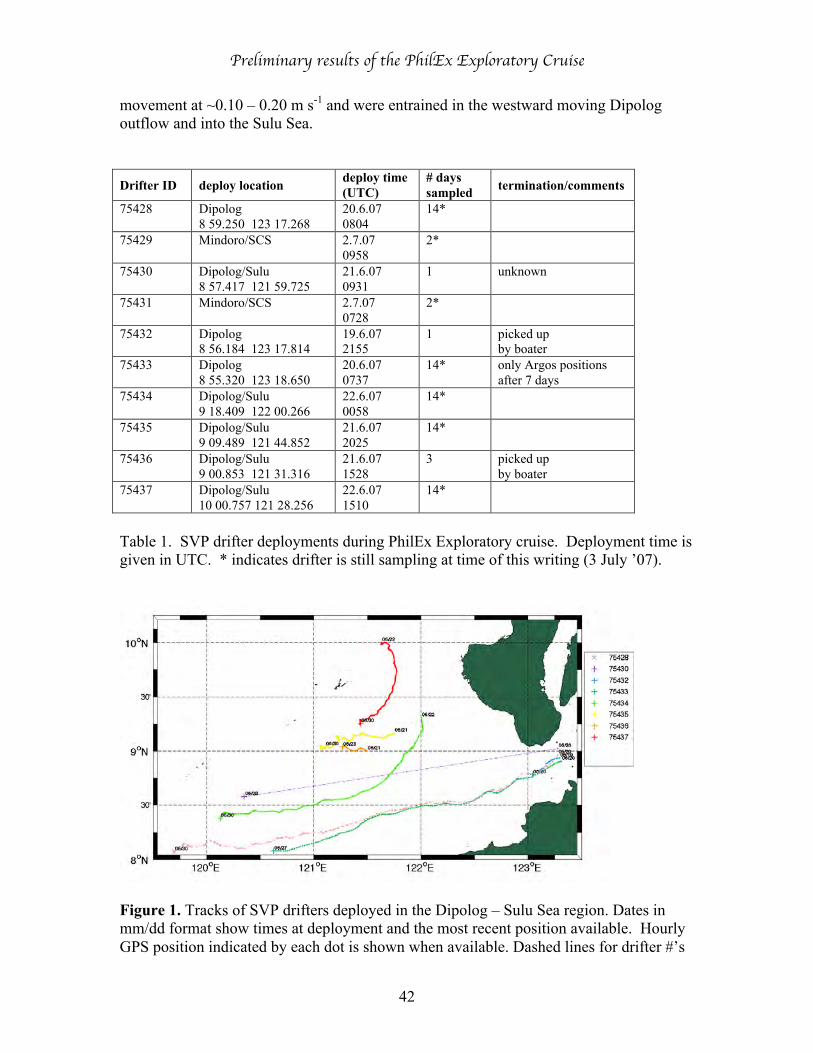
Drifter ID deploy locationdeploy time(UTC)
# dayssampled termination/comments
75428 Dipolog8 59.250 123 17.268
20.6.070804
14*
75429 Mindoro/SCS 2.7.070958
2*
75430 Dipolog/Sulu8 57.417 121 59.725
21.6.070931
1 unknown
75431 Mindoro/SCS 2.7.070728
2*
75432 Dipolog8 56.184 123 17.814
19.6.072155
1 picked upby boater
75433 Dipolog8 55.320 123 18.650
20.6.070737
14* only Argos positionsafter 7 days
75434 Dipolog/Sulu9 18.409 122 00.266
22.6.070058
14*
75435 Dipolog/Sulu9 09.489 121 44.852
21.6.072025
14*
75436 Dipolog/Sulu9 00.853 121 31.316
21.6.071528
3 picked upby boater
75437 Dipolog/Sulu10 00.757 121 28.256
22.6.071510
14*
Table 1. SVP drifter deployments during PhilEx Exploratory cruise. Deployment time isgiven in UTC. * indicates drifter is still sampling at time of this writing (3 July ’07).
Figure 1. Tracks of SVP drifters deployed in the Dipolog – Sulu Sea region. Dates inmm/dd format show times at deployment and the most recent position available. HourlyGPS position indicated by each dot is shown when available. Dashed lines for drifter #’s
Preliminary results of the PhilEx Exploratory Cruise
43
75428 and 75430 are from Argos positions acquired by Doppler ranging as GPS positionsdid not report. Drifter # 75430 traveled 8 days between successive position records.
The drifter data support the idea put forth by Chief Scientist Gordon (based on ADCPsurveys) that an anti-cyclonic eddy exists off the west coast of Negros. CTD data showwater properties confined to the eddy with surface water from Dipolog flowing northwardto Mindoro along the western edge of the eddy. Drifter numbers 35 and 36 showextremely small velocities for an extended period of time suggesting they might betrapped within the central region of such an eddy, and confirming the possibility ofconfined waters. Drifter number 34 and 37 suggest return flow along the inshore edge ofan eddy. A diurnal signal (presumed tidal) is clearly evident in many of the drifter trackseither through abrupt changes in direction (drifter #35) or changes in velocity along atrack with a mostly constant direction (drifter #33).
Mindoro Strait – South China Sea SVP deploymentA pair of SVP drifters were deployed in the extreme northwestern region of the Mindorostrait where it meets the South China Sea on the last sampling day of the cruise. Thedeployment location was near the center of the strait where the hull ADCP and Microstardrifters show northwestward flow near 0.70 m s-1. Deployment was within a fewkilometers of the location of Microstar drifters that moved from the Mindoro/Tablasregion to continue the tracing of surface waters that originated within the centralarchipelago.
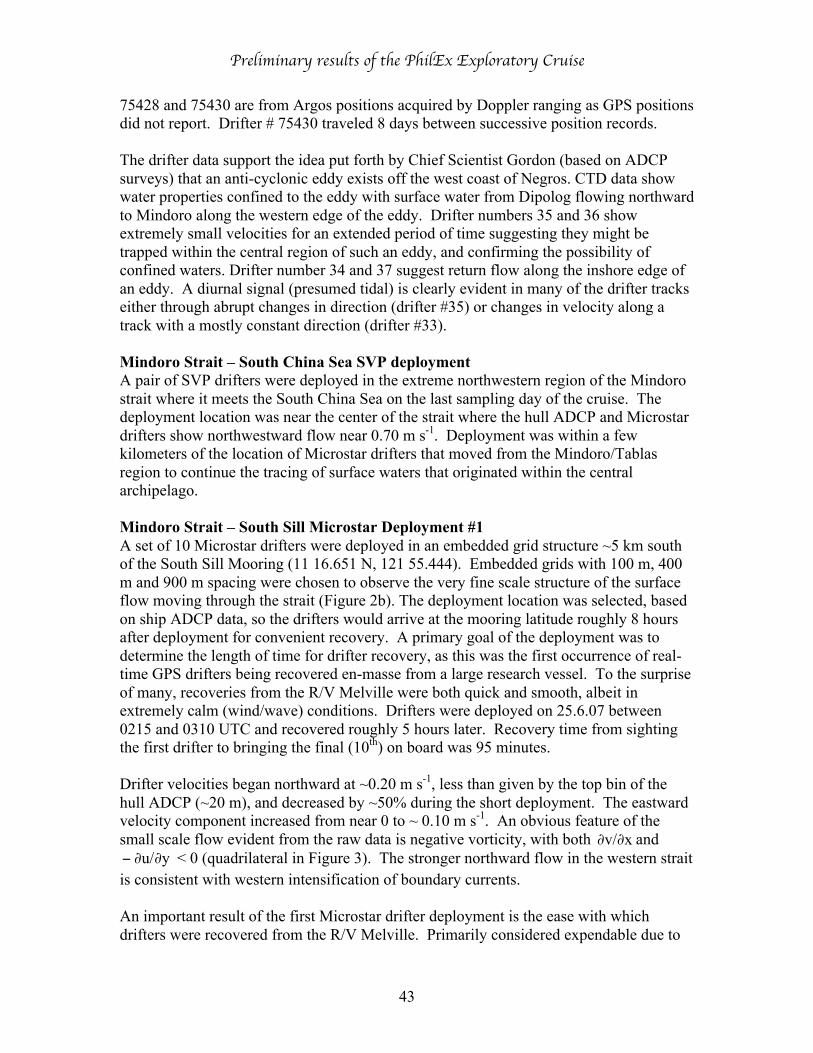
Mindoro Strait – South Sill Microstar Deployment #1A set of 10 Microstar drifters were deployed in an embedded grid structure ~5 km southof the South Sill Mooring (11 16.651 N, 121 55.444). Embedded grids with 100 m, 400m and 900 m spacing were chosen to observe the very fine scale structure of the surfaceflow moving through the strait (Figure 2b). The deployment location was selected, basedon ship ADCP data, so the drifters would arrive at the mooring latitude roughly 8 hoursafter deployment for convenient recovery. A primary goal of the deployment was todetermine the length of time for drifter recovery, as this was the first occurrence of real-time GPS drifters being recovered en-masse from a large research vessel. To the surpriseof many, recoveries from the R/V Melville were both quick and smooth, albeit inextremely calm (wind/wave) conditions. Drifters were deployed on 25.6.07 between0215 and 0310 UTC and recovered roughly 5 hours later. Recovery time from sightingthe first drifter to bringing the final (10th) on board was 95 minutes.
Drifter velocities began northward at ~0.20 m s-1, less than given by the top bin of thehull ADCP (~20 m), and decreased by ~50% during the short deployment. The eastwardvelocity component increased from near 0 to ~ 0.10 m s-1. An obvious feature of thesmall scale flow evident from the raw data is negative vorticity, with both xv/∂∂ and
yu/∂∂− < 0 (quadrilateral in Figure 3). The stronger northward flow in the western straitis consistent with western intensification of boundary currents.
An important result of the first Microstar drifter deployment is the ease with whichdrifters were recovered from the R/V Melville. Primarily considered expendable due to
Preliminary results of the PhilEx Exploratory Cruise
44
0.9 km
0.9 km
Panay
Mindoro
1 km1 km
a.
b.
c.
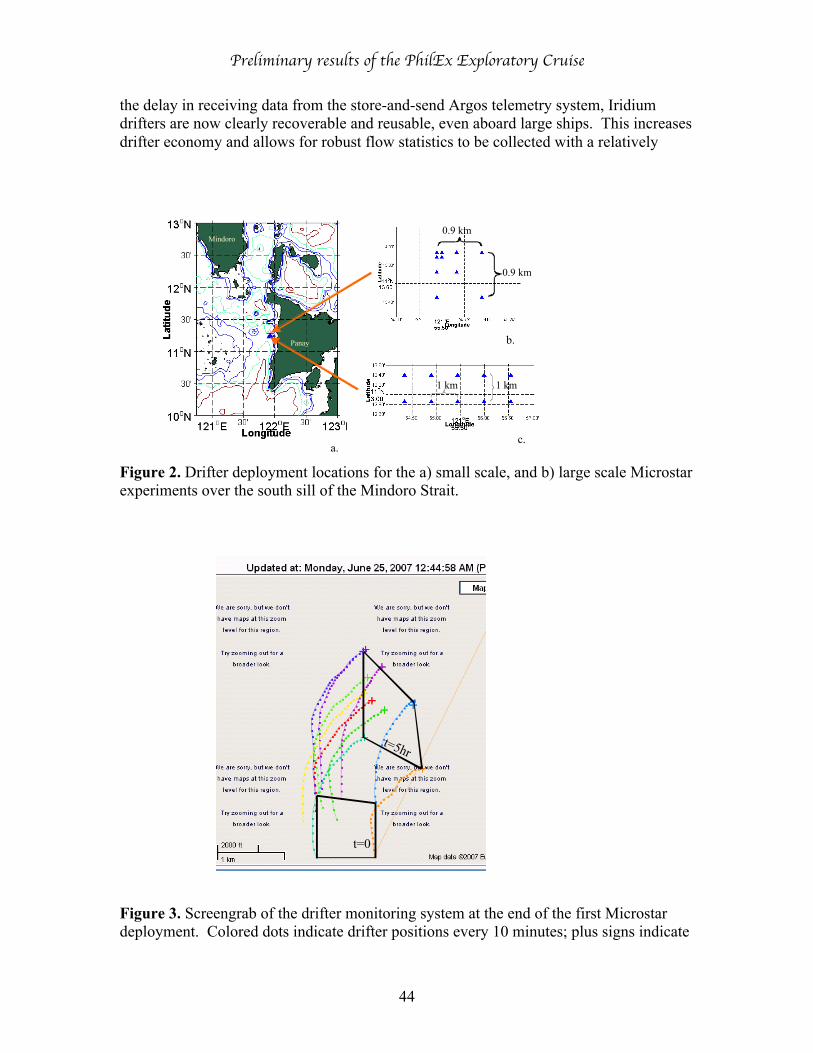
the delay in receiving data from the store-and-send Argos telemetry system, Iridiumdrifters are now clearly recoverable and reusable, even aboard large ships. This increasesdrifter economy and allows for robust flow statistics to be collected with a relatively
Figure 2. Drifter deployment locations for the a) small scale, and b) large scale Microstarexperiments over the south sill of the Mindoro Strait.
t=0
t=5hr
Figure 3. Screengrab of the drifter monitoring system at the end of the first Microstardeployment. Colored dots indicate drifter positions every 10 minutes; plus signs indicate
Preliminary results of the PhilEx Exploratory Cruise
45
ending positions. Quadrilaterals connect drifters comprising the outermost (0.9 km) gridat deployment (time = 0) and recovery (time = 5 hours).
small drifter fleet in areas where the small scale flow structure is targeted for study. Thequantity of Philippino fishing boats throughout the Strait at all times caused concernabout drifters being retrieved undesirably and taken ashore. Although some loss ofequipment occurred, the local fishermen seemed to heed writing on each drifter that reads“science experiment, please do not touch”.
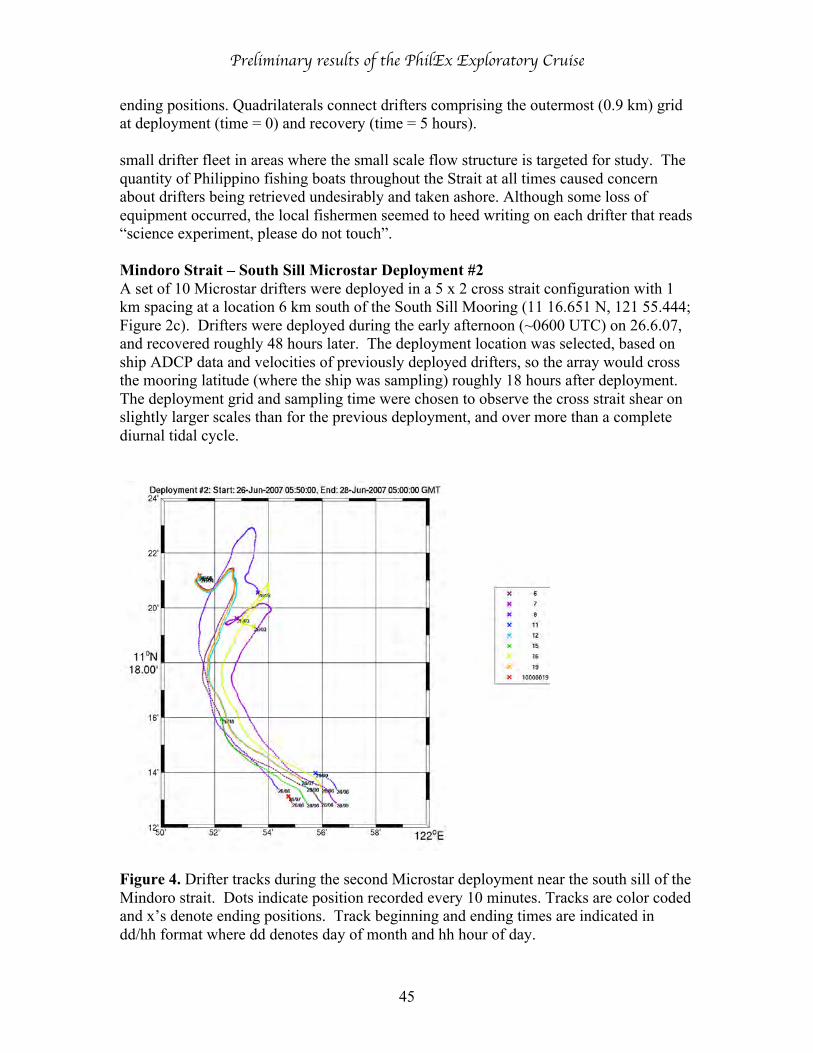
Mindoro Strait – South Sill Microstar Deployment #2A set of 10 Microstar drifters were deployed in a 5 x 2 cross strait configuration with 1km spacing at a location 6 km south of the South Sill Mooring (11 16.651 N, 121 55.444;Figure 2c). Drifters were deployed during the early afternoon (~0600 UTC) on 26.6.07,and recovered roughly 48 hours later. The deployment location was selected, based onship ADCP data and velocities of previously deployed drifters, so the array would crossthe mooring latitude (where the ship was sampling) roughly 18 hours after deployment.The deployment grid and sampling time were chosen to observe the cross strait shear onslightly larger scales than for the previous deployment, and over more than a completediurnal tidal cycle.
Figure 4. Drifter tracks during the second Microstar deployment near the south sill of theMindoro strait. Dots indicate position recorded every 10 minutes. Tracks are color codedand x’s denote ending positions. Track beginning and ending times are indicated indd/hh format where dd denotes day of month and hh hour of day.
Preliminary results of the PhilEx Exploratory Cruise
46
Drifters started out moving northeastward at ~0.25 m s-1, turning to northwestward atreduced velocities, and eventually returned southward for a few hours (Figure 4).Velocity values computed as a first difference in position show appreciable variations ontimescales which appear to be semi-diurnal and smaller. Velocity components appearboth in phase and 180 degrees out of phase during the 48 hour sampling period. As forthe previous Microstar deployment in the region, the drifter tracks generally illustrateanticyclonic vorticity, western velocity intensification, and significant variations onkilometer scales.
It was interesting that the regularly spaced array quickly rearranged itself into 4 separatepatches. Upon retrieval, a set of 3 drifters (some of which were not communicating) wasfound within ~ 200 - 300 m, and a set of 4 drifters was found within another ~200 – 300m region. At retrieval time drifters were located in regions of significant terrestrialflotsam (sticks, coconuts, etc.). Given the extremely light wind conditions, convergencepatterns that act on scales of a few kilometers are hypothesized to be surfacemanifestations of internal motions.
One of the 10 drifters deployed was picked up by a fisherman and taken to shore.Considering that more than 50 small fishing boats were visible with the naked eye at onepoint, and numerous boats were the norm, this loss rate is not considered bad. Threedrifters failed just after deployment due to what is believed to be an RF/ shieldingproblem with the instruments. Convergence patterns allowed 2 of the non-reportingdrifters to be retrieved as they accumulated with working drifters whose position wasknown.
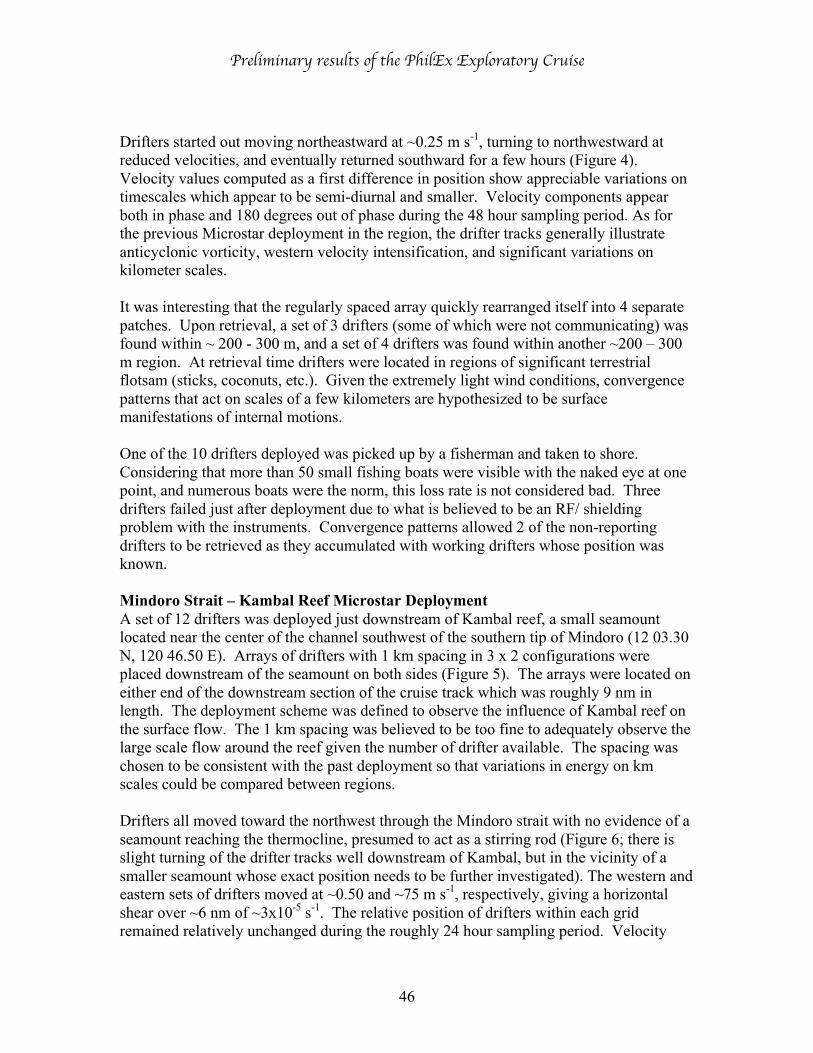
Mindoro Strait – Kambal Reef Microstar DeploymentA set of 12 drifters was deployed just downstream of Kambal reef, a small seamountlocated near the center of the channel southwest of the southern tip of Mindoro (12 03.30N, 120 46.50 E). Arrays of drifters with 1 km spacing in 3 x 2 configurations wereplaced downstream of the seamount on both sides (Figure 5). The arrays were located oneither end of the downstream section of the cruise track which was roughly 9 nm inlength. The deployment scheme was defined to observe the influence of Kambal reef onthe surface flow. The 1 km spacing was believed to be too fine to adequately observe thelarge scale flow around the reef given the number of drifter available. The spacing waschosen to be consistent with the past deployment so that variations in energy on kmscales could be compared between regions.
Drifters all moved toward the northwest through the Mindoro strait with no evidence of aseamount reaching the thermocline, presumed to act as a stirring rod (Figure 6; there isslight turning of the drifter tracks well downstream of Kambal, but in the vicinity of asmaller seamount whose exact position needs to be further investigated). The western andeastern sets of drifters moved at ~0.50 and ~75 m s-1, respectively, giving a horizontalshear over ~6 nm of ~3x10⁻⁵ s-1. The relative position of drifters within each gridremained relatively unchanged during the roughly 24 hour sampling period. Velocity
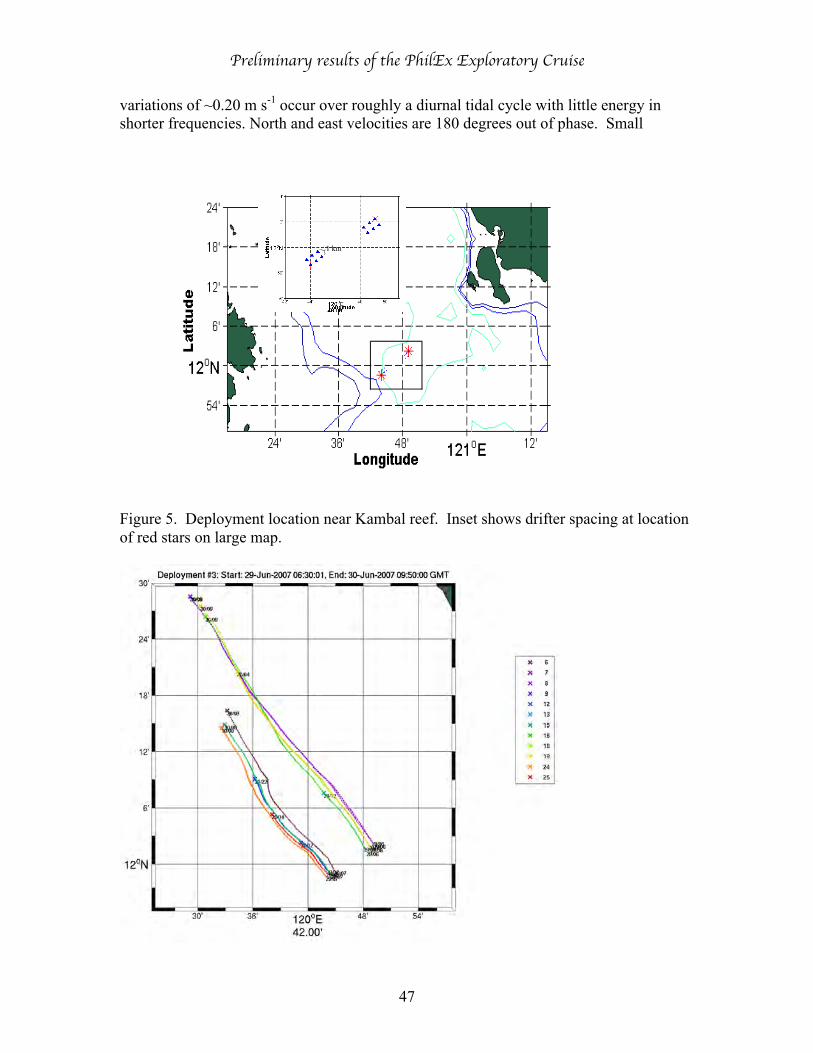
Preliminary results of the PhilEx Exploratory Cruise
47
variations of ~0.20 m s-1 occur over roughly a diurnal tidal cycle with little energy inshorter frequencies. North and east velocities are 180 degrees out of phase. Small
1 km
Figure 5. Deployment location near Kambal reef. Inset shows drifter spacing at locationof red stars on large map.
Preliminary results of the PhilEx Exploratory Cruise
48
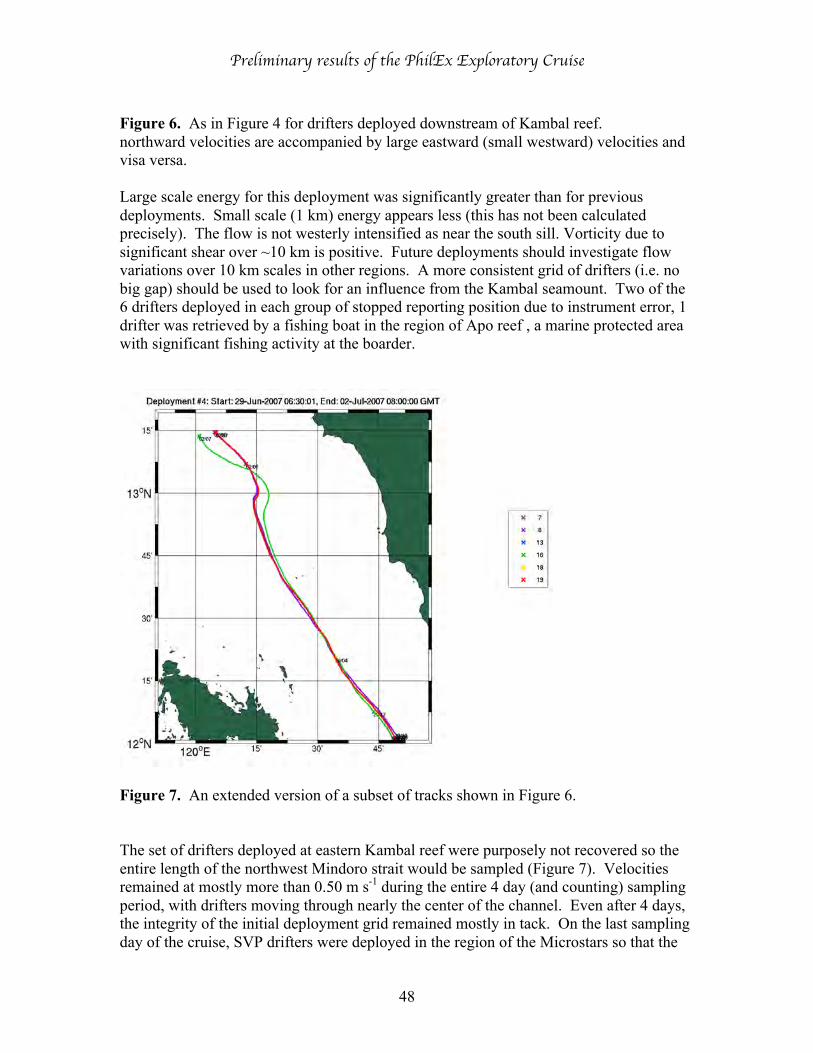
Figure 6. As in Figure 4 for drifters deployed downstream of Kambal reef.northward velocities are accompanied by large eastward (small westward) velocities andvisa versa.
Large scale energy for this deployment was significantly greater than for previousdeployments. Small scale (1 km) energy appears less (this has not been calculatedprecisely). The flow is not westerly intensified as near the south sill. Vorticity due tosignificant shear over ~10 km is positive. Future deployments should investigate flowvariations over 10 km scales in other regions. A more consistent grid of drifters (i.e. nobig gap) should be used to look for an influence from the Kambal seamount. Two of the6 drifters deployed in each group of stopped reporting position due to instrument error, 1drifter was retrieved by a fishing boat in the region of Apo reef , a marine protected areawith significant fishing activity at the boarder.
Figure 7. An extended version of a subset of tracks shown in Figure 6.
The set of drifters deployed at eastern Kambal reef were purposely not recovered so theentire length of the northwest Mindoro strait would be sampled (Figure 7). Velocitiesremained at mostly more than 0.50 m s-1 during the entire 4 day (and counting) samplingperiod, with drifters moving through nearly the center of the channel. Even after 4 days,the integrity of the initial deployment grid remained mostly in tack. On the last samplingday of the cruise, SVP drifters were deployed in the region of the Microstars so that the
Preliminary results of the PhilEx Exploratory Cruise
49
fate of Mindoro strait water can be tracked even after the Microstars reach the end oftheir ~8 day sampling life. Finally, it is worth noting that while the first few drifterdeployments were characterized by calm winds and seas, winds along the northwesternMindoro were as large as 20 knots and mostly from the south-east with little curl on thecross-strait scale.
Mindoro Strait – Apo Reef Microstar DeploymentA set of 4 Microstar drifters were deployed just downstream of the eastern edge of Aporeef in hopes of observing stirring caused by the seamount (Figure 8). Originally, a gridof 6 drifters in a 2 x 3 array with the usual 1 km spacing was planned for a location asclose to the reef as the R/V Melville could safely travel (~2.5 km). This location turnedout to coincide with the outer edge of the marine protected area where fishermencongregate. Fishing traffic was so dense that the R/V Melville was unable to navigate totwo of the stations. Thus, only 4 drifters were deployed. Two of these failed due toinstrument malfunction, 1 was picked up by a fisherman and later redeployed, and 1 waspicked up by a fisherman and taken to shore.
The two drifters that successfully sampled clearly show recirculation in the lee of the reef(Figure 9). All drifters began moving south-eastward, opposite the larger scale channelflow, at near 0.50 m s-1. Cyclonic circulation toward the north-east, north, and north-westthen occurred. After moving roughly 8 nm further down channel, the remaining drifteragain moved with rapid cyclonic motion, ending with southward flow at ~0.20 m s-1. Thedrifter deployed on the west side of the reef rotated anti-cyclonically, ultimately movingsouth-east at ~0.10 m s-1 in the lee of the reef.
Observations show recirculation, and not the generation of eddies and their movementdownstream. This may be an artifact of the extremely sparse sampling. Apo reef clearlyhas the potential to induce significant vorticity into the flow. This region should betargeted for a more in depth study. With all the fishing traffic an extensive drifter studymight prove difficult. Much could likely be learned from data collected as part of atowed survey in the lee of Apo reef. Similarly, the absence of vorticity in the lee ofKambal reef may arise from an overly sparse or improperly configured sampling strategyand the influence of smaller seamounts on the channel flow needs further investigation.
3. Summary/CommentsThe timing of this report, due at the end of the cruise, dictates a bias toward discussion ofsampling logistics, instrument performance, and a descriptive summary of driftermovement. Many drifters are still sampling including 7 SVP drifters that will hopefullyrecord the regional circulation over many months to come.
A total of 30 Microstar tracks with an average length of ~2 days were collected with 12drifters during the cruise. Sampling by 7 SVP drifters is still ongoing. The deploymentsmark the first use of more than a handful of drifters that transmit real-time position datato a research vessel through Iridium. Although 5 Microstar drifters were lost due tofailure, the reason for failure was presumably discovered, and the drifters will be
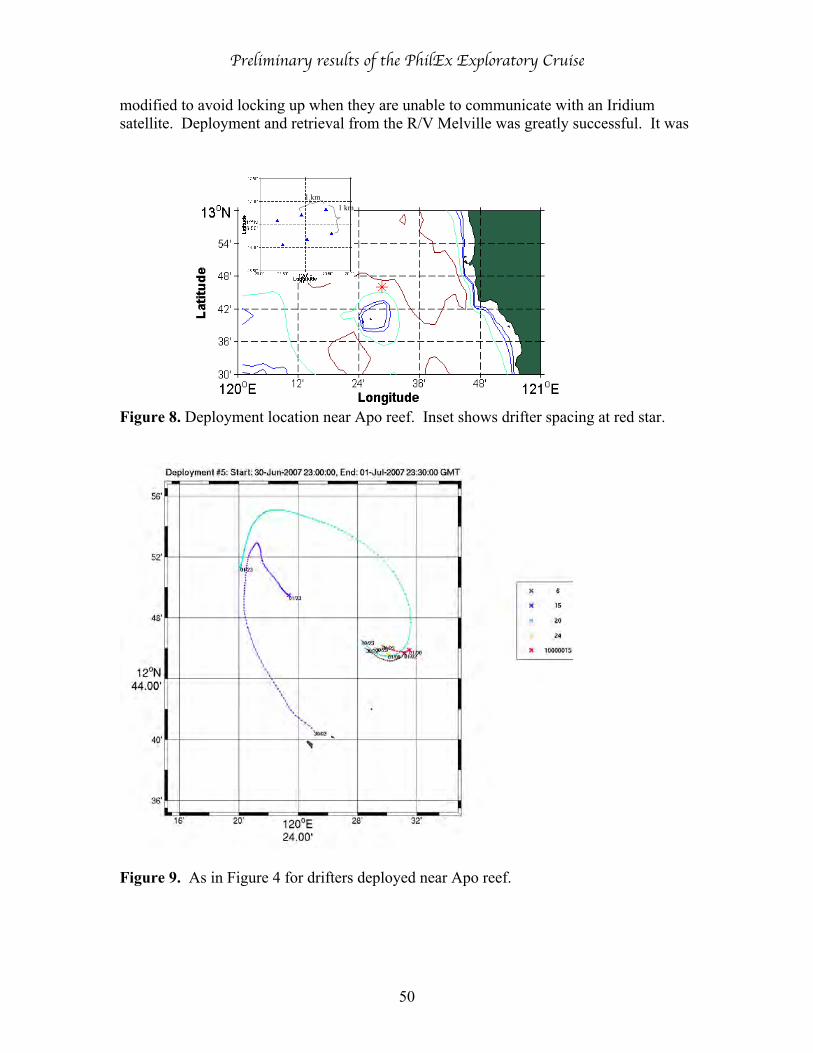
Preliminary results of the PhilEx Exploratory Cruise
50
1 km1 km
modified to avoid locking up when they are unable to communicate with an Iridiumsatellite. Deployment and retrieval from the R/V Melville was greatly successful. It was
Figure 8. Deployment location near Apo reef. Inset shows drifter spacing at red star.
Figure 9. As in Figure 4 for drifters deployed near Apo reef.
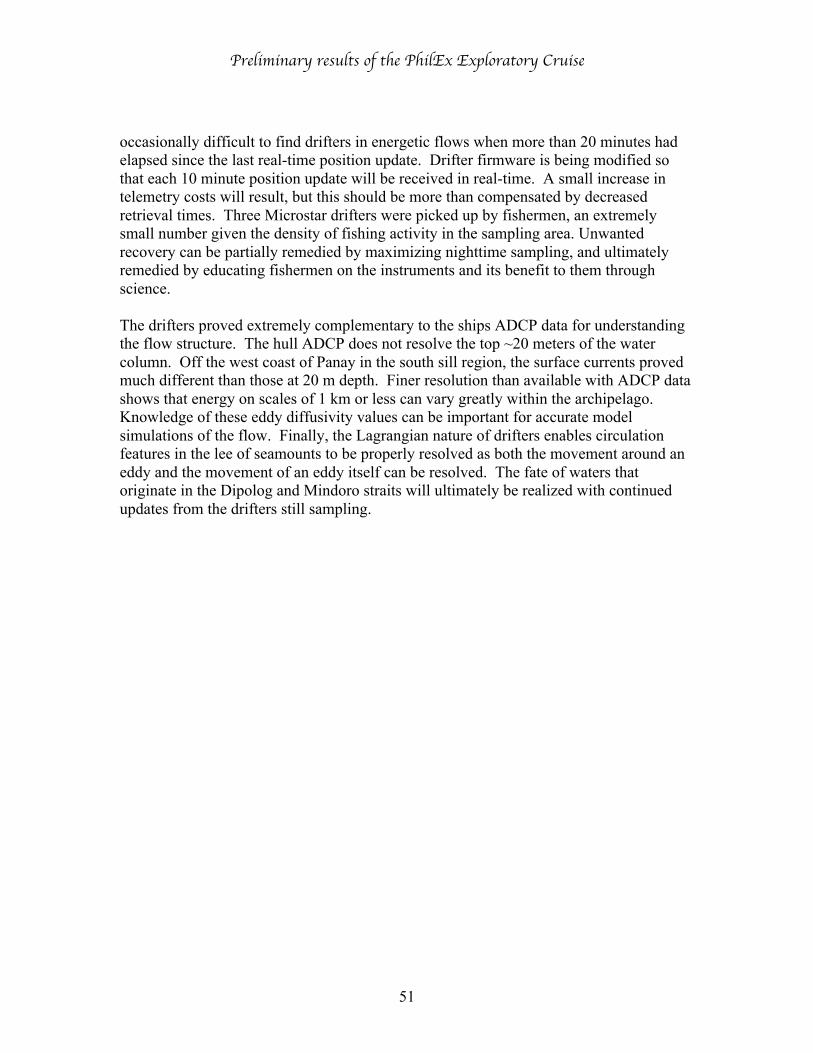
Preliminary results of the PhilEx Exploratory Cruise
51
occasionally difficult to find drifters in energetic flows when more than 20 minutes hadelapsed since the last real-time position update. Drifter firmware is being modified sothat each 10 minute position update will be received in real-time. A small increase intelemetry costs will result, but this should be more than compensated by decreasedretrieval times. Three Microstar drifters were picked up by fishermen, an extremelysmall number given the density of fishing activity in the sampling area. Unwantedrecovery can be partially remedied by maximizing nighttime sampling, and ultimatelyremedied by educating fishermen on the instruments and its benefit to them throughscience.
The drifters proved extremely complementary to the ships ADCP data for understandingthe flow structure. The hull ADCP does not resolve the top ~20 meters of the watercolumn. Off the west coast of Panay in the south sill region, the surface currents provedmuch different than those at 20 m depth. Finer resolution than available with ADCP datashows that energy on scales of 1 km or less can vary greatly within the archipelago.Knowledge of these eddy diffusivity values can be important for accurate modelsimulations of the flow. Finally, the Lagrangian nature of drifters enables circulationfeatures in the lee of seamounts to be properly resolved as both the movement around aneddy and the movement of an eddy itself can be resolved. The fate of waters thatoriginate in the Dipolog and Mindoro straits will ultimately be realized with continuedupdates from the drifters still sampling.