Embed Size (px)
Citation preview
State of the Industry Research Series :
3rd Annual Analytics in Retail Study
www.eknresearch.com
EKN is part of the Edgell Family
Supporting SponsorPremier Sponsor
2014
®
Table of Contents
Executive Summary 3
State of Retail Analytics 5
Data: Sailing Through the Data Tsunami 12
Analytics Tools & Machine Intelligence: Future of the Analytics Toolset 17
Skills & Ingenuity: Bridging the Skills & Capabilities Chasm 22
Strategy Codification: Making Analytics a Part of the Organization’s DNA 25
Decoding the DNA of an Analytics Superstar 30
Amazon - The Cult of Analytics 33
Retail Honor Board 35
Executive Summary
EKN 4 State of the Industry Research Series: 3rd Annual Analytics in Retail Study5
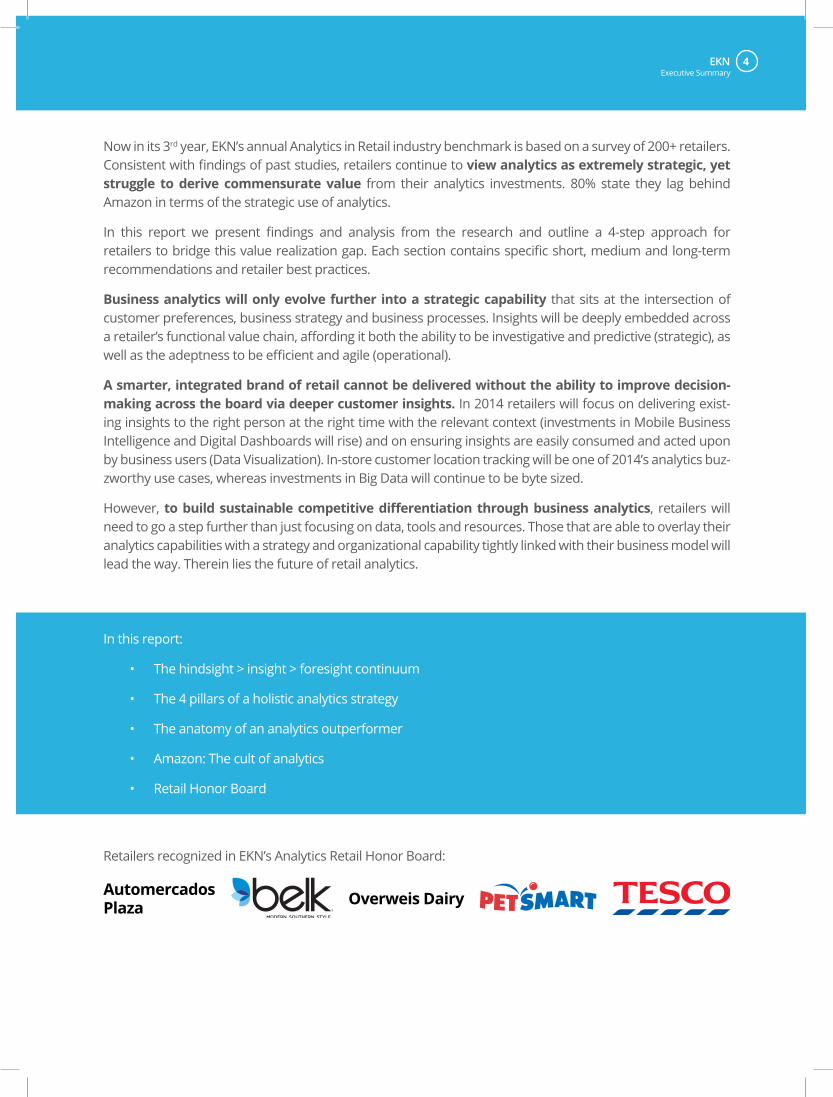
Now in its 3rd year, EKN’s annual Analytics in Retail industry benchmark is based on a survey of 200+ retailers. Consistent with findings of past studies, retailers continue to view analytics as extremely strategic, yet struggle to derive commensurate value from their analytics investments. 80% state they lag behind Amazon in terms of the strategic use of analytics.
In this report we present findings and analysis from the research and outline a 4-step approach for retailers to bridge this value realization gap. Each section contains specific short, medium and long-term recommendations and retailer best practices.
Business analytics will only evolve further into a strategic capability that sits at the intersection of customer preferences, business strategy and business processes. Insights will be deeply embedded across a retailer’s functional value chain, affording it both the ability to be investigative and predictive (strategic), as well as the adeptness to be efficient and agile (operational).
A smarter, integrated brand of retail cannot be delivered without the ability to improve decision-making across the board via deeper customer insights. In 2014 retailers will focus on delivering exist-ing insights to the right person at the right time with the relevant context (investments in Mobile Business Intelligence and Digital Dashboards will rise) and on ensuring insights are easily consumed and acted upon by business users (Data Visualization). In-store customer location tracking will be one of 2014’s analytics buz-zworthy use cases, whereas investments in Big Data will continue to be byte sized.
However, to build sustainable competitive differentiation through business analytics, retailers will need to go a step further than just focusing on data, tools and resources. Those that are able to overlay their analytics capabilities with a strategy and organizational capability tightly linked with their business model will lead the way. Therein lies the future of retail analytics.
In this report:
• The hindsight > insight > foresight continuum
• The 4 pillars of a holistic analytics strategy
• The anatomy of an analytics outperformer
• Amazon: The cult of analytics
• Retail Honor Board
Retailers recognized in EKN’s Analytics Retail Honor Board:
Executive Summary
Automercados Plaza Overweis Dairy
EKN 4 State of the Industry Research Series: 3rd Annual Analytics in Retail Study5
State of Retail Analytics
EKN 6 State of the Industry Research Series: 3rd Annual Analytics in Retail Study7
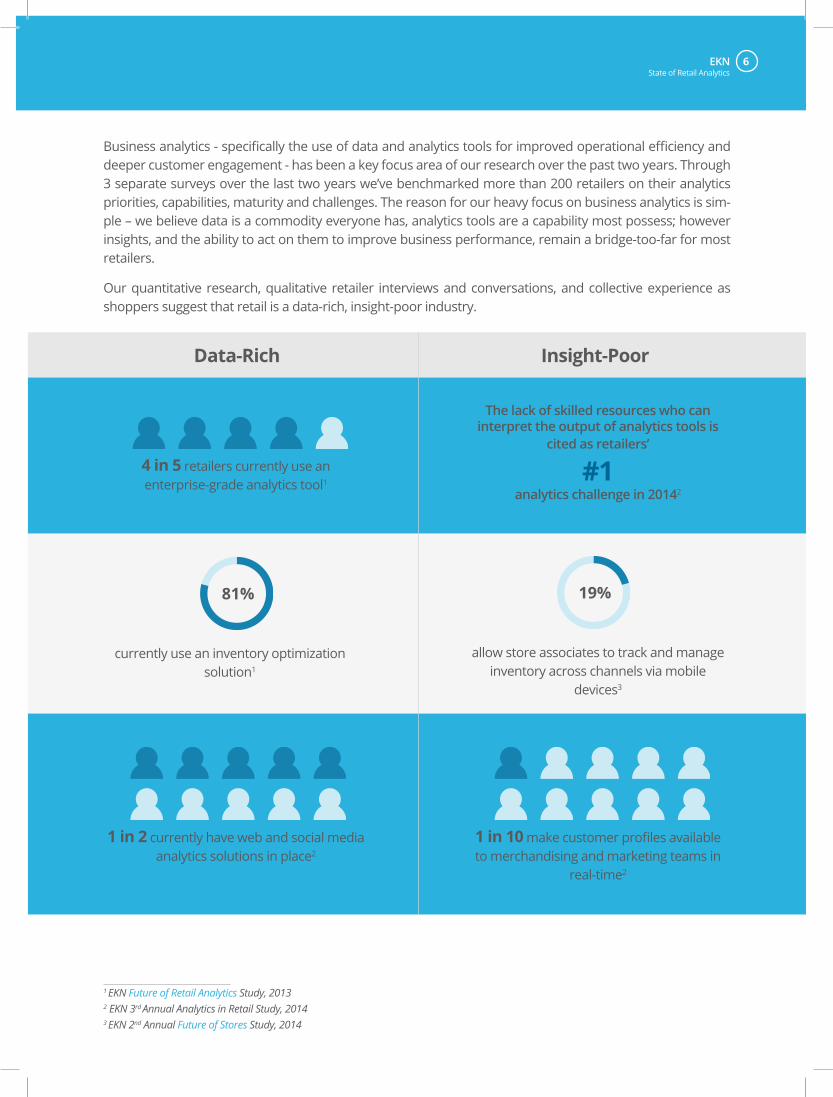
Business analytics - specifically the use of data and analytics tools for improved operational efficiency and deeper customer engagement - has been a key focus area of our research over the past two years. Through 3 separate surveys over the last two years we’ve benchmarked more than 200 retailers on their analytics priorities, capabilities, maturity and challenges. The reason for our heavy focus on business analytics is sim-ple – we believe data is a commodity everyone has, analytics tools are a capability most possess; however insights, and the ability to act on them to improve business performance, remain a bridge-too-far for most retailers.
Our quantitative research, qualitative retailer interviews and conversations, and collective experience as shoppers suggest that retail is a data-rich, insight-poor industry.
Data-Rich Insight-Poor
4 in 5 retailers currently use an enterprise-grade analytics tool1
1 in 2 currently have web and social media analytics solutions in place2
1 in 10 make customer profiles available to merchandising and marketing teams in
real-time2
The lack of skilled resources who can interpret the output of analytics tools is
cited as retailers’
#1 analytics challenge in 20142
currently use an inventory optimization solution1
allow store associates to track and manage inventory across channels via mobile
devices3
81% 19%
1 EKN Future of Retail Analytics Study, 20132 EKN 3rd Annual Analytics in Retail Study, 20143 EKN 2nd Annual Future of Stores Study, 2014
State of Retail Analytics
EKN 6 State of the Industry Research Series: 3rd Annual Analytics in Retail Study7
Rather than continue to simply benchmark retailers’ analytics maturity, our research focus in 2014 was threefold:
• To validate past findings and determine what, if any, improvements have occurred in terms of retailers’ use of data and analytics to improve business performance
• To illustrate gaps in retailers’ business processes, technology systems and organizational culture that limit the value derived from current analytics
• To present a framework through which retailers can begin to move from a focus on data and analysis to one on insights and action
We take the participation of 200+ retailers in EKN’s 2014 Future of Analytics study as a validation of our approach. We thank each participant for making this one of the most comprehensive and participative pieces of research on business analytics in the retail industry.
EKN’s 2014 Retail Analytics benchmark study is based on a large survey of 200+ retailers in North America
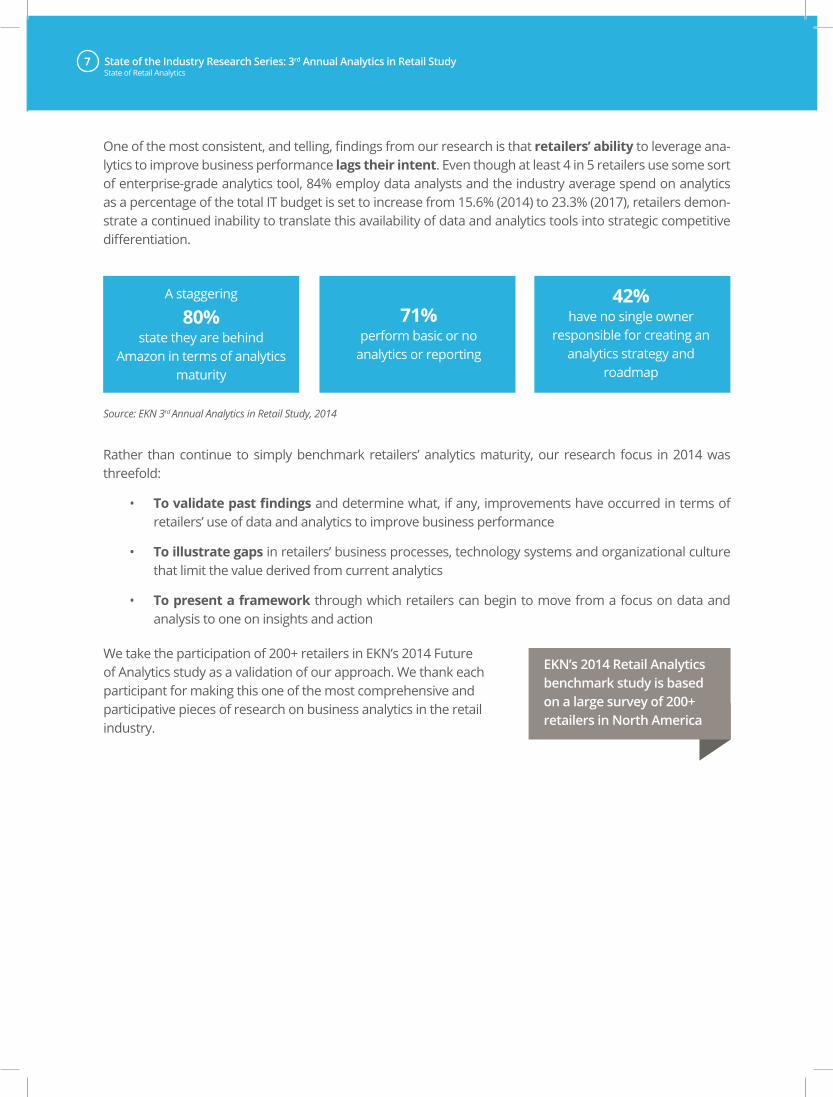
Source: EKN 3rd Annual Analytics in Retail Study, 2014
State of Retail Analytics
One of the most consistent, and telling, findings from our research is that retailers’ ability to leverage ana-lytics to improve business performance lags their intent. Even though at least 4 in 5 retailers use some sort of enterprise-grade analytics tool, 84% employ data analysts and the industry average spend on analytics as a percentage of the total IT budget is set to increase from 15.6% (2014) to 23.3% (2017), retailers demon-strate a continued inability to translate this availability of data and analytics tools into strategic competitive differentiation.
A staggering
80% state they are behind
Amazon in terms of analytics maturity
71% perform basic or no
analytics or reporting
42% have no single owner
responsible for creating an analytics strategy and
roadmap
EKN 8 State of the Industry Research Series: 3rd Annual Analytics in Retail Study9
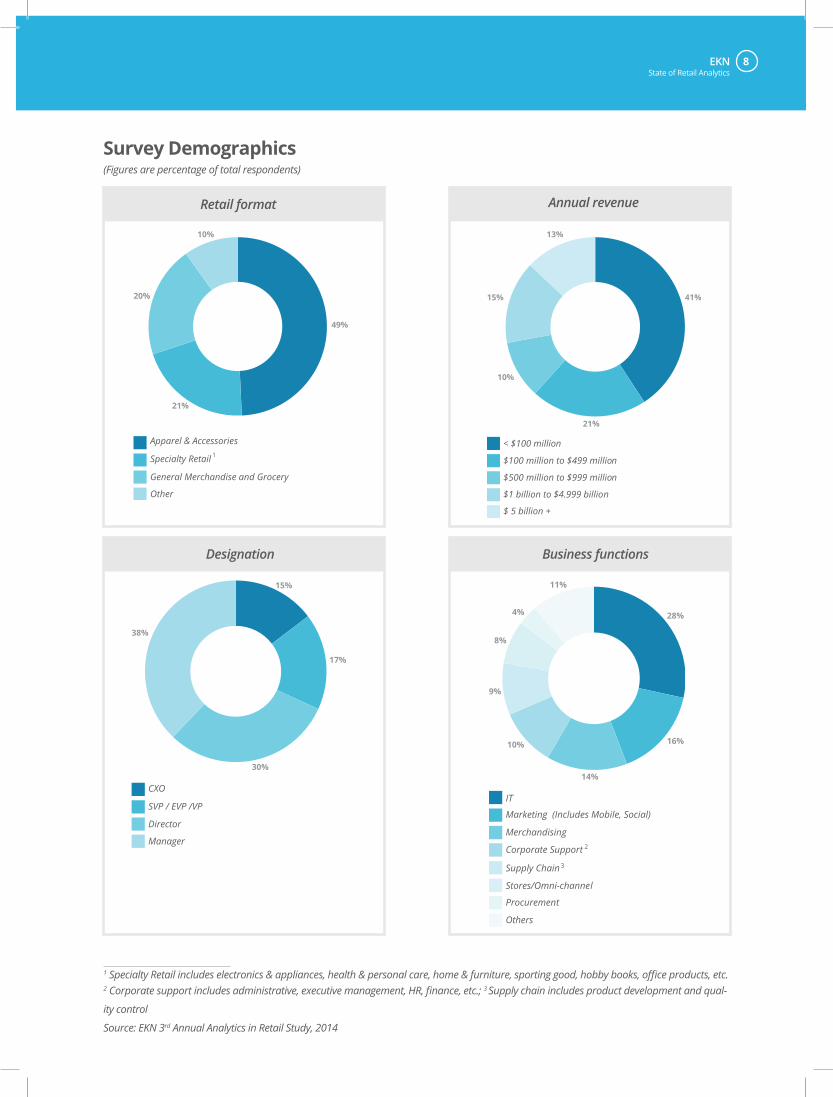
Survey Demographics (Figures are percentage of total respondents)
Retail format
Designation
Annual revenue
Business functions
1 Specialty Retail includes electronics & appliances, health & personal care, home & furniture, sporting good, hobby books, office products, etc.2 Corporate support includes administrative, executive management, HR, finance, etc.; 3 Supply chain includes product development and qual-
ity control
Source: EKN 3rd Annual Analytics in Retail Study, 2014
49%
21%
20%
10%
Apparel & Accessories
Specialty Retail
General Merchandise and Grocery
Other
1
15%
17%
30%
38%
CXO
SVP / EVP /VP
Director
Manager
41%
21%
10%
15%
13%
< $100 million
$100 million to $499 million
$500 million to $999 million
$1 billion to $4.999 billion
$ 5 billion +
28%
16%
14%
10%
9%
8%
4%
11%
IT
Marketing (Includes Mobile, Social)
Merchandising
Corporate Support
Supply Chain
Stores/Omni-channel
Procurement
Others
2
3
State of Retail Analytics
EKN 8 State of the Industry Research Series: 3rd Annual Analytics in Retail Study9
1 EKN 3rd Annual Analytics in Retail Study, 2014
From Analytics to InsightsAdvanced analytics tools, access to a variety of data and advances in data storage infrastructure have eased technical constraints, but retailers are still only able to scratch the surface in terms of business results from their analytics investments. Less than a third have developed analytics as an enterprise-wide capability.
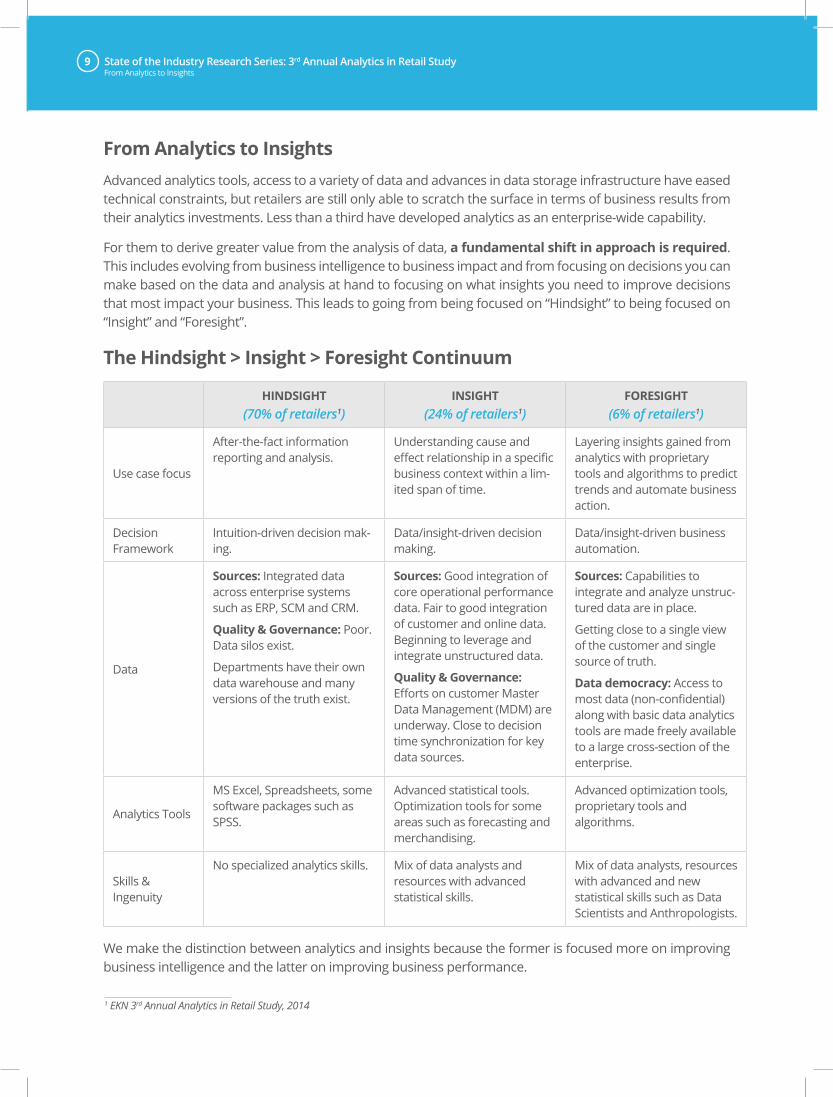
For them to derive greater value from the analysis of data, a fundamental shift in approach is required. This includes evolving from business intelligence to business impact and from focusing on decisions you can make based on the data and analysis at hand to focusing on what insights you need to improve decisions that most impact your business. This leads to going from being focused on “Hindsight” to being focused on “Insight” and “Foresight”.
The Hindsight > Insight > Foresight Continuum
From Analytics to Insights
HINDSIGHT (70% of retailers1)
INSIGHT (24% of retailers1)
FORESIGHT (6% of retailers1)
Use case focus
After-the-fact information reporting and analysis.
Understanding cause and effect relationship in a specific business context within a lim-ited span of time.
Layering insights gained from analytics with proprietary tools and algorithms to predict trends and automate business action.
Decision Framework
Intuition-driven decision mak-ing.
Data/insight-driven decision making.
Data/insight-driven business automation.
Data
Sources: Integrated data across enterprise systems such as ERP, SCM and CRM.
Quality & Governance: Poor. Data silos exist.
Departments have their own data warehouse and many versions of the truth exist.
Sources: Good integration of core operational performance data. Fair to good integration of customer and online data. Beginning to leverage and integrate unstructured data.
Quality & Governance: Efforts on customer Master Data Management (MDM) are underway. Close to decision time synchronization for key data sources.
Sources: Capabilities to integrate and analyze unstruc-tured data are in place.
Getting close to a single view of the customer and single source of truth.
Data democracy: Access to most data (non-confidential) along with basic data analytics tools are made freely available to a large cross-section of the enterprise.
Analytics Tools
MS Excel, Spreadsheets, some software packages such as SPSS.
Advanced statistical tools. Optimization tools for some areas such as forecasting and merchandising.
Advanced optimization tools, proprietary tools and algorithms.
Skills & Ingenuity
No specialized analytics skills. Mix of data analysts and resources with advanced statistical skills.
Mix of data analysts, resources with advanced and new statistical skills such as Data Scientists and Anthropologists.
We make the distinction between analytics and insights because the former is focused more on improving business intelligence and the latter on improving business performance.
EKN 10 State of the Industry Research Series: 3rd Annual Analytics in Retail Study11From Analytics to Insights
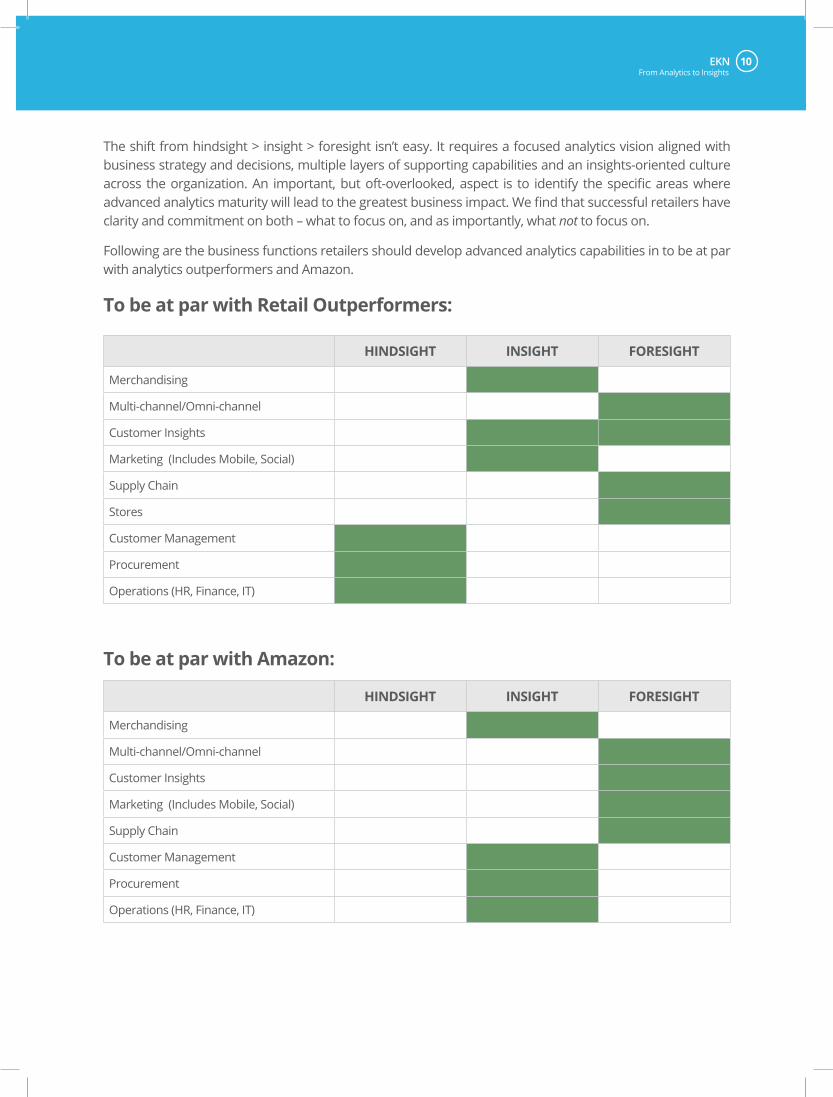
The shift from hindsight > insight > foresight isn’t easy. It requires a focused analytics vision aligned with business strategy and decisions, multiple layers of supporting capabilities and an insights-oriented culture across the organization. An important, but oft-overlooked, aspect is to identify the specific areas where advanced analytics maturity will lead to the greatest business impact. We find that successful retailers have clarity and commitment on both – what to focus on, and as importantly, what not to focus on.
Following are the business functions retailers should develop advanced analytics capabilities in to be at par with analytics outperformers and Amazon.
To be at par with Retail Outperformers:
HINDSIGHT INSIGHT FORESIGHT
Merchandising
Multi-channel/Omni-channel
Customer Insights
Marketing (Includes Mobile, Social)
Supply Chain
Stores
Customer Management
Procurement
Operations (HR, Finance, IT)
HINDSIGHT INSIGHT FORESIGHT
Merchandising
Multi-channel/Omni-channel
Customer Insights
Marketing (Includes Mobile, Social)
Supply Chain
Customer Management
Procurement
Operations (HR, Finance, IT)
To be at par with Amazon:
EKN 10 State of the Industry Research Series: 3rd Annual Analytics in Retail Study11
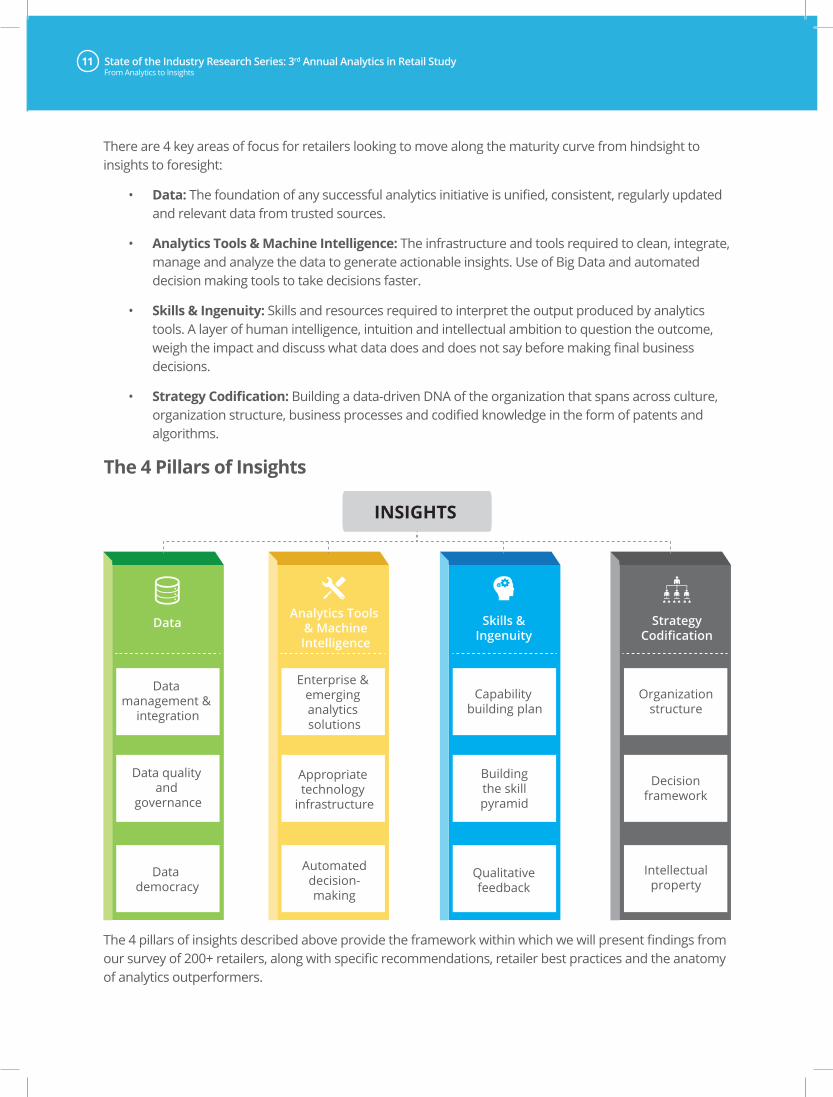
There are 4 key areas of focus for retailers looking to move along the maturity curve from hindsight to insights to foresight:
• Data: The foundation of any successful analytics initiative is unified, consistent, regularly updated and relevant data from trusted sources.
• Analytics Tools & Machine Intelligence: The infrastructure and tools required to clean, integrate, manage and analyze the data to generate actionable insights. Use of Big Data and automated decision making tools to take decisions faster.
• Skills & Ingenuity: Skills and resources required to interpret the output produced by analytics tools. A layer of human intelligence, intuition and intellectual ambition to question the outcome, weigh the impact and discuss what data does and does not say before making final business decisions.
• Strategy Codification: Building a data-driven DNA of the organization that spans across culture, organization structure, business processes and codified knowledge in the form of patents and algorithms.
The 4 pillars of insights described above provide the framework within which we will present findings from our survey of 200+ retailers, along with specific recommendations, retailer best practices and the anatomy of analytics outperformers.
From Analytics to Insights
Data management &
integration
Data quality and
governance
Data democracy
Enterprise & emerging analytics solutions
Capability building plan
Buildingthe skillpyramid
Qualitativefeedback
Appropriate technology
infrastructure
Automateddecision-making
Organizationstructure
Decisionframework
Intellectualproperty
DataAnalytics Tools
& MachineIntelligence
Skills &Ingenuity
StrategyCodification
INSIGHTS
The 4 Pillars of Insights
EKN 12 State of the Industry Research Series: 3rd Annual Analytics in Retail Study13
Data: Sailing Through the Data Tsunami
EKN 12 State of the Industry Research Series: 3rd Annual Analytics in Retail Study13
With consumers ever more reliant on technology – personal computers, tablets, mobile and smart phones, the Internet and social media – they are leaving behind digital breadcrumbs and displaying their “digital body language”. Combined with how consumers interact with retailers across all channels, loyalty programs, promotions and customer service, this mass of consumer data offers retailers their best chance yet to really know their customer.
By integrating customer data from loyalty programs, point of sale, online transaction platform, mobile apps, social media, in-store videos, public sources such as the US Census, and from syndicated sources such as Nielsen and IRI, with data from enterprise systems such as CRM, retailers have an opportunity like never before to develop an intimate understanding of individual customers. Further, insights from the analysis of such data is what can drive consumer-centric decisions across retail business functions such as marketing, merchandising, stores, eCommerce and supply chain.
The volume, variety and velocity of this data are increasing exponentially – the world’s data volume is forecasted to double every 18 months. The limitless possibilities such data offers in terms of how it can be used to drive smarter business is both a boon and a bane.
Retailers are relatively more experienced at handling large volumes of data than at integrating a wide variety of data sources and data types, and even less adept at consistently being able to translate data into contextual insights to improve decision making across the enterprise. EKN’s research bears this out.
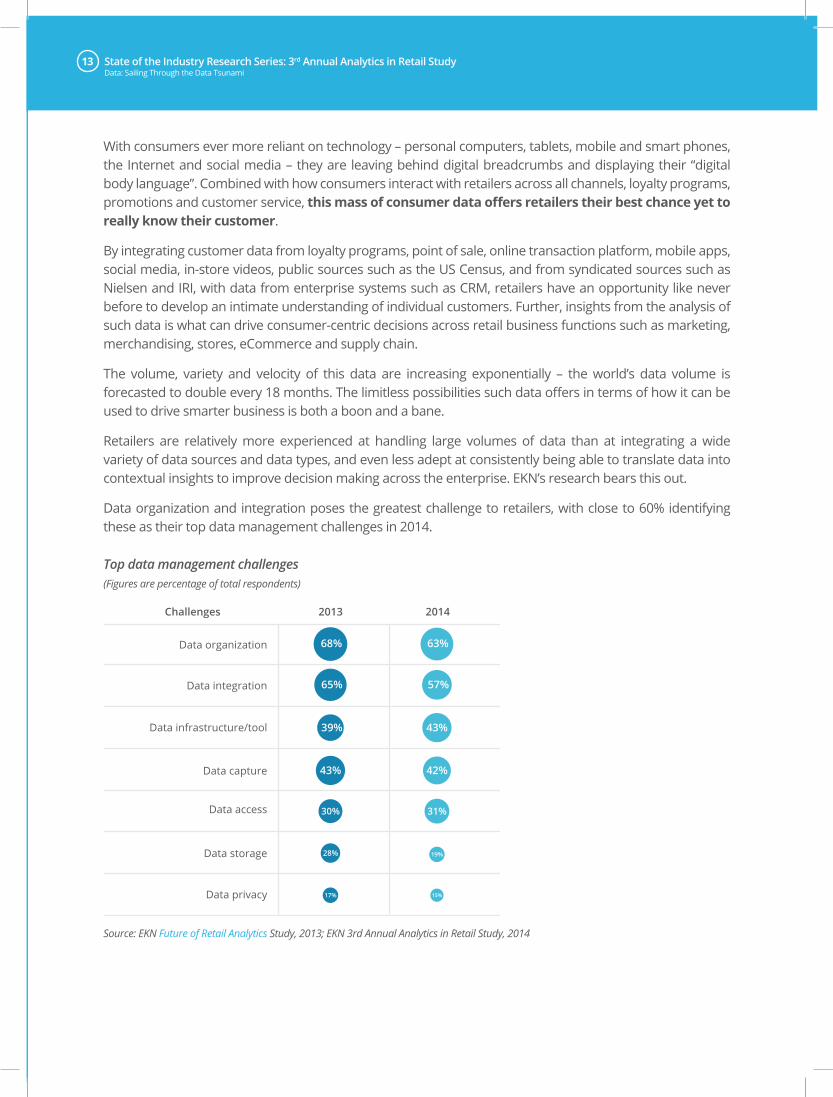
Data organization and integration poses the greatest challenge to retailers, with close to 60% identifying these as their top data management challenges in 2014.
Top data management challenges (Figures are percentage of total respondents)
Data: Sailing Through the Data Tsunami
Source: EKN Future of Retail Analytics Study, 2013; EKN 3rd Annual Analytics in Retail Study, 2014
Challenges
Data organization
Data integration
Data infrastructure/tool
Data capture
Data access
Data storage
Data privacy
2013 2014
68%
65%
39%
43%
30%
28%
17%
63%
57%
43%
42%
31%
19%
15%
EKN 14 State of the Industry Research Series: 3rd Annual Analytics in Retail Study15
Retailers recognize that a unified, consistent, exhaustive and frequently updated data-mart can lay the foundation of a successful analytics initiative, which in turn requires a stronger data management and integration process. Without an integrated and consistent data pool, the organization will have multiple versions of “the truth”, including redundant and inconsistent data.
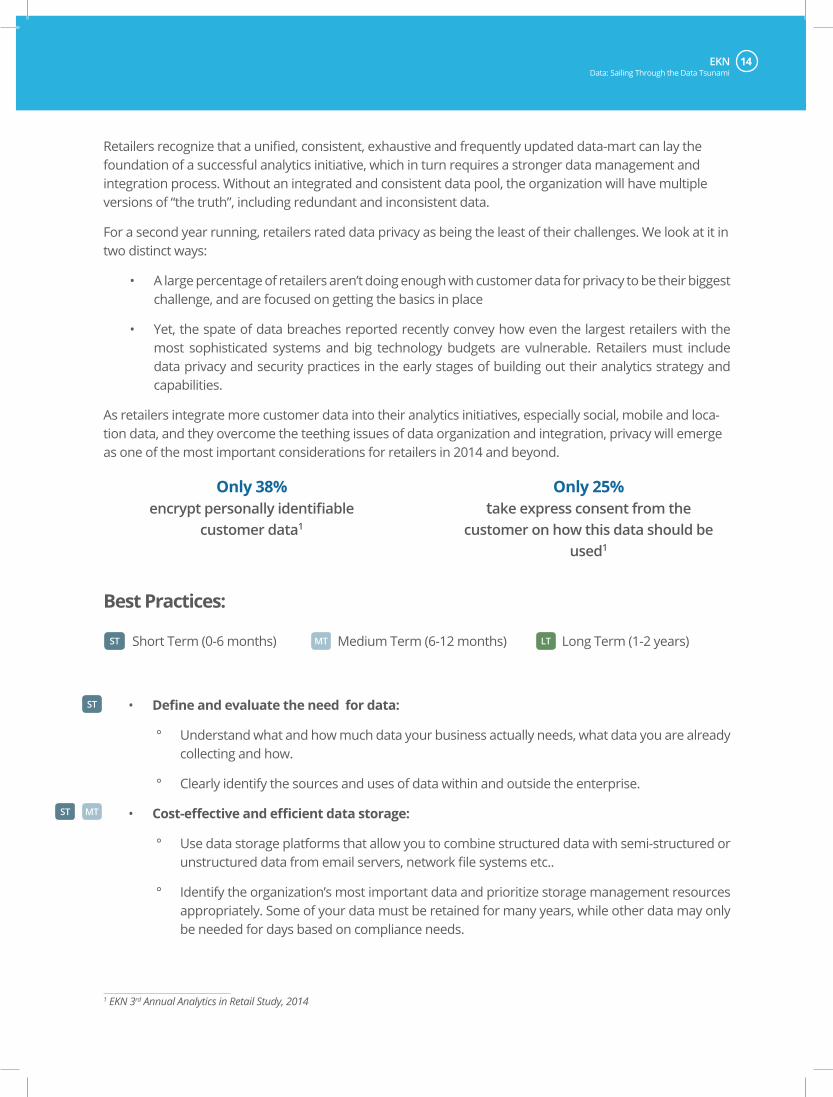
For a second year running, retailers rated data privacy as being the least of their challenges. We look at it in two distinct ways:
• A large percentage of retailers aren’t doing enough with customer data for privacy to be their biggest challenge, and are focused on getting the basics in place
• Yet, the spate of data breaches reported recently convey how even the largest retailers with the most sophisticated systems and big technology budgets are vulnerable. Retailers must include data privacy and security practices in the early stages of building out their analytics strategy and capabilities.
As retailers integrate more customer data into their analytics initiatives, especially social, mobile and loca-tion data, and they overcome the teething issues of data organization and integration, privacy will emerge as one of the most important considerations for retailers in 2014 and beyond.
Data: Sailing Through the Data Tsunami
Only 38% encrypt personally identifiable
customer data1
Only 25% take express consent from the
customer on how this data should be used1
1 EKN 3rd Annual Analytics in Retail Study, 2014
Best Practices:
• Define and evaluate the need for data:
° Understand what and how much data your business actually needs, what data you are already collecting and how.
° Clearly identify the sources and uses of data within and outside the enterprise.
• Cost-effective and efficient data storage:
° Use data storage platforms that allow you to combine structured data with semi-structured or unstructured data from email servers, network file systems etc..
° Identify the organization’s most important data and prioritize storage management resources appropriately. Some of your data must be retained for many years, while other data may only be needed for days based on compliance needs.
Short Term (0-6 months) Medium Term (6-12 months) Long Term (1-2 years)LTST MT
ST
ST MT
EKN 14 State of the Industry Research Series: 3rd Annual Analytics in Retail Study15
° Use tokenization and other best practices in storing and accessing data.
° Companies with huge data volume and variety should seriously evaluate a tiered storage ap-proach. Tiered storage solutions enable organizations to assign data to categories based on performance needs, frequency of use, amount of protection required, workflow and other or-ganizational criteria. For example, data without current business value can be moved to an archive storage tier that isn’t backed up at all, greatly reducing backup capacity and manage-ment issues.
• Establish the standards for data consistency, quality and privacy:
° Don’t over-cleanse your data. Focus on removing inconsistencies and duplication while making sure no valuable data is deleted.
° Ensure all points of data exchange are well documented and secured.
° Develop a transparent process identifying sensitive customer information flowing through your systems, use cases that it is used in, alternatives in case of legislation or other changes restricting or prohibiting it.
° End-to-end encryption of data.
° Publish standards for capture, storage and use of data.
• Strengthen enterprise data management toolset:
° Make sure data storage/management technologies that you use allow quick and easy access to data anytime and provide accurate results instantly.
° Integrate data across service lines and business units to create an integrated customer view and make sure that view or profile is available to multiple systems for execution. Having a single version of truth requires a common customer/master data model (MDM). MDM helps organizations build a higher performing, more agile, lower-cost and unified data warehouse architecture. However, before deciding to either build or buy a MDM product, retailers should ensure:
• They have an Enterprise Data Integration (EDI) platform to enable two-way integration between operational and analytical solutions using the appropriate technique, such as Service Oriented Architecture (SOA), Enterprise Application Integration (EAI) or Extract, Transport, Load (ETL), that is needed to integrate the various enterprise applications and the Enterprise Data Warehouse (EDW).
• They have well established Enterprise Data Management (EDM) practices.
° Once you have the MDM platform in place, begin with mastering only one data domain at a time. It is better to taste success in one domain over a short period of time and then be able to replicate it in other master data domains than to overload a project and compromise re-sults. EKN recommends retailers focus their efforts most aggressively on the core sources of customer data (transaction data – POS, Omni-channel; loyalty and CRM data; syndicated con-sumer behavior data – Nielsen, IRI). With a solid foundation they can then focus on expanding the data sources (social media, mobile, enterprise systems, machine logs) and their ability to process types of data, based on the specific needs of the decisions they most want to focus on.
Data: Sailing Through the Data Tsunami
ST
MT
EKN 16 State of the Industry Research Series: 3rd Annual Analytics in Retail Study17Data: Sailing Through the Data Tsunami
° While storing, sorting and managing the data, think about future needs. Your business may not need certain data immediately, but as business needs change some data may become relevant.
° Have a disaster recovery plan and constantly test it.
• Data access and democratization:
° There needs to be a move away from the siloed, feudalistic model of access to data, to a more democratic access method. Access to most data (non-confidential) along with basic data analyt-ics tools should be freely available to a larger cross-section of the enterprise across both func-tions and designations. For retailers who already have a progressive data access strategy, the next step should allow data and insights contribution. Collaboration best practices have shown enterprise data is only made richer by allowing employees to contribute, and customer insight should be no different. A further higher level of maturity would involve setting up data-sharing and analytics sandboxes with key business partners, vendors and even customers.
MT
EKN 16 State of the Industry Research Series: 3rd Annual Analytics in Retail Study17
Analytics Tools & Machine Intelligence: Future of the Analytics Toolset
EKN 18 State of the Industry Research Series: 3rd Annual Analytics in Retail Study19Analytics Tools & Machine Intelligence: Future of the Analytics Toolset
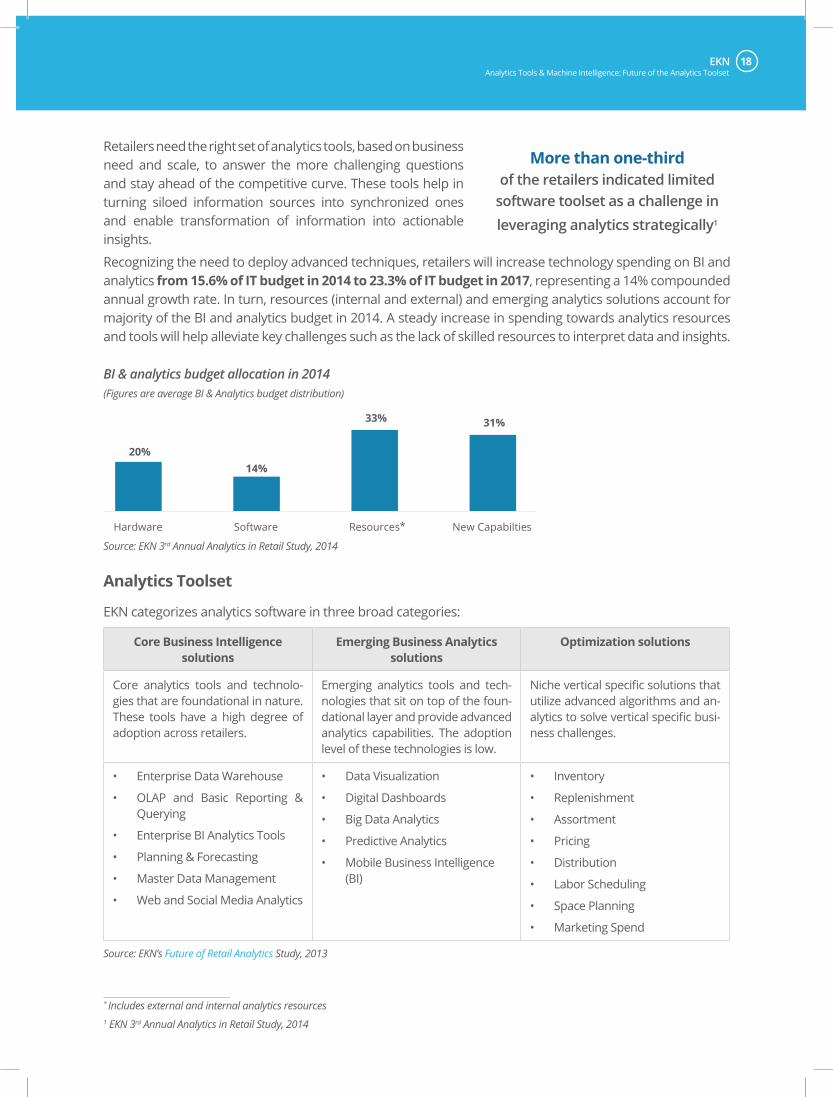
Recognizing the need to deploy advanced techniques, retailers will increase technology spending on BI and analytics from 15.6% of IT budget in 2014 to 23.3% of IT budget in 2017, representing a 14% compounded annual growth rate. In turn, resources (internal and external) and emerging analytics solutions account for majority of the BI and analytics budget in 2014. A steady increase in spending towards analytics resources and tools will help alleviate key challenges such as the lack of skilled resources to interpret data and insights.
BI & analytics budget allocation in 2014 (Figures are average BI & Analytics budget distribution)
Retailers need the right set of analytics tools, based on business need and scale, to answer the more challenging questions and stay ahead of the competitive curve. These tools help in turning siloed information sources into synchronized ones and enable transformation of information into actionable insights.
Source: EKN 3rd Annual Analytics in Retail Study, 2014
More than one-third
of the retailers indicated limited software toolset as a challenge in leveraging analytics strategically1
20%
Hardware
14%
Software
31%
New Capabilties
33%
Resources*
* Includes external and internal analytics resources 1 EKN 3rd Annual Analytics in Retail Study, 2014
Source: EKN’s Future of Retail Analytics Study, 2013
Analytics Toolset
EKN categorizes analytics software in three broad categories:
Core Business Intelligence solutions
Emerging Business Analytics solutions
Optimization solutions
Core analytics tools and technolo-gies that are foundational in nature. These tools have a high degree of adoption across retailers.
Emerging analytics tools and tech-nologies that sit on top of the foun-dational layer and provide advanced analytics capabilities. The adoption level of these technologies is low.
Niche vertical specific solutions that utilize advanced algorithms and an-alytics to solve vertical specific busi-ness challenges.
• Enterprise Data Warehouse
• OLAP and Basic Reporting & Querying
• Enterprise BI Analytics Tools
• Planning & Forecasting
• Master Data Management
• Web and Social Media Analytics
• Data Visualization
• Digital Dashboards
• Big Data Analytics
• Predictive Analytics
• Mobile Business Intelligence (BI)
• Inventory
• Replenishment
• Assortment
• Pricing
• Distribution
• Labor Scheduling
• Space Planning
• Marketing Spend
EKN 18 State of the Industry Research Series: 3rd Annual Analytics in Retail Study19
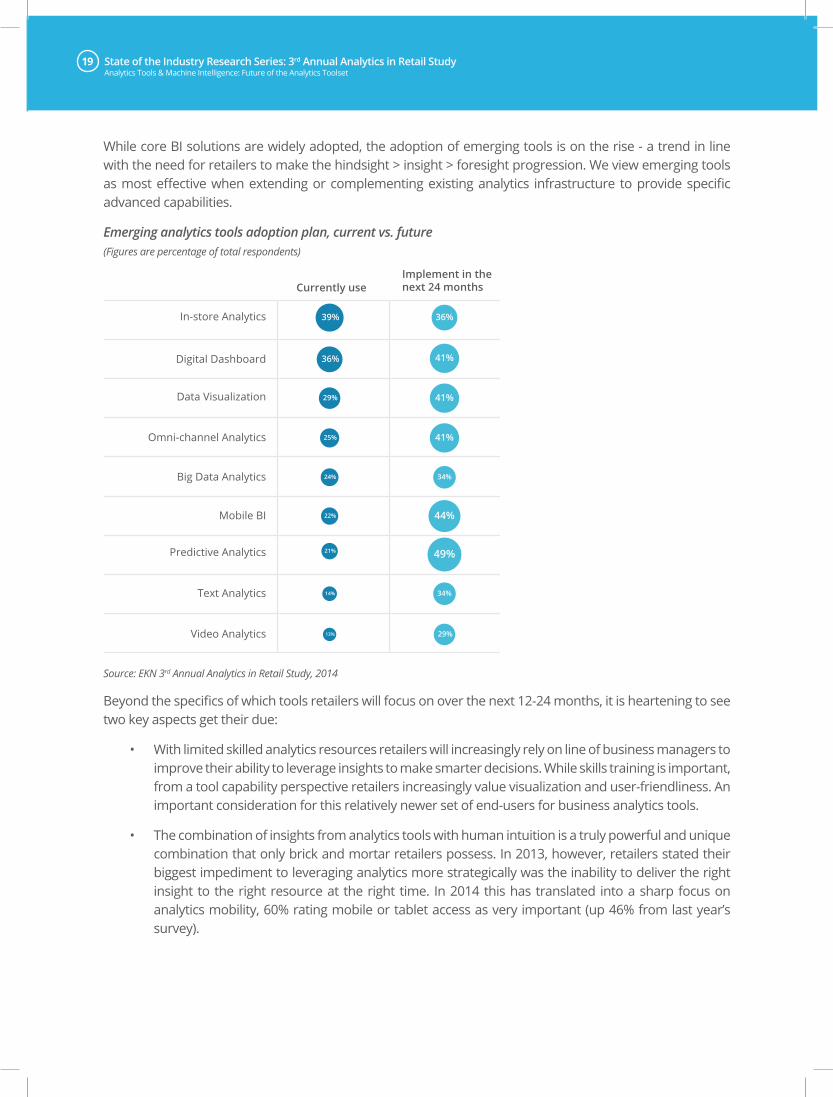
While core BI solutions are widely adopted, the adoption of emerging tools is on the rise - a trend in line with the need for retailers to make the hindsight > insight > foresight progression. We view emerging tools as most effective when extending or complementing existing analytics infrastructure to provide specific advanced capabilities.
Emerging analytics tools adoption plan, current vs. future (Figures are percentage of total respondents)
Source: EKN 3rd Annual Analytics in Retail Study, 2014
Analytics Tools & Machine Intelligence: Future of the Analytics Toolset
In-store Analytics
Digital Dashboard
Data Visualization
Omni-channel Analytics
Big Data Analytics
Mobile BI
Predictive Analytics
Currently useImplement in the next 24 months
Text Analytics
Video Analytics
39%
41%
41%
41%
44%
49%
34%
34%
36%
36%
29%
29%
25%
24%
22%
21%
14%
13%
Beyond the specifics of which tools retailers will focus on over the next 12-24 months, it is heartening to see two key aspects get their due:
• With limited skilled analytics resources retailers will increasingly rely on line of business managers to improve their ability to leverage insights to make smarter decisions. While skills training is important, from a tool capability perspective retailers increasingly value visualization and user-friendliness. An important consideration for this relatively newer set of end-users for business analytics tools.
• The combination of insights from analytics tools with human intuition is a truly powerful and unique combination that only brick and mortar retailers possess. In 2013, however, retailers stated their biggest impediment to leveraging analytics more strategically was the inability to deliver the right insight to the right resource at the right time. In 2014 this has translated into a sharp focus on analytics mobility, 60% rating mobile or tablet access as very important (up 46% from last year’s survey).
EKN 20 State of the Industry Research Series: 3rd Annual Analytics in Retail Study21
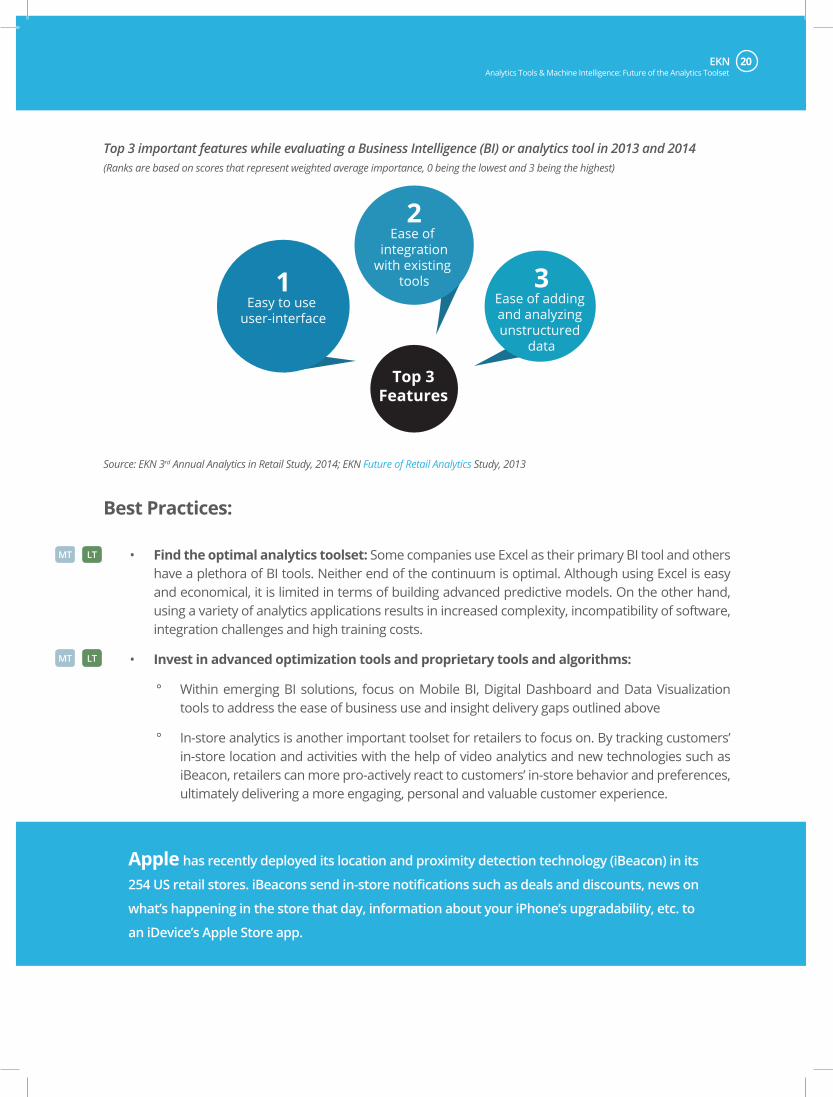
Source: EKN 3rd Annual Analytics in Retail Study, 2014; EKN Future of Retail Analytics Study, 2013
Top 3Features
1Easy to use
user-interface
2Ease of
integrationwith existing
tools 3Ease of adding and analyzing unstructured
data
Best Practices:
• Find the optimal analytics toolset: Some companies use Excel as their primary BI tool and others have a plethora of BI tools. Neither end of the continuum is optimal. Although using Excel is easy and economical, it is limited in terms of building advanced predictive models. On the other hand, using a variety of analytics applications results in increased complexity, incompatibility of software, integration challenges and high training costs.
• Invest in advanced optimization tools and proprietary tools and algorithms:
° Within emerging BI solutions, focus on Mobile BI, Digital Dashboard and Data Visualization tools to address the ease of business use and insight delivery gaps outlined above
° In-store analytics is another important toolset for retailers to focus on. By tracking customers’ in-store location and activities with the help of video analytics and new technologies such as iBeacon, retailers can more pro-actively react to customers’ in-store behavior and preferences, ultimately delivering a more engaging, personal and valuable customer experience.
Analytics Tools & Machine Intelligence: Future of the Analytics Toolset
MT
MT
LT
LT
Apple has recently deployed its location and proximity detection technology (iBeacon) in its
254 US retail stores. iBeacons send in-store notifications such as deals and discounts, news on
what’s happening in the store that day, information about your iPhone’s upgradability, etc. to
an iDevice’s Apple Store app.
Top 3 important features while evaluating a Business Intelligence (BI) or analytics tool in 2013 and 2014 (Ranks are based on scores that represent weighted average importance, 0 being the lowest and 3 being the highest)
EKN 20 State of the Industry Research Series: 3rd Annual Analytics in Retail Study21Analytics Tools & Machine Intelligence: Future of the Analytics Toolset
• Evaluate SaaS-based tools:
° The analytics toolset enabled by the Cloud and delivered as Software-as-a-Service will evolve at a brisk pace and will be faster and cheaper than the current BI infrastructure retailers have in place. We recommend that retailers actively evaluate cloud-based BI and visualization tools in the short-term.
• Focus on usability and interactivity while evaluating BI tools:
° A tool that is difficult to operate, understand and interact with will face adoption challenges regardless of its features. A “form leads function” approach is where EKN finds some of the newer tools and solution providers to have an advantage over enterprise-grade solutions. En-terprise tools will need to invest in providing a similarly user-friendly experience to maintain their leadership position and appeal as much to business users as they do to technology or analytics professionals.
ST
MT
° However, sooner or later, retailers will need to explore automated decision making for routine decisions espe-cially for high priority areas such as customer profiling, pricing and promotions. Technologies such as in-mem-ory computing, new information management architec-tures such as MapReduce, Massively Parallel Processing (MPP), Big Data Visualization and NoSQL databases will become an integral part of an optimal analytics toolset.
Close to 4 in 10
retailers will deploy programming models for parallel-processing and in-memory platforms by
20151
• Begin or expand Big Data exploration: As retailers’ up the ante in terms of analytics maturity they will need to analyze larger data sets at greater speed and lower cost. However, the current adoption of Big Data across business functions as well as the deployment of Big Data technologies remains low. Less than 1 in 10 retailers have executed a POC or a Big Data project.
° Less than 1 in 5 retailers plan to invest in any Big Data technology in 2014. Their plans are more aggressive in the next 12-month timeframe, which begs the question as to whether retailers are certain of those investments or they are deferring intent to adopt to a time in the future.
ST MT
1 EKN Big Data in Retail Study, 2013
EKN 22 State of the Industry Research Series: 3rd Annual Analytics in Retail Study23
Skills & Ingenuity: Bridging the Skills and Capabilities Chasm
EKN 22 State of the Industry Research Series: 3rd Annual Analytics in Retail Study23
The biggest analytics challenge for 1 in 2 retailers is the lack of resources who can interpret the output of analytics tools. Not surprising, as business analytics has not been instituted or rewarded as a core skill for the business users that retailers now need most to leverage insights - for instance merchants, store associates and marketers.
Retailers’ analytics capabilities need to evolve, just as other business skills, for them to remain competitive and relevant. Amazon, for example, has cross-functional business teams for each division, and each team has an analytics specialist. Teams share their findings with other divisions and there is a core team that focuses purely on building the deep technical skills required to execute on Big Data technologies.
Best Practices:From our perspective, there are 4 distinct areas retailers must focus on to help build a more robust business analytics resource pool in the organization:
• Technology investment: Data visualization, easier to use and mobile-ready analytics tools, as described previously.
• Capability building & skills training:
° Review and redefine job profiles, required skills, attitudes and aptitude for key roles to include a focus on analytics.
° Develop training to assist business users to become more comfortable with analytics as a busi-ness concept and with the specific analytics use cases that are most relevant to their roles.
° Develop pathways for business users and skilled analytics resources to collaborate.
° Institute cross-competency training for executives to better understand analytical concepts and analytics resources to understand the most important insights their analysis enables.
° Invest in capability building across the board, from executive training to building a strong ana-lytics team.
° For large retailers, another alternative solution could be to sponsor special analytics programs in Universities, and benefit by hiring those trained resources internally.
Skills & Ingenuity: Bridging the Skills and Capabilities Chasm
Google and Amazon support analytics-related programs at the University of
Washington. They will be among the future employers of program graduates – making
their investment a win/win.
ST
ST MT
EKN 24 State of the Industry Research Series: 3rd Annual Analytics in Retail Study25
The model does not suggest that each retailer should have all such job roles. The structure and proportion will differ based on the retailer’s format, size and business needs. The first step should be to strengthen the base of the skill pyramid, and then, based on business needs and analytics focus, hire and train specialist resources.
Having internal experts is definitely an advantage. How-ever, not every retailer has the budget or organizational capability to build a well-balanced, optimally-organized, multi-disciplinary team of internal experts. An alternative solution could be to (completely or partially) outsource ana-lytics projects that require advanced skills and capabilities.
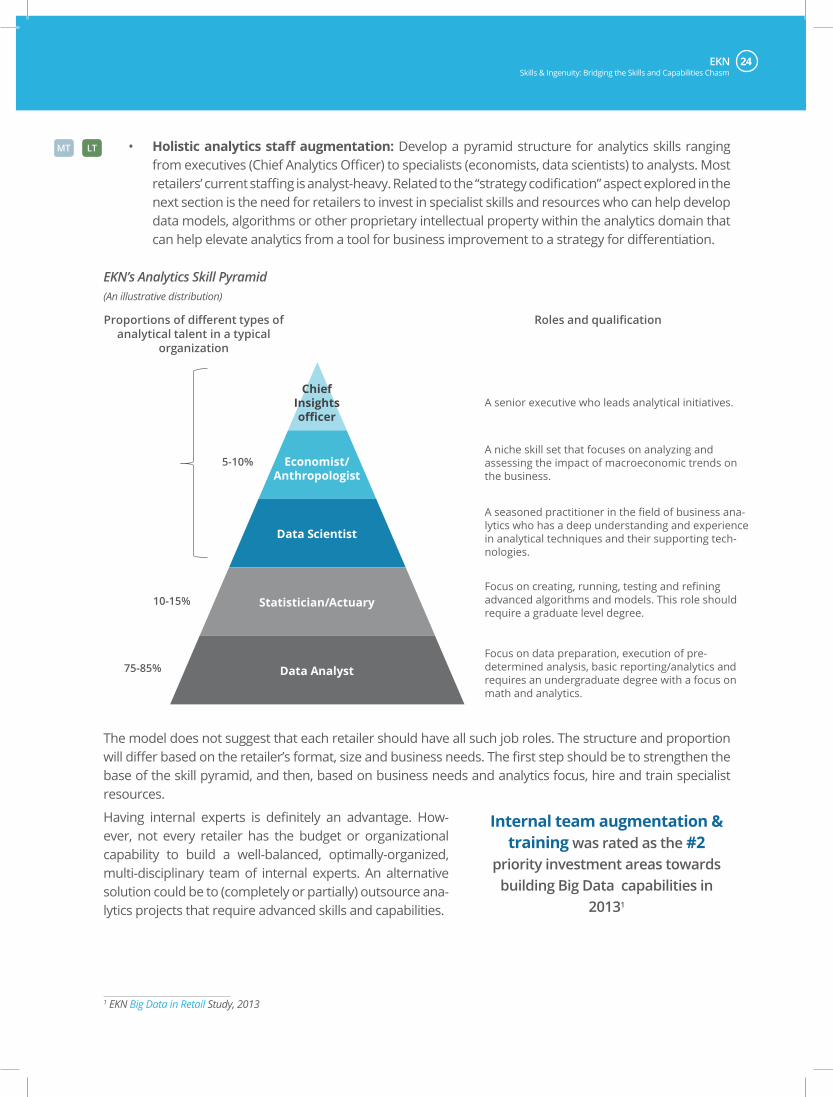
MT • Holistic analytics staff augmentation: Develop a pyramid structure for analytics skills ranging from executives (Chief Analytics Officer) to specialists (economists, data scientists) to analysts. Most retailers’ current staffing is analyst-heavy. Related to the “strategy codification” aspect explored in the next section is the need for retailers to invest in specialist skills and resources who can help develop data models, algorithms or other proprietary intellectual property within the analytics domain that can help elevate analytics from a tool for business improvement to a strategy for differentiation.
EKN’s Analytics Skill Pyramid (An illustrative distribution)
10-15%
5-10%
75-85%
Proportions of different types ofanalytical talent in a typical
organization
Roles and qualification
A senior executive who leads analytical initiatives.
Focus on data preparation, execution of pre-determined analysis, basic reporting/analytics andrequires an undergraduate degree with a focus onmath and analytics.
Focus on creating, running, testing and refining advanced algorithms and models. This role should require a graduate level degree.
A seasoned practitioner in the field of business ana-lytics who has a deep understanding and experience in analytical techniques and their supporting tech-nologies.
A niche skill set that focuses on analyzing and assessing the impact of macroeconomic trends on the business.
ChiefInsightsofficer
Economist/Anthropologist
Data Scientist
Statistician/Actuary
Data Analyst
Internal team augmentation & training was rated as the #2
priority investment areas towards building Big Data capabilities in
20131
Skills & Ingenuity: Bridging the Skills and Capabilities Chasm
LT
1 EKN Big Data in Retail Study, 2013
EKN 24 State of the Industry Research Series: 3rd Annual Analytics in Retail Study25
Strategy Codification:Making Analytics a Part of the Organization’s DNA
EKN 26 State of the Industry Research Series: 3rd Annual Analytics in Retail Study27
An analytics strategy built solely on data, tools and resources cannot lead to sustainable competi-tive differentiation, as all of these areas can be commoditized. “Strategy Codification” refers to a retailer infusing key aspects of its business model into its analytics strategy through one or more of the following:
• Re-orienting the organizational structure to support a sharp focus on the customer and infusing an insights-driven culture across the enterprise
• Creating a “decision framework”, taking into account the specifics of their business needs, industry position, retail format, competitive positioning and several other factors
• Building intellectual property assets – including algorithms, APIs, statistical models etc. – that translate a decision framework into a proprietary asset
The Organization StructureFor most retailers, their organization structure and culture are optimized to move product through chan-nels. A customer-centric transformation needs to be accompanied and enabled by a similar change in or-ganization structure and culture. In 2014 we see more retailers preparing for this change via efforts such as instituting Board Level Committees focused on innovation and customer engagement, adding executives to lead Omni-channel execution, setting up shared services analytics teams, establishing customer experience related roles and positions, and redefining metrics across channels to be focused on Customer Lifetime Value (CLV).
Strategy Codification: Making Analytics a Part of the Organization’s DNA
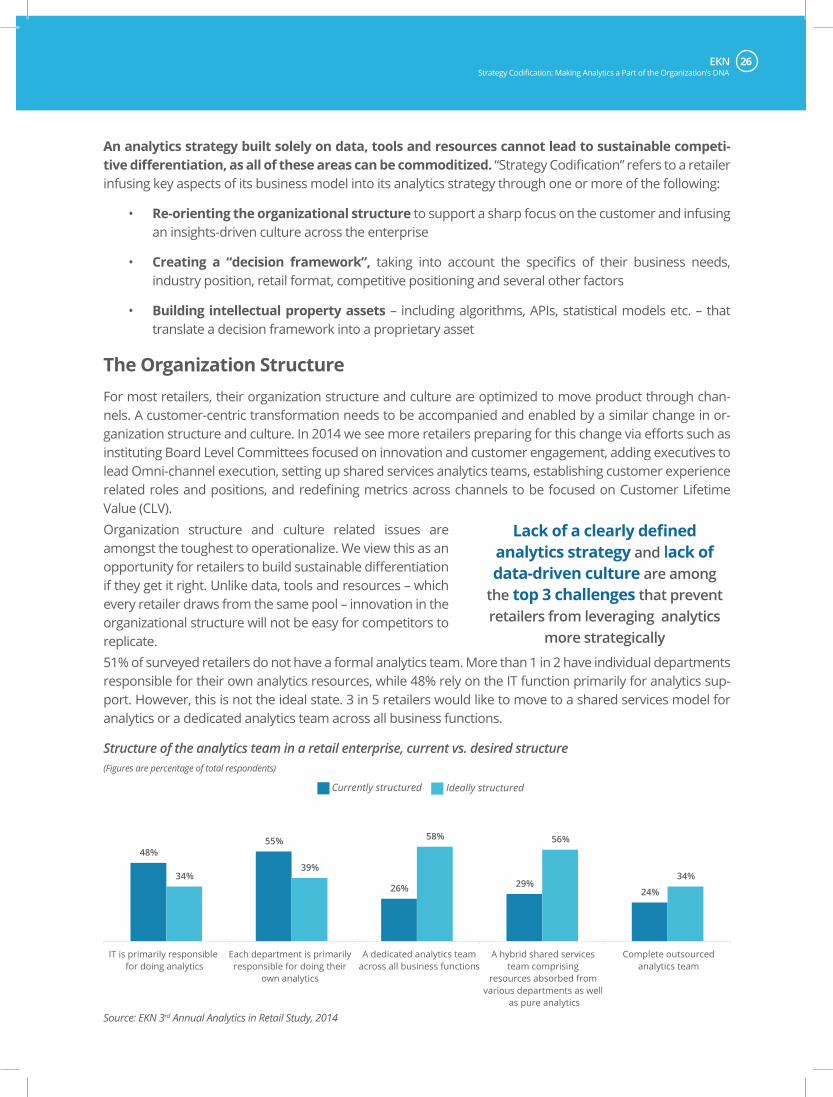
Organization structure and culture related issues are amongst the toughest to operationalize. We view this as an opportunity for retailers to build sustainable differentiation if they get it right. Unlike data, tools and resources – which every retailer draws from the same pool – innovation in the organizational structure will not be easy for competitors to replicate. 51% of surveyed retailers do not have a formal analytics team. More than 1 in 2 have individual departments responsible for their own analytics resources, while 48% rely on the IT function primarily for analytics sup-port. However, this is not the ideal state. 3 in 5 retailers would like to move to a shared services model for analytics or a dedicated analytics team across all business functions.
Structure of the analytics team in a retail enterprise, current vs. desired structure (Figures are percentage of total respondents)
Lack of a clearly defined analytics strategy and lack of data-driven culture are among
the top 3 challenges that prevent retailers from leveraging analytics
more strategically
48%55%
26% 29%24%
34%39%
58% 56%
34%
IT is primarily responsible for doing analytics
Each department is primarilyresponsible for doing their
own analytics
A dedicated analytics teamacross all business functions
A hybrid shared services team comprising
resources absorbed from various departments as well
as pure analytics
Complete outsourcedanalytics team
Currently structured Ideally structured
Source: EKN 3rd Annual Analytics in Retail Study, 2014
EKN 26 State of the Industry Research Series: 3rd Annual Analytics in Retail Study27
Decision FrameworkEach retailer must relate its analytics strategy to its business model, specifically identifying and focus-ing on what insights will offer them the ability to move the needle on business actions that deliver the great-est impact on revenue, profitability and customer engagement.
• What business decisions have the greatest impact on customer and financial business metrics?
• What insights can have the biggest impact on these business actions or decisions?
• What data, tools, resources and intellectual property do we need to build such insights?
• What organizational change, including culture and business processes, will help ensure such insights are operationalized?
• Can we measure the impact of our insights and decisions?
• How can we strengthen and protect our ability to build and act upon such insights better than our competitors?
• Who is responsible and accountable for the change management associated with all of the above?
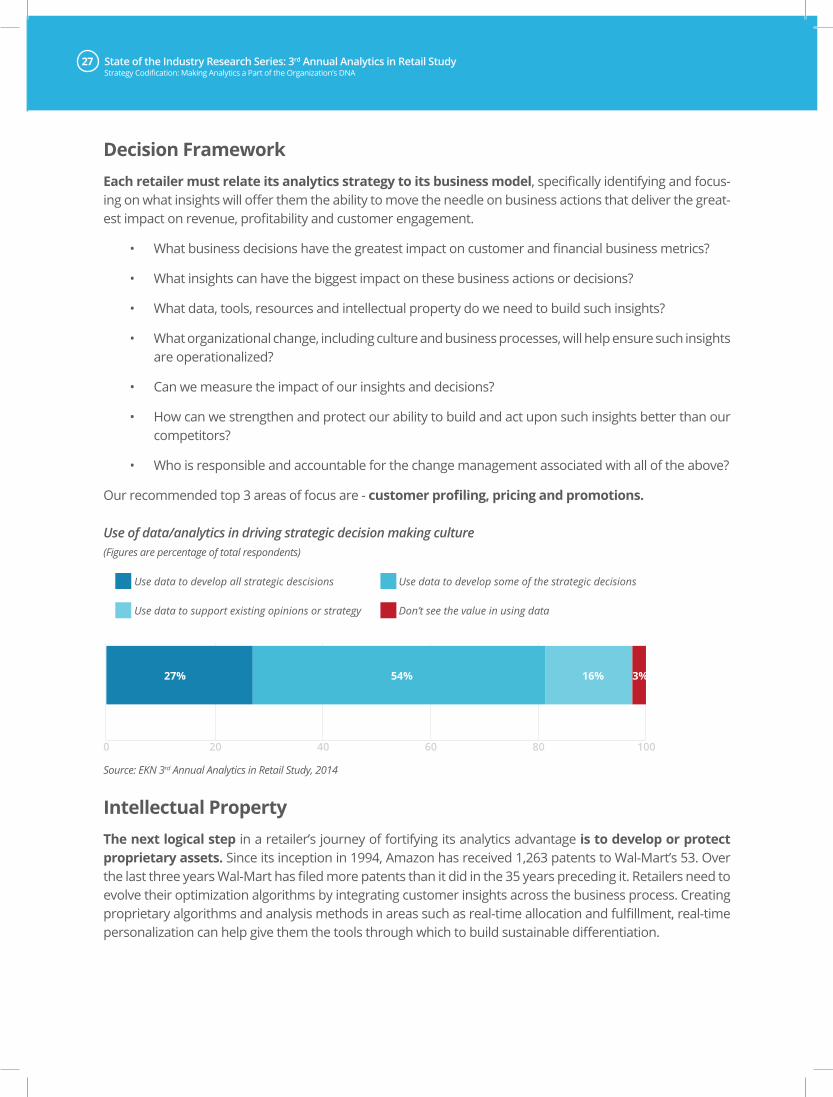
Our recommended top 3 areas of focus are - customer profiling, pricing and promotions.
Use of data/analytics in driving strategic decision making culture (Figures are percentage of total respondents)
Strategy Codification: Making Analytics a Part of the Organization’s DNA
0 20 40 60 80 100
Use data to develop all strategic descisions Use data to develop some of the strategic decisions
Use data to support existing opinions or strategy Don’t see the value in using data
27% 54% 16% 3%
Source: EKN 3rd Annual Analytics in Retail Study, 2014
Intellectual PropertyThe next logical step in a retailer’s journey of fortifying its analytics advantage is to develop or protect proprietary assets. Since its inception in 1994, Amazon has received 1,263 patents to Wal-Mart’s 53. Over the last three years Wal-Mart has filed more patents than it did in the 35 years preceding it. Retailers need to evolve their optimization algorithms by integrating customer insights across the business process. Creating proprietary algorithms and analysis methods in areas such as real-time allocation and fulfillment, real-time personalization can help give them the tools through which to build sustainable differentiation.
EKN 28 State of the Industry Research Series: 3rd Annual Analytics in Retail Study29
Amazon’s oft-cited recommendation engine is a great example of analytics intellectual property (item based collaborative filtering algorithm) that is tightly integrated with its customer experience philosophy (personalization and shopping assistance) and business model (the world’s biggest selection). We find that in analyzing Amazon’s success as relates to customer analytics, a lot of focus is given to the data, tools and resources that it has at its disposal. For us, the “strategy codification” component of Amazon’s approach is as, if not more, important than the specifics of the technologies it uses.
Best Practices:• Organization structure & incentives: Develop a formal analytics organization structure and
clearly define its interplay with the rest of the organization. Create analytics as an enterprise-wide capability and shared service.
• Develop data-driven decision making culture:
° Create a clearly articulated analytics strategy focused on most 1-2 high priority areas. We rec-ommend focusing on one or more of the following areas:
• Micro-segmentation/personalization
• Pricing
• Promotion
° Train and educate decision-makers on using data/insights to take decisions.
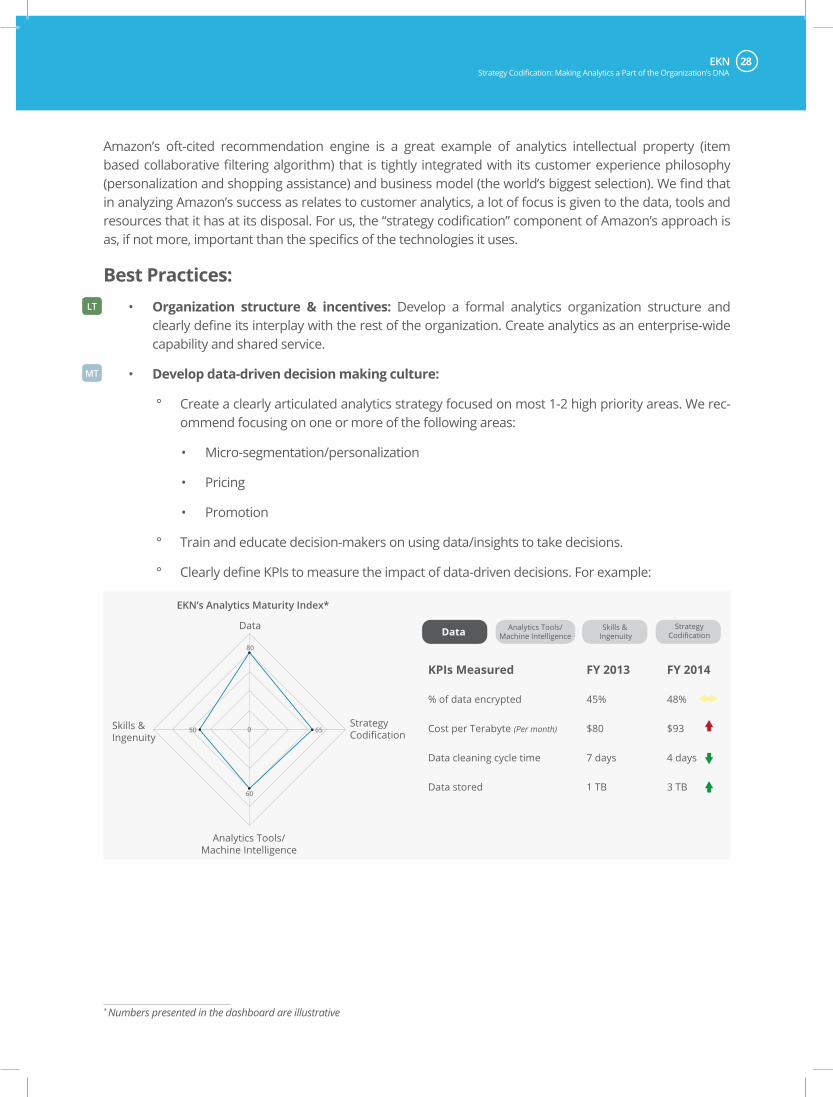
° Clearly define KPIs to measure the impact of data-driven decisions. For example:
Strategy Codification: Making Analytics a Part of the Organization’s DNA
Data Data
Skills & Ingenuity
Skills & Ingenuity
Analytics Tools/Machine Intelligence
Analytics Tools/Machine Intelligence
StrategyCodification
KPIs Measured FY 2013 FY 2014
% of data encrypted
Cost per Terabyte (Per month)
Data cleaning cycle time
Data stored
45%
$80
7 days
1 TB
48%
$93
4 days
3 TB
StrategyCodification
80
050 65
60
EKN’s Analytics Maturity Index*
MT
LT
* Numbers presented in the dashboard are illustrative
EKN 28 State of the Industry Research Series: 3rd Annual Analytics in Retail Study29
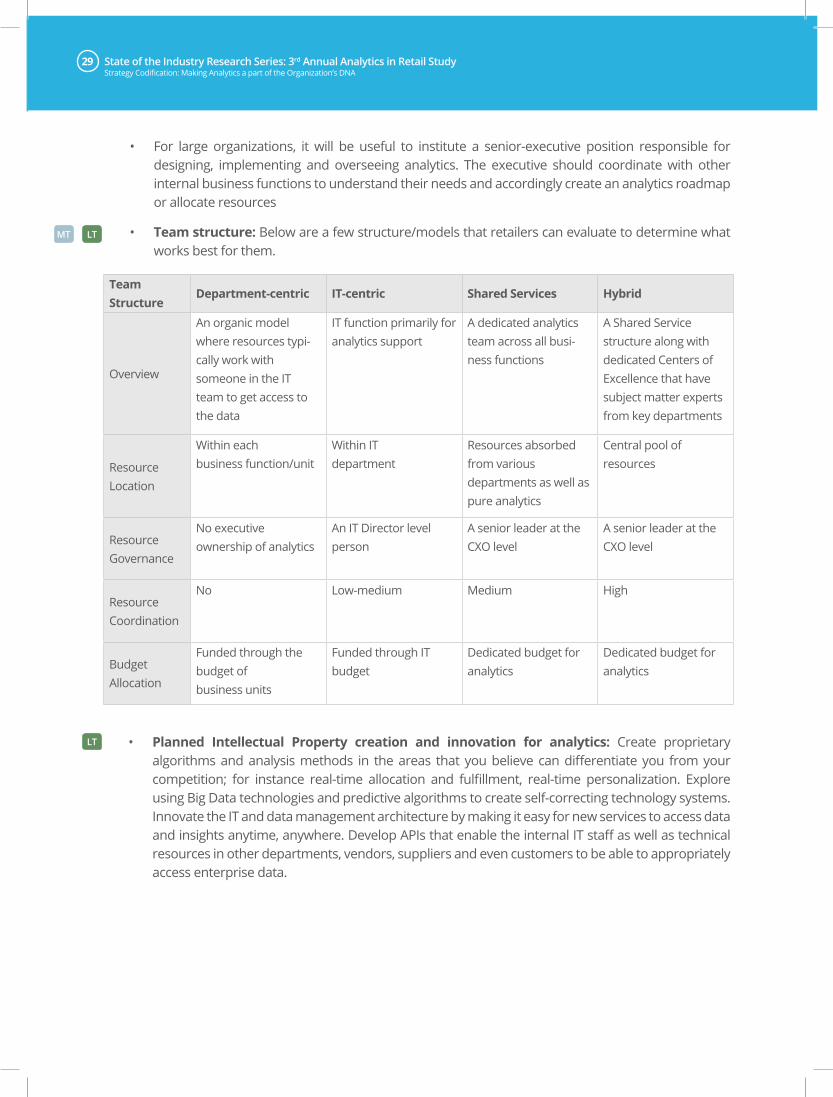
• For large organizations, it will be useful to institute a senior-executive position responsible for designing, implementing and overseeing analytics. The executive should coordinate with other internal business functions to understand their needs and accordingly create an analytics roadmap or allocate resources
• Team structure: Below are a few structure/models that retailers can evaluate to determine what works best for them.
MT LT
Team Structure
Department-centric IT-centric Shared Services Hybrid
Overview
An organic model where resources typi-cally work with someone in the IT team to get access to the data
IT function primarily for analytics support
A dedicated analytics team across all busi-ness functions
A Shared Service structure along with dedicated Centers of Excellence that have subject matter experts from key departments
Resource Location
Within each business function/unit
Within IT department
Resources absorbed from various departments as well as pure analytics
Central pool of resources
Resource Governance
No executive ownership of analytics
An IT Director level person
A senior leader at the CXO level
A senior leader at the CXO level
Resource Coordination
No Low-medium Medium High
Budget Allocation
Funded through the budget of business units
Funded through IT budget
Dedicated budget for analytics
Dedicated budget for analytics
Strategy Codification: Making Analytics a part of the Organization’s DNA
LT • Planned Intellectual Property creation and innovation for analytics: Create proprietary algorithms and analysis methods in the areas that you believe can differentiate you from your competition; for instance real-time allocation and fulfillment, real-time personalization. Explore using Big Data technologies and predictive algorithms to create self-correcting technology systems. Innovate the IT and data management architecture by making it easy for new services to access data and insights anytime, anywhere. Develop APIs that enable the internal IT staff as well as technical resources in other departments, vendors, suppliers and even customers to be able to appropriately access enterprise data.
EKN 30 State of the Industry Research Series: 3rd Annual Analytics in Retail Study31
Decoding the DNA of an Analytics Superstar
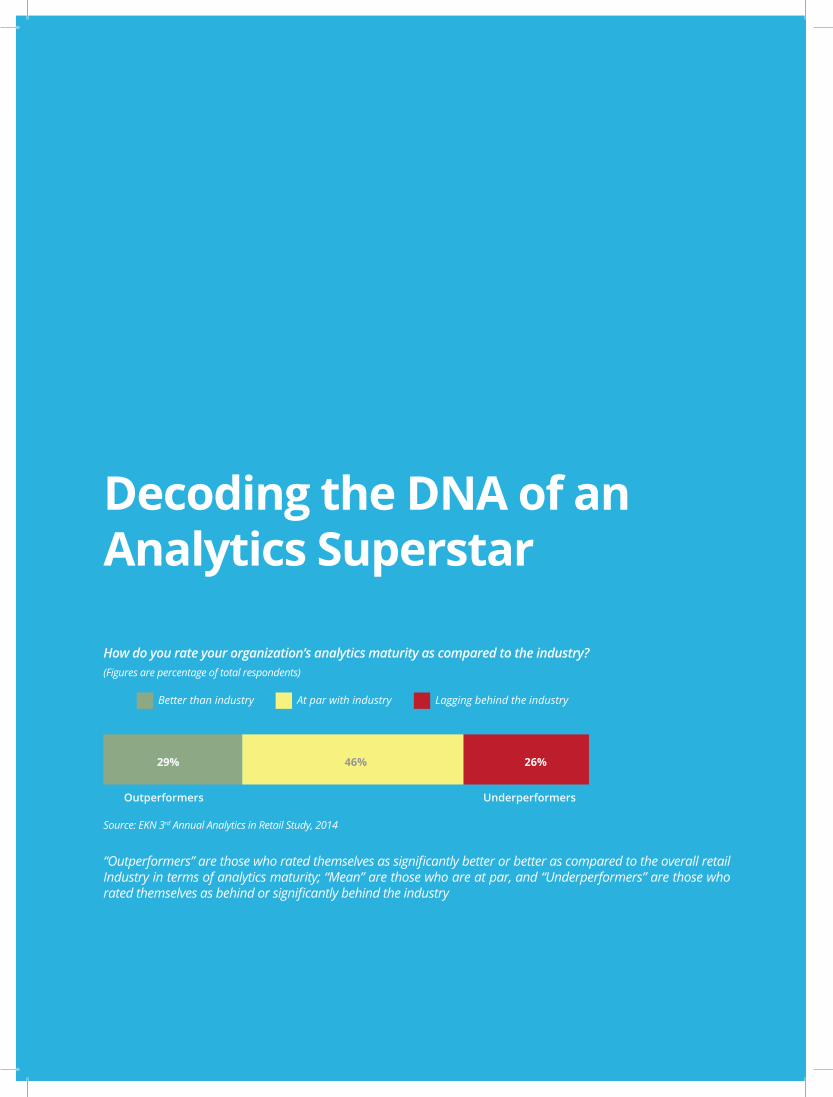
Better than industry At par with industry Lagging behind the industry
Outperformers Underperformers
17% 43%29% 46% 26%
How do you rate your organization’s analytics maturity as compared to the industry? (Figures are percentage of total respondents)
“Outperformers” are those who rated themselves as significantly better or better as compared to the overall retail Industry in terms of analytics maturity; “Mean” are those who are at par, and “Underperformers” are those who rated themselves as behind or significantly behind the industry
Source: EKN 3rd Annual Analytics in Retail Study, 2014
EKN 30 State of the Industry Research Series: 3rd Annual Analytics in Retail Study31
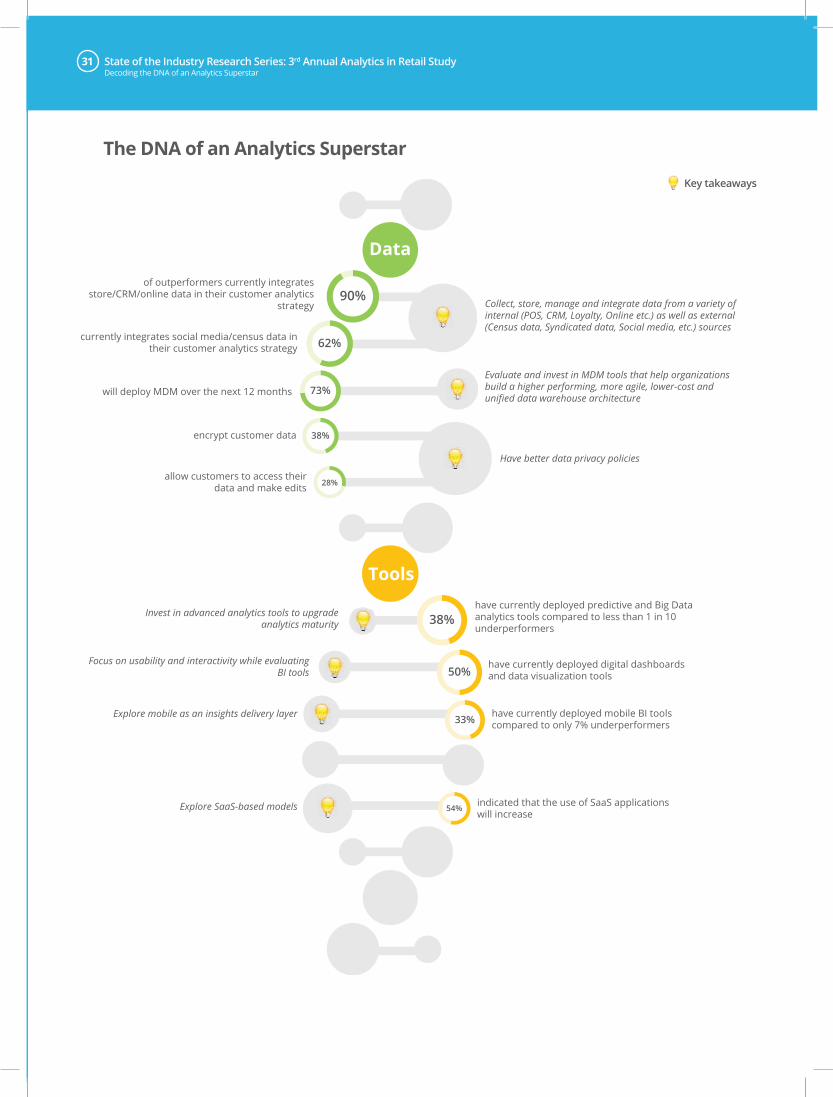
encrypt customer data
allow customers to access their data and make edits
of outperformers currently integrates store/CRM/online data in their customer analytics
strategy
have currently deployed digital dashboards and data visualization tools
currently integrates social media/census data in their customer analytics strategy
will deploy MDM over the next 12 months
have currently deployed mobile BI tools compared to only 7% underperformers
indicated that the use of SaaS applications will increase
have currently deployed predictive and Big Data analytics tools compared to less than 1 in 10 underperformers
73%
38%
38%
Collect, store, manage and integrate data from a variety of internal (POS, CRM, Loyalty, Online etc.) as well as external (Census data, Syndicated data, Social media, etc.) sources
Evaluate and invest in MDM tools that help organizations build a higher performing, more agile, lower-cost and unified data warehouse architecture
Have better data privacy policies
Invest in advanced analytics tools to upgrade analytics maturity
Focus on usability and interactivity while evaluating BI tools
Explore mobile as an insights delivery layer
Data
Tools
33%
28%
62%
90%
50%
Explore SaaS-based models 54%
The DNA of an Analytics Superstar
Decoding the DNA of an Analytics Superstar
Key takeaways

EKN 32 State of the Industry Research Series: 3rd Annual Analytics in Retail Study33Decoding the DNA of an Analytics Superstar
will hire data/math scientists and statisticians over the next 12 months compared to just 16%
underperformers
currently have a Chief Insights Officer compared to only 19% underperformers
have deployed programs to train the executive team and analysts about Big Data
currently have shared services team compared to just 15% underperformers
use data as a part of develop all or some strategic business decisions
46%
41%
Hire resources with new skills such as data/math scientists, statisticians to join the mix
Anoint a clear owner for analytics and customer insights at the senior executive level (VP or C-Suite)
Institute cross-competency training for executives to better understand analytical concepts and analytics resources to understand the most important insights that analysis enables
Develop culture to support fact-based decision making
Create a hybrid shared services team comprising resources absorbed from various departments as
well as pure analytics
Skills
Organ-ization
Develop proprietary tools and algorithms
44%
79%
30%
EKN Big Data in Retail Study, 2013EKN 3rd Annual Analytics in Retail Study, 2014EKN The New IT Cost Structure in Retail Study, 2013EKN Future of Retail Analytics Study, 2013
EKN 32 State of the Industry Research Series: 3rd Annual Analytics in Retail Study33
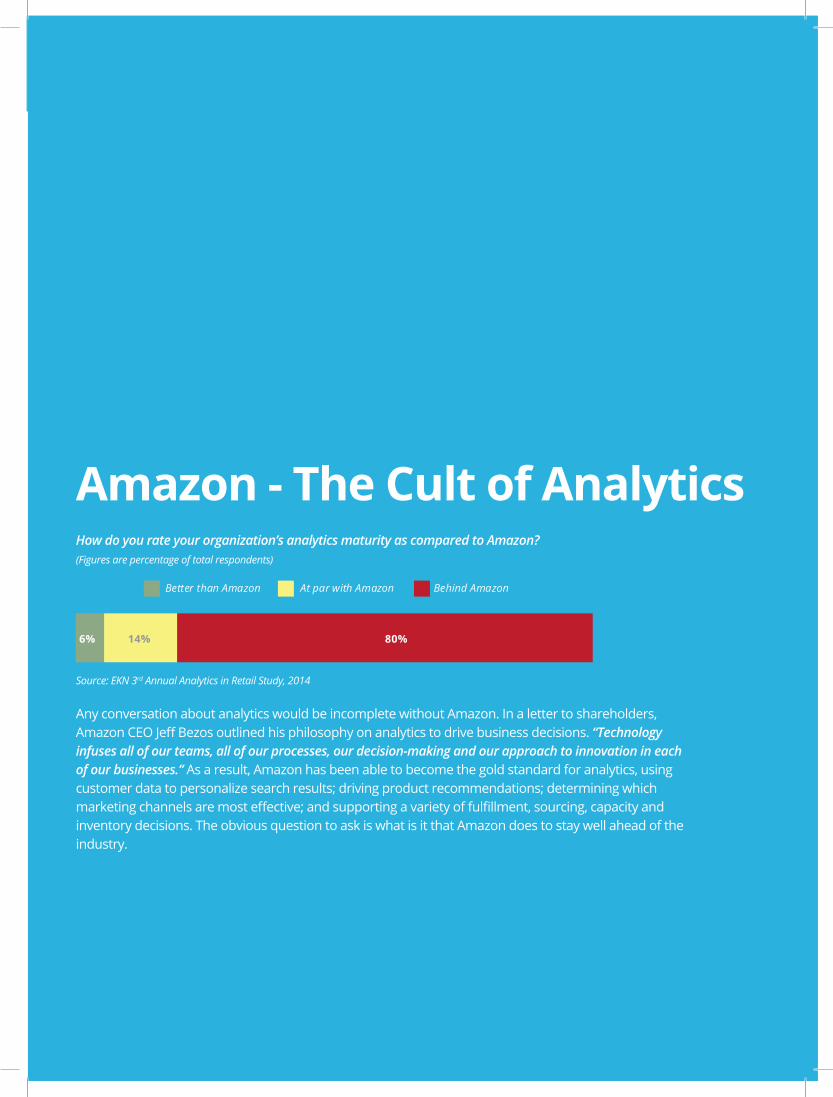
Amazon - The Cult of AnalyticsHow do you rate your organization’s analytics maturity as compared to Amazon? (Figures are percentage of total respondents)
Any conversation about analytics would be incomplete without Amazon. In a letter to shareholders, Amazon CEO Jeff Bezos outlined his philosophy on analytics to drive business decisions. “Technology infuses all of our teams, all of our processes, our decision-making and our approach to innovation in each of our businesses.” As a result, Amazon has been able to become the gold standard for analytics, using customer data to personalize search results; driving product recommendations; determining which marketing channels are most effective; and supporting a variety of fulfillment, sourcing, capacity and inventory decisions. The obvious question to ask is what is it that Amazon does to stay well ahead of the industry.
Source: EKN 3rd Annual Analytics in Retail Study, 2014
6% 14% 80%
Better than Amazon At par with Amazon Behind Amazon
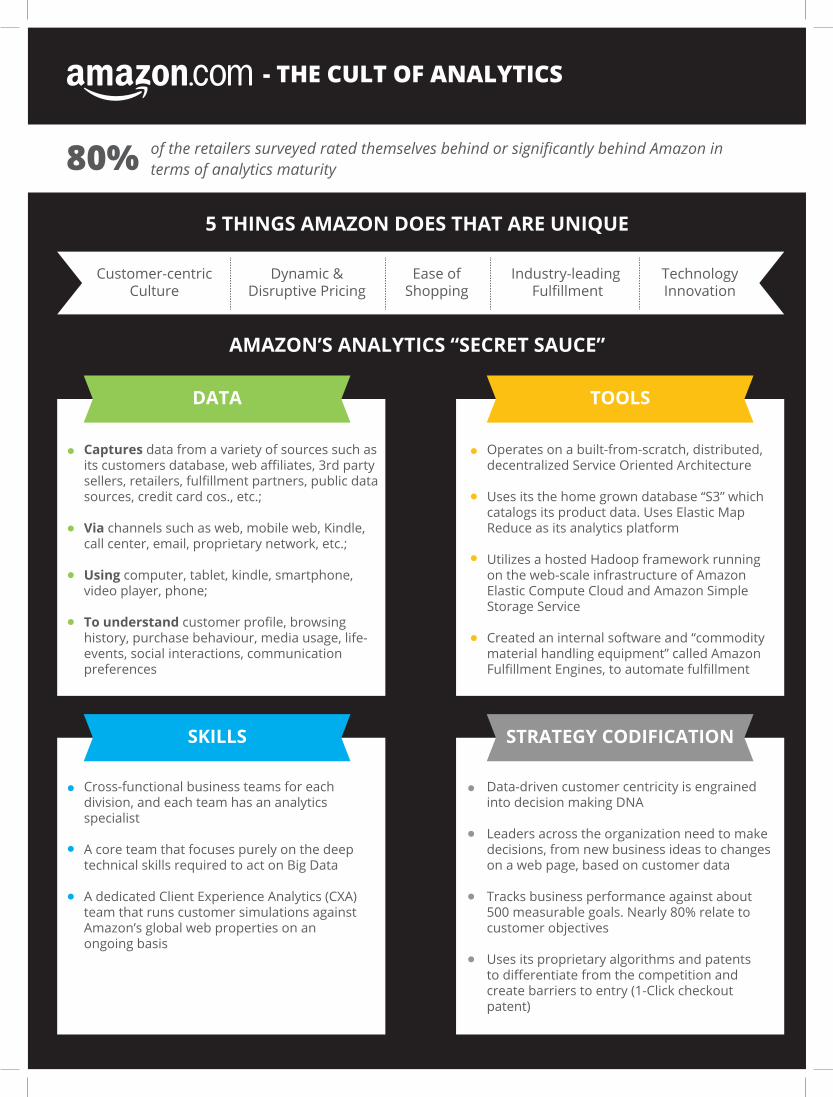
- THE CULT OF ANALYTICS
5 THINGS AMAZON DOES THAT ARE UNIQUE
AMAZON’S ANALYTICS “SECRET SAUCE”
of the retailers surveyed rated themselves behind or significantly behind Amazon in terms of analytics maturity 80%
Dynamic &Disruptive Pricing
Ease ofShopping
Industry-leading Fulfillment
TechnologyInnovation
Customer-centricCulture
STRATEGY CODIFICATION
Data-driven customer centricity is engrained into decision making DNA
Leaders across the organization need to make decisions, from new business ideas to changes on a web page, based on customer data
Tracks business performance against about 500 measurable goals. Nearly 80% relate to customer objectives
Uses its proprietary algorithms and patents to differentiate from the competition and create barriers to entry (1-Click checkout patent)
SKILLS
Cross-functional business teams for each division, and each team has an analytics specialist
A core team that focuses purely on the deep technical skills required to act on Big Data
A dedicated Client Experience Analytics (CXA) team that runs customer simulations against Amazon’s global web properties on an ongoing basis
DATA
Captures data from a variety of sources such asits customers database, web affiliates, 3rd partysellers, retailers, fulfillment partners, public datasources, credit card cos., etc.;
Via channels such as web, mobile web, Kindle,call center, email, proprietary network, etc.;
Using computer, tablet, kindle, smartphone,video player, phone;
To understand customer profile, browsinghistory, purchase behaviour, media usage, life-events, social interactions, communication preferences
TOOLS
Operates on a built-from-scratch, distributed, decentralized Service Oriented Architecture
Uses its the home grown database “S3” which catalogs its product data. Uses Elastic MapReduce as its analytics platform
Utilizes a hosted Hadoop framework running on the web-scale infrastructure of AmazonElastic Compute Cloud and Amazon Simple Storage Service
Created an internal software and “commodity material handling equipment” called AmazonFulfillment Engines, to automate fulfillment
Retail Honor Board
EKN 36 State of the Industry Research Series: 3rd Annual Analytics in Retail Study37
Retailers Action
Automercados Plaza
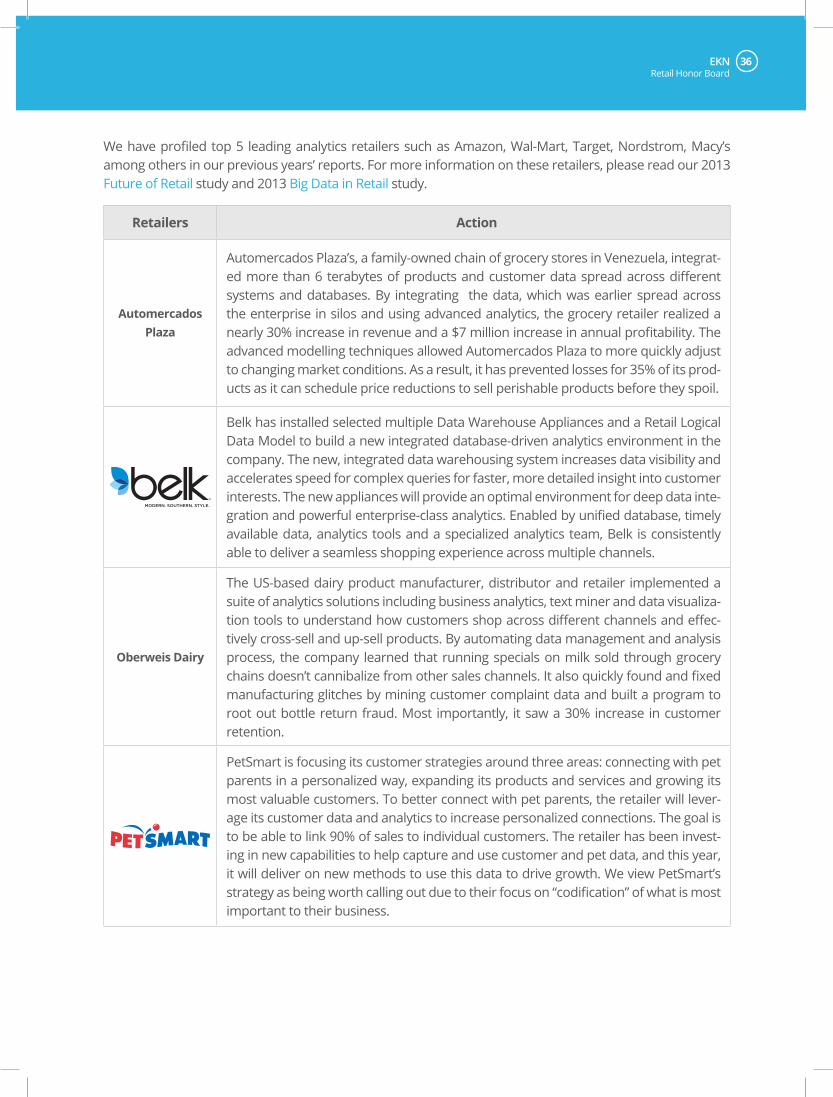
Automercados Plaza’s, a family-owned chain of grocery stores in Venezuela, integrat-ed more than 6 terabytes of products and customer data spread across different systems and databases. By integrating the data, which was earlier spread across the enterprise in silos and using advanced analytics, the grocery retailer realized a nearly 30% increase in revenue and a $7 million increase in annual profitability. The advanced modelling techniques allowed Automercados Plaza to more quickly adjust to changing market conditions. As a result, it has prevented losses for 35% of its prod-ucts as it can schedule price reductions to sell perishable products before they spoil.
Belk has installed selected multiple Data Warehouse Appliances and a Retail Logical Data Model to build a new integrated database-driven analytics environment in the company. The new, integrated data warehousing system increases data visibility and accelerates speed for complex queries for faster, more detailed insight into customer interests. The new appliances will provide an optimal environment for deep data inte-gration and powerful enterprise-class analytics. Enabled by unified database, timely available data, analytics tools and a specialized analytics team, Belk is consistently able to deliver a seamless shopping experience across multiple channels.
Oberweis Dairy
The US-based dairy product manufacturer, distributor and retailer implemented a suite of analytics solutions including business analytics, text miner and data visualiza-tion tools to understand how customers shop across different channels and effec-tively cross-sell and up-sell products. By automating data management and analysis process, the company learned that running specials on milk sold through grocery chains doesn’t cannibalize from other sales channels. It also quickly found and fixed manufacturing glitches by mining customer complaint data and built a program to root out bottle return fraud. Most importantly, it saw a 30% increase in customer retention.
PetSmart is focusing its customer strategies around three areas: connecting with pet parents in a personalized way, expanding its products and services and growing its most valuable customers. To better connect with pet parents, the retailer will lever-age its customer data and analytics to increase personalized connections. The goal is to be able to link 90% of sales to individual customers. The retailer has been invest-ing in new capabilities to help capture and use customer and pet data, and this year, it will deliver on new methods to use this data to drive growth. We view PetSmart’s strategy as being worth calling out due to their focus on “codification” of what is most important to their business.
We have profiled top 5 leading analytics retailers such as Amazon, Wal-Mart, Target, Nordstrom, Macy’s among others in our previous years’ reports. For more information on these retailers, please read our 2013 Future of Retail study and 2013 Big Data in Retail study.
Retail Honor Board
EKN 36 State of the Industry Research Series: 3rd Annual Analytics in Retail Study37Retail Honor Board
Retailers Action
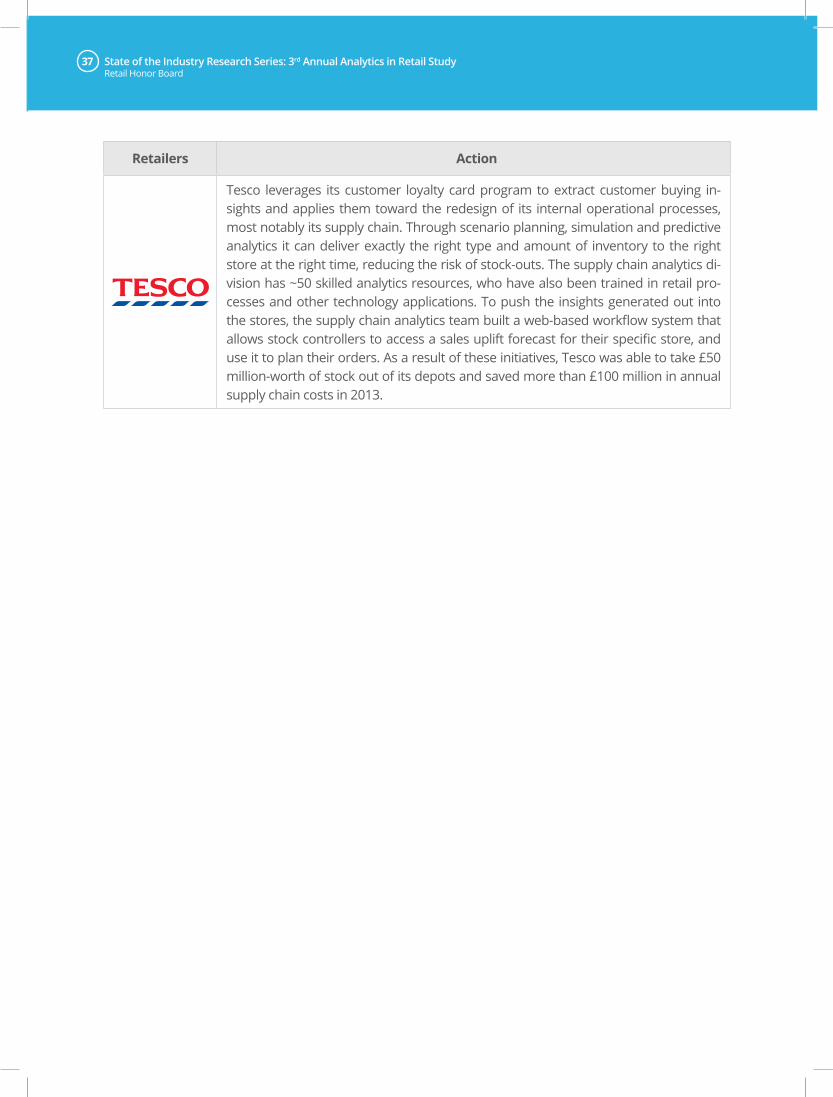
Tesco leverages its customer loyalty card program to extract customer buying in-sights and applies them toward the redesign of its internal operational processes, most notably its supply chain. Through scenario planning, simulation and predictive analytics it can deliver exactly the right type and amount of inventory to the right store at the right time, reducing the risk of stock-outs. The supply chain analytics di-vision has ~50 skilled analytics resources, who have also been trained in retail pro-cesses and other technology applications. To push the insights generated out into the stores, the supply chain analytics team built a web-based workflow system that allows stock controllers to access a sales uplift forecast for their specific store, and use it to plan their orders. As a result of these initiatives, Tesco was able to take £50 million-worth of stock out of its depots and saved more than £100 million in annual supply chain costs in 2013.
Premier Sponsor
About ManthanManthan serves as the Chief Analytics Officer for global consumer industries. Manthan’s comprehensive portfolio of analytics products and services enable retailers and their supplier partners to understand and activate the customer’s path-to-purchase journey. Architected with deep industry expertise, Manthan’s solutions combine advanced predic-tive analytics, actionable insights and unmatched customer knowledge to help retailers identify and drive incremental growth opportunities. Manthan has provided its business-building analytics solutions to over 120 leading retail and CPG organizations across 19 countries. Visit Manthan at http://www.manthansystems.com.
Supporting Sponsor
About SASIn retail, where companies can go quickly from rags to riches - or riches to rags - the customer’s perception of, and experience with, your brand is critical not only to staying in business, but growing your business as well. SAS enables retailers across all segments - apparel, grocery, specialty, general merchandise, online and hardlines - to uncover in-depth customer insights that you can use to delight customers by engaging them in profitable ways. With high-per-formance analytics at the core and backed by more than three decades of retail experience, SAS solutions for retail enable you to find new and better ways of doing business.
www.sas.com/retail
EKN is part of the Edgell Family
®
About EKNOur research agenda is developed using inputs from the end user community and the end user community extensively reviews the research before it is published. This ensures that we inject a healthy dose of pragmatism into the research and recommendations. This includes input of what research topics to pursue, incorporat-ing heavy practitioner input – via interviews etc., and ensuring that the bend of research takeaways are oriented towards a real-world, practical application of insights with community sign-off.
For more information, visit www.eknresearch.com
Email us at [email protected]
Copyright © 2014 EKN
Registered Office: 4 Middlebury Blvd. Randolph, NJ 07869
Ph: (973) 607 1300
Disclaimer:
EKN does not make any warranties, express or implied, including, without limitation, those of merchantability and fitness for a particu-lar purpose. The information and opinions in research reports con-stitute judgments as at the date indicated and are subject to change without notice. The information provided is not intended as financial or investment advice and should not be relied upon as such. The information is not a substitute for independent professional advice before making any investment decisions.
Gaurav Pant SVP Research and Principal Analyst [email protected]
Sahir Anand VP Research & Principal Analyst [email protected]
Asheesh Kumar Sr. Analyst [email protected]
Neha Aggarwal Sr. Analyst [email protected]
EKN Research Team