Embed Size (px)
Citation preview
Premier Wen Jiabao’s Quotation April 9th, 2007
China’s expansion has become what
he called “unstable, unbalanced,
uncoordinated and unsustainable”
Source: Wall Street Journal
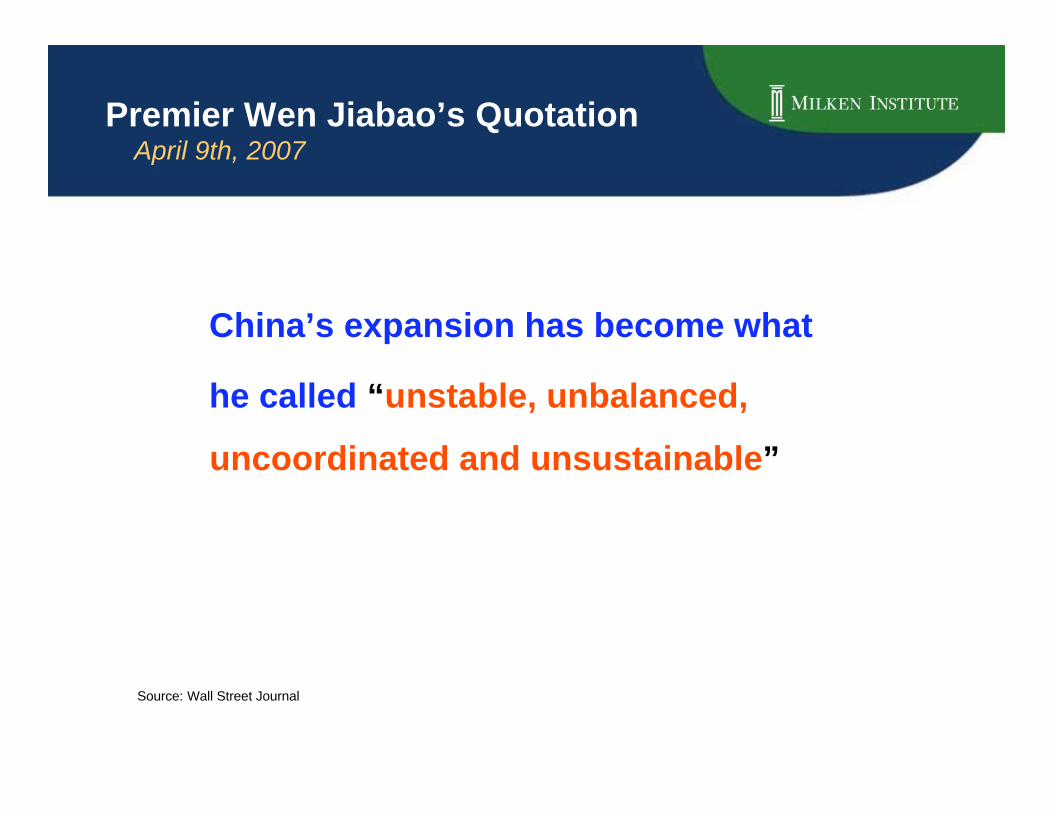
Sources of Electricity Production China, Percent of Total
Source: WDI, IEA Energy Statistics
20042001199819951992
80
78
76
74
72
70
25
20
15
10
5
0
Percent
Natural Gas Hydro NuclearOil Coal

Source: BP
0
2
4
6
8
10
1980 1985 1990 1995 2000 2005
To
nn
es
oil
eq
uiv
ale
nt
pe
r p
ers
on
United States China India
Energy Consumption Per Capita

China’s Energy Efficiency Energy Consumed Per $ 1,000 GDP
0.0
0.4
0.8
1.2
1.6
2.0
1980 1985 1990 1995 2000 2005
To
nn
es
oil
eq
uiv
ale
nt
pe
r U
S$
1,0
00
GD
P
China
India
United States
Sources: BP, World Economic Outlook
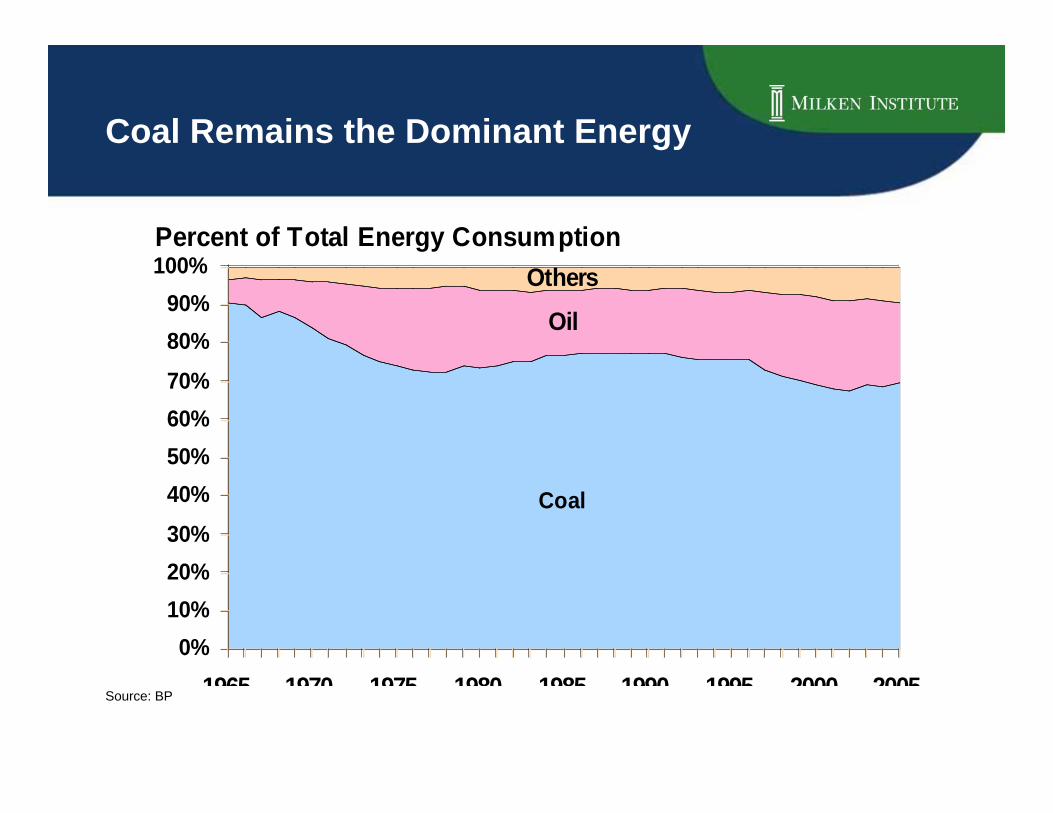
Coal Remains the Dominant Energy
Coal
Oil
Others
0%
10%
20%
30%
40%
50%
60%
70%
80%
90%
100%
1965 1970 1975 1980 1985 1990 1995 2000 2005
Percent of Total Energy Consumption
Source: BP
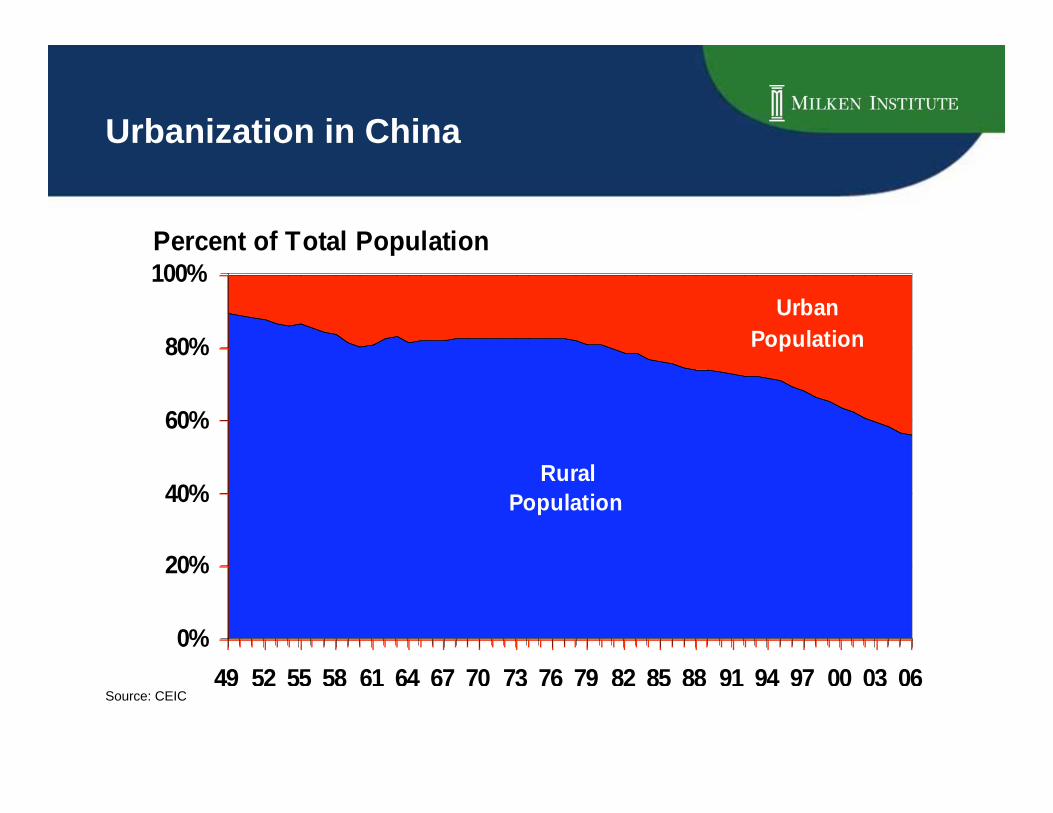
Urbanization in China
Rural
Population
Urban
Population
0%
20%
40%
60%
80%
100%
49 52 55 58 61 64 67 70 73 76 79 82 85 88 91 94 97 00 03 06
Percent of Total Population
Source: CEIC
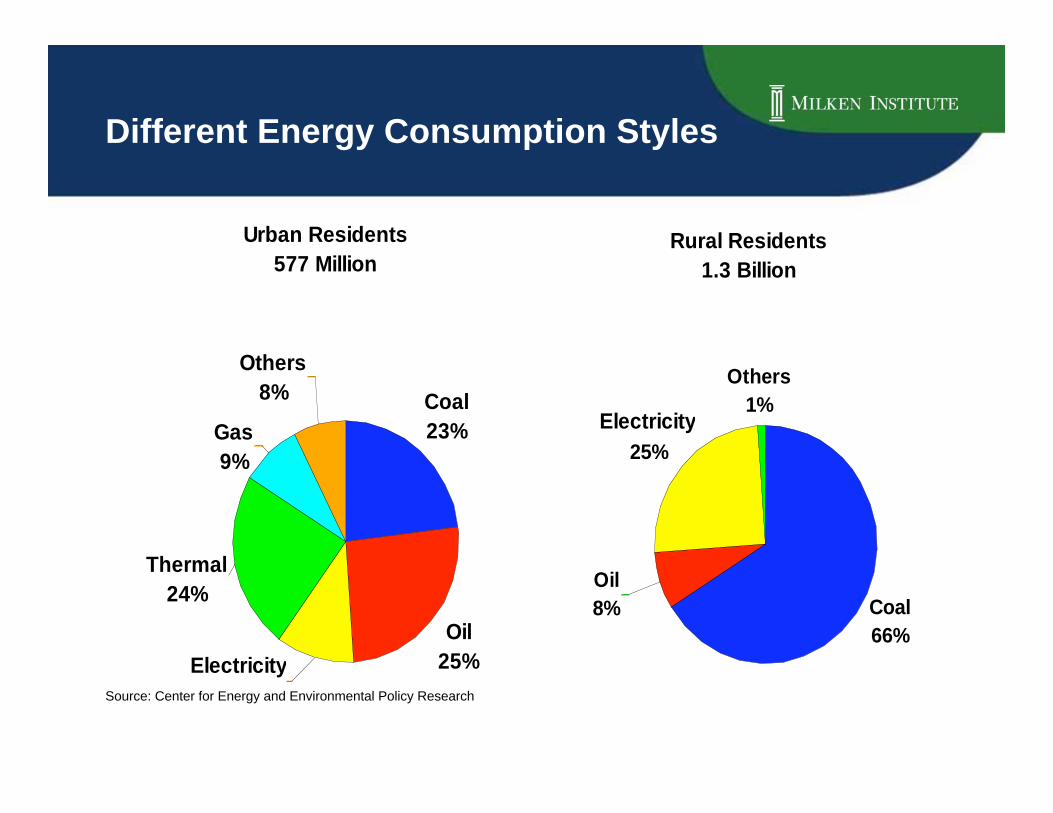
Different Energy Consumption Styles
Coal
23%
Oil
25%
Gas
9%
Others
8%
Ther
24%
Electr
Thermal
24%
Electricity
Urban Residents
577 Million
Coal
66%
Electri
city
25%
Others
1%
Oil
8%
Electricity
Rural Residents
1.3 Billion
Source: Center for Energy and Environmental Policy Research
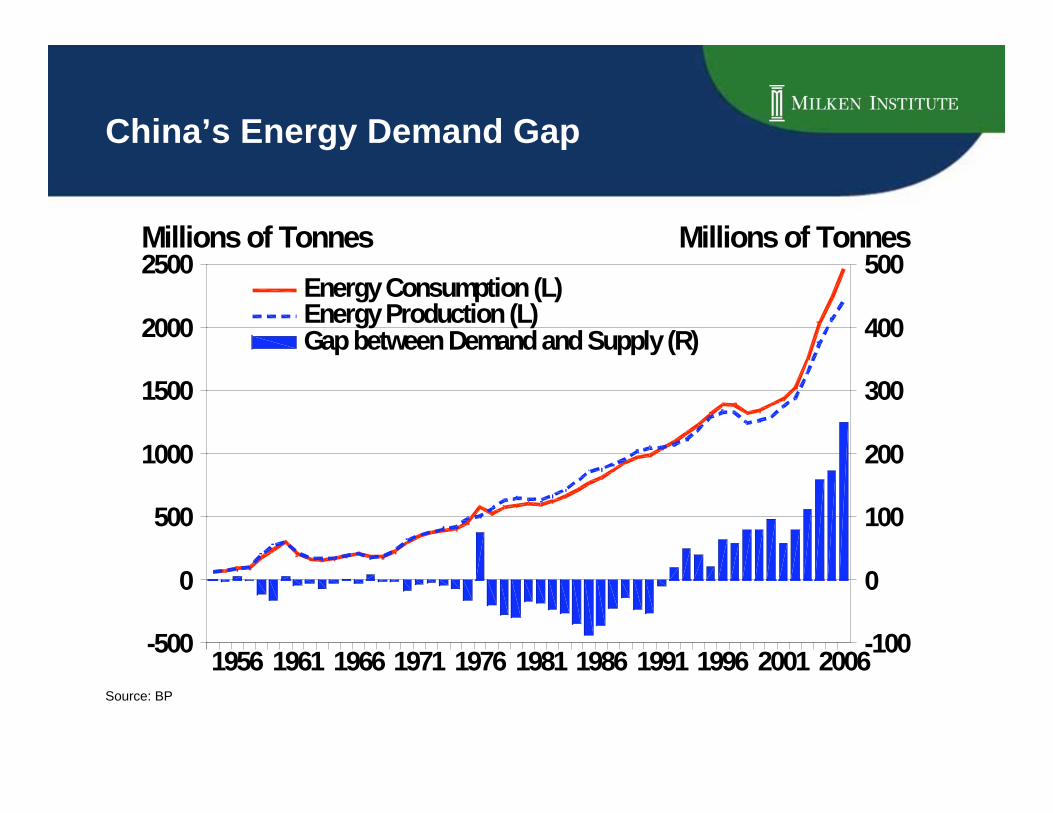
China’s Energy Demand Gap
20062001199619911986198119761971196619611956
2500
2000
1500
1000
500
0
-500
500
400
300
200
100
0
-100
Millions of Tonnes Millions of Tonnes
Energy Consumption (L)Energy Production (L)Gap between Demand and Supply (R)
Source: BP

Rising Share of Energy Consumption
Coal
Oil
Primary
Energy
0%
5%
10%
15%
20%
25%
30%
35%
40%
1965 1970 1975 1980 1985 1990 1995 2000 2005
Percent of Total World Consumption
Source: BP

Farming,
Forestry,
Animal
Husbandry,
Fishery and
Water
Conservancy
4%
Residential
Consumption
10%
Wholesale,
Retail Trade
and Hotel,
Restaurants
2%
Others
4%
Industry
71%
onstruction
2%
Transport,
Storage and
Post
7%
Energy Consumption by Sector 2005
Source: China Statistical Yearbook, 2005

• 30% of acid rain that falls in China is blamed onthe burning of coal
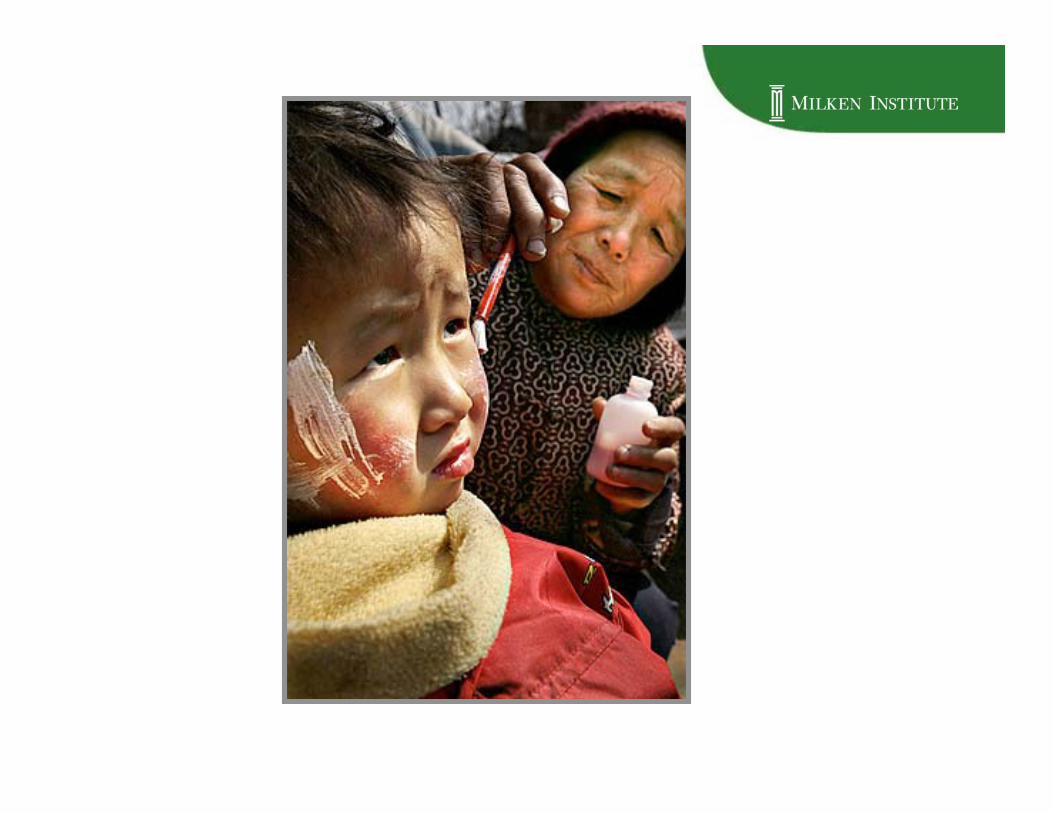
• Between 2001 and 2020, 600,000 people/ year areexpected to suffer premature deaths due to airpollution
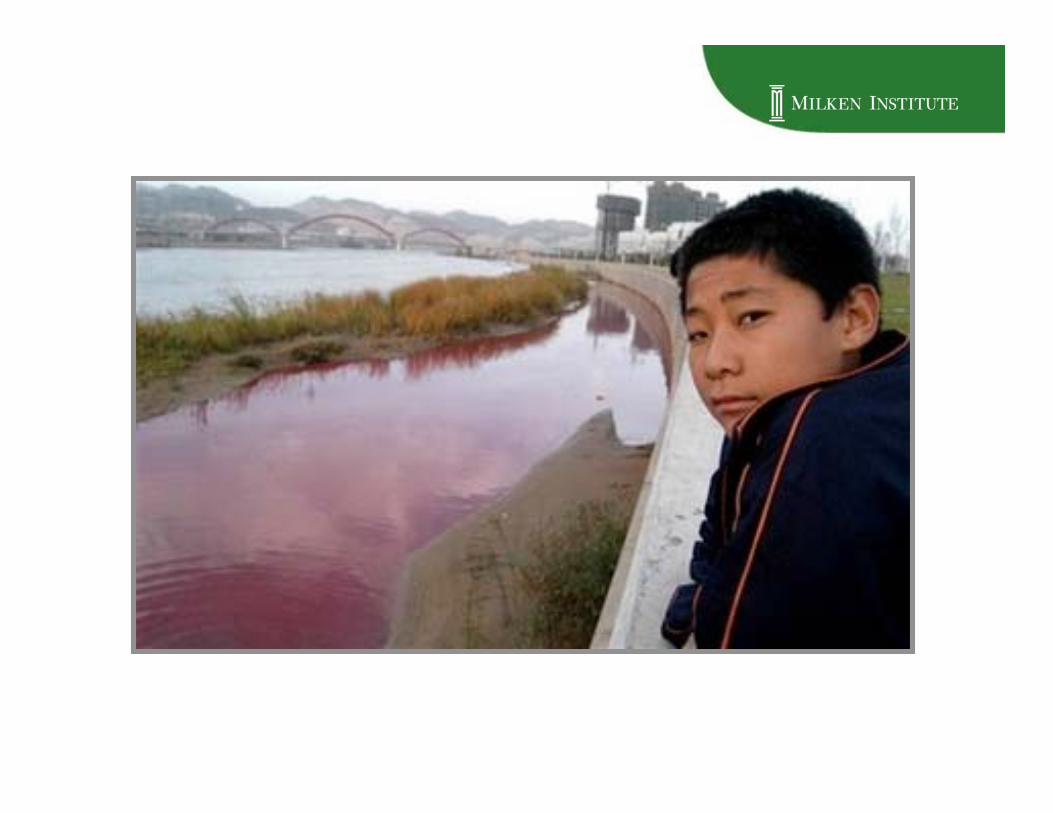
• Over 75% of rivers are unusable for farming ordrinking
• China owns 7% of world's farmable land
Environment Overview China
Source: http://news.nationalgeographic.com/news/2005/05/0516_050516_chinaeco.html

If Chinese HouseholdsBuy More Cars…
Number of cars owned per
urban household
0.01
1.78
0.0
0.2
0.4
0.6
0.8
1.0
1.2
1.4
1.6
1.8
2.0
United States China
• In the United States, eachhousehold owns 1.78 cars.
• In China, each 100 urbanhouseholds owns 1.36 cars.
• If every 10 Chinese urbanhouseholds own 1 car,China’s emission of carbondioxide will increase by 79.4million tons each year*.
*Based upon 225 miles per week/22 milesper gallon assumptions.Source: BEA, NBS and Milken Institute staff calculation
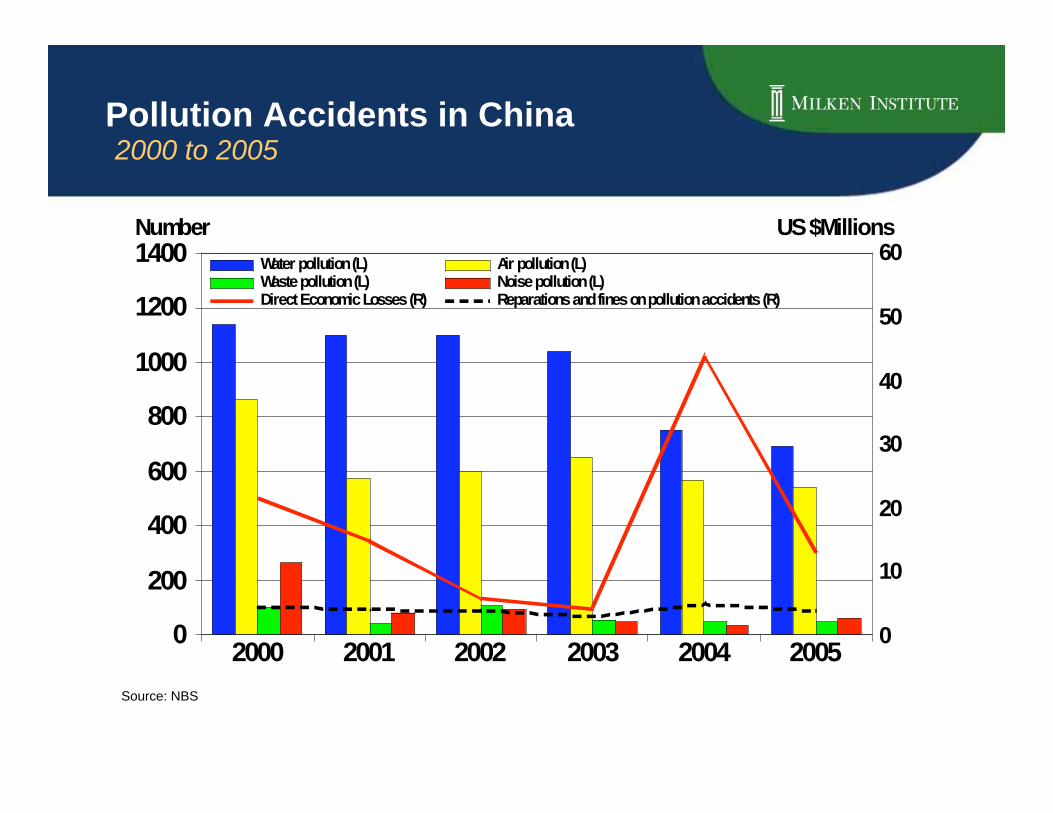
Pollution Accidents in China 2000 to 2005
Source: NBS
200520042003200220012000
1400
1200
1000
800
600
400
200
0
60
50
40
30
20
10
0
Number US $Millions
Water pollution (L) Air pollution (L)Waste pollution (L) Noise pollution (L)Direct Economic Losses (R) Reparations and fines on pollution accidents (R)
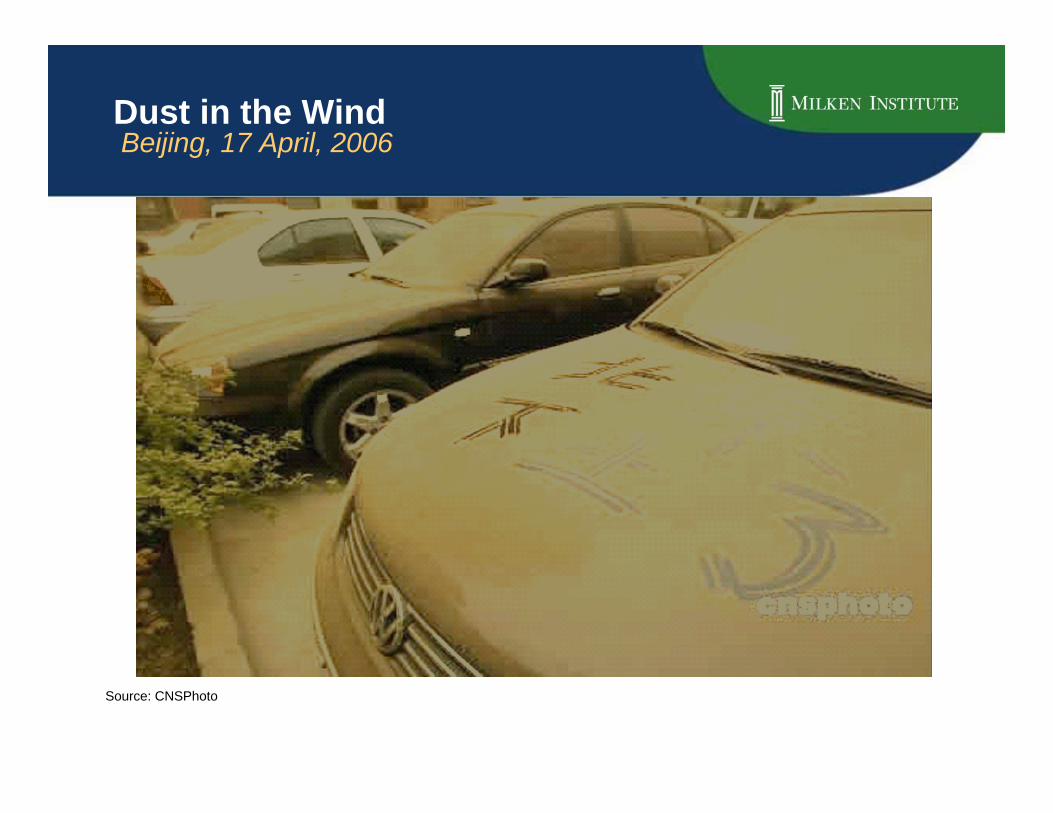
Dust in the Wind Beijing, 17 April, 2006
Source: CNSPhoto
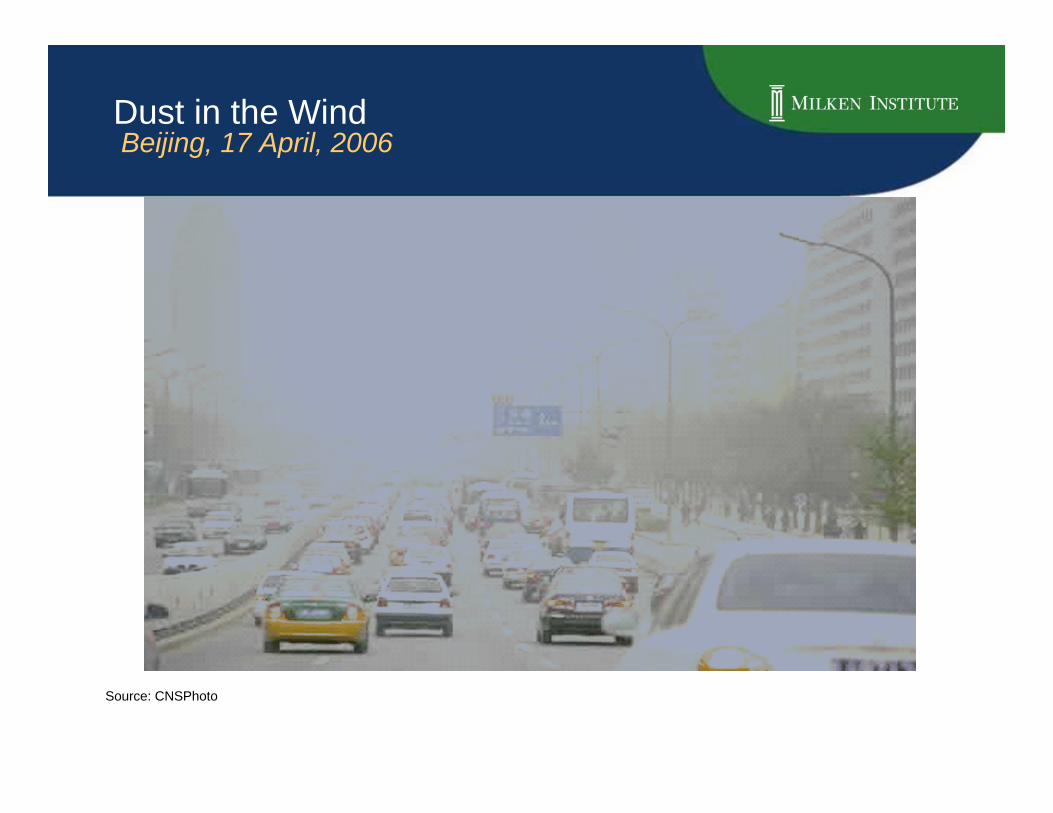
Dust in the Wind Beijing, 17 April, 2006
Source: CNSPhoto
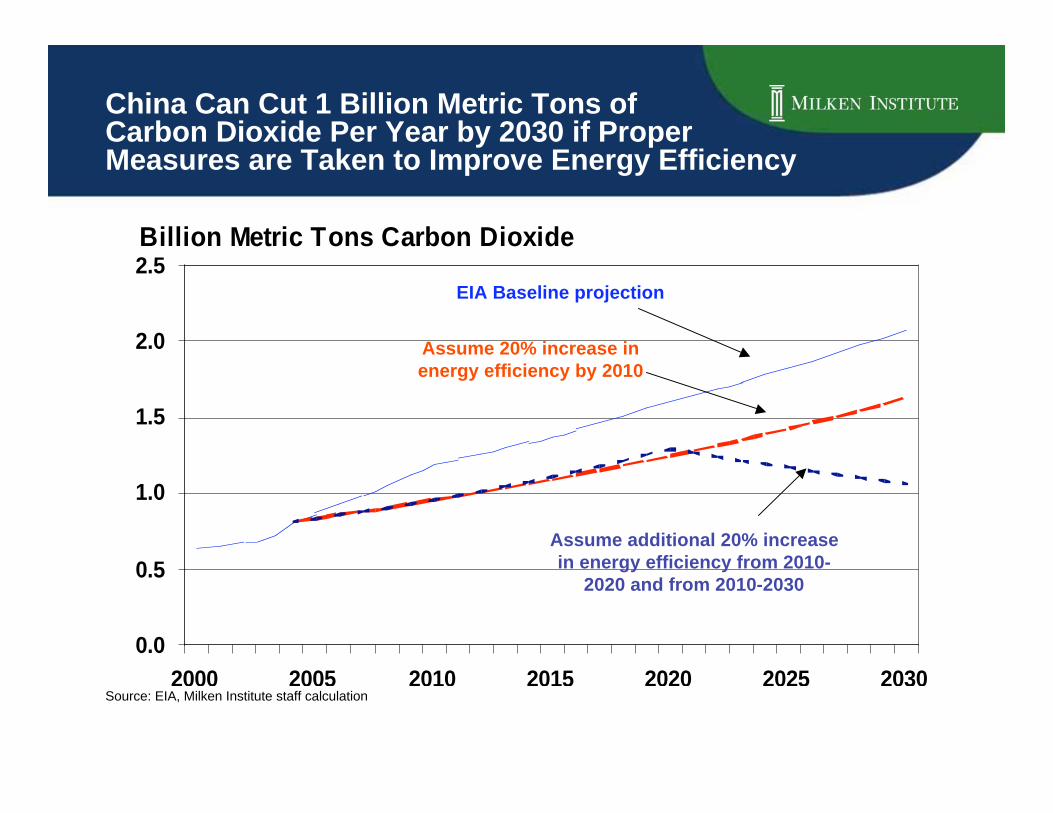
0.0
0.5
1.0
1.5
2.0
2.5
2000 2005 2010 2015 2020 2025 2030
Billion Metric Tons Carbon Dioxide
China Can Cut 1 Billion Metric Tons ofCarbon Dioxide Per Year by 2030 if ProperMeasures are Taken to Improve Energy Efficiency
EIA Baseline projection
Assume 20% increase inenergy efficiency by 2010
Assume additional 20% increasein energy efficiency from 2010-
2020 and from 2010-2030
Source: EIA, Milken Institute staff calculation
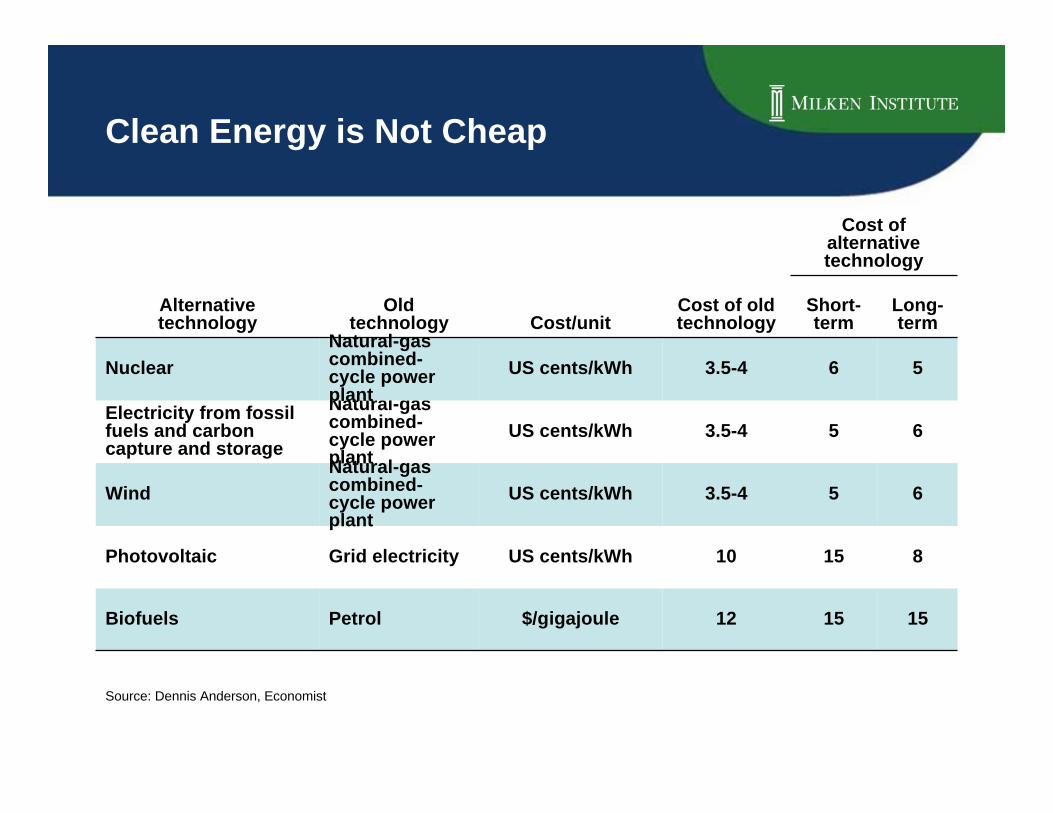
Clean Energy is Not Cheap
151512$/gigajoulePetrolBiofuels
81510US cents/kWhGrid electricityPhotovoltaic
653.5-4US cents/kWh
Natural-gascombined-cycle powerplant
Wind
653.5-4US cents/kWh
Natural-gascombined-cycle powerplant
Electricity from fossilfuels and carboncapture and storage
563.5-4US cents/kWh
Natural-gascombined-cycle powerplant
Nuclear
Long-term
Short-term
Cost of oldtechnologyCost/unit
Oldtechnology
Alternativetechnology
Cost ofalternativetechnology
Source: Dennis Anderson, Economist
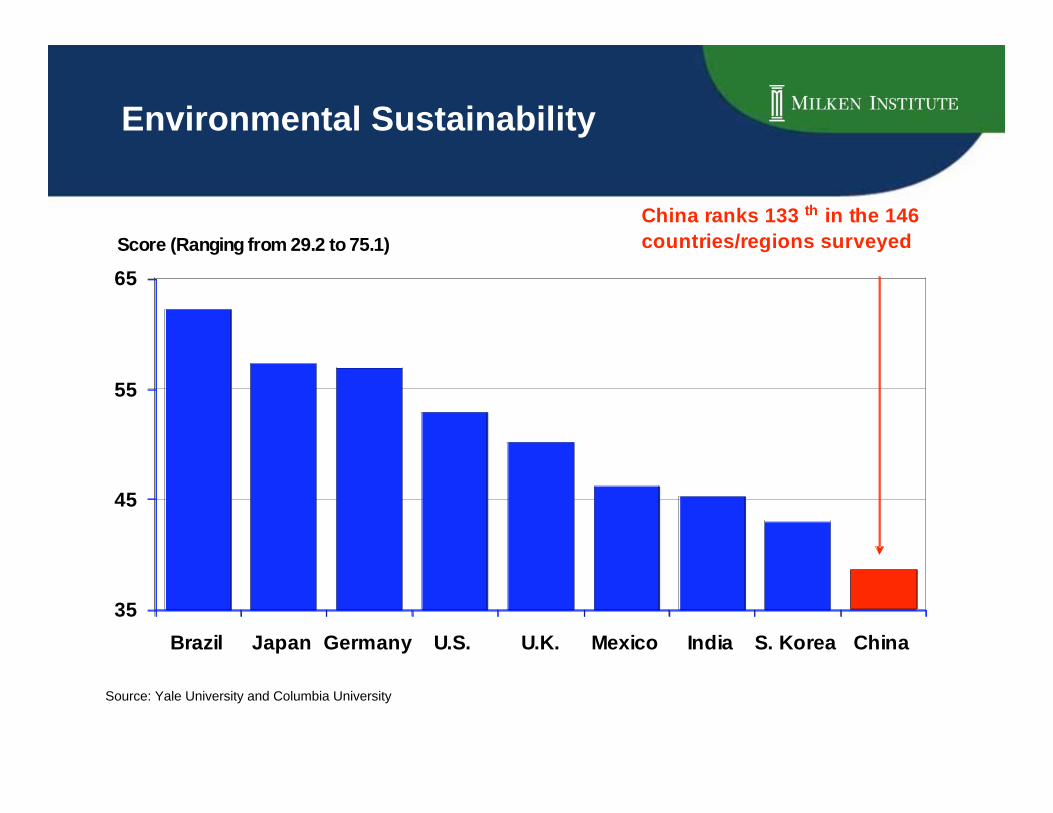
Environmental Sustainability
35
45
55
65
Brazil Japan Germany U.S. U.K. Mexico India S. Korea China
Score (Ranging from 29.2 to 75.1)
China ranks 133 th in the 146
countries/regions surveyed
Source: Yale University and Columbia University
T h e C h i n a S u s t a i n a b l e E n e r g y P r o g r a mT h e C h i n a S u s t a i n a b l e E n e r g y P r o g r a m
Social Investment: Shaping China’s Energy Markets forEnergy Efficiency and Renewable EnergyMilken Institute—”China’s Growing Energy Appetite”
April 23, 2007
Doug Ogden, Director, China Sustainable Energy Program,[email protected]

China’s Energy Efficiency Imperative
-
1,000
2,000
3,000
4,000
5,000
6,000
7,000
8,000
1980 1985 1990 1995 2000 2005 2010 2015 2020
Mil
lio
n T
on
s o
f C
oa
l E
qu
iva
len
t
Energy Intensity Target:
20% Achieved Every 5 Years
Business As Usual
@ 7.5% Energy Growth
Source: Lawrence Berkeley National Lab
1.4 Americas ofGlobal WarmingPollution in 2020
2.7 Americas ofGlobal WarmingPollution in 2020

Technology Policies Catalyze Markets
{Science
Engineering
Commercialization Policies
{
{
Time/Volume
Advanced Technology
Fossil fuels
Price Per kWh
Source: Doug Ogden
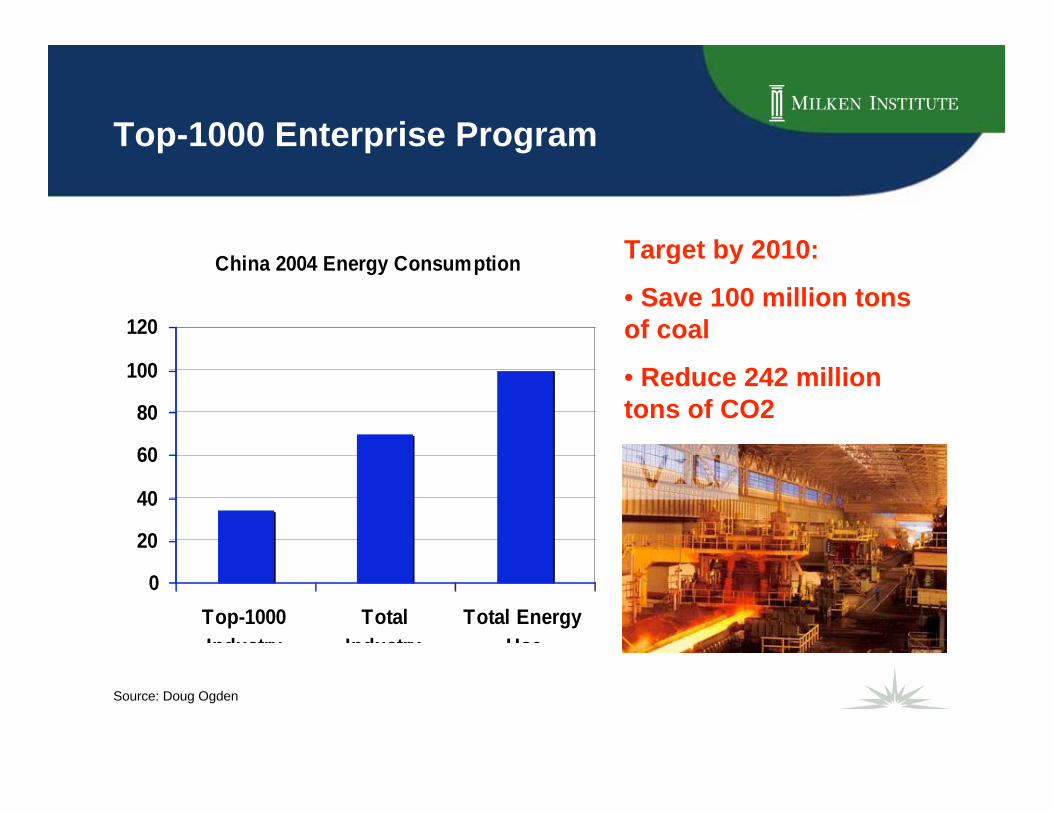
Top-1000 Enterprise Program
China 2004 Energy Consumption
0
20
40
60
80
100
120
Top-1000
Industry
Total
Industry
Total Energy
Use
Target by 2010:
• Save 100 million tonsof coal
• Reduce 242 milliontons of CO2
Source: Doug Ogden
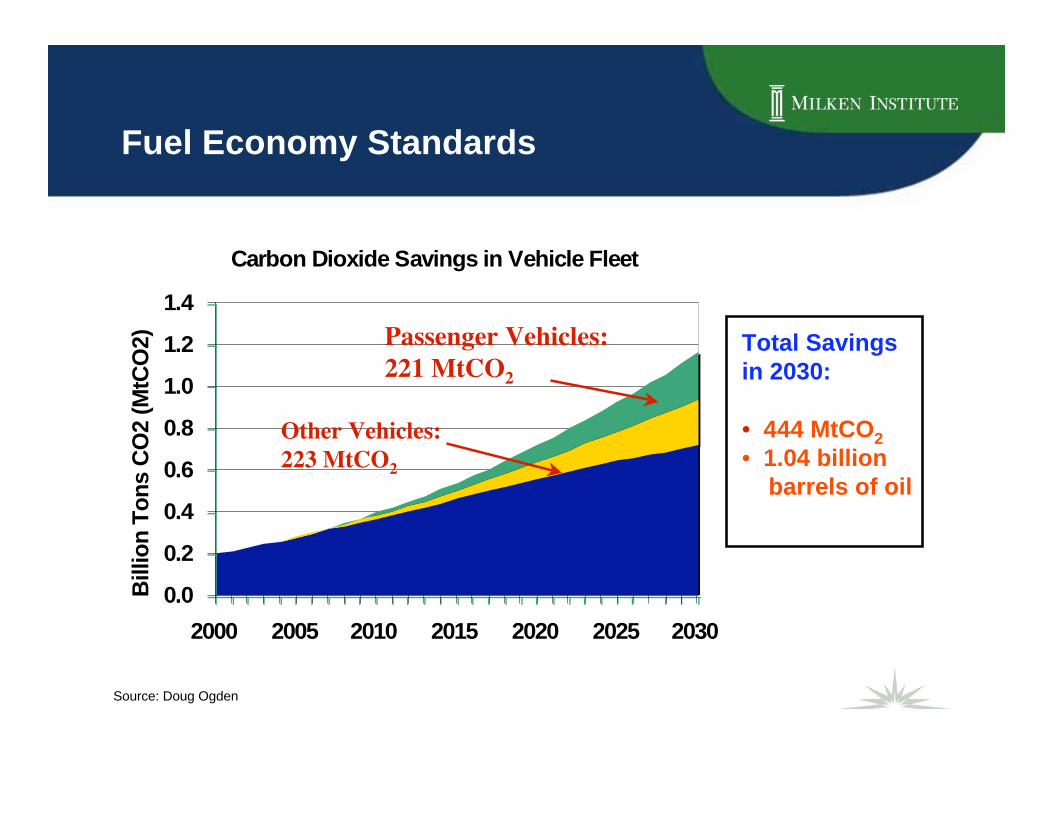
Carbon Dioxide Savings in Vehicle Fleet
0.0
0.2
0.4
0.6
0.8
1.0
1.2
1.4
2000 2005 2010 2015 2020 2025 2030
Billio
n T
on
s C
O2 (
MtC
O2)
Fuel Economy Standards
Total Savingsin 2030:
• 444 MtCO2
• 1.04 billion barrels of oil
Passenger Vehicles:
221 MtCO2
Other Vehicles:
223 MtCO2
Source: Doug Ogden

Energy Efficiency Power Plants
Source: Asian Development Bank
Shanghai
• Saves 198 MW in 2 yrs
• Saves US $69 million
• Average cost: US 1.6
cents/kWh
Jiangsu
• Saves 17, 000 MW in 10 yrs
• 1/4 the average cost of a coal-
fired power plant (average cost:
US 1.6 cents/kWh)
• Net benefit to consumers:
US $21.2 billion
Guangzhou• Asian Development Bank:
US $120 million for a 350 MWEPP
Jiangsu EPP Electricity Savings
0
500
1000
1500
2000
Year 1 Year 2 Year 3 Year 4Cu
mu
lati
ve A
nn
ual P
eak
Dem
an
d M
W/y
r (g
en
era
tio
n
vo
ltag
e)
Residential Appliances
Industrial Motor Drive Systems
New Cooling /Lighting Equipment
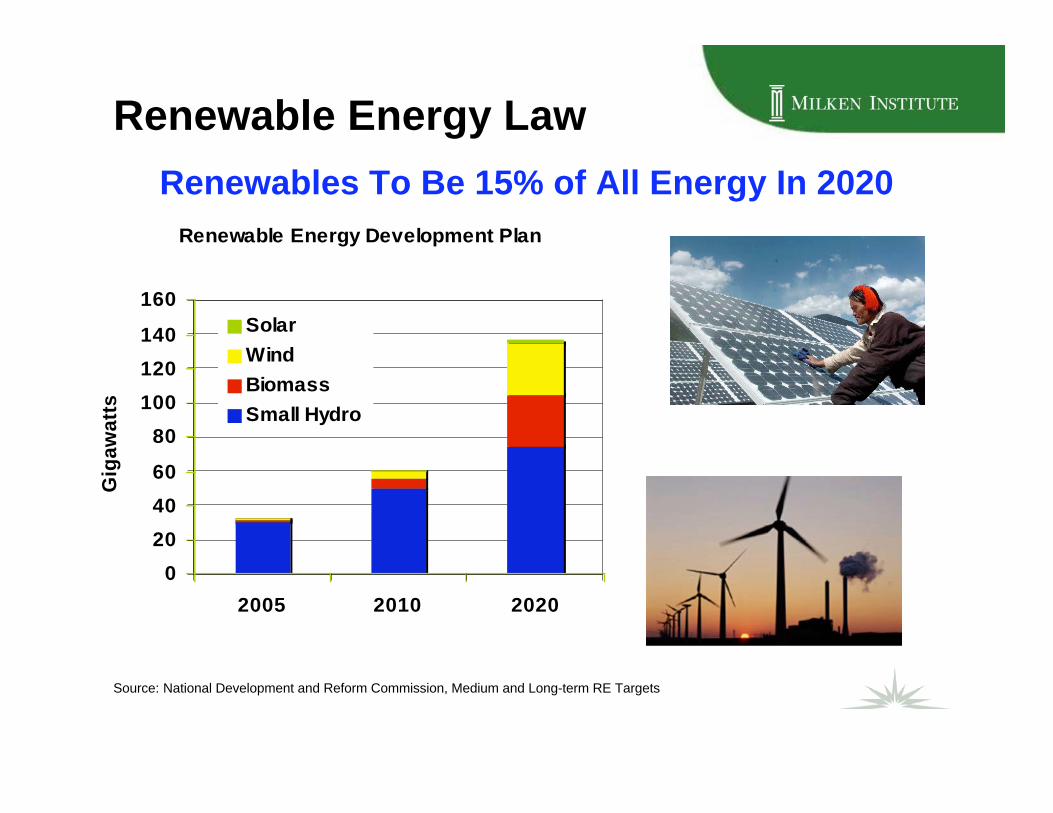
Renewable Energy Law
Source: National Development and Reform Commission, Medium and Long-term RE Targets
Renewable Energy Development Plan
0
20
40
60
80
100
120
140
160
2005 2010 2020
Gig
aw
att
s
Solar
Wind
Biomass
Small Hydro
Renewables To Be 15% of All Energy In 2020
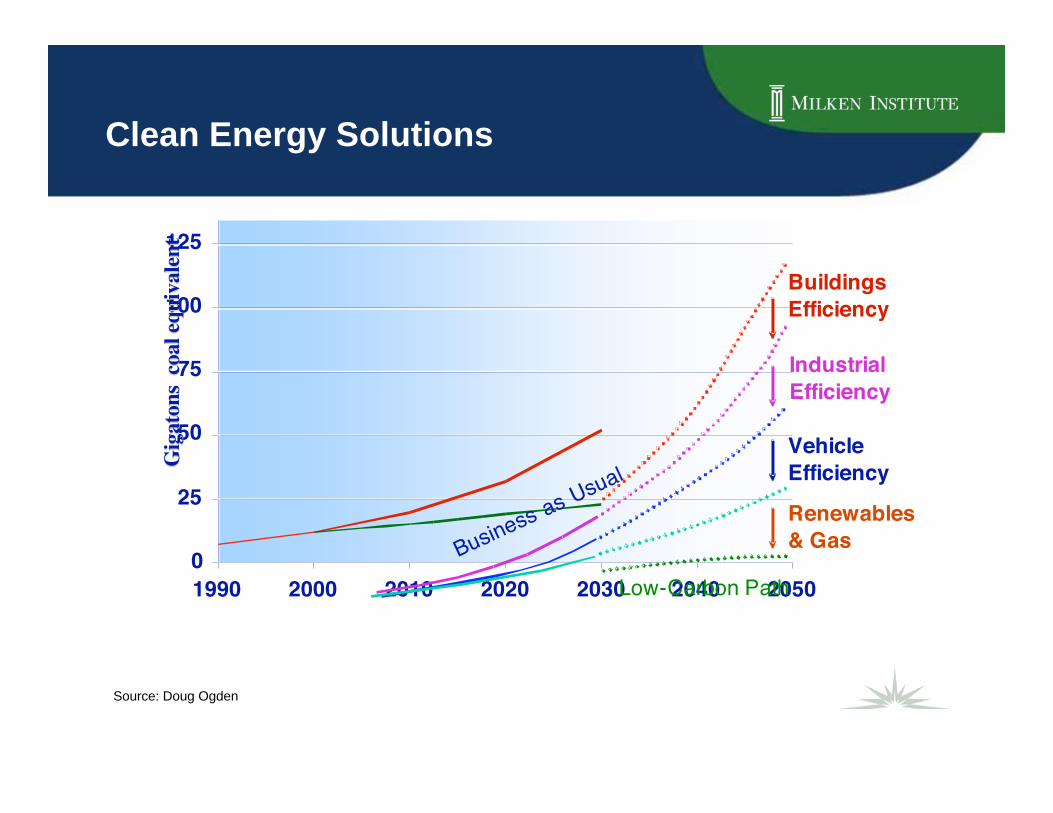
Clean Energy Solutions
0
25
50
75
100
125
1990 2000 2010 2020 2030 2040 2050
Gig
ato
ns
Gig
ato
ns
coal
equ
ivale
nt
coal
equ
ivale
nt
Business as U
sual
Low-Carbon Path
Buildings
Efficiency
Industrial
Efficiency
Vehicle
Efficiency
Renewables
& Gas
Source: Doug Ogden
T h e C h i n a S u s t a i n a b l e E n e r g y P r o g r a mT h e C h i n a S u s t a i n a b l e E n e r g y P r o g r a m
• High-level access; bottom-up demonstrations
• Identify and Encourage Champions
• Training: Lateral Transfer
• Job Performance Criteria
• Scale
• Long-term commitment
Keys to Implementation & Enforcement
Source: Doug Ogden
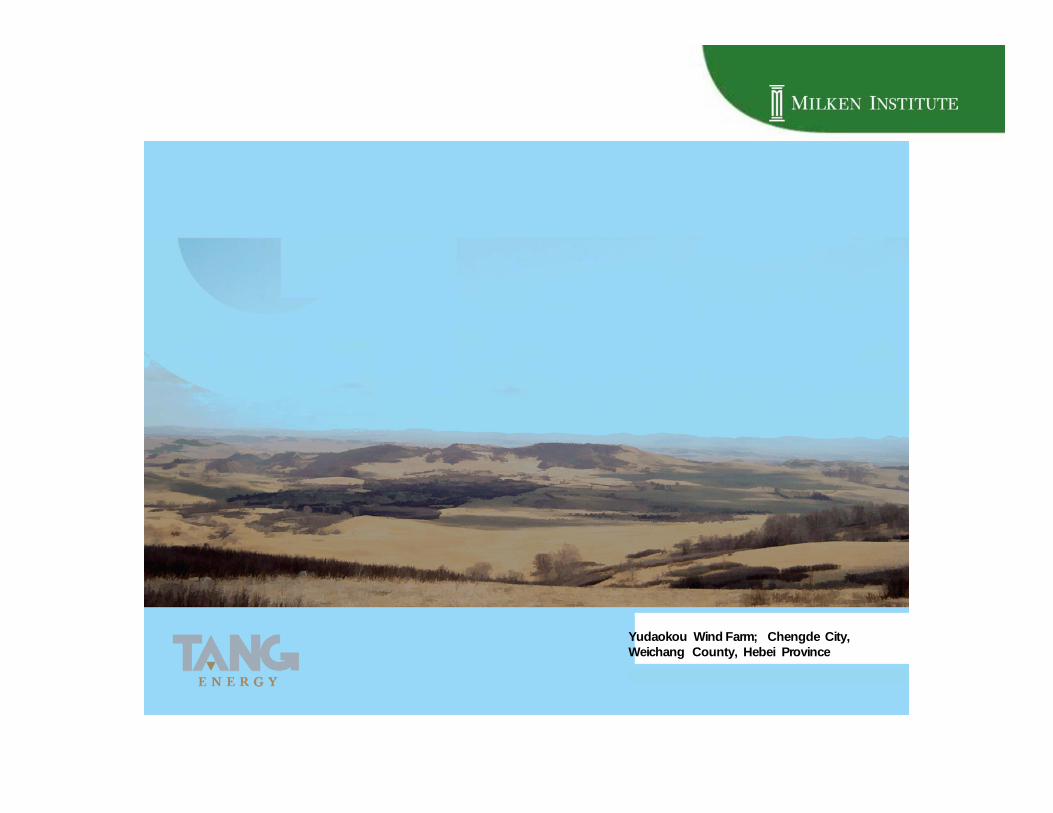
Yudaokou Wind Farm; Chengde City,
Weichang County, Hebei Province
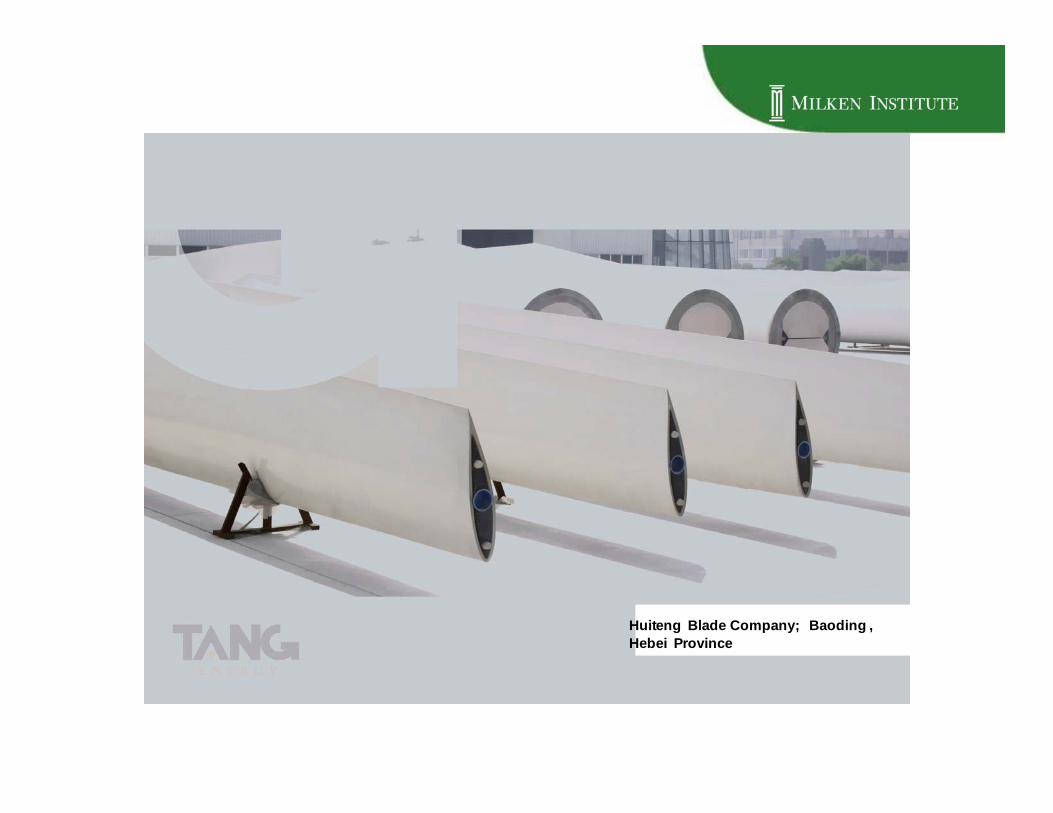
Huiteng Blade Company; Baoding ,
Hebei Province

This slogan says “Protect the Environment”
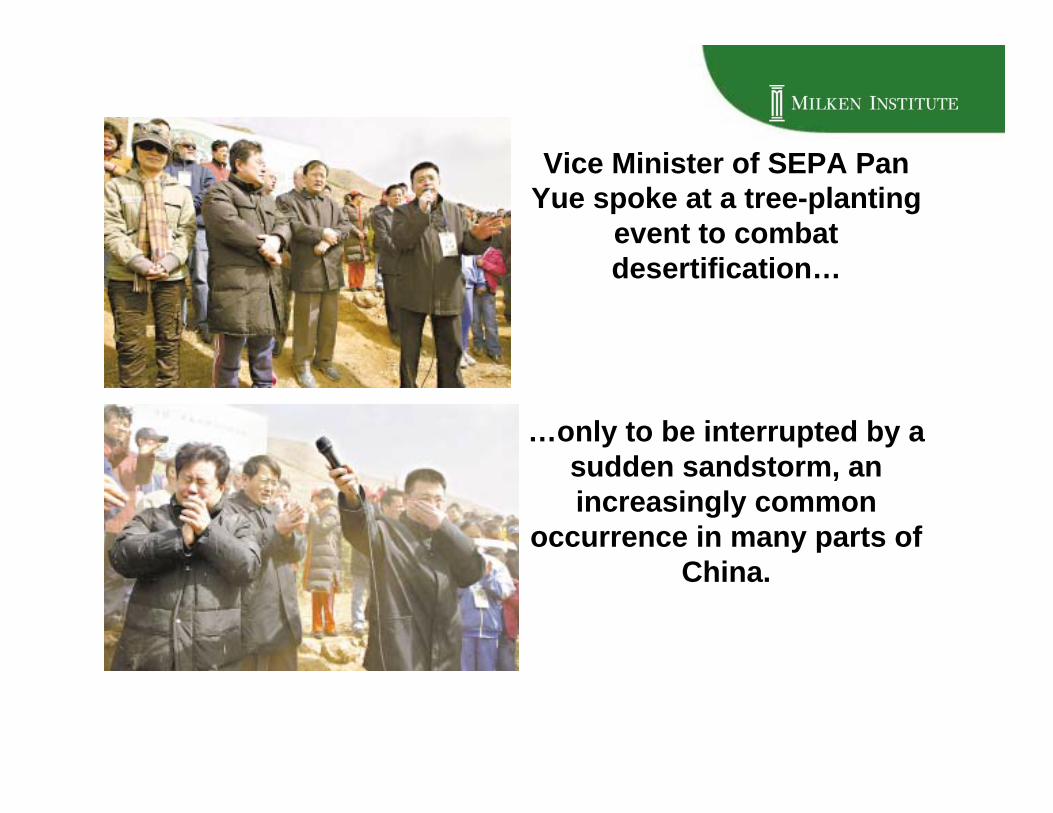
Vice Minister of SEPA PanYue spoke at a tree-planting
event to combatdesertification…
…only to be interrupted by asudden sandstorm, anincreasingly common
occurrence in many parts ofChina.


Riots broke out in Zhejiang province after elderlywomen protesting pollution from a chemical factorywere treated roughly by police. The women believedthat pollution was the cause of increased stillbirthsand had poisoned the village’s crops.
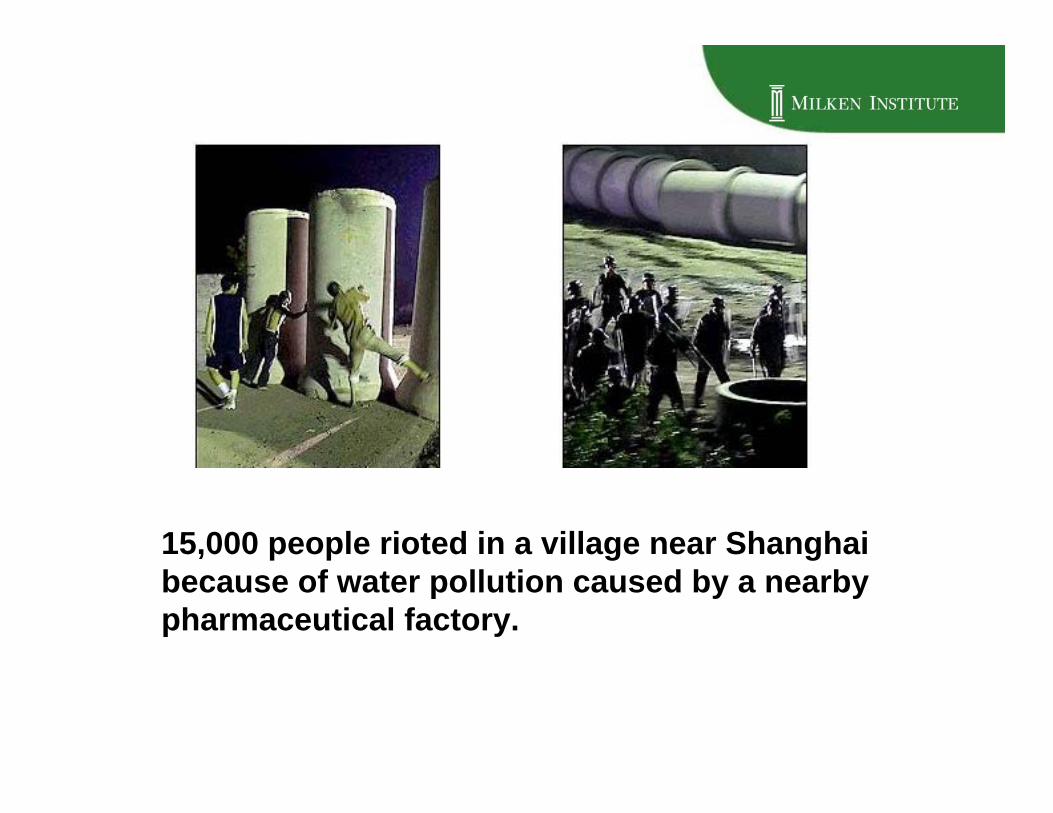
15,000 people rioted in a village near Shanghaibecause of water pollution caused by a nearbypharmaceutical factory.

BLANK SLIDE

BLANK SLIDE

BLANK SLIDE
20 April 200720 April 2007SBI E2SBI E2 --Capital: A specialist in Hong Kong/China/Singapore Small Cap ResCapital: A specialist in Hong Kong/China/Singapore Small Cap Res earchearch
Milken Institute
2007 Global Conference
China’s Growing Energy AppetiteHow can it meet demand and protect the environment?
Our small ideas are BIG !
DatoDato ’’ SJ WongSJ Wong
Tel: (852) 2533 3738Tel: (852) 2533 3738
[email protected]@softbank.com.hk
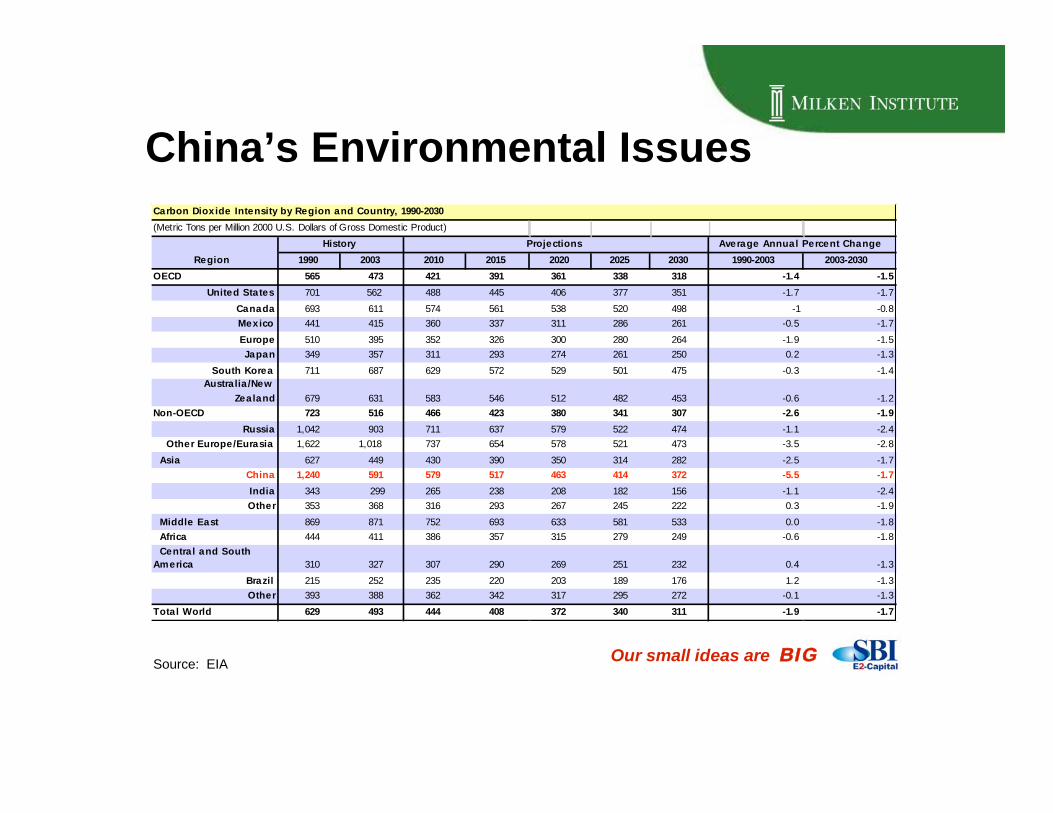
Carbon Dioxide Intensity by Region and Country, 1990-2030
(Metric Tons per Million 2000 U.S. Dollars of Gross Domestic Product)
1990 2003 2010 2015 2020 2025 2030 1990-2003 2003-2030
OECD 565 473 421 391 361 338 318 -1.4 -1.5
United States 701 562 488 445 406 377 351 -1.7 -1.7
Canada 693 611 574 561 538 520 498 -1 -0.8
Mexico 441 415 360 337 311 286 261 -0.5 -1.7
Europe 510 395 352 326 300 280 264 -1.9 -1.5
Japan 349 357 311 293 274 261 250 0.2 -1.3
South Korea 711 687 629 572 529 501 475 -0.3 -1.4
Australia /New
Zealand 679 631 583 546 512 482 453 -0.6 -1.2
Non-OECD 723 516 466 423 380 341 307 -2.6 -1.9
Russia 1,042 903 711 637 579 522 474 -1.1 -2.4
Other Europe/Eurasia 1,622 1,018 737 654 578 521 473 -3.5 -2.8
Asia 627 449 430 390 350 314 282 -2.5 -1.7
China 1,240 591 579 517 463 414 372 -5.5 -1.7
India 343 299 265 238 208 182 156 -1.1 -2.4
Other 353 368 316 293 267 245 222 0.3 -1.9
Middle East 869 871 752 693 633 581 533 0.0 -1.8
Africa 444 411 386 357 315 279 249 -0.6 -1.8
Central and South
America 310 327 307 290 269 251 232 0.4 -1.3
Brazil 215 252 235 220 203 189 176 1.2 -1.3
Other 393 388 362 342 317 295 272 -0.1 -1.3
Total World 629 493 444 408 372 340 311 -1.9 -1.7
History Projections
Region
Average Annual Percent Change
China’s Environmental Issues
Source: EIAOur small ideas are BIG

ChinaChina’’s Environmental Issuess Environmental Issues
Source: Energy Information Administration
CO2 Emission in China (1980-2004)
0
500
1,000
1,500
2,000
2,500
3,000
3,500
4,000
4,500
5,000
1980 1981 1982 1983 1984 1985 1986 1987 1988 1989 1990 1991 1992 1993 1994 1995 1996 1997 1998 1999 2000 2001 2002 2003 2004
Coal
Petroleum
Natural Gas
Total
million tons
Our small ideas are BIG

ChinaChina’’s Environmental Issuess Environmental Issues
Annual emission of Industrial SO2 & Treatment Capacity
Source: State Environmental Protection Administration
0
2
4
6
8
10
12
14
16
18
20
1999 2000 2001 2002 2003 2004
Industrial SO2 emitted
Industrial SO2 removed
million ton
Our small ideas are BIG
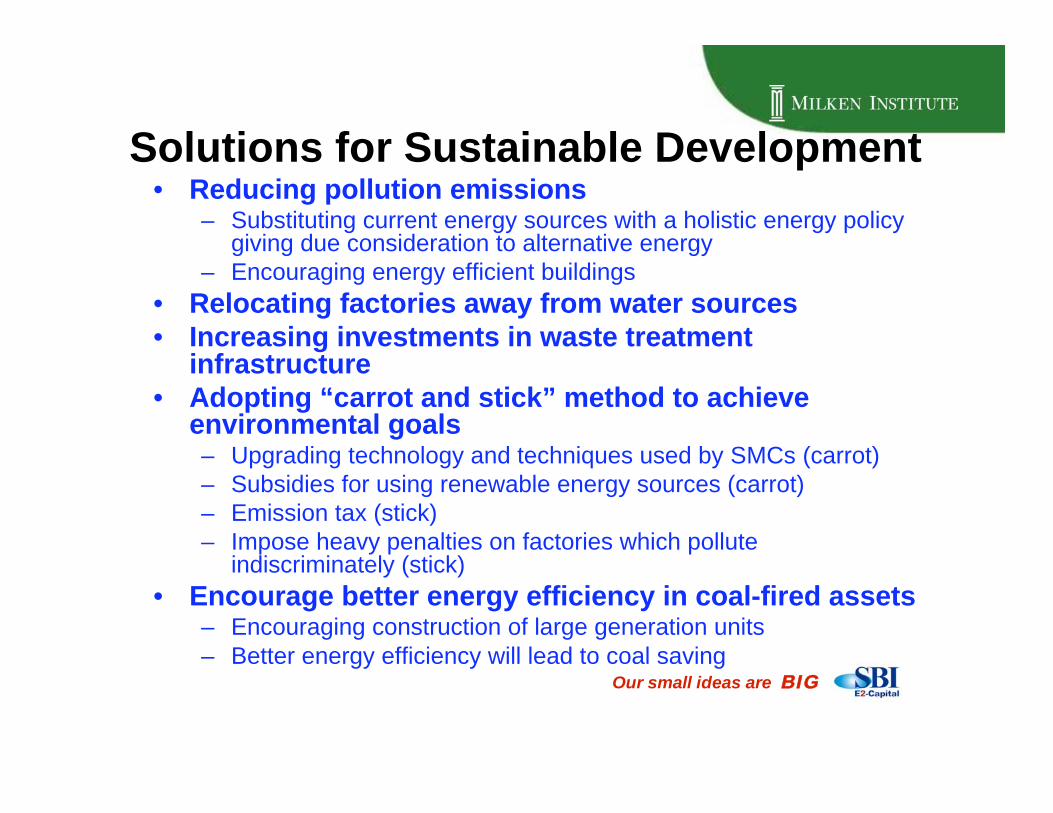
Solutions for Sustainable Development• Reducing pollution emissions
– Substituting current energy sources with a holistic energy policygiving due consideration to alternative energy
– Encouraging energy efficient buildings
• Relocating factories away from water sources• Increasing investments in waste treatment
infrastructure• Adopting “carrot and stick” method to achieve
environmental goals– Upgrading technology and techniques used by SMCs (carrot)– Subsidies for using renewable energy sources (carrot)– Emission tax (stick)– Impose heavy penalties on factories which pollute
indiscriminately (stick)
• Encourage better energy efficiency in coal-fired assets– Encouraging construction of large generation units– Better energy efficiency will lead to coal saving
Our small ideas are BIG
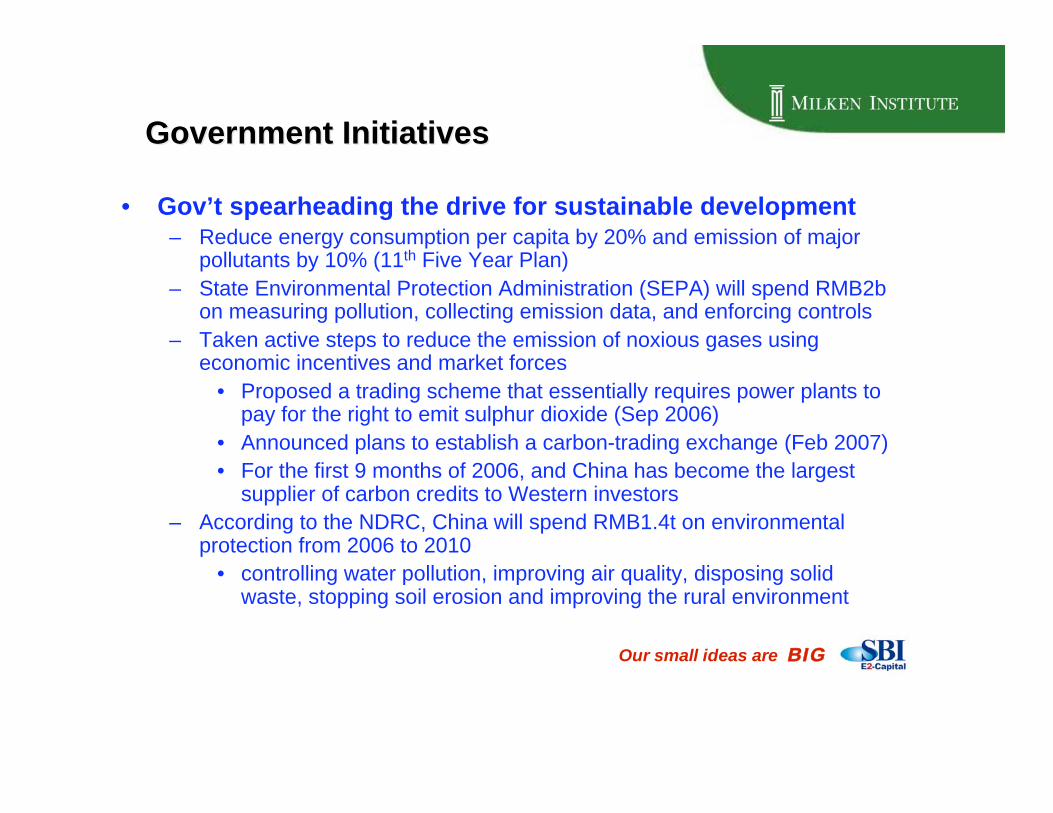
Government InitiativesGovernment Initiatives
• Gov’t spearheading the drive for sustainable development– Reduce energy consumption per capita by 20% and emission of major
pollutants by 10% (11th Five Year Plan)
– State Environmental Protection Administration (SEPA) will spend RMB2bon measuring pollution, collecting emission data, and enforcing controls
– Taken active steps to reduce the emission of noxious gases usingeconomic incentives and market forces
• Proposed a trading scheme that essentially requires power plants topay for the right to emit sulphur dioxide (Sep 2006)
• Announced plans to establish a carbon-trading exchange (Feb 2007)
• For the first 9 months of 2006, and China has become the largestsupplier of carbon credits to Western investors
– According to the NDRC, China will spend RMB1.4t on environmentalprotection from 2006 to 2010
• controlling water pollution, improving air quality, disposing solidwaste, stopping soil erosion and improving the rural environment
Our small ideas are BIG
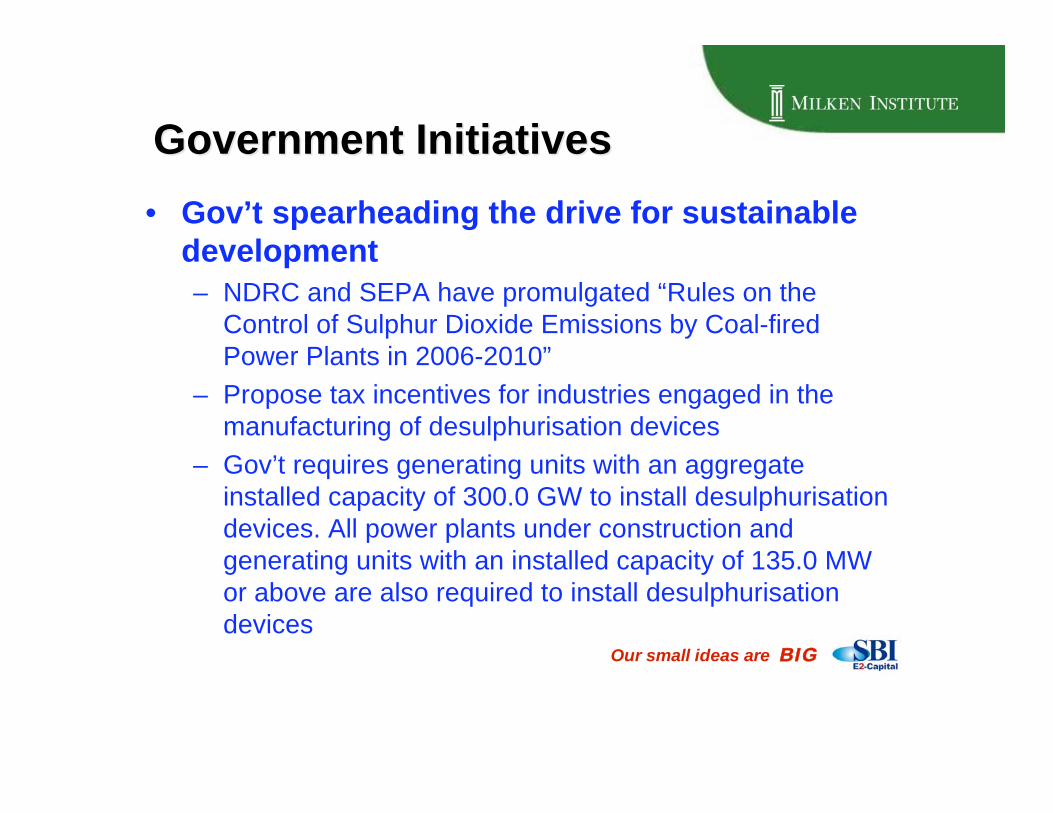
Government InitiativesGovernment Initiatives
• Gov’t spearheading the drive for sustainabledevelopment
– NDRC and SEPA have promulgated “Rules on theControl of Sulphur Dioxide Emissions by Coal-firedPower Plants in 2006-2010”
– Propose tax incentives for industries engaged in themanufacturing of desulphurisation devices
– Gov’t requires generating units with an aggregateinstalled capacity of 300.0 GW to install desulphurisationdevices. All power plants under construction andgenerating units with an installed capacity of 135.0 MWor above are also required to install desulphurisationdevices
Our small ideas are BIG
Corporates Benefiting From Initiatives• Corporates who ride on government initiatives and
policies to provide solutions enjoy favorablemarket valuations :– Municipal and industrial wastewater treatment – Asia
Environment, Asia Water, Epure, Bio-Treat, Hyflux,Dayen, Sinomem
– Provision of clean water supply – Asia Environment,Asia Water, Hyflux
– Proper handling of solid waste – Zhonghui, Lo’s Enviro-Pro, China Everbright
– Handling of gaseous waste – Sunpower, Sino-Environment
– Provision of alternate energy sources, eg bio-mass –China Enersave, Asia Power
– Typically with earning multiples trading between 30-50x,much higher than market average of 20x
Our small ideas are BIG

Alternative Energy• Support for alternative energy
– Gov’t issued the “Renewable energy act” on 1 January 2007,which stipulates that power generated by renewable energysources should enjoy higher tariffs than coal-fired power
– Tax breaks to alternative energy related industries– Encourage the development of substitutive/ alternative energy
sources, especially in areas of high power demand– Ministry of Finance, NDRC, Ministry of Agriculture, State Forestry
Administration and State Administration of Taxation have recentlytogether published the “Opinions on favourable taxation policies tosupport the development of biomass energy”
• Hurdles– With rich coal resources, China has been slow to pursue other
options– Equipment industry for alternative energy in China is
underdeveloped– Supporting policies difficult to implement due to diverging interests– Market is nascent, and more mechanisms need to be developed
Our small ideas are BIG

Alternative Energy
• Expand share of alternative energy– Current new energy capacity still largely coal-fired, accounting
for 75% of of all new capacity approved in 2006, the other 25%being mostly hydropower
– Alternative energy includes Nuclear Power, Solar Power, SolidWaste also being commissioned and coming on-stream mostlybetween 2010-2020
– By 2010, China aims to increase the proportion of renewableenergy in its total energy consumption to 10.0%, from 7.0% in2005, and further to 16.0% in 2020
– Enhance energy efficiency– By 2010, Gov’t plans to reduce energy consumption per unit of
GDP by 20.0%, to 0.98 tons of standard coal per RMB100,000of GDP
Our small ideas are BIG
Alternative Energy
• Hydropower– Rich reserves
• Theoretical hydropower reserves are estimated at 676.0 GW,technologically feasible at 483.0 GW and economically feasible at378.0 GW
• Hydropower capacity increased 9.5% YoY to 128.6 GW in 2006and accounted for 20.7% of the country’s total installed capacity
– Expansion• By 2010, the Chinese government aims to boost the country’s
installed hydropower capacity to 190.0 GW• In 2006, NDRC approved the construction of 13 hydropower
projects with a total installed capacity of 19.5 GW• Hydropower projects with a capacity of 90.0 GW were under
construction at end-2006
– Hurdles• Major funding requirements• Relocation of riverside residents and environmental protection
Our small ideas are BIG
Alternative Energy
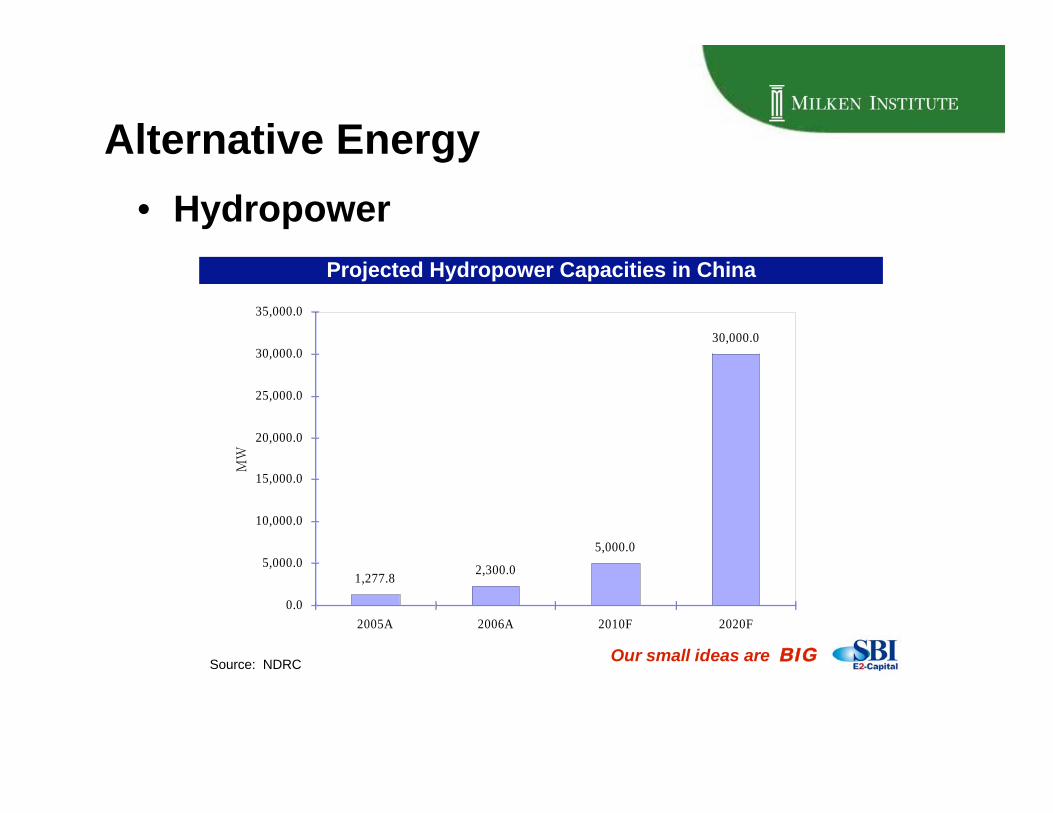
• Hydropower
Projected Hydropower Capacities in China
Source: NDRC
1,277.82,300.0
5,000.0
30,000.0
0.0
5,000.0
10,000.0
15,000.0
20,000.0
25,000.0
30,000.0
35,000.0
2005A 2006A 2010F 2020F
Our small ideas are BIG
Alternative Energy
• Nuclear– Supply growth
• 3 nuclear power stations in Qinshan, Daya Bay andShenzhen Lingao (total 7,850MW and 1.3% of China’spower generation capacity)
• Two generating units at Lianyungang TianwanNuclear Power Plant with a capacity of 1,000.0 MWeach are expected to come on stream in 2007
• Gov’t aims to increase the country’s installed nuclearpower capacity to 12,000.0 MW by the end of 2010and 40,000.0 MW by 2020
– Immature domestic technology• Still rely on imported technologies from Russia,
France and CanadaOur small ideas are BIG
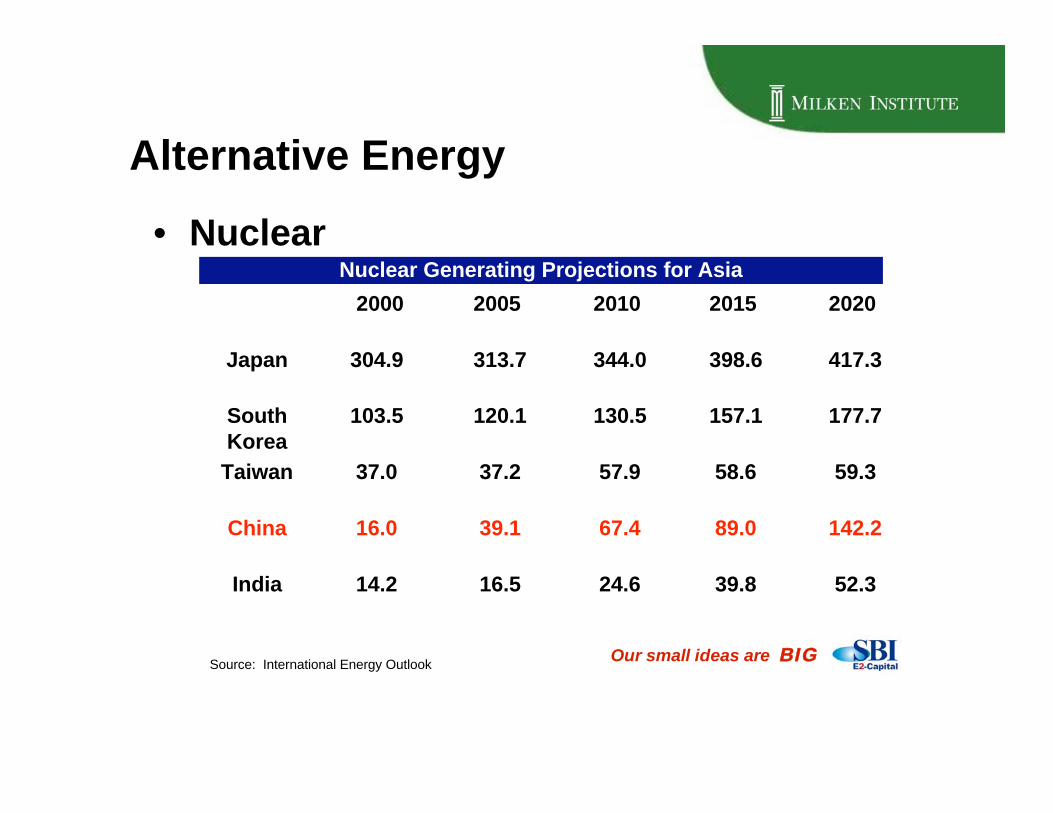
Alternative Energy
• NuclearNuclear Generating Projections for Asia
Source: International Energy Outlook
52.339.824.616.514.2India
142.289.067.439.116.0China
59.358.657.937.237.0Taiwan
177.7157.1130.5120.1103.5SouthKorea
417.3398.6344.0313.7304.9Japan
2020201520102005 2000
Our small ideas are BIG
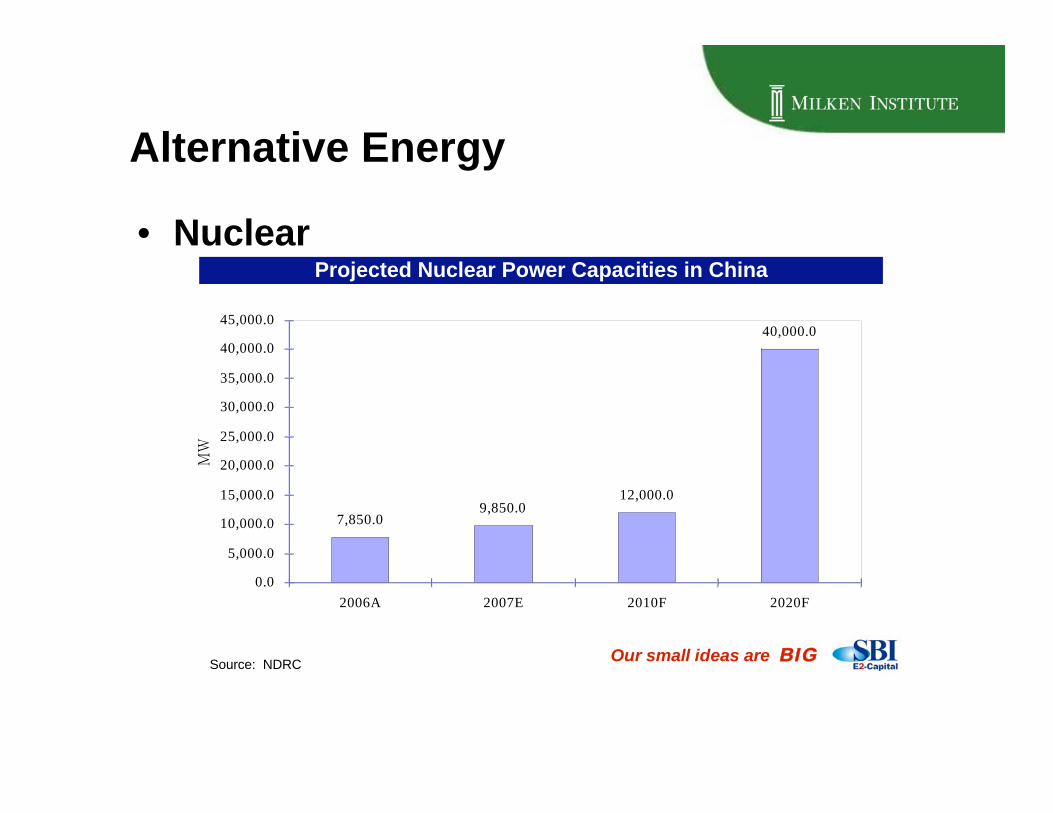
Alternative Energy
• NuclearProjected Nuclear Power Capacities in China
Source: NDRC
7,850.09,850.0
12,000.0
40,000.0
0.0
5,000.0
10,000.0
15,000.0
20,000.0
25,000.0
30,000.0
35,000.0
40,000.0
45,000.0
2006A 2007E 2010F 2020F
Our small ideas are BIG
Alternative Energy
• Wind power– Expansion
• Onshore wind power resources are estimated at 253.0 GW
• At the end of 2006, China had 80 wind plants with an installedcapacity of 2,300.0 MW, up 80.0% from end-2005
• Country expects to boost to 5,000.0 MW by 2010, and30,000.0 MW by 2020 by building 30 wind plants at 100.0 MWeach in Inner Mongolia, Hebei, Jiangsu and Gansu
– Hurdles• Wind power is expected to become the most popular power
source as the investment costs decrease
• Between January and September 2006, China imported 481wind power generators for a total of US$175.7m and exported3,507 units of wind power equipment for US$2.5m
Our small ideas are BIG

Alternative Energy• Solid waste fuel energy
– Solving two problems• China has 668 cities with high population density and high
resource consumption rates• Average refuse amount per capita in China’s first and
second tier cities reached 440.0 kg per annum and the totalsolid waste withdrawal reached 150.0m tons per day
• Refuse withdrawal is expected to increase at an averageannual rate of 10.0% in the next few years, with 80.0- 90.0%of solid waste coming from first and second tier cities
– Favourable policy• Solid waste-fuelled power producers in China usually have
BOT agreements with local governments (around 25 years)• Conditions typically stipulate that city governments must
purchase electricity from power producers at a contractualprice and feed their generating units with a designatedamount of solid waste at the designated quality on a periodicbasis free of charge
Our small ideas are BIG
Alternative Energy• Solar energy
– Status• Theoretical solar power reserves equivalent to 1,700b
tons of standard coal• Average yield of radiation per annum in most regions
exceeds 4.0 KW/sq.m and can reach as high as 7.0KW/sq.m. in Tibet
– Issues• China’s solar energy industry lags behind developed
countries by 10-15 years. The country’s solar cellproduction capacity was 200.0 MW at end-2005 and 300.0MW at end-2006
• Between 2010 and 2020, solar power generation in Chinais expected to shift from an independent PV power systemto power stations, with the total capacity of solargenerating units increasing to 300.0 MW by 2010 and1,800.0 MW by 2020.
Our small ideas are BIG
Alternative Energy
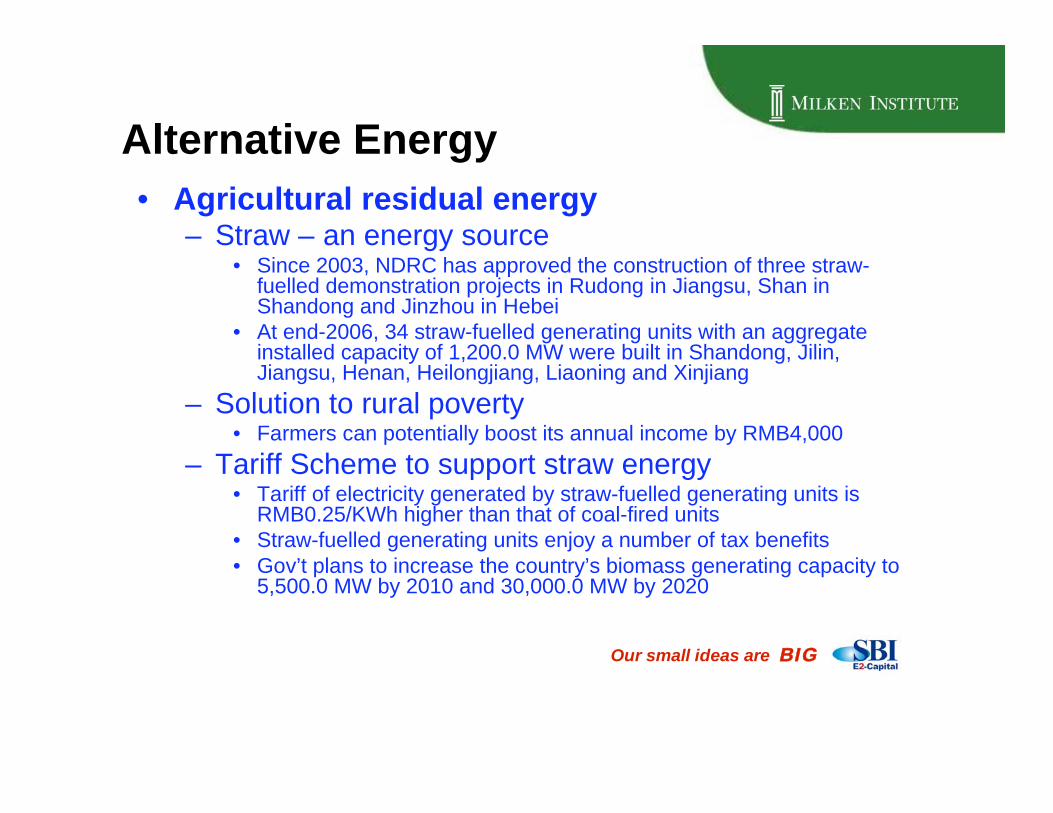
• Agricultural residual energy– Straw – an energy source
• Since 2003, NDRC has approved the construction of three straw-fuelled demonstration projects in Rudong in Jiangsu, Shan inShandong and Jinzhou in Hebei
• At end-2006, 34 straw-fuelled generating units with an aggregateinstalled capacity of 1,200.0 MW were built in Shandong, Jilin,Jiangsu, Henan, Heilongjiang, Liaoning and Xinjiang
– Solution to rural poverty• Farmers can potentially boost its annual income by RMB4,000
– Tariff Scheme to support straw energy• Tariff of electricity generated by straw-fuelled generating units is
RMB0.25/KWh higher than that of coal-fired units• Straw-fuelled generating units enjoy a number of tax benefits• Gov’t plans to increase the country’s biomass generating capacity to
5,500.0 MW by 2010 and 30,000.0 MW by 2020
Our small ideas are BIG

Alternative Energy
• Natural gas– Status
• China plans to expand its natural gas-fuelled installedcapacity from about 10,000.0 MW now to 36,000.0 MWby 2010
– Issues• Utilization hours at the country’s gas-fuelled generating
units remain low, because of unstable supply• Gov’t plans to build more gas receiving stations• Another problem is China’s low controlled gas price
and a gap between the domestic and international gasprice, which discourages imports
Our small ideas are BIG