Embed Size (px)
Citation preview
PREPARATION OF GRAPHENE QUANTUM DOTS AS A GREEN PHOTOSENSITIZER AND ITS
APPLICATION IN DYE-SENSITIZED SOLAR CELL
GOLNOUSH ZAMIRI
INSTITUTE OF GRADUATE STUDIES
UNIVERSITY OF MALAYA KUALA LUMPUR
2018
Univers
ity of
Mala
ya

PREPARATION OF GRAPHENE QUANTUM DOTS AS A GREEN PHOTOSENSITIZER AND ITS
APPLICATION IN DYE-SENSITIZED SOLAR CELL
GOLNOUSH ZAMIRI
DISSERTATION SUBMITTED IN FULFILMENTOF
THE REQUIREMENTSFOR THE DEGREE OF DOCTOR OF PHILOSOPHY
INSTITUTE OF GRADUATE STUDIES UNIVERSITY OF MALAYA
KUALA LUMPUR
2018
Univers
ity of
Mala
ya
ii
UNIVERSITY OF MALAYA
ORIGINAL LITERARY WORK DECLARATION
Name of Candidate: GOLNOUSH ZAMIRI
Matric No: HHC140008
Name of Degree: DOCTOR OF PHILOSOPHY
Title of Dissertation: PREPARATION OF GRAPHENE QUANTUM DOTS AS A
GREEN PHOTOSENSITIZER AND ITS APPLICATION IN DYE-SENSITIZED
SOLAR CELL
Field of Study: NANOTECHNOLOGY
I do solemnly and sincerely declare that:
(1) I am the sole author/writer of this Work; (2) This Work is original; (3) Any use of any work in which copyright exists was done by way of fair
dealing and for permitted purposes and any excerpt or extract from, or reference to or reproduction of any copyright work has been disclosed expressly and sufficiently and the title of the Work and its authorship have been acknowledged in this Work;
(4) I do not have any actual knowledge nor do I ought reasonably to know that the making of this work constitutes an infringement of any copyright work;
(5) I hereby assign all and every right in the copyright to this Work to the University of Malaya (“UM”), who henceforth shall be the owner of the copyright in this Work and that any reproduction or use in any form or by any means whatsoever is prohibited without the written consent of UM having been first had and obtained;
(6) I am fully aware that if in the course of making this Work, I have infringed any copyright whether intentionally or otherwise, I may be subject to legal action or any other action as may be determined by UM.
Candidate’s Signature Date:
Subscribed and solemnly declared before,
Witness’s Signature Date:
Name:
Designation:
Univers
ity of
Malaya
iii
PREPARATION OF GRAPHENE QUANTUM DOTS AS A GREEN PHOTOSENSITIZER AND ITS APPLICATION IN DYE-
SENSITIZED SOLAR CELL
ABSTRACT
The increasing incidence of global warming provides the impetus for research in
alternative green renewable energy sources, such as tidal, geothermal, biomass, wind,
and solar energy. Among these options, solar energy is of great interest due to its
inherent abundance. Currently, commercially produced solar cells are based on silicon
technology, which is very expensive due to the high production costs. An alternative to
the conventional Si solar cell is the Dye-Sensitized Solar Cells (DSSCs), which is
currently being actively explored. The commonly used dyes for a photosensitizer in
DSSCs are ruthenium-based complexes. To improve the performances of DSSCs and to
increase their commercial attractiveness, cheap, colorful, stable, and highly efficient
ruthenium-free dyes needs to be developed due to ruthenium-based dyes are quite rare.
An alternative to dye-type sensitizers are quantum dots (QDs). QDs are interesting due
to their intrinsic properties. The band gap varies with size, therefore, absorption and
redox properties can be tuned by the synthesis of QDs. Zero-dimensional graphene
quantum dots (GQDs) consist of single- or few-layer graphene with a size less than
100nm and stand for a new type of QDs with unique properties combining the graphene
nature and size-resulted quantum effects. GQDs possess unique optical and electronic
properties, and in particular possess a band-gap less than 2.0 eV because of quantum
confinement and edge effects. In this study, we synthesized GQDs from graphene oxide
(GO) by using the hydrothermal method. We investigated the performance of DSSCs
using different thicknesses of TiO2 and ZnO nanoparticles as photo-anodes and the as-
prepared GQD as a green photosensitizer. The I-V test results indicate that the
performance of DSSCs is improved by increasing the thickness of the photo-anode and
the thickness of 40 μm shows the highest efficiency for both DSSC devices based on
Univers
ity of
Mala
ya
iv
TiO2 and ZnO nanoparticles photo-anodes. The DSSCs using TiO2 and ZnO
nanoparticles as photo-anodes with thickness of 40 μm show almost same efficiency
when we replaced N-719 with GQDs which is confirmed that using GQDs as an
alternative to ruthenium based dyes is a new approach for DSSCs.
Keywords: Graphene quantum dots, Green photosensitizer, Dye-densitized solar cell,
Solar cell fabrication
Univers
ity of
Mala
ya
v
PENYEDIAAN DARI TANAH GRAPHENE QUANTUM SEBAGAI
PHOTOSENSITISER HIJAU DAN APLIKASI ITU DALAM SELAR SELAR-
SENSITIS
ABSTRAK
Insiden meningkatkan pemanasan global menjadi penggerak untuk penyelidikan
dalam sumber tenaga boleh diperbaharui alternatif hijau, seperti pasang surut, panas
bumi, biomas, angin, dan tenaga solar.Antara pilihan ini, tenaga solar sangat menarik
kerana banyak yang wujud itu. Pada masa ini, sel-sel solar yang dihasilkan secara
komersial adalah berdasarkan kepada teknologi silikon, yang sangat mahal kerana kos
pengeluaran yang tinggi. Satu alternatif kepada Si sel solar konvensional adalah Sel
Solar Dye-sensitif (DSSCs), yang kini sedang giat diterokai.Pewarna yang biasa
digunakan untuk photosensitizer dalam DSSCs adalah kompleks berasaskan
ruthenium.Untuk meningkatkan prestasi DSSCs dan untuk meningkatkan daya tarikan
komersial mereka, murah, pewarna ruthenium bebas berwarna-warni, stabil, dan sangat
berkesan perlu dibangunkan kerana pewarna berasaskan ruthenium-agak jarang
berlaku.Satu alternatif kepada pewarna-jenis memeka adalah titik kuantum (QDs).QDs
adalah menarik kerana sifat intrinsik mereka.Jurang band berbeza dengan saiz, oleh itu,
penyerapan dan redoks hartanah boleh ditala oleh sintesis QDs. Zero dimensi titik
graphene kuantum (GQDs) terdiri daripada tunggal atau beberapa lapisan graphene
dengan saiz yang kurang daripada 100 nm dan berdiri untuk jenis baru QDs dengan ciri-
ciri unik yang menggabungkan sifat graphene dan kesan kuantum saiz menyebabkan.
GQDs memiliki sifat-sifat optik dan elektronik yang unik, dan khususnya memiliki
memberikan nilai jurang yang kurang daripada 2.0 eV kerana kesan pantang dan
kelebihan kuantum.Dalam kajian ini, kami disintesis GQDs daripada oksida graphene
dengan menggunakan kaedah hidroterma. Kami menyiasat prestasi DSSCs
Univers
ity of
Mala
ya
vi
menggunakan thichnesses berbeza TiO2 dan ZnO nanopartikel sebagai photo-anodes
dan GQD as-disediakan sebagai photosensitizer hijau. Keputusan ujian I-V
menunjukkan bahawa prestasi DSSCs diperbaiki dengan meningkatkan ketebalan
photo-anode dan ketebalan 40 mikron menunjukkan kecekapan yang paling tinggi bagi
kedua-dua peranti DSSC berdasarkan TiO2 dan ZnO nanopartikel photo-anodes. The
DSSCs menggunakan TiO2 dan ZnO nanoparticls sebagai photo-anodes dengan
ketebalan 40 mikron menunjukkan kecekapan hampir sama apabila kami menggantikan
N-719 dengan GQDs yang disahkan bahawa menggunakan GQDs sebagai alternatif
kepada ruthenium pewarna berasaskan adalah satu pendekatan baru untuk DSSCs.
Kata kunci: Titik kuantum graphene, fotosensitizer Hijau, Sel suria bertekanan suria,
fabrikasi sel Suria
Univers
ity of
Mala
ya

vii
ACKNOWLEDGEMENTS
My sincere gratitude goes to my supervisors, Dr. Samira Bagheri and Late Prof Dr.
Sharifah Bee Abd Hamid for their constant guidance, valuable advice, and inspiration
throughout the progress of this project. Without the direct support and persistent
involvement from them in this work, the completion of this research and thesis would
not have been an easy task.
I wish to express my special thanks for the financial support from University of
Malaya Grand Challenge Grant (Grant No. GC001A-14AET) and University of Malaya
Postgraduate Research Grant (Grant No. PG058-2015B).
Last but not least, I wish to thank my beloved parents, my brothers and my sister for
their love and unconditional support. Also to my friends, I am very grateful for your
continuous unflinching support.
Univers
ity of
Mala
ya

viii
TABLE OF CONTENTS
Abstract ........................................................................................................................... iii
Abstrak ............................................................................................................................. v
Acknowledgements ........................................................................................................ vii
Table of Contents ......................................................................................................... viii
List of Figures ............................................................................................................... xiii
List of Tables ............................................................................................................... xvii
CHAPTER 1: INTRODUCTION .................................................................................. 1
Research Background .............................................................................................. 1
1.1.1 Photovoltaic Technology ............................................................................ 2
1.1.1.1 Solar Cell Terminologies ............................................................ 2
1.1.1.2 Short-circuit Current ................................................................... 3
1.1.1.3 Open-circuit Voltage ................................................................... 3
1.1.1.4 Fill Factor .................................................................................... 4
1.1.1.5 Efficiency .................................................................................... 4
1.1.1.6 Quantum Efficiency .................................................................... 5
1.1.2 Photovoltaic generation .............................................................................. 5
1.1.3 Dye-sensitized solar cells ........................................................................... 6
1.1.3.1 Structure and mechanism of dye-sensitized solar cells ............... 8
1.1.4 Graphene quantum dots .............................................................................. 9
1.1.4.1 Advantages of graphene quantum dots ..................................... 10
1.1.4.2 Quantum confinement ............................................................... 11
Problem statement ................................................................................................. 12
Research Scopes .................................................................................................... 13
Research Objectives............................................................................................... 14
Univers
ity of
Mala
ya
ix
Organization of Thesis ........................................................................................... 16
CHAPTER 2: LITERATURE REVIEW .................................................................... 17
Photovoltaics.......................................................................................................... 17
2.1.1 Silicon solar cells ...................................................................................... 18
2.1.2 Thin film technologies .............................................................................. 18
2.1.3 Organic solar cells .................................................................................... 19
2.1.4 Quantum dot solar cells ............................................................................ 19
2.1.5 Perovskite solar cells ................................................................................ 19
2.1.6 Dye Sensitized Solar Cells ....................................................................... 19
Comparison of Different photovoltaic devices ...................................................... 20
Basic principles of Dye Sensitized Solar Cells...................................................... 21
2.3.1 Absorption of light ................................................................................... 22
2.3.2 Charge separation ..................................................................................... 23
2.3.3 Charge transport ....................................................................................... 24
2.3.4 Recombination .......................................................................................... 26
DSSCs components ............................................................................................... 26
2.4.1 Transparent conducting oxide-coated glass substrate in DSSCs .............. 27
2.4.2 Photo-anodes in DSSCs ............................................................................ 28
2.4.3 Photosensitizers in DSSCs ....................................................................... 34
2.4.3.1 Anchoring group of photosensitizers ........................................ 34
2.4.3.2 Dye Molecules ........................................................................... 35
2.4.4 Counter electrodes in DSSCs ................................................................... 39
2.4.5 Electrolytes in DSSCs .............................................................................. 41
Graphene ................................................................................................................ 42
2.5.1 Synthesis of graphene quantum dots ........................................................ 44
2.5.1.1 Top-down methods .................................................................... 45
Univers
ity of
Mala
ya
x
2.5.1.2 Bottom-up Methods ................................................................... 45
2.5.2 Application of graphene quantum dots in photovoltaics .......................... 45
CHAPTER 3: MATERIALS AND CHEMICALS .................................................... 51
Materials ................................................................................................................ 51
Synthesis and characterization of transition metal oxide nanoparticles ................ 51
Dye Solution .......................................................................................................... 53
3.3.1 Synthesis and characterization of graphene oxide.................................... 53
3.3.2 Synthesis and characterization of graphene quantum dots ....................... 54
Fabrication of DSSCs ............................................................................................ 55
3.4.1 TMO nanoparticles coating on FTO glass by the Dr. Blade method ....... 56
3.4.2 Preparation of counter electrode ............................................................... 56
Material characterization technique ....................................................................... 58
3.5.1 X-ray powder diffraction .......................................................................... 58
3.5.2 Fourier Transform Infrared Spectroscopy ................................................ 59
3.5.3 Field Emission Scanning Electron Microscopy ....................................... 59
3.5.4 Photoluminescence spectroscopy ............................................................. 60
3.5.5 UV-Visible Spectrophotometry ................................................................ 61
3.5.6 Raman Spectroscopy ................................................................................ 61
3.5.7 Brunauer-Emmett-Teller (BET) Surface Area Analysis .......................... 62
3.5.8 High Resolution Transmission Electron Microscopy .............................. 62
Photovoltaic performance ...................................................................................... 62
3.6.1 Current-voltage characteristics ................................................................. 62
3.6.2 Incident photon to current conversion efficiency ..................................... 63
3.6.3 Electrochemical Impedance Spectroscopy ............................................... 64
CHAPTER 4: RESULTS AND DISCUSSION .......................................................... 65
Univers
ity of
Mala
ya

xi
Material characterization ....................................................................................... 65
4.1.1 Characterization of TiO2 nanoparticles..................................................... 65
4.1.2 Characterization of ZnO nanoparticles ..................................................... 71
4.1.3 Characterization of GQDs ........................................................................ 76
Characterization of DSSCs based on TiO2 photo-anode ....................................... 80
4.2.1 Effect of different immersion time in GQDs on PCE in DSSCs based on
TiO2 photo-anode ...................................................................................... 80
4.2.2 FESEM images of TiO2 photo-anode with different thicknesses ............. 81
4.2.3 Effect of TiO2 photo-anode with different thicknesses on PCE in DSSCs
using N-719 as photosensitizer ................................................................. 82
4.2.4 Effect of TiO2 photo-anode with different thicknesses on PCE in DSSCs
using GQDs as photosensitizer ................................................................. 85
Characterization of DSSCs based on ZnO photo-anode........................................ 88
4.3.1 Effect of different immersion time in GQDs on PCE in DSSCs based on
ZnO photo-anode ...................................................................................... 88
4.3.2 FESEM images of ZnO photo-anode with different thicknesses ............. 89
4.3.3 The effect of ZnO photo-anode with different thicknesses on PCE in
DSSCs using N-719 as photosensitizer .................................................... 90
4.3.4 The effect of ZnO photo-anode with different thicknesses on PCE in
DSSCs using GQDs as photosensitizer .................................................... 93
Characterization of DSSCs based on 4-Layers TiO2 photo-anode using GQDs as a
photosensitizer and N-719 as a photosensitizer ..................................................... 97
Characterization of DSSCs based on 4-Layes ZnO photo-anode using GQDs as a
photosensitizer and N-719 as a photosensitizer ................................................... 102
Characterization of dye-sensitized solar cells based on GQDs as a photosensitizer
using 4-Layers TiO2 and ZnO photo-anodes ....................................................... 107
Univers
ity of
Mala
ya

xii
CHAPTER 5: CONCLUSION ................................................................................... 113
CONCLUSION ................................................................................................... 113
Recommendations for future work ...................................................................... 114
REFERENCES ............................................................................................................ 115
List of Publications and Papers Presented ............................................................... 133
Univers
ity of
Mala
ya

xiii
LIST OF FIGURES
Figure 1.1: Consumption of the fossil fuel in the world from 1965 to 2030 (Shafiee and Topal, 2009) ...................................................................................................................... 1
Figure 1.2: Equivalent circuit of an ideal solar cell (Khan, 2013) .................................... 2
Figure 1.3: Typical current-voltage relationship of a solar cell (Khan, 2013) .................. 4
Figure 1.4: DSSCs were fabricted by Dyesol, Oxford PV and power plastic on market (Dong, 2013) ..................................................................................................................... 7
Figure 1.5: Schematic of the interior of a DSSC (Ni, et al., 2006) ................................... 8
Figure 1.6: Schematic illustration of a DSSC (Ellis, 2014a) ............................................ 9
Figure 1.7: Images of different sized GQDs in water under (a) white and (b) UV illumination (b). (c) Dependence of the band gap as a function of the GQD size (Li, et al., 2010).......................................................................................................................... 11
Figure 1.8: Flowchart of fabricating DSSCs ................................................................... 15
Figure 2.1: Schematic illustration of a silicon solar cell (Ellis, 2014b) .......................... 17
Figure 2.2: Typical structure and operation of a DSSC (Grätzel, 2005) ........................ 22
Figure 2.3: Charge transfer processes between the dye and the TiO2 lattice: 1. MLCT excitation; 2. Electron injection; 3. Charge recombination (Halme, 2002) .................... 23
Figure 2.4: Schematic illustration of trap-limited charge transport in a dye sensitized semiconductor nanoparticle (Griffith, 2012)................................................................... 25
Figure 2.5: A schematic illustration of the two possible charge recombination pathways in DSSCs following injection from the photo-excited dye state (S*) (Grätzel, 2005) .... 26
Figure 2.6: Triangular sublattices of graphene. Each atom in one sublattice (A) has 3 nearest neighbors in sublattice (B) and vice-versa (Cooper, et al., 2012) ...................... 43
Figure 2.7:Image of GQDs (Chua, et al., 2015) .............................................................. 44
Figure 3.1: Preparation of TMO nanoparticles ............................................................... 52
Figure 3.2: Synthesis of GO by modified Hummer's method ......................................... 54
Figure 3.3: Preparation of GQDs via hydrothermal method ........................................... 55
Figure 3.4: Fabrication process of TMO nanoparticles films ......................................... 56
Univers
ity of
Mala
ya
xiv
Figure 3.5: Fabrication process of TMO nanoparticles films ......................................... 57
Figure 3.6: Schematic view of DSSC ............................................................................. 58
Figure 3.7: Schematic of the working principle of FESEM............................................ 60
Figure 3.8: Schematic of the working principle of PL spectroscopy .............................. 61
Figure 4.1: FTIR spectrum of TiO2 nanoparticles .......................................................... 66
Figure 4.2: XRD pattern of TiO2 nanoparticles .............................................................. 67
Figure 4.3: Raman spectrum of TiO2 nanoparticles ........................................................ 68
Figure 4.4:TEM images of TiO2 nanoparticles ............................................................... 69
Figure 4.5: UV-Visible spectrum of TiO2 nanoparticles. ............................................... 70
Figure 4.6: Nitrogen adsorption-desorption of TiO2 nanoparticles ................................ 71
Figure 4.7: XRD spectrum of ZnO nanoparticles ........................................................... 72
Figure 4.8: FTIR spectrum of ZnO nanoparticles ........................................................... 73
Figure 4.9: Raman spectrum of ZnO nanoparticles ........................................................ 74
Figure 4.10: TEM images of ZnO nanoparticles ............................................................ 74
Figure 4.11: UV-Vis spectrum of ZnO nanoparticles ..................................................... 75
Figure 4.12: Nitrogen adsorption-desorption of ZnO nanoparticles ............................... 76
Figure 4.13: FTIR spectra of GO and GQDs .................................................................. 77
Figure 4.14: Raman spectrum of GQDs .......................................................................... 78
Figure 4.15: UV-Visible spectrum of GQDs .................................................................. 78
Figure 4.16: Photoluminescence spectrum of GQD ....................................................... 79
Figure 4.17: HRTEM images of GQDs .......................................................................... 79
Figure 4.18: Current-voltage (I-V) Curves of DSSCs based on TiO2 photo-anode with different immersion time in GQDs as a photosensitizer ................................................. 80
Figure 4.19: FESEM images of TiO2 photo-anode with different thicknesses ............... 82
Univers
ity of
Mala
ya
xv
Figure 4.20: The typical current-voltage (I-V) Curves of DSSCs based on TiO2 photo-anodes with different thicknesses and using N-719 as a photosensitizer........................ 83
Figure 4.21: IPCE Curves of DSSCs using TiO2 photo-anodes with different thicknesses and using GQDs as a photosensitizer .............................................................................. 85
Figure 4.22: Current-voltage (I-V) Curves of DSSCs using TiO2 photo-anodes with different thicknesses and using GQDs as a photosensitizer ............................................ 86
Figure 4.23: IPCE Curves of DSSCs sensitized by TiO2 photo-anodes with different thicknesses and using GQDs as a photosensitizer .......................................................... 87
Figure 4.24: Current-voltage (I-V) Curves of DSSCs based on ZnO photo-anode with different immersion time in GQDs as a photosensitizer ................................................. 88
Figure 4.25: FESEM images of ZnO photo-anode with different thicknesses ............... 90
Figure 4.26: Current-voltage (I-V) Curves of DSSCs using ZnO photo-anodes with different thicknesses and N-719 as a photosensitizer ..................................................... 91
Figure 4.27: IPCE Curves of DSSCs sensitized by ZnO photo-anodes with different thicknesses and using N-719 as a photosensitizer........................................................... 93
Figure 4.28: Current-voltage (I-V) Curves of DSSCs using ZnO photo-anodes with different thicknesses and GQDs as a photosensitizer ..................................................... 94
Figure 4.29: IPCE Curves of DSSCs using ZnO photo-anodes with different thicknesses and GQDs as a photosensitizer ....................................................................................... 95
Figure 4.30: Vacuum energy level of TiO2 nanoparticles, N-719 and GQDs ................ 97
Figure 4.31: PL spectra of photo-anodes based on TiO2 photo-anode immersed in N-719 and GQDs as photosensitizers ......................................................................................... 98
Figure 4.32: Current-voltage (I-V) curves of DSSCs devices based on TiO2 nanoparticles using N-719 as a photosensitizer and GQDs as a photosensitizer ............ 99
Figure 4.33: Nyquist plots of EIS for DSSCs based on TiO2 nanoparticles using N-719 and GQDs as photosensitizer in dark conditions .......................................................... 101
Figure 4.34: IPCE Curves for DSSCs N-719 and GQDs using TiO2 nanoparticles as a photo-anode ................................................................................................................... 102
Figure 4.35: Vacuum energy level of ZnO nanoparticles, N-719 and GQDs ............... 103
Figure 4.36: PL spectra of photo-anodes based on ZnO nanoparticles immersed in N-719 and GQDs as photosensitizers ................................................................................ 104
Univers
ity of
Mala
ya

xvi
Figure 4.37: Current-voltage (I-V) curves of DSSCs devices based on ZnO nanoparticles using N-719 and GQDs as photosensitizer ............................................. 105
Figure 4.38: Nyquist plots of EIS for DSSCs based on ZnO nanoparticles using N-719 and GQDs as photosensitizer in dark condition ............................................................ 106
Figure 4.39: IPCE Curves for DSSCs using N-719 and GQDs a photosensitizers and ZnO nanoparticles as a photo-anode ............................................................................. 107
Figure 4.40: Vacuum energy level of GQDs, TiO2 and ZnO nanoparticles ................. 108
Figure 4.41: PL spectra of photo-anodes based on TiO2 and ZnO nanoparticles immersed in GQDs as a photosensitizer ....................................................................... 109
Figure 4.42: Current-voltage (I-V) curves of DSSCs devices based on GQDs as a photosensitizer using TiO2 and ZnO as photo-anodes .................................................. 110
Figure 4.43: Nyquist plots of EIS for DSSCs based on GQDs as a photosensitizer using TiO2 and ZnO as photo-anodes in dark condition ......................................................... 111
Figure 4.44: IPCE Curves for DSSCs based on TiO2 and ZnO as photo-anodes and GQDs as photosensitizer ............................................................................................... 112
Univers
ity of
Mala
ya
xvii
LIST OF TABLES
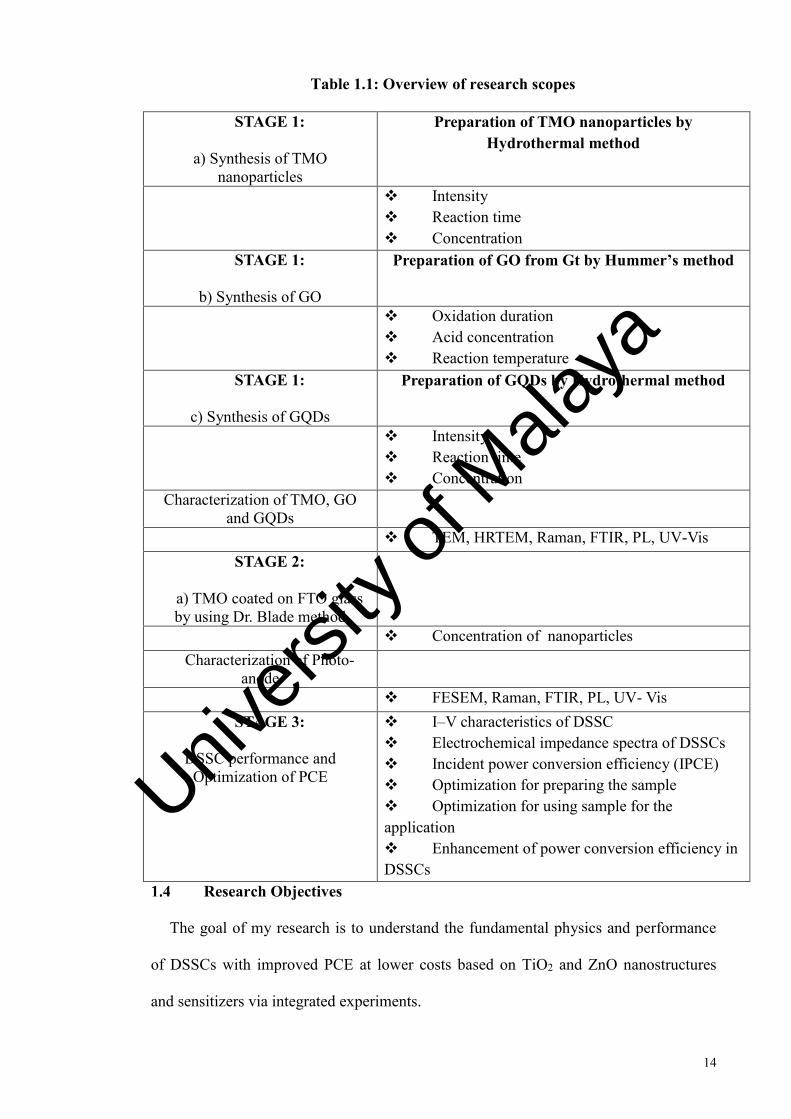
Table 1.1: Overview of research scopes ......................................................................... 14
Table 2.1: Performance of photovoltaic and photoelectrochemical solar cells .............. 21
Table 2.2: Efficiency of DSSCs using TiO2 nanostructures as a photo-anode ............... 30
Table 2.3: Efficiency of DSSCs using ZnO nanostructures as a photo-anode ................ 33
Table 2.4:Efficiency of DSSCs using different photosensitizer ..................................... 39
Table 4.1: Characteristic peaks of TiO2 nanoparticles .................................................... 66
Table 4.2: Raman peaks of TiO2 nanoparticles ............................................................... 67
Table 4.3:Characteristic peaks of ZnO nanoparticles ..................................................... 72
Table 4.4: Raman peaks of ZnO nanoparticles ............................................................... 73
Table 4.5: Characteristic peaks of GQDs ........................................................................ 77
Table 4.6: Raman peaks of GQDs................................................................................... 77
Table 4.7: Photovoltaic Characteristics of DCCS devices based on TiO2 nanoparticles with different immersion time in GQDs as a photosensitizer ......................................... 81
Table 4.8: Photovoltaic Characteristics of DCCSs devices based on TiO2 nanoparticles with different thicknesses and using N-719 as a photosensitizer .................................... 84
Table 4.9: Photovoltaic Characteristics of DCCSs devices based on TiO2 nanoparticles with different thicknesses by using GQDs as a photosensitizer ..................................... 87
Table 4.10: Photovoltaic Characteristics of DSSCs devices based on ZnO nanoparticles with different immersion time in GQDs as a photosensitizer ......................................... 89
Table 4.11: Photovoltaic Characteristics of DCCSs devices based on ZnO nanoparticles with different thicknesses and using N-719 as a photosensitizer .................................... 92
Table 4.12: Photovoltaic Characteristics of DSSCs devices based on ZnO nanoparticles with different thicknesses and using GQDs as a photosensitizer .................................... 95
Table 4.13: Photovoltaic Characteristics of DSSCs devices based on TiO2 nanoparticles using N-719 and GQDs as photosensitizer ..................................................................... 99
Table 4.14: Photovoltaic Characteristics of DCCSs devices based on ZnO nanoparticles using N-719 and GQDs as photosensitizer ................................................................... 104
Univers
ity of
Mala
ya

xviii
Table 4.15: Photovoltaic Characteristics of DSSCs devices based on GQDs as a photosensitizer using TiO2 and ZnO as photo-anodes .................................................. 109
Univers
ity of
Mala
ya
xix
LIST OF SYMBOLS AND ABBREVIATIONS
COOH
Si
EPFL
HOMO
LUMO
NIR
HBC
KBr
:
:
:
:
:
:
:
:
Carboxylic group
Silicon
École Polytechnique Fédérale de Lausanne
Highest Occupied Molecular Orbital
Lowest Unoccupied Molecular Orbital
Near infrared
Hexa-peri-hexabenzocoronene
Potassium Bromide
DSSC : Dye Sensitized Solar Cell
EIS : Electrochemical Impedance Spectra
EQE : External Quantum Efficiency
FESEM : Field Emission Scanning Electron Microscopy
FF : Fill factor
FTIR : Fourier Transform Infrared
FTO : Fluorine-dopped Tin Oxide
GNR : Graphene Nanoribon
GQD : Graphene Quantum Dot
HRTEM : High Resolution Transmission Electron Microscopy
IPCE : Incident Photon to Current Conversion Efficiency
ITO : Indium-dopped Tin Oxide
MLCT : Metal-to-Ligand Charge-Transfer
PCE : Power Conversion Efficiency
PL : Photoluminiscent
QD : Quantum Dot
Univers
ity of
Mala
ya

xx
QE : Quantum Efficiency
Ru : Ruthenium
TEM : Transmission Electron Microscopy
TiO2 : Titanium Dioxide
TMO : Transition Metal Oxide
XRD : X-Ray Diffraction
ZnO : Zinc Oxide
Univers
ity of
Mala
ya
1
CHAPTER 1: INTRODUCTION
Research Background
Energy is generated from fossil fuels and nuclear power. The currently limited fossil
fuel resources and its usage, which results in a large amount of carbon dioxide,
increases the greenhouse effect and induces climate change, which is fast becoming a
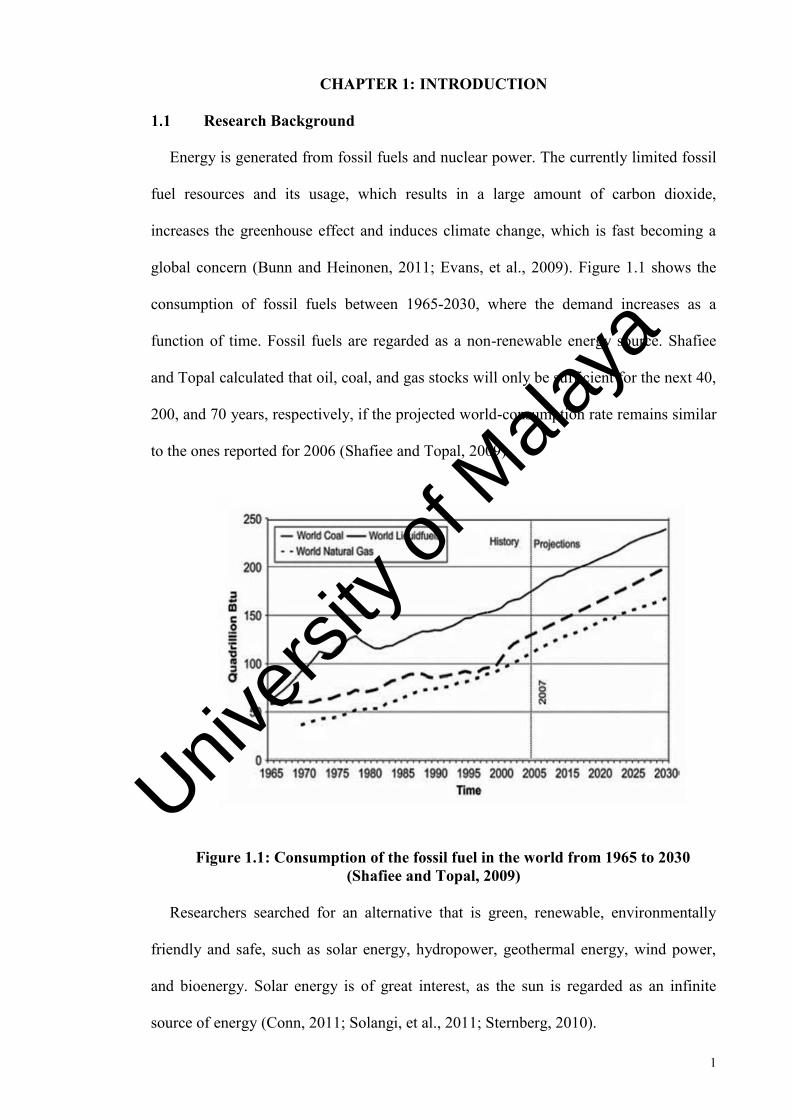
global concern (Bunn and Heinonen, 2011; Evans, et al., 2009). Figure 1.1 shows the
consumption of fossil fuels between 1965-2030, where the demand increases as a
function of time. Fossil fuels are regarded as a non-renewable energy source. Shafiee
and Topal calculated that oil, coal, and gas stocks will only be sufficient for the next 40,
200, and 70 years, respectively, if the projected world-consumption rate remains similar
to the ones reported for 2006 (Shafiee and Topal, 2009).
Figure 1.1: Consumption of the fossil fuel in the world from 1965 to 2030 (Shafiee and Topal, 2009)
Researchers searched for an alternative that is green, renewable, environmentally
friendly and safe, such as solar energy, hydropower, geothermal energy, wind power,
and bioenergy. Solar energy is of great interest, as the sun is regarded as an infinite
source of energy (Conn, 2011; Solangi, et al., 2011; Sternberg, 2010).
Univers
ity of
Mala
ya

2
1.1.1 Photovoltaic Technology
Solar cell, or photovoltaic cell, is an electrical device that converts the incident
photon energy of the solar radiation directly into electricity via the photovoltaic effect.
The photovoltaic effect is the physical and chemical phenomenon that occurs when
photons falls into a semiconductor and generates an electron-hole pair.
A solar cell contains two electrodes: cathode and anode. When light is irradiated,
solar cell builds up a voltage through its electrodes (Ellis, 2014b).The concept of a
photovoltaic device involves charge separation at a junction of two materials with
different conduction mechanism (Grätzel, 2003).
1.1.1.1 Solar Cell Terminologies
A current source in parallel with a forward-biased diode represents an equivalent
circuit of an ideal solar cell. Series and parallel resistances are added to account for
various loss mechanisms. Figure 1.2 shows an equivalent circuit of an ideal solar cell.
Figure 1.2: Equivalent circuit of an ideal solar cell (Khan, 2013)
Univers
ity of
Mala
ya
3
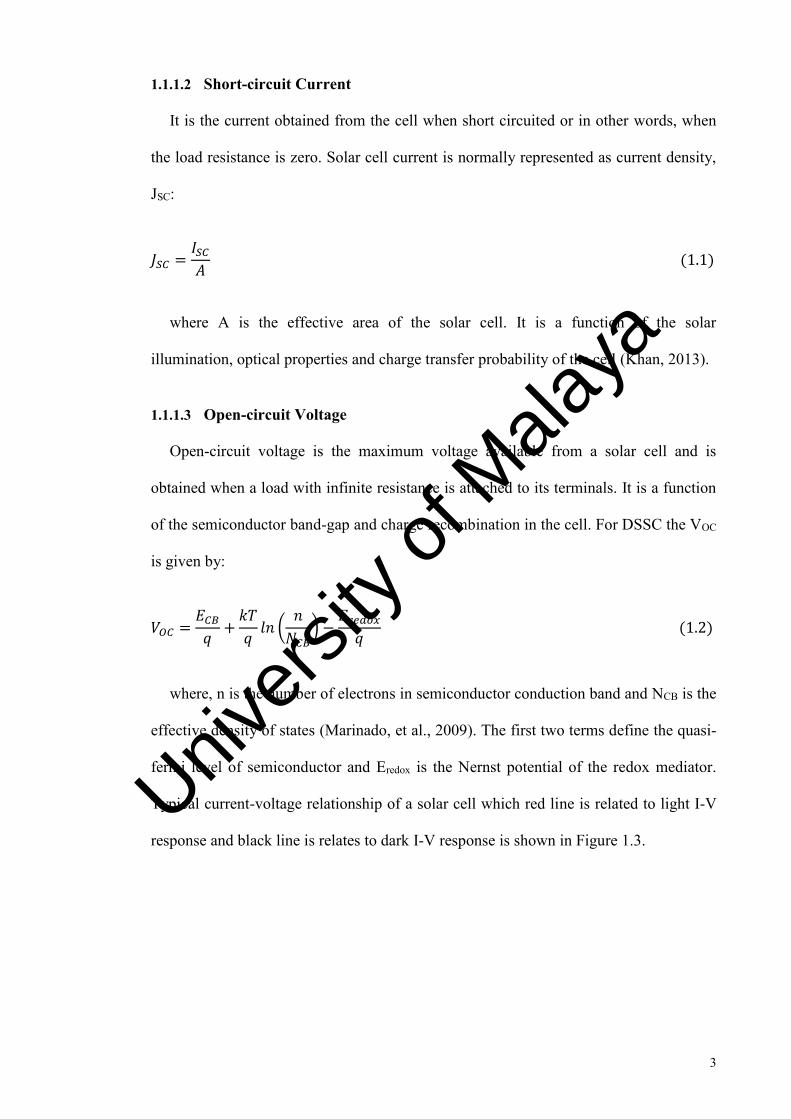
1.1.1.2 Short-circuit Current
It is the current obtained from the cell when short circuited or in other words, when
the load resistance is zero. Solar cell current is normally represented as current density,
JSC:
𝐽𝑆𝐶 =𝐼𝑆𝐶
𝐴 (1.1)
where A is the effective area of the solar cell. It is a function of the solar
illumination, optical properties and charge transfer probability of the cell (Khan, 2013).
1.1.1.3 Open-circuit Voltage
Open-circuit voltage is the maximum voltage available from a solar cell and is
obtained when a load with infinite resistance is attached to its terminals. It is a function
of the semiconductor band-gap and charge recombination in the cell. For DSSC the VOC
is given by:
𝑉𝑂𝐶 =𝐸𝐶𝐵
𝑞+
𝑘𝑇
𝑞𝑙𝑛 (
𝑛
𝑁𝐶𝐵) −
𝐸𝑟𝑒𝑑𝑜𝑥
𝑞 (1.2)
where, n is the number of electrons in semiconductor conduction band and NCB is the
effective density of states (Marinado, et al., 2009). The first two terms define the quasi-
fermi level of semiconductor and Eredox is the Nernst potential of the redox mediator.
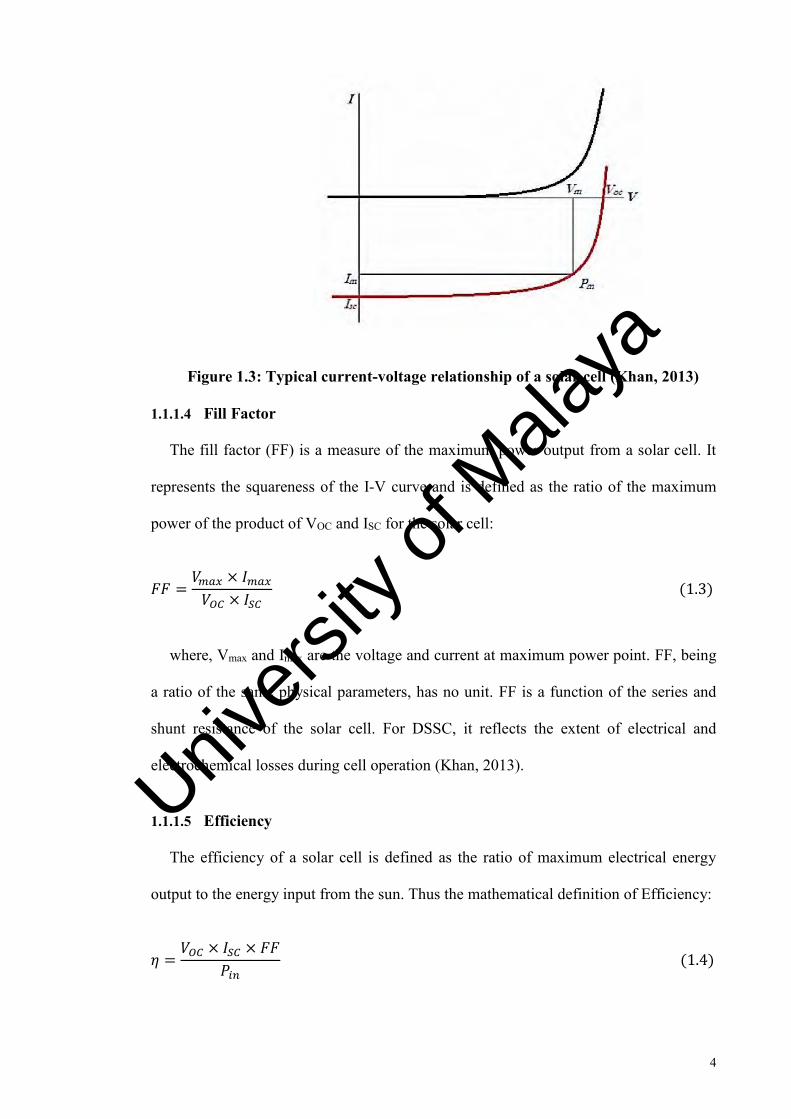
Typical current-voltage relationship of a solar cell which red line is related to light I-V
response and black line is relates to dark I-V response is shown in Figure 1.3. Univ
ersity
of M
alaya
4
Figure 1.3: Typical current-voltage relationship of a solar cell (Khan, 2013)
1.1.1.4 Fill Factor
The fill factor (FF) is a measure of the maximum power output from a solar cell. It
represents the squareness of the I-V curve and is defined as the ratio of the maximum
power of the product of VOC and ISC for the solar cell:
𝐹𝐹 =𝑉𝑚𝑎𝑥 × 𝐼𝑚𝑎𝑥
𝑉𝑂𝐶 × 𝐼𝑆𝐶 (1.3)
where, Vmax and Imax are the voltage and current at maximum power point. FF, being
a ratio of the same physical parameters, has no unit. FF is a function of the series and
shunt resistance of the solar cell. For DSSC, it reflects the extent of electrical and
electrochemical losses during cell operation (Khan, 2013).
1.1.1.5 Efficiency
The efficiency of a solar cell is defined as the ratio of maximum electrical energy
output to the energy input from the sun. Thus the mathematical definition of Efficiency:
𝜂 =𝑉𝑂𝐶 × 𝐼𝑆𝐶 × 𝐹𝐹
𝑃𝑖𝑛 (1.4)
Univers
ity of
Mala
ya
5
where, Pin is the power input from the sunlight. Efficiency is generally expressed in
percentage (Khan, 2013).
1.1.1.6 Quantum Efficiency
Quantum efficiency (QE) or ‘External Quantum Efficiency (EQE)’, sometimes also
referred to as incident photon-to-current conversion efficiency (IPCE) is a measure of
how efficient a solar cell is in producing photo-generated charge at a given frequency. It
is defined as the ratio of the number of incident photons to the number of charge carriers
generated and is a function of the excitation wavelength:
𝐼𝑃𝐶𝐸 (𝜆) = 1240 ×𝐼𝑆𝐶
𝜆 × 𝜙 (1.5)
where, ISC is the short circuit current (mA/cm2), λ is the wavelength and Φ is the
incident radiative light flux (W/m2) (Grätzel, 2009).
1.1.2 Photovoltaic generation
Photovoltaics are divided into three generations based on their performance and cost
effectiveness.
The first generation of solar cell is based on silicon, and has a relatively high
efficiency at high production costs, and is limited by the Shokley-Queisser limit
(Conibeer, et al., 2006).
The Shokley-Queisser limit, in physics, refers to the maximum theoretical efficiency
that the solar cells build upon on the principle of a single p-n junction to collect power
from a cell. It was calculated by Wiliam Shokley and Hans Queisser in 1961 (Shockley
and Queisser, 1961). Limited absorption of photons is one of the most important
limitations in the efficiency of solar energy production.
Univers
ity of
Mala
ya
6
In conventional crystalline silicon solar cells, the photo-generated electron-hole pair
is separated and collected through the p-n junction of a doped semiconductor (Gibbons,
1977).
The thin film solar cells based on CdTe or CuInGaSe belong to the second
generation. Thin film technology is still limited by the Shokley-Queisser limit and is
less efficient compared to the 1st generation solar cells, but they are much cheaper due
to its low-cost manufacturing process. In 2nd generation photovoltaics, the cell’s
thickness has been reduced from millimeters to only a few micrometers. The Shokley-
Queisser theoretical limit limits the propagation of both 1st and 2nd generations of solar
cells (Timilsina, et al., 2012).
The 3rd generation of photovoltaics includes any cells that were not included in the
previous generations. 3rd generation solar cells are capable of exceeding the
Shokley-Queisser limit. Nanomaterials are used to fabricate 3rd generation
photovoltaics. The cost of the fabrication process is low as it does not require extreme
temperatures for the preparation of pure silicon. DSSCs belong to the 2nd and 3rd
generation of solar cells (Hoffmann and Dorgan, 2012).
1.1.3 Dye-sensitized solar cells
Currently, there is a need to develop cheaper photovoltaic devices that are reasonably
efficient to instigate the widespread application of photovoltaic technology. DSSC is
regarded as a thin film solar cell, and have emerged as an important alternative to
conventional silicon solar cells (Grätzel, 2004).
DSSCs was first reported by O’Regan and Gratzell in 1991, and have attracted
significant attention, as it is environmentally friendly, easy to manufacture, capable of
Univers
ity of
Mala
ya
7
utilizing indoor light sources, cheap, and relatively efficient (O’regan and Grätzel,
1991).
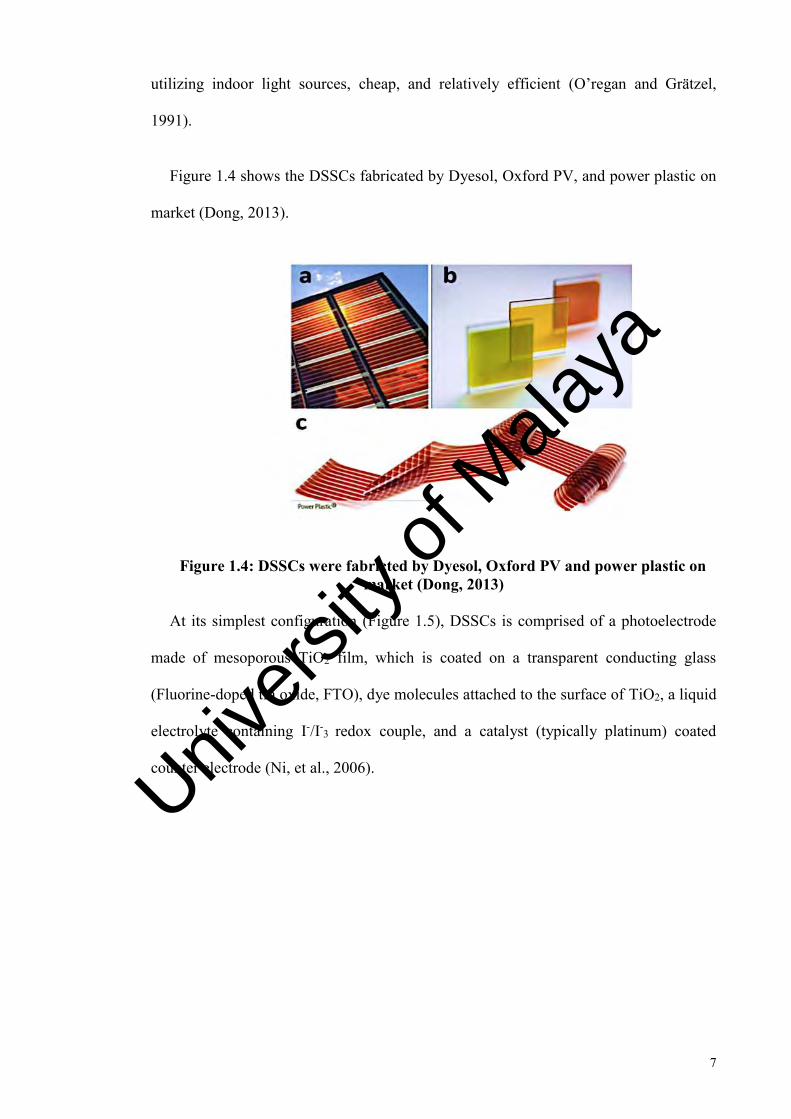
Figure 1.4 shows the DSSCs fabricated by Dyesol, Oxford PV, and power plastic on
market (Dong, 2013).
Figure 1.4: DSSCs were fabricted by Dyesol, Oxford PV and power plastic on market (Dong, 2013)
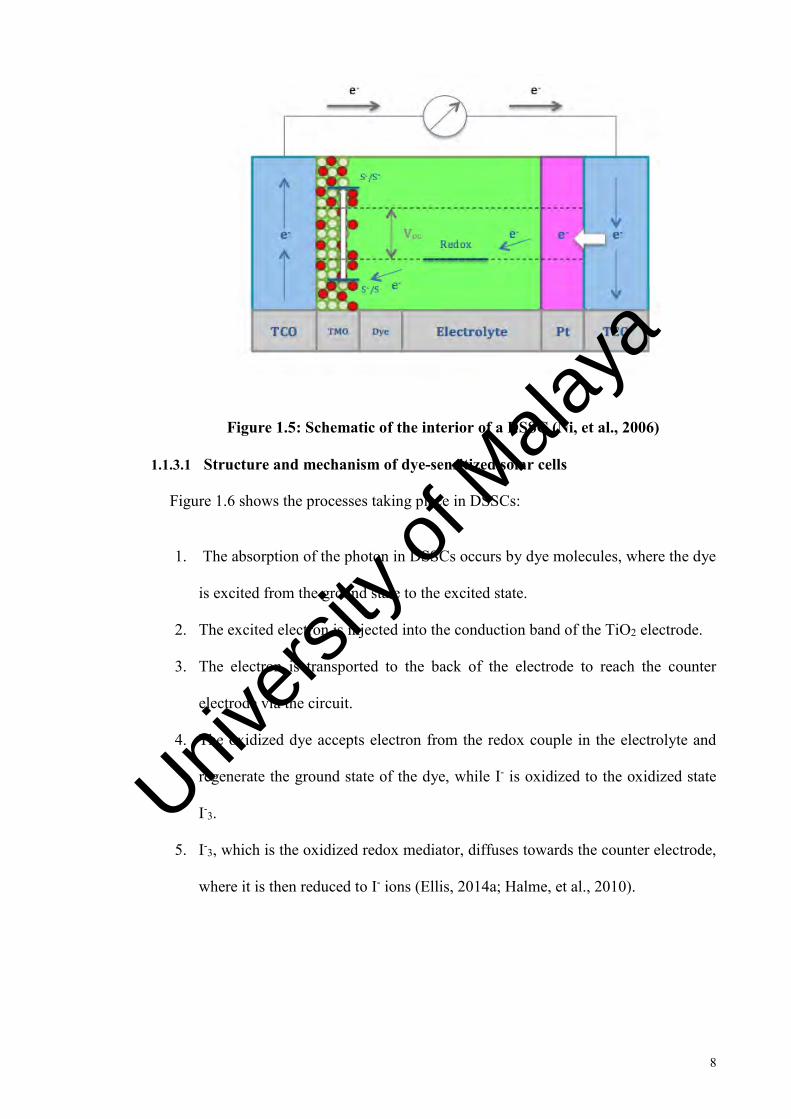
At its simplest configuration (Figure 1.5), DSSCs is comprised of a photoelectrode
made of mesoporous TiO2 film, which is coated on a transparent conducting glass
(Fluorine-doped tin oxide, FTO), dye molecules attached to the surface of TiO2, a liquid
electrolyte containing I-/I-3 redox couple, and a catalyst (typically platinum) coated
counter electrode (Ni, et al., 2006).
Univers
ity of
Mala
ya
8
Figure 1.5: Schematic of the interior of a DSSC (Ni, et al., 2006)
1.1.3.1 Structure and mechanism of dye-sensitized solar cells
Figure 1.6 shows the processes taking place in DSSCs:
1. The absorption of the photon in DSSCs occurs by dye molecules, where the dye
is excited from the ground state to the excited state.
2. The excited electron is injected into the conduction band of the TiO2 electrode.
3. The electron is transported to the back of the electrode to reach the counter
electrode via the circuit.
4. The oxidized dye accepts electron from the redox couple in the electrolyte and
regenerate the ground state of the dye, while I- is oxidized to the oxidized state
I-3.
5. I-3, which is the oxidized redox mediator, diffuses towards the counter electrode,
where it is then reduced to I- ions (Ellis, 2014a; Halme, et al., 2010).
Univers
ity of
Mala
ya

9
Figure 1.6: Schematic illustration of a DSSC (Ellis, 2014a)
1.1.4 Graphene quantum dots
Carbon is the 15th most abundant element in the Earth's crust, and the 4th most
abundant element in the universe. Carbon nanostructures, or nanocarbons, i.e. low-
dimensional nanomaterials, are being extensively researched for the past two decades
due to their unique structural and electronic properties, prompting a huge interest from
the perspective of fundamental research and application in molecular electronics,
materials science, energy storage and conversion, bio-medicine, sensing, and bio-
sensing (Delhaes, 2012; Gogotsi and Presser, 2013; Rapino, et al., 2014).
Graphene is a single or few atomic layers of graphite, with sp2 carbon atoms packed
in a honeycomb crystal lattice. Graphene was recently touted as a wonder material, due
to its high-mechanical strength, high electron mobility, lightness, flexibility, single-
atom thickness, and near transparency. Graphene also has large surface area, is
impermeable to gas, reports very high thermal conductivity and Young’s moduli, all of
which make it suitable for composites, thin films, electromagnetic shielding, sensor, and
solar cells (Katsnelson, 2007).
Univers
ity of
Mala
ya
10
To effectively tune the band gap of graphene and facilitate its use in various
applications, its size needs to be reduced (Li, et al., 2011).
Techniques to alter the band-gap in graphene have attracted significant interest for
application in graphene-based electronics. To date, diverse strategies for the formation
of a bandgap in graphene structures have been developed, including graphene
nanoribbons (GNRs) and GQDs (Tong, et al., 2016).
Zero-dimensional GQDs consist of single-or few-layer graphene that measures less
than 100 nm and stands for a new type of quantum dots with unique properties,
combining the nature of the graphene and size-induced quantum effects. GQDs exhibit
unique optical and electronic properties, with a band-gap of less than 2.0 eV due to
quantum confinement and edge effects. GQDs recently emerged as a potential candidate
for fluorescent probes in cell imaging, bio-sensing, and solar cells, and were explored
due to their unique characteristics such as high surface area, large diameter, and
enhanced surface grafting using the π-π conjugated network or surface groups. GQDs
also possess rich functional groups, such as carboxylic acid moieties at the edge, which
imparts them with excellent water solubility and subsequent functionalization
possibilities (Huang, et al., 2011).
1.1.4.1 Advantages of graphene quantum dots
The photoluminescent (PL) behavior of GQDs can be tuned from ultraviolet to near
infrared based on its size, shape, edge effects, functional groups, heterojunction doping,
and sp2 carbon fraction.
In addition to their excellent PL behavior, GQDs exhibit a number of attractive
characteristics. They report minimal toxicity to humans and the environment in contrast
to their heavy metal based counterparts. They are also synthesized in bulk from an
Univers
ity of
Mala
ya
11
abundance of starting materials via low cost strategies. Also, because GQDs are
dispersed in water and organic solvents, they are readily integrated into standard
industrial manufacturing.
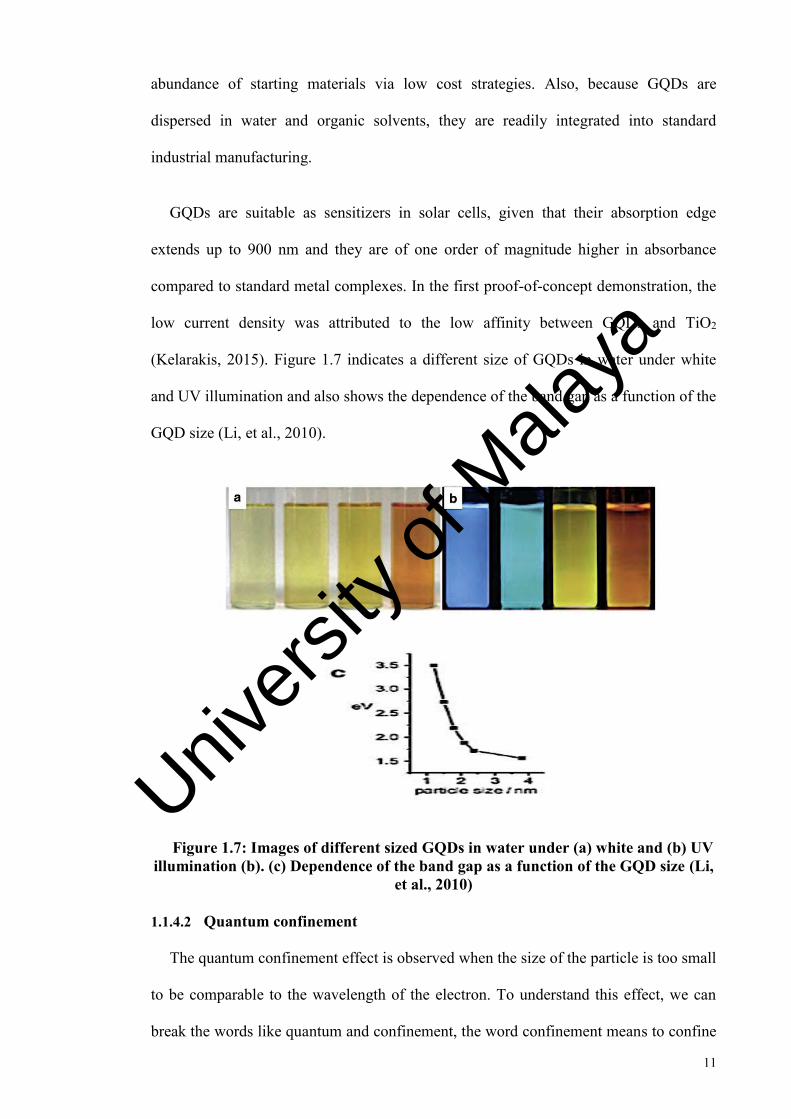
GQDs are suitable as sensitizers in solar cells, given that their absorption edge
extends up to 900 nm and they are of one order of magnitude higher in absorbance
compared to standard metal complexes. In the first proof-of-concept demonstration, the
low current density was attributed to the low affinity between GQDs and TiO2
(Kelarakis, 2015). Figure 1.7 indicates a different size of GQDs in water under white
and UV illumination and also shows the dependence of the band gap as a function of the
GQD size (Li, et al., 2010).
Figure 1.7: Images of different sized GQDs in water under (a) white and (b) UV illumination (b). (c) Dependence of the band gap as a function of the GQD size (Li,
et al., 2010)
1.1.4.2 Quantum confinement
The quantum confinement effect is observed when the size of the particle is too small
to be comparable to the wavelength of the electron. To understand this effect, we can
break the words like quantum and confinement, the word confinement means to confine
Univers
ity of
Mala
ya

12
the motion of randomly moving electron to restrict its motion in specific energy levels
(discreteness) and quantum reflects the atomic realm of particles. So, as the size of a
particle decrease till we can reach a nano scale the decrease in confining dimension
makes the energy levels discrete and this increases or widens up the band gap and
ultimately the band gap energy also increases. Materials will have dimensions
comparable to the exciton Bohr radius, increasing the surface to volume ratio, which
results in the change in thermal, magnetic, electric and optical properties (Schaefer,
2010) of the materials, as the size of the materials changes from bulk to the nanoscale.
When the electrons in the nanomaterials are squeezed to the size comparable to exciton
Bohr radius, the overlapping energy orbitals of nanomaterials change to discrete energy
levels (Kittel, et al., 1996; Myasnikov and Myasnikova, 2001), this phenomenon is
known as quantum confinement.
Problem statement
In the past decade, ruthenium-based complexes are the most utilized dyes in DSSCs.
However, major technical drawbacks of these complexes include the fact that they are
expensive, as the metal is rare, its purification process tedious, and its lack of absorption
in the red region of the visible spectrum, where the light harvesting process is
optimized. This basically means that an alternative is required. Replacing ruthenium-
based dye with GQDs as a green photo-sensitizer is seen as a new approach for higher
efficiency DSSCs, since the band gap of GQDs varies with size, therefore, the
absorption and redox properties can be tuned via the synthesis of quantum dots.
Moreover, GQDs demonstrate several fascinating properties, such as strong PL activity,
chemical stability, lower toxicity compared to ruthenium-based dyes, and very high
optical absorptivity (Tang, et al., 2014).
Univers
ity of
Mala
ya
13
The photo-anode serves a dual function: support sensitizer loading and transport
photo-excited electrons from the sensitizer to the external circuit. Therefore, a large
surface area is necessary to ensure increased dye loadings, and a fast rate of charge
transport is required to ensure high electron collection efficiency. These two properties
are the defining characteristics of an ideal photo-anode. TMOs (TiO2 and ZnO) report
many advantages, such as high surface area, which helps dye absorption, electrolyte
penetration, light scattering, and multi-reflection via its visible light harvesting
capability. Many efforts were expounded to enhance the performance of the working
electrode in terms of reducing the recombination loss, increase dye uptake, increase
Fermi energy level, enhance the electron lifetime with longer diffusion length, as well
as electron collection and transport. Thus, the optimization procedure should be taken
into account when determining the perfect thickness of the TMO nanoparticles and
immersion time in the proposed dye.
Research Scopes
There are three main stages in this work: Synthesis, Fabrication, and Application and
Optimization of DSSC which is presented in Table 1.1. The synthesis and
characterization of TiO2, ZnO nanoparticles and GQDs are investigated in this study.
They will then be used in the DSSCs to enhance the power conversion efficiency (PCE).
Univers
ity of
Mala
ya
14
Table 1.1: Overview of research scopes
STAGE 1:
a) Synthesis of TMO nanoparticles
Preparation of TMO nanoparticles by Hydrothermal method
Intensity Reaction time Concentration
STAGE 1:
b) Synthesis of GO
Preparation of GO from Gt by Hummer’s method
Oxidation duration Acid concentration Reaction temperature
STAGE 1:
c) Synthesis of GQDs
Preparation of GQDs by Hydrothermal method
Intensity Reaction time Concentration
Characterization of TMO, GO and GQDs
TEM, HRTEM, Raman, FTIR, PL, UV-Vis STAGE 2:
a) TMO coated on FTO glass by using Dr. Blade method
Concentration of nanoparticles Characterization of Photo-
anode
FESEM, Raman, FTIR, PL, UV- Vis STAGE 3:
DSSC performance and Optimization of PCE
I–V characteristics of DSSC Electrochemical impedance spectra of DSSCs Incident power conversion efficiency (IPCE) Optimization for preparing the sample Optimization for using sample for the application Enhancement of power conversion efficiency in DSSCs
Research Objectives
The goal of my research is to understand the fundamental physics and performance
of DSSCs with improved PCE at lower costs based on TiO2 and ZnO nanostructures
and sensitizers via integrated experiments.
Univers
ity of
Mala
ya
15
The specific objectives of this research are:
1. To synthesize graphene quantum dots as a green sensitizer with band gap
analogous to a transition metal.
2. To fabricate a highly efficient DSSCs using the as-synthesized GQDs.
3. To investigate the power conversion efficiency of novel fabricated DSSCs.
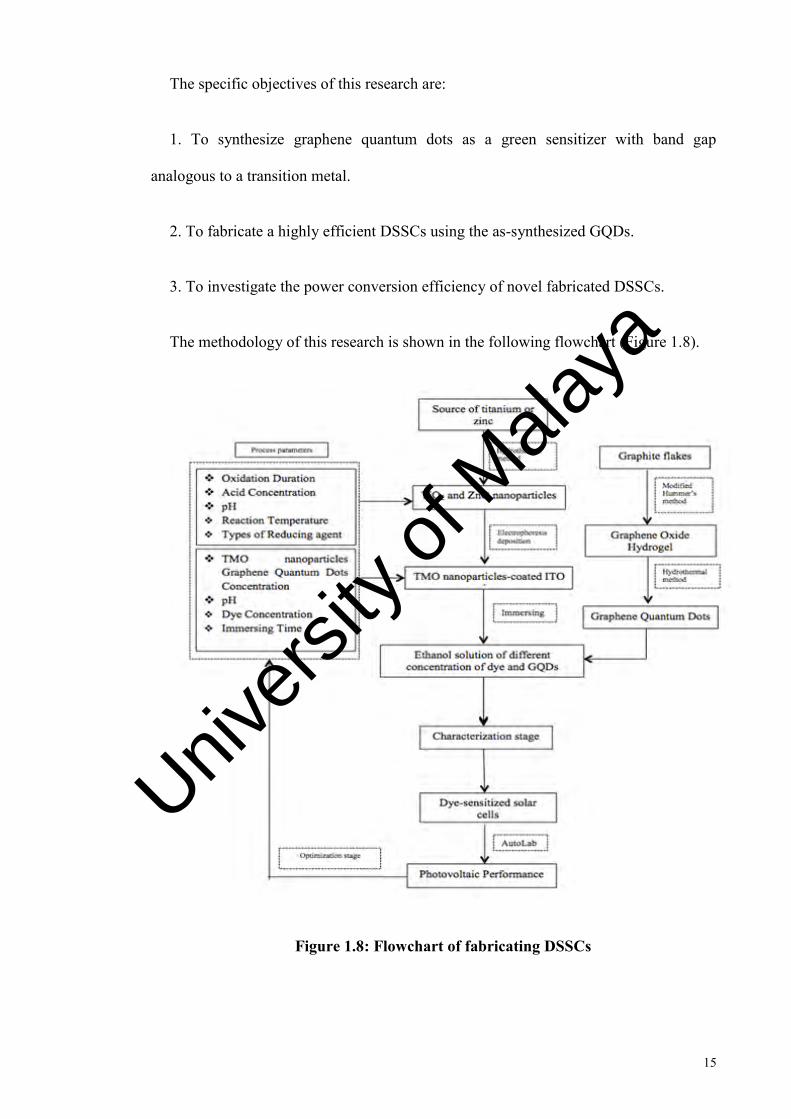
The methodology of this research is shown in the following flowchart (Figure 1.8).
Figure 1.8: Flowchart of fabricating DSSCs
Univers
ity of
Mala
ya
16
Organization of Thesis
This dissertation adopts a university Malaya style guide to presentation, logically
aimed and systematically rendered to enhance understanding of the research. The thesis
is divided into five chapters as follows:
Chapter one highlights the background of the study, the problems existing in this
area which build motivation for this project, and the objectives of this research.
Chapter two presents the literature review, which covers materials used in DSSCs
and experimental parameters. This chapter shows that there have been many
experimental studies regarding the fabrication of DSSCs. However, no work has been
published on comparing the effect of ZnO and TiO2 photo-anodes with different
thickness in DSSCs based on GQDs as a photosensitizer.
Chapter three explains the methodology for conducting this research project.
Preparation of materials and using them for the fabrication of DSSCs described
schematically and the characterization equipment explained in details by adding some
photographs, figures.
Chapter four presents the experimental results which are analyzed by different
characterization techniques.
Chapter five demonstrates the comprehensive conclusions along with
recommendations for further work.
Univers
ity of
Mala
ya
17
CHAPTER 2: LITERATURE REVIEW
Photovoltaics
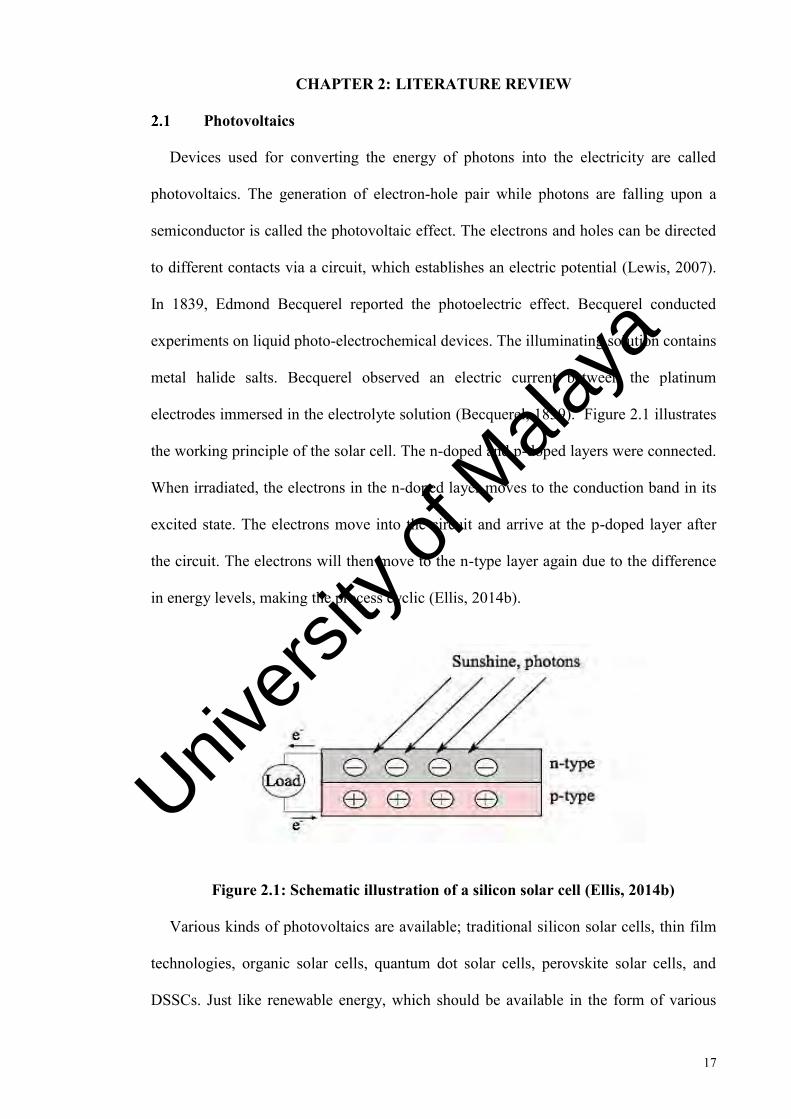
Devices used for converting the energy of photons into the electricity are called
photovoltaics. The generation of electron-hole pair while photons are falling upon a
semiconductor is called the photovoltaic effect. The electrons and holes can be directed
to different contacts via a circuit, which establishes an electric potential (Lewis, 2007).
In 1839, Edmond Becquerel reported the photoelectric effect. Becquerel conducted
experiments on liquid photo-electrochemical devices. The illuminating solution contains
metal halide salts. Becquerel observed an electric current between the platinum
electrodes immersed in the electrolyte solution (Becquerel, 1839). Figure 2.1 illustrates
the working principle of the solar cell. The n-doped and p-doped layers were connected.
When irradiated, the electrons in the n-doped layer moves to the conduction band in its
excited state. The electrons move into the circuit and arrive at the p-doped layer after
the circuit. The electrons will then move to the n-type layer again due to the difference
in energy levels, making the process cyclic (Ellis, 2014b).
Figure 2.1: Schematic illustration of a silicon solar cell (Ellis, 2014b)
Various kinds of photovoltaics are available; traditional silicon solar cells, thin film
technologies, organic solar cells, quantum dot solar cells, perovskite solar cells, and
DSSCs. Just like renewable energy, which should be available in the form of various
Univers
ity of
Mala
ya

18
energy sources in the future, photovoltaics should also be designed to make it adaptable
(Ellis, 2014b). Different types of solar cells will be briefly summarized in the following
subsections.
2.1.1 Silicon solar cells
The most widely used photovoltaic technology is crystalline silicon (Si). Silicon
which is known as the second most plentiful element in the earth’s crust -rarely exists in
its pure form. Instead, it appears as silicon dioxide (silica) or silicates. The abundance of
silicon is one of the main advantages of solar cells. However, the energy consumption
for producing pure silicon is a disadvantage. Crystalline silicon solar cells are available
in a) mono-crystalline silicon, produced by slicing wafers from a high-purity single
crystal ingot, and b) multi-crystalline silicon, made by sawing a cast block of silicon
first into bars, then wafers. The latter reports lower efficiencies. The crystalline silicon
solar cells proved to have an efficiency of around 25 % (Meinardi, et al., 2014). The
working principle of silicon solar cells is illustrated in Figure 2.1. Two semiconductors,
both silicon, one n-doped (most often with phosphorous) and the other p-doped (for
example with boron) are connected to form the silicon solar cell (Ellis, 2014b; Saga,
2010).
2.1.2 Thin film technologies
Amorphous Si, CdS, CdTe, CuInSe2 (CIS), and CuInGaSe2 (CIGS) are included in
devices fabricated by thin film technology. The working principles of thin film solar
cells are almost similar to crystalline silicon photovoltaics; semiconductors are
connected and an electric field is established at the junction between the p-type and the
n-type inorganic semiconductors. Around 20 % efficiency has been reported for thin
film solar cells (Poortmans and Arkhipov, 2006).
Univers
ity of
Mala
ya

19
2.1.3 Organic solar cells
Conductive polymers or other organic conductors (as charge transport materials) are
used in organic solar cells. They are seen as analogous to semiconductor based solar
cells (Heo, et al., 2013). Different conductive polymers with differing highest occupied
molecular orbital and lowest unoccupied molecular orbital (HOMO-LUMO) levels are
brought together, and the application of an effective field resulted in a charge
separation, which prompt the electrons to fall from one excited state level to another.
Organic solar cells report efficiencies of around 11 % (Meinardi, et al., 2014).
2.1.4 Quantum dot solar cells
Different types of quantum dot solar cells are available, and are almost similar to
DSSCs. Quantum dot solar cells reported an efficiency of around 8.6 %. Quantum dots
can be utilized both as a sensitizer and redox mediator, and the quantum dot solar cells
can be both liquid and solid state based. Lead-sulfide is an example of quantum dots
materials (Heo, et al., 2013).
2.1.5 Perovskite solar cells
One of the latest photovoltaic technologies is the perovskite solar cell. It includes a
broad class of crystalline minerals, with their working principles and kinetics still being
investigated. These cells are shown to operate both as charge carrier and absorbance
medium. One of its disadvantages is that it contains lead (a health hazard), and
perovskites, being salt-like minerals, can be readily dissolved in water or even humid
air. Efficiencies of 6.4 % and 17.9 % are reported for non-lead and lead containing
versions, respectively (Noel, et al., 2014).
2.1.6 Dye Sensitized Solar Cells
Dye-sensitization dates back to 1873 (Vogel, 1873), when Vogel sensitized silver
halide emulsions by dyes to produce black and white photographic films (referred in
Univers
ity of
Mala
ya
20
(McEvoy and Grätzel, 1994)). However, the application of dye-sensitized in
photovoltaics remained unsuccessful until the 1990’s, when Professor Grätzel and his
co-workers successfully developed a solar cell (reporting an energy conversion
efficiency that exceeded 10 %) by combining nanostructured electrodes and efficient
charge injection dyes in the Laboratory of Photonics and Interfaces in École
Polytechnique Fédérale de Lausanne (EPFL), Switzerland. This dye-sensitized
nanostructured solar cell is called the Grätzel cell (O’regan and Grätzel, 1991). It is
regarded as a photo-electrochemical solar cell, which means a liquid electrolyte or other
ion-conducting phase is used as a charge transport medium. It is the focus of many
researches due to its high efficiency and long-term stability. There are also patents and
licenses developed for the main invention, and numerous research groups investigated
the possibility of replacing its original materials. The next sub-sections will present the
DSSCs technology, with a more detailed look into the cell operation in light of the key
steps of photovoltaic conversion, as well as other important fundamental operational
aspects of the cell’s physics and chemistry (Gong, et al., 2017; Halme, 2002).
Comparison of Different photovoltaic devices
Table 2.1 shows the comparison between various types of photovoltaic devices.
Although DSSCs reports lower efficiency compared to traditional silicon-based solar
cells and CuInSe2 solar cells, several advantages of DSSCs render them suitable for
conventional solar cells. First, the fabrication cost is quite low compared to
silicon-based solar cells. Second, the materials used to make DSSCs, such as TiO2,
ZnO, dye, and iodine, are all widely available. The potentially harmful organic solvents
have been replaced by the non-volatile ionic liquid and solid-state electrolyte.
Moreover, colorful and transparent solar cells are easily fabricated, which can serve as
power-producing windows in architectures or as decorations for both indoor and
outdoor applications (Wei, 2011).
Univers
ity of
Mala
ya
21
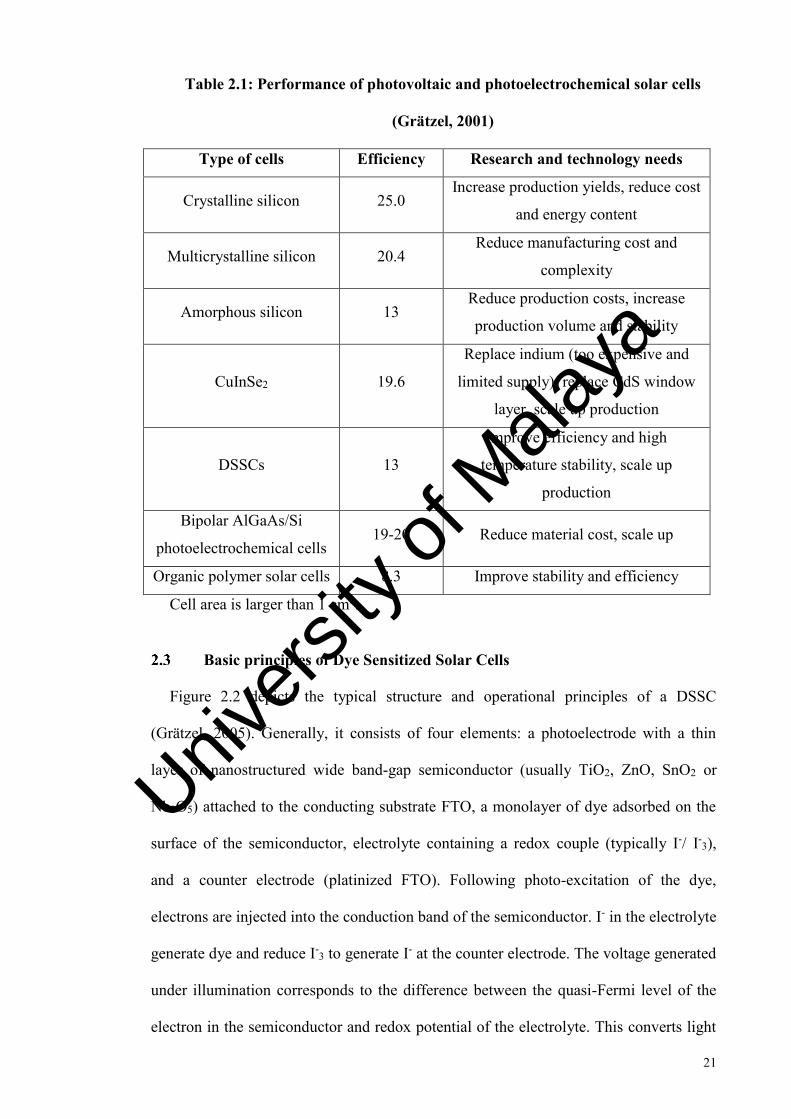
Table 2.1: Performance of photovoltaic and photoelectrochemical solar cells
(Grätzel, 2001)
Type of cells Efficiency Research and technology needs
Crystalline silicon 25.0 Increase production yields, reduce cost
and energy content
Multicrystalline silicon 20.4 Reduce manufacturing cost and
complexity
Amorphous silicon 13 Reduce production costs, increase
production volume and stability
CuInSe2 19.6
Replace indium (too expensive and
limited supply), replace CdS window
layer, scale up production
DSSCs 13
Improve efficiency and high
temperature stability, scale up
production
Bipolar AlGaAs/Si
photoelectrochemical cells 19-20 Reduce material cost, scale up
Organic polymer solar cells 8.3 Improve stability and efficiency
Cell area is larger than 1 cm2.
Basic principles of Dye Sensitized Solar Cells
Figure 2.2 depicts the typical structure and operational principles of a DSSC
(Grätzel, 2005). Generally, it consists of four elements: a photoelectrode with a thin
layer of nanostructured wide band-gap semiconductor (usually TiO2, ZnO, SnO2 or
Nb2O5) attached to the conducting substrate FTO, a monolayer of dye adsorbed on the
surface of the semiconductor, electrolyte containing a redox couple (typically I-/ I-3),
and a counter electrode (platinized FTO). Following photo-excitation of the dye,
electrons are injected into the conduction band of the semiconductor. I- in the electrolyte
generate dye and reduce I-3 to generate I- at the counter electrode. The voltage generated
under illumination corresponds to the difference between the quasi-Fermi level of the
electron in the semiconductor and redox potential of the electrolyte. This converts light
Univers
ity of
Mala
ya

22
into electricity, with no permanent chemical transformation taking place. Therefore,
DSSC is regarded as a regenerative-type photo electrochemical cell (Grätzel, 2001;
Wei, 2011).
Figure 2.2: Typical structure and operation of a DSSC (Grätzel, 2005)
2.3.1 Absorption of light
The superior efficiency of the DSSC is due to many well-tuned physio-chemical
properties, the most important one being the use of a large band gap semiconductor
material as an electrode. Its properties are enhanced by the coating of the internal
surface of the porous semiconductor with a type of altered dye molecules that absorbs
incoming light. The dye is adsorbed onto the surface of TiO2, owing to the special
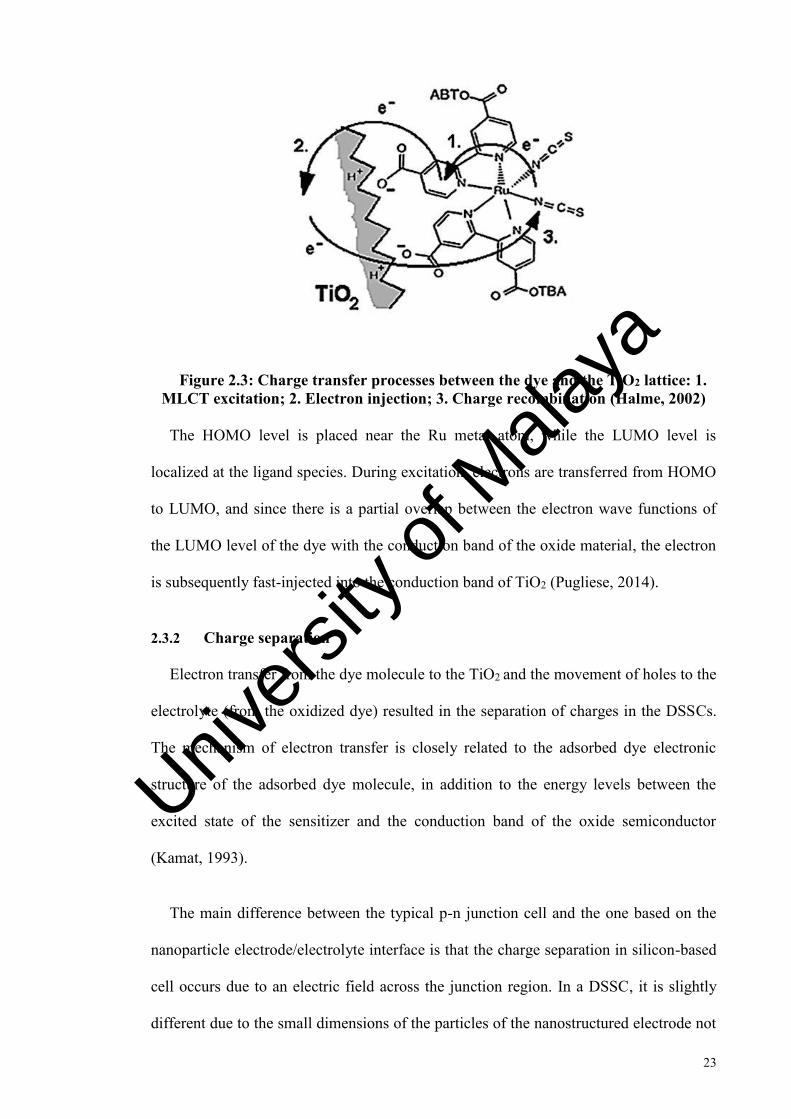
anchoring groups attached to the dye molecule (Pugliese, 2014). Absorption of an
impinging photon occurs through an excitation between the electronic states of the
molecule: in Ru complexes-based dyes, the excitation is of metal-to-ligand charge-
transfer (MLCT) type, as reported in Figure 2.3 (Halme, 2002).
Univers
ity of
Mala
ya
23
Figure 2.3: Charge transfer processes between the dye and the TiO2 lattice: 1. MLCT excitation; 2. Electron injection; 3. Charge recombination (Halme, 2002)
The HOMO level is placed near the Ru metal atom, while the LUMO level is
localized at the ligand species. During excitation, electrons are transferred from HOMO
to LUMO, and since there is a partial overlap between the electron wave functions of
the LUMO level of the dye with the conduction band of the oxide material, the electron
is subsequently fast-injected into the conduction band of TiO2 (Pugliese, 2014).
2.3.2 Charge separation
Electron transfer from the dye molecule to the TiO2 and the movement of holes to the
electrolyte (from the oxidized dye) resulted in the separation of charges in the DSSCs.
The mechanism of electron transfer is closely related to the adsorbed dye electronic
structure of the adsorbed dye molecule, in addition to the energy levels between the
excited state of the sensitizer and the conduction band of the oxide semiconductor
(Kamat, 1993).
The main difference between the typical p-n junction cell and the one based on the
nanoparticle electrode/electrolyte interface is that the charge separation in silicon-based
cell occurs due to an electric field across the junction region. In a DSSC, it is slightly
different due to the small dimensions of the particles of the nanostructured electrode not
Univers
ity of
Mala
ya
24
permitting the generation of a field. The electrolyte surrounding all the nanoparticles
decouples them and looks for any electric field in a range of about a nanometer (Pichot
and Gregg, 2000). Even if the band bending inside the particles is denied, an electric
field is otherwise created at the interface of oxide/electrolyte, owing to the dye
molecules being adsorbed. The latter usually employs acid anchoring groups (carboxyl
group, COOH) as attachment units, and when binding with TiO2, a proton (H+) is
released, leaving the dye molecule negatively charged. The generated potential
difference is estimated to be around 0.3 eV, and is the responsible for charge separation.
The most important mechanism for the separation of charges is the relative position of
the energy levels: the excited level of the dye must be higher than the conduction band
of the oxide, while the HOMO level of the sensitizer must be lower than the redox
potential of the electrolyte (Pugliese, 2014).
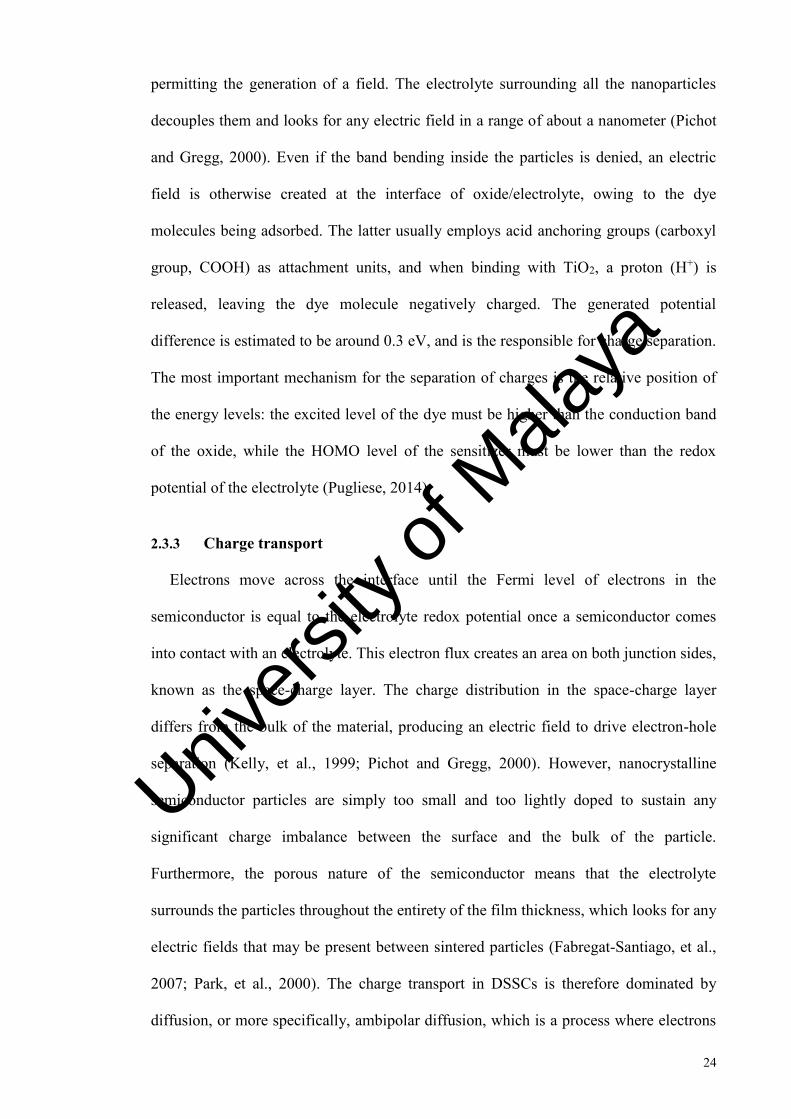
2.3.3 Charge transport
Electrons move across the interface until the Fermi level of electrons in the
semiconductor is equal to the electrolyte redox potential once a semiconductor comes
into contact with an electrolyte. This electron flux creates an area on both junction sides,
known as the space-charge layer. The charge distribution in the space-charge layer
differs from the bulk of the material, producing an electric field to drive electron-hole
separation (Kelly, et al., 1999; Pichot and Gregg, 2000). However, nanocrystalline
semiconductor particles are simply too small and too lightly doped to sustain any
significant charge imbalance between the surface and the bulk of the particle.
Furthermore, the porous nature of the semiconductor means that the electrolyte
surrounds the particles throughout the entirety of the film thickness, which looks for any
electric fields that may be present between sintered particles (Fabregat-Santiago, et al.,
2007; Park, et al., 2000). The charge transport in DSSCs is therefore dominated by
diffusion, or more specifically, ambipolar diffusion, which is a process where electrons
Univers
ity of
Mala
ya

25
and the associated cations on the surface simultaneously move through the film
(Kopidakis, et al., 2000; Murakoshi, et al., 1997).
Although diffusion is the dominant driving force for charge transport in the
semiconductor, early attempts to describe the transport behavior using the diffusion
equation found that the diffusion coefficient was unexpectedly dependent on
illumination intensity. It is now widely accepted that charge the transport behavior in
nanocrystalline semiconductors is dominated by trap states in the semiconductor
(Nelson, 1999; Saito, et al., 2002b). This model suggests that electronic states in the
semiconductor are a combination of conduction band states, which allow free transport
of electrons, and intra-band trap states, which are localized electronic states that trap
and release electrons to the conduction band. The number of trap states follows an
exponential distribution with energy, and is significantly higher than the number of free
electrons in the conduction band, thus, the movement of electrons into these traps and
their subsequent escape into the conduction band is the dominant charge transport mode
in the DSSC. This process is illustrated in Figure 2.4 (Griffith, 2012).
Figure 2.4: Schematic illustration of trap-limited charge transport in a dye sensitized semiconductor nanoparticle (Griffith, 2012)
Univers
ity of
Mala
ya
26
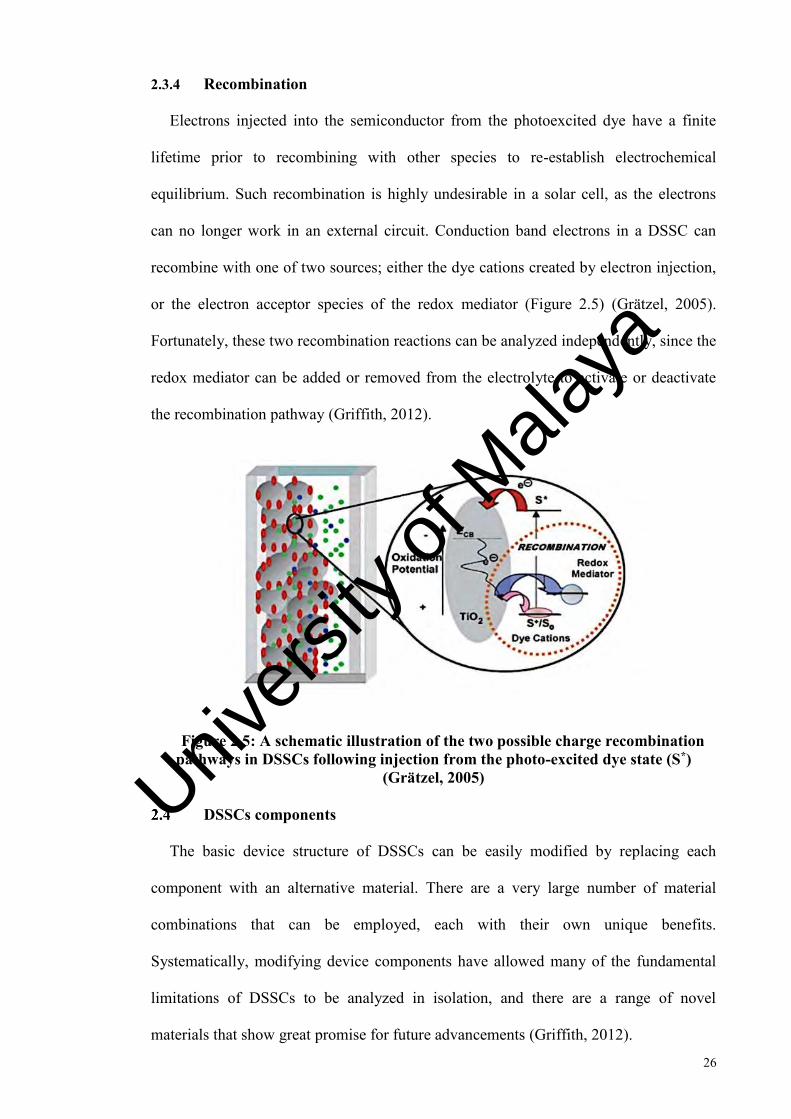
2.3.4 Recombination
Electrons injected into the semiconductor from the photoexcited dye have a finite
lifetime prior to recombining with other species to re-establish electrochemical
equilibrium. Such recombination is highly undesirable in a solar cell, as the electrons
can no longer work in an external circuit. Conduction band electrons in a DSSC can
recombine with one of two sources; either the dye cations created by electron injection,
or the electron acceptor species of the redox mediator (Figure 2.5) (Grätzel, 2005).
Fortunately, these two recombination reactions can be analyzed independently, since the
redox mediator can be added or removed from the electrolyte to activate or deactivate
the recombination pathway (Griffith, 2012).
Figure 2.5: A schematic illustration of the two possible charge recombination pathways in DSSCs following injection from the photo-excited dye state (S*)
(Grätzel, 2005)
DSSCs components
The basic device structure of DSSCs can be easily modified by replacing each
component with an alternative material. There are a very large number of material
combinations that can be employed, each with their own unique benefits.
Systematically, modifying device components have allowed many of the fundamental
limitations of DSSCs to be analyzed in isolation, and there are a range of novel
materials that show great promise for future advancements (Griffith, 2012).
Univers
ity of
Mala
ya

27
2.4.1 Transparent conducting oxide-coated glass substrate in DSSCs
Typical DSSCs employ anodes comprised of a glass substrate coated with a
transparent conducting oxide (FTO and indium-doped tin oxide (ITO)). This material
combination is one of the only candidates that satisfy the dual criteria for DSSC anodes
of good conductivity, high transparency, and thermal stability (to allow deposited
semiconductor films to be sintered). However, the conducting glass electrode
constitutes 30-50 % of the total cost for a DSSC module, which would make it better if
it is replaced with a cheaper alternative (Meyer, 1996; Smestad, et al., 1994). Poly
(ethylene terephthalate) films coated with ITO has been tested as an anode material
(Nogueira, et al., 2004), however, the low thermal stability of the polymer forces the
utilization of unsintered semiconductor films, which significantly reduce the overall
efficiency. Consequently, the overwhelming majority of DSSCs is constructed from
conducting glass anodes.
The cathode of a conventional DSSC is constructed from ITO plated with Platinum.
In contrast to the anode, it does not need to be transparent, but must instead satisfy the
dual criteria of moderate thermal stability (due to the annealing processes employed for
most deposited catalysts) and fast catalysis for the reduction of the redox mediator
acceptor species. Given its extensive use as an electrode material, carbon-functionalized
counter electrodes have been intricately studied in the context of DSSCs. Counter
electrodes are formed by coating ITO with activated nanoparticles (Ahmad, et al.,
2010), nanotubes (Suzuki, et al., 2002), and graphene (Kaniyoor and Ramaprabhu,
2011), with all demonstrating comparable efficiencies and stabilities towards platinum
coated electrodes. Polymers such as poly (3,4- ethylenedioxythiophene) (PEDOT)
(Saito, et al., 2002a) or polyester (Fang, et al., 2005) have shown limited success,
although the polymer coating increases sheet resistance of the electrode, which limits
the FF of the device. Stainless steel and nickel sheets exhibit reasonable performance as
Univers
ity of
Mala
ya
28
counter electrodes, although the stability of such coatings to the standard I-/I-3 corrosive
redox mediator have not been fully examined (Mosconi, et al., 2012). Whilst there are
clearly many electro-catalysts that can be used as counter electrodes, the material cost is
negligible compared to the overall module cost. Platinum-coated FTO electrodes are
therefore used almost exclusively used since they consistently result in the highest
efficiency (Griffith, 2012)
2.4.2 Photo-anodes in DSSCs
The photoelectrode is a key component in a DSSC. The morphology, surface area,
porosity, and pore size of the semiconductor films directly influence the electron
transport and electrolyte diffusion in a cell (Jiu, et al., 2006). Due to their large surface
areas and electron transfer medium, TiO2, ZnO, SnO2, Nb2O5, (semiconductor oxides)
serves as the carrier for the monolayers of the sensitizer in DSSCs (Yeoh and Chan,
2017).
TiO2 is an excellent choice as semiconductors, due to its low cost, abundant in the
market, nontoxicity, and biocompatibility. Rutile, anatase, and brookite are naturally
occurring TiO2 crystal types, with rutile reported to be the most thermodynamically
stable form. Thanks to having a larger band-gap and higher conduction band edge
energy, anatase is preferred in DSSCs, which in turn leads to a higher Fermi level and
Voc in DSSCs for similar conduction band electron concentrations (Nwanya, et al.,
2011; Sopian, et al., 2017).
In the context of environmental remediation, TiO2 is believed to be the most suitable
semiconductor. Owing to their large surface-to-volume ratios, nanostructured solar
cells benefit from increased loading of sensitizers, and the potential of an increased
number of current-producing electron transfer chemical reactions (Kamat, et al., 2010).
Nanostructure can increase the specific surface area up to 1000 times that of a bulk
Univers
ity of
Mala
ya
29
material (Nogi, et al., 2012). Nanoparticles are widely utilized for the fabrication of
mesoporous film, partially due to the direct availability of porous structures with
assembled nanoparticles and the simplicity of synthesis. Commercially available
Degussa P25 is one of the conventional sources of TiO2 (Ito, et al., 2006; Rasalingam, et
al., 2015). TiO2 is easily available, quite inexpensive, and have high photocatalyst
activity. It contains both anatase and rutile phase in a ratio of 7:3 and a crystallite size is
30nm (Xin, 2012).
The TiO2 film generally employed in a DSSC is fabricated from a paste in which
anatase nanoparticles, with a mean dimension of 20nm, is dispersed. Doctor-blading and
screen-printing are two widely used deposition processes for preparing nanocrystalline
TiO2 films, where a viscous dispersion of colloidal TiO2 particles are spread on a
conducting glass support before being sintering at high temperature to enhance the
electronic interconnection between the nanoparticles and the charge transfer towards the
substrate (Nazeeruddin, et al., 1993). The nanoparticles based photo-anode is beneficial
due to its high SSA value (in the range 50-25 m2g-1), which permits the anchoring of a
great number of dye molecules, while a disadvantage is the reduced charge transport
due to a long pathway for the electron diffusion within the semiconductor network
(Pugliese, 2014). Table 2.2 shows the efficiency reported by different studies on the
usage of TiO2 nanostructures as a photo-anode in DSSCs.
Univers
ity of
Mala
ya
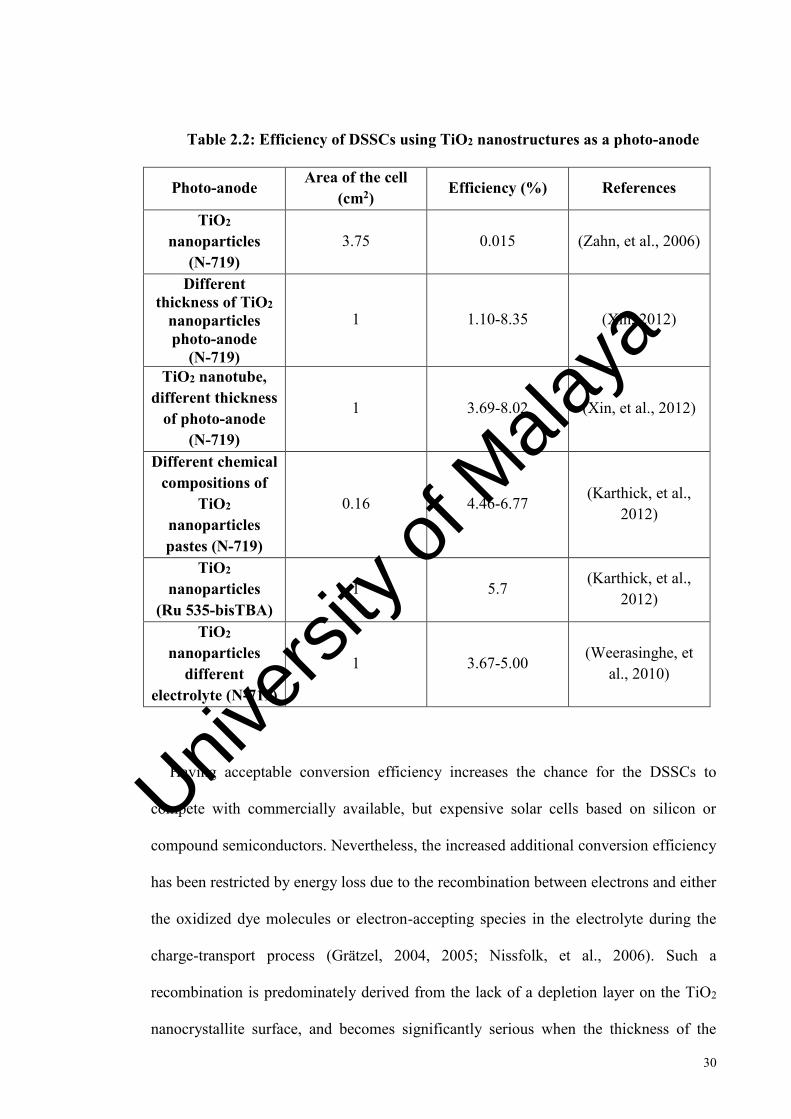
30
Table 2.2: Efficiency of DSSCs using TiO2 nanostructures as a photo-anode
Photo-anode Area of the cell (cm2) Efficiency (%) References
TiO2 nanoparticles
(N-719) 3.75 0.015 (Zahn, et al., 2006)
Different thickness of TiO2
nanoparticles photo-anode
(N-719)
1 1.10-8.35 (Xin, 2012)
TiO2 nanotube, different thickness
of photo-anode (N-719)
1 3.69-8.02 (Xin, et al., 2012)
Different chemical compositions of
TiO2 nanoparticles pastes (N-719)
0.16 4.46-6.77 (Karthick, et al.,
2012)
TiO2
nanoparticles (Ru 535-bisTBA)
1 5.7 (Karthick, et al.,
2012)
TiO2 nanoparticles
different electrolyte (N-719)
1 3.67-5.00 (Weerasinghe, et
al., 2010)
Having acceptable conversion efficiency increases the chance for the DSSCs to
compete with commercially available, but expensive solar cells based on silicon or
compound semiconductors. Nevertheless, the increased additional conversion efficiency
has been restricted by energy loss due to the recombination between electrons and either
the oxidized dye molecules or electron-accepting species in the electrolyte during the
charge-transport process (Grätzel, 2004, 2005; Nissfolk, et al., 2006). Such a
recombination is predominately derived from the lack of a depletion layer on the TiO2
nanocrystallite surface, and becomes significantly serious when the thickness of the
Univers
ity of
Mala
ya
31
photoelectrode film increases. In order to understand this, DSSC technology based on
ZnO has been explored extensively. A promising alternative to TiO2 for the fabrication
of DSSC photo-anode is ZnO (Ko, et al., 2011; Zhang, et al., 2009).
Zinc oxide (ZnO) is a wide-band-gap semiconductor with an energy-band structure.
The physical properties of ZnO are similar to those of TiO2, but its electronic mobility is
higher, which would be advantageous for the transport of electrons, on top of the
reduced recombination loss when used in DSSCs. Numerous investigations have
already reported the application of ZnO in DSSCs. ZnO’s ease of crystallization and
anisotropic growth makes it a great alternative to TiO2, although the conversion
efficiencies of 0.4–5.8 % reported for ZnO are lower than that of 11 % for TiO2. All of
the aforementioned properties allow ZnO to be produced in various nanostructures,
therefore offering exceptional properties for electronics, optics, or photocatalysis
(Schmidt-Mende and MacManus-Driscoll, 2007; Tornow, et al., 2008; Tornow and
Schwarzburg, 2007; Wang, 2004). Recent investigations of ZnO nanostructure based
DSSCs have brought about many new concepts, resulting in a better knowledge of
photoelectrochemically-based energy conversion, which in turn would accelerate the
growth of DSSCs connected with TiO2.
The basic units of nanostructures on the nanometer scale represent an important
feature due to its provision of a large specific surface area. It could also result in many
specific behaviors in electron transport or light propagation when taking into account
the surface effect, quantum-confinement effect, or photon localization (Arico, et al.,
2005; Bittkau and Carius, 2007; Xia, et al., 2003). The nanostructural forms of ZnO
developed during the past several decades, mainly include nanoparticles (Meulenkamp,
1998; Vafaee and Ghamsari, 2007), nanowires (or nanorods) (Kar, et al., 2006; Yang, et
al., 2002), nanotubes (Li, et al., 2005), nanobelts (Wang, et al., 2004b), and nanosheets
Univers
ity of
Mala
ya

32
(Fu, et al., 2006; Kar, et al., 2006). The production of these structures can be realized
via sol–gel synthesis, (Vafaee and Ghamsari, 2007) hydrothermal/solvothermal growth
(Kar, et al., 2006), physical or chemical vapor deposition (Wang, et al., 2004b; Yang, et
al., 2002), low-temperature aqueous growth (Li, et al., 2005), chemical bath deposition
(Wang and Xie, 2006), or electrochemical deposition (Fu, et al., 2006; Nonomura, et al.,
2003). Table 2.3 tabulates the efficiency reported by different studies on ZnO
nanostructures as a photo-anode in DSSCs.
Univers
ity of
Mala
ya
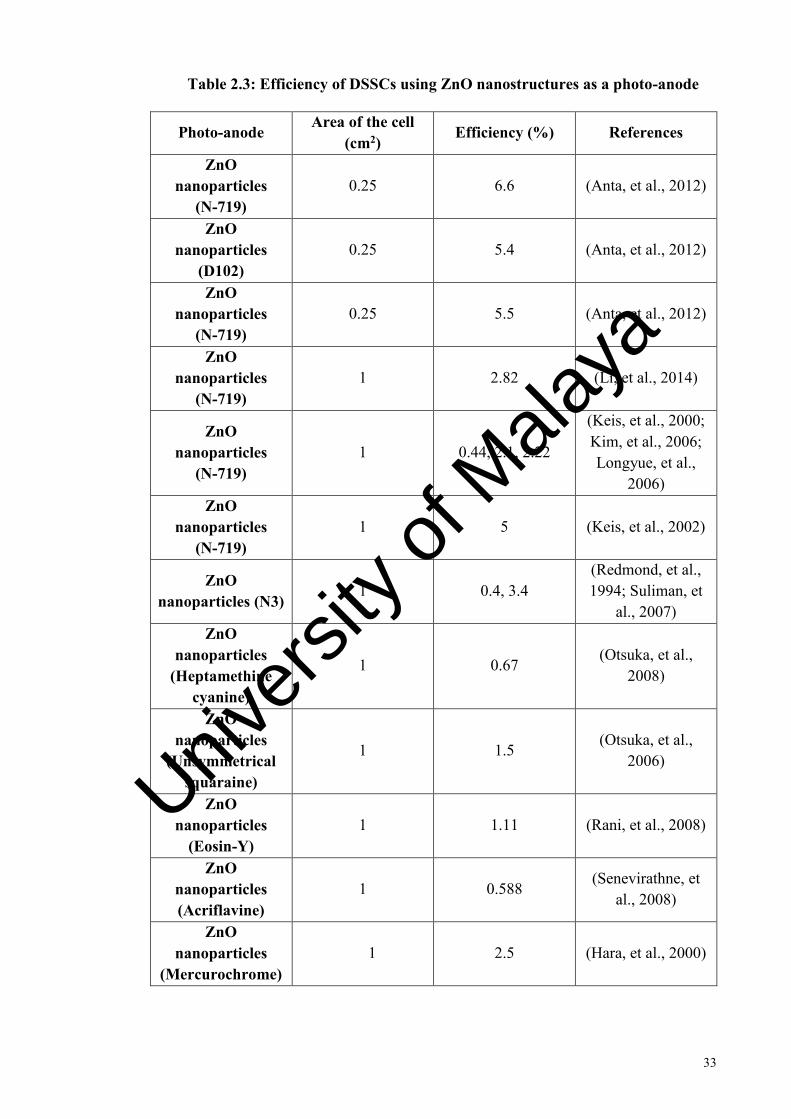
33
Table 2.3: Efficiency of DSSCs using ZnO nanostructures as a photo-anode
Photo-anode Area of the cell (cm2)
Efficiency (%) References
ZnO nanoparticles
(N-719) 0.25 6.6 (Anta, et al., 2012)
ZnO nanoparticles
(D102) 0.25 5.4 (Anta, et al., 2012)
ZnO nanoparticles
(N-719) 0.25 5.5 (Anta, et al., 2012)
ZnO nanoparticles
(N-719) 1 2.82 (Li, et al., 2014)
ZnO nanoparticles
(N-719) 1 0.44, 2.1, 2.22
(Keis, et al., 2000;
Kim, et al., 2006;
Longyue, et al.,
2006)
ZnO nanoparticles
(N-719) 1 5 (Keis, et al., 2002)
ZnO nanoparticles (N3)
1 0.4, 3.4 (Redmond, et al.,
1994; Suliman, et
al., 2007)
ZnO nanoparticles
(Heptamethine cyanine)
1 0.67 (Otsuka, et al.,
2008)
ZnO nanoparticles
(Unsymmetrical squaraine)
1 1.5 (Otsuka, et al.,
2006)
ZnO nanoparticles
(Eosin-Y) 1 1.11 (Rani, et al., 2008)
ZnO nanoparticles (Acriflavine)
1 0.588 (Senevirathne, et
al., 2008)
ZnO nanoparticles
(Mercurochrome) 1 2.5 (Hara, et al., 2000)
Univers
ity of
Mala
ya
34
2.4.3 Photosensitizers in DSSCs
The photosensitizing dye is perhaps the most crucial component of a DSSC.
Accordingly, optimization of the dye structure, including a variety of features such as
the size, metal center, ligands, substituents, and conjugation of molecules has attracted
significant interests. Studies of thousands of photosensitizers have shown that
optimizing the performance of most single dyes to achieve higher efficiencies is
extremely difficult. This is because the desirable properties for efficient electron
injection and dye regeneration are often incompatible with those required for broad
visible and near-infrared (NIR) absorption (Hagfeldt, et al., 2010).
An excellent sensitizer for DSSC should meet several requirements (Duncan and
Prezhdo, 2007). First, the sensitizer absorption spectrum should cover the visible and
part of the NIR region. Second, the sensitizer should bind strongly to the
semiconductor’s surface. Third, the sensitizer should possess suitable energy levels to
ensure electron injection and dye regeneration. Furthermore, for long-term performance,
the dye molecules must display excellent chemical and thermal stabilities. Finally, a
strong electronic coupling among the dye and semiconductor is required for efficient
charge separation. This is normally achieved by appending a conjugated anchoring
group to the chromophore, the design of which is rather complex (Griffith, 2012).
2.4.3.1 Anchoring group of photosensitizers
Several types of anchoring groups have been tested for DSSCs. The legends must
first immobilize the dye on the surface, and ideally, should also be electron withdrawing
in order to facilitate electron transfer from the dye into the semiconductor. The binding
interaction can occur via physisorption, such as hydrogen bonding, although it only
results in weak electronic interactions with the semiconductor. Commonly, the
anchoring group is designed in a way that it forms a permanent chemical bond with the
Univers
ity of
Mala
ya
35
semiconductor, and is frequently conjugated in order to facilitate electron transfer
(Murakoshi, et al., 1995). Chemical moieties that have been employed for this purpose
include sulfonic acids (SO3H) (Taffa, et al., 2010), phosphonic acids (PO3H)
(Nazeeruddin, et al., 2003; Wang, et al., 2004a), COOH (Lee, et al., 2009; Nazeeruddin,
et al., 2003; Srinivas, et al., 2009), and catechols [C6H4(OH)2] (An, et al., 2010;
Sánchez-de-Armas, et al., 2011). Somewhat surprisingly, the strongest binders (PO3H
and catechols) resulted in poorly performing devices, reportedly due to a very fast
recombination from strong coupling.
2.4.3.2 Dye Molecules
There have been thousands of sensitizing dyes tested in DSSCs, making a complete
assessment of sensitizers quite complex. Some major classes of dyes and their
corresponding advantages will be discussed here, with more detailed information
available in a recently published review of various dye systems (Hagfeldt, et al., 2010).
Ruthenium organometallic complexes were by far the most extensively investigated due
to higher power conversion efficiency of the dyes reported more than two decades ago
(O’regan and Grätzel, 1991). The most reported ruthenium complex, the benchmark N-
719 dye, exhibit highly efficient electron injection due to a long lived triplet excited
state, absorption of light over a broad wavelength range, and extremely slow
recombination (Katoh, et al., 2011; Mozer, et al., 2008; Robertson, 2008). The
modification of the bipyridyl ligands with conjugated substitutes has been shown to
improve the extinction coefficient and long-term stability of the dye (Wang, et al.,
2003), whilst the addition of organic antennae to the dye creates an extremely high
extinction coefficient that allows it to be employed in devices that require thin
semiconductor films (Choi, et al., 2008; Jang, et al., 2009). Several groups investigated
the addition of electron donating groups, including furan (Gao, et al., 2008),
triarylamine (Haque, et al., 2005; Shi, et al., 2008), and thiophene (Jiang and Masaki,
Univers
ity of
Mala
ya
36
2006) units to the basic ruthenium polypyridyl structure. This strategy has been shown
to reduce charge recombination via controlling the location of electron density in the
excited state of the dyes. However, the injection yield of the dyes was often
compromised.
Although traditional ruthenium dyes fulfill all these requirements and reported high
energy conversion efficiency, they are quite costly and are detrimental to the
environment, which severely limit their large-scale applications.
The replacement of the central ruthenium species with other heavy metal atoms that
also produce triplet excited states has been tested. Transition metal complexes formed
from copper (Sakaki, et al., 2002), platinum (Geary, et al., 2005), and iron (Ferrere,
2002) were examined. The majority of these dyes also produce broad metal-to-ligand
charge transfer absorption bands; however, the photocurrent produced from such
devices is often poor. This low Jsc was attributed to the poor injection and the
regeneration of the neutral dye ground state for many systems.
By contrast, organic dyes have many advantages in the context of application in
DSSCs (Campbell, et al., 2004). First, its cost is relatively low, because they are easily
synthesized, and are essentially not limited by available resources. Second, organic dyes
generally report much higher absorption coefficients than that of ruthenium dyes, and
the light absorption band of organic dyes can be easily tuned via molecular design. They
are also environmentally friendly, as they could be easily removed by sintering in the
air. Accordingly, the photoelectrode could be recycled, which further reduces the cost of
the DSSCs. Coumarin (Hara, et al., 2003) and indoline (Ito, et al., 2006) dyes were
amongst the first organic species to demonstrate high device efficiencies, with the
former also reporting excellent long term stability. The modification of the dye structure
led to the extension of the absorption spectrum towards the near infrared region, leading
Univers
ity of
Mala
ya
37
to conversion efficiencies of ~8-10 % (Ito, et al., 2008a). Carbazole dyes have also been
extensively studied in DSSCs (Wang, et al., 2008). These dyes offer all of the
advantages of other organic dyes, and have also been heavily utilized to study the effect
of dye structure on charge injection and recombination, owing to the ease with which
the length of the conjugated thiophene backbone can be controlled and alkyl chain
substituents of various lengths can be appended (Miyashita, et al., 2008). Perylene
(Shibano, et al., 2007) dyes have also been examined, and whilst they do not
demonstrate outstanding power conversion efficiency, they have been shown as injected
by direct charge transfer from the ground state to the TiO2 rather than from the excited
state, making them a valuable tool for the examination of some unusual photophysical
properties of the sensitizing dye (De Angelis, 2010).
Dyes with absorption bands in the infrared region have been particularly sought after,
since this is the region where solar flux is the strongest. Phthalocyanine dyes have been
examined in this context, as they have a strong absorption bands in the ~700-800 nm
region (Nazeeruddin, 1998). These dyes are of great interest since they behave as an
intermediate between transition metal complexes and purely organic dyes, with
absorption dominated by the organic framework, but the metal center impacting the
injection and recombination processes (Silvestri, et al., 2009). Phthalocyanine dyes
suffer from strong π–π stacking and aggregation, and also experience very fast
recombination, which limits their power conversion efficiencies in devices (Eu, et al.,
2008); although recent reports indicate that this class of dyes remain quite promising
(Mori, et al., 2010). Squaraine dyes have also demonstrated significant infrared
absorption in operational devices (Maeda, et al., 2011), although its small band-gap that
produces infrared absorption also limits the driving force for the regeneration between
the redox mediator and the dye HOMO level (Tatay, et al., 2007). As a result of this and
other issues such as limited injection, the power conversion of the infrared dyes remains
Univers
ity of
Mala
ya

38
low. Other dyes of interest include triarylamines (Marinado, et al., 2009), anthracenes
(Mann, et al., 2008), quinones (Mann, et al., 2008), and polymers (Hong, et al., 2002),
where each provides useful support that allows us to examine the relationship between
dye structure and device functionality (Griffith, 2012). Table 2.4 tabulates the efficiency
of DSSCs using different photosensitizers.
Univers
ity of
Mala
ya
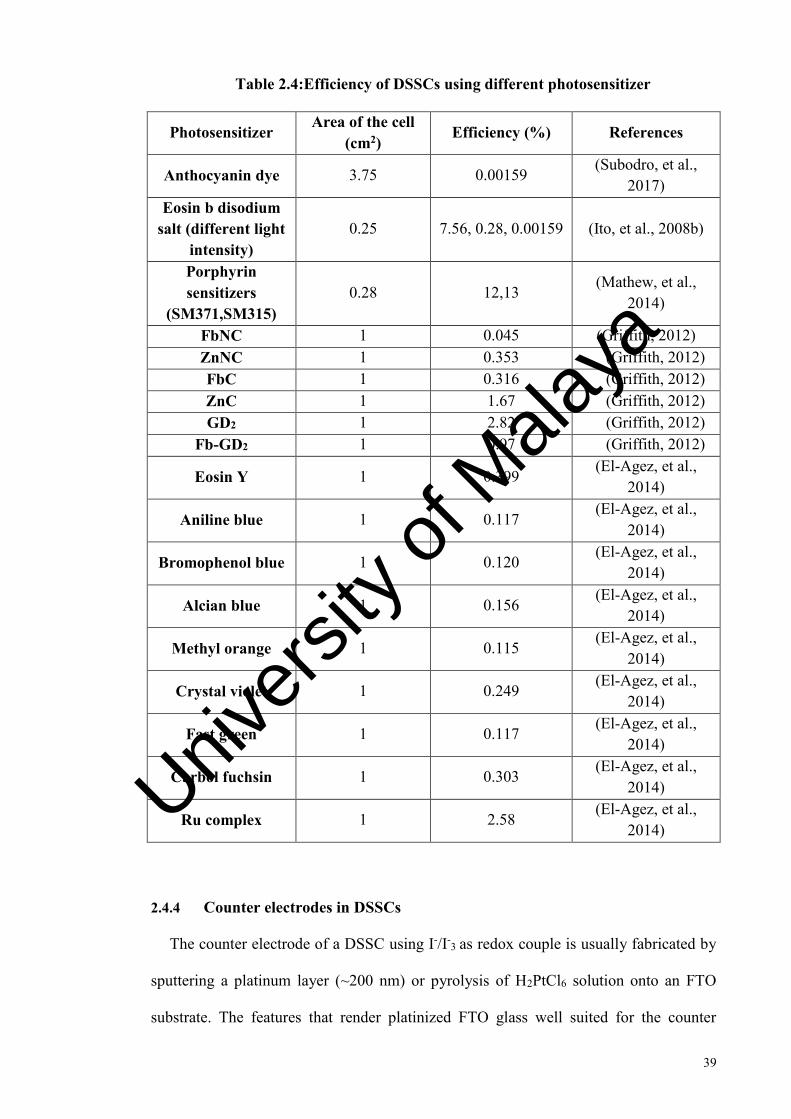
39
Table 2.4:Efficiency of DSSCs using different photosensitizer
Photosensitizer Area of the cell (cm2)
Efficiency (%) References
Anthocyanin dye 3.75 0.00159 (Subodro, et al.,
2017)
Eosin b disodium salt (different light
intensity) 0.25 7.56, 0.28, 0.00159 (Ito, et al., 2008b)
Porphyrin sensitizers
(SM371,SM315) 0.28 12,13
(Mathew, et al.,
2014)
FbNC 1 0.045 (Griffith, 2012) ZnNC 1 0.353 (Griffith, 2012) FbC 1 0.316 (Griffith, 2012) ZnC 1 1.67 (Griffith, 2012) GD2 1 2.82 (Griffith, 2012)
Fb-GD2 1 0.97 (Griffith, 2012)
Eosin Y 1 0.399 (El-Agez, et al.,
2014)
Aniline blue 1 0.117 (El-Agez, et al.,
2014)
Bromophenol blue 1 0.120 (El-Agez, et al.,
2014)
Alcian blue 1 0.156 (El-Agez, et al.,
2014)
Methyl orange 1 0.115 (El-Agez, et al.,
2014)
Crystal violet 1 0.249 (El-Agez, et al.,
2014)
Fast green 1 0.117 (El-Agez, et al.,
2014)
Carbol fuchsin 1 0.303 (El-Agez, et al.,
2014)
Ru complex 1 2.58 (El-Agez, et al.,
2014)
2.4.4 Counter electrodes in DSSCs
The counter electrode of a DSSC using I-/I-3 as redox couple is usually fabricated by
sputtering a platinum layer (~200 nm) or pyrolysis of H2PtCl6 solution onto an FTO
substrate. The features that render platinized FTO glass well suited for the counter
Univers
ity of
Mala
ya
40
electrode is the electrocatalytic activity of platinum, which improves the reduction of I3-
by facilitating electron exchange (Papageorgiou, et al., 1997) and increasing light-
refection due to the mirror-effect of platinized FTO.
Although most highly efficient DSSCs are based on a platinum counter electrode,
several disadvantages hinder its widespread application, such as limited material
availability for such a rare metal, making it unsuitable for the production of large-area
DSSCs. There are also reports proving the corrosion of platinum in I3- containing
electrolyte generating platinum iodide, such as PtI4 (Olsen, et al., 2000), indicating
problems with long-term stability of platinum electrode. It is desirable to develop
platinum-free counter electrode with excellent catalytic activity for the reduction of I3-
and excellent stability in the electrolyte.
In a previous report, a mixture of graphite and carbon black was used as the counter
electrode, which resulted in an energy conversion efficiency of 6.7 % (Kay and Grätzel,
1996). Later, several varieties of carbon materials, such as carbon nanotubes (Suzuki, et
al., 2002) and activated carbon and graphite (Imoto, et al., 2003; Lindström, et al., 2001)
were also employed as catalysts on FTO glass for counter electrodes. Organic ion-doped
conducting polymers based on poly (3,4-ethylenedioxythiophene) (PEDOT) were used
as a catalytic material, and FTO glass as the counter electrode for DSSCs with both
organic and liquid electrolytes (Imoto, et al., 2003; Saito, et al., 2002a; Saito, et al.,
2004). Although the costs of carbon materials and organic conducting polymers are
lower than that of platinum, poor adhesion to the FTO substrates and insufficient energy
conversion efficiency are disadvantages of using platinum free counter electrode
(Murakami, et al., 2006).
Univers
ity of
Mala
ya

41
2.4.5 Electrolytes in DSSCs
The role of a redox mediator is to intercept recombination between electrons in the
semiconductor and the oxidized dye molecules by regenerating the dye cation following
injection. There are three major components of the redox electrolyte, each affecting its
function.
Most high performing DSSCs are based on liquid electrolytes. This is due to their
combination of good solvation for a range of redox species, high chemical stability, and
low viscosity that minimizes diffusion limitations on redox mediator transport. Water
would be the obvious solvent of choice; however, many sensitizing chromophores are
susceptible to hydrolysis. Consequently, polar organic solvents are commonly
employed, as they satisfy the criteria of a good solvent (Hagfeldt, et al., 2010). The
drawback with these organic solvents is their volatility, which makes many choices
unsuitable for long-term stability. Currently, the most successful liquid solvent is
3-methoxypropionitrile (Boschloo, et al., 2002), since it combines a higher boiling point
with a low viscosity and high chemical stability.
Ionic liquids, where the solvent is composed of bulky anions and cations that are in a
liquid state at room temperature have also been explored as electrolyte solvents (Gorlov
and Kloo, 2008). Typically based on imidazolium derivatives, these solvents provide an
attractive alternative since they have negligible vapor pressure and high boiling points,
and can therefore provide greater long-term stability. The higher viscosity of such
solvents generally limits mass transport for the redox species. However, this can be
circumvented to a certain extent by employing strategies such as forming liquid crystals
to increase the local concentration of the redox mediator, thereby enhancing the
Grotthuss mechanism charge hopping conductivity mechanism (Yamanaka, et al., 2005;
Univers
ity of
Mala
ya
42
Yamanaka, et al., 2007). Continuous improvements in ionic liquid electrolytes have
been transferred to device power conversion efficiencies of up to 9 % (Shi, et al., 2008).
An intriguing substitute for electrolyte solvents is to remove the dissolved redox
mediator and replace it with a solid-state hole conductor. This approach has significant
practical advantages, since it removes the difficulties normally associated with the
permanent sealing of a solid-liquid junction. However, the implementation of these
electrolytes limits conductivity due to the charge hopping conductivity mechanism and
the difficulty of filling nanopores in the semiconductor with a solid material. The hole
conductor most often utilized for such studies is spiro-MeOTAD (Bach, 2000), with
efficiencies of up to 5 % reported by these solid state devices (Tetreault, et al., 2010)
which the efficiencies of them are lower than the efficiency of devices that using liquid
electrolytes.
Graphene
A planar single sheet of graphite is called a graphene, which is currently used as a
heterogeneous catalysis. Electro-catalysis and photocatalysis, which will be further
discussed herein, seem to benefit most from the properties of carbon support.
It is a common practice to assume that graphene is an even structure composed of a
few stacked carbon layers (maximum 10), as they exhibit very similar properties to
individual graphene sheets (Figure 2.6) (Cooper, et al., 2012). Univers
ity of
Mala
ya
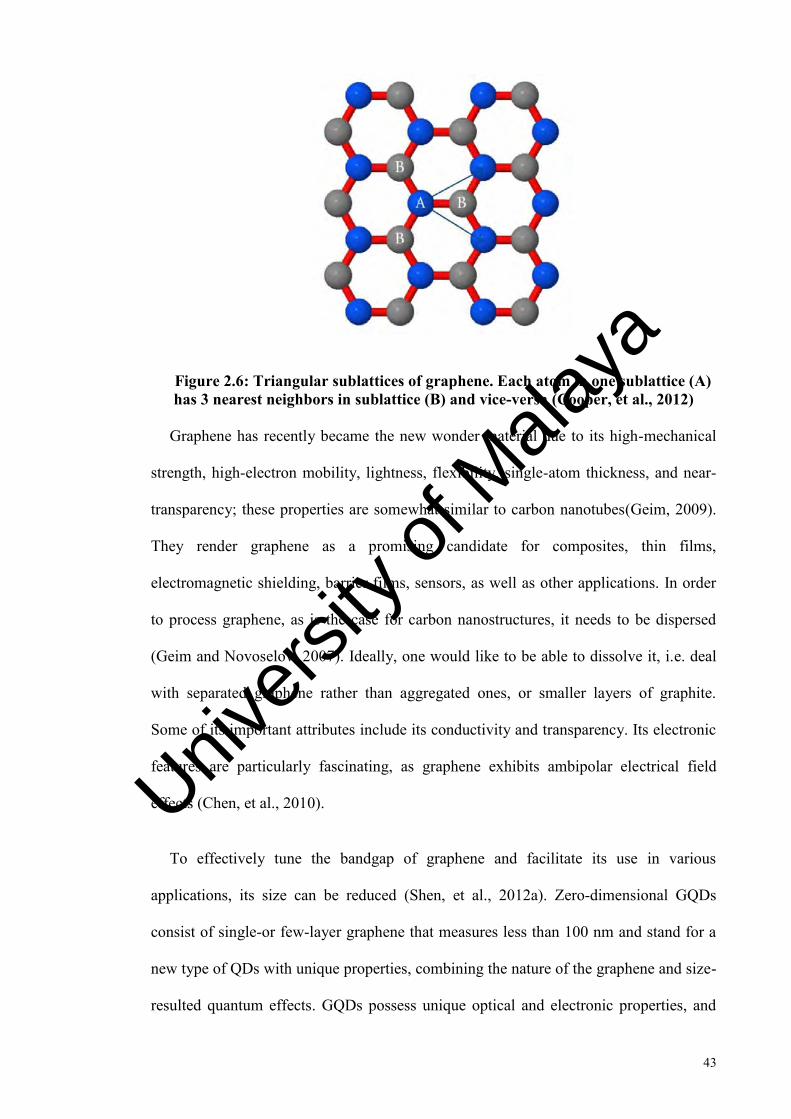
43
Figure 2.6: Triangular sublattices of graphene. Each atom in one sublattice (A) has 3 nearest neighbors in sublattice (B) and vice-versa (Cooper, et al., 2012)
Graphene has recently became the new wonder material due to its high-mechanical
strength, high-electron mobility, lightness, flexibility, single-atom thickness, and near-
transparency; these properties are somewhat similar to carbon nanotubes(Geim, 2009).
They render graphene as a promising candidate for composites, thin films,
electromagnetic shielding, barrier films, sensors, as well as other applications. In order
to process graphene, as is the case for carbon nanostructures, it needs to be dispersed
(Geim and Novoselov, 2007). Ideally, one would like to be able to dissolve it, i.e. deal
with separated graphene rather than aggregated ones, or smaller layers of graphite.
Some of its important attributes include its conductivity and transparency. Its electronic
features are particularly fascinating, as graphene exhibits ambipolar electrical field
effects (Chen, et al., 2010).
To effectively tune the bandgap of graphene and facilitate its use in various
applications, its size can be reduced (Shen, et al., 2012a). Zero-dimensional GQDs
consist of single-or few-layer graphene that measures less than 100 nm and stand for a
new type of QDs with unique properties, combining the nature of the graphene and size-
resulted quantum effects. GQDs possess unique optical and electronic properties, and
Univers
ity of
Mala
ya
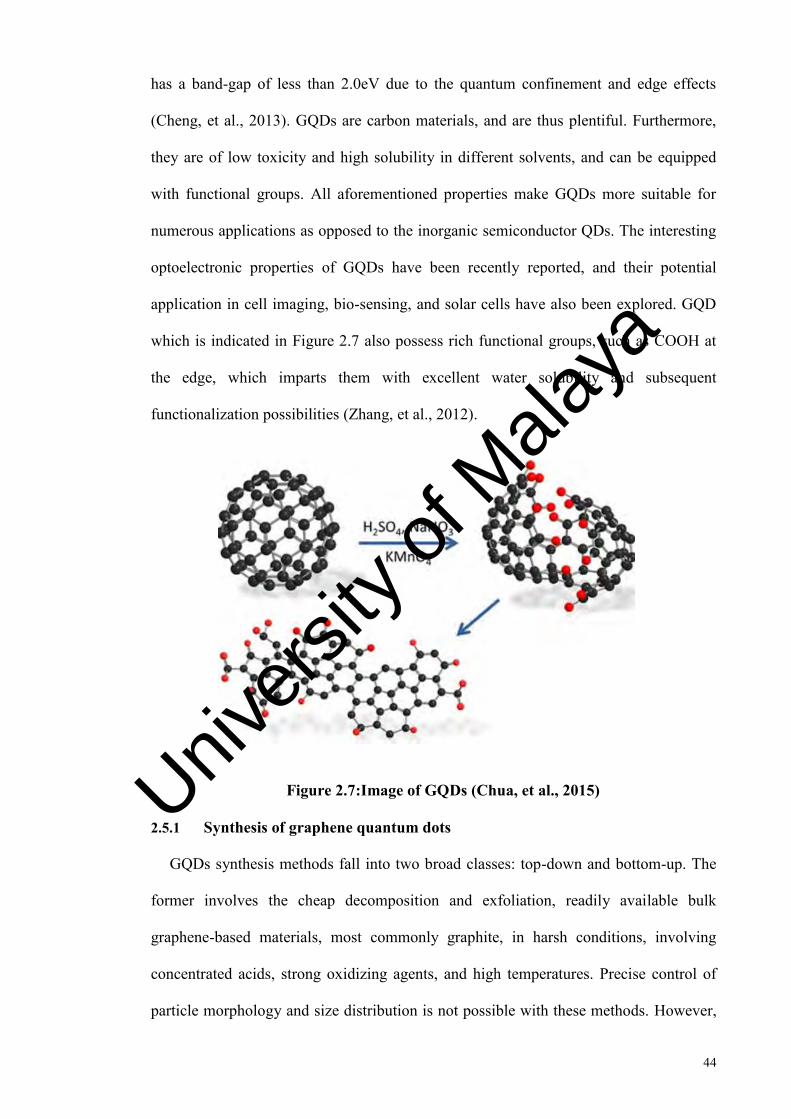
44
has a band-gap of less than 2.0eV due to the quantum confinement and edge effects
(Cheng, et al., 2013). GQDs are carbon materials, and are thus plentiful. Furthermore,
they are of low toxicity and high solubility in different solvents, and can be equipped
with functional groups. All aforementioned properties make GQDs more suitable for
numerous applications as opposed to the inorganic semiconductor QDs. The interesting
optoelectronic properties of GQDs have been recently reported, and their potential
application in cell imaging, bio-sensing, and solar cells have also been explored. GQD
which is indicated in Figure 2.7 also possess rich functional groups, such as COOH at
the edge, which imparts them with excellent water solubility and subsequent
functionalization possibilities (Zhang, et al., 2012).
Figure 2.7:Image of GQDs (Chua, et al., 2015)
2.5.1 Synthesis of graphene quantum dots
GQDs synthesis methods fall into two broad classes: top-down and bottom-up. The
former involves the cheap decomposition and exfoliation, readily available bulk
graphene-based materials, most commonly graphite, in harsh conditions, involving
concentrated acids, strong oxidizing agents, and high temperatures. Precise control of
particle morphology and size distribution is not possible with these methods. However,
Univers
ity of
Mala
ya
45
bottom-up methods, although more complex, allow for excellent control of the
properties of the final product. They involve the quantum dots synthesis of polycyclic
aromatic compounds or other molecules with aromatic structures (e.g. fullerenes) (Liu,
et al., 2011; Zhu, et al., 2017).
2.5.1.1 Top-down methods
The graphite-based starting material is converted to graphite oxide sheets via a
modified Hummers method, representing the first step in most reported methods. This
technique uses a mix of sulfuric acid, sodium nitrate, and potassium permanganate or
other similar reagents. The majority of top-down methods, such as hydrothermal
cutting, solvothermal cutting, electrochemical cutting, nanolithography,
microwave-assisted cutting, and ultrasonic shearing varies in their respective ways of
altering these GO sheets to quantum dots, and are termed accordingly (Bacon, et al.,
2014).
2.5.1.2 Bottom-up Methods
GQDs are made by (Liu, et al., 2013) from hexa-peri-hexabenzocoronene (HBC),
which is a polycyclic aromatic hydrocarbon that could be regarded as graphene
nanoscaled fragments that stack via π–π interactions. Disk-like GQDs measuring
approximately 60nm and 2–3 nm thick was produced in their work. HBC was
pyrolyzed, oxidized, functionalized, and subsequently reduced.
2.5.2 Application of graphene quantum dots in photovoltaics
The application of GQDs in photovoltaic devices represents its most suitable use, due
to extraordinary electronic properties of graphene and its ability to absorb a high
percentage of incident light.
Univers
ity of
Mala
ya

46
The improvement of the efficiency of GQD-based photovoltaics is not limited to
chemical modification. Changes in the photoelectrical properties of colloidal GQDs
were reported by Hamilton when orientated differently on polar surfaces. The
molecular device orientation on surfaces can alter their efficiency, and even
functionality, therefore, Hamilton and his co-workes investigated the effect of
orientation on the colloidal GQDs photoelectric properties in solution by adjusting its
orientation on a water and mica substrate. The arrangement of the GQDs on the
substrate (water) was determined by the strength of the molecule–water interaction and
the co-facial molecule–water interaction (Hamilton, et al., 2011).
The colloidal GQDs used by Hamilton were produced via the synthetic approach
reported by (Pan, et al., 2010), which results in the carboxylated GQDs. Three types of
GQDs were synthesized to obtain differing degrees of carboxylic acid modification,
differing numbers of attached alkyl chains (2′, 4′, 6′-trialkyl phenyl), and sizes. The
aggregation of the GQDs was prevented by the alkyl chains, which, due to steric
constraints, twist in a 3D configuration, creating a cage around the graphene core. The
photoinduced charge injection could potentially be tuned via alignment effects for
increased cell performance.
GQDs have been investigated for use in DSSCs. A DSSC device consists of a
sensitized photoelectrode (typically TiO2), an electrolyte, and a counter electrode (CE),
which is commonly made from platinum. GQDs could increase the efficiency of
DSSCs, as they can be used as both photo-anode sensitizers (Li, et al., 2011; Pan, et al.,
2013) and composite materials in counter electrodes (Chen, et al., 2013). The size and
synthesis-dependent optical properties, efficient multiple carrier generation, high PL
quantum yields, tunable band gaps, high electron mobility, and high specific surface
areas render GQDs suitable for DSSCs.
Univers
ity of
Mala
ya
47
As briefly mentioned in the synthesis section, (Yan, et al., 2010) synthesized large
(168 conjugated carbon) GQDs for photovoltaic applications, demonstrating maximum
absorbance at 591nm. The GQDs had a molar absorption coefficient that is an order of
magnitude larger than metal complexes used in DSSCs (1.0 × 10⁴ M−1). Yan and his
group studied the photoelectrical properties of these GQDs on a TiO2 photo-anode,
which was constructed by the immersion of nanocrystalline thin films of TiO2 on
conducting glass in a toluene/ethanol mixture containing GQDs. The authors calculated
the energy of the HOMO (5.3 eV) and LUMO (3.8 eV) of the GQDs, which, when
compared to the relative bands of TiO2 and the reduction potential of the I-/I-3
electrolyte, theoretically allows for the sensitization of TiO2 by GQDs.
Yan was able to produce an open current voltage of 0.48 V, however, he postulated
that the efficiency can be increased by tuning functionalization of GQDs and surface
chemistry, and increasing the affinity of the GQDs with the TiO2 surfaces via similar
modifications.
Pan and his co-workers recently fabricated photo-electrocatalysts using GQD-
sensitized nano-tube arrays. TiO2 nanotube arrays were selected by the authors due to
their high n-type photoconductivity (excess free electrons), large internal surface area,
excellent stability, and environmental friendliness. The GQDs were prepared by a
hydrothermal method (Chen, et al., 2013) and were complexed with the TiO2 nanotube
arrays via vacuum-assisted filling and electrophoretic filling, with the latter being
preferred due to poor GQD deposition on the TiO2 nanotube arrays when using the
former. The GQD-TiO2 nanotube arrays hetero-junctions showed exhibited photo-
electrochemical activity over unfilled TiO2 nanotube arrays and those reported for the
CdS filled arrays. The researchers reported that visible light excitation of GQDs resulted
in electron transfer to the TiO2, and inferred that the mechanism for electron transfer
Univers
ity of
Mala
ya

48
would lead to highly active holes on the surface of the GQDs, which would oxidize
water, producing hydroxyl radicals. Pan suggested that such a mechanism (with
production of a -OH radical) could be useful for decomposing organic pollutants in
water to CO2 and H2O.
(Li, et al., 2011) used green-luminescent GQDs and poly (3-hexylthiophene) (P3HT)
to construct a bulk hetero-junction polymer. They constructed a photovoltaic cell, where
an electron transport cascade results in an electric current, and showed that the addition
of GQDs to the active layer (P3HT) improved the performance of the cell, reporting an
open circuit voltage of 0.67 V (conversion efficiency of 1.28 %). The increased
performance is probably due to the high electron mobility within the GQDs. The low FF
(conversion efficiency) can be attributed to the lack of device optimization in common
with novel constructions. (Kim, et al., 2013) reported a similar system with a
significantly improved performance.
(Chen, et al., 2013) recently synthesized a GQD-doped polypyrrole counter
electrode, where GQDs were synthesized via the oxidation of carbon black and added to
a pyrrole/lithium perchlorate solution. This complex was doped onto FTO glass by
electrochemical deposition.
For the fabrication of the DSSC, an I-/I-3 electrolyte was sandwiched between the
counter electrode and a TiO2 photo-anode. Doping the polypyrrole with GQDs resulted
in a more porous structure, with more active sites and higher charge transfer rate of
electrolyte reduction. A 10 % doping with GQDs results in the highest PCE, which is
close to that afforded by a platinum counter electrode.
Gupta and his group also used GQD/polymer blends to improve the optoelectronic
properties of photovoltaic devices containing graphene-based materials. They intend to
Univers
ity of
Mala
ya
49
develop low-cost donor/acceptor materials for photovoltaic applications. They showed
that GQD-polymer blends performed better than graphene-sheet-blended polymers.
GQDs were synthesized via a hydrothermal method (Gupta, et al., 2011), and were then
functionalized with aniline (ANI-GQDs). Two types of cells were constructed; cells
with the blended ANI-GQD-functionalized polymers (P3HT/ ANI-GQD), and cells with
graphene-sheet-aniline-functionalized polymers (P3HT/ ANIGSs). The peak
performance for the P3HT/ANI-GQD was for a device consisting of 1 wt % ANI-GQD.
The researchers determined the morphology of the blends using atomic force
microscopy, and it was found that while the GQD blend showed uniform morphology
and nano-scale phase separation, the graphene sheet blend showed large-scale phase
separation, which increased resistance for exciton migration and subsequently decreased
performance (Oueiny, et al., 2014).
A ZnO/GQD solid-state solar cell was recently constructed by (Dutta, et al., 2012).
They synthesized GQDs using a top-down approach, which were used to infiltrate and
cover ZnO nanowire arrays grown on aluminum doped ZnO thin films by repeated spin-
casting of an ethanolic suspension of GQDs on the nanowires. They then deposited a
60–70 nm layer of N,N′-diphenyl-N,N′-bis(3-methylphenyl)-1,1′-biphenyl)-4,4′-
diamine to act as a hole transporting layer. The device was then annealed, and a gold
electrode was sputtered on the TPD layer (Bacon, et al., 2014).
The researchers verified the charge transfer at the interface between the photo-
excited GQDs and ZnO nanowires via emission spectroscopy and photovoltaic
measurements. The open circuit voltage was reported to be 0.8 V without any
optimization (Ebrahimi, et al., 2016).
Williams and his co-workers reported a hot electron injection and charge
recombination dynamics for graphene QDs, anchored to the semiconductor surface via
Univers
ity of
Mala
ya

50
carboxyl linkers using femtosecond time-resolved second harmonic generation. They
found ultrafast electron injection from photo-excited graphene QDs to the
semiconductor conduction band with time constant (Williams, et al., 2013).
Univers
ity of
Mala
ya
51
CHAPTER 3: MATERIALS AND CHEMICALS
This chapter provides a detailed account of the synthesis of TiO2 and ZnO
nanoparticles using as a photo-anodes for DSSCs application. It will also detail the
preparation of GQDs from GO and using GQDs as a photosensitizer in DSSCs. This
chapter also discusses the fabrication of DSSCs by coating different layers of TiO2 and
ZnO nanoparticles to observe the effect of the thickness of the photo-anode on the
performance of DSSCs. The principles of the analytical techniques used in the
characterization of physical and chemical properties of materials will be discussed as
well.
Materials
Graphite powder, H2SO4, H3PO4, KMnO4, Na2HPO4, NaH2PO4, KCl, TTIP, zinc
acetate dihydrated (Zn(CH3COO)2.2H2O), ethanol, methanol, NaOH and Triton-X100
were purchased from Sigma-Aldrich. Ruthenium polypyridyl dye N-719, purchased
from Solaronix and used as a photosensitizer.
Synthesis and characterization of transition metal oxide nanoparticles
As shown in Figure 3.1, in order to synthesize the TMO nanoparticles, the source of
transition metals such as titanium and zinc will be prepared in stirred ethanol.
TiO2 nanoparticles were prepared by hydrothermal reaction of titanium isopropoxide
in an acidic ethanol-water solution. TTIP was added dropwise to a mixed ethanol and
water solution at pH 0.7 with nitric acid, and transferred into a Teflon-lined sealed
stainless steel autoclaves at 240 °C for 4 h. The TiO2 nanoparticles synthesized under
this acidic ethanol-water environment were mainly primary structure in the anatase
phase without secondary structure. The sizes of the particles were controlled to the
range of 7-25 nm by adjusting the concentration of Ti precursor and the composition of
Univers
ity of
Mala
ya
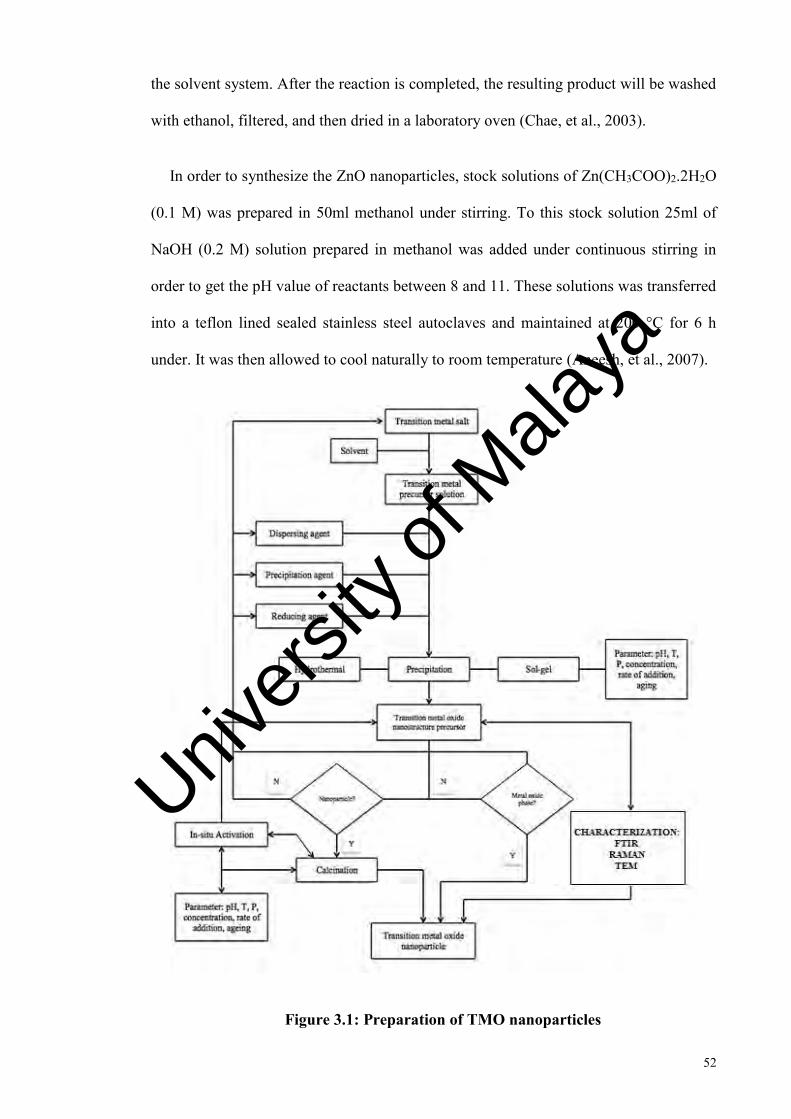
52
the solvent system. After the reaction is completed, the resulting product will be washed
with ethanol, filtered, and then dried in a laboratory oven (Chae, et al., 2003).
In order to synthesize the ZnO nanoparticles, stock solutions of Zn(CH3COO)2.2H2O
(0.1 M) was prepared in 50ml methanol under stirring. To this stock solution 25ml of
NaOH (0.2 M) solution prepared in methanol was added under continuous stirring in
order to get the pH value of reactants between 8 and 11. These solutions was transferred
into a teflon lined sealed stainless steel autoclaves and maintained at 200 °C for 6 h
under. It was then allowed to cool naturally to room temperature (Aneesh, et al., 2007).
Figure 3.1: Preparation of TMO nanoparticles
Univers
ity of
Mala
ya

53
Dye Solution
In order to prepare GQDs, the first step is to synthesize graphite oxide from graphite
using the modified Hummer’s method which the process is shown in Figure 3.2.
The properties of GQDs were compared to a benchmark ruthenium polypyridyl dye
N-719, purchased from Solaronix and used as is without further purification.
3.3.1 Synthesis and characterization of graphene oxide
GO will be obtained by oxidizing graphite flakes with sulfuric acid (H2SO4),
phosphoric acid (H3PO4), and potassium permanganate (KMnO4). The mixture will be
stirred to oxidize graphite. The formed graphite oxide will be washed thrice with HCl
using a centrifuge, and repeatedly washed with deionized water until its pH is ~4–5.
During the washing process with deionized water, the graphite oxide underwent
exfoliation, which results in the thickening of the GO solution, leading to the formation
of GO gel (Shahriary and Athawale, 2014).
Univers
ity of
Mala
ya
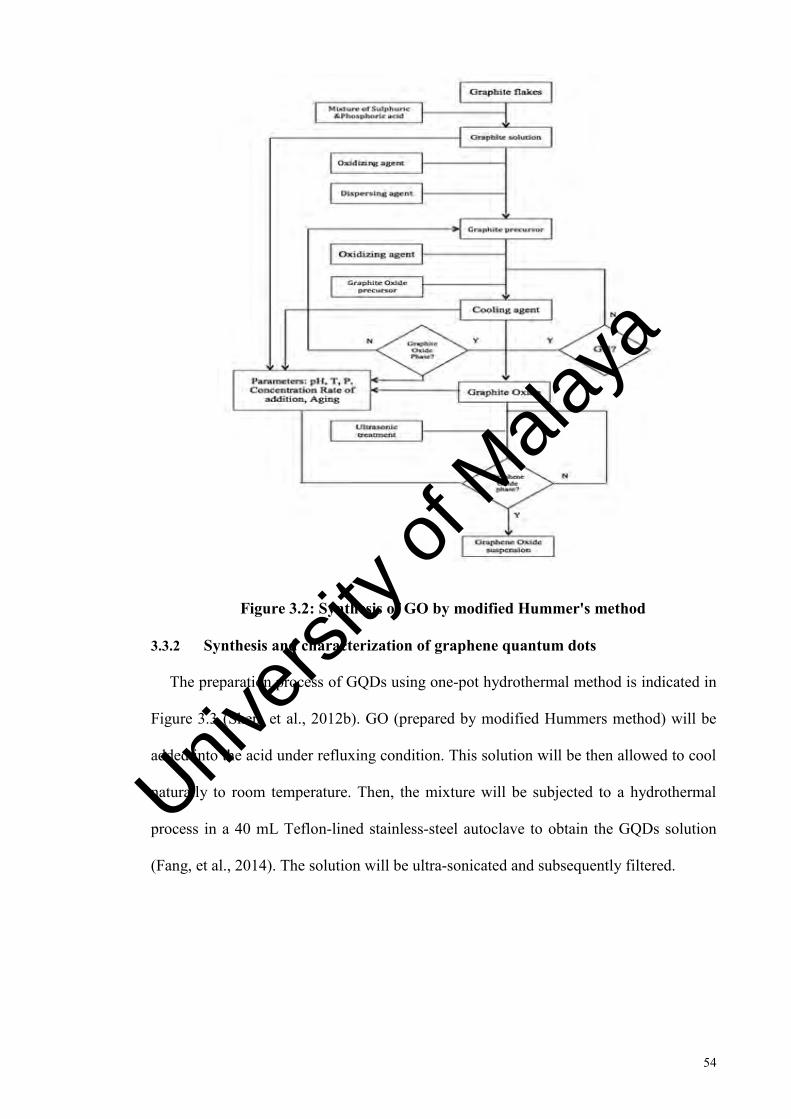
54
Figure 3.2: Synthesis of GO by modified Hummer's method
3.3.2 Synthesis and characterization of graphene quantum dots
The preparation process of GQDs using one-pot hydrothermal method is indicated in
Figure 3.3 (Shen, et al., 2012b). GO (prepared by modified Hummers method) will be
added into the acid under refluxing condition. This solution will be then allowed to cool
naturally to room temperature. Then, the mixture will be subjected to a hydrothermal
process in a 40 mL Teflon-lined stainless-steel autoclave to obtain the GQDs solution
(Fang, et al., 2014). The solution will be ultra-sonicated and subsequently filtered.
Univers
ity of
Mala
ya
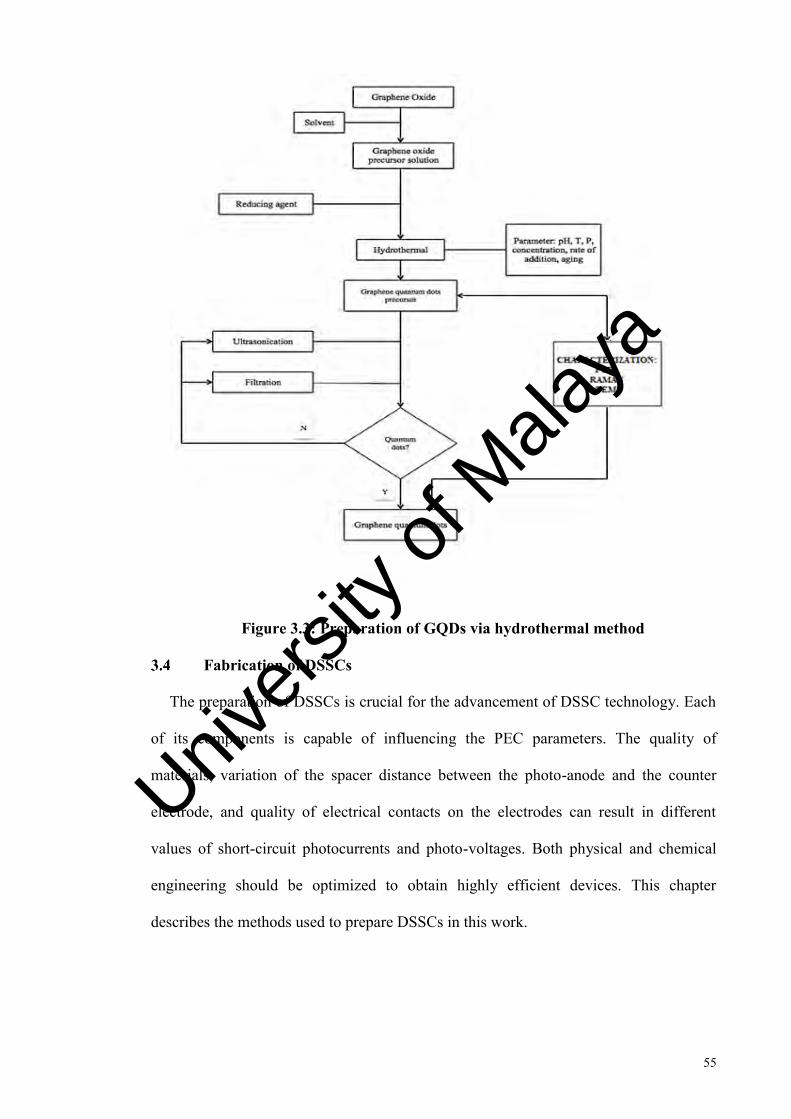
55
Figure 3.3: Preparation of GQDs via hydrothermal method
Fabrication of DSSCs
The preparation of DSSCs is crucial for the advancement of DSSC technology. Each
of its components is capable of influencing the PEC parameters. The quality of
materials, variation of the spacer distance between the photo-anode and the counter
electrode, and quality of electrical contacts on the electrodes can result in different
values of short-circuit photocurrents and photo-voltages. Both physical and chemical
engineering should be optimized to obtain highly efficient devices. This chapter
describes the methods used to prepare DSSCs in this work.
Univers
ity of
Mala
ya
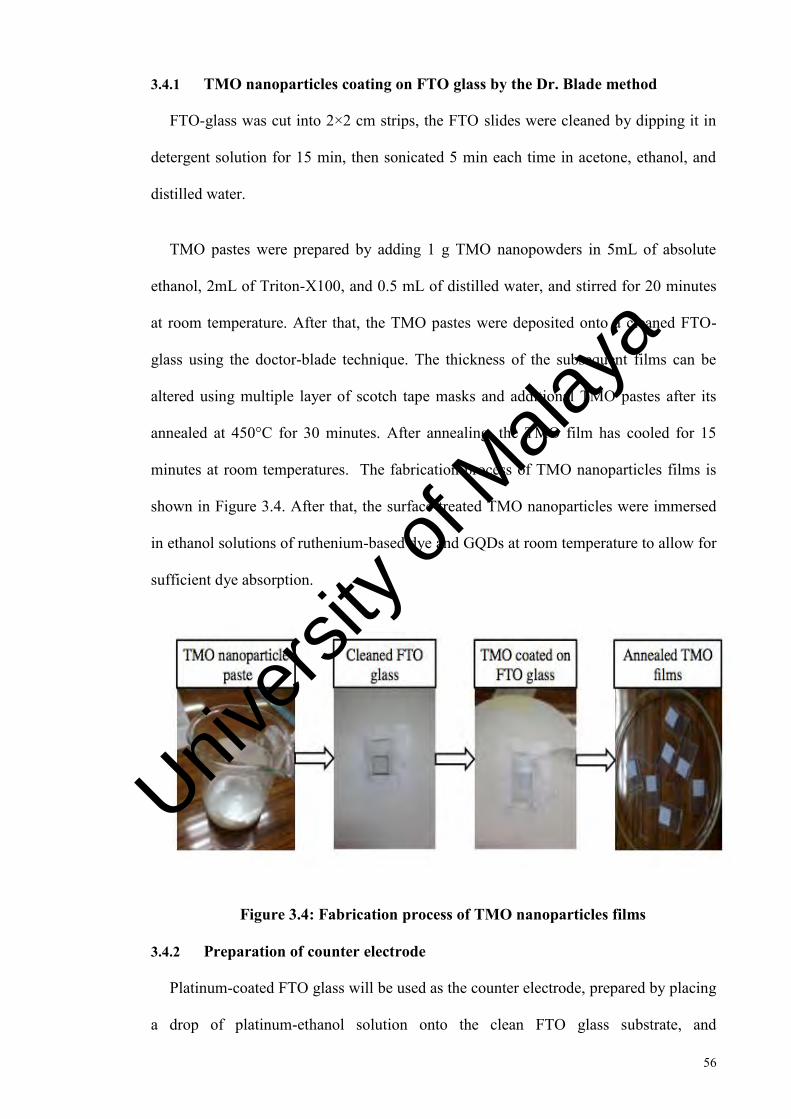
56
3.4.1 TMO nanoparticles coating on FTO glass by the Dr. Blade method
FTO-glass was cut into 2×2 cm strips, the FTO slides were cleaned by dipping it in
detergent solution for 15 min, then sonicated 5 min each time in acetone, ethanol, and
distilled water.
TMO pastes were prepared by adding 1 g TMO nanopowders in 5mL of absolute
ethanol, 2mL of Triton-X100, and 0.5 mL of distilled water, and stirred for 20 minutes
at room temperature. After that, the TMO pastes were deposited onto a cleaned FTO-
glass using the doctor-blade technique. The thickness of the subsequent films can be
altered using multiple layer of scotch tape masks and additional TMO pastes after its
annealed at 450°C for 30 minutes. After annealing, the TMO film has cooled for 15
minutes at room temperatures. The fabrication process of TMO nanoparticles films is
shown in Figure 3.4. After that, the surface-treated TMO nanoparticles were immersed
in ethanol solutions of ruthenium-based dye and GQDs at room temperature to allow for
sufficient dye absorption.
Figure 3.4: Fabrication process of TMO nanoparticles films
3.4.2 Preparation of counter electrode
Platinum-coated FTO glass will be used as the counter electrode, prepared by placing
a drop of platinum-ethanol solution onto the clean FTO glass substrate, and
Univers
ity of
Mala
ya

57
subsequently sintered. The fabrication process of the photocathode is shown in Figure
3.5.
Figure 3.5: Fabrication process of TMO nanoparticles films
The DSSC will be sandwiched between the TMO nanoparticles paste-coated FTO
glass (anode) and the platinum coated onto FTO glass (cathode). The fabrication
process of the DSSC is shown in Figure 3.6.
Univers
ity of
Mala
ya
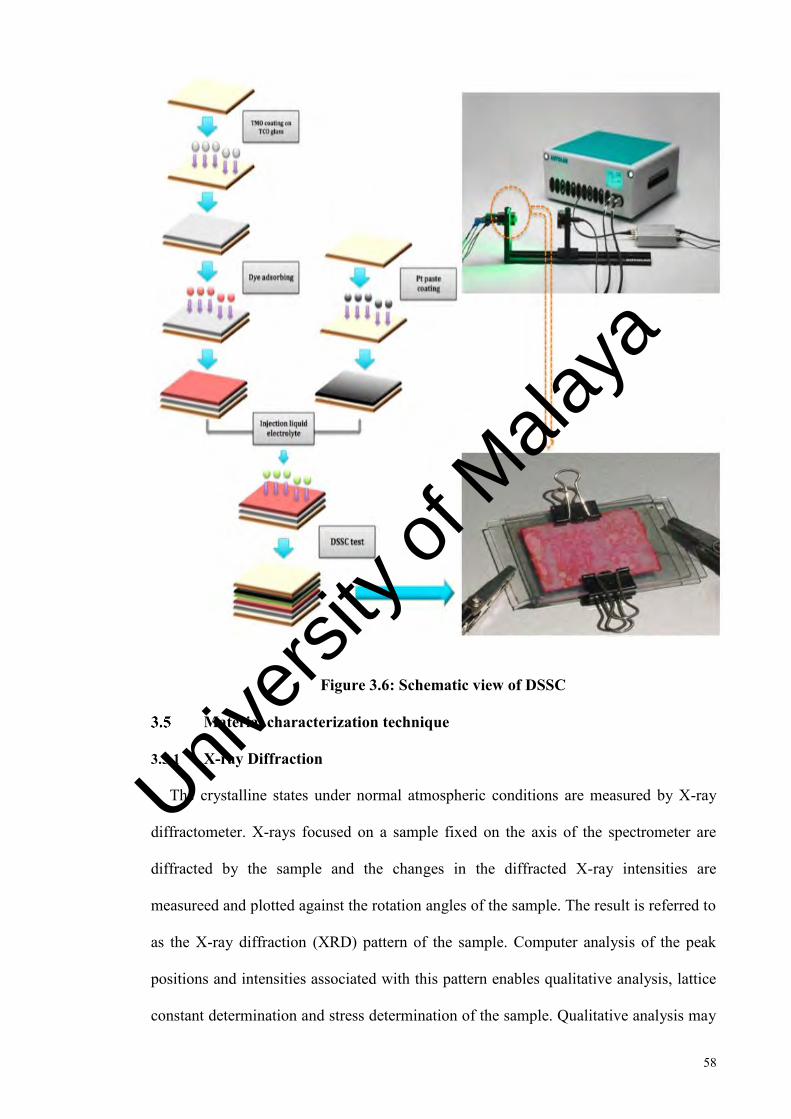
58
Figure 3.6: Schematic view of DSSC
Material characterization technique
3.5.1 X-ray Diffraction
The crystalline states under normal atmospheric conditions are measured by X-ray
diffractometer. X-rays focused on a sample fixed on the axis of the spectrometer are
diffracted by the sample and the changes in the diffracted X-ray intensities are
measureed and plotted against the rotation angles of the sample. The result is referred to
as the X-ray diffraction (XRD) pattern of the sample. Computer analysis of the peak
positions and intensities associated with this pattern enables qualitative analysis, lattice
constant determination and stress determination of the sample. Qualitative analysis may
Univers
ity of
Mala
ya

59
be conducted on the basis of peak height or peak area. The peak angles and profiles can
be used to determine particle diameters and degree of crystallization, and are useful in
conducting precise X-ray structural analysis (Rahima, 2008). XRD was used to identify
the crystal phase and estimate crystal size (Bruker-D8).
3.5.2 Fourier Transform Infrared Spectroscopy
Fourier transform infrared spectroscopy (FTIR) is a technique to determine the
functional group in the samples. 200 mg of potassium bromide and 1% of the samples
were mixed and made the pellets by pressing at 10 tonnes for preparing KBr disc. The
FTIR spectra of samples were characterized by a Bruker IFS 66/S FTIR (Germany) with
4 cm-1 resolution.
3.5.3 Field Emission Scanning Electron Microscopy
The morphologies and thicknesses of TiO2 and ZnO nanostructure coated on FTO
glasses were studied by Field Emission Scanning Electron Microscopy (FESEM) that
scans the sample with a focused beam of electrons and as a result of the bombardment
different type of electrons is coming out from the specimen.
The schematic diagram of FESEM can be seen in Figure 3.7. The secondary
electrons are collected or detected by a detector. The surface image of the sample is
built up by comparing the intensity of these secondary electrons with the scanning
primary electron beam. The FESEM images of samples were captured by a scanning
electron microscopy of Model: Nova Nanosem 230. Univ
ersity
of M
alaya
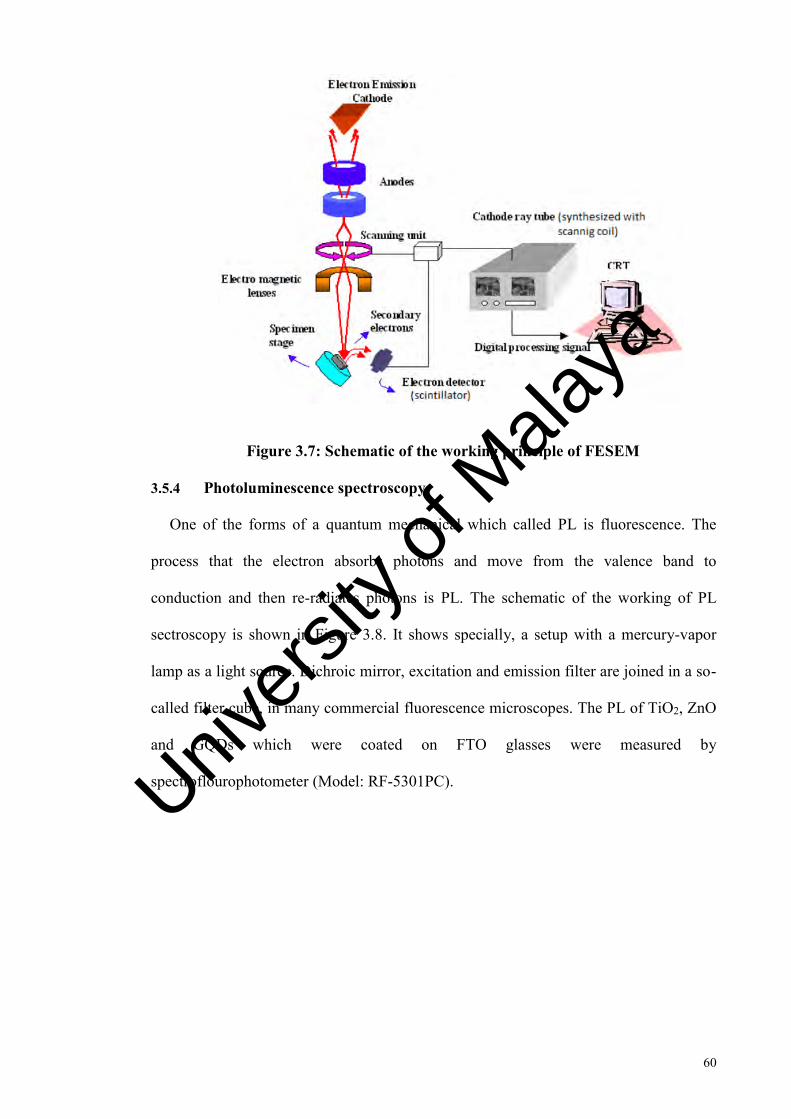
60
Figure 3.7: Schematic of the working principle of FESEM
3.5.4 Photoluminescence spectroscopy
One of the forms of a quantum mechanical which called PL is fluorescence. The
process that the electron absorbs photons and move from the valence band to
conduction and then re-radiates photons is PL. The schematic of the working of PL
sectroscopy is shown in Figure 3.8. It shows specially, a setup with a mercury-vapor
lamp as a light source. Dichroic mirror, excitation and emission filter are joined in a so-
called filter cube, in many commercial fluorescence microscopes. The PL of TiO2, ZnO
and GQDs which were coated on FTO glasses were measured by
spectroflourophotometer (Model: RF-5301PC). Univers
ity of
Mala
ya

61
Figure 3.8: Schematic of the working principle of PL spectroscopy
3.5.5 UV-Visible Spectrophotometry
UV-Visible spectra of GQDs, TiO2 and ZnO nanoparticles were obtained between
300 nm and 750 nm with the spectral acquisition range extended out to 850 nm for the
N-719 dye. Solution state UV-visible spectra were measured on a Shimadzu UV 1601
spectrophotometer connected to a PC running UV-Vis Probe software.
3.5.6 Raman Spectroscopy
The Raman spectra of GQDs were obtained using a Renishaw inVia™ confocal
Raman microscope employing a 532 nm excitation wavelength to confirm the reduction
of graphene. Excitation was provided by a HeNe laser (Melles Griot). The exciting laser
radiation was coupled into a Zeiss microscope through a wavelength-specific single
mode optical fiber. The incident laser beam was collimated via an achromatic lens and
passes a holographic band-pass filter before it was focused onto the sample through the
microscope objective. The sample is located on a piezo-electrically driven microscope
scanning stage with an x, y resolution of ca. 3 nm and a repeatability of 5nm, and z
resolution of ca. 0.3 nm and 2 nm repeatability. The Raman back-scattered radiation
Univers
ity of
Mala
ya
62
was detected by a back-illuminated deep depletion, 1024 128 pixel charge-coupled
device camera operating at -82.
3.5.7 Brunauer-Emmett-Teller (BET) Surface Area Analysis
The Brunauer-Emmett-Teller (BET) theory (an extension of the Langmuir adsorption
theory44) uses gas adsorption to determine surface area was proposed in 1938. BET has
since become the most extensively used method to calculate surface area of adsorbent
materials, including nanocatalysts and catalyst supports. BET theory assumes that gas
molecules are adsorbed randomly onto a surface of equivalent sites with no interaction
between adsorbed molecules in the same layer. It further assumes that each layer of gas
molecules are essentially the ‘first’ layer on the adsorbent, with each subsequent
adsorbed layer behaving as the surface of the adsorbent, therefore, the rate of adsorption
and the heat of condensation do not change between subsequent layers (Olsen, 2013).
3.5.8 High Resolution Transmission Electron Microscopy
Transmission electron microscopy (TEM) images of as-received nanostructures were
captured using Philips PW 6061 TEM system (model CM 200, Eindhoven, Netherlands)
to analyze the dimension and structure of nanostructures. FEIG-4020, 500kV high-
resolution transmission electron microscopy (HRTEM) was used to study GQDs
structure.
Photovoltaic performance
3.6.1 Current-voltage characteristics
One of the most essential measurements of a solar cell is the current-voltage (I-V)
measurement. In order to be able to compare performances of solar cells the I-V curve is
measured under the illumination of a lamp with a spectrum similar to the AM1.5G
illumination (Figure 3.9). The AM1.5G spectrum is the spectrum of sunlight that has
traveled 1.5 times the thickness of the atmosphere. The intensity of the illumination is
Univers
ity of
Mala
ya
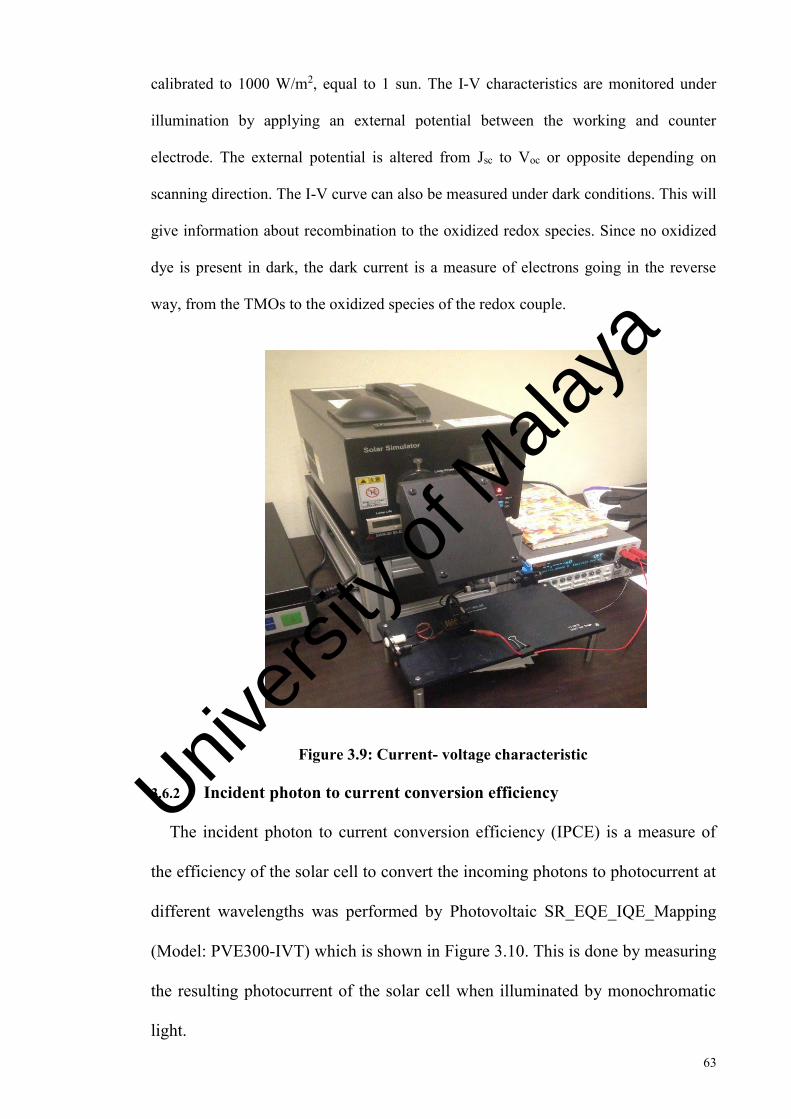
63
calibrated to 1000 W/m2, equal to 1 sun. The I-V characteristics are monitored under
illumination by applying an external potential between the working and counter
electrode. The external potential is altered from Jsc to Voc or opposite depending on
scanning direction. The I-V curve can also be measured under dark conditions. This will
give information about recombination to the oxidized redox species. Since no oxidized
dye is present in dark, the dark current is a measure of electrons going in the reverse
way, from the TMOs to the oxidized species of the redox couple.
Figure 3.9: Current- voltage characteristic
3.6.2 Incident photon to current conversion efficiency
The incident photon to current conversion efficiency (IPCE) is a measure of
the efficiency of the solar cell to convert the incoming photons to photocurrent at
different wavelengths was performed by Photovoltaic SR_EQE_IQE_Mapping
(Model: PVE300-IVT) which is shown in Figure 3.10. This is done by measuring
the resulting photocurrent of the solar cell when illuminated by monochromatic
light.
Univers
ity of
Mala
ya

64
Figure 3.10: Incident photon to current conversion efficiency
3.6.3 Electrochemical Impedance Spectroscopy
Electrochemical impedance spectroscopy is a recent tool in corrosion and solid state
laboratories that are slowly making its way into the service environment as units are
decreased in size and become portable. Impedance Spectroscopy is also called AC
Impedance or just Impedance Spectroscopy.
The usefulness of impedance spectroscopy lies in the ability to distinguish the
dielectric and electrical properties of individual contributions of components under
investigation. In order to gain deeper insight into the interfacial charge transfer process
within the fabricated bio-electrode, the electrochemical impedance spectra (EIS) were
recorded in a frequency range between 0.01 Hz and 100 kHz. All electrochemical
measurements were performed using a computer controlled Potentiostat/Galvanostat
(302N Autolab).
Univers
ity of
Mala
ya
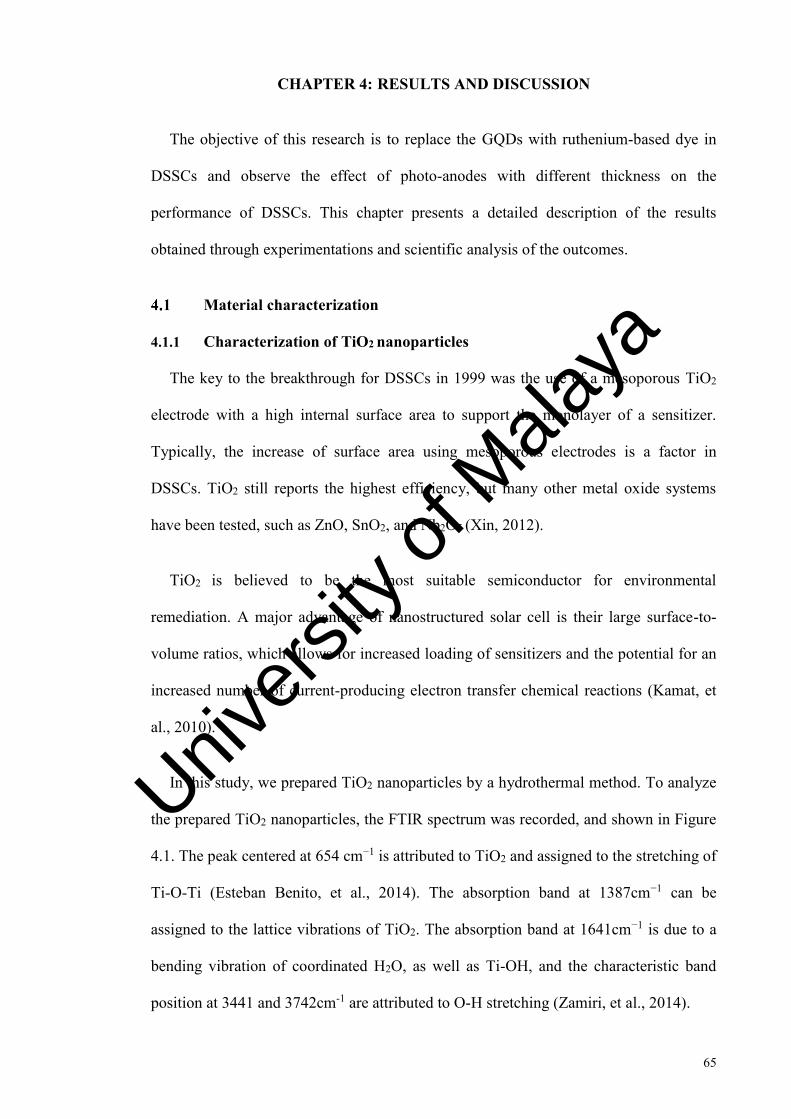
65
CHAPTER 4: RESULTS AND DISCUSSION
The objective of this research is to replace the GQDs with ruthenium-based dye in
DSSCs and observe the effect of photo-anodes with different thickness on the
performance of DSSCs. This chapter presents a detailed description of the results
obtained through experimentations and scientific analysis of the outcomes.
Material characterization
4.1.1 Characterization of TiO2 nanoparticles
The key to the breakthrough for DSSCs in 1999 was the use of a mesoporous TiO2
electrode with a high internal surface area to support the monolayer of a sensitizer.
Typically, the increase of surface area using mesoporous electrodes is a factor in
DSSCs. TiO2 still reports the highest efficiency, but many other metal oxide systems
have been tested, such as ZnO, SnO2, and Nb2O5 (Xin, 2012).
TiO2 is believed to be the most suitable semiconductor for environmental
remediation. A major advantage of nanostructured solar cell is their large surface-to-
volume ratios, which allows for increased loading of sensitizers and the potential for an
increased number of current-producing electron transfer chemical reactions (Kamat, et
al., 2010).
In this study, we prepared TiO2 nanoparticles by a hydrothermal method. To analyze
the prepared TiO2 nanoparticles, the FTIR spectrum was recorded, and shown in Figure
4.1. The peak centered at 654 cm−1 is attributed to TiO2 and assigned to the stretching of
Ti-O-Ti (Esteban Benito, et al., 2014). The absorption band at 1387cm−1 can be
assigned to the lattice vibrations of TiO2. The absorption band at 1641cm−1 is due to a
bending vibration of coordinated H2O, as well as Ti-OH, and the characteristic band
position at 3441 and 3742cm-1 are attributed to O-H stretching (Zamiri, et al., 2014).
Univers
ity of
Mala
ya
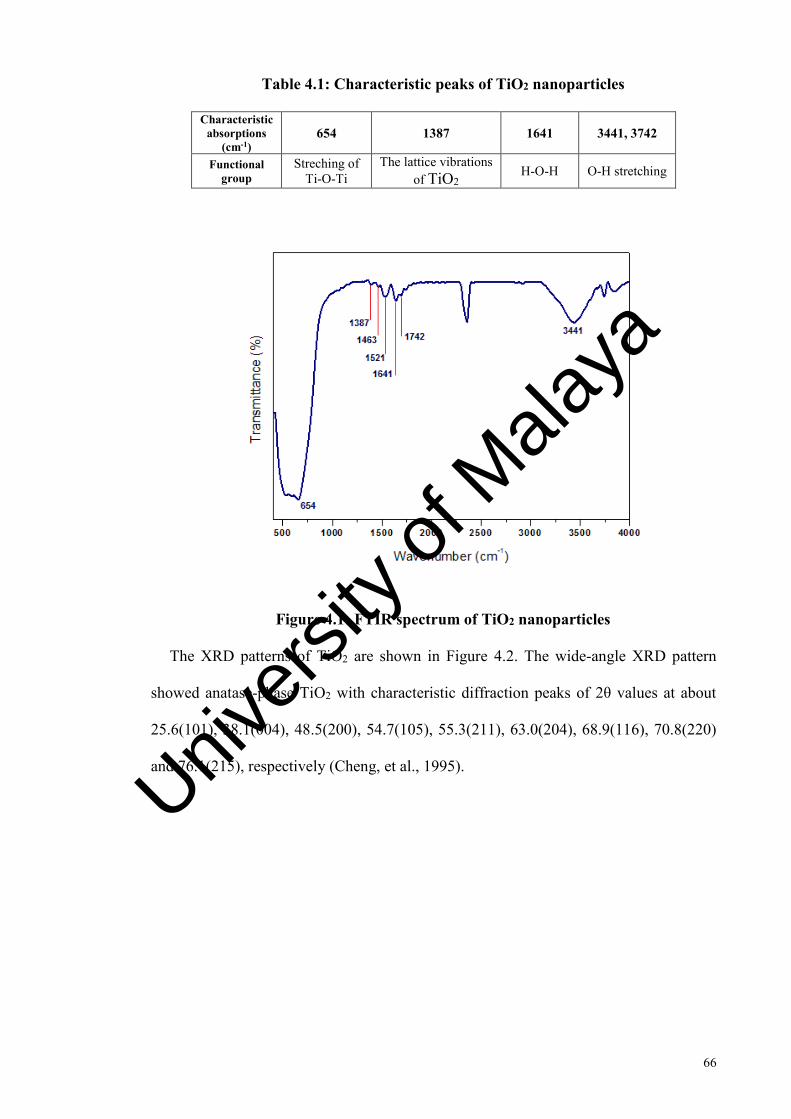
66
Table 4.1: Characteristic peaks of TiO2 nanoparticles
Characteristic absorptions
(cm-1) 654 1387 1641 3441, 3742
Functional group
Streching of Ti-O-Ti
The lattice vibrations of TiO2 H-O-H O-H stretching
Figure 4.1: FTIR spectrum of TiO2 nanoparticles
The XRD patterns of TiO2 are shown in Figure 4.2. The wide-angle XRD pattern
showed anatase-phase TiO2 with characteristic diffraction peaks of 2θ values at about
25.6(101), 38.1(004), 48.5(200), 54.7(105), 55.3(211), 63.0(204), 68.9(116), 70.8(220)
and 76.1(215), respectively (Cheng, et al., 1995).
Univers
ity of
Mala
ya
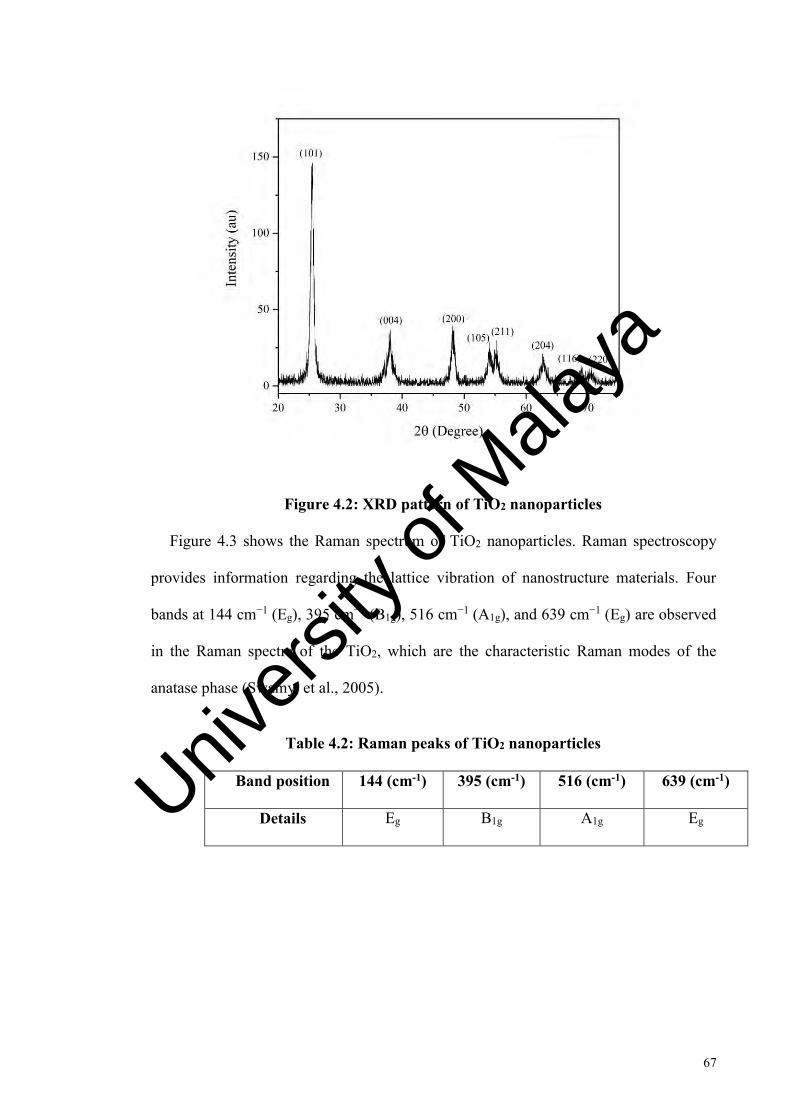
67
Figure 4.2: XRD pattern of TiO2 nanoparticles
Figure 4.3 shows the Raman spectrum of TiO2 nanoparticles. Raman spectroscopy
provides information regarding the lattice vibration of nanostructure materials. Four
bands at 144 cm−1 (Eg), 395 cm−1 (B1g), 516 cm−1 (A1g), and 639 cm−1 (Eg) are observed
in the Raman spectra of the TiO2, which are the characteristic Raman modes of the
anatase phase (Swamy, et al., 2005).
Table 4.2: Raman peaks of TiO2 nanoparticles
Band position 144 (cm-1) 395 (cm-1) 516 (cm-1) 639 (cm-1)
Details Eg B1g A1g Eg
Univers
ity of
Mala
ya
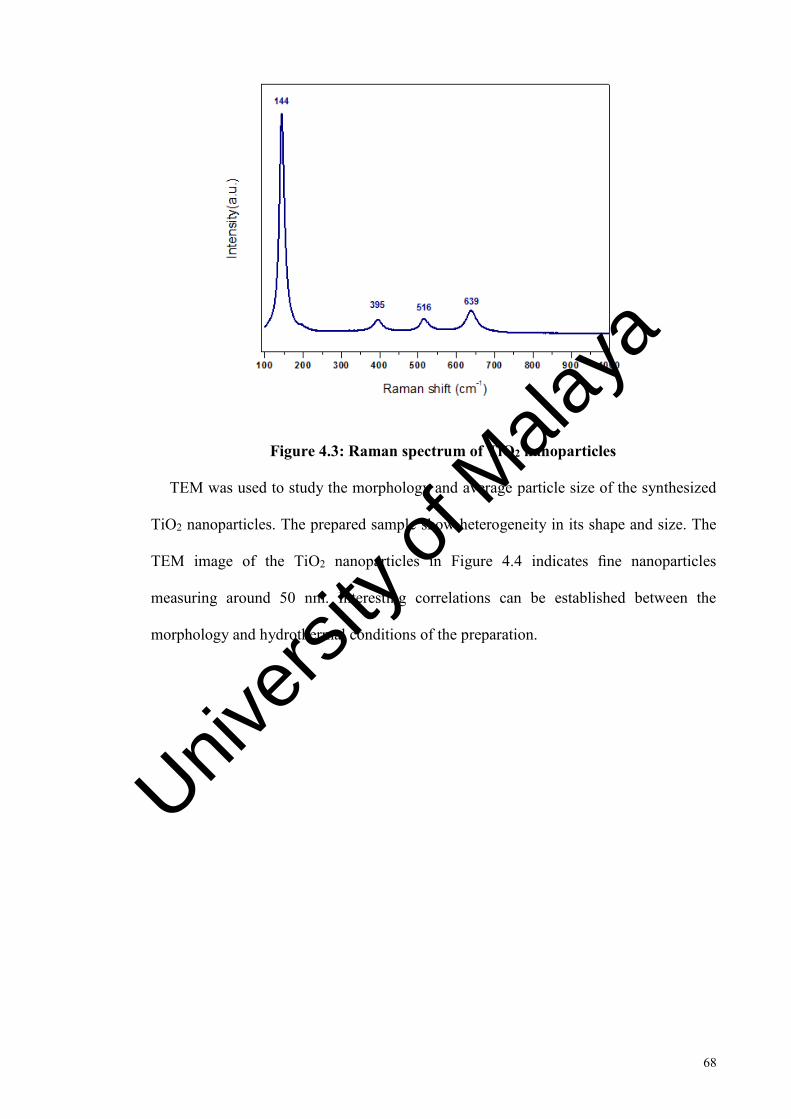
68
Figure 4.3: Raman spectrum of TiO2 nanoparticles
TEM was used to study the morphology and average particle size of the synthesized
TiO2 nanoparticles. The prepared sample show heterogeneity in its shape and size. The
TEM image of the TiO2 nanoparticles in Figure 4.4 indicates fine nanoparticles
measuring around 50 nm. Interesting correlations can be established between the
morphology and hydrothermal conditions of the preparation.
Univers
ity of
Mala
ya

69
Figure 4.4:TEM images of TiO2 nanoparticles
The UV pattern of TiO2 is shown in Figure 4.5. To investigate the optical absorption
properties of TiO2 nanoparticles under present investigation, UV-Vis study was carried
out (Figure 4.5). The band gap energy (Eg) was calculated according to the equation:
𝐸𝑔 = ℎ 𝑐𝜆⁄ (4.1)
Where Eg is the band gap energy (eV), h is Planck's constant, c is the velocity of
light (m/s) and λ is the wavelength in nm. The band gap value for absorption to be 335
nm was calculated by above formula is 3.2 eV (Hema, et al., 2013).
Univers
ity of
Mala
ya
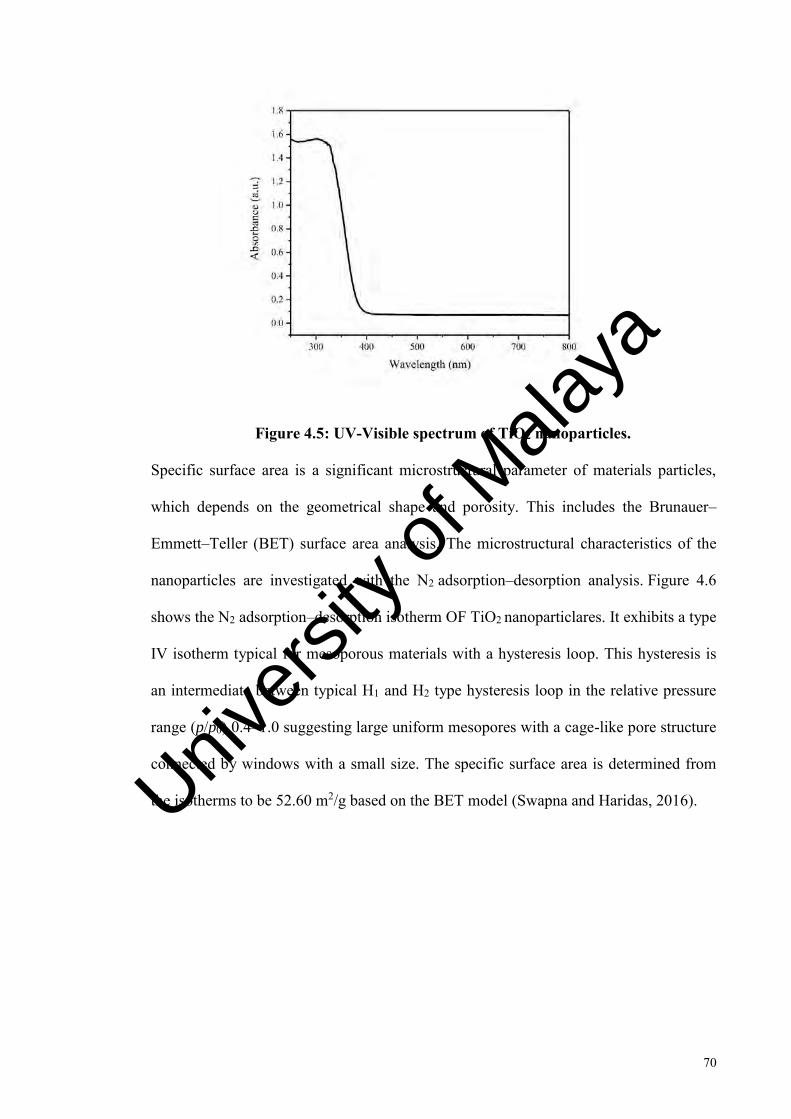
70
Figure 4.5: UV-Visible spectrum of TiO2 nanoparticles.
Specific surface area is a significant microstructural parameter of materials particles,
which depends on the geometrical shape and porosity. This includes the Brunauer–
Emmett–Teller (BET) surface area analysis. The microstructural characteristics of the
nanoparticles are investigated with the N2 adsorption–desorption analysis. Figure 4.6
shows the N2 adsorption–desorption isotherm OF TiO2 nanoparticlares. It exhibits a type
IV isotherm typical for mesoporous materials with a hysteresis loop. This hysteresis is
an intermediate between typical H1 and H2 type hysteresis loop in the relative pressure
range (p/p0) 0.4–1.0 suggesting large uniform mesopores with a cage-like pore structure
connected by windows with a small size. The specific surface area is determined from
the isotherms to be 52.60 m2/g based on the BET model (Swapna and Haridas, 2016). Univers
ity of
Mala
ya
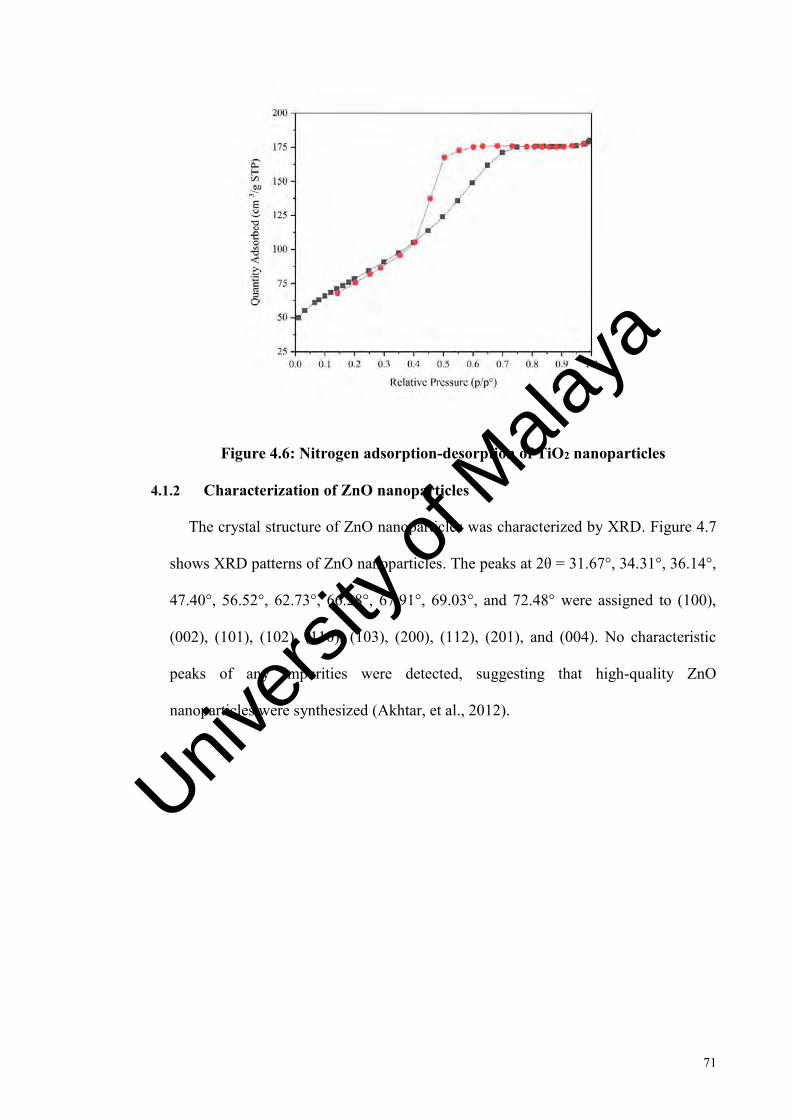
71
Figure 4.6: Nitrogen adsorption-desorption of TiO2 nanoparticles
4.1.2 Characterization of ZnO nanoparticles
The crystal structure of ZnO nanoparticles was characterized by XRD. Figure 4.7
shows XRD patterns of ZnO nanoparticles. The peaks at 2θ = 31.67°, 34.31°, 36.14°,
47.40°, 56.52°, 62.73°, 66.28°, 67.91°, 69.03°, and 72.48° were assigned to (100),
(002), (101), (102), (110), (103), (200), (112), (201), and (004). No characteristic
peaks of any impurities were detected, suggesting that high-quality ZnO
nanoparticles were synthesized (Akhtar, et al., 2012).
Univers
ity of
Mala
ya
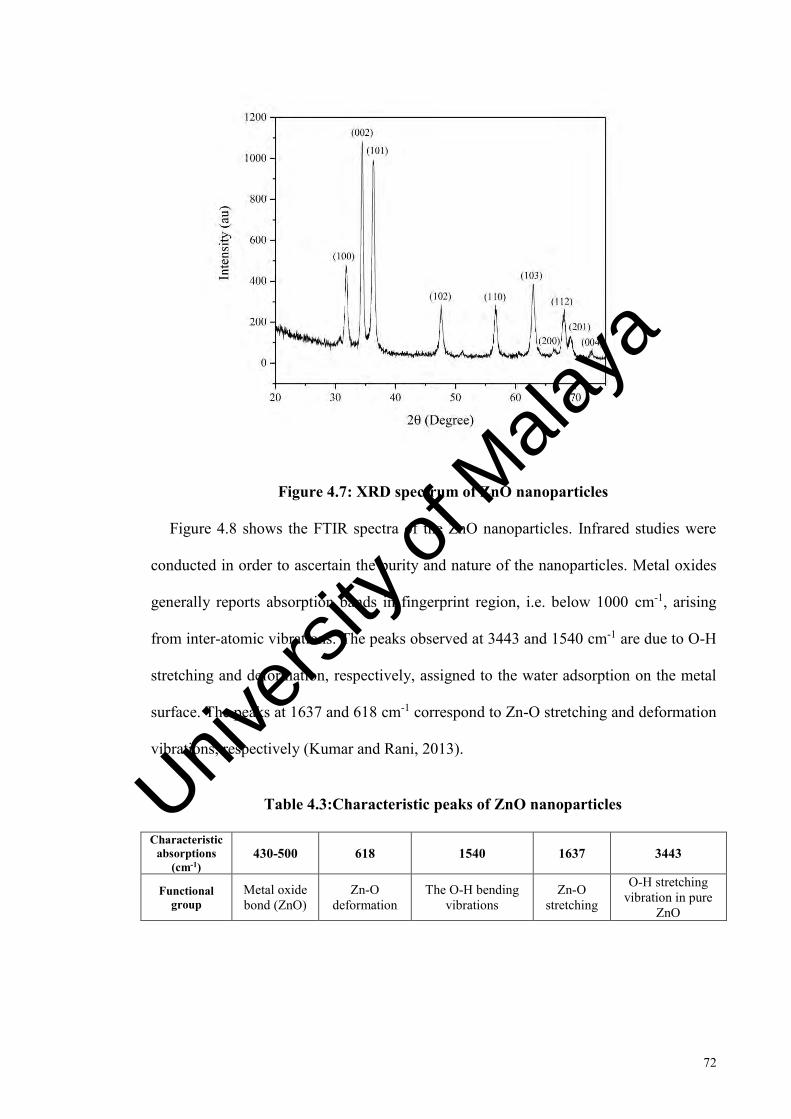
72
Figure 4.7: XRD spectrum of ZnO nanoparticles
Figure 4.8 shows the FTIR spectra of the ZnO nanoparticles. Infrared studies were
conducted in order to ascertain the purity and nature of the nanoparticles. Metal oxides
generally reports absorption bands in fingerprint region, i.e. below 1000 cm-1, arising
from inter-atomic vibrations. The peaks observed at 3443 and 1540 cm-1 are due to O-H
stretching and deformation, respectively, assigned to the water adsorption on the metal
surface. The peaks at 1637 and 618 cm-1 correspond to Zn-O stretching and deformation
vibrations, respectively (Kumar and Rani, 2013).
Table 4.3:Characteristic peaks of ZnO nanoparticles
Characteristic absorptions
(cm-1) 430-500 618 1540 1637 3443
Functional group
Metal oxide bond (ZnO)
Zn-O deformation
The O-H bending vibrations
Zn-O stretching
O-H stretching vibration in pure
ZnO
Univers
ity of
Mala
ya
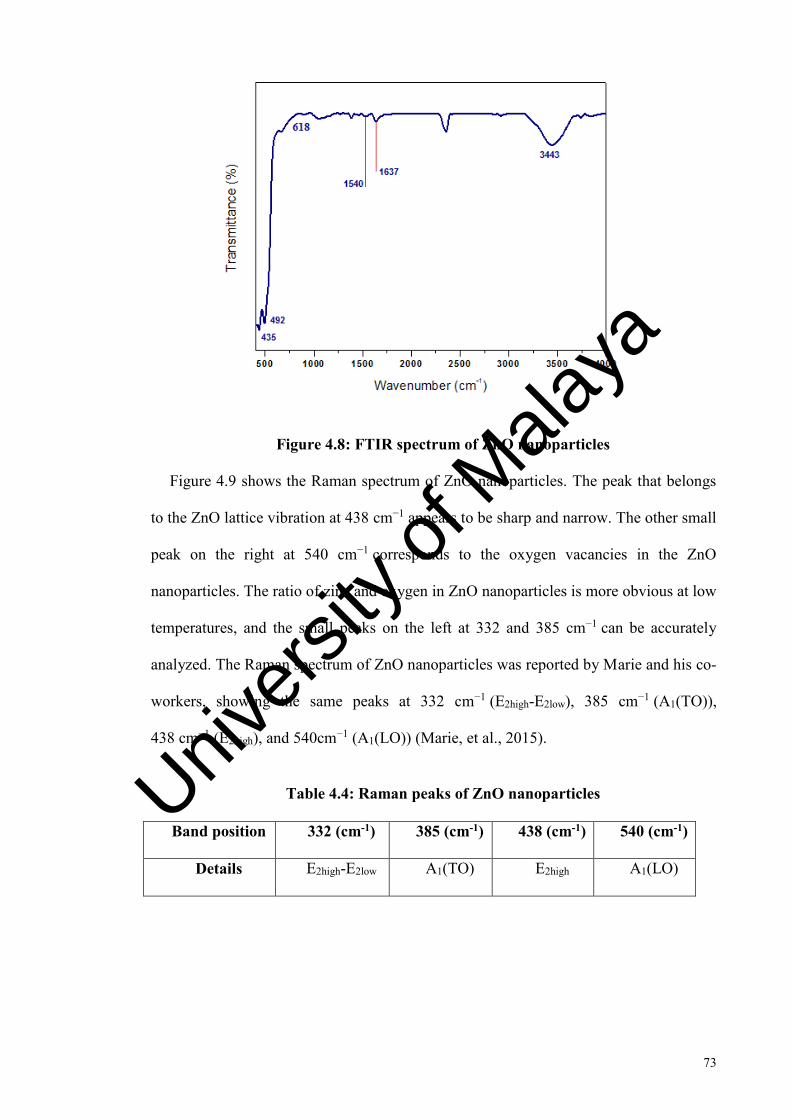
73
Figure 4.8: FTIR spectrum of ZnO nanoparticles
Figure 4.9 shows the Raman spectrum of ZnO nanoparticles. The peak that belongs
to the ZnO lattice vibration at 438 cm−1 appears to be sharp and narrow. The other small
peak on the right at 540 cm−1 corresponds to the oxygen vacancies in the ZnO
nanoparticles. The ratio of zinc and oxygen in ZnO nanoparticles is more obvious at low
temperatures, and the small peaks on the left at 332 and 385 cm−1 can be accurately
analyzed. The Raman spectrum of ZnO nanoparticles was reported by Marie and his co-
workers, showing the same peaks at 332 cm−1 (E2high-E2low), 385 cm−1 (A1(TO)),
438 cm−1 (E2high), and 540cm−1 (A1(LO)) (Marie, et al., 2015).
Table 4.4: Raman peaks of ZnO nanoparticles
Band position 332 (cm-1) 385 (cm-1) 438 (cm-1) 540 (cm-1)
Details E2high-E2low A1(TO) E2high A1(LO)
Univers
ity of
Mala
ya
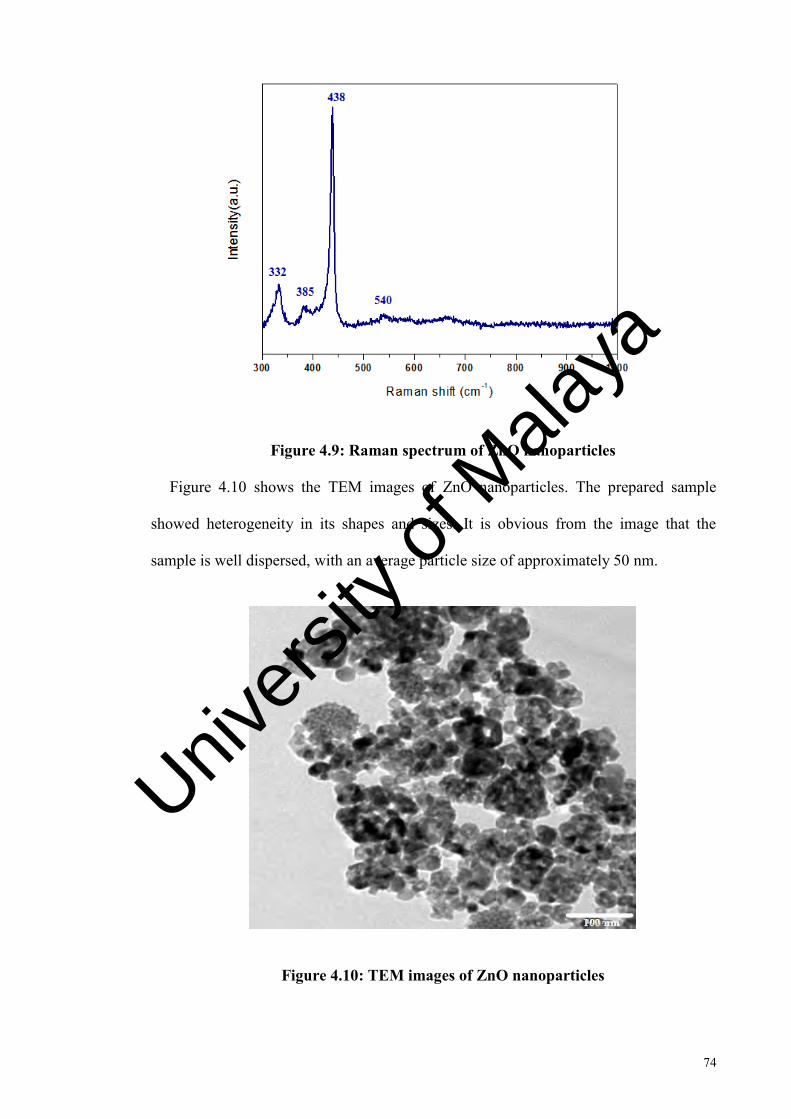
74
Figure 4.9: Raman spectrum of ZnO nanoparticles
Figure 4.10 shows the TEM images of ZnO nanoparticles. The prepared sample
showed heterogeneity in its shapes and sizes. It is obvious from the image that the
sample is well dispersed, with an average particle size of approximately 50 nm.
Figure 4.10: TEM images of ZnO nanoparticles
Univers
ity of
Mala
ya
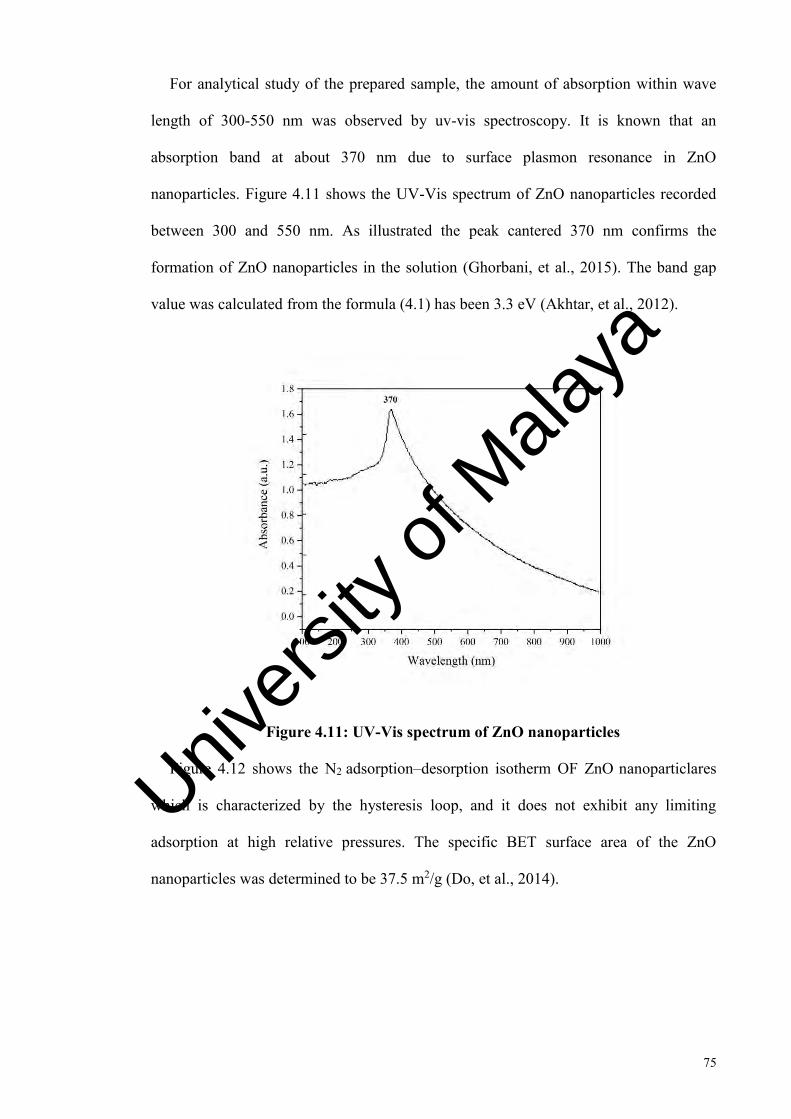
75
For analytical study of the prepared sample, the amount of absorption within wave
length of 300-550 nm was observed by uv-vis spectroscopy. It is known that an
absorption band at about 370 nm due to surface plasmon resonance in ZnO
nanoparticles. Figure 4.11 shows the UV-Vis spectrum of ZnO nanoparticles recorded
between 300 and 550 nm. As illustrated the peak cantered 370 nm confirms the
formation of ZnO nanoparticles in the solution (Ghorbani, et al., 2015). The band gap
value was calculated from the formula (4.1) has been 3.3 eV (Akhtar, et al., 2012).
Figure 4.11: UV-Vis spectrum of ZnO nanoparticles
Figure 4.12 shows the N2 adsorption–desorption isotherm OF ZnO nanoparticlares
which is characterized by the hysteresis loop, and it does not exhibit any limiting
adsorption at high relative pressures. The specific BET surface area of the ZnO
nanoparticles was determined to be 37.5 m2/g (Do, et al., 2014).
Univers
ity of
Mala
ya
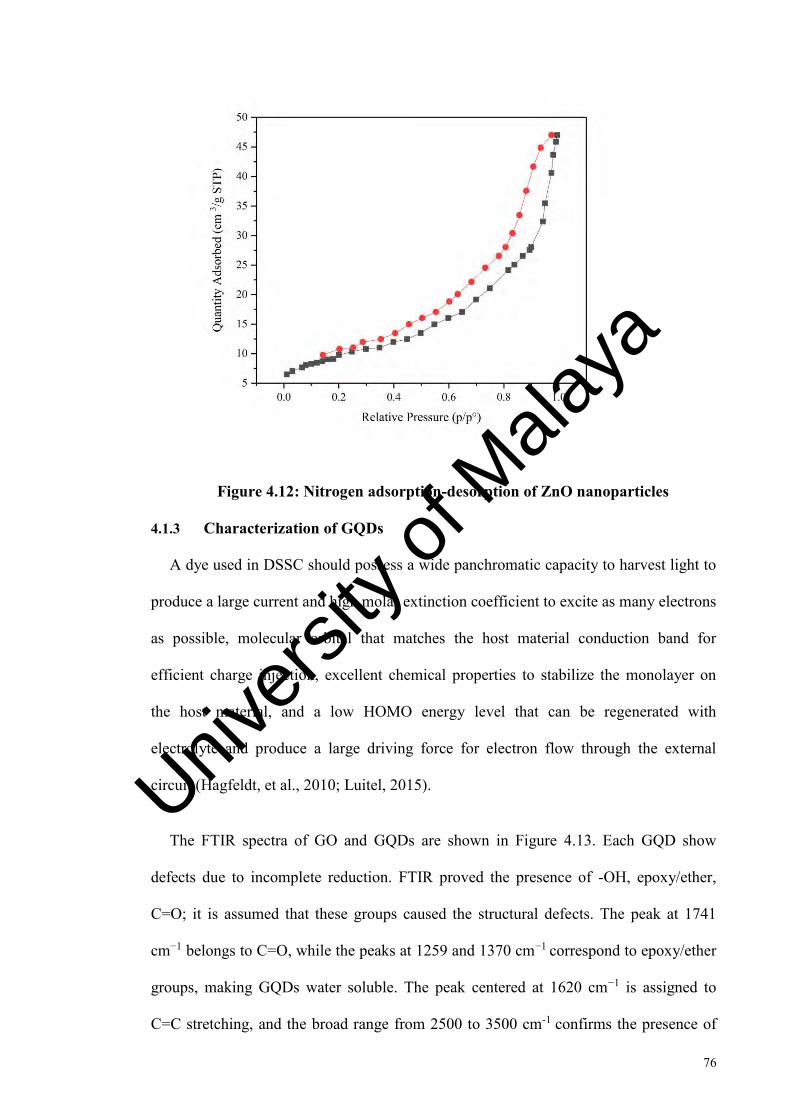
76
Figure 4.12: Nitrogen adsorption-desorption of ZnO nanoparticles
4.1.3 Characterization of GQDs
A dye used in DSSC should possess a wide panchromatic capacity to harvest light to
produce a large current and high molar extinction coefficient to excite as many electrons
as possible, molecular orbital that matches the host material conduction band for
efficient charge injection, excellent chemical properties to stabilize the monolayer on
the host material, and a low HOMO energy level that can be regenerated with
electrolyte and produce a large driving force for electron flow through the external
circuit (Hagfeldt, et al., 2010; Luitel, 2015).
The FTIR spectra of GO and GQDs are shown in Figure 4.13. Each GQD show
defects due to incomplete reduction. FTIR proved the presence of -OH, epoxy/ether,
C=O; it is assumed that these groups caused the structural defects. The peak at 1741
cm−1 belongs to C=O, while the peaks at 1259 and 1370 cm−1 correspond to epoxy/ether
groups, making GQDs water soluble. The peak centered at 1620 cm−1 is assigned to
C=C stretching, and the broad range from 2500 to 3500 cm-1 confirms the presence of
Univers
ity of
Mala
ya
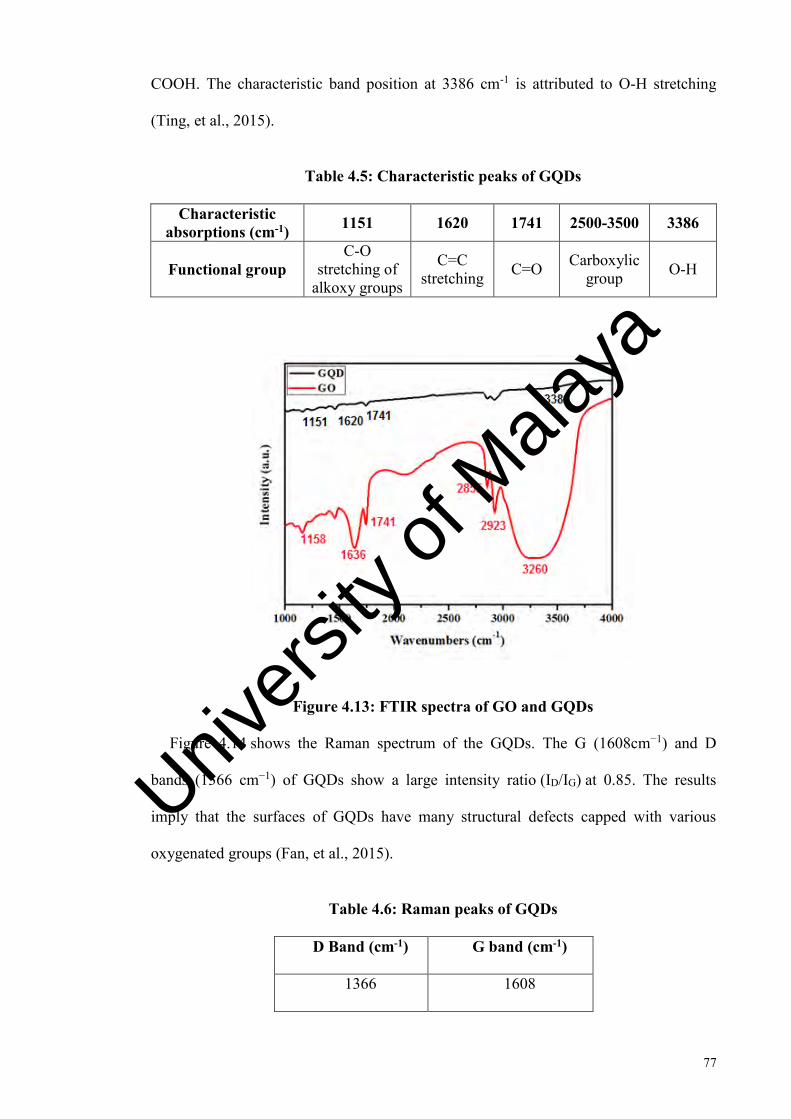
77
COOH. The characteristic band position at 3386 cm-1 is attributed to O-H stretching
(Ting, et al., 2015).
Table 4.5: Characteristic peaks of GQDs
Characteristic absorptions (cm-1) 1151 1620 1741 2500-3500 3386
Functional group C-O
stretching of alkoxy groups
C=C stretching C=O Carboxylic
group O-H
Figure 4.13: FTIR spectra of GO and GQDs
Figure 4.14 shows the Raman spectrum of the GQDs. The G (1608cm−1) and D
bands (1366 cm−1) of GQDs show a large intensity ratio (ID/IG) at 0.85. The results
imply that the surfaces of GQDs have many structural defects capped with various
oxygenated groups (Fan, et al., 2015).
Table 4.6: Raman peaks of GQDs
D Band (cm-1) G band (cm-1)
1366 1608
Univers
ity of
Mala
ya
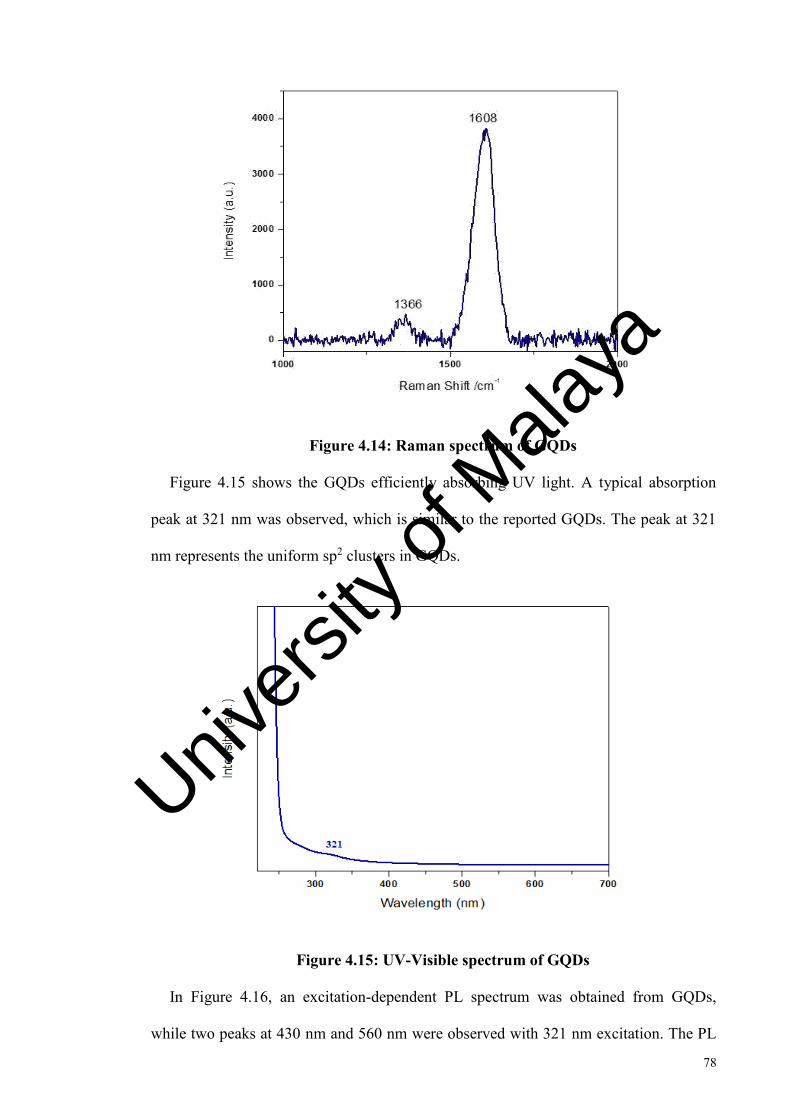
78
Figure 4.14: Raman spectrum of GQDs
Figure 4.15 shows the GQDs efficiently absorbing UV light. A typical absorption
peak at 321 nm was observed, which is similar to the reported GQDs. The peak at 321
nm represents the uniform sp2 clusters in GQDs.
Figure 4.15: UV-Visible spectrum of GQDs
In Figure 4.16, an excitation-dependent PL spectrum was obtained from GQDs,
while two peaks at 430 nm and 560 nm were observed with 321 nm excitation. The PL
Univers
ity of
Mala
ya
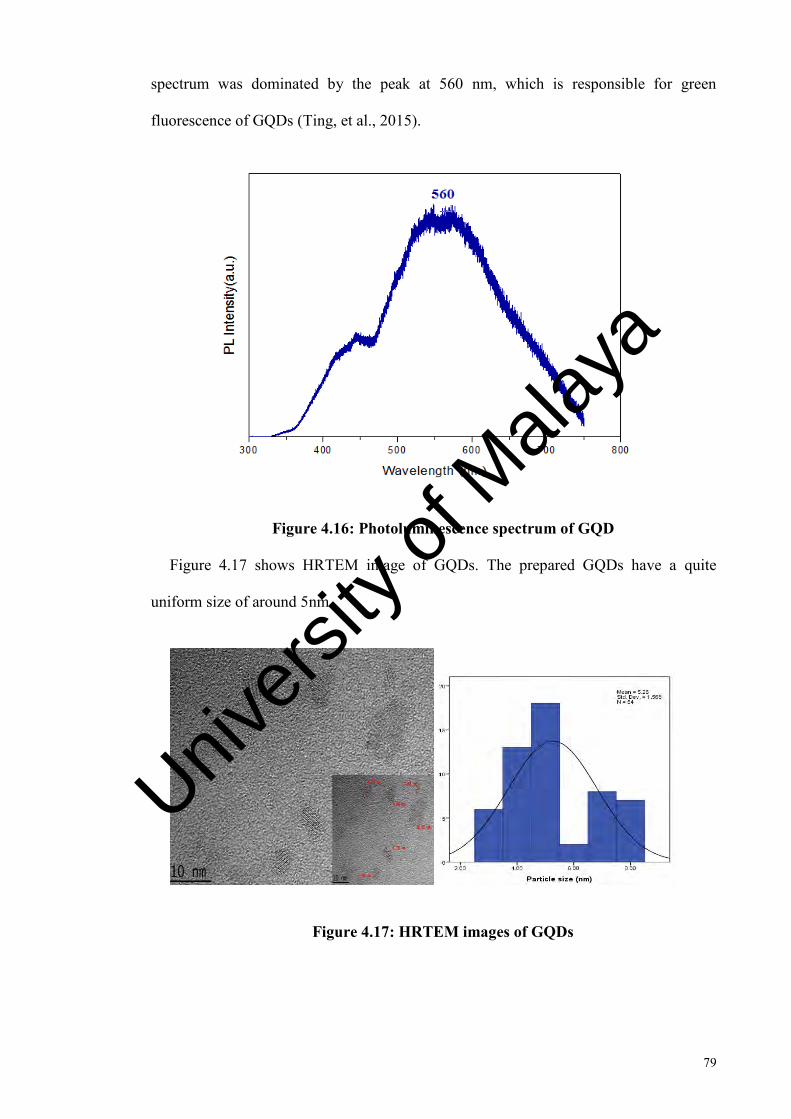
79
spectrum was dominated by the peak at 560 nm, which is responsible for green
fluorescence of GQDs (Ting, et al., 2015).
Figure 4.16: Photoluminescence spectrum of GQD
Figure 4.17 shows HRTEM image of GQDs. The prepared GQDs have a quite
uniform size of around 5nm.
Figure 4.17: HRTEM images of GQDs
Univers
ity of
Mala
ya

80
Characterization of DSSCs based on TiO2 photo-anode
4.2.1 Effect of different immersion time in GQDs on PCE in DSSCs based on
TiO2 photo-anode
To investigate the effect of different immersion times on the performance of DSSCs,
TiO2 photo-anodes with thickness of 10 μm were immersed in GQDs at different times,
such as 7, 14, 21, and 28 hours.
Figure 4.18 compares the I-V characteristics obtained from DSSCs made of TiO2
nanoparticles as photo-anodes immersed in GQDs for many hours. After increasing the
immersion time from 7 - 21 hours, the efficiency increased from 0.415 to 1.097 %.
Figure 4.18: Current-voltage (I-V) Curves of DSSCs based on TiO2 photo-anode with different immersion time in GQDs as a photosensitizer
As seen in Figure 4.18 and Table 4.7, the effect of immersion time on the
performance of DSSCs was examined. We note that increasing immersion time of TiO2
photo-anodes in GQDs is a good strategy to improve the performance of DSSCs. More
photosensitizer molecules can be adsorbed when the immersion time is increased, thus
realizing higher light harvesting efficiency. To this end, DSSCs devices based on TiO2
Univers
ity of
Mala
ya
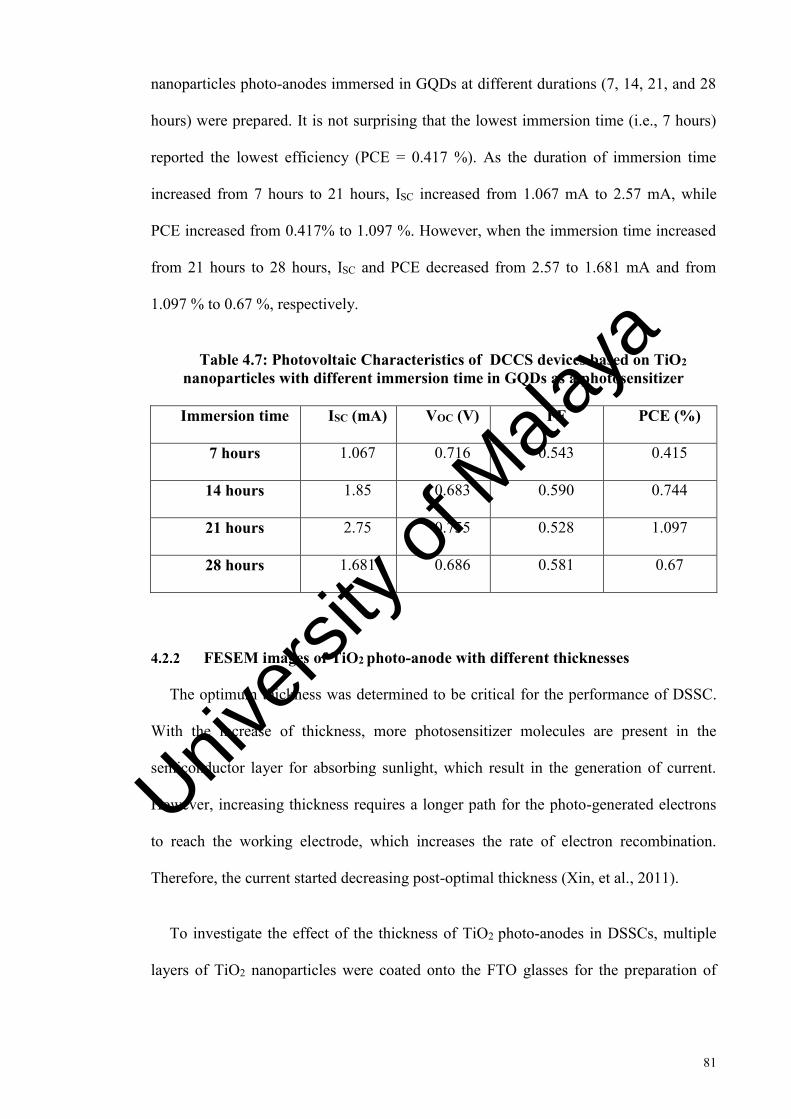
81
nanoparticles photo-anodes immersed in GQDs at different durations (7, 14, 21, and 28
hours) were prepared. It is not surprising that the lowest immersion time (i.e., 7 hours)
reported the lowest efficiency (PCE = 0.417 %). As the duration of immersion time
increased from 7 hours to 21 hours, ISC increased from 1.067 mA to 2.57 mA, while
PCE increased from 0.417% to 1.097 %. However, when the immersion time increased
from 21 hours to 28 hours, ISC and PCE decreased from 2.57 to 1.681 mA and from
1.097 % to 0.67 %, respectively.
Table 4.7: Photovoltaic Characteristics of DCCS devices based on TiO2 nanoparticles with different immersion time in GQDs as a photosensitizer
Immersion time ISC (mA) VOC (V) FF PCE (%)
7 hours 1.067 0.716 0.543 0.415
14 hours 1.85 0.683 0.590 0.744
21 hours 2.75 0.755 0.528 1.097
28 hours 1.681 0.686 0.581 0.67
4.2.2 FESEM images of TiO2 photo-anode with different thicknesses
The optimum thickness was determined to be critical for the performance of DSSC.
With the increase of thickness, more photosensitizer molecules are present in the
semiconductor layer for absorbing sunlight, which result in the generation of current.
However, increasing thickness requires a longer path for the photo-generated electrons
to reach the working electrode, which increases the rate of electron recombination.
Therefore, the current started decreasing post-optimal thickness (Xin, et al., 2011).
To investigate the effect of the thickness of TiO2 photo-anodes in DSSCs, multiple
layers of TiO2 nanoparticles were coated onto the FTO glasses for the preparation of
Univers
ity of
Mala
ya

82
photo-anodes. The FESEM images in Figure 4.19 show that the thickness of each layer
of TiO2 nanoparticles is around 10 μm.
Figure 4.19: FESEM images of TiO2 photo-anode with different thicknesses
4.2.3 Effect of TiO2 photo-anode with different thicknesses on PCE in DSSCs
using N-719 as photosensitizer
The effect of TiO2 photo-anode thickness on the performance of DSSCs using N-719
as a photosensitizer was investigated by coating different layers of TiO2 nanoparticles
on FTO glasses to prepare photo-anodes, which was then immersed in N-719 for 21
hours (Wang, et al., 2006).
Univers
ity of
Mala
ya
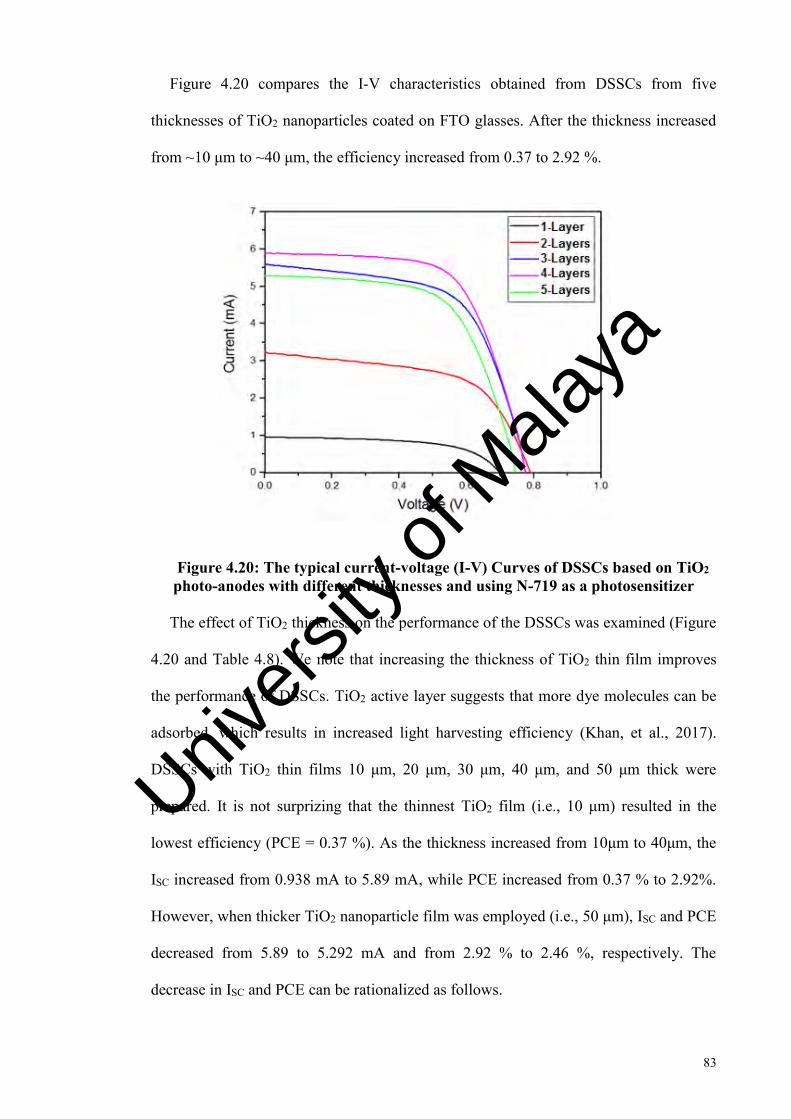
83
Figure 4.20 compares the I-V characteristics obtained from DSSCs from five
thicknesses of TiO2 nanoparticles coated on FTO glasses. After the thickness increased
from ~10 μm to ~40 μm, the efficiency increased from 0.37 to 2.92 %.
Figure 4.20: The typical current-voltage (I-V) Curves of DSSCs based on TiO2
photo-anodes with different thicknesses and using N-719 as a photosensitizer
The effect of TiO2 thickness on the performance of the DSSCs was examined (Figure
4.20 and Table 4.8). We note that increasing the thickness of TiO2 thin film improves
the performance of DSSCs. TiO2 active layer suggests that more dye molecules can be
adsorbed, which results in increased light harvesting efficiency (Khan, et al., 2017).
DSSCs with TiO2 thin films 10 μm, 20 μm, 30 μm, 40 μm, and 50 μm thick were
prepared. It is not surprizing that the thinnest TiO2 film (i.e., 10 μm) resulted in the
lowest efficiency (PCE = 0.37 %). As the thickness increased from 10μm to 40μm, the
ISC increased from 0.938 mA to 5.89 mA, while PCE increased from 0.37 % to 2.92%.
However, when thicker TiO2 nanoparticle film was employed (i.e., 50 μm), ISC and PCE
decreased from 5.89 to 5.292 mA and from 2.92 % to 2.46 %, respectively. The
decrease in ISC and PCE can be rationalized as follows.
Univers
ity of
Mala
ya
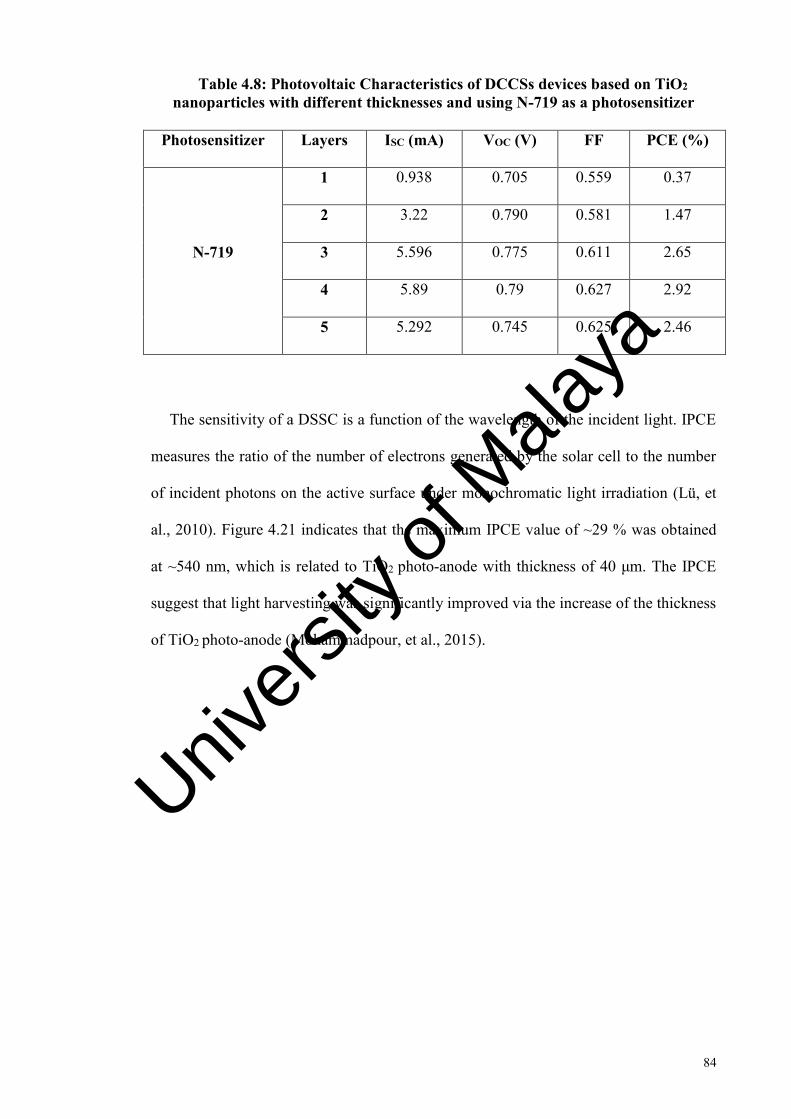
84
Table 4.8: Photovoltaic Characteristics of DCCSs devices based on TiO2 nanoparticles with different thicknesses and using N-719 as a photosensitizer
Photosensitizer Layers ISC (mA) VOC (V) FF PCE (%)
N-719
1 0.938 0.705 0.559 0.37
2 3.22 0.790 0.581 1.47
3 5.596 0.775 0.611 2.65
4 5.89 0.79 0.627 2.92
5 5.292 0.745 0.625 2.46
The sensitivity of a DSSC is a function of the wavelength of the incident light. IPCE
measures the ratio of the number of electrons generated by the solar cell to the number
of incident photons on the active surface under monochromatic light irradiation (Lü, et
al., 2010). Figure 4.21 indicates that the maximum IPCE value of ~29 % was obtained
at ~540 nm, which is related to TiO2 photo-anode with thickness of 40 μm. The IPCE
suggest that light harvesting was significantly improved via the increase of the thickness
of TiO2 photo-anode (Mohammadpour, et al., 2015).
Univers
ity of
Mala
ya
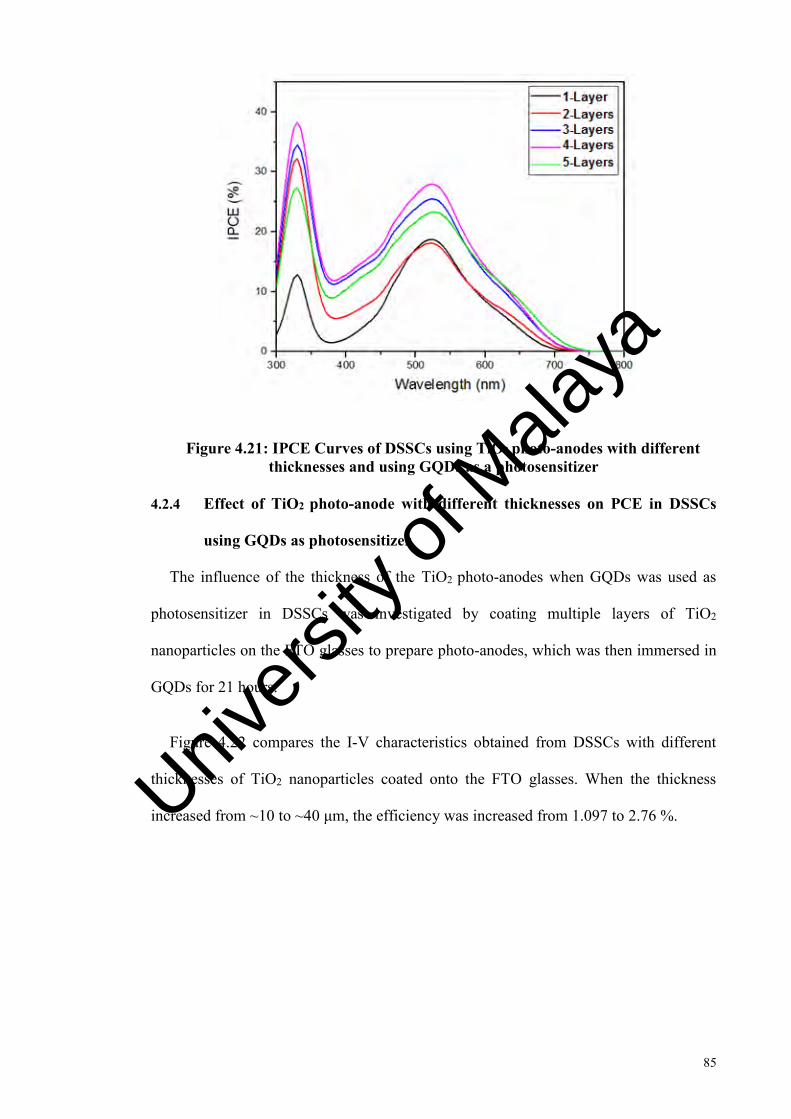
85
Figure 4.21: IPCE Curves of DSSCs using TiO2 photo-anodes with different thicknesses and using GQDs as a photosensitizer
4.2.4 Effect of TiO2 photo-anode with different thicknesses on PCE in DSSCs
using GQDs as photosensitizer
The influence of the thickness of the TiO2 photo-anodes when GQDs was used as
photosensitizer in DSSCs was investigated by coating multiple layers of TiO2
nanoparticles on the FTO glasses to prepare photo-anodes, which was then immersed in
GQDs for 21 hours.
Figure 4.22 compares the I-V characteristics obtained from DSSCs with different
thicknesses of TiO2 nanoparticles coated onto the FTO glasses. When the thickness
increased from ~10 to ~40 μm, the efficiency was increased from 1.097 to 2.76 %. Univers
ity of
Mala
ya
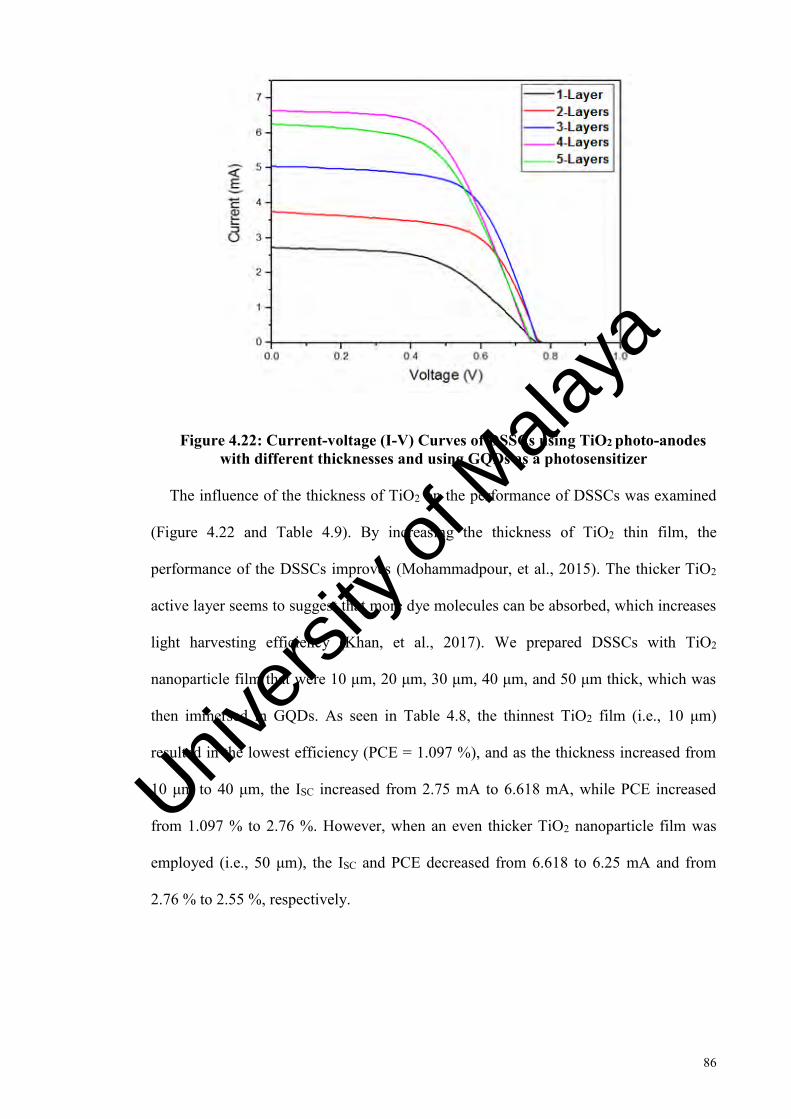
86
Figure 4.22: Current-voltage (I-V) Curves of DSSCs using TiO2 photo-anodes with different thicknesses and using GQDs as a photosensitizer
The influence of the thickness of TiO2 on the performance of DSSCs was examined
(Figure 4.22 and Table 4.9). By increasing the thickness of TiO2 thin film, the
performance of the DSSCs improves (Mohammadpour, et al., 2015). The thicker TiO2
active layer seems to suggest that more dye molecules can be absorbed, which increases
light harvesting efficiency (Khan, et al., 2017). We prepared DSSCs with TiO2
nanoparticle film that were 10 μm, 20 μm, 30 μm, 40 μm, and 50 μm thick, which was
then immersed in GQDs. As seen in Table 4.8, the thinnest TiO2 film (i.e., 10 μm)
resulted in the lowest efficiency (PCE = 1.097 %), and as the thickness increased from
10 μm to 40 μm, the ISC increased from 2.75 mA to 6.618 mA, while PCE increased
from 1.097 % to 2.76 %. However, when an even thicker TiO2 nanoparticle film was
employed (i.e., 50 μm), the ISC and PCE decreased from 6.618 to 6.25 mA and from
2.76 % to 2.55 %, respectively.
Univers
ity of
Mala
ya
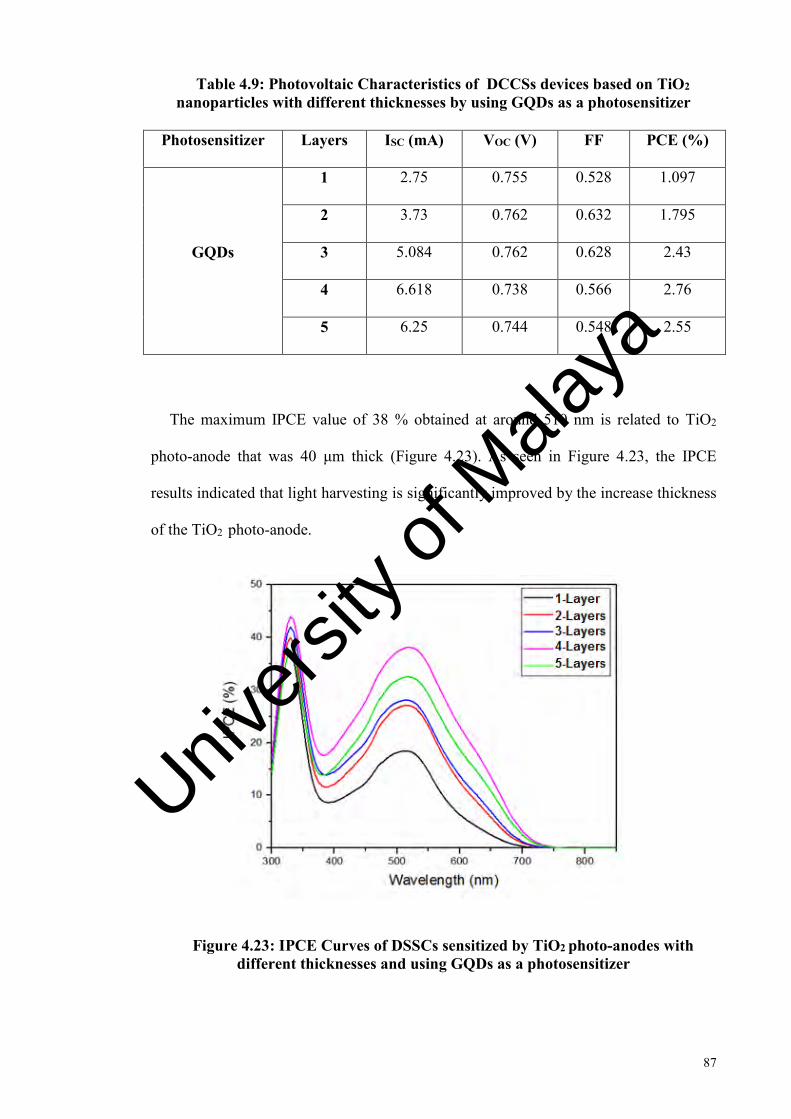
87
Table 4.9: Photovoltaic Characteristics of DCCSs devices based on TiO2 nanoparticles with different thicknesses by using GQDs as a photosensitizer
Photosensitizer Layers ISC (mA) VOC (V) FF PCE (%)
GQDs
1 2.75 0.755 0.528 1.097
2 3.73 0.762 0.632 1.795
3 5.084 0.762 0.628 2.43
4 6.618 0.738 0.566 2.76
5 6.25 0.744 0.548 2.55
The maximum IPCE value of 38 % obtained at around 510 nm is related to TiO2
photo-anode that was 40 μm thick (Figure 4.23). As seen in Figure 4.23, the IPCE
results indicated that light harvesting is significantly improved by the increase thickness
of the TiO2 photo-anode.
Figure 4.23: IPCE Curves of DSSCs sensitized by TiO2 photo-anodes with different thicknesses and using GQDs as a photosensitizer
Univers
ity of
Mala
ya
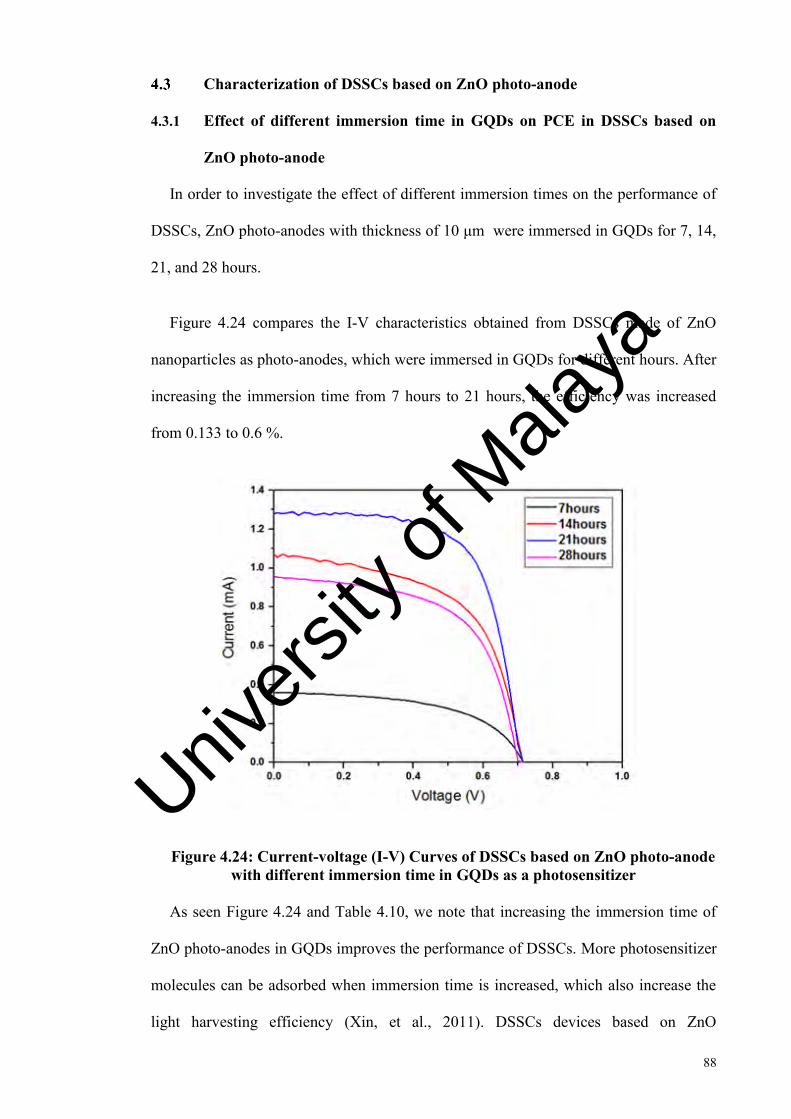
88
Characterization of DSSCs based on ZnO photo-anode
4.3.1 Effect of different immersion time in GQDs on PCE in DSSCs based on
ZnO photo-anode
In order to investigate the effect of different immersion times on the performance of
DSSCs, ZnO photo-anodes with thickness of 10 μm were immersed in GQDs for 7, 14,
21, and 28 hours.
Figure 4.24 compares the I-V characteristics obtained from DSSCs made of ZnO
nanoparticles as photo-anodes, which were immersed in GQDs for different hours. After
increasing the immersion time from 7 hours to 21 hours, the efficiency was increased
from 0.133 to 0.6 %.
Figure 4.24: Current-voltage (I-V) Curves of DSSCs based on ZnO photo-anode with different immersion time in GQDs as a photosensitizer
As seen Figure 4.24 and Table 4.10, we note that increasing the immersion time of
ZnO photo-anodes in GQDs improves the performance of DSSCs. More photosensitizer
molecules can be adsorbed when immersion time is increased, which also increase the
light harvesting efficiency (Xin, et al., 2011). DSSCs devices based on ZnO
Univers
ity of
Mala
ya
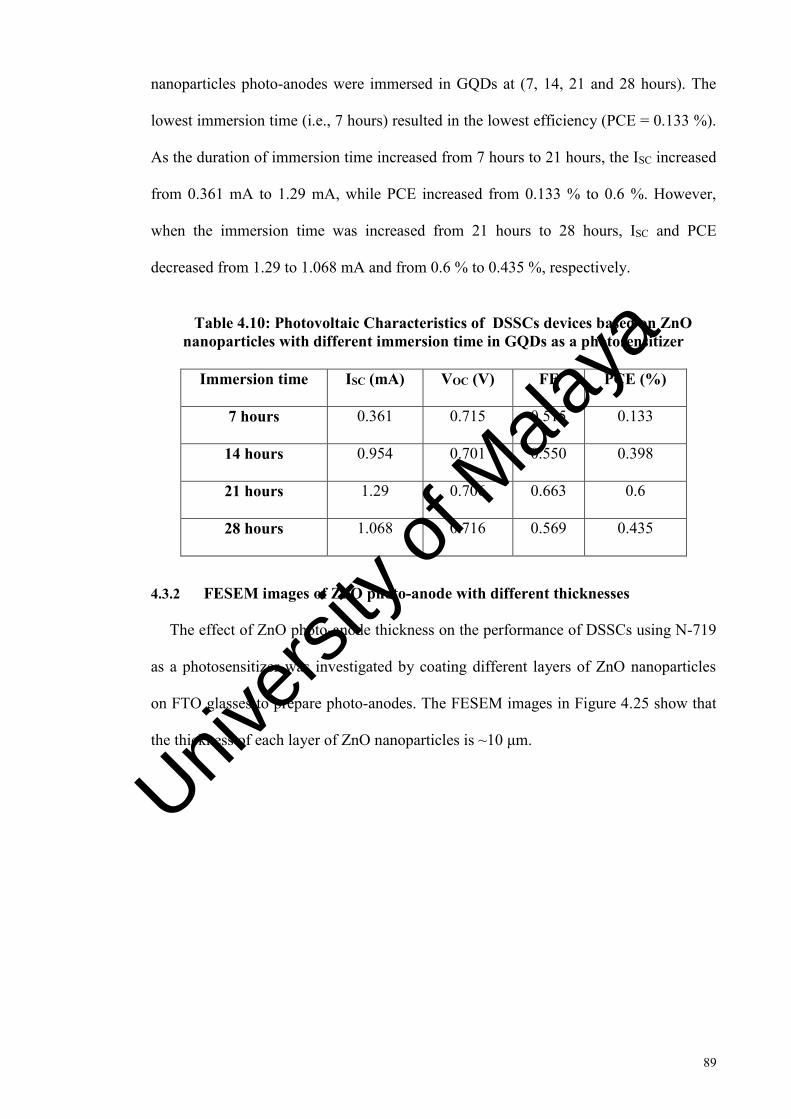
89
nanoparticles photo-anodes were immersed in GQDs at (7, 14, 21 and 28 hours). The
lowest immersion time (i.e., 7 hours) resulted in the lowest efficiency (PCE = 0.133 %).
As the duration of immersion time increased from 7 hours to 21 hours, the ISC increased
from 0.361 mA to 1.29 mA, while PCE increased from 0.133 % to 0.6 %. However,
when the immersion time was increased from 21 hours to 28 hours, ISC and PCE
decreased from 1.29 to 1.068 mA and from 0.6 % to 0.435 %, respectively.
Table 4.10: Photovoltaic Characteristics of DSSCs devices based on ZnO nanoparticles with different immersion time in GQDs as a photosensitizer
Immersion time ISC (mA) VOC (V) FF PCE (%)
7 hours 0.361 0.715 0.515 0.133
14 hours 0.954 0.701 0.550 0.398
21 hours 1.29 0.706 0.663 0.6
28 hours 1.068 0.716 0.569 0.435
4.3.2 FESEM images of ZnO photo-anode with different thicknesses
The effect of ZnO photo-anode thickness on the performance of DSSCs using N-719
as a photosensitizer was investigated by coating different layers of ZnO nanoparticles
on FTO glasses to prepare photo-anodes. The FESEM images in Figure 4.25 show that
the thickness of each layer of ZnO nanoparticles is ~10 μm.
Univers
ity of
Mala
ya
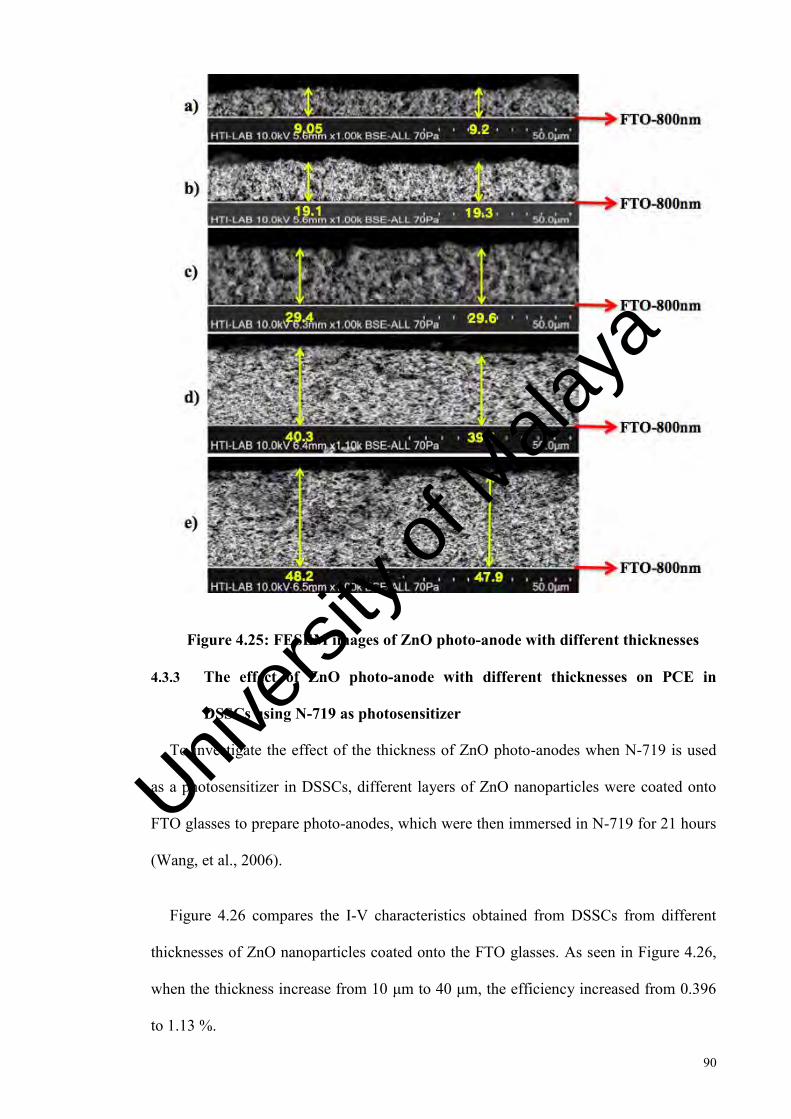
90
Figure 4.25: FESEM images of ZnO photo-anode with different thicknesses
4.3.3 The effect of ZnO photo-anode with different thicknesses on PCE in
DSSCs using N-719 as photosensitizer
To investigate the effect of the thickness of ZnO photo-anodes when N-719 is used
as a photosensitizer in DSSCs, different layers of ZnO nanoparticles were coated onto
FTO glasses to prepare photo-anodes, which were then immersed in N-719 for 21 hours
(Wang, et al., 2006).
Figure 4.26 compares the I-V characteristics obtained from DSSCs from different
thicknesses of ZnO nanoparticles coated onto the FTO glasses. As seen in Figure 4.26,
when the thickness increase from 10 μm to 40 μm, the efficiency increased from 0.396
to 1.13 %.
Univers
ity of
Mala
ya

91
Figure 4.26: Current-voltage (I-V) Curves of DSSCs using ZnO photo-anodes with different thicknesses and N-719 as a photosensitizer
The effect of the thickness of ZnO on the performance of the DSSCs was examined
(Figure 4.26 and Table 4.11). The results show that increased thickness of ZnO
nanoparticle film improves the performance of DSSCs. The thicker ZnO active layer
suggests that more photosensitizer molecules can be adsorbed, which results in
increased light harvesting efficiency (Khan, et al., 2017). We prepared DSSC with ZnO
nanoparticles films that were 10 μm, 20 μm, 30 μm, 40 μm and 50 μm thick. Table 4.9
and Figure 4.26 indicated that the thinnest ZnO film (i.e., 10 μm) reported the lowest
efficiency (PCE = 0.396 %). As the thickness increased from 10 μm to 40 μm, ISC
increased from 1.122 mA to 2.657 mA, while PCE increased from 0.396 % to 1.13 %.
However, when an even thicker ZnO nanoparticle film was used (i.e., 50 μm), ISC and
PCE decreased from 2.657 to 2.54 mA and from 1.13 % to 1.04 %, respectively. The
decrease in ISC and PCE can be rationalized as follows.
Univers
ity of
Mala
ya

92
Table 4.11: Photovoltaic Characteristics of DCCSs devices based on ZnO nanoparticles with different thicknesses and using N-719 as a photosensitizer
Photosensitizer Layers ISC (mA) VOC (V) FF PCE (%)
N-719
1 1.122 0.693 0.510 0.396
2 1.64 0.673 0.589 0.65
3 1.85 0.675 0.607 0.76
4 2.657 0.661 0.645 1.13
5 2.54 0.661 0.619 1.04
The IPCE plots in Figure 4.27 showed that the active photon-to-current responses of
ZnO photo-anode with a thickness of 40 μm are more red-shifted compared to the other
thicknesses of ZnO photo-anode (10, 20, 30 and 50 μm), which indicates that the
spectral absorption range is effectively broadened. On the other hand, the maximum
IPCE value of 11 % was obtained at around 500 nm, which is related to ZnO
nanoparticles photo-anode with a thickness of 40 μm. These results suggest that light
harvesting is significantly improved by increasing the thickness of ZnO photo-anode.
Univers
ity of
Mala
ya
93
Figure 4.27: IPCE Curves of DSSCs sensitized by ZnO photo-anodes with different thicknesses and using N-719 as a photosensitizer
4.3.4 The effect of ZnO photo-anode with different thicknesses on PCE in
DSSCs using GQDs as photosensitizer
The effect of ZnO photo-anodes thickness when GQDs is used as a photosensitizer in
DSSCs was investigated by coating different layers of ZnO nanoparticles onto FTO
glasses to prepare photo-anodes, which was then immersed in GQDs for 21 hours.
Figure 4.28 compares the I-V characteristics obtained from DSSCs from different
thicknesses of ZnO nanoparticles coated onto FTO glasses. Clearly, after increasing the
thickness from 10 μm to 40 μm, the efficiency increased from 0.6 % to 1.26 %. Univers
ity of
Mala
ya
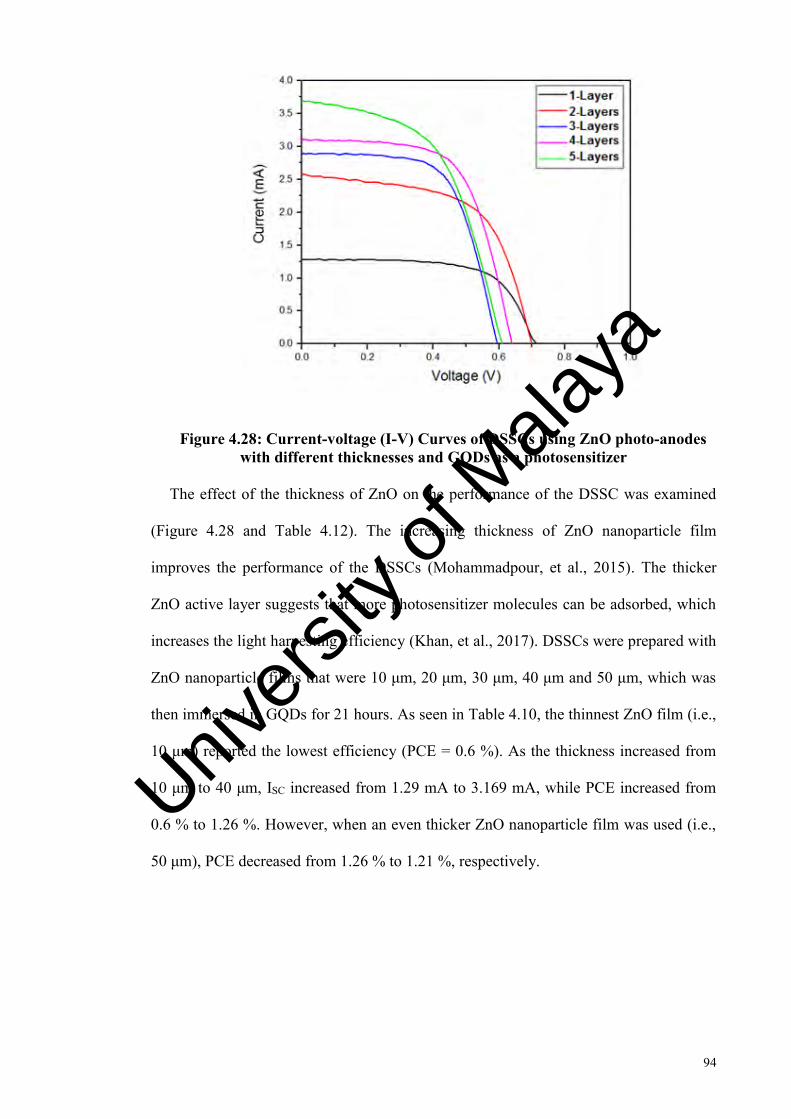
94
Figure 4.28: Current-voltage (I-V) Curves of DSSCs using ZnO photo-anodes with different thicknesses and GQDs as a photosensitizer
The effect of the thickness of ZnO on the performance of the DSSC was examined
(Figure 4.28 and Table 4.12). The increasing thickness of ZnO nanoparticle film
improves the performance of the DSSCs (Mohammadpour, et al., 2015). The thicker
ZnO active layer suggests that more photosensitizer molecules can be adsorbed, which
increases the light harvesting efficiency (Khan, et al., 2017). DSSCs were prepared with
ZnO nanoparticle films that were 10 μm, 20 μm, 30 μm, 40 μm and 50 μm, which was
then immersed in GQDs for 21 hours. As seen in Table 4.10, the thinnest ZnO film (i.e.,
10 μm) reported the lowest efficiency (PCE = 0.6 %). As the thickness increased from
10 μm to 40 μm, ISC increased from 1.29 mA to 3.169 mA, while PCE increased from
0.6 % to 1.26 %. However, when an even thicker ZnO nanoparticle film was used (i.e.,
50 μm), PCE decreased from 1.26 % to 1.21 %, respectively.
Univers
ity of
Mala
ya
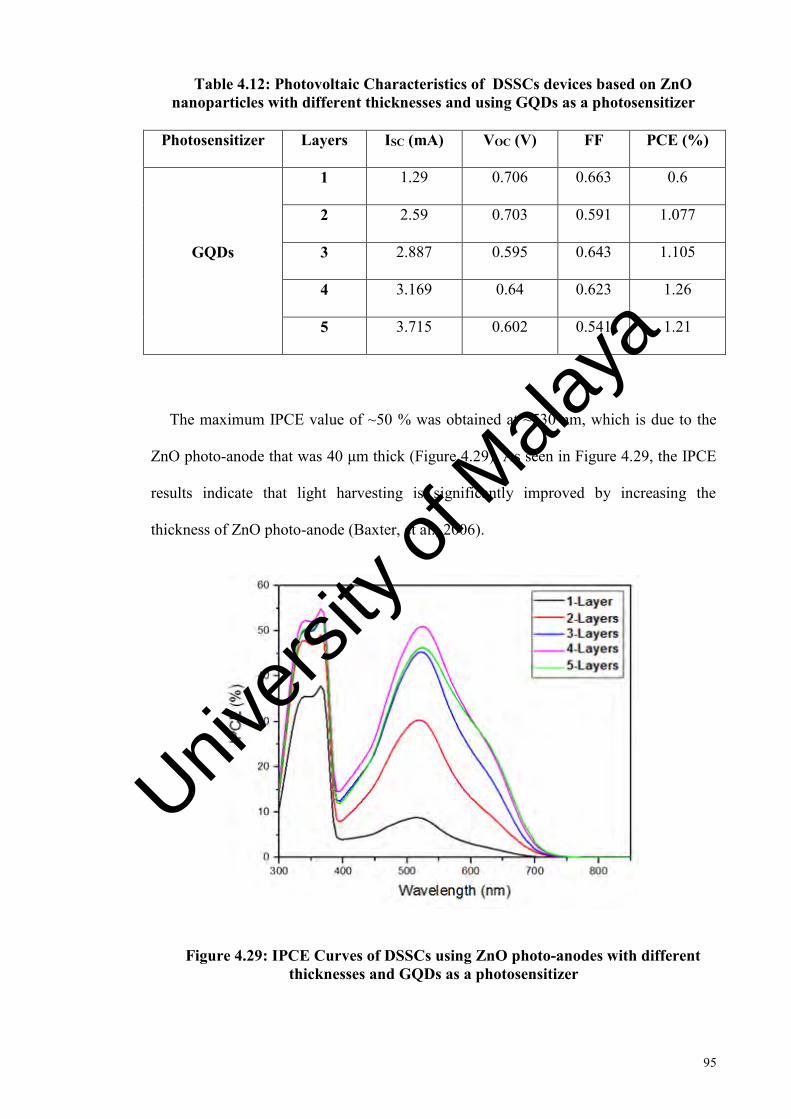
95
Table 4.12: Photovoltaic Characteristics of DSSCs devices based on ZnO nanoparticles with different thicknesses and using GQDs as a photosensitizer
Photosensitizer Layers ISC (mA) VOC (V) FF PCE (%)
GQDs
1 1.29 0.706 0.663 0.6
2 2.59 0.703 0.591 1.077
3 2.887 0.595 0.643 1.105
4 3.169 0.64 0.623 1.26
5 3.715 0.602 0.541 1.21
The maximum IPCE value of ~50 % was obtained at ~530 nm, which is due to the
ZnO photo-anode that was 40 μm thick (Figure 4.29). As seen in Figure 4.29, the IPCE
results indicate that light harvesting is significantly improved by increasing the
thickness of ZnO photo-anode (Baxter, et al., 2006).
Figure 4.29: IPCE Curves of DSSCs using ZnO photo-anodes with different thicknesses and GQDs as a photosensitizer
Univers
ity of
Mala
ya

96
The results in this section indicate that the increasing thickness of TiO2 and ZnO
nanoparticle films for both N-719 and GQDs as photosensitizers improves the
performance of DSSCs, due to the thicker TiO2 and ZnO active layers, which suggest
that more photosensitizer molecules can be adsorbed, increasing the light harvesting
efficiency (Yang and Leung, 2011) The performance, decreased with increasing
thickness of TiO2 and ZnO nanoparticle films from 40 μm to 50 μm. Although the
increased thickness of TiO2 and ZnO photo-anodes improve light absorption, in the
current front side illumination mode (i.e., light entered the cell through the transparent
FTO glass on which TiO2 and ZnO photo-anodes were directly deposited), as the
thicknesses of TiO2 and ZnO nanoparticles increased, most of the photons were
absorbed by the dyes anchored on TiO2 and ZnO photo-anodes that were close to the
FTO glass (i.e., the bottom part of TiO2 and ZnO thin films), while photosensitizers on
the top part of the thin films that were near the TiO2/electrolyte and ZnO/electrolyte
interfaces may lack the photons for absorption (Hsin, et al., 2008). The advantage
afforded by thick films was negated by further increasing the thickness. Also, thicker
TiO2 and ZnO films implies that electrons had to undergo a longer pathway before
reaching the FTO glass, which increases the chances for recombination during the
transport process (Zhu, et al., 2006). Finally, the thicker TiO2 and ZnO films may hinder
the electrolyte from penetrating completely to the bottom of TiO2 and ZnO films and the
transport of the I-3 in the electrolyte to the platinum coated counter electrode, thus
impeding the recovery of photosensitizer molecules after the injection of the excited
electrons to TiO2 and ZnO. Taken together, the performance increased in tandem with
the thickness of the thin films.
Univers
ity of
Mala
ya
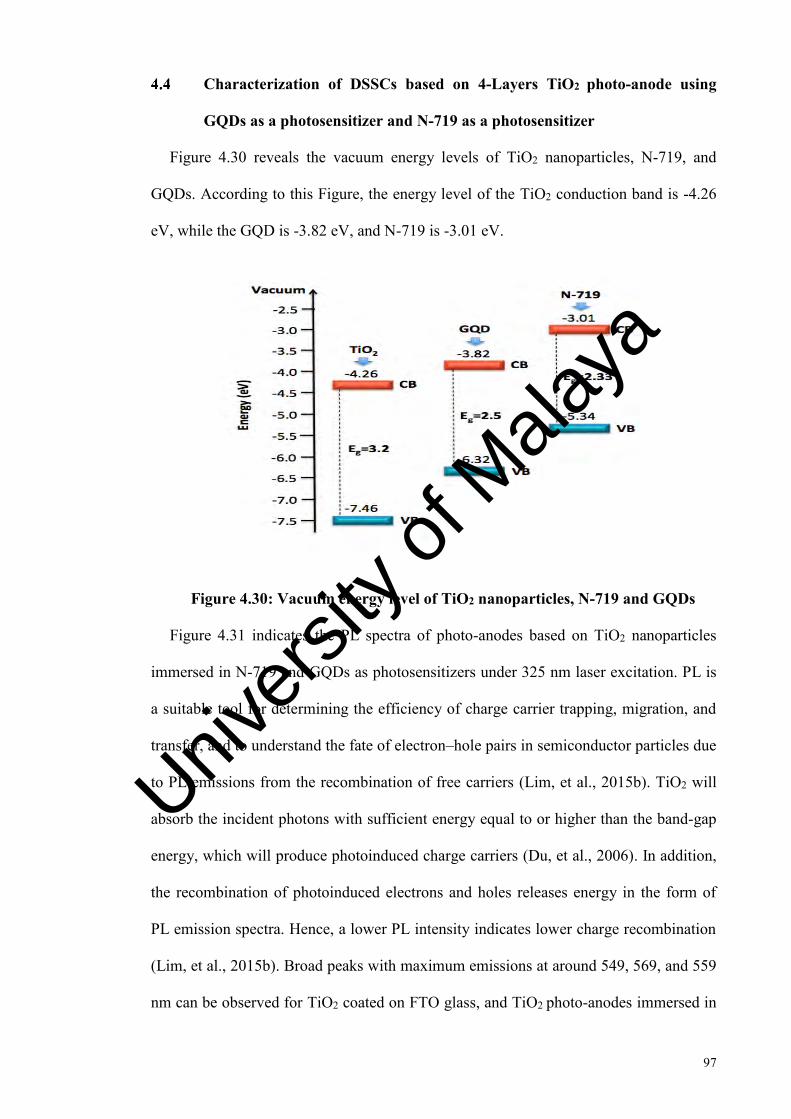
97
Characterization of DSSCs based on 4-Layers TiO2 photo-anode using
GQDs as a photosensitizer and N-719 as a photosensitizer
Figure 4.30 reveals the vacuum energy levels of TiO2 nanoparticles, N-719, and
GQDs. According to this Figure, the energy level of the TiO2 conduction band is -4.26
eV, while the GQD is -3.82 eV, and N-719 is -3.01 eV.
Figure 4.30: Vacuum energy level of TiO2 nanoparticles, N-719 and GQDs
Figure 4.31 indicates the PL spectra of photo-anodes based on TiO2 nanoparticles
immersed in N-719 and GQDs as photosensitizers under 325 nm laser excitation. PL is
a suitable tool for determining the efficiency of charge carrier trapping, migration, and
transfer, and to understand the fate of electron–hole pairs in semiconductor particles due
to PL emissions from the recombination of free carriers (Lim, et al., 2015b). TiO2 will
absorb the incident photons with sufficient energy equal to or higher than the band-gap
energy, which will produce photoinduced charge carriers (Du, et al., 2006). In addition,
the recombination of photoinduced electrons and holes releases energy in the form of
PL emission spectra. Hence, a lower PL intensity indicates lower charge recombination
(Lim, et al., 2015b). Broad peaks with maximum emissions at around 549, 569, and 559
nm can be observed for TiO2 coated on FTO glass, and TiO2 photo-anodes immersed in
Univers
ity of
Mala
ya
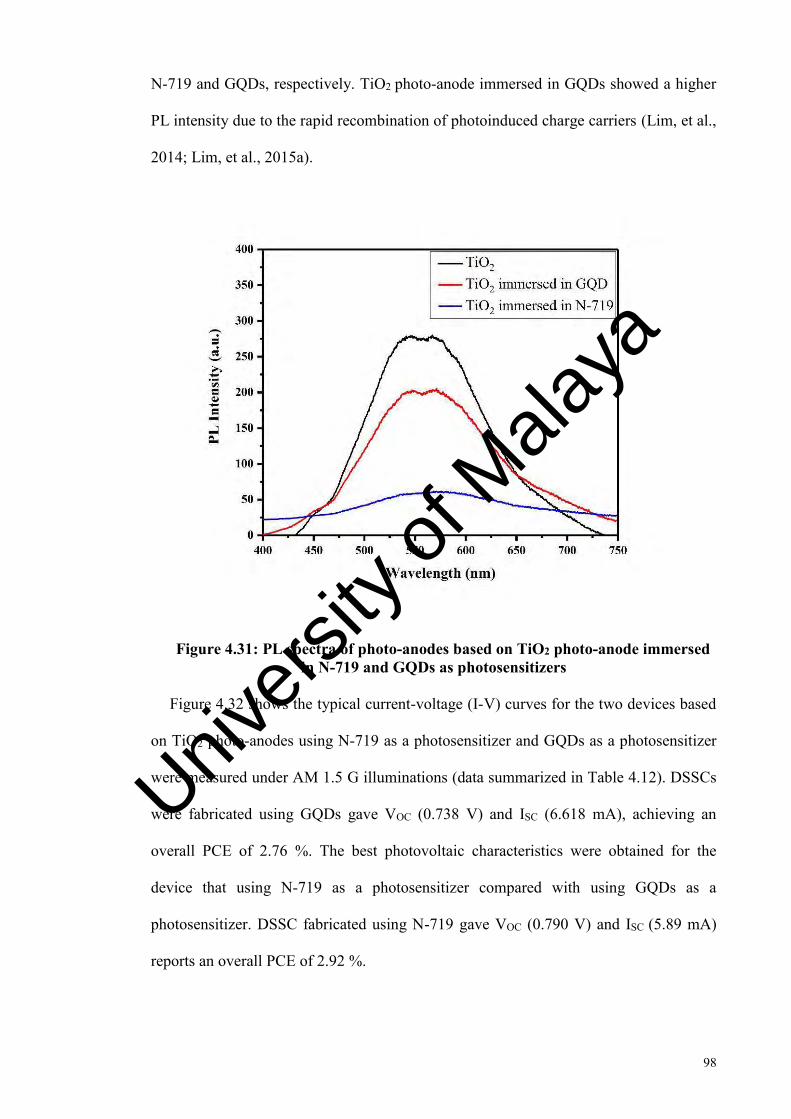
98
N-719 and GQDs, respectively. TiO2 photo-anode immersed in GQDs showed a higher
PL intensity due to the rapid recombination of photoinduced charge carriers (Lim, et al.,
2014; Lim, et al., 2015a).
Figure 4.31: PL spectra of photo-anodes based on TiO2 photo-anode immersed in N-719 and GQDs as photosensitizers
Figure 4.32 shows the typical current-voltage (I-V) curves for the two devices based
on TiO2 photo-anodes using N-719 as a photosensitizer and GQDs as a photosensitizer
were measured under AM 1.5 G illuminations (data summarized in Table 4.12). DSSCs
were fabricated using GQDs gave VOC (0.738 V) and ISC (6.618 mA), achieving an
overall PCE of 2.76 %. The best photovoltaic characteristics were obtained for the
device that using N-719 as a photosensitizer compared with using GQDs as a
photosensitizer. DSSC fabricated using N-719 gave VOC (0.790 V) and ISC (5.89 mA)
reports an overall PCE of 2.92 %.
Univers
ity of
Mala
ya
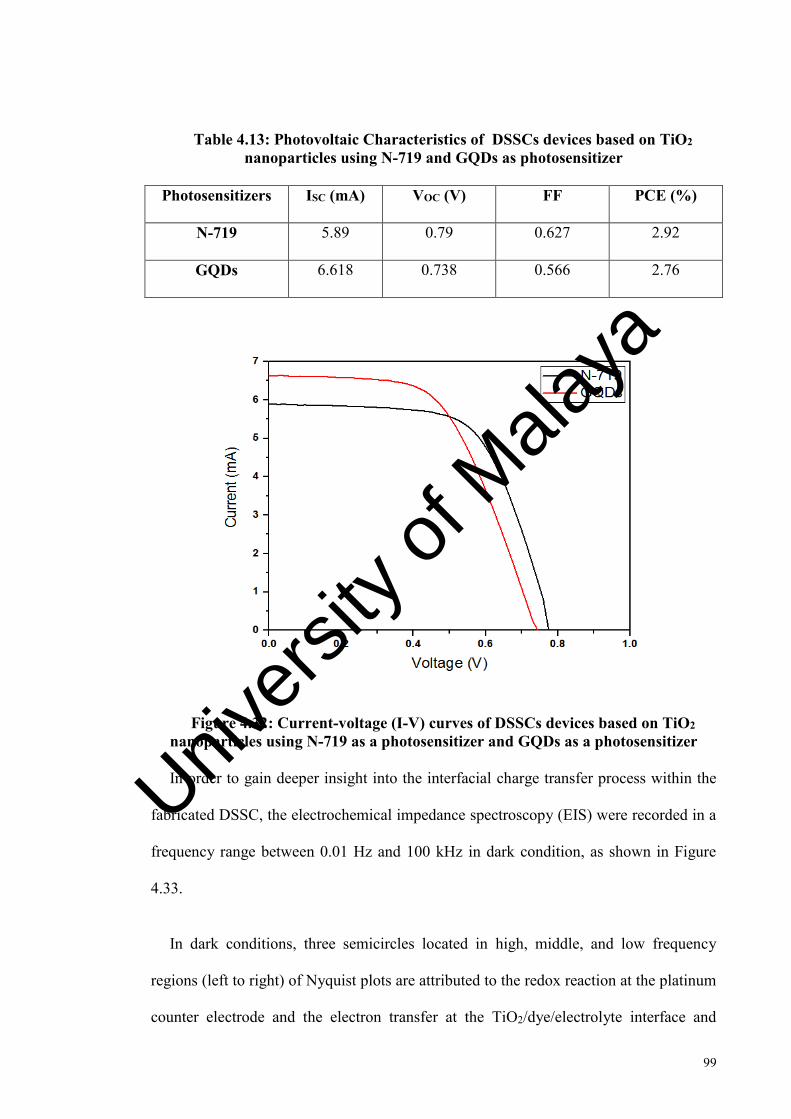
99
Table 4.13: Photovoltaic Characteristics of DSSCs devices based on TiO2 nanoparticles using N-719 and GQDs as photosensitizer
Photosensitizers ISC (mA) VOC (V) FF PCE (%)
N-719 5.89 0.79 0.627 2.92
GQDs 6.618 0.738 0.566 2.76
Figure 4.32: Current-voltage (I-V) curves of DSSCs devices based on TiO2 nanoparticles using N-719 as a photosensitizer and GQDs as a photosensitizer
In order to gain deeper insight into the interfacial charge transfer process within the
fabricated DSSC, the electrochemical impedance spectroscopy (EIS) were recorded in a
frequency range between 0.01 Hz and 100 kHz in dark condition, as shown in Figure
4.33.
In dark conditions, three semicircles located in high, middle, and low frequency
regions (left to right) of Nyquist plots are attributed to the redox reaction at the platinum
counter electrode and the electron transfer at the TiO2/dye/electrolyte interface and
Univers
ity of
Mala
ya
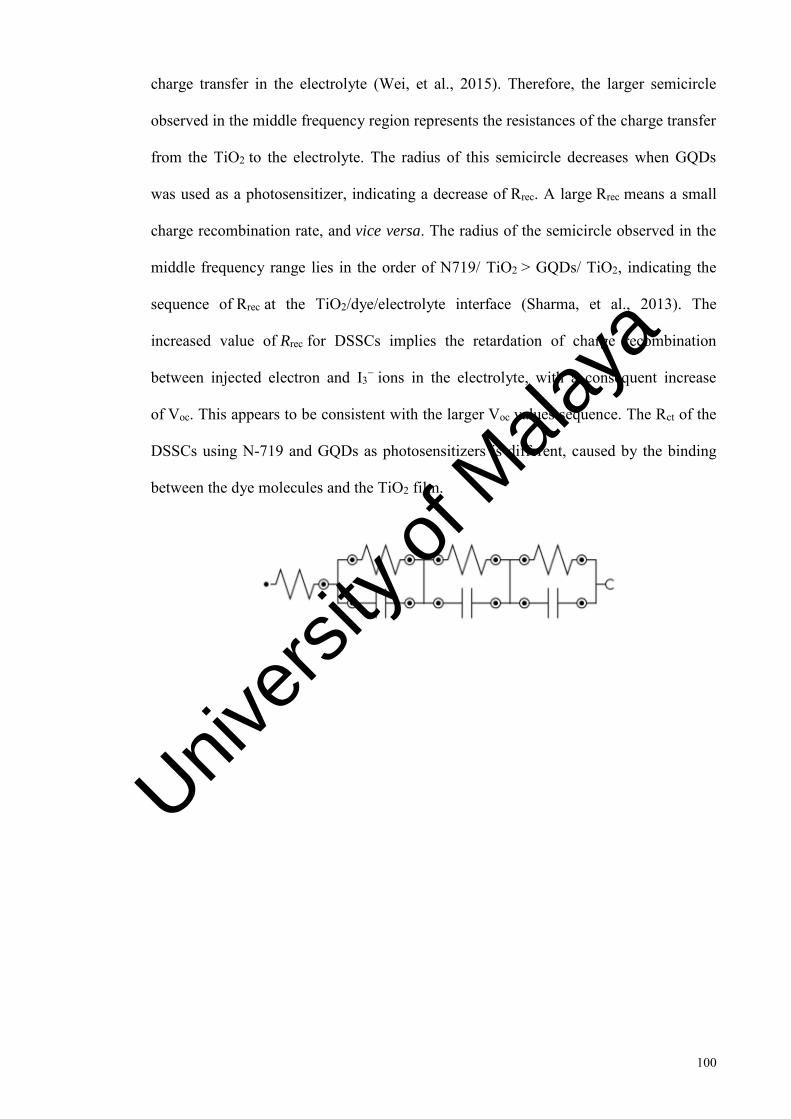
100
charge transfer in the electrolyte (Wei, et al., 2015). Therefore, the larger semicircle
observed in the middle frequency region represents the resistances of the charge transfer
from the TiO2 to the electrolyte. The radius of this semicircle decreases when GQDs
was used as a photosensitizer, indicating a decrease of Rrec. A large Rrec means a small
charge recombination rate, and vice versa. The radius of the semicircle observed in the
middle frequency range lies in the order of N719/ TiO2 > GQDs/ TiO2, indicating the
sequence of Rrec at the TiO2/dye/electrolyte interface (Sharma, et al., 2013). The
increased value of Rrec for DSSCs implies the retardation of charge recombination
between injected electron and I3− ions in the electrolyte, with a consequent increase
of Voc. This appears to be consistent with the larger Voc values sequence. The Rct of the
DSSCs using N-719 and GQDs as photosensitizers is different, caused by the binding
between the dye molecules and the TiO2 film.
Univers
ity of
Mala
ya

101
Figure 4.33: Nyquist plots of EIS for DSSCs based on TiO2 nanoparticles using N-719 and GQDs as photosensitizer in dark conditions
The IPCE curves in Figure 4.34 clearly shows that the active photon-to-current
responses of TiO2 photo-anode immersed in N-719 are more red-shifted compared to the
TiO2 photo-anode immersed in GQDs, which indicates that the spectral absorption range
is effectively broadened. The IPCE value of TiO2 photo-anode immersed in N-719
exceeds 28 %, while the quantum efficiency increased to 39 % for the DSSC device
based on TiO2 nanoparticles using GQDs as a photosensitizer (Lai, et al., 2015).
Univers
ity of
Mala
ya
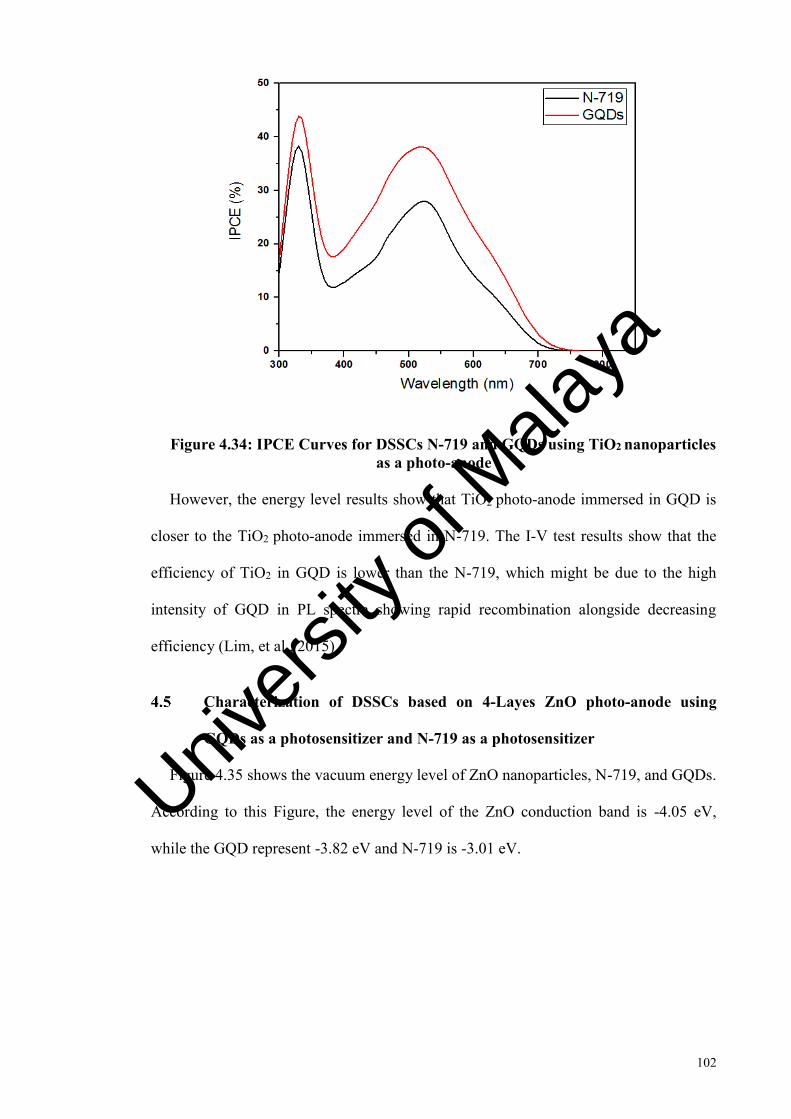
102
Figure 4.34: IPCE Curves for DSSCs N-719 and GQDs using TiO2 nanoparticles as a photo-anode
However, the energy level results show that TiO2 photo-anode immersed in GQD is
closer to the TiO2 photo-anode immersed in N-719. The I-V test results show that the
efficiency of TiO2 in GQD is lower than the N-719, which might be due to the high
intensity of GQD in PL spectra showing rapid recombination alongside decreasing
efficiency (Lim, et al., 2015).
Characterization of DSSCs based on 4-Layes ZnO photo-anode using
GQDs as a photosensitizer and N-719 as a photosensitizer
Figure 4.35 shows the vacuum energy level of ZnO nanoparticles, N-719, and GQDs.
According to this Figure, the energy level of the ZnO conduction band is -4.05 eV,
while the GQD represent -3.82 eV and N-719 is -3.01 eV.
Univers
ity of
Mala
ya
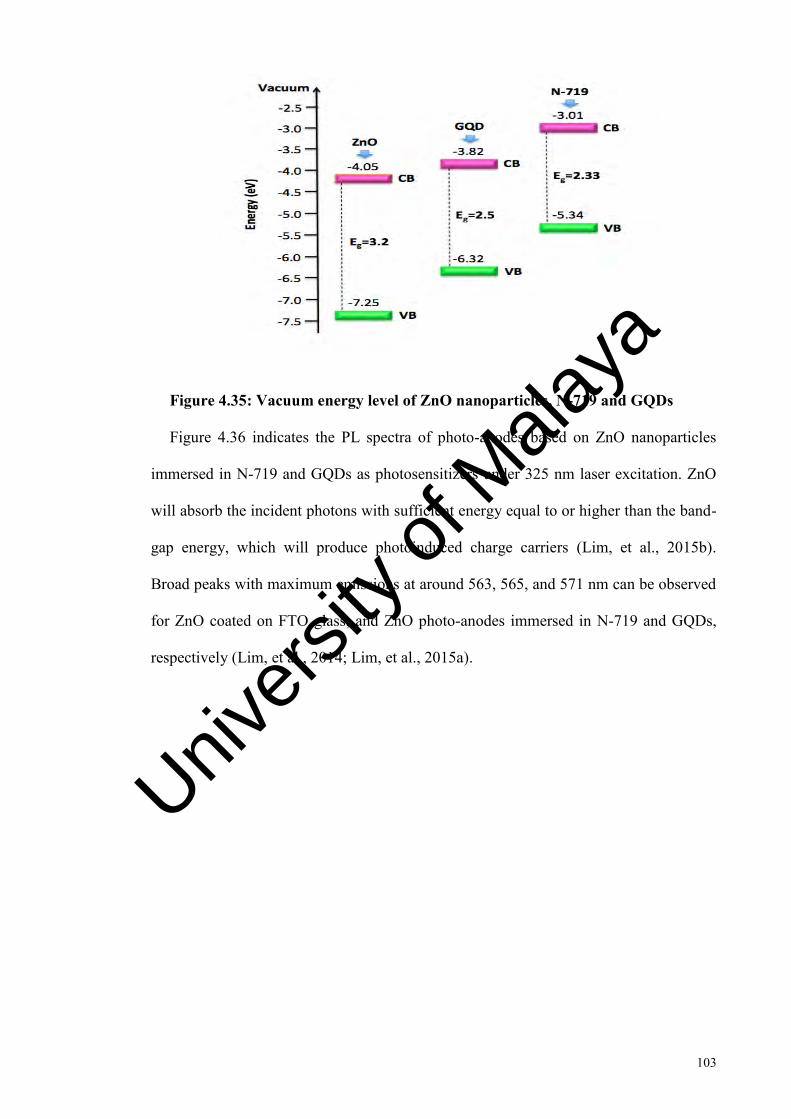
103
Figure 4.35: Vacuum energy level of ZnO nanoparticles, N-719 and GQDs
Figure 4.36 indicates the PL spectra of photo-anodes based on ZnO nanoparticles
immersed in N-719 and GQDs as photosensitizers under 325 nm laser excitation. ZnO
will absorb the incident photons with sufficient energy equal to or higher than the band-
gap energy, which will produce photoinduced charge carriers (Lim, et al., 2015b).
Broad peaks with maximum emissions at around 563, 565, and 571 nm can be observed
for ZnO coated on FTO glass, and ZnO photo-anodes immersed in N-719 and GQDs,
respectively (Lim, et al., 2014; Lim, et al., 2015a).
Univers
ity of
Mala
ya
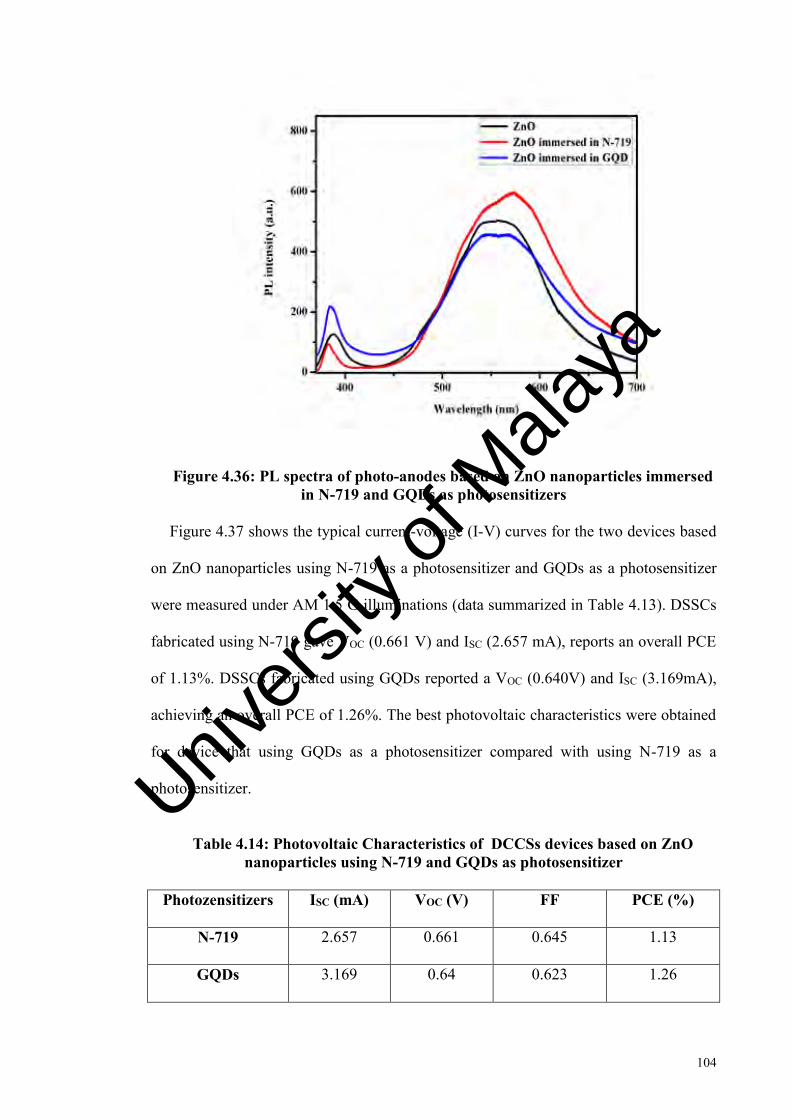
104
Figure 4.36: PL spectra of photo-anodes based on ZnO nanoparticles immersed in N-719 and GQDs as photosensitizers
Figure 4.37 shows the typical current-voltage (I-V) curves for the two devices based
on ZnO nanoparticles using N-719 as a photosensitizer and GQDs as a photosensitizer
were measured under AM 1.5 G illuminations (data summarized in Table 4.13). DSSCs
fabricated using N-719 gave VOC (0.661 V) and ISC (2.657 mA), reports an overall PCE
of 1.13%. DSSCs fabricated using GQDs reported a VOC (0.640V) and ISC (3.169mA),
achieving an overall PCE of 1.26%. The best photovoltaic characteristics were obtained
for device that using GQDs as a photosensitizer compared with using N-719 as a
photosensitizer.
Table 4.14: Photovoltaic Characteristics of DCCSs devices based on ZnO nanoparticles using N-719 and GQDs as photosensitizer
Photozensitizers ISC (mA) VOC (V) FF PCE (%)
N-719 2.657 0.661 0.645 1.13
GQDs 3.169 0.64 0.623 1.26
Univers
ity of
Mala
ya
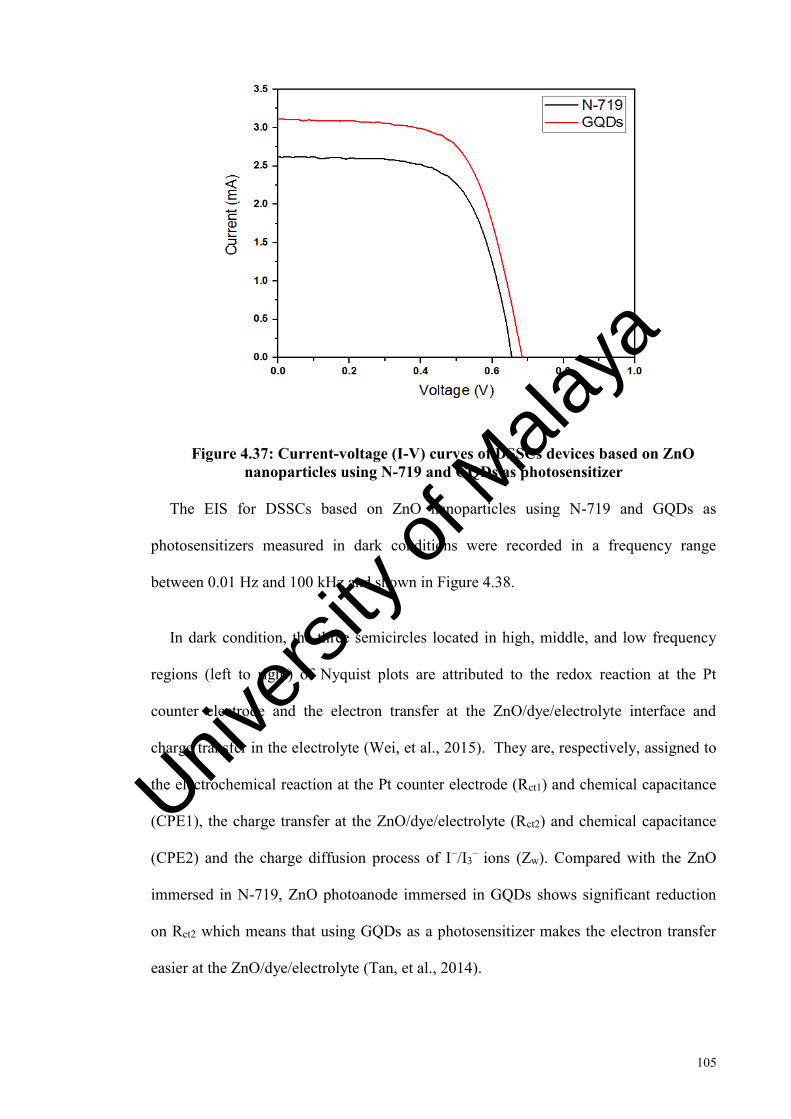
105
Figure 4.37: Current-voltage (I-V) curves of DSSCs devices based on ZnO nanoparticles using N-719 and GQDs as photosensitizer
The EIS for DSSCs based on ZnO nanoparticles using N-719 and GQDs as
photosensitizers measured in dark conditions were recorded in a frequency range
between 0.01 Hz and 100 kHz and shown in Figure 4.38.
In dark condition, the three semicircles located in high, middle, and low frequency
regions (left to right) of Nyquist plots are attributed to the redox reaction at the Pt
counter electrode and the electron transfer at the ZnO/dye/electrolyte interface and
charge transfer in the electrolyte (Wei, et al., 2015). They are, respectively, assigned to
the electrochemical reaction at the Pt counter electrode (Rct1) and chemical capacitance
(CPE1), the charge transfer at the ZnO/dye/electrolyte (Rct2) and chemical capacitance
(CPE2) and the charge diffusion process of I−/I3− ions (Zw). Compared with the ZnO
immersed in N-719, ZnO photoanode immersed in GQDs shows significant reduction
on Rct2 which means that using GQDs as a photosensitizer makes the electron transfer
easier at the ZnO/dye/electrolyte (Tan, et al., 2014).
Univers
ity of
Mala
ya
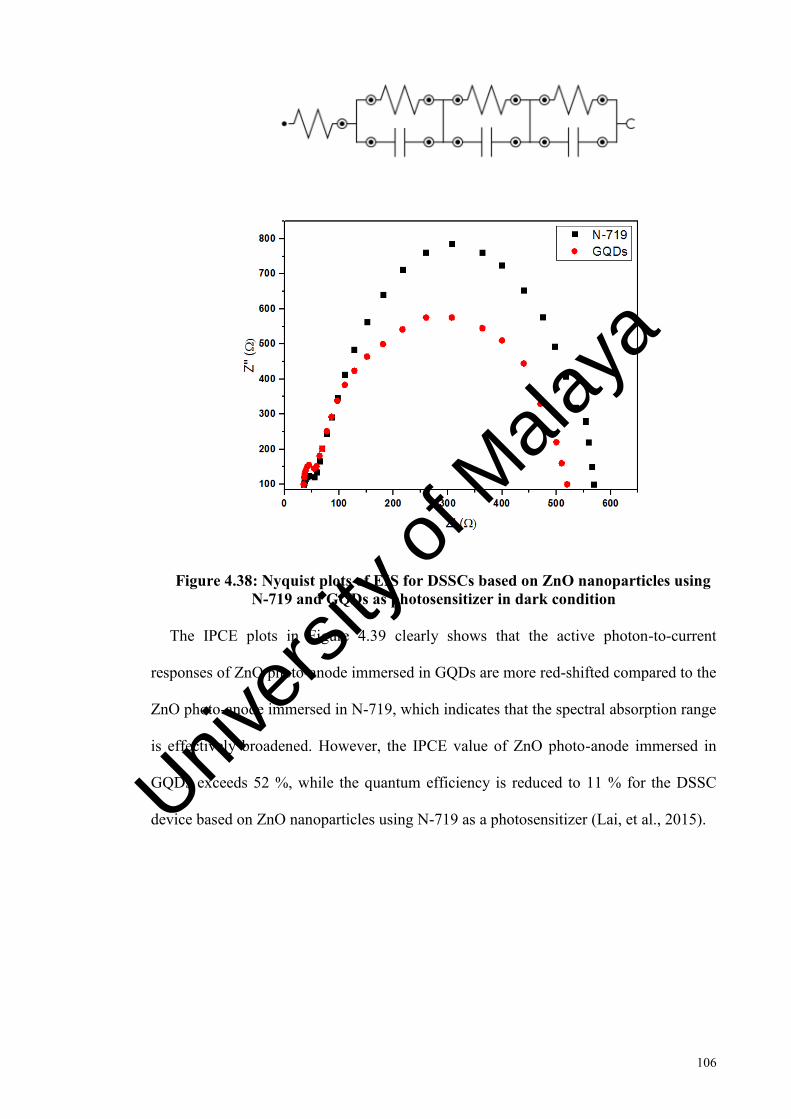
106
Figure 4.38: Nyquist plots of EIS for DSSCs based on ZnO nanoparticles using N-719 and GQDs as photosensitizer in dark condition
The IPCE plots in Figure 4.39 clearly shows that the active photon-to-current
responses of ZnO photo-anode immersed in GQDs are more red-shifted compared to the
ZnO photo-anode immersed in N-719, which indicates that the spectral absorption range
is effectively broadened. However, the IPCE value of ZnO photo-anode immersed in
GQDs exceeds 52 %, while the quantum efficiency is reduced to 11 % for the DSSC
device based on ZnO nanoparticles using N-719 as a photosensitizer (Lai, et al., 2015).
Univers
ity of
Mala
ya
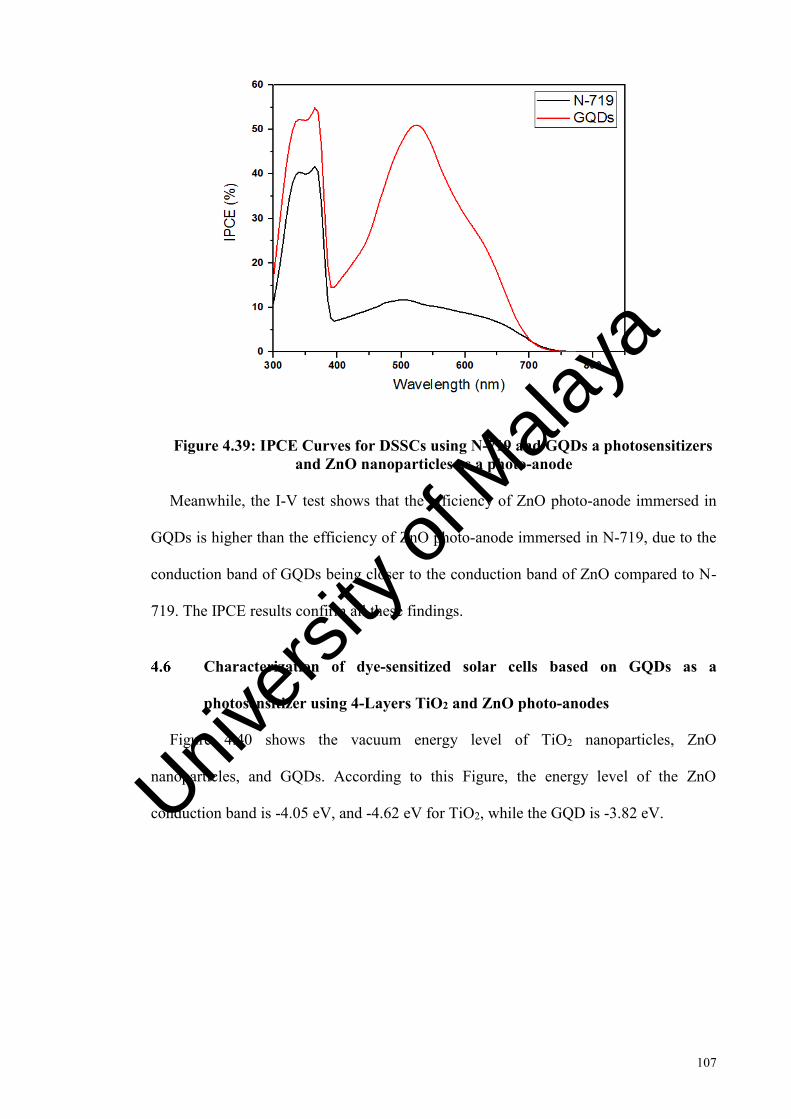
107
Figure 4.39: IPCE Curves for DSSCs using N-719 and GQDs a photosensitizers and ZnO nanoparticles as a photo-anode
Meanwhile, the I-V test shows that the efficiency of ZnO photo-anode immersed in
GQDs is higher than the efficiency of ZnO photo-anode immersed in N-719, due to the
conduction band of GQDs being closer to the conduction band of ZnO compared to N-
719. The IPCE results confirm all these findings.
Characterization of dye-sensitized solar cells based on GQDs as a
photosensitizer using 4-Layers TiO2 and ZnO photo-anodes
Figure 4.40 shows the vacuum energy level of TiO2 nanoparticles, ZnO
nanoparticles, and GQDs. According to this Figure, the energy level of the ZnO
conduction band is -4.05 eV, and -4.62 eV for TiO2, while the GQD is -3.82 eV. Univers
ity of
Mala
ya
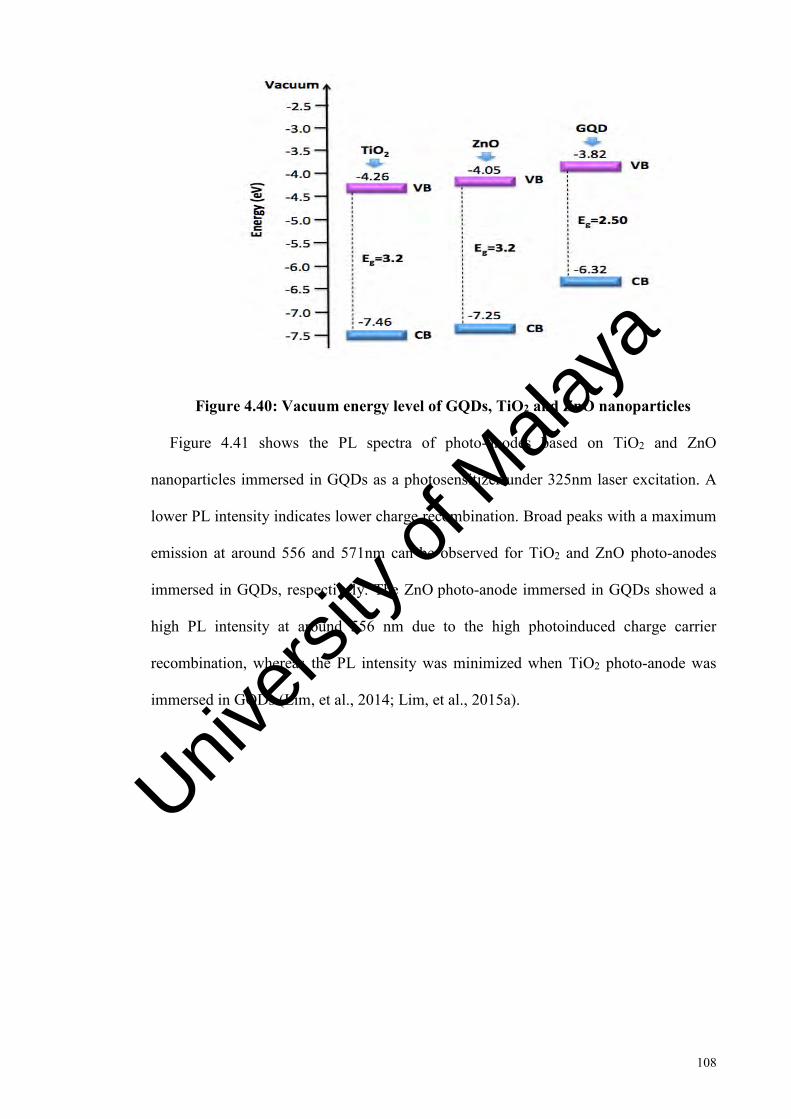
108
Figure 4.40: Vacuum energy level of GQDs, TiO2 and ZnO nanoparticles
Figure 4.41 shows the PL spectra of photo-anodes based on TiO2 and ZnO
nanoparticles immersed in GQDs as a photosensitizer under 325nm laser excitation. A
lower PL intensity indicates lower charge recombination. Broad peaks with a maximum
emission at around 556 and 571nm can be observed for TiO2 and ZnO photo-anodes
immersed in GQDs, respectively. The ZnO photo-anode immersed in GQDs showed a
high PL intensity at around 556 nm due to the high photoinduced charge carrier
recombination, whereas the PL intensity was minimized when TiO2 photo-anode was
immersed in GQDs (Lim, et al., 2014; Lim, et al., 2015a).
Univers
ity of
Mala
ya

109
Figure 4.41: PL spectra of photo-anodes based on TiO2 and ZnO nanoparticles immersed in GQDs as a photosensitizer
Figure 4.42 presents the typical current-voltage (I-V) curves for the two devices
based on GQDs as photosensitizers using TiO2 and ZnO nanoparticles as
photoelectrodes were measured under AM 1.5 G illumination (data summarized in
Table 4.15). DSSCs fabricated using TiO2 reported a VOC (0.738 V) and ISC (6.618 mA),
achieving an overall PCE of 2.76 %. The DSSCs fabricated using ZnO gave VOC (0.623
V) and ISC (3.169 mA), achieving an overall PCE of 1.26 %. The best photovoltaic
characteristics using GQDs, as a photosensitizer, were obtained for device that using
TiO2 as photoelectrodes as opposed to ZnO.
Table 4.15: Photovoltaic Characteristics of DSSCs devices based on GQDs as a photosensitizer using TiO2 and ZnO as photo-anodes
Photo-anodes ISC (mA) VOC (V) FF PCE (%)
TiO2 6.618 0.738 0.566 2.76
ZnO 3.169 0.64 0.623 1.26
Univers
ity of
Mala
ya
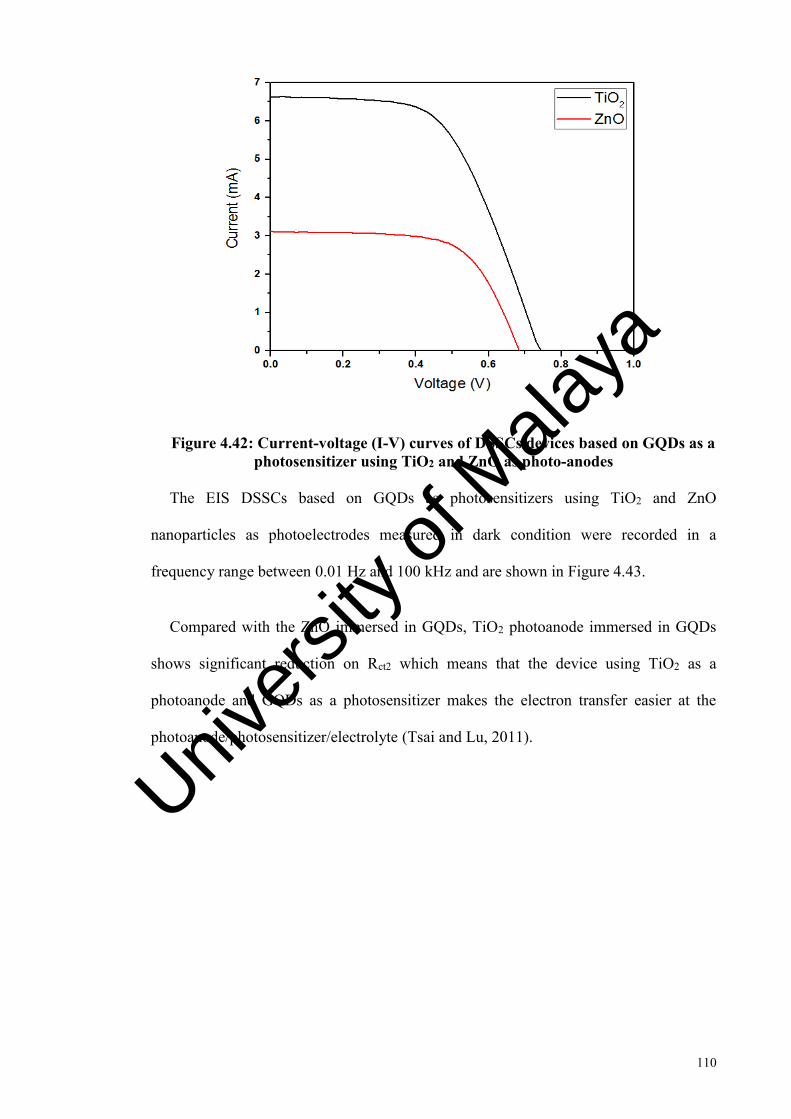
110
Figure 4.42: Current-voltage (I-V) curves of DSSCs devices based on GQDs as a photosensitizer using TiO2 and ZnO as photo-anodes
The EIS DSSCs based on GQDs as photosensitizers using TiO2 and ZnO
nanoparticles as photoelectrodes measured in dark condition were recorded in a
frequency range between 0.01 Hz and 100 kHz and are shown in Figure 4.43.
Compared with the ZnO immersed in GQDs, TiO2 photoanode immersed in GQDs
shows significant reduction on Rct2 which means that the device using TiO2 as a
photoanode and GQDs as a photosensitizer makes the electron transfer easier at the
photoanode/photosensitizer/electrolyte (Tsai and Lu, 2011).
Univers
ity of
Mala
ya
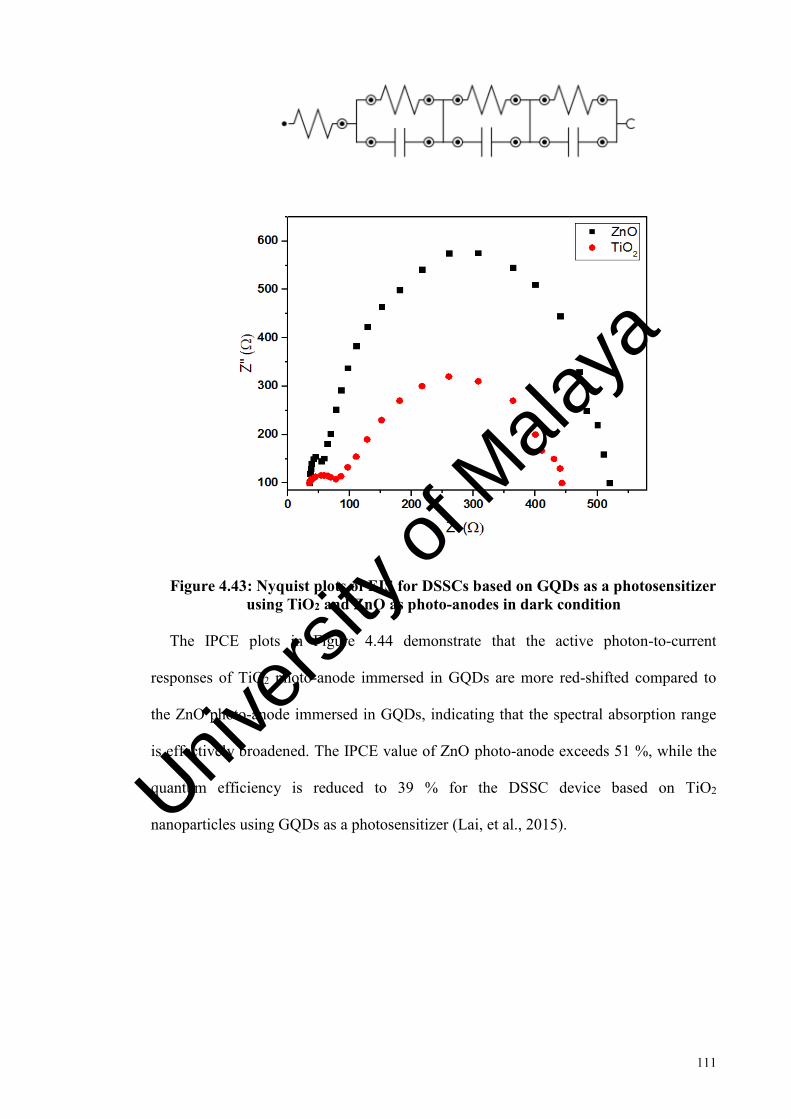
111
Figure 4.43: Nyquist plots of EIS for DSSCs based on GQDs as a photosensitizer using TiO2 and ZnO as photo-anodes in dark condition
The IPCE plots in Figure 4.44 demonstrate that the active photon-to-current
responses of TiO2 photo-anode immersed in GQDs are more red-shifted compared to
the ZnO photo-anode immersed in GQDs, indicating that the spectral absorption range
is effectively broadened. The IPCE value of ZnO photo-anode exceeds 51 %, while the
quantum efficiency is reduced to 39 % for the DSSC device based on TiO2
nanoparticles using GQDs as a photosensitizer (Lai, et al., 2015). Univers
ity of
Mala
ya

112
Figure 4.44: IPCE Curves for DSSCs based on TiO2 and ZnO as photo-anodes and GQDs as photosensitizer
The I-V test results indicate that the efficiency of TiO2 photo-anode immersed in
GQD is higher than the efficiency of ZnO photo-anode immersed in GQD. This might
be due to the high intensity of GQD in PL spectra, which shows the rapid recombination
and decrease of efficiency (Yu, et al., 2011).
Univers
ity of
Mala
ya
113
CHAPTER 5: CONCLUSION
CONCLUSION
In this study, the performance of low cost DSSCs with improved PCE based on TiO2
and ZnO nanoparticles as photo-anodes and GQDs as a photosensitizer were
investigated experimentally. For this purpose, a series of experiments were performed
and the results were recorded. As described in the previous chapters, different DSSC
devices were fabricated based on different photo-anodes and different photosensitizers.
The effect of different immersion times on the performance of DSSCs was
investigated by immersing TiO2 and ZnO photo-anodes in different photosensitizer for
different times. For both photosensitizers, the I-V tests and IPCE results confirm when
the immersion time is 21 hours the efficiency was increased due to more photosensitizer
molecules can be adsorbed when immersion time is increased, which also increase the
light harvesting efficiency.
To investigate the effect of the thickness of TiO2 and ZnO photo-anodes in DSSCs,
multiple layers of TiO2 and ZnO nanoparticles were coated onto the FTO glasses for the
preparation of photo-anodes and then immersed in N-719 and GQDs as
photosensitizers. With an increasing thickness, there was more photosensitizer
molecules present in the semiconductor layer for absorbing sunlight, which result in the
generation of current. However, increasing thickness requires a longer path for the
photo generated electrons to reach the working electrode, which increases the rate of
electron recombination. Therefore, the current started decreasing post-optimal
thickness. For both photosensitizers, the I-V tests and IPCE results confirm that photo-
anodes with 40 μm thicknesses show the highest efficiency.
To compare the efficiency of DSSCs using GQDs as a photosensitizer with DSSCs
using N-719 as photosensitizer, TiO2 and ZnO photo-anodes with 40 μm thicknesses
Univers
ity of
Mala
ya

114
were immersed in both photosensitizers for 21 hours. The I-V test results show that the
efficiency of TiO2 photo-anodes immersed in GQDs are lower than the N-719, which
might be due to the high intensity of GQDs in PL spectra showing rapid recombination
alongside decreasing efficiency. Meanwhile, from I-V test results, the efficiency of ZnO
photo-anode immersed in GQDs is higher than the efficiency of ZnO photo-anode
immersed in N-719, due to the conduction band of GQDs being closer to the conduction
band of ZnO compared to N-719. Although, the efficiency of ZnO photo-anode
immersing in GQD is higher than ZnO photo-anode immersing in N-719, but the TiO2
photo-anode immersing in GQD efficiency (2.76 %) is more than two times higher than
the ZnO (1.26 %) photo-anode immersing in GQDs.
Recommendations for future work
Though this study has provided good efficiencies of DSSCs using GQDs as
photosensitizer, there is still a need for further study on these achievements. As it has
been reported in the literature, the higher efficiency of DSSC employing N-719 is 11 %,
while the one fabricated in this research is 2.76 %. This difference might be due to the
method which has been used to fabricate the DSSC. As a result, future work can focus
on the fabrication method such as sputtering, spin-coating and etcetera, which might
increase the efficiency of DSSC utilizing GQD in its photo-anode.
Due to uniqe properties of GQDs which has been mentioned earlier, green quantum dots
can be used as a green photosensitizer. In addition quantum dots (QDs) are superior
to organic photosensitizers in terms of photostability and water dispersability.
All these benefits of green quantum dots, put in the center of attention for future
studies both in the case of green photosensitizer and also water treatment.
Univers
ity of
Mala
ya
115
REFERENCES
Ahmad, S., Yum, J. H., Butt, H. J., Nazeeruddin, M. K., & Grätzel, M. (2010). Efficient Platinum‐ Free Counter Electrodes for Dye‐ Sensitized Solar Cell Applications. ChemPhysChem, 11(13), 2814-2819.
Akhtar, M. J., Ahamed, M., Kumar, S., Khan, M. A. M., Ahmad, J., & Alrokayan, S. A. (2012). Zinc oxide nanoparticles selectively induce apoptosis in human cancer cells through reactive oxygen species. International journal of nanomedicine, 7, 845.
An, B.-K., Hu, W., Burn, P. L., & Meredith, P. (2010). New type II catechol-thiophene sensitizers for dye-sensitized solar cells. The Journal of Physical Chemistry C,
114(41), 17964-17974.
Aneesh, P., Vanaja, K., & Jayaraj, M. (2007). Synthesis of ZnO nanoparticles by
hydrothermal method. Paper presented at the NanoScience+ Engineering.
Anta, J. A., Guillen, E., & Tena-Zaera, R. n. (2012). ZnO-based dye-sensitized solar cells. The Journal of Physical Chemistry C, 116(21), 11413-11425.
Arico, A. S., Bruce, P., Scrosati, B., Tarascon, J.-M., & Van Schalkwijk, W. (2005). Nanostructured materials for advanced energy conversion and storage devices. Nature materials, 4(5), 366-377.
Bach, U. (2000). Solid-state dye-sensitized mesoporous TiO2 solar cells.
Bacon, M., Bradley, S. J., & Nann, T. (2014). Graphene quantum dots. Particle &
Particle Systems Characterization, 31(4), 415-428.
Baxter, J. B., Walker, A., Van Ommering, K., & Aydil, E. (2006). Synthesis and characterization of ZnO nanowires and their integration into dye-sensitized solar cells. Nanotechnology, 17(11), S304.
Becquerel, A.-E. (1839). Memoire sur les effets electriques produits sous l’influence des rayons solaires. Comptes rendus, 9(567), 1839.
Bittkau, K., & Carius, R. (2007). Near-field study of optical modes in randomly textured ZnO thin films. Superlattices and Microstructures, 42(1), 47-51.
Boschloo, G., Lindström, H., Magnusson, E., Holmberg, A., & Hagfeldt, A. (2002). Optimization of dye-sensitized solar cells prepared by compression method. Journal of Photochemistry and Photobiology A: Chemistry, 148(1), 11-15.
Bunn, M., & Heinonen, O. (2011). Preventing the next Fukushima. Science, 333(6049), 1580-1581.
Campbell, W. M., Burrell, A. K., Officer, D. L., & Jolley, K. W. (2004). Porphyrins as light harvesters in the dye-sensitised TiO 2 solar cell. Coordination Chemistry
Reviews, 248(13), 1363-1379.
Univers
ity of
Mala
ya
116
Chae, S. Y., Park, M. K., Lee, S. K., Kim, T. Y., Kim, S. K., & Lee, W. I. (2003). Preparation of size-controlled TiO2 nanoparticles and derivation of optically transparent photocatalytic films. Chemistry of Materials, 15(17), 3326-3331.
Chen, D., Tang, L., & Li, J. (2010). Graphene-based materials in electrochemistry. Chemical Society Reviews, 39(8), 3157-3180.
Chen, L., Guo, C. X., Zhang, Q., Lei, Y., Xie, J., Ee, S., . . . Li, C. M. (2013). Graphene quantum-dot-doped polypyrrole counter electrode for high-performance dye-sensitized solar cells. ACS applied materials & interfaces, 5(6), 2047-2052.
Cheng, H., Dong, Z., Hu, C., Zhao, Y., Hu, Y., Qu, L., . . . Dai, L. (2013). Textile electrodes woven by carbon nanotube–graphene hybrid fibers for flexible electrochemical capacitors. Nanoscale, 5(8), 3428-3434.
Cheng, H., Ma, J., Zhao, Z., & Qi, L. (1995). Hydrothermal preparation of uniform nanosize rutile and anatase particles. Chemistry of Materials, 7(4), 663-671.
Choi, H., Baik, C., Kim, S., Kang, M.-S., Xu, X., Kang, H. S., . . . Grätzel, M. (2008). Molecular engineering of hybrid sensitizers incorporating an organic antenna into ruthenium complex and their application in solar cells. New Journal of
Chemistry, 32(12), 2233-2237.
Chua, C. K., Sofer, Z. k., Simek, P., Jankovsky, O. e., Klimova, K. i., Bakardjieva, S., . . . Pumera, M. (2015). Synthesis of strongly fluorescent graphene quantum dots by cage-opening buckminsterfullerene. Acs Nano, 9(3), 2548-2555.
Conibeer, G., Green, M., Corkish, R., Cho, Y., Cho, E.-C., Jiang, C.-W., . . . Puzzer, T. (2006). Silicon nanostructures for third generation photovoltaic solar cells. Thin
solid films, 511, 654-662.
Conn, D. R. (2011). The Smart Guide to Geothermal: How To Harvest Earth's Free Energy for Heating & Cooling: REED BUSINESS INFORMATION 360 PARK AVENUE SOUTH, NEW YORK, NY 10010 USA.
Cooper, D. R., D’Anjou, B., Ghattamaneni, N., Harack, B., Hilke, M., Horth, A., . . . Whiteway, E. (2012). Experimental review of graphene. ISRN Condensed
Matter Physics, 2012.
De Angelis, F. (2010). Direct vs. indirect injection mechanisms in perylene dye-sensitized solar cells: A DFT/TDDFT investigation. Chemical Physics Letters,
493(4), 323-327.
Delhaes, P. (2012). Carbon science and technology: from energy to materials: John Wiley & Sons.
Do, A.-T. T., Giang, H. T., Do, T. T., Pham, N. Q., & Ho, G. T. (2014). Effects of palladium on the optical and hydrogen sensing characteristics of Pd-doped ZnO nanoparticles. Beilstein journal of nanotechnology, 5, 1261.
Dong, P. (2013). Nanomaterials Enabled Dye-sensitized Solar Cells. Rice University.
Univers
ity of
Mala
ya
117
Du, J., Zhang, J., Liu, Z., Han, B., Jiang, T., & Huang, Y. (2006). Controlled synthesis of Ag/TiO2 core− shell nanowires with smooth and bristled surfaces via a one-step solution route. Langmuir, 22(3), 1307-1312.
Duncan, W. R., & Prezhdo, O. V. (2007). Theoretical studies of photoinduced electron transfer in dye-sensitized TiO2. Annu. Rev. Phys. Chem., 58, 143-184.
Dutta, M., Sarkar, S., Ghosh, T., & Basak, D. (2012). ZnO/graphene quantum dot solid-state solar cell. The Journal of Physical Chemistry C, 116(38), 20127-20131.
Ebrahimi, M., Samadi, M., Yousefzadeh, S., Soltani, M., Rahimi, A., Chou, T.-c., . . . Moshfegh, A. Z. (2016). Improved Solar-Driven Photocatalytic Activity of Hybrid Graphene Quantum Dots/ZnO Nanowires: A Direct Z-scheme Mechanism. ACS Sustainable Chemistry & Engineering.
El-Agez, T. M., Taya, S. A., Elrefi, K. S., & Abdel-Latif, M. S. (2014). Dye-sensitized solar cells using some organic dyes as photosensitizers. Optica applicata, 44(2), 345--351.
Ellis, H. (2014a). Characterization of dye-sensitized solar cells: Components for environmentally friendly photovoltaics.
Ellis, H. (2014b). Characterization of dye-sensitized solar cells: Components for
environmentally friendly photovoltaics. Ångström.
Esteban Benito, H., Del Ángel Sánchez, T., García Alamilla, R., Hernández Enríquez, J., Sandoval Robles, G., & Paraguay Delgado, F. (2014). Synthesis and physicochemical characterization of titanium oxide and sulfated titanium oxide obtained by thermal hydrolysis of titanium tetrachloride. Brazilian Journal of
Chemical Engineering, 31(3), 737-745.
Eu, S., Katoh, T., Umeyama, T., Matano, Y., & Imahori, H. (2008). Synthesis of sterically hindered phthalocyanines and their applications to dye-sensitized solar cells. Dalton Transactions(40), 5476-5483.
Evans, A., Strezov, V., & Evans, T. J. (2009). Assessment of sustainability indicators for renewable energy technologies. Renewable and sustainable energy reviews,
13(5), 1082-1088.
Fabregat-Santiago, F., Bisquert, J., Palomares, E., Otero, L., Kuang, D., Zakeeruddin, S. M., & Grätzel, M. (2007). Correlation between photovoltaic performance and impedance spectroscopy of dye-sensitized solar cells based on ionic liquids. The
Journal of Physical Chemistry C, 111(17), 6550-6560.
Fan, T., Zeng, W., Tang, W., Yuan, C., Tong, S., Cai, K., . . . Epstein, A. J. (2015). Controllable size-selective method to prepare graphene quantum dots from graphene oxide. Nanoscale research letters, 10(1), 1-8.
Fang, X., Li, M., Guo, K., Li, J., Pan, M., Bai, L., . . . Zhao, X. (2014). Graphene quantum dots optimization of dye-sensitized solar cells. Electrochimica Acta,
137, 634-638.
Univers
ity of
Mala
ya
118
Fang, X., Ma, T., Akiyama, M., Guan, G., Tsunematsu, S., & Abe, E. (2005). Flexible counter electrodes based on metal sheet and polymer film for dye-sensitized solar cells. Thin Solid Films, 472(1), 242-245.
Ferrere, S. (2002). New photosensitizers based upon [Fe II (L) 2 (CN) 2] and [Fe II L 3], where L is substituted 2, 2′-bipyridine. Inorganica Chimica Acta, 329(1), 79-92.
Fu, M., Zhou, J., Xiao, Q., Li, B., Zong, R., Chen, W., & Zhang, J. (2006). ZnO nanosheets with ordered pore periodicity via colloidal crystal template assisted electrochemical deposition. Advanced Materials, 18(8), 1001-1004.
Gao, F., Wang, Y., Zhang, J., Shi, D., Wang, M., Humphry-Baker, R., . . . Grätzel, M. (2008). A new heteroleptic ruthenium sensitizer enhances the absorptivity of mesoporous titania film for a high efficiency dye-sensitized solar cell. Chemical
communications(23), 2635-2637.
Geary, E. A. M., Yellowlees, L. J., Jack, L. A., Oswald, I. D. H., Parsons, S., Hirata, N., . . . Robertson, N. (2005). Synthesis, structure, and properties of [Pt (II)(diimine)(dithiolate)] dyes with 3, 3'-, 4, 4'-, and 5, 5'-disubstituted bipyridyl: Applications in dye-sensitized solar cells. Inorganic chemistry, 44(2), 242-250.
Geim, A. K. (2009). Nature Mater. 6, 183 (2007); AH Castro Neto, F. Guinea, NMR Peres, KS Novoselov, and AK Geim. Rev. Mod. Phys, 81(1), 109.
Geim, A. K., & Novoselov, K. S. (2007). The rise of graphene. Nature materials, 6(3), 183-191.
Ghorbani, H. R., Mehr, F. P., Pazoki, H., & Rahmani, B. M. (2015). Synthesis of ZnO nanoparticles by precipitation method. Oriental Journal of Chemistry, 31(2), 1219-1221.
Gibbons, J. F. (1977). Semiconductor pn junction solar cell and method of manufacture: Google Patents.
Gogotsi, Y., & Presser, V. (2013). Carbon nanomaterials: CRC Press.
Gong, J., Sumathy, K., Qiao, Q., & Zhou, Z. (2017). Review on dye-sensitized solar cells (DSSCs): Advanced techniques and research trends. Renewable and
sustainable energy reviews, 68, 234-246.
Gorlov, M., & Kloo, L. (2008). Ionic liquid electrolytes for dye-sensitized solar cells. Dalton Transactions(20), 2655-2666.
Grätzel, M. (2001). Photoelectrochemical cells. Nature, 414(6861), 338-344.
Grätzel, M. (2003). Dye-sensitized solar cells. Journal of Photochemistry and
Photobiology C: Photochemistry Reviews, 4(2), 145-153.
Grätzel, M. (2004). Conversion of sunlight to electric power by nanocrystalline dye-sensitized solar cells. Journal of Photochemistry and Photobiology A:
Chemistry, 164(1), 3-14.
Univers
ity of
Mala
ya
119
Grätzel, M. (2005). Solar energy conversion by dye-sensitized photovoltaic cells. Inorganic chemistry, 44(20), 6841-6851.
Grätzel, M. (2009). Recent advances in sensitized mesoscopic solar cells. Accounts of
chemical research, 42(11), 1788-1798.
Griffith, M. J. (2012). Charge generation and recombination in porphyrin based dye sensitized solar cells.
Gupta, V., Chaudhary, N., Srivastava, R., Sharma, G. D., Bhardwaj, R., & Chand, S. (2011). Luminscent graphene quantum dots for organic photovoltaic devices. Journal of the American Chemical Society, 133(26), 9960-9963.
Hagfeldt, A., Boschloo, G., Sun, L., Kloo, L., & Pettersson, H. (2010). Dye-sensitized solar cells. Chemical Reviews, 110(11), 6595-6663.
Halme, J. (2002). Dye-sensitized nanostructured and organic photovoltaic cells: technical review and preliminary tests. Master of Science in Technology,
Helsinki University of Technology, Helsinki, Finland.
Halme, J., Vahermaa, P., Miettunen, K., & Lund, P. (2010). Device physics of dye solar cells. Advanced Materials, 22(35).
Hamilton, I. P., Li, B., Yan, X., & Li, L.-s. (2011). Alignment of colloidal graphene quantum dots on polar surfaces. Nano letters, 11(4), 1524-1529.
Haque, S. A., Handa, S., Peter, K., Palomares, E., Thelakkat, M., & Durrant, J. R. (2005). Supermolecular Control of Charge Transfer in Dye‐ Sensitized Nanocrystalline TiO2 Films: Towards a Quantitative Structure–Function Relationship. Angewandte Chemie International Edition, 44(35), 5740-5744.
Hara, K., Horiguchi, T., Kinoshita, T., Sayama, K., Sugihara, H., & Arakawa, H. (2000). Highly efficient photon-to-electron conversion with mercurochrome-sensitized nanoporous oxide semiconductor solar cells. Solar Energy Materials
and Solar Cells, 64(2), 115-134.
Hara, K., Sato, T., Katoh, R., Furube, A., Ohga, Y., Shinpo, A., . . . Arakawa, H. (2003). Molecular design of coumarin dyes for efficient dye-sensitized solar cells. The
Journal of Physical Chemistry B, 107(2), 597-606.
Hema, M., Arasi, A. Y., Tamilselvi, P., & Anbarasan, R. (2013). Titania nanoparticles synthesized by sol–gel technique. Chem Sci Trans, 2(1), 239-245.
Heo, J. H., Im, S. H., Noh, J. H., Mandal, T. N., Lim, C.-S., Chang, J. A., . . . Nazeeruddin, M. K. (2013). Efficient inorganic-organic hybrid heterojunction solar cells containing perovskite compound and polymeric hole conductors. Nature photonics, 7(6), 486-491.
Hoffmann, P., & Dorgan, B. (2012). Tomorrow's energy: hydrogen, fuel cells, and the
prospects for a cleaner planet: MIT press.
Univers
ity of
Mala
ya
120
Hong, J. S., Joo, M., Vittal, R., & Kim, K.-J. (2002). Improved photocurrent-voltage characteristics of Ru (II)-dye sensitized solar cells with polypyrrole-anchored TiO2 films. Journal of The Electrochemical Society, 149(12), E493-E496.
Hsin, C., Wei, C., Chia, L., Song, T., & Wen, H. (2008). Formation of branched ZnO nanowires from solvothermal method and dye-sensitized solar cells applications. The Journal of Physical Chemistry C, 112(42), 16359-16364.
Huang, X., Yin, Z., Wu, S., Qi, X., He, Q., Zhang, Q., . . . Zhang, H. (2011). Graphene‐based materials: synthesis, characterization, properties, and applications. small,
7(14), 1876-1902.
Imoto, K., Takahashi, K., Yamaguchi, T., Komura, T., Nakamura, J.-i., & Murata, K. (2003). High-performance carbon counter electrode for dye-sensitized solar cells. Solar Energy Materials and Solar Cells, 79(4), 459-469.
Ito, S., Miura, H., Uchida, S., Takata, M., Sumioka, K., Liska, P., . . . Grätzel, M. (2008a). High-conversion-efficiency organic dye-sensitized solar cells with a novel indoline dye. Chemical communications(41), 5194-5196.
Ito, S., Murakami, T. N., Comte, P., Liska, P., Grätzel, C., Nazeeruddin, M. K., & Grätzel, M. (2008b). Fabrication of thin film dye sensitized solar cells with solar to electric power conversion efficiency over 10%. Thin Solid Films, 516(14), 4613-4619.
Ito, S., Zakeeruddin, S. M., Humphry‐ Baker, R., Liska, P., Charvet, R., Comte, P., . . . Miura, H. (2006). High‐ Efficiency Organic‐ Dye‐ Sensitized Solar Cells Controlled by Nanocrystalline‐ TiO2 Electrode Thickness. Advanced Materials,
18(9), 1202-1205.
Jang, S.-R., Yum, J.-H., Klein, C., Kim, K.-J., Wagner, P., Officer, D., . . . Nazeeruddin, M. K. (2009). High molar extinction coefficient ruthenium sensitizers for thin film dye-sensitized solar cells. The Journal of Physical Chemistry C, 113(5), 1998-2003.
Jiang, K. J., & Masaki, N. (2006). J. b. Xia, S. Noda and S. Yanagida. Chem. Commun, 2460-2462.
Jiu, J., Isoda, S., Wang, F., & Adachi, M. (2006). Dye-sensitized solar cells based on a single-crystalline TiO2 nanorod film. The Journal of Physical Chemistry B,
110(5), 2087-2092.
Kamat, P. V. (1993). Photochemistry on nonreactive and reactive (semiconductor) surfaces. Chemical Reviews, 93(1), 267-300.
Kamat, P. V., Tvrdy, K., Baker, D. R., & Radich, J. G. (2010). Beyond photovoltaics: semiconductor nanoarchitectures for liquid-junction solar cells. Chemical
reviews, 110(11), 6664-6688.
Kaniyoor, A., & Ramaprabhu, S. (2011). Thermally exfoliated graphene based counter electrode for low cost dye sensitized solar cells. Journal of Applied Physics,
109(12), 124308.
Univers
ity of
Mala
ya
121
Kar, S., Dev, A., & Chaudhuri, S. (2006). Simple solvothermal route to synthesize ZnO nanosheets, nanonails, and well-aligned nanorod arrays. The Journal of Physical
Chemistry B, 110(36), 17848-17853.
Karthick, S. N., Hemalatha, K. V., Raj, C. J., Kim, H.-J., & Moonsuk, Y. (2012). Titanium dioxide paste preparation for dye sensitized solar cell using hydrothermal technique. Journal of Ceramic Processing Research, 13, 136-139.
Katoh, R., Yaguchi, K., & Furube, A. (2011). Effect of dye concentration on electron injection efficiency in nanocrystalline TiO 2 films sensitized with N719 dye. Chemical Physics Letters, 511(4), 336-339.
Katsnelson, M. I. (2007). Graphene: carbon in two dimensions. Materials today, 10(1), 20-27.
Kay, A., & Grätzel, M. (1996). Low cost photovoltaic modules based on dye sensitized nanocrystalline titanium dioxide and carbon powder. Solar Energy Materials
and Solar Cells, 44(1), 99-117.
Keis, K., Bauer, C., Boschloo, G., Hagfeldt, A., Westermark, K., Rensmo, H., & Siegbahn, H. (2002). Nanostructured ZnO electrodes for dye-sensitized solar cell applications. Journal of Photochemistry and Photobiology A: Chemistry, 148(1), 57-64.
Keis, K., Lindgren, J., Lindquist, S.-E., & Hagfeldt, A. (2000). Studies of the adsorption process of Ru complexes in nanoporous ZnO electrodes. Langmuir, 16(10), 4688-4694.
Kelarakis, A. (2015). Graphene quantum dots: In the crossroad of graphene, quantum dots and carbogenic nanoparticles. Current Opinion in Colloid & Interface
Science, 20(5), 354-361.
Kelly, C. A., Farzad, F., Thompson, D. W., Stipkala, J. M., & Meyer, G. J. (1999). Cation-controlled interfacial charge injection in sensitized nanocrystalline TiO2. Langmuir, 15(20), 7047-7054.
Khan, J., Gu, J., Meng, Y., Chai, Z., He, S., Wu, Q., . . . Wu, M. (2017). Anatase TiO 2 single crystal hollow nanoparticles: their facile synthesis and high-performance in dye-sensitized solar cells. CrystEngComm, 19(2), 325-334.
Khan, M. I. (2013). A Study on the Optimization of Dye-Sensitized Solar Cells.
Kim, J. K., Park, M. J., Kim, S. J., Wang, D. H., Cho, S. P., Bae, S., . . . Hong, B. H. (2013). Balancing light absorptivity and carrier conductivity of graphene quantum dots for high-efficiency bulk heterojunction solar cells. Acs Nano, 7(8), 7207-7212.
Kim, K. S., Kang, Y., Lee, J., Shin, Y., Park, N., Ryu, K. S., & Chang, S. H. (2006). Photovoltaic properties of nano-particulate and nanorod array ZnO electrodes for dye-sensitized solar cell. Bulletin-korean chemical society, 27(2), 295.
Univers
ity of
Mala
ya
122
Kittel, C., McEuen, P., & McEuen, P. (1996). Introduction to solid state physics (Vol. 8): Wiley New York.
Ko, S. H., Lee, D., Kang, H. W., Nam, K. H., Yeo, J. Y., Hong, S. J., . . . Sung, H. J. (2011). Nanoforest of hydrothermally grown hierarchical ZnO nanowires for a high efficiency dye-sensitized solar cell. Nano letters, 11(2), 666-671.
Kopidakis, N., Schiff, E., Park, N.-G., Van de Lagemaat, J., & Frank, A. (2000). Ambipolar diffusion of photocarriers in electrolyte-filled, nanoporous TiO2. The
Journal of Physical Chemistry B, 104(16), 3930-3936.
Kumar, H., & Rani, R. (2013). Structural and optical characterization of ZnO nanoparticles synthesized by microemulsion route. International Letters of
Chemistry, Physics and Astronomy, 14, 26.
Lai, F.-I., Yang, J.-F., & Kuo, S.-Y. (2015). Efficiency Enhancement of Dye-Sensitized Solar Cells’ Performance with ZnO Nanorods Grown by Low-Temperature Hydrothermal Reaction. Materials, 8(12), 8860-8867.
Lee, M.-W., Cha, S.-B., Yang, S.-J., Park, S.-W., Kim, K.-K., Park, N.-G., & Lee, D.-H. (2009). Synthesis of Organic Dyes with Linkers Between 9, 9-Dimethylfluorenyl Terminal and α-Cyanoacrylic Acid Anchor, Effect of the Linkers on UV-Vis Absorption Spectra, and Photovoltaic Properties in Dye-Sensitized Solar Cells. Bulletin of the Korean Chemical Society, 30(10), 2269-2279.
Lewis, N. S. (2007). Toward cost-effective solar energy use. Science, 315(5813), 798-801.
Li, F., Wang, G., Jiao, Y., Li, J., & Xie, S. (2014). Efficiency enhancement of ZnO-based dye-sensitized solar cell by hollow TiO 2 nanofibers. Journal of Alloys
and Compounds, 611, 19-23.
Li, H., He, X., Kang, Z., Huang, H., Liu, Y., Liu, J., . . . Lee, S. T. (2010). Water‐soluble fluorescent carbon quantum dots and photocatalyst design. Angewandte
Chemie International Edition, 49(26), 4430-4434.
Li, Q., Kumar, V., Li, Y., Zhang, H., Marks, T. J., & Chang, R. P. H. (2005). Fabrication of ZnO nanorods and nanotubes in aqueous solutions. Chemistry of
Materials, 17(5), 1001-1006.
Li, Y., Hu, Y., Zhao, Y., Shi, G., Deng, L., Hou, Y., & Qu, L. (2011). An electrochemical avenue to green‐ luminescent graphene quantum dots as potential electron‐ acceptors for photovoltaics. Advanced Materials, 23(6), 776-780.
Lim, S. P., Pandikumar, A., Huang, N. M., & Lim, H. N. (2014). Enhanced photovoltaic performance of silver@ titania plasmonic photoanode in dye-sensitized solar cells. RSC Advances, 4(72), 38111-38118.
Univers
ity of
Mala
ya
123
Lim, S. P., Pandikumar, A., Lim, H. N., Ramaraj, R., & Huang, N. M. (2015a). Boosting photovoltaic performance of dye-sensitized solar cells using silver nanoparticle-decorated N, S-Co-doped-TiO2 photoanode. Scientific reports, 5.
Lim, S. P., Pandikumar, A., Lim, H. N., Ramaraj, R., & Huang, N. M. (2015b). Boosting photovoltaic performance of dye-sensitized solar cells using silver nanoparticle-decorated N, S-Co-doped-TiO2 photoanode. Scientific reports, 5, 11922.
Lindström, H., Holmberg, A., Magnusson, E., Lindquist, S.-E., Malmqvist, L., & Hagfeldt, A. (2001). A new method for manufacturing nanostructured electrodes on plastic substrates. Nano Letters, 1(2), 97-100.
Liu, F., Jang, M. H., Ha, H. D., Kim, J. H., Cho, Y. H., & Seo, T. S. (2013). Facile synthetic method for pristine graphene quantum dots and graphene oxide quantum dots: origin of blue and green luminescence. Advanced Materials,
25(27), 3657-3662.
Liu, R., Wu, D., Feng, X., & Mullen, K. (2011). Bottom-up fabrication of photoluminescent graphene quantum dots with uniform morphology. Journal of
the American Chemical Society, 133(39), 15221-15223.
Longyue, Z., Songyuan, D., Weiwei, X., & Kongjia, W. (2006). Dye-sensitized solar cells based on ZnO films. Plasma Science and Technology, 8(2), 172.
Lü, X., Mou, X., Wu, J., Zhang, D., Zhang, L., Huang, F., . . . Huang, S. (2010). Improved‐ performance dye‐ sensitized solar cells using Nb‐ doped TiO2 electrodes: efficient electron injection and transfer. Advanced Functional
Materials, 20(3), 509-515.
Luitel, T. (2015). Application of surface chemistry at the interface of mesoporous TiO2 films for stable and high efficiency dye-sensitized solar cells.
Maeda, T., Hamamura, Y., Miyanaga, K., Shima, N., Yagi, S., & Nakazumi, H. (2011). Near-infrared absorbing squarylium dyes with linearly extended π-conjugated structure for dye-sensitized solar cell applications. Organic Letters, 13(22), 5994-5997.
Mann, J. R., Gannon, M. K., Fitzgibbons, T. C., Detty, M. R., & Watson, D. F. (2008). Optimizing the photocurrent efficiency of dye-sensitized solar cells through the controlled aggregation of chalcogenoxanthylium dyes on nanocrystalline titania films. The Journal of Physical Chemistry C, 112(34), 13057-13061.
Marie, M., Mandal, S., & Manasreh, O. (2015). An electrochemical glucose sensor based on zinc oxide nanorods. Sensors, 15(8), 18714-18723.
Marinado, T., Nonomura, K., Nissfolk, J., Karlsson, M. K., Hagberg, D. P., Sun, L., . . . Hagfeldt, A. (2009). How the nature of triphenylamine-polyene dyes in dye-sensitized solar cells affects the open-circuit voltage and electron lifetimes. Langmuir, 26(4), 2592-2598.
Univers
ity of
Mala
ya

124
Mathew, S., Yella, A., Gao, P., Humphry-Baker, R., Curchod, B. F. E., Ashari-Astani, N., . . . Grätzel, M. (2014). Dye-sensitized solar cells with 13% efficiency achieved through the molecular engineering of porphyrin sensitizers. Nature
chemistry, 6(3), 242-247.
McEvoy, A., & Grätzel, M. (1994). Sensitisation in photochemistry and photovoltaics. Solar Energy Materials and Solar Cells, 32(3), 221-227.
Meinardi, F., Colombo, A., Velizhanin, K. A., Simonutti, R., Lorenzon, M., Beverina, L., . . . Brovelli, S. (2014). Large-area luminescent solar concentrators based on/Stokes-shift-engineered/'nanocrystals in a mass-polymerized PMMA matrix. Nature Photonics, 8(5), 392-399.
Meulenkamp, E. A. (1998). Synthesis and growth of ZnO nanoparticles. The Journal of
Physical Chemistry B, 102(29), 5566-5572.
Meyer, T. (1996). Solid state nanocrystalline titanium oxide photovoltaic cells.
Miyashita, M., Sunahara, K., Nishikawa, T., Uemura, Y., Koumura, N., Hara, K., . . . Mori, S. (2008). Interfacial electron-transfer kinetics in metal-free organic dye-sensitized solar cells: combined effects of molecular structure of dyes and electrolytes. Journal of the American Chemical Society, 130(52), 17874-17881.
Mohammadpour, F., Moradi, M., Lee, K., Cha, G., So, S., Kahnt, A., . . . Schmuki, P. (2015). Enhanced performance of dye-sensitized solar cells based on TiO 2 nanotube membranes using an optimized annealing profile. Chemical
Communications, 51(9), 1631-1634.
Mori, S., Nagata, M., Nakahata, Y., Yasuta, K., Goto, R., Kimura, M., & Taya, M. (2010). Enhancement of incident photon-to-current conversion efficiency for phthalocyanine-sensitized solar cells by 3D molecular structuralization. Journal
of the American Chemical Society, 132(12), 4054-4055.
Mosconi, E., Yum, J.-H., Kessler, F., Gomez Garcia, C. J., Zuccaccia, C., Cinti, A., . . . De Angelis, F. (2012). Cobalt electrolyte/dye interactions in dye-sensitized solar cells: a combined computational and experimental study. Journal of the
American Chemical Society, 134(47), 19438-19453.
Mozer, A. J., Wagner, P., Officer, D. L., Wallace, G. G., Campbell, W. M., Miyashita, M., . . . Mori, S. (2008). The origin of open circuit voltage of porphyrin-sensitised TiO 2 solar cells. Chemical communications(39), 4741-4743.
Murakami, T. N., Ito, S., Wang, Q., Nazeeruddin, M. K., Bessho, T., Cesar, I., . . . Péchy, P. (2006). Highly efficient dye-sensitized solar cells based on carbon black counter electrodes. Journal of the electrochemical Society, 153(12), A2255-A2261.
Murakoshi, K., Kano, G., Wada, Y., Yanagida, S., Miyazaki, H., Matsumoto, M., & Murasawa, S. (1995). Importance of binding states between photosensitizing molecules and the TiO 2 surface for efficiency in a dye-sensitized solar cell. Journal of Electroanalytical Chemistry, 396(1), 27-34.
Univers
ity of
Mala
ya
125
Murakoshi, K., Kogure, R., Wada, Y., & Yanagida, S. (1997). Solid state dye-sensitized TiO2 solar cell with polypyrrole as hole transport layer. Chemistry letters, 26(5), 471-472.
Myasnikov, E. N., & Myasnikova, A. E. (2001). Band theory of semiconductors and autolocalization of electrons. Physics Letters A, 286(2-3), 210-216.
Nazeeruddin, M. K. (1998). R. Humphry-Baker. M. Gratzel, BA Murrer. Chemical
communications, 719.
Nazeeruddin, M. K., Humphry-Baker, R., Liska, P., & Grätzel, M. (2003). Investigation of sensitizer adsorption and the influence of protons on current and voltage of a dye-sensitized nanocrystalline TiO2 solar cell. The Journal of Physical
Chemistry B, 107(34), 8981-8987.
Nazeeruddin, M. K., Kay, A., Rodicio, I., Humphry-Baker, R., Müller, E., Liska, P., . . . Grätzel, M. (1993). Conversion of light to electricity by cis-X2bis (2, 2'-bipyridyl-4, 4'-dicarboxylate) ruthenium (II) charge-transfer sensitizers (X= Cl-, Br-, I-, CN-, and SCN-) on nanocrystalline titanium dioxide electrodes. Journal
of the American Chemical Society, 115(14), 6382-6390.
Nelson, J. (1999). Continuous-time random-walk model of electron transport in nanocrystalline TiO 2 electrodes. Physical Review B, 59(23), 15374.
Ni, M., Leung, M. K., Leung, D. Y., & Sumathy, K. (2006). An analytical study of the porosity effect on dye-sensitized solar cell performance. Solar Energy Materials
and Solar Cells, 90(9), 1331-1344.
Nissfolk, J., Fredin, K., Hagfeldt, A., & Boschloo, G. (2006). Recombination and transport processes in dye-sensitized solar cells investigated under working conditions. The Journal of Physical Chemistry B, 110(36), 17715-17718.
Nogi, K., Naito, M., & Yokoyama, T. (2012). Nanoparticle technology handbook: Elsevier.
Nogueira, A., Longo, C., & De Paoli, M.-A. (2004). Polymers in dye sensitized solar cells: overview and perspectives. Coordination Chemistry Reviews, 248(13), 1455-1468.
Nonomura, K., Yoshida, T., Schlettwein, D., & Minoura, H. (2003). One-step electrochemical synthesis of ZnO/Ru (dcbpy) 2 (NCS) 2 hybrid thin films and their photoelectrochemical properties. Electrochimica Acta, 48(20), 3071-3078.
Nwanya, A., Ezema, F., & Ejikeme, P. (2011). Dyed sensitized solar cells: A technically and economically alternative concept to pn junction photovoltaic devices. International Journal of the Physical Sciences, 6(22), 5190-5201.
O’regan, B., & Grätzel, M. (1991). Low cost and highly efficient solar cells based on the sensitization of colloidal titanium dioxide. Nature, 335(24), 737-740.
Univers
ity of
Mala
ya
126
Olsen, E., Hagen, G., & Lindquist, S. E. (2000). Dissolution of platinum in methoxy propionitrile containing LiI/I 2. Solar Energy Materials and Solar Cells, 63(3), 267-273.
Olsen, R. E. (2013). Synthesis, Characterization, and Application of High Surface Area,
Mesoporous, Stabilized Anatase TiO 2 Catalyst Supports: Brigham Young University.
Otsuka, A., Funabiki, K., Sugiyama, N., Mase, H., Yoshida, T., Minoura, H., & Matsui, M. (2008). Design and synthesis of near-infrared-active heptamethine-cyanine dyes to suppress aggregation in a dye-sensitized porous zinc oxide solar cell. Chemistry letters, 37(2), 176-177.
Otsuka, A., Funabiki, K., Sugiyama, N., Yoshida, T., Minoura, H., & Matsui, M. (2006). Dye sensitization of ZnO by unsymmetrical squaraine dyes suppressing aggregation. Chemistry letters, 35(6), 666-667.
Oueiny, C., Berlioz, S., & Perrin, F.-X. (2014). Carbon nanotube–polyaniline composites. Progress in Polymer Science, 39(4), 707-748.
Pan, D., Xi, C., Li, Z., Wang, L., Chen, Z., Lu, B., & Wu, M. (2013). Electrophoretic fabrication of highly robust, efficient, and benign heterojunction photoelectrocatalysts based on graphene-quantum-dot sensitized TiO 2 nanotube arrays. Journal of Materials Chemistry A, 1(11), 3551-3555.
Pan, D., Zhang, J., Li, Z., & Wu, M. (2010). Hydrothermal route for cutting graphene sheets into blue‐ luminescent graphene quantum dots. Advanced Materials,
22(6), 734-738.
Papageorgiou, N., Maier, W., & Grätzel, M. (1997). An iodine/triiodide reduction electrocatalyst for aqueous and organic media. Journal of the electrochemical
Society, 144(3), 876-884.
Park, N.-G., Van de Lagemaat, J., & Frank, A. (2000). Comparison of dye-sensitized rutile-and anatase-based TiO2 solar cells. The Journal of Physical Chemistry B,
104(38), 8989-8994.
Pichot, F., & Gregg, B. A. (2000). The photovoltage-determining mechanism in dye-sensitized solar cells. The Journal of Physical Chemistry B, 104(1), 6-10.
Poortmans, J., & Arkhipov, V. (2006). Thin film solar cells: fabrication,
characterization and applications (Vol. 5): John Wiley & Sons.
Pugliese, D. (2014). New insights in Dye-sensitized Solar Cells: novel nanostructured
photoanodes, metal-free dye, quasi-solid electrolytes and physics-based
modeling. Politecnico di Torino.
Rahima, L. (2008). SYNTHESIS OF TiO2-BASED NANOSTRUCTURED MATERIALS
USING A SOL-GEL PROCESS IN SUPERCRITICAL CO2. (Doctor of Philosophy), The University of Western Ontario London, Ontario, Canada.
Univers
ity of
Mala
ya
127
Rani, S., Suri, P., Shishodia, P. K., & Mehra, R. M. (2008). Synthesis of nanocrystalline ZnO powder via sol–gel route for dye-sensitized solar cells. Solar Energy
Materials and Solar Cells, 92(12), 1639-1645.
Rapino, S., Treossi, E., Palermo, V., Marcaccio, M., Paolucci, F., & Zerbetto, F. (2014). Playing peekaboo with graphene oxide: a scanning electrochemical microscopy investigation. Chemical Communications, 50(86), 13117-13120.
Rasalingam, S., Wu, C.-M., & Koodali, R. T. (2015). Modulation of Pore Sizes of Titanium Dioxide Photocatalysts by a Facile Template Free Hydrothermal Synthesis Method: Implications for Photocatalytic Degradation of Rhodamine B. ACS applied materials & interfaces, 7(7), 4368-4380.
Redmond, G., Fitzmaurice, D., & Graetzel, M. (1994). Visible light sensitization by cis-bis (thiocyanato) bis (2, 2'-bipyridyl-4, 4'-dicarboxylato) ruthenium (II) of a transparent nanocrystalline ZnO film prepared by sol-gel techniques. Chemistry
of Materials, 6(5), 686-691.
Robertson, N. (2008). Catching the Rainbow: Light Harvesting in Dye‐ Sensitized Solar Cells. Angewandte Chemie International Edition, 47(6), 1012-1014.
Saga, T. (2010). Advances in crystalline silicon solar cell technology for industrial mass production. NPG Asia Materials, 2(3), 96-102.
Saito, Y., Kitamura, T., Wada, Y., & Yanagida, S. (2002a). Application of poly (3, 4-ethylenedioxythiophene) to counter electrode in dye-sensitized solar cells. Chemistry letters, 31(10), 1060-1061.
Saito, Y., Kitamura, T., Wada, Y., & Yanagida, S. (2002b). Poly (3, 4-ethylenedioxythiophene) as a hole conductor in solid state dye sensitized solar cells. Synthetic Metals, 131(1), 185-187.
Saito, Y., Kubo, W., Kitamura, T., Wada, Y., & Yanagida, S. (2004). I−/I 3− redox reaction behavior on poly (3, 4-ethylenedioxythiophene) counter electrode in dye-sensitized solar cells. Journal of Photochemistry and Photobiology A:
Chemistry, 164(1), 153-157.
Sakaki, S., Kuroki, T., & Hamada, T. (2002). Synthesis of a new copper (I) complex,[Cu (tmdcbpy) 2]+(tmdcbpy= 4, 4′, 6, 6′-tetramethyl-2, 2′-bipyridine-5, 5′-dicarboxylic acid), and its application to solar cells. Journal of the Chemical
Society, Dalton Transactions(6), 840-842.
Sánchez-de-Armas, R., Oviedo, J., San Miguel, M. Á., & Sanz, J. F. (2011). Direct vs indirect mechanisms for electron injection in dye-sensitized solar cells. The
Journal of Physical Chemistry C, 115(22), 11293-11301.
Schaefer, H.-E. (2010). Nanoscience: the science of the small in physics, engineering,
chemistry, biology and medicine: Springer Science & Business Media.
Schmidt-Mende, L., & MacManus-Driscoll, J. L. (2007). ZnO–nanostructures, defects, and devices. Materials today, 10(5), 40-48.
Univers
ity of
Mala
ya
128
Senevirathne, M. K. I., Pitigala, P., Sivakumar, V., Jayaweera, P. V. V., Perera, A. G. U., & Tennakone, K. (2008). Sensitization of TiO 2 and ZnO nanocrystalline films with acriflavine. Journal of Photochemistry and Photobiology A:
Chemistry, 195(2), 364-367.
Shafiee, S., & Topal, E. (2009). When will fossil fuel reserves be diminished? Energy
policy, 37(1), 181-189.
Shahriary, L., & Athawale, A. A. (2014). Graphene oxide synthesized by using modified hummers approach. Int. J. Renew. Energy Environ. Eng, 2(01), 58-63.
Sharma, G., Daphnomili, D., Angaridis, P. A., Biswas, S., & Coutsolelos, A. (2013). Effect of thiourea incorporation in the electrolyte on the photovoltaic performance of the DSSC sensitized with pyridyl functionalized porphyrin. Electrochimica Acta, 102, 459-465.
Shen, J., Zhu, Y., Yang, X., & Li, C. (2012a). Graphene quantum dots: emergent nanolights for bioimaging, sensors, catalysis and photovoltaic devices. Chemical
Communications, 48(31), 3686-3699.
Shen, J., Zhu, Y., Yang, X., Zong, J., Zhang, J., & Li, C. (2012b). One-pot hydrothermal synthesis of graphene quantum dots surface-passivated by polyethylene glycol and their photoelectric conversion under near-infrared light. New Journal of Chemistry, 36(1), 97-101.
Shi, D., Pootrakulchote, N., Li, R., Guo, J., Wang, Y., Zakeeruddin, S. M., . . . Wang, P. (2008). New efficiency records for stable dye-sensitized solar cells with low-volatility and ionic liquid electrolytes. The Journal of Physical Chemistry C,
112(44), 17046-17050.
Shibano, Y., Umeyama, T., Matano, Y., & Imahori, H. (2007). Electron-donating perylene tetracarboxylic acids for dye-sensitized solar cells. Organic Letters,
9(10), 1971-1974.
Shockley, W., & Queisser, H. J. (1961). Efficiency loss mechanisms: theory and characterization. Appl Phys, 32, 510-519.
Silvestri, F., García-Iglesias, M., Yum, J.-H., Vázquez, P., Victoria Martínez-Díaz, M., Grätzel, M., . . . Torres, T. (2009). Carboxy-1, 4-phenylenevinylene-and carboxy-2, 6-naphthylene-vinylene unsymmetrical substituted zinc phthalocyanines for dye-sensitized solar cells. Journal of Porphyrins and
Phthalocyanines, 13(03), 369-375.
Smestad, G., Bignozzi, C., & Argazzi, R. (1994). Testing of dye sensitized TiO2 solar cells I: Experimental photocurrent output and conversion efficiencies. Solar
Energy Materials and Solar Cells, 32(3), 259-272.
Solangi, K., Islam, M., Saidur, R., Rahim, N., & Fayaz, H. (2011). A review on global solar energy policy. Renewable and sustainable energy reviews, 15(4), 2149-2163.
Univers
ity of
Mala
ya

129
Sopian, K., Zaharim, A., Zulfakar, M. S., & Ludin, N. A. (2017). Review on recent
performance titanium dioxide for flexible dye sensitized solar cell. Paper presented at the Energy and Sustainability in Small Developing Economies (ES2DE), 2017 International Conference in.
Srinivas, K., Yesudas, K., Bhanuprakash, K., & Giribabu, L. (2009). A combined experimental and computational investigation of anthracene based sensitizers for DSSC: comparison of cyanoacrylic and malonic acid electron withdrawing groups binding onto the TiO2 anatase (101) surface. The Journal of Physical
Chemistry C, 113(46), 20117-20126.
Sternberg, R. (2010). Hydropower's future, the environment, and global electricity systems. Renewable and sustainable energy reviews, 14(2), 713-723.
Subodro, R., Kristiawan, B., Ramelan, A. H., Wahyuningsih, S., Munawaroh, H., Hanif, Q. A., & Saputri, L. N. M. Z. (2017). Dye-Sensitized Solar Cells (DSSCs)
reengineering using TiO2 with natural dye (anthocyanin). Paper presented at the AIP Conference Proceedings.
Suliman, A. E., Tang, Y., & Xu, L. (2007). Preparation of ZnO nanoparticles and nanosheets and their application to dye-sensitized solar cells. Solar Energy
Materials and Solar Cells, 91(18), 1658-1662.
Suzuki, K., Yamaguchi, M., Kumagai, M., & Yanagida, S. (2002). Application of carbon nanotubes to counter electrodes of dye-sensitized solar cells. Chemistry
letters, 32(1), 28-29.
Swamy, V., Kuznetsov, A., Dubrovinsky, L. S., Caruso, R. A., Shchukin, D. G., & Muddle, B. C. (2005). Finite-size and pressure effects on the Raman spectrum of nanocrystalline anatase Ti O 2. Physical Review B, 71(18), 184302.
Swapna, M. V., & Haridas, K. R. (2016). An easier method of preparation of mesoporous anatase TiO2 nanoparticles via ultrasonic irradiation. Journal of
Experimental Nanoscience, 11(7), 540-549.
Taffa, D. H., Kathiresan, M., Arnold, T., Walder, L., Erbacher, M., Bauer, D., . . . Haase, M. (2010). Dye sensitized membranes within mesoporous TiO 2: Photocurrents in aqueous solution. Journal of Photochemistry and Photobiology
A: Chemistry, 216(1), 35-43.
Tan, X., Qiang, P., Zhang, D., Cai, X., Tan, S., Liu, P., & Mai, W. (2014). Three-level hierarchical TiO 2 nanostructure based high efficiency dye-sensitized solar cells. CrystEngComm, 16(6), 1020-1025.
Tang, H., Hessel, C. M., Wang, J., Yang, N., Yu, R., Zhao, H., & Wang, D. (2014). Two-dimensional carbon leading to new photoconversion processes. Chemical
Society Reviews, 43(13), 4281-4299.
Tatay, S., Haque, S. A., O'Regan, B., Durrant, J. R., Verhees, W. J. H., Kroon, J. M., . . . Palomares, E. (2007). Kinetic competition in liquid electrolyte and solid-state cyanine dye sensitized solar cells. Journal of Materials Chemistry, 17(29), 3037-3044.
Univers
ity of
Mala
ya
130
Tetreault, N., Horvath, E., Moehl, T., Brillet, J. r. m., Smajda, R., Bungener, S. p., . . . Forro, L. s. (2010). High-efficiency solid-state dye-sensitized solar cells: fast charge extraction through self-assembled 3D fibrous network of crystalline TiO2 nanowires. Acs Nano, 4(12), 7644-7650.
Timilsina, G. R., Kurdgelashvili, L., & Narbel, P. A. (2012). Solar energy: Markets, economics and policies. Renewable and sustainable energy reviews, 16(1), 449-465.
Ting, S. L., Ee, S. J., Ananthanarayanan, A., Leong, K. C., & Chen, P. (2015). Graphene quantum dots functionalized gold nanoparticles for sensitive electrochemical detection of heavy metal ions. Electrochimica Acta, 172, 7-11.
Tong, X., Wei, Q., Zhan, X., Zhang, G., & Sun, S. (2016). The New Graphene Family Materials: Synthesis and Applications in Oxygen Reduction Reaction. Catalysts,
7(1), 1.
Tornow, J., Ellmer, K., Szarko, J., & Schwarzburg, K. (2008). Voltage bias dependency of the space charge capacitance of wet chemically grown ZnO nanorods employed in a dye sensitized photovoltaic cell. Thin Solid Films, 516(20), 7139-7143.
Tornow, J., & Schwarzburg, K. (2007). Transient electrical response of dye-sensitized ZnO nanorod solar cells. The Journal of Physical Chemistry C, 111(24), 8692-8698.
Tsai, T.-Y., & Lu, S.-Y. (2011). Efficiency Enhancement Achieved with Elongated Titania Nanocrystals for Dye Sensitized Solar Cells. Journal of The
Electrochemical Society, 158(11), B1306-B1309.
Vafaee, M., & Ghamsari, M. S. (2007). Preparation and characterization of ZnO nanoparticles by a novel sol–gel route. Materials Letters, 61(14), 3265-3268.
Vogel, H. (1873). Dye-sensitization of AgX photographic plates. Ber. Dtsch. Ges,
6(144), 1320.
Wang, H., & Xie, C. (2006). Controlled fabrication of nanostructured ZnO particles and porous thin films via a modified chemical bath deposition method. Journal of
crystal growth, 291(1), 187-195.
Wang, P., Klein, C., Moser, J.-E., Humphry-Baker, R., Cevey-Ha, N.-L., Charvet, R., . . . Grätzel, M. (2004a). Amphiphilic ruthenium sensitizer with 4, 4'-diphosphonic acid-2, 2'-bipyridine as anchoring ligand for nanocrystalline dye sensitized solar cells. The Journal of Physical Chemistry B, 108(45), 17553-17559.
Wang, P., Zakeeruddin, S. M., Humphry‐ Baker, R., Moser, J. E., & Grätzel, M. (2003). Molecular‐ Scale Interface Engineering of TiO2 Nanocrystals: Improve the Efficiency and Stability of Dye‐ Sensitized Solar Cells. Advanced Materials,
15(24), 2101-2104.
Univers
ity of
Mala
ya
131
Wang, Q., Ito, S., Grätzel, M., Fabregat-Santiago, F., Mora-Seró, I., Bisquert, J., . . . Imai, H. (2006). Characteristics of high efficiency dye-sensitized solar cells. The
Journal of Physical Chemistry B, 110(50), 25210-25221.
Wang, X., Ding, Y., Summers, C. J., & Wang, Z. L. (2004b). Large-scale synthesis of six-nanometer-wide ZnO nanobelts. The Journal of Physical Chemistry B,
108(26), 8773-8777.
Wang, Z.-S., Koumura, N., Cui, Y., Takahashi, M., Sekiguchi, H., Mori, A., . . . Hara, K. (2008). Hexylthiophene-functionalized carbazole dyes for efficient molecular photovoltaics: tuning of solar-cell performance by structural modification. Chemistry of Materials, 20(12), 3993-4003.
Wang, Z. L. (2004). Zinc oxide nanostructures: growth, properties and applications. Journal of Physics: Condensed Matter, 16(25), R829.
Weerasinghe, H. C., Sirimanne, P. M., Franks, G. V., Simon, G. P., & Cheng, Y. B. (2010). Low temperature chemically sintered nano-crystalline TiO 2 electrodes for flexible dye-sensitized solar cells. Journal of Photochemistry and
Photobiology A: Chemistry, 213(1), 30-36.
Wei, L., Yang, Y., Zhu, Z., Fan, R., Wang, P., Dong, Y., & Chen, S. (2015). Effect of different donor groups in bis (6-methoxylpyridin-2-yl) substituted co-sensitizer on the performance of N719 sensitized solar cells. RSC Advances, 5(117), 96934-96944.
Wei, Z. (2011). Fabricataion of Dye Sensitized Solar Cells With Enhanced Energy
Conversion Efficiency.
Xia, Y., Yang, P., Sun, Y., Wu, Y., Mayers, B., Gates, B., . . . Yan, H. (2003). One‐dimensional nanostructures: synthesis, characterization, and applications. Advanced Materials, 15(5), 353-389.
Xin, X. (2012). Dye-and quantum dot-sensitized solar cells based on nanostructured wide-bandgap semiconductors via an integrated experimental and modeling study.
Xin, X., Liu, H., & Lin, Z. (2012). CHEMICLA BATH DEPOSITED NANOFLOWER ZNO AND TIO2 DYE-SENSITIZED SOLAR CELLS AND THEIR ELECTROCHEMICAL PROPERTIES. Dye-and quantum dot-sensitized solar
cells based on nanostructured wide-bandgap semiconductors via an integrated
experimental and modeling study, 65.
Xin, X., Scheiner, M., Ye, M., & Lin, Z. (2011). Surface-treated TiO2 nanoparticles for dye-sensitized solar cells with remarkably enhanced performance. Langmuir,
27(23), 14594-14598.
Yamanaka, N., Kawano, R., Kubo, W., Kitamura, T., Wada, Y., Watanabe, M., & Yanagida, S. (2005). Ionic liquid crystal as a hole transport layer of dye-sensitized solar cells. Chemical Communications(6), 740-742.
Univers
ity of
Mala
ya
132
Yamanaka, N., Kawano, R., Kubo, W., Masaki, N., Kitamura, T., Wada, Y., . . . Yanagida, S. (2007). Dye-sensitized TiO2 solar cells using imidazolium-type ionic liquid crystal systems as effective electrolytes. The Journal of Physical
Chemistry B, 111(18), 4763-4769.
Yan, X., Cui, X., Li, B., & Li, L.-s. (2010). Large, solution-processable graphene quantum dots as light absorbers for photovoltaics. Nano letters, 10(5), 1869-1873.
Yang, L., & Leung, W. W. F. (2011). Application of a Bilayer TiO2 Nanofiber Photoanode for Optimization of Dye‐ Sensitized Solar Cells. Advanced
Materials, 23(39), 4559-4562.
Yang, P., Yan, H., Mao, S., Russo, R., Johnson, J., Saykally, R., . . . Choi, H.-J. (2002). Controlled growth of ZnO nanowires and their optical properties. Advanced
Functional Materials, 12(5), 323.
Yeoh, M. E., & Chan, K. Y. (2017). Recent advances in photo‐ anode for dye‐sensitized solar cells: a review. International Journal of Energy Research,
41(15), 2446-2467.
Yu, J., Fan, J., & Cheng, B. (2011). Dye-sensitized solar cells based on anatase TiO 2 hollow spheres/carbon nanotube composite films. Journal of Power Sources,
196(18), 7891-7898.
Zahn, J., Sun, P., Jiang, S., & Sun, X. (2006). An investigation of the performance of dye-sensitized nanocrystalline solar cell with anthocyanin dye and ruthenium dye as the sensitizers.
Zamiri, G., Zakaria, A., Hussein, M. Z. B., Zamiri, R., Rebelo, A., & Ahangar, H. A. (2014). Effect of manganese doping on optical and magnetic properties of titanium dioxide nanostructures prepared by hydrothermal technique in the presence of thiourea. IET Micro & Nano Letters, 9(12), 906-908.
Zhang, Q., Dandeneau, C. S., Zhou, X., & Cao, G. (2009). ZnO Nanostructures for Dye‐ Sensitized Solar Cells. Advanced Materials, 21(41), 4087-4108.
Zhang, Z., Zhang, J., Chen, N., & Qu, L. (2012). Graphene quantum dots: an emerging material for energy-related applications and beyond. Energy & Environmental
Science, 5(10), 8869-8890.
Zhu, K., Kopidakis, N., Neale, N. R., van de Lagemaat, J., & Frank, A. J. (2006). Influence of surface area on charge transport and recombination in dye-sensitized TiO2 solar cells. The Journal of Physical Chemistry B, 110(50), 25174-25180.
Zhu, S., Song, Y., Wang, J., Wan, H., Zhang, Y., Ning, Y., & Yang, B. (2017). Photoluminescence mechanism in graphene quantum dots: Quantum confinement effect and surface/edge state. Nano Today, 13, 10-14.
Univers
ity of
Mala
ya

133
LIST OF PUBLICATIONS AND PAPERS PRESENTED
Golnoush Zamiri, Samira Bagheri, Sharifah Bee Abd Hamid Enhanced PCE of
Green Dye-Sensitized Solar Cell: Graphene Quantum Dots as a Photo-Sensitizer
(Submitted)
Golnoush Zamiri, Samira Bagheri, Sharifah Bee Abd Hamid Fabrication of Green
Dye-Sensitized Solar Cell based on ZnO nanoparticles as a photoanode and Graphene
Quantum Dots as a Photo-Sensitizer. Journal of Colloid and Interface Science/
YJCIS22896
Golnoush Zamiri, Samira Bagheri, Sheida Shahnazar, Sharifah Bee Abd Hamid,
Progress on Synthesis, Functionalization and Application of Graphene Nanoplatelets.
Material Research Innovations June 2015.
Univers
ity of
Mala
ya