Embed Size (px)
Citation preview
Prepared by Debby Bloom-Hill CMA, CFM
Slide 14-2
CHAPTER 14CHAPTER 14
Analyzing Financial Statements:
A Managerial Perspective
Analyzing Financial Statements:
A Managerial Perspective
Learning objective 1: Explain why managers analyze financial statements
Slide 14-3
Why Managers Analyze Financial Statements
Why Managers Analyze Financial Statements
Managers analyze financial statements for a variety of reasons including:1. To control operations2. To assess the financial stability of
vendors, customers, and other business partners
3. To assess how their companies appear to investors and creditors
Learning objective 1: Explain why managers analyze financial statements
Slide 14-4
Control of OperationsControl of Operations
Managers analyze financial statements to gain insight into whether their goals have been achieved or plans implemented successfully Managers expect that a successful
implementation of their plans will be reflected in financial information If financial information is inconsistent with a successful implementation an investigation will be launched
Learning objective 1: Explain why managers analyze financial statements
Slide 14-5
Assessment of Vendors, Customers, and Other Partners
Assessment of Vendors, Customers, and Other Partners Another important reason for
analyzing financial statements is to review the financial stability of vendors, customers, and other strategic partners Increasingly companies are
establishing strong relationships with a small number of vendors willing to commit to high quality levels and short lead times
Learning objective 1: Explain why managers analyze financial statements
Slide 14-6
Assessment of Vendors, Customers, and Other Partners
Assessment of Vendors, Customers, and Other Partners Managers want to be confident that
the vendor will be stable and continue in existence over the foreseeable future Companies analyze customers to
assess whether they will be able to pay the amounts they owe
Companies do not want to enter into partnerships with firms in financial difficulty
Learning objective 1: Explain why managers analyze financial statements
Slide 14-7
Assessment of Appearance to Investors and Creditors
Assessment of Appearance to Investors and Creditors
Investors and creditors carefully analyze a company’s financial statements Managers should anticipate how
their financial information will appear to stakeholders Managers can explain differences in the notes to the financial statements, or avoid transactions which cause differences
Learning objective 1: Explain why managers analyze financial statements
Slide 14-8
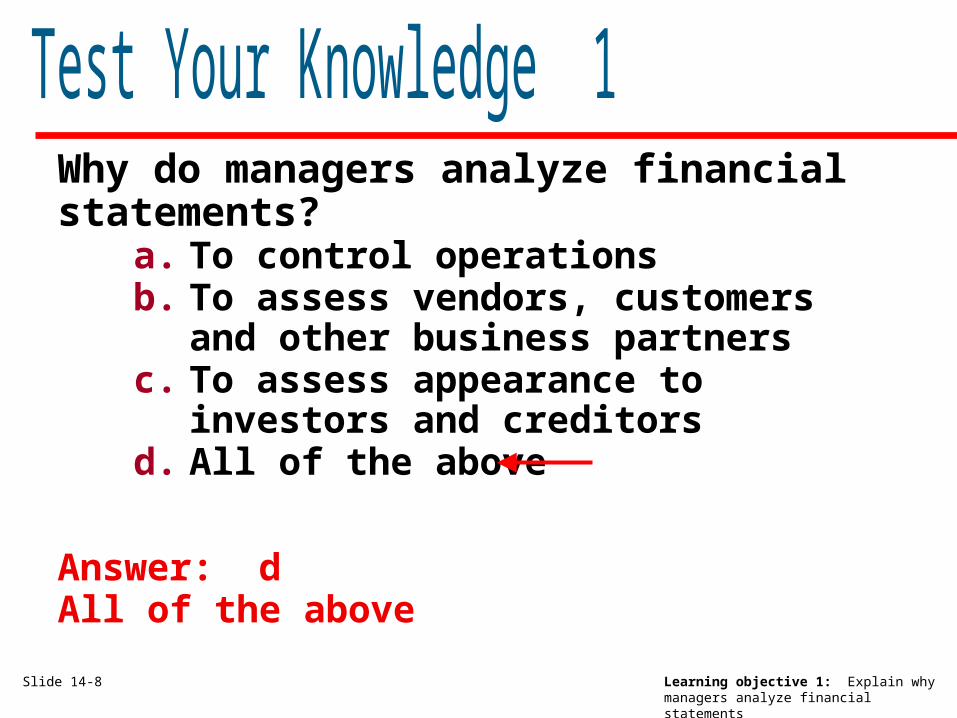
Why do managers analyze financial statements?
a. To control operationsb. To assess vendors, customers and
other business partnersc. To assess appearance to investors
and creditorsd. All of the above
Answer: dAll of the above
Learning objective 2: Perform horizontal and vertical analyses of the balance sheet and the income statement
Slide 14-9
Horizontal and Vertical Analyses
Horizontal and Vertical Analyses
Horizontal analysis Analysis of the dollar value and
percentage changes in financial statement amounts across time The dollar value of the change is the new value minus the old value for each financial statement amount
The percentage change is the dollar value of the change divided by the old value for each financial statement amount
Learning objective 2: Perform horizontal and vertical analyses of the balance sheet and the income statement
Slide 14-10
Horizontal and Vertical Analyses
Horizontal and Vertical Analyses
Vertical analysis Also called common size analysis Analyze financial statement
amounts in comparison to a base amount Divide each financial statement amount by total assets for the balance sheet
Divide each financial statement amount by net sales for the income statement
Slide 14-11
Analysis of the Balance SheetAnalysis of the Balance Sheet
The results of a partial horizontal analysis of the balance sheet are presented on the next slide What can we conclude?
HGW is expanding (increases in land, buildings, furniture and fixtures, and equipment)
Funded by debt and internally generated funds (retained earnings)
Learning objective 2: Perform horizontal and vertical analyses of the balance sheet and the income statement
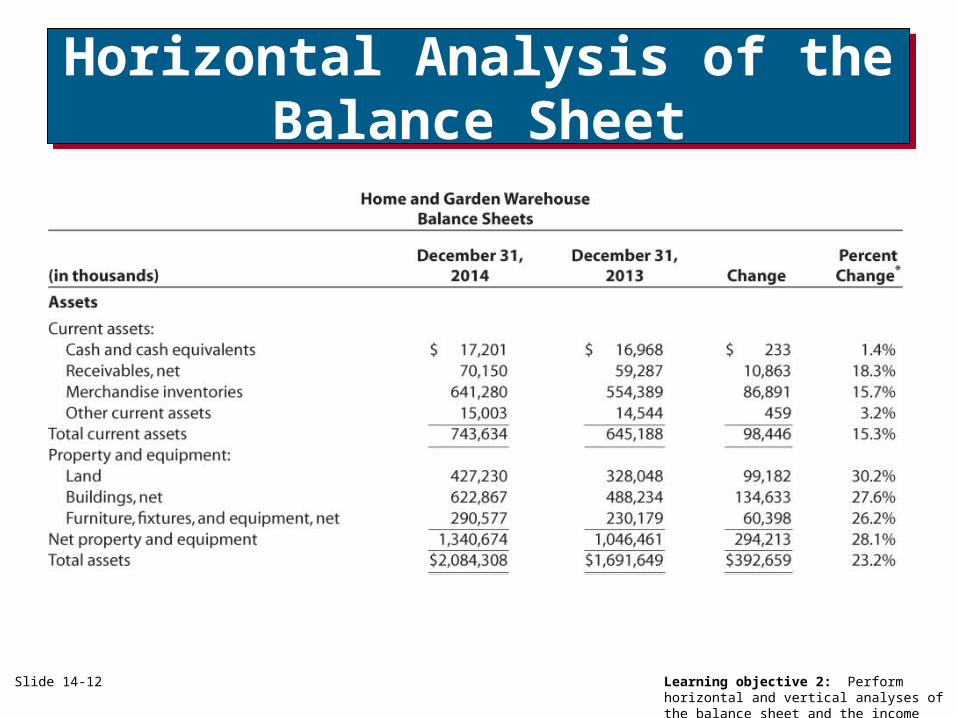
Horizontal Analysis of the Balance Sheet
Horizontal Analysis of the Balance Sheet
Learning objective 2: Perform horizontal and vertical analyses of the balance sheet and the income statement
Slide 14-12
Slide 14-13
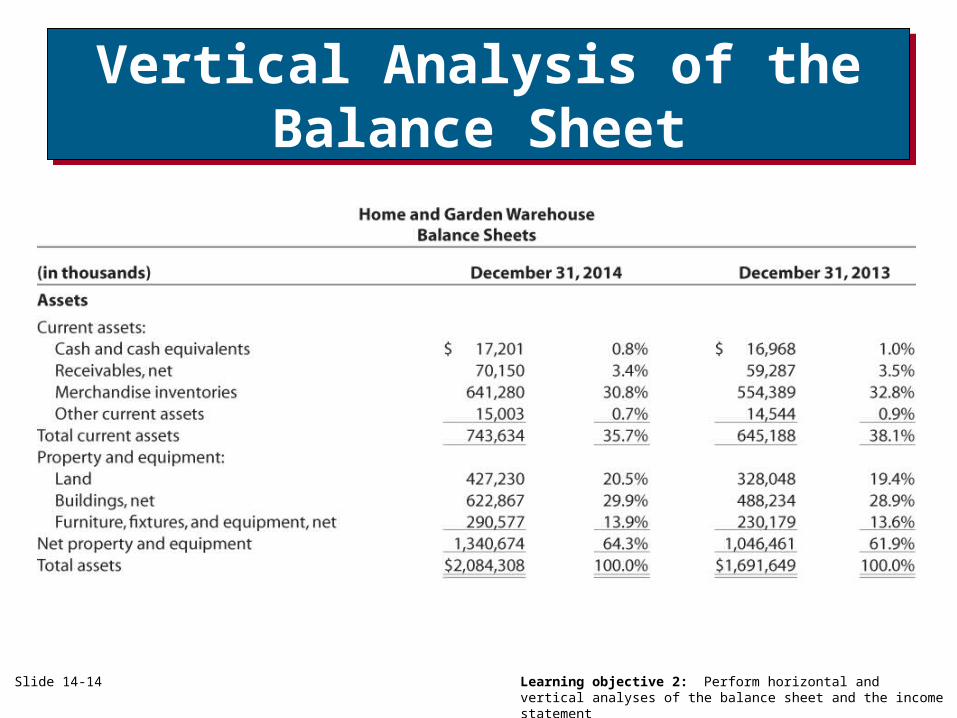
Analysis of the Balance SheetAnalysis of the Balance Sheet
A vertical analysis of the balance sheet is presented on the next slide The primary asset accounts are
merchandise inventory, land, and buildings All account balances are greater than 20 percent of total assets
Learning objective 2: Perform horizontal and vertical analyses of the balance sheet and the income statement
Slide 14-14
Vertical Analysis of the Balance Sheet
Vertical Analysis of the Balance Sheet
Learning objective 2: Perform horizontal and vertical analyses of the balance sheet and the income statement
Slide 14-15
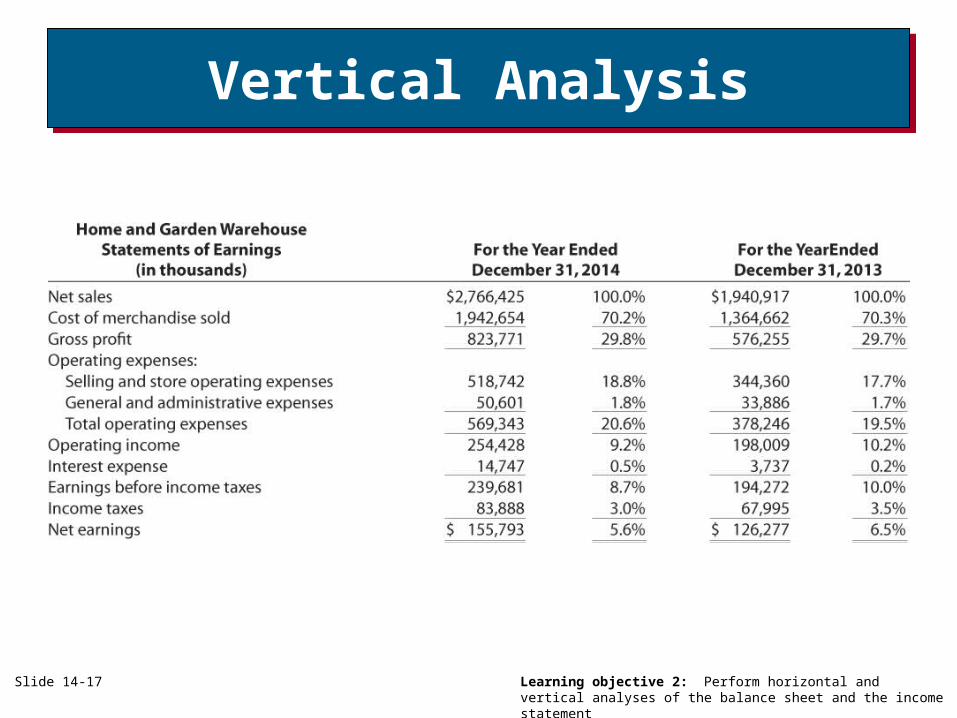
Analyzing the Income Statement
Analyzing the Income Statement
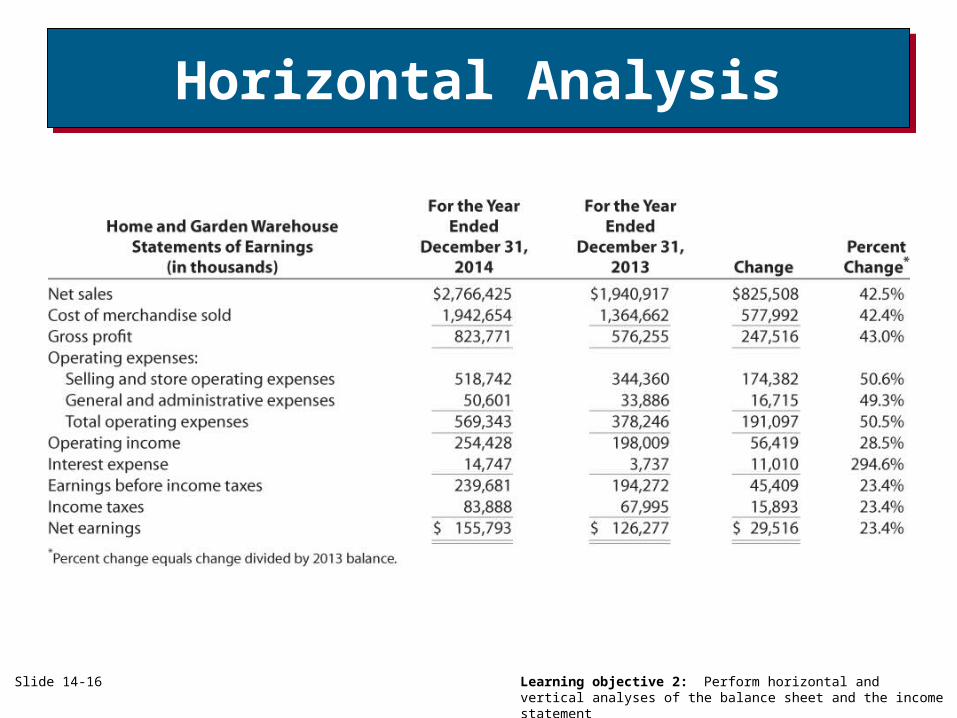
A horizontal and vertical analysis of the balance sheet is presented on the next two slides Both net sales and cost of goods
sold have increased from 2013 to 2014 Gross profit has increased 43%
The vertical analysis shows that net income has declined from 6.5% of sales to 5.6% of sales
Learning objective 2: Perform horizontal and vertical analyses of the balance sheet and the income statement
Slide 14-16
Horizontal AnalysisHorizontal Analysis
Learning objective 2: Perform horizontal and vertical analyses of the balance sheet and the income statement
Slide 14-17
Vertical AnalysisVertical Analysis
Learning objective 2: Perform horizontal and vertical analyses of the balance sheet and the income statement
Slide 14-18
Horizontal analysis evaluates:a. Comparable companiesb. Changes in expenses as a percentage
of salesc. Changes in expenses as a percent of
total assetsd. Changes in balances from one year to
another
Answer: dChanges in balances from one year to another
Learning objective 2: Perform horizontal and vertical analyses of the balance sheet and the income statement
Slide 14-19
Vertical analysis evaluates:a. Changes in net sales as a percentage
of total assetsb. Changes in expenses as a percentage
of salesc. Financial statement amounts in
comparison to a base amountd. Changes in balances from one year to
another
Answer: cFinancial statement amounts in comparison to a base amount
Learning objective 2: Perform horizontal and vertical analyses of the balance sheet and the income statement
Learning objective 3: Discuss earnings management and the importance of comparing net income to cash flow from operations
Slide 14-20
Earnings ManagementEarnings Management Accounting earnings can be
manipulated to make performance appear stronger than it actually is Allegations of impropriety have
been leveled against many companies, including: Enron Kroger Lucent, and Waste Management
Learning objective 3: Discuss earnings management and the importance of comparing net income to cash flow from operations
Slide 14-21
Earnings ManagementEarnings Management Why do managers manipulate
earnings? Managers often are evaluated and
rewarded based on the level of firm earnings If earnings are below the
specified bonus level, managers have an inventive to manipulate earnings
Managers manipulate earnings to raise the stock price and profit from exercising stock options
Learning objective 3: Discuss earnings management and the importance of comparing net income to cash flow from operations
Slide 14-22
Earnings ManagementEarnings Management
A red flag suggesting that accounting irregularities may be a problem is a difference between net income and operating cash flows If a firm records fictitious sales
income will increase but operating cash flows will not be affected The company does not collect cash
from fictitious sales
Learning objective 3: Discuss earnings management and the importance of comparing net income to cash flow from operations
Slide 14-23
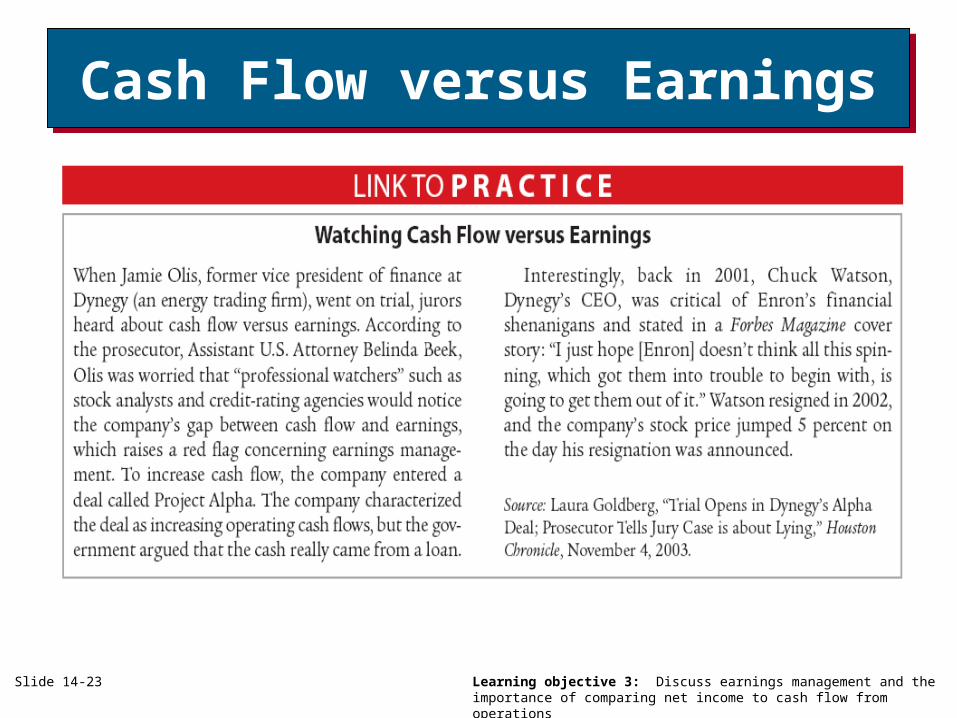
Cash Flow versus EarningsCash Flow versus Earnings
Learning objective 4: Understand how MD&A, credit reports, and news articles can be used to gain insight into a company’s current and future financial performance
Slide 14-24
Other Sources of Information on Financial Performance
Other Sources of Information on Financial Performance
A number of other information sources can be used to gain insight into a company’s financial performance Management discussion and
analysis Contained in the annual report Management provides users with explanations for financial results that are not obvious from reading the basic financial statements
Learning objective 4: Understand how MD&A, credit reports, and news articles can be used to gain insight into a company’s current and future financial performance
Slide 14-25
Other Sources of Information on Financial Performance
Other Sources of Information on Financial Performance
A number of other information sources can be used to gain insight into a company’s financial performance Credit reports
A number of firms sell credit reports that provide information on a company’s credit history
The ratings help managers evaluate the likelihood that a company they do business with will pay its bills on time
Learning objective 4: Understand how MD&A, credit reports, and news articles can be used to gain insight into a company’s current and future financial performance
Slide 14-26
Other Sources of Information on Financial Performance
Other Sources of Information on Financial Performance
A number of other information sources can be used to gain insight into a company’s financial performance News articles are another very
valuable source of financial information Lexis-Nexis is an example of a company that, for a fee, provides access to articles from major newspapers, magazines, and newswire services
Slide 14-27
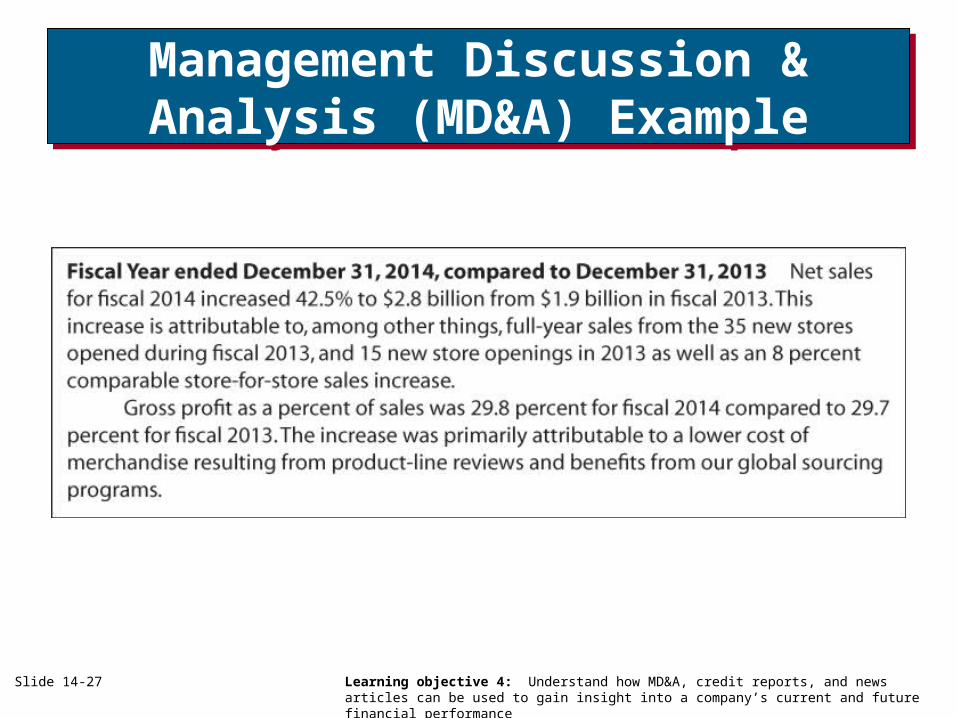
Management Discussion & Analysis (MD&A) ExampleManagement Discussion & Analysis (MD&A) Example
Learning objective 4: Understand how MD&A, credit reports, and news articles can be used to gain insight into a company’s current and future financial performance
Learning objective 5: Calculate and interpret profitability ratios
Slide 14-28
Ratio AnalysisRatio Analysis
Managers frequently perform financial analyses using various ratios To control operations To assess the stability of vendors,
customers, and other business partners
To assess how their companies appear to investors and creditors
Learning objective 5: Calculate and interpret profitability ratios
Slide 14-29
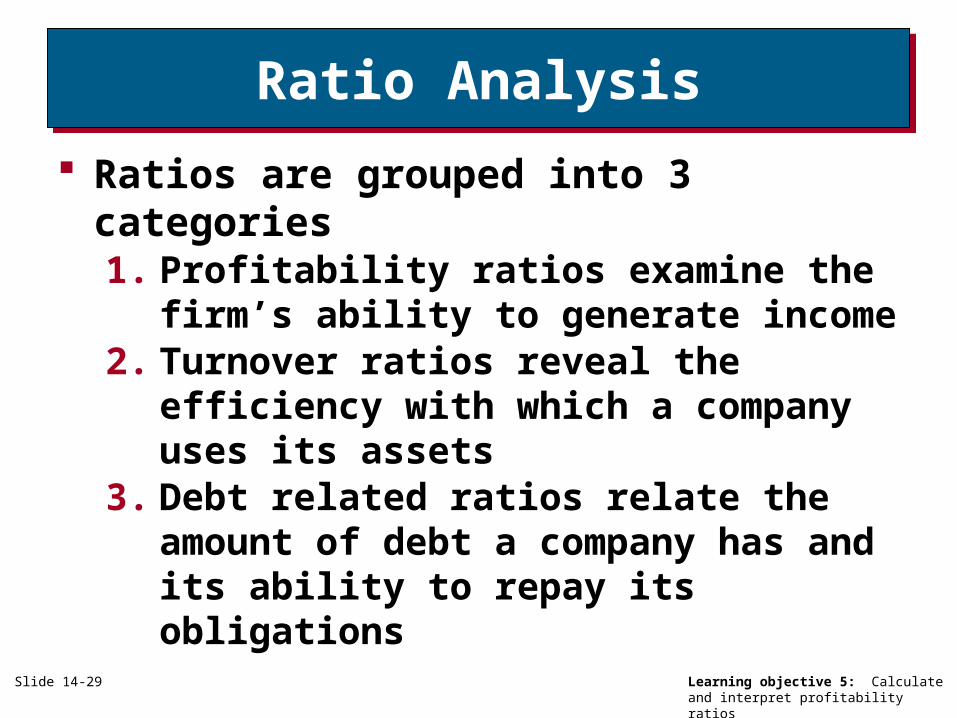
Ratio AnalysisRatio Analysis
Ratios are grouped into 3 categories1. Profitability ratios examine the
firm’s ability to generate income2. Turnover ratios reveal the
efficiency with which a company uses its assets
3. Debt related ratios relate the amount of debt a company has and its ability to repay its obligations
Slide 14-30
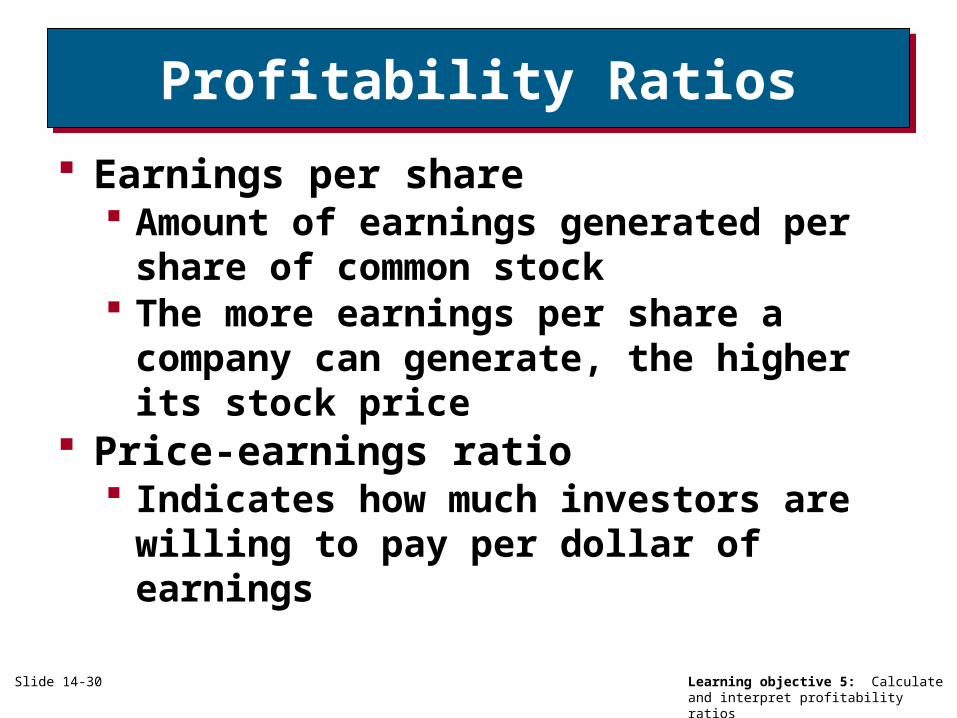
Profitability RatiosProfitability Ratios
Learning objective 5: Calculate and interpret profitability ratios
Earnings per share Amount of earnings generated per
share of common stock The more earnings per share a
company can generate, the higher its stock price
Price-earnings ratio Indicates how much investors are
willing to pay per dollar of earnings
Slide 14-31
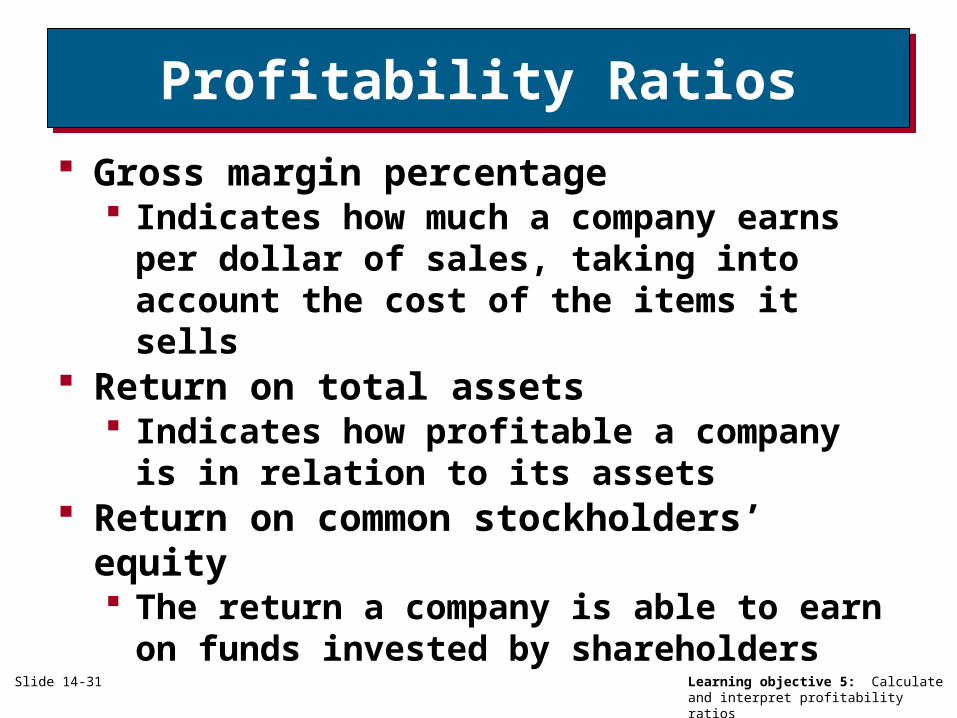
Profitability RatiosProfitability Ratios
Learning objective 5: Calculate and interpret profitability ratios
Gross margin percentage Indicates how much a company earns
per dollar of sales, taking into account the cost of the items it sells
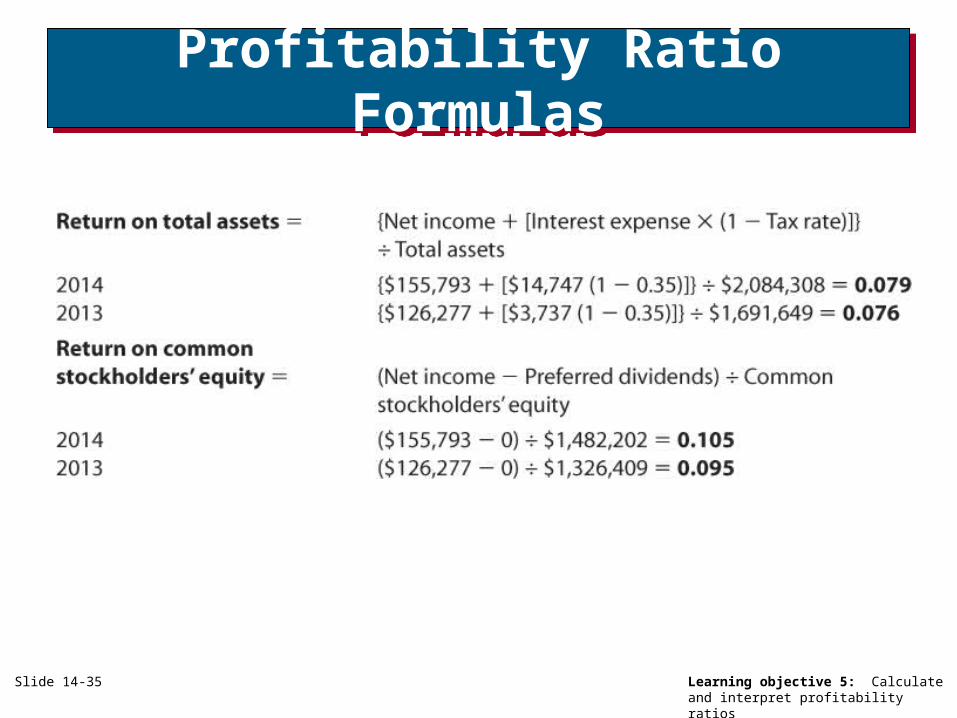
Return on total assets Indicates how profitable a company is
in relation to its assets Return on common stockholders’
equity The return a company is able to earn
on funds invested by shareholders
Slide 14-32
Profitability Ratio FormulasProfitability Ratio Formulas
Learning objective 5: Calculate and interpret profitability ratios
Slide 14-33
Profitability Ratio FormulasProfitability Ratio Formulas
Learning objective 5: Calculate and interpret profitability ratios
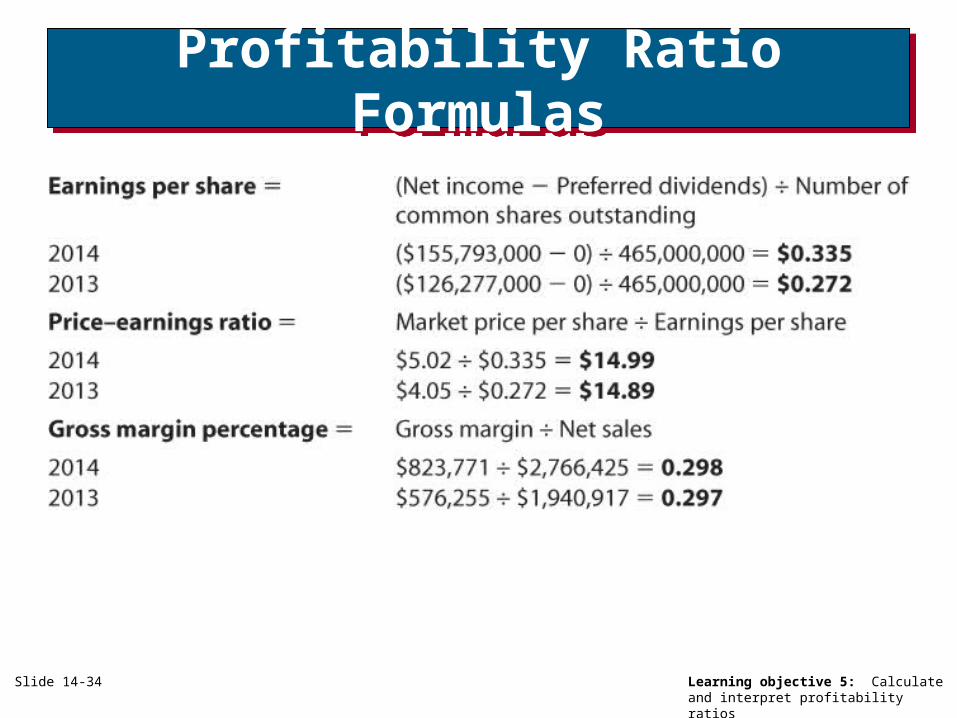
Slide 14-34
Profitability Ratio FormulasProfitability Ratio Formulas
Learning objective 5: Calculate and interpret profitability ratios
Slide 14-35
Profitability Ratio FormulasProfitability Ratio Formulas
Learning objective 5: Calculate and interpret profitability ratios
Slide 14-36
Turnover RatiosTurnover Ratios
Learning objective 6: Calculate and interpret turnover ratios
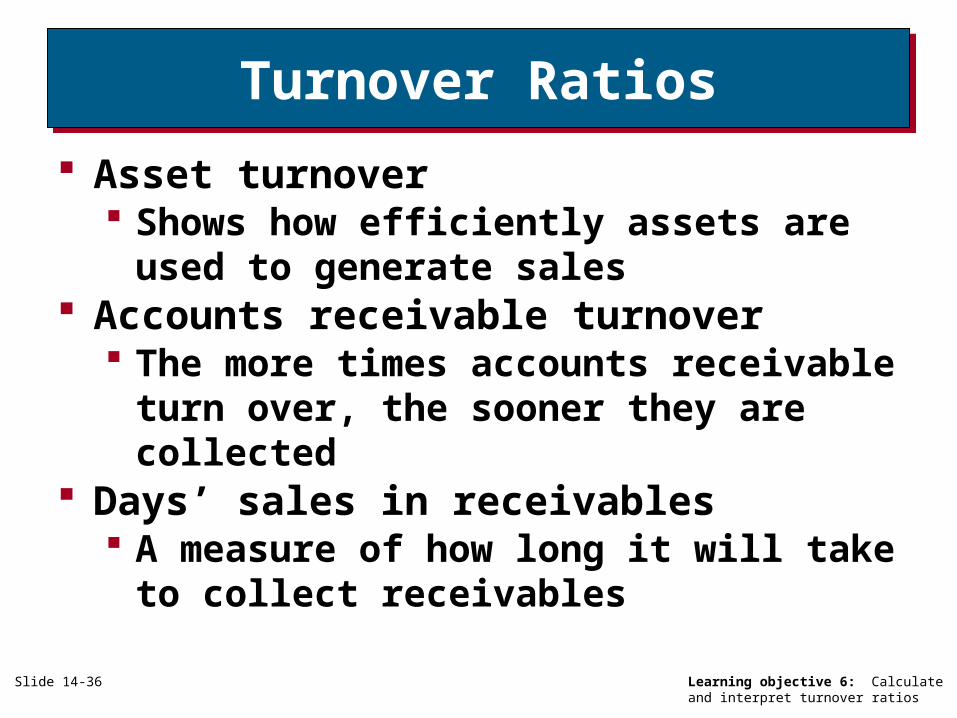
Asset turnover Shows how efficiently assets are
used to generate sales Accounts receivable turnover
The more times accounts receivable turn over, the sooner they are collected
Days’ sales in receivables A measure of how long it will take
to collect receivables
Slide 14-37
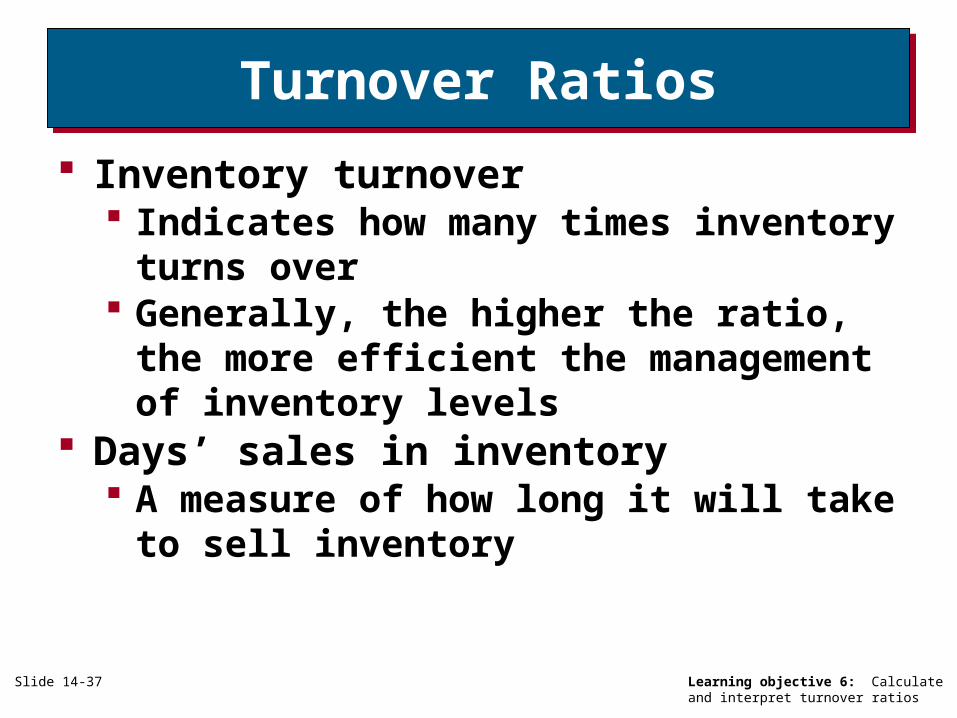
Turnover RatiosTurnover Ratios
Learning objective 6: Calculate and interpret turnover ratios
Inventory turnover Indicates how many times inventory
turns over Generally, the higher the ratio, the
more efficient the management of inventory levels
Days’ sales in inventory A measure of how long it will take
to sell inventory

Slide 14-38
Turnover Ratio FormulasTurnover Ratio Formulas
Learning objective 6: Calculate and interpret turnover ratios
Slide 14-39
Turnover Ratio FormulasTurnover Ratio Formulas
Learning objective 6: Calculate and interpret turnover ratios
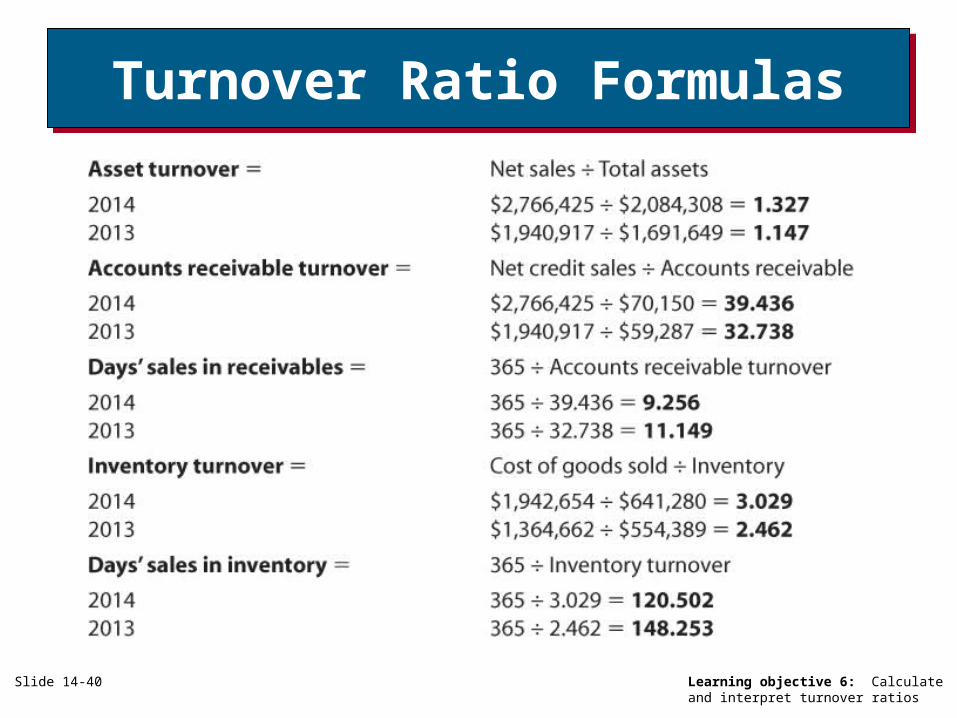
Slide 14-40
Turnover Ratio FormulasTurnover Ratio Formulas
Learning objective 6: Calculate and interpret turnover ratios
Slide 14-41
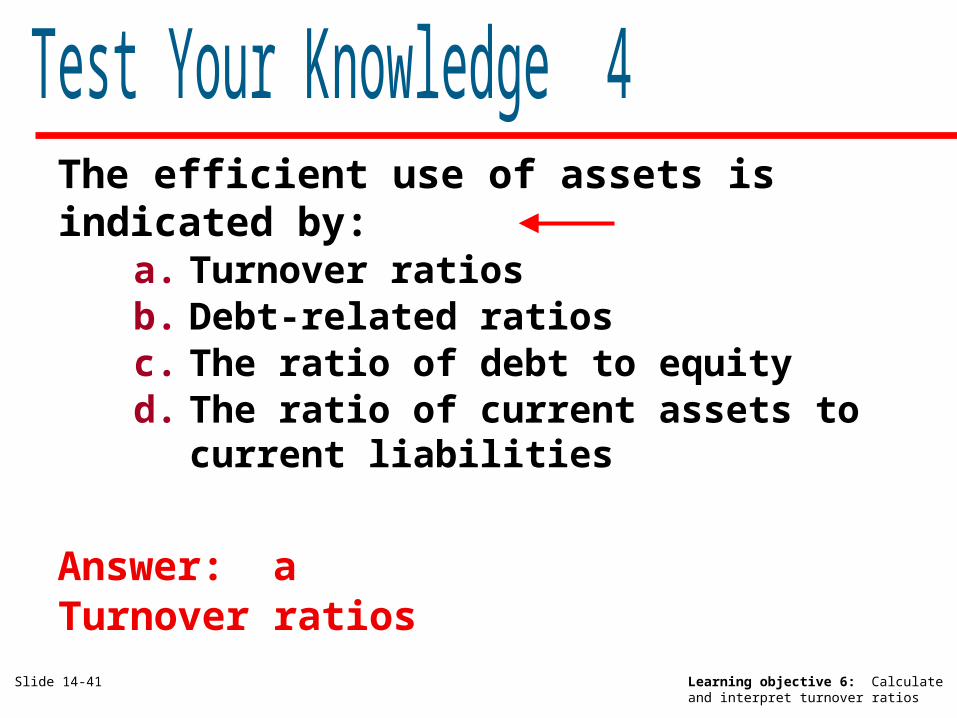
The efficient use of assets is indicated by:
a. Turnover ratiosb. Debt-related ratiosc. The ratio of debt to equityd. The ratio of current assets to
current liabilities
Answer: aTurnover ratios
Learning objective 6: Calculate and interpret turnover ratios
Slide 14-42
Debt-Related RatiosDebt-Related Ratios
Learning objective 7: Calculate and interpret debt-related ratios
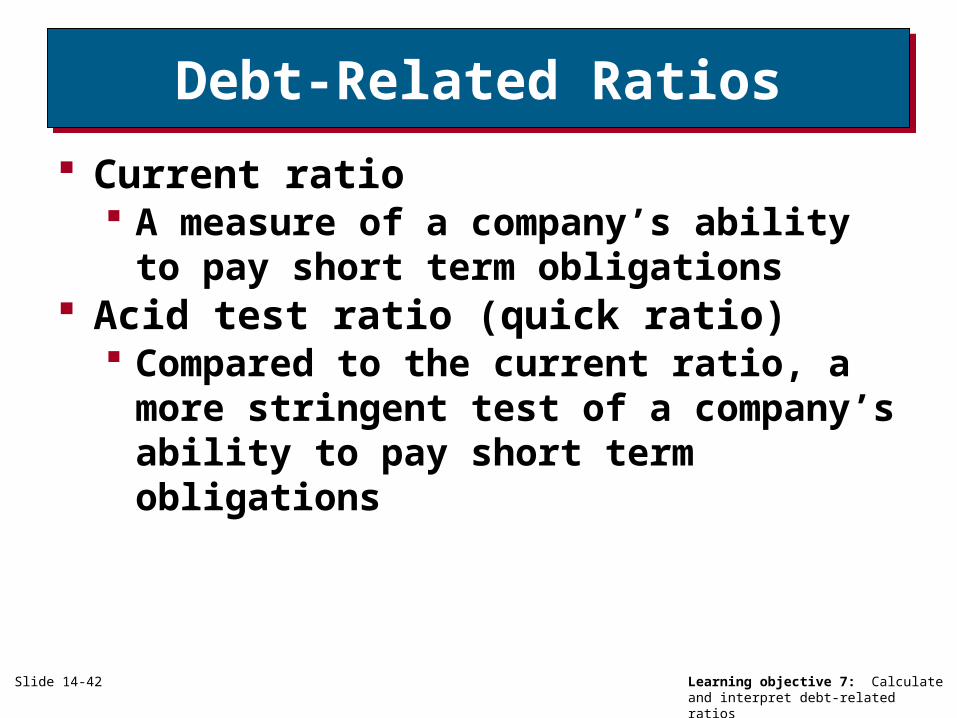
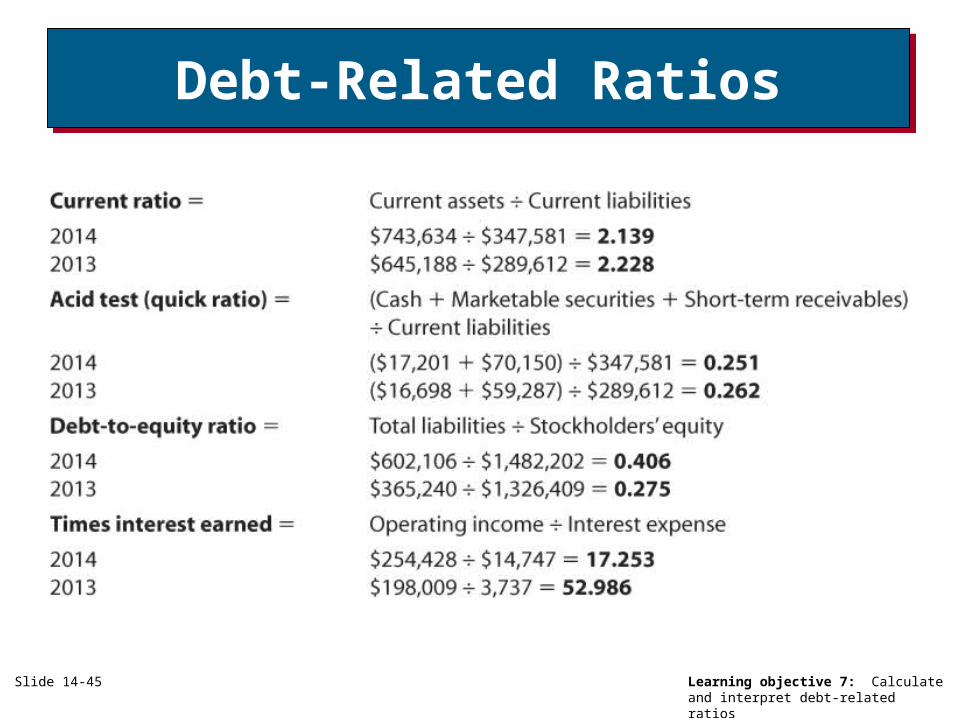
Current ratio A measure of a company’s ability to
pay short term obligations Acid test ratio (quick ratio)
Compared to the current ratio, a more stringent test of a company’s ability to pay short term obligations
Slide 14-43
Debt-Related RatiosDebt-Related Ratios
Learning objective 7: Calculate and interpret debt-related ratios
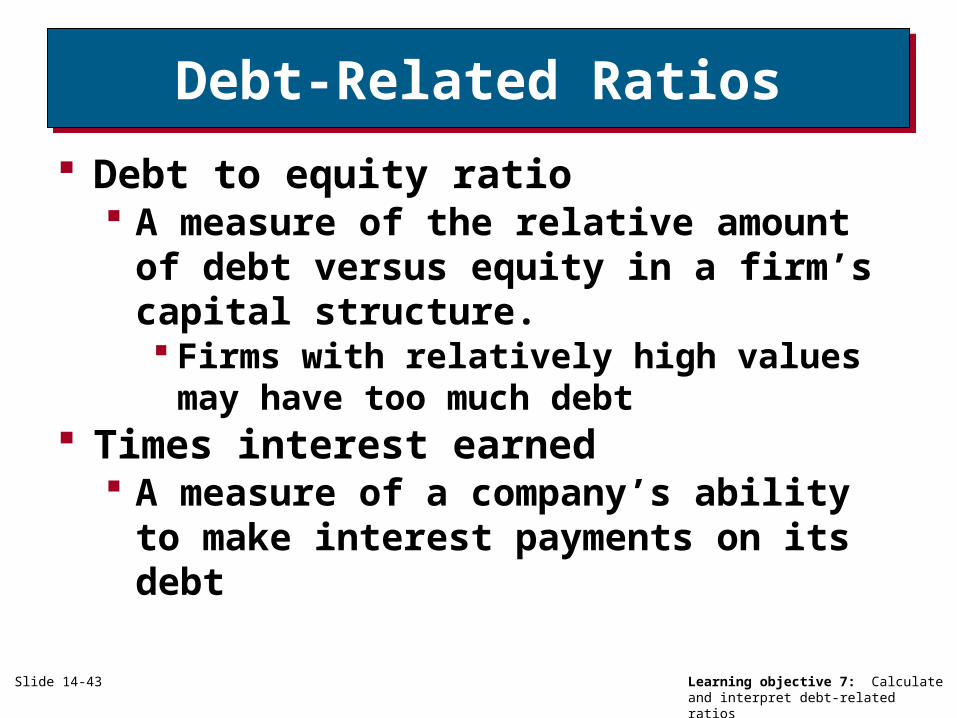
Debt to equity ratio A measure of the relative amount of
debt versus equity in a firm’s capital structure. Firms with relatively high values may have too much debt
Times interest earned A measure of a company’s ability to
make interest payments on its debt
Slide 14-44
Debt-Related RatiosDebt-Related Ratios
Learning objective 7: Calculate and interpret debt-related ratios
Slide 14-45
Debt-Related RatiosDebt-Related Ratios
Learning objective 7: Calculate and interpret debt-related ratios
Slide 14-46
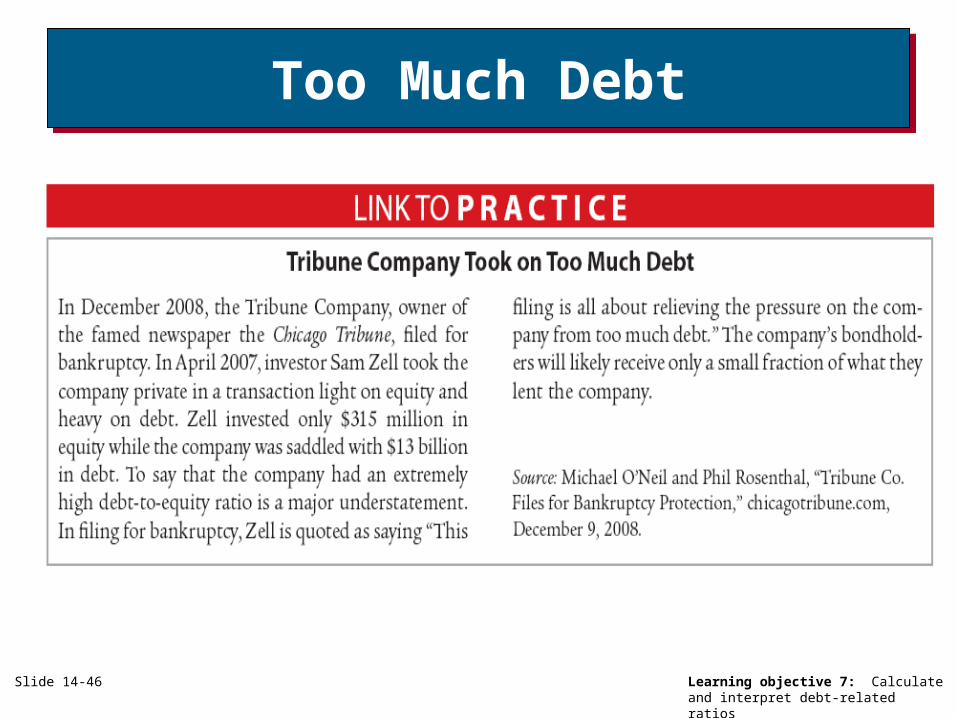
Too Much DebtToo Much Debt
Learning objective 7: Calculate and interpret debt-related ratios
Slide 14-47
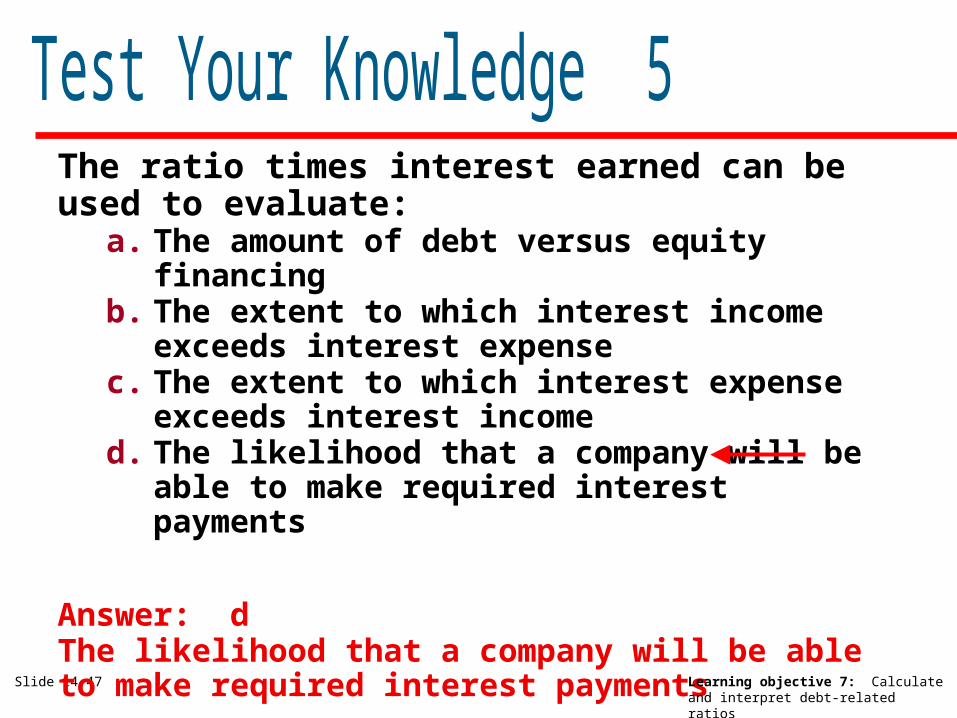
The ratio times interest earned can be used to evaluate:
a. The amount of debt versus equity financing
b. The extent to which interest income exceeds interest expense
c. The extent to which interest expense exceeds interest income
d. The likelihood that a company will be able to make required interest payments
Answer: dThe likelihood that a company will be able to make required interest payments
Learning objective 7: Calculate and interpret debt-related ratios
Slide 14-48
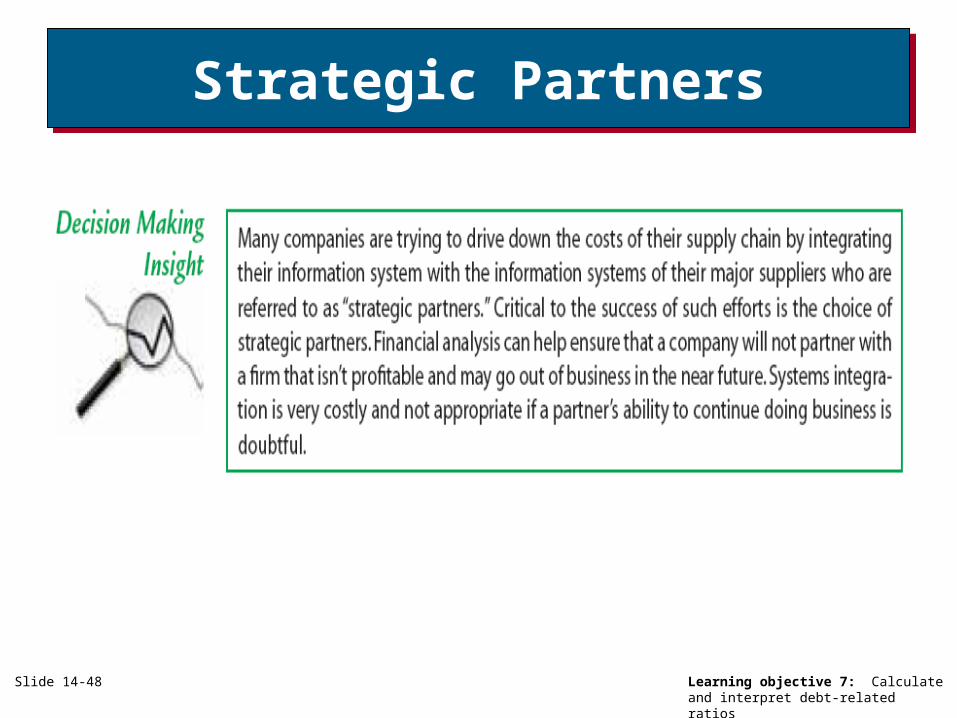
Strategic PartnersStrategic Partners
Learning objective 7: Calculate and interpret debt-related ratios
Slide 14-49
CopyrightCopyright© 2010 John Wiley & Sons, Inc. All rights reserved. Reproduction or translation of this work beyond that permitted in Section 117 of the 1976 United States Copyright Act without the express written permission of the copyright owner is unlawful. Request for further information should be addressed to the Permissions Department, John Wiley & Sons, Inc. The purchaser may make back-up copies for his/her own use only and not for distribution or resale. The Publisher assumes no responsibility for errors, omissions, or damages, caused by the use of these programs or from the use of the information contained herein.