Embed Size (px)
Citation preview
Achieving 12% Green Electricity by 2017
i
Achieving 12% Green Electricity by 2017
Final Report, June 2011
Prepared by
World Institute of Sustainable Energy, Pune
Supported by
Shakti Sustainable Energy Foundation
Achieving 12% Green Electricity by 2017
ii
For Internal Circulation
The Report of the study ‘Achieving 12% Green Electricity by 2017’ is strictly for internal
circulation. To reproduce any part of the text of the report for bona fide use, please obtain prior
permission by writing to [email protected].
Research Team
Principal Investigator G M Pillai, Founder Director General, WISE
Team leader Surendra Pimparkhedkar, Fellow & Head,
Centre for Renewable Regulation and Policy (CRRP)
Research Team Members Anand Wagh, Associate Fellow
Satadru Chakraborty, Sr Research Associate, CRRP
Supported by Centre for Climate and Sustainability Policy,
Centre for Wind Power,
Centre for Solar Energy
Contact
Centre for Renewable Regulation and Policy Tel. (020) 2661 3832 / 55
World Institute of Sustainable Energy Fax (020) 2661 1438
Plot No 44, Road No 2, Kalyani Nagar E-mail [email protected]
Pune – 411006/India [Country code +91] Web www.wisein.org
Achieving 12% Green Electricity by 2017
iii
Contents
Abbreviations iv
Figures and Tables vi
Executive Summary vii
1 Evolution of Policy Environment for Renewables in India 1
1.1 Recent legal and policy environment for RE 1
1.2 Developments in RE Electricity Regulation 7
2 Rational for and Benefits of Increasing RE in the Energy Mix 11
2.1 Rational 11
2.2 The Benefits 15
3 Potential and Status of Development of Renewables in India 19
3.1 Renewable Energy Potential in India 19
3.2 Current Status of Development 23
4 Capacity Addition Required for Achieving 12% RE by 2017 and 15% RE
by 2020
27
4.1 The Approach and Methodology 28
4.2 The Different Targets & Plans 29
4.3 The Existing Plans /and Shortfall vis-a-vis NAPCC 30
4.4 Capacity Addition Scenarios 32
4.5 Pan India Impact on Average Power Procurement Cost (APPC) 41
4.6 Possible State–wise /RE Technology–wise Capacity Addition Plan to Meet
the NAPCC Target (Solar Dominant Scenario)
42
4.7 Key Outcomes 55
5 Towards 15% RE by 2020: Removing the Barriers 57
5.1 Financial Barriers and Remedies 57
5.2 Policy Barriers and Remedies 59
5.3 Regulatory Barriers and Remedies 63
5.4 Institutional Barriers and Remedies 69
5.5 Human Resources and Remedies 71
5.6 Other Barriers 73
6 Road Map of Actions Needed 75
6.1 Planning 75
6.2 Financing 75
6.3 Policy 76
6.4 Regulation 77
6.5 Capacity Building 78
6.6 Human Resources 78
6.7 Other Areas 79
References 80
Achieving 12% Green Electricity by 2017
iv
Abbreviations
APPC Average Power Procurement Cost
ADB Asian Development Bank
CAGR Compounded Annual Growth Rate
CDM Clean Development Mechanism
CEA Central Electricity Authority
CERC Central Electricity Regulatory Commission
CPV Concentrated Photovoltaic
CSP Concentrating solar power
CUF Capacity Utilisation Factor
C–WET Centre for Wind Energy Technology
DTC Direct Tax Code
EA Electricity Act 2003
ERC Electricity Regulatory Commission
ESMPA Energy Sector Management Assistance Programme
EU European Union
FDI Foreign Direct Investment
Fis Financial Institutions
FY Financial Year, FY10 is FY 2010-11
GBI Generation Based Incentives
GHG Green House Gas
GoI Government of India
GSI Geological Survey of India
GW Giga Watt
GWEC Global Wind Energy Council
IEGC Indian Electricity Grid Code
IEP Integrated Energy Policy
IEX Indian Energy Exchange
IREDA Indian Renewable Energy Development Agency
JNNSM Jawaharlal Nehru National Solar Mission
Kg Kilo gram
kg/m3 kilogram per cubic meter
km Kilo meter
kW Kilo Watt
Achieving 12% Green Electricity by 2017
v
kWh Kilo Watt hours
LBNL Lawrence Berkeley National laboratory
LCOE Levelized Cost of Energy
m meter
MNES Ministry of Non Conventional Energy Sources
MNRE Ministry of New & Renewable Energy
MW Mega Watt
MWh Mega Watt hour
NAPCC National Action Plan for Climate Change
NCEF National Clean Energy Fund
NEP National Electricity Policy
NLDC National Load Dispatch Centre
NTP National Tariff Policy
NTPC National Thermal Power Corporation
NVVNL NTPC Vidyut Vyapar Nigam Ltd
OA Open Access
PFC Power Finance Corporation
PLF Plant Load Factor
PPA Power Purchase Agreement
RE Renewable Energy
REC Renewable Energy Certificate
RPO Renewable Purchase Obligation
RPS Renewable Purchase Standards
RRF Renewable Regulatory Fund
Rs Rupees
SERC State Electricity Regulatory Commission
SEZ Special Economic Zone
SHP Small Hydro Power
UI Unscheduled Interchange
WISE World Institute of Sustainable Energy, Pune

Achieving 12% Green Electricity by 2017
vi
Figures
Title Page
2.1 Increasing Competitiveness of RE-based Generation on LCOE basis 13
2.2 Expected Grid Parity for Solar-based Electricity 13
2.3 Comparative Costs of Nuclear Power and Solar PV Power in cents/kWh 15
3.1 Share of RE in Overall Power Generation Capacity (MW) 23
3.2 Share of RE Generation in Overall Power Generation (MU) 24
4.1 Requirement of renewable energy to meet NAPCC target (BU) 30
4.2 Planned RE injection and shortfall 31
4.3 Cumulative RE capacity addition projection over 2011-12 to 2019-20 40
5.1 Scenario-wise RE capacity addition vis-à-vis state-wise RPO targets (MW) 66
Tables Title Page
2.1 India: Energy Sector GHG Emissions (million tonnes of CO2 e.q.) in 2007 16
2.2 Annual Avoided Emissions after 2016/17 (in million tonnes of CO2) 16
3.1 MNRE Estimate: Renewable Energy Potential in India 19
3.2 Grid-connected RE Potential in India (WISE Estimates) 21
4.1 Planned capacity addition for 11th, 12th, & 13th Five Year Plan periods 29
4.2 Targets specified under JNNSM 29
4.3 All India electricity demand and required RE injection to meet the NAPCC target 30
4.4 Planned RE injection and shortfall 31
4.5 RE capacity addition required as per Scenario 1 (2011-12 to 2019-20) 34
4.6 RE capacity required as per Scenario 2 (2011-12 to 2019-20) 36
4.7 RE capacity addition required as per Scenario 3 (2011-12 to 2019-20) 38
4.8 Cumulative RE capacity addition projection over 2011-12 to 2019-20 40
4.9 Impact on Pan India APPC due to purchase of RE 41
4.10 State wise projected RE capacity addition on cumulative basis (Wind dominant
scenario )
43
4.11 State wise projected RE capacity addition on cumulative basis (Solar dominant
scenario )
49
5.1 Likely Debt Requirement for RE Sector during 12th Plan Period 57
5.2 Likely Debt Requirement for RE by 2020 58
5.3 RPO Targets set by SERCs 63
5.4 Required capacity addition vis-à-vis capacity addition through state RPO (MW) 65
5.5 Job creation during 12th five year plan in RE sector (WISE Estimates) 71
5.6 Job creation in RE sector by 2020 (WISE Estimates) 71
5.7 Proposed revision required in the curricula of educational
and training institutions 72
Achieving 12% Green Electricity by 2017
vii
Executive Summary
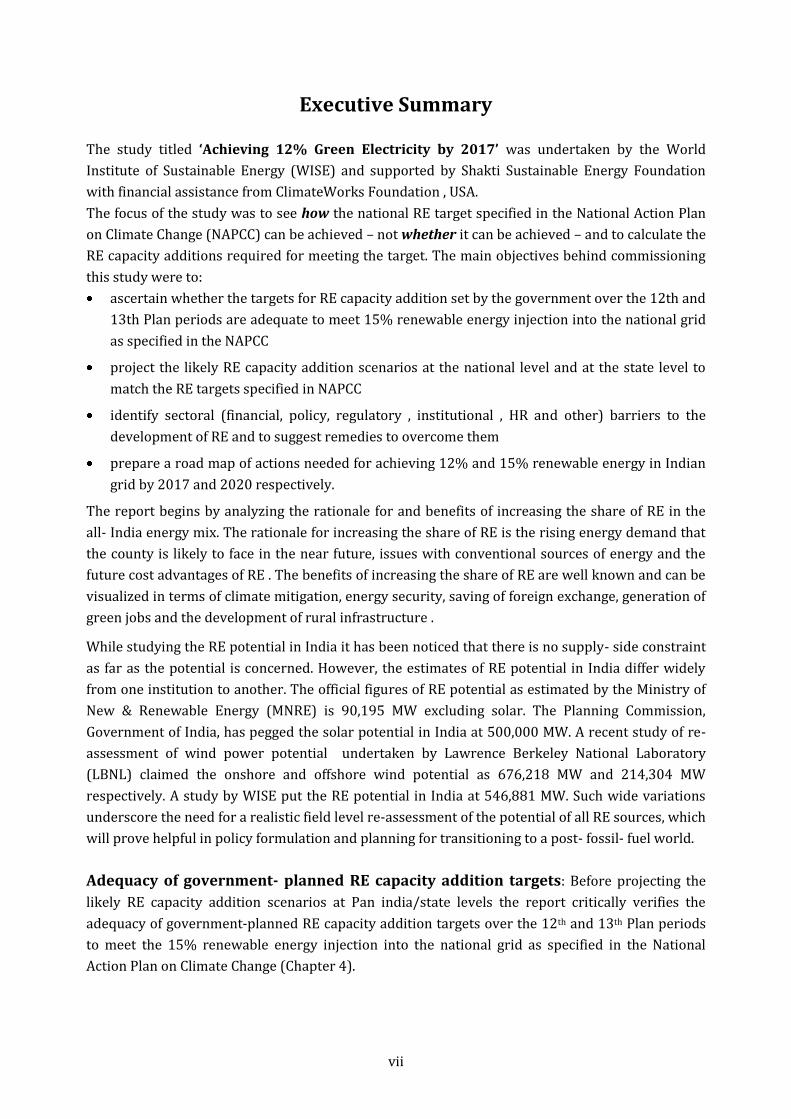
The study titled ‘Achieving 12% Green Electricity by 2017’ was undertaken by the World
Institute of Sustainable Energy (WISE) and supported by Shakti Sustainable Energy Foundation
with financial assistance from ClimateWorks Foundation , USA.
The focus of the study was to see how the national RE target specified in the National Action Plan
on Climate Change (NAPCC) can be achieved – not whether it can be achieved – and to calculate the
RE capacity additions required for meeting the target. The main objectives behind commissioning
this study were to:
ascertain whether the targets for RE capacity addition set by the government over the 12th and
13th Plan periods are adequate to meet 15% renewable energy injection into the national grid
as specified in the NAPCC
project the likely RE capacity addition scenarios at the national level and at the state level to
match the RE targets specified in NAPCC
identify sectoral (financial, policy, regulatory , institutional , HR and other) barriers to the
development of RE and to suggest remedies to overcome them
prepare a road map of actions needed for achieving 12% and 15% renewable energy in Indian
grid by 2017 and 2020 respectively.
The report begins by analyzing the rationale for and benefits of increasing the share of RE in the
all- India energy mix. The rationale for increasing the share of RE is the rising energy demand that
the county is likely to face in the near future, issues with conventional sources of energy and the
future cost advantages of RE . The benefits of increasing the share of RE are well known and can be
visualized in terms of climate mitigation, energy security, saving of foreign exchange, generation of
green jobs and the development of rural infrastructure .
While studying the RE potential in India it has been noticed that there is no supply- side constraint
as far as the potential is concerned. However, the estimates of RE potential in India differ widely
from one institution to another. The official figures of RE potential as estimated by the Ministry of
New & Renewable Energy (MNRE) is 90,195 MW excluding solar. The Planning Commission,
Government of India, has pegged the solar potential in India at 500,000 MW. A recent study of re-
assessment of wind power potential undertaken by Lawrence Berkeley National Laboratory
(LBNL) claimed the onshore and offshore wind potential as 676,218 MW and 214,304 MW
respectively. A study by WISE put the RE potential in India at 546,881 MW. Such wide variations
underscore the need for a realistic field level re-assessment of the potential of all RE sources, which
will prove helpful in policy formulation and planning for transitioning to a post- fossil- fuel world.
Adequacy of government- planned RE capacity addition targets: Before projecting the
likely RE capacity addition scenarios at Pan india/state levels the report critically verifies the
adequacy of government-planned RE capacity addition targets over the 12th and 13th Plan periods
to meet the 15% renewable energy injection into the national grid as specified in the National
Action Plan on Climate Change (Chapter 4).
Achieving 12% Green Electricity by 2017
viii
The NAPCC has recommended that the minimum share of renewable energy in the national grid be
set at 5% in 2009/10, subsequently to be increased by 1% every year to reach 15% by 2019/20.
The anticipated renewable energy injection envisaged under the NAPCC has been calculated by
applying the National RPO targets to the all-India electricity demand projections given under the
‘17th Electric Power Survey of India Report’ published by the Central Electricity Authority (CEA).
The government-planned capacity addition targets (MNRE and JNNSM), are then converted into
energy terms (in billion units) by applying the CERC-specified normative RE technology-wise
capacity utilization factor (CUF) and compared with the anticipated RE injection envisaged under
the NAPCC. The present installed RE capacity and corresponding generation are also factored in
while making the comparison.
The comparison reveals that the MNRE-planned non-solar capacity additions for 11th and 12th
Plan periods together with the JNNSM-targeted solar capacity addition (16,000 MW) over 2010–
2020 are inadequate to meet the NAPCC target . The shortfall in energy terms will increase to 84
BU in FY 2019/20 from 0.57 BU in FY 2009/2010. The planned capacity addition, when realized,
will represent approximately 9.88% of the energy mix in the national grid in 2020. Hence there is a
shortfall of approximately 5% (84 BU) in meeting the NAPCC requirement of 15% by 2019/20.
Considering an average CUF of 36% representing all RE technologies, about 26,000 MW of RE
capacity over and above the planned RE capacity (MNRE and JNNSM) is required to overcome the
shortfall by 2019/2020. This indicates that cumulative RE capacity installation of about 82,000
MW is required to be in place by 2019/20 to meet the NAPCC target with the specified
assumptions.
The adequacy of SERC specified state-wise RPO targets to meet the national RPO in NAPCC is
verified by comparing the possible renewable energy generation due to present state-wise RPO
targets with the anticipated renewable energy generation envisaged in the NAPCC. The possible
renewable energy injection into the national grid due to mandatory RPO targets specified by 25
SERCs in India has been worked out considering the state-wise solar and non-solar RPO targets
and state-wise future energy consumption projected by CEA. Our analysis indicates that the
current non-solar/solar RPO targets specified by the 25 SERCs taken together may not be sufficient
to achieve the requisite RE capacity additions to raise the pan-India solar and non-solar RE-based
generation to the 10% share stipulated by the NAPCC by 2014/15.
These calculations establish the need to revise the RE capacity additions originally planned by the
working group. The revision in planned RE capacity in the 12th and 13th Plans is still possible as
the 12th Plan Working Group Report on RE is yet to be finalized.
Three projected scenarios: With the broad objective of meeting the NAPCC target of 15% RE
by 2020, different RE capacity addition scenarios were considered, keeping in mind the availability
and commercial potential of each RE resource in India. Finally, three scenarios were arrived at (1)
Wind dominant (2) SHP-biomass-dominant (on CAGR basis) and (3) Solar- dominant. A
progressive growth rate was considered for each major RE source while the share of other RE
sources was defined based on their historical growth rates. Later, the most beneficial scenarios
were extended to the state level for working out the possible state-wise, RE technology-wise
contribution towards meeting the national RPO of 15%.
Achieving 12% Green Electricity by 2017
ix
Scenario 1 (Wind dominant) : Given the past growth rate, present stage of development and
future potential availability reported under various studies, an accelerated growth rate slightly
higher than the advanced scenario projected by the Global Wind Energy Council (GWEC) and WISE
in the ‘Indian Wind Energy Outlook 2011’, is considered under scenario 1. A moderate growth rate
lower than the historical growth rate was considered while projecting capacity additions for SHP
and biomass technologies, whereas solar capacity addition targets were restricted to the lower
limit specified under the JNNSM (4000 MW) by 2017 in order to reduce the impact on pan-India
APPC. If the projected RE capacity additions under this scenario have to be realized, the cumulative
wind power installation will have to grow to 74 GW by 2020. During the 12th Plan period, on an
annual average basis, addition of 5,662 MW of wind power and 740 MW of solar power capacity
needs to be set up if the 12% RE target has to be met by 2017. During the first three years of the
13th Plan, the wind and solar capacity additions need to be further accelerated to 9,436 MW and
2,000 MW annually. The combined capacity of biomass and cogeneration technologies needs to be
increased to 800 MW annually. The projected annual average capacity addition for wind is around
5.25 times the past capacity addition. However, if the capacity addition in 2010/11 is considered as
a benchmark, a CAGR of 20% for the following years (which is realistic) can help to achieve this
growth. Under this scenario, during the 12th five year Plan, India will have to install 37,680 MW of
grid-connected capacities from renewables. The cumulative installed capacity of renewables would
be 62,103 MW at the end of the 12th Plan and 100,267 MW, by 2020.
Scenario 2 (Biomass-SHP dominant) (On CAGR basis): While projecting RE capacity
addition under this scenario, biomass and SHP were considered as dominant sources irrespective
of their limitations. While projecting the likely capacity addition, the growth rate over past ten
years was studied and a slightly higher growth rate was considered over the period 2010–
2020.Wind power growth was placed at a moderate level based on historical CAGR of 16% and
solar capacity addition was limited to the JNNSM targets, which were considered as realized.
If the RE capacity addition targets proposed under this scenario have to be realized, the cumulative
biomass and SHP power project installations need to be raised to 13.4 GW and 8 GW respectively
by 2019/20. In the 12th Plan period, on an annual average basis, 1,134 MW and 535 MW biomass
and SHP capacity have to be set up if the 12% RE target has to be met. During the first three years
of the 13th Plan period, biomass and SHP capacity addition needs to be further accelerated to 1,413
MW and 750 MW annually. The projected annual average capacity addition in case of biomass and
SHP is approximately 3.5 times and 2.5 times than the past capacity addition (on annual basis),
which is difficult to achieve. During the 12th five-year-Plan, India will have to install 35,000 MW of
grid-connected capacity from renewables. The cumulative installed capacity of renewables would
be 59,061 MW at the end of 12th Plan and 89,355 MW by 2020.
Scenario : 3 (Solar dominant scenario) : The abundant solar potential in the country,
experience of past three years in cost reduction , international projections of cost reduction and the
fact that the cost reduction can be achieved by facilitating mass production and R&D efforts, have
been taken into account in scenario 3. Promoting solar energy is essential in view of energy
security and minimizing the dependence on imports of conventional fuels. All the above favourable
conditions support the solar dominant scenario, under which total solar capacity additions of
35,490 MW are envisaged to be realized during year 2011–2020. During the 12th Plan period, on an
Achieving 12% Green Electricity by 2017
x
average annual basis, solar power capacity of 3,395 MW has to be set up if the 12% RE target has to
be met along with moderate growth of wind at an average annual capacity addition of 3,400 MW.
During the first three years of 13th Plan period, solar power capacity addition needs to be further
accelerated to 6,000 MW annually. This differential approach is adopted because the third phase of
JNNSM will begin in 2017. By then, solar energy would have seen significant cost reductions, if not
grid parity. The conservative biomass projection made under this scenario is based on past growth
rates, which is more realistic and achievable. The projected solar power capacity addition of 6,000
MW a year in the 13th plan needs special efforts from all stakeholders if it is to be realized. During
the 12th five-year Plan, India will have to install 39,870 MW of grid-connected capacity from
renewables. The cumulative installed capacity would be 63,471 MW at the end of the 12th Plan and
1, 02,755 MW, by 2020.
Comparative analysis of the three scenarios: Wind power capacity addition on an annual
average basis projected under Scenario 1 (6,662 MW) is high, but achievable, if conducive policy
environment of clear and unambiguous commitment to this leading RE source is made explicit
through further policy and regulatory initiatives. In scenario 2 , the resource limitation of biomass
and SHP sources may prevent the anticipated annual capacity addition of 1,197 MW and 598 MW
respectively , whereas wind power capacity addition of 4,110 MW (annual average) is achievable
considering the quantum jump achieved in FY 2010/11.
In Scenario 3 (solar dominant), biomass and SHP annual average capacity addition of 804 MW and
312 MW are achievable considering the historical trend of capacity addition. The position of wind
is the same as in scenario 2 and therefore achievable. The projected solar annual average capacity
addition of 3395 MW is 1.5 times that of the JNNSM target and is achievable, considering the state
level developments in non-JNNSM project activities. However, the targeted capacity addition
during the 13th Plan period (6000 MW) needs special efforts. Considering all aspects and the
importance of promoting solar power projects from the point of view of energy security, all efforts
should be directed to realize the capacity additions proposed under this scenario.
Impact on Pan India APPC under three scenarios: For the three likely supply scenarios
above, the impact on average power procurement cost (APPC) of a utility is analysed over the
period 2010–2020 at Pan India level. The time value of the impact has been calculated taking the
discount factor as 9.35%. The discounted impact on APPC due to purchase of renewable-based
energy under the three scenarios varies from 12–16 paisa / kWh under scenario 1, 13–18
paisa/kWh under scenario2 and 16–20 paisa/ kWh under scenario 3 .
The impact on the APPC under all the three scenarios is significant and it would be impossible for
the utilities to absorb the same. Much of this is the result of high solar tariff, which means the
government will have to exercise major policy options to make the projects viable. These options
may include Interest subsidies to provide softer loans, measures to accelerate grid parity and
generation-based incentives to keep tariffs low.
Capacity addition Plan by State and by RE technology to meet the NAPCC target
(under the wind and solar- dominant scenarios) : Encouraging the solar-dominant
scenario is important in view of achieving energy security. However the wind-dominant scenario
with solar capacities restricted to the lower limit projected in phase 2 of JNNSM may also be
Achieving 12% Green Electricity by 2017
xi
important from the point of view of minimal impact on Pan-India APPC. Therefore these two
scenarios were considered for a detailed state by state analysis. The possible shares of states for
each technology in total were matched with the corresponding pan-India share. While devising the
state-wise/RE technology-wise shares as above, a detailed study of state-wise RE
potential/installed capacity and unexplored RE potential and of the past growth rate of RE capacity
addition was carried out. As the official potential assessment in terms of state-wise solar capacity is
not available, the targeted solar potential is distributed in selected potential states based on solar
radiation assessment. Table 4.10 and 4.11 provide the state-wise projected RE capacity additions
(cumulative) based on the wind and solar dominant scenarios.
Key outcomes of the scenario analysis
The government’s plans for development of RE are not consistent with the policies. The RE
capacity additions targeted by MNRE and those planned under the JNNSM are inadequate to
meet the targets set by the NAPCC. The targets originally planned by the working group will
have to be revised to achieve the 12% and 15% RE penetration by 2016/17 and 2019/20
respectively. The revision in planned RE capacity in the 12th and 13th Plans are still possible as
the 12th plan Working Group Report on RE is yet to be finalized
The potential of RE at the national level needs to be re-assessed urgently. In the absence of
realistic potential assessment figures, policy decisions on power generation could be skewed in
favour of conventional sources.
Although all the three scenarios are capable of meeting the national RPO of 12% and 15% by
year 2017 and 2020, considering the importance of scenarios 1 and 3, either of them may be
adopted at the national level.
Adoption of scenario 1 (wind dominant) against that of scenario 3 (solar dominant) at national
level will reduce the impact on pan-India APPC by 4–5 paise / kWh.
The huge untapped solar potential of the country is important from the point of view of energy
security. International experience shows that cost reduction can be achieved by way of mass
production and R&D efforts and therefore scenario 3 is also equally important.
The targeted capacity addition envisaged under three scenarios can avoid approximately
141.82 million tonnes, 143.16 million tonnes and 142.64 million tonnes of CO2 respectively
beyond 2017.
The targeted capacity addition envisaged under three scenarios if realized ,can create 15 lakh,
14.7 lakh and 16.6 lakh new jobs respectively by 2020.
The likely debt requirement for realizing the RE capacity addition projected up to 2020 under
the three scenarios ranges from Rs 361602 crore to 541659 crore .
The capacity additions by State and by technology envisaged under the wind and solar-
dominant scenarios show that individual states can share the national RPO within the available
RE potential.
The state-wise RE technology mix emerging from the state-level analysis indicates ample scope
for wind power development in the states of Tamil Nadu, Karnataka, Rajasthan, Maharashtra,
Gujarat, Andhra Pradesh and Orissa. Significant contribution to SHP can come from the north
and north-eastern states like Himachal Pradesh, J&K, Uttarakhand and Arunachal Pradesh,
Achieving 12% Green Electricity by 2017
xii
whereas states like Tamil Nadu, Andhra Pradesh and Uttar Pradesh can still develop biomass
power potential to a great extent.
Based on the analysis of solar radiation data, geographical spread and availability of wasteland,
states like Rajasthan, Andhra Pradesh, Gujarat, Madhya Pradesh, Maharashtra, Orissa,
Karnataka, and Tamil Nadu can play a decisive role in realizing the solar capacity addition
under the solar- dominant scenario.
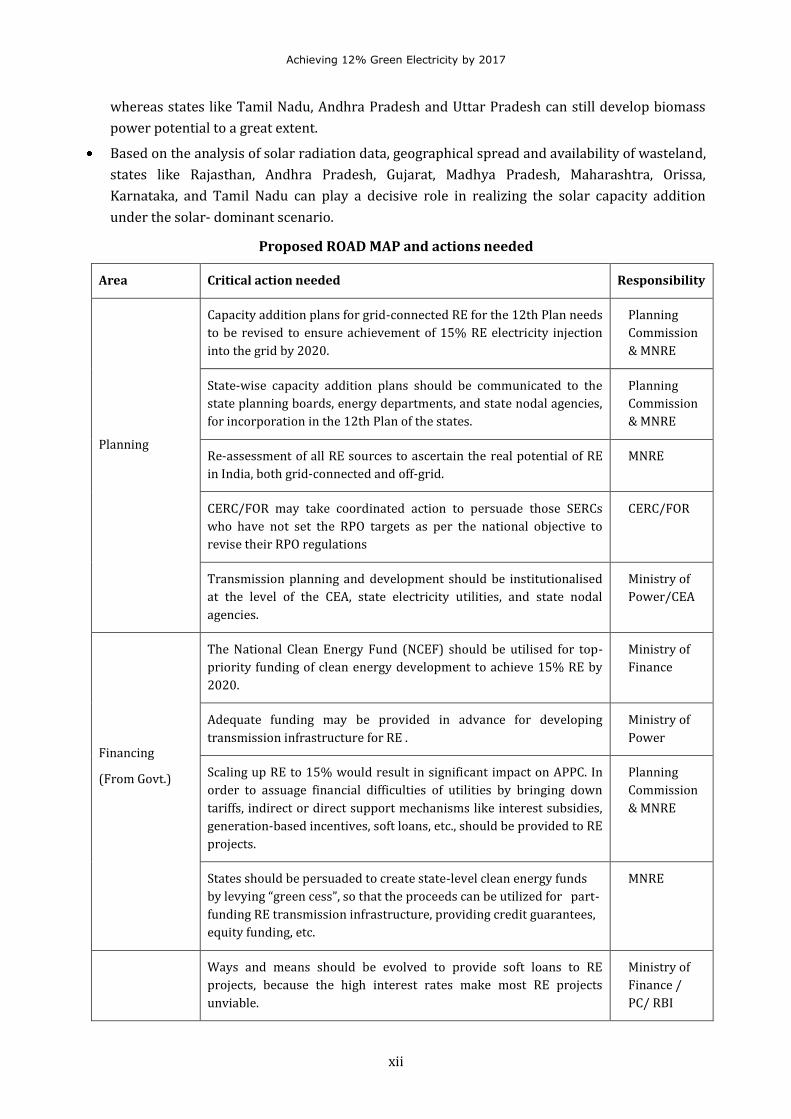
Proposed ROAD MAP and actions needed
Area Critical action needed Responsibility
Planning
Capacity addition plans for grid-connected RE for the 12th Plan needs
to be revised to ensure achievement of 15% RE electricity injection
into the grid by 2020.
Planning
Commission
& MNRE
State-wise capacity addition plans should be communicated to the
state planning boards, energy departments, and state nodal agencies,
for incorporation in the 12th Plan of the states.
Planning
Commission
& MNRE
Re-assessment of all RE sources to ascertain the real potential of RE
in India, both grid-connected and off-grid.
MNRE
CERC/FOR may take coordinated action to persuade those SERCs
who have not set the RPO targets as per the national objective to
revise their RPO regulations
CERC/FOR
Transmission planning and development should be institutionalised
at the level of the CEA, state electricity utilities, and state nodal
agencies.
Ministry of
Power/CEA
Financing
(From Govt.)
The National Clean Energy Fund (NCEF) should be utilised for top-
priority funding of clean energy development to achieve 15% RE by
2020.
Ministry of
Finance
Adequate funding may be provided in advance for developing
transmission infrastructure for RE .
Ministry of
Power
Scaling up RE to 15% would result in significant impact on APPC. In
order to assuage financial difficulties of utilities by bringing down
tariffs, indirect or direct support mechanisms like interest subsidies,
generation-based incentives, soft loans, etc., should be provided to RE
projects.
Planning
Commission
& MNRE
States should be persuaded to create state-level clean energy funds
by levying “green cess”, so that the proceeds can be utilized for part-
funding RE transmission infrastructure, providing credit guarantees,
equity funding, etc.
MNRE
Ways and means should be evolved to provide soft loans to RE
projects, because the high interest rates make most RE projects
unviable.
Ministry of
Finance /
PC/ RBI
Achieving 12% Green Electricity by 2017
xiii
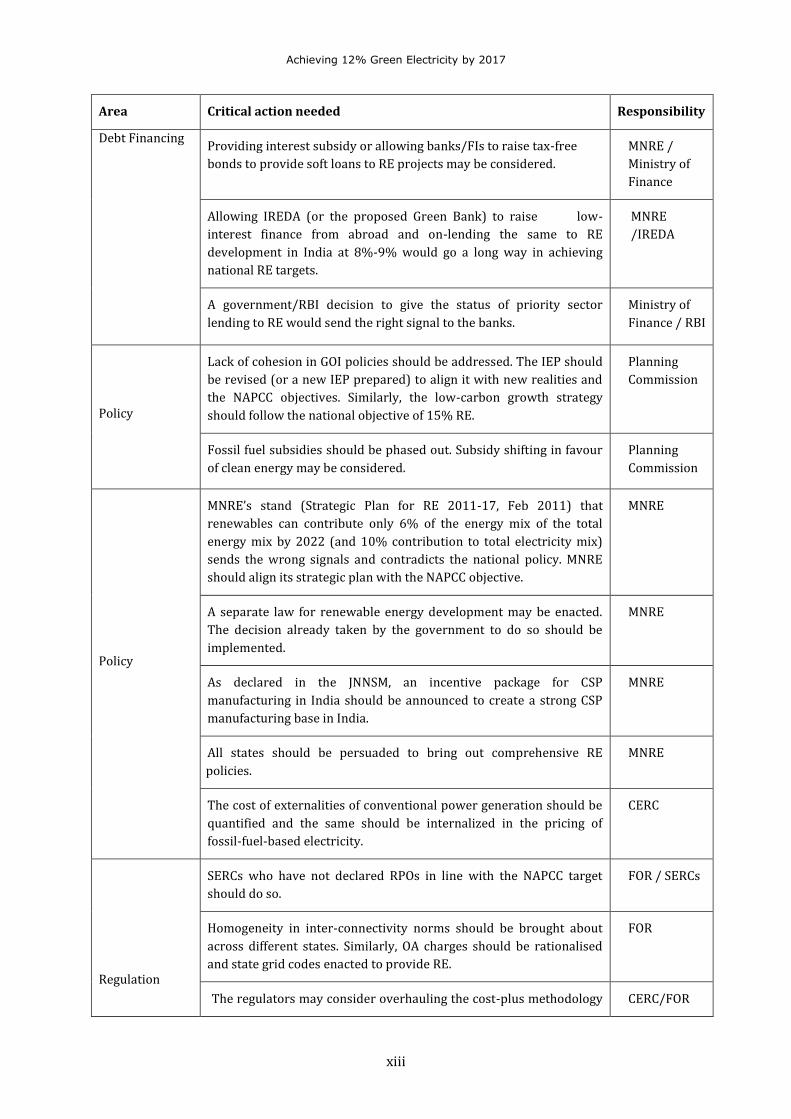
Area Critical action needed Responsibility
Debt Financing Providing interest subsidy or allowing banks/FIs to raise tax-free
bonds to provide soft loans to RE projects may be considered.
MNRE /
Ministry of
Finance
Allowing IREDA (or the proposed Green Bank) to raise low-
interest finance from abroad and on-lending the same to RE
development in India at 8%-9% would go a long way in achieving
national RE targets.
MNRE
/IREDA
A government/RBI decision to give the status of priority sector
lending to RE would send the right signal to the banks.
Ministry of
Finance / RBI
Policy
Lack of cohesion in GOI policies should be addressed. The IEP should
be revised (or a new IEP prepared) to align it with new realities and
the NAPCC objectives. Similarly, the low-carbon growth strategy
should follow the national objective of 15% RE.
Planning
Commission
Fossil fuel subsidies should be phased out. Subsidy shifting in favour
of clean energy may be considered.
Planning
Commission
Policy
MNRE’s stand (Strategic Plan for RE 2011-17, Feb 2011) that
renewables can contribute only 6% of the energy mix of the total
energy mix by 2022 (and 10% contribution to total electricity mix)
sends the wrong signals and contradicts the national policy. MNRE
should align its strategic plan with the NAPCC objective.
MNRE
A separate law for renewable energy development may be enacted.
The decision already taken by the government to do so should be
implemented.
MNRE
As declared in the JNNSM, an incentive package for CSP
manufacturing in India should be announced to create a strong CSP
manufacturing base in India.
MNRE
All states should be persuaded to bring out comprehensive RE
policies.
MNRE
The cost of externalities of conventional power generation should be
quantified and the same should be internalized in the pricing of
fossil-fuel-based electricity.
CERC
Regulation
SERCs who have not declared RPOs in line with the NAPCC target
should do so.
FOR / SERCs
Homogeneity in inter-connectivity norms should be brought about
across different states. Similarly, OA charges should be rationalised
and state grid codes enacted to provide RE.
FOR
The regulators may consider overhauling the cost-plus methodology CERC/FOR
Achieving 12% Green Electricity by 2017
xiv
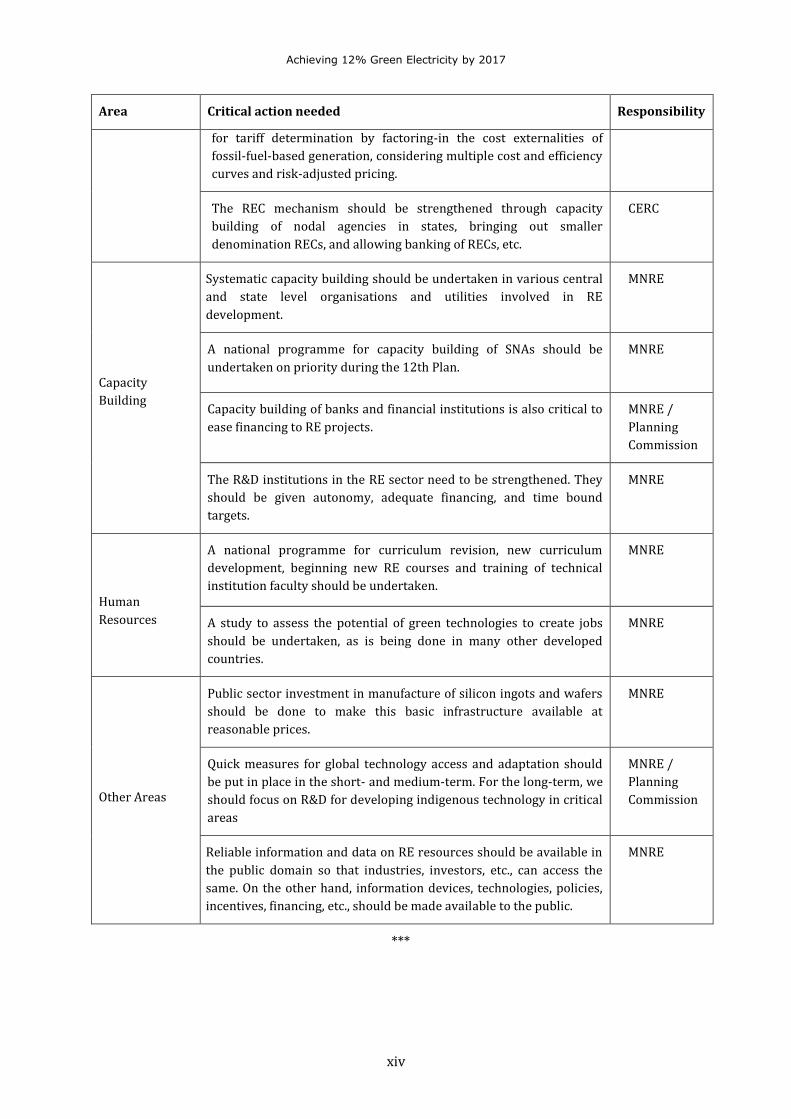
Area Critical action needed Responsibility
for tariff determination by factoring-in the cost externalities of
fossil-fuel-based generation, considering multiple cost and efficiency
curves and risk-adjusted pricing.
The REC mechanism should be strengthened through capacity
building of nodal agencies in states, bringing out smaller
denomination RECs, and allowing banking of RECs, etc.
CERC
Capacity
Building
Systematic capacity building should be undertaken in various central
and state level organisations and utilities involved in RE
development.
MNRE
A national programme for capacity building of SNAs should be
undertaken on priority during the 12th Plan.
MNRE
Capacity building of banks and financial institutions is also critical to
ease financing to RE projects.
MNRE /
Planning
Commission
The R&D institutions in the RE sector need to be strengthened. They
should be given autonomy, adequate financing, and time bound
targets.
MNRE
Human
Resources
A national programme for curriculum revision, new curriculum
development, beginning new RE courses and training of technical
institution faculty should be undertaken.
MNRE
A study to assess the potential of green technologies to create jobs
should be undertaken, as is being done in many other developed
countries.
MNRE
Other Areas
Public sector investment in manufacture of silicon ingots and wafers
should be done to make this basic infrastructure available at
reasonable prices.
MNRE
Quick measures for global technology access and adaptation should
be put in place in the short- and medium-term. For the long-term, we
should focus on R&D for developing indigenous technology in critical
areas
MNRE /
Planning
Commission
Reliable information and data on RE resources should be available in
the public domain so that industries, investors, etc., can access the
same. On the other hand, information devices, technologies, policies,
incentives, financing, etc., should be made available to the public.
MNRE
***
Achieving 12% Green Electricity by 2017
1
11 Evolution of the Policy Environment for Renewables in India
Development of renewables in India has witnessed various ups and downs. The beginning was the
set of promotional guidelines issued by the then Ministry of Non Conventional Energy Sources
(MNES) during the year 1993–94. For the first time, an indicative tariff for renewable energy (RE)
based electricity was announced; besides, RE project proponents were also allowed to bank and
consume energy from the grid as per their supply-demand pattern within a particular financial
year. The ministry’s guidelines and state-level incentives like sales tax exemption, infrastructure
assistance, etc, resulted in commendable capacity addition during the following decade (1993–
2002). However, the next transition in the policy and regulatory framework governing RE was the
enactment of the Electricity Act in 2003. Some of the major post-EA, 2003, policy and regulatory
initiatives responsible for promotion of RE are chronicled in this chapter.
1.1 RECENT LEGAL AND POLICY ENVIRONMENT FOR RE
In the last few years, a set of conducive policies facilitating accelerated RE development have been
put in place. These relate to legal provisions and policy pronouncement.
1.1.1. Legal and Policy Initiatives
Electricity Act 2003: The Electricity Act, (EA), 2003, introduced some enabling provisions that
were conducive for accelerated development of grid connected renewables.
Under Section 61(h), promotion of cogeneration and generation of electricity from renewable
sources of energy has been made the explicit responsibility of state electricity regulatory
commissions (SERCs), who are taking these considerations into account while drafting their terms
and conditions for tariff regulations. Nearly all SERCs have issued their tariff regulations/orders
incorporating suitable clauses which will enable the SERCs to provide a preferential treatment to
renewable energy during the tariff determination process.
Under Section 86 (1)(e), SERC is also made responsible for the following:
i. Ensuring suitable measures for connectivity of renewable power to the grid;
ii. Sale of renewable energy electricity to any person;
iii. Mandating purchase of a certain percentage of total energy consumption from renewables.
As mandated under section 86 1(e) of EA, 2003, almost 24 SERCs have fixed certain quota (in terms
of percentage of electricity being handled by the power utility) to procure renewable energy. The
mandate termed as Renewable Purchase Obligation (RPO) or Renewable Purchase Specification
(RPS) varies from 0.5% to 14% in various states. Few states have come out with technology-
specific RPO or RPS. Besides, the state regulators determine the tariff for all RE projects in the
states and ensure connectivity to the grid through extension of power evacuation from the RE
project sites which are generally at remote locations and away from major load centres.
Achieving 12% Green Electricity by 2017
2
National Electricity Policy: Clause 5.12 of the National Electricity Policy stipulates several
conditions for promotion and harnessing of renewable energy sources. The salient features of the
said provisions of NEP are reproduced below.
5.12.1: Non-conventional sources of energy being the most environment-friendly, there is an
urgent need to promote generation of electricity based on such sources of energy. For this purpose,
efforts need to be made to reduce the capital cost of projects based on non-conventional and
renewable sources of energy. Cost of energy can also be reduced by promoting competition within
such projects. At the same time, adequate promotional measures would also have to be taken for
development of technologies and a sustained growth of these sources.
5.12.2: The Electricity Act, 2003, provides that co-generation and generation of electricity from
non-conventional sources would be promoted by the SERCs by providing suitable measures for
connectivity with the grid and sale of electricity to any person and also by specifying, for purchase
of electricity from such sources, a percentage of the total consumption of electricity in the area of a
distribution licensee. Such percentage for purchase of power from non-conventional sources
should be made applicable for the tariffs to be determined by the SERCs at the earliest.
Progressively, the share of electricity from non-conventional sources would need to be increased
as prescribed by state electricity regulatory commissions. Such purchase by distribution companies
shall be through competitive bidding process. Considering the fact that it will take some time
before non-conventional technologies compete, in terms of cost, with conventional sources, the
Commission may determine an appropriate differential in prices to promote these technologies.
National Tariff Policy (NTP): This policy further elaborates the role of regulatory commissions,
the mechanism for promoting renewable energy, the time frame for implementation, etc. Clause 6.4
of the policy addresses various aspects associated with promoting and harnessing renewable
energy sources. Salient features of the provisions made by the NTP are as follows.
(i) Pursuant to provisions of Section 86 (1) (e) of EA, 2003, the appropriate Commission shall fix a
minimum percentage for purchase of energy from such sources, taking into account availability of
such resources in the region and its impact on retail tariffs. Such percentage for purchase of energy
should be made applicable for the tariffs to be determined by the SERCs latest by 1 April 2006.
It will take some time before non-conventional technologies can compete with conventional
sources in terms of cost of electricity. Therefore, procurement by distribution companies shall be
done at preferential tariffs determined by the appropriate Commission.
(ii) Such procurement by distribution licensees for future requirements shall be done, as far as
possible, through competitive bidding process under Section 63 of the Act among suppliers offering
energy from same type of non-conventional sources. In the long term, these technologies would
need to compete with other sources in terms of full costs.
(iii) The Central Commission should lay down guidelines within three months for pricing non-firm
power, especially from non-conventional sources, to be followed in cases where such procurement
is not through competitive bidding.
Recently on 20th January 2011, clause 6.4 (1) is amended with inclusion of solar specific RPO. Now
clause 6.4 (1) reads as follows: “within the percentage so made applicable, to start with, the SERCs
Achieving 12% Green Electricity by 2017
3
shall reserve a minimum percentage for purchase of solar from the date of notification of the
official gazette which will go up to 0.25% by the end of 2012/13 and further upto 3% by 2022.”
13th Finance Commission Incentive for RE: The 13th Finance Commission made
recommendations for the period 2010–15. The Commission felt that a quantum jump in the supply
of electricity is a critical requirement for future sustainable growth. Hence they made a provision
for a forward looking grant of Rs.5000 crores to be paid as incentive to states who increase the
share of electricity generated from renewable sources between FY 2010-11 to FY 2013-14. The
entire incentive scheme is further subdivided in two parts namely, (i) 25% of incentive grant to be
disbursed for achievement in installed capacity addition over unachieved potential as assessed by
MNRE (due to uneven distribution of RE sources) and (ii) 75% of incentive grant to be allotted for
achievement in installed capacity addition relative to the aggregate of installed capacity addition
across all states (in order to ensure accelerated capacity addition). Further, a cap of Rs.1.25
crores/MW & Rs.1.50 crores/MW of installed capacity addition is proposed respectively for
general and special category states. The report also recommends access to competitive power
markets for RE developers. (13th Finance Commission 2011)
National Clean Energy Fund: In the Union Budget 2010–11, the Finance Minister proposed to levy
a cess on all coal consumed in the country, the revenues from which will go towards the creation of
a National Clean Energy Fund (NCEF). The clean energy cess of Rs.50 per metric tonne will be
levied on all coal, lignite and peat produced in India, as also on imports from abroad. On 24 June
2010, the Union Finance Ministry issued formal orders for levy of the cess as a duty of excise w.e.f.
1 July 2010. The NCEF is proposed to be utilised for the development and deployment of clean
energy technologies in India. An internal assessment by WISE shows that a corpus of Rs.50,934
crores will accumulate in the NCEF up to 2020 based on the CAGR of coal consumption in the
country. It is imperative that a substantial portion of the NCEF should be made available for
development of renewables.
Incentives for Solar Photovoltaic Manufacturing under Semiconductor Policy: During August
2008, Government of India announced a semiconductor policy with incentives to attract
investment to the semiconductor sector. The scheme covered manufacturers of semiconductors,
displays and solar photovoltaic technologies using semiconductor devices for solar cells. The
government will bear 20 percent of capital expenditure in the first ten years if a unit is located
within one of the Special Economic Zones (SEZs), including a major economic zone in Hyderabad
called "Fab City" and 25 percent in the non-SEZ areas. The minimum investment was set at Rs.25
billion for semiconductor manufacturers and Rs.10 billion for other micro and nanotechnology
organizations. The solar industry has been the chief beneficiary of these announcements and at
least twelve industrial houses had their projects for solar manufacturing approved under the
policy. When implemented, all these projects would increase solar PV manufacturing capacity in
India from around 700 MW at present to over 4000 MW per annum.
Planning Commission sets up Expert Group on Strategy for Low Carbon Economy: To
strengthen the goal of low carbon development, the Planning Commission of India in January 2010,
constituted an expert committee/task force. The 26-member expert committee is headed by Dr
Kirit Parikh, former Member, Planning Commission, GoI. The major objectives of the Committee
are to review the existing studies on low carbon growth for India as prepared by various
Achieving 12% Green Electricity by 2017
4
organisations, conducting further analysis to assess low carbon options for the Indian economy and
finally, prepare a report outlining a roadmap for India for low carbon growth. The final
report/roadmap will contain an evaluation of some key alternative low carbon options with an
analysis of their cost-benefits and relative merits and demerits, an action plan comprising of
critical low carbon initiatives to be undertaken, including sector-specific initiatives, along with a
suggested timeline and targets starting 2011 and extending to the 12th Plan period. The expert
committee has now submitted an interim report to the Planning Commission (Low carbon Economy,
2011).The report analyses projection of fuel mix and emissions under different scenarios for both
8% and 9% average GDP growth rate upto 2020. It is observed that the report is methodologically
skewed and has not considered RE injection targets specified under the NAPCC.
National Action Plan on Climate Change (NAPCC): The National Action Plan on Climate Change
(NAPCC) announced by the Prime Minister’s council on Climate Change was notified in June 2008.
As per NAPCC, renewable electricity injection into the national grid has to be set at 5% at the
beginning of FY 2009–10 and needs to be increased at 1% per annum in the subsequent years to
reach 15% at the end of FY 2019–20.
Jawaharlal Nehru National Solar Mission: As part of the eight national missions announced in
the NAPCC, the Jawaharlal Nehru National Solar Mission (JNNSM) was announced in 2009. JNNSM
aims to promote the development of solar energy for grid connected and off-grid power
generation. The ultimate objective is to make solar power competitive with fossil based
applications by 2020-2022.
The main objectives of the JNNSM are:
Create an enabling policy framework for the deployment of 20,000 MW of grid-connected solar
power by 2022.
Create favourable conditions for establishment of indigenous solar manufacturing capacity,
particularly for solar thermal power generation technologies.
Promote programmes for off grid applications, reaching 1000 MW by 2017 and 2000 MW by
2022.
Achieve 15 million sq meter solar thermal collector area by 2017 and 20 million sq meter by
2022.
Deploy solar lightening systems for rural areas by 2022.
Three guidelines for project implementation under JNNSM have also been issued recently and
through them, the JNNSM is now operational, to the extent of solar project development. To
minimize the impact of high solar tariff on state electricity utilities and customers, it is envisaged
that NVVN, NTPCs wholly owned subsidiary company engaged in the business of trading of power
has been designated as the nodal agency for entering into a Power Purchase Agreements (PPA)
with solar power developers for the first phase of the mission upto 2013. The PPAs will be valid for
a period of 25 years. For each MW of solar power installed capacity for which PPA is signed by
NVVN, an equivalent amount of MW capacity from the unallocated quota of NTPC stations will be
allocated to them. NVVN will bundle this power and sell this bundled power at a rate fixed as per
CERC regulations. In case of significant price movement in the market rate, the Government will
review the situation. (JNNSM 2009) (NVVN 2011)
Achieving 12% Green Electricity by 2017
5
1.1.2. Incentives for RE by the Central Government
Capital Subsidy: Some technologies like small hydro, biomass and solar PV (off-grid) systems are
provided support through capital subsidy based on installed capacity. An indexation method has
been devised to calculate subsidy amounts for various technologies.
Accelerated Depreciation: The Government of India currently allows accelerated depreciation at
the rate of up to 80% in the first year on a written-down value (WDV) basis for equipment under
Section 32, Rule 5 of the Income Tax Act.
Generation Based Incentive (GBI): The Government of India had implemented a GBI scheme for
grid interactive wind power projects - a GBI of Rs 0.50 per kWh, with cap of Rs.15 lakhs per MW
per year, totalling Rs.62.5 lakhs per MW to be availed up to 10 years of the project life. This scheme
is applicable to wind power projects not availing accelerated depreciation benefits and
commissioned before 31 March 2012. However, there are no guidelines for GBI post-2012.
A similar GBI scheme was offered to solar power generation projects for small capacity of 50 MW.
However, the scheme was withdrawn after the introduction of JNNSM.
Income Tax Holiday: Section 80 IA of the Income Tax Act offers a 10-year tax holiday within a
block of first fifteen years during the life cycle of all infrastructure projects which also includes
renewable energy power generation projects.
Excise Duty Exemption: Government of India is offering 100% exemption in Excise Duty for most
renewable energy generation project components. The components that are offered such
exemption are specified under List 9 of Section No. 237 of the Central Excise Tariff Act, 1985. The
normal rate of Excise Duty for such components is 16%.
Customs Duty Exemption: Government of India is offering concessional Customs Duty of 5% for
selected components of renewable energy generation power projects under the Customs Tariff Act,
1975 (51 of 1975). The electrical components and machinery used in renewable energy power
projects attracts Customs Duty of 7.5% or 10% (depending upon components). Further, Govt. of
India vide Notification No. 30/2010-Customs dated 27 February 2010 has offered concessional
Customs Duty for all machinery imported for the initial setting up of a solar power generation
project or facility.
Foreign Direct Investment: 100% FDI investment is allowed in renewable energy generation
projects.
Deduction in Taxable Income: Under Section 10(23G) of the Income Tax Act, income from an
infrastructure capital fund or company or a cooperative bank (from the assessment year 2002/03)
by way of dividends, interest, or long-term capital gain from investments made in infrastructure
business, etc., is exempt till 2012.
Renewable Regulatory Fund (RRF): All power generation projects are required to schedule the
power. Any deviation from the schedule is liable to be penalised. However, wind and solar power
projects are allowed limited deviation from their schedule. In order to compensate the applicable
unscheduled interchange (UI) penalty to state utility because of default of RE power schedules
within the allowed limits, it is proposed to create a renewable regulatory fund to compensate the
Achieving 12% Green Electricity by 2017
6
same. This fund is proposed to be created by the National Load Dispatch Centre (NLDC) on the
lines of UI Pool Account at the regional level. Payments on account of renewable regulatory
charges, as described in the Regulations, and interest, will be credited to this account.
1.1.3. Incentives for RE by State Governments
Some state governments have established clean energy funds through levy of ‘green cess’. Certain
other incentives have also been announced in states like Maharashtra. The initiatives in the states
of Maharashtra, Karnataka and Gujarat are briefly discussed here.
Maharashtra: The Government of Maharashtra has levied Rs. 0.08 (eight paise) per kWh on
energy consumption by commercial and industrial units. This cess generates around Rs.200 crore
annually. The state government has formed the Urjankur Nidhi trust and appointed M/s IL & FS as
fund manager for proper utilisation of the funds. The funds are being utilised for providing equity
capital for bagasse co-generation projects and for funding power evacuation infrastructure
required for evacuation of power generated from non-conventional energy generation projects.
The Maharashtra government has recently (3 March 2011) announced 100% exemption on
sugarcane purchase tax of 3% for co-operative sugar factories which will be commissioning co-
generation power projects. This tax exemption will be available for a ten year period, from the
commissioning of the co-generation project, or till such tax exemption amount becomes equal to
the project cost, whichever is earlier.
Gujarat: The Government of Gujarat has passed the ‘Gujarat Green Cess Bill 2011’ which proposes
to levy a green cess of Rs. 0.02 (two paise) per kWh on generation of all kinds of electrical energy,
including captive energy, but excluding solar energy, wind energy, bio-energy, geo-thermal energy,
tidal energy and hydel energy. This cess could generate Rs.244 crore, which is proposed to be
utilised for encouraging the use of renewable energy and for protection of the environment. (Gujarat
2011)
Karnataka: The Government of Karnataka has planned to impose Rs.0.05 (five paise) per kWh as
green cess on commercial and industrial consumers to generate about Rs.50 to Rs.60 crore
annually. This fund is proposed to be utilised for the development of renewable energy, incubation
of projects, and enhance capabilities on evacuation of wind power projects in the state.
Concession in open access charges/demand charges for captive RE projects: RE projects,
especially wind power projects, have low plant load factor compared to conventional power
projects. However, the open access charges do not differentiate between the source of power
generation. Hence, per unit of open access charges are comparatively higher for RE projects,
making open access transactions unviable. Hence, to promote RE projects, some states have offered
concessional open access charges for captive RE projects or waived the cross-subsidy surcharges
for such transactions. States like Karnataka, Kerala, Tamil Nadu and Gujarat have offered
concessional open access charges/demand charges for captive RE projects and states like
Maharashtra have not imposed cross-subsidy surcharge. Some states have restricted such benefits
for captive use of RE power and third party transactions are being excluded. So there is wide
variation among the states in the open access charges and cross subsidy policies.
Achieving 12% Green Electricity by 2017
7
1.2 DEVELOPMENTS IN RE ELECTRICITY REGULATION
Developments in RE Tariff Regulations: Prior to the formation of regulatory commissions, the
Ministry of New and Renewable Energy (MNRE) had prescribed the tariffs for purchase of power
from all renewable sources of energy. As per MNRE guidelines, Rs.2.25/kWh tariff for the base year
1994-95 was set with escalation of 5% per annum for the first 10 years. Many state governments
followed these guidelines. This tariff policy did not consider the RE technology, project cost, and
other techno-commercial parameters.
Later, after the enactment of the Electricity Regulatory Commissions (ERC) Act, 1998, Section
22(1)(c) empowered the Commission to regulate the power purchase and procurement process,
including the tariff. Further, Section 29 of the ERC Act, 1998, prescribes the specific principles of
tariff fixation. Further, the Electricity Act, 2003, empowered the state electricity regulatory
commissions (SERCs) to promote generation of electricity from RE sources and specify RE
purchase obligation.
With this, SERCs formulated RE tariff regulations. The tariff methodologies and tariff petitions are
being discussed through a public consultation process to bring in transparency, competition, as
well as secure the returns on investment. Most of the SERCs adopted the cost-plus methodology for
determination of RE tariff. These orders were passive as they were not considering the inflations
and capital cost fluctuations during the tariff order control period. Hence, SERCs are now shifting
towards the multi-year tariff regulations, where tariffs are linked to capital cost indexatation.
Renewable Purchase Obligation/Specification: Most SERCs have put significant emphasis on
Section 86 (1) (e) of EA, 2003, namely specifying a percentage of electricity to be procured by the
distribution licensees from renewable sources of energy. As on date (31.03.2011), twenty-four
SERCs, with jurisdiction over their respective states, have issued orders or regulations under this
section of EA, 2003, and have specified percentages for purchase of electricity from renewable
sources of energy. These obligations are popularly referred to as ‘renewable purchase
specification’ (RPS) or ‘renewable purchase obligation’ (RPO). While most SERCs have specified a
single target for procurement of power from renewable energy technologies, some SERCs have
specified separate targets for specific technologies.
REC Mechanism -Tradable Renewable Energy Certificates: Given the renewable purchase
obligation on distribution licensees, the availability of renewable energy has to be ensured. To
meet these targets, a tradable REC mechanism was put in place by the Central Electricity
Regulatory Commission (CERC) in the year 2010. Under this framework, RE generators can trade
Renewable Energy Certificates (one REC is equivalent to 1000 kWh) through power exchange
platform that will allow market-based price discovery. However, this price range is determined
again by CERC and the price discovery can happen only in this range defined between the Floor
Price and the Forbearance Price. The respective price ranges are defined separately for solar and
non-solar RECs (wind, biomass, small hydro) to take care of the difference in economics. The
Commission has stipulated Rs.1.50/kWh and Rs.3.90/kWh as floor and forbearance price for non-
solar RECs and Rs.12.00/kWh & Rs.17.00/kWh as floor and forbearance price for solar RECs,
respectively.
Achieving 12% Green Electricity by 2017
8
The only requirement to make a renewable energy generator eligible for participating under RECs
is that he should sell his power to the host distribution licensee at Average Power Procurement
Cost (APPC) or at mutually agreed tariff to the entity other than host distribution licensee. APPC is
the weighted average cost of power purchase for the utility, and in effect, represents the effective
cost of grid mix. So, on the demand side, the REC framework allows the purchase obligated utilities
to buy RECs through the national exchange irrespective of state potential and installed capacity. On
the supply side, it allows the RE generators to get a base revenue income by selling power at the
average power procurement cost and an additional market determined revenue stream through
the REC trading platform.
CERC RE Tariff Notification: The Central Electricity Regulatory Commission has come out with
tariff regulation ‘Terms and conditions for determination of tariff for sale of electricity from
renewable sources of energy’ in September 2009. The SERCs can follow these guidelines while
specifying the RE tariff in their states. These regulations have the following key features:
Upfront tariff for a project for the whole of the normative debt repayment period (for useful life
in case of solar and small hydro) to give certainty to the investors. There would not be any
midcourse tariff modification.
Capital cost norms and financial norms take care of all reasonable costs.
Adequate and fixed return on equity determined right in the beginning.
Generic tariff to be declared every year for the projects to be commissioned in the next
financial year.
Newer technologies e.g. solar and municipal waste-based generation projects have additional
option of approaching the CERC for getting project-specific tariffs based on actual capital costs
in deviation of norms specified in the regulations, subject to prudence check.
Reasonable escalation has been built into the tariff framework so that tariffs for projects to be
commissioned in successive years remain aligned to market realities.
Scheduling Norms for Wind and Solar Power: Recently, the CERC has notified ‘The Indian
Electricity Grid Code (IEGC), 2010’ which has provided a special dispensation for scheduling of
wind and solar generation in case of inter-state sale of electricity. The provision of inter-state sale
of wind generation will come into force on 1 January 2012. However, the capacity of such plants
connected to a 33 kV connection point should be 10 MW and above. The inter-state sale option is
applicable for those who have not signed any PPA with states or others as on the date of coming
into force of IEGC 2010 with effect from 03.05.2010.Such transaction will however attract
unscheduled interchange charges as specified in IEGC, 2010, if the actual generation is beyond +/-
30% of the schedule in case of wind.
In case of solar electricity, these norms are applicable for solar projects of capacity 5 MW and
above connected to 33 kV level and above. However, in case of inter-state sale of solar generation,
no UI charges are to be paid or earned by the developer till 2015. (IEGC 2010)
Open Access to Inter-state Transmission of RE: CERC has issued ‘Grant of Connectivity, Long-
term Access and Medium-term Open Access in Inter-state Transmission and Related Matters
(Amendment) Regulations, 2010’, in September 2010. The amended regulations had included
hydro and other renewable energy generation projects with aggregate capacity of 50 MW and

Achieving 12% Green Electricity by 2017
9
above for inter-state transmission of power, with the condition that the lead generator shall act on
behalf of all the generators to undertake all operational and commercial responsibilities for all the
collective generators connected at that point in following the provisions of the Indian Electricity
Grid Code and all other regulations. Further, RE projects with aggregate capacity of 250 MW and
above shall not be required to construct a dedicated transmission line to the point of connection,
and such stations shall be taken into account for coordinated transmission planning by the Central
Transmission Utility and Central Electricity Authority (CEA).
Notwithstanding many persisting loopholes and barriers, India now has a reasonably proactive
policy and regulatory framework at the national level for facilitating RE development. However, we
are missing in action. Our work plans, both at national and state levels still plough the business-as-
usual path. The current course of action is insufficient to achieve the NAPCC target of 15% by 2020.
We need to first discover what this 15% means in terms of capacity addition of RE and work out
action plans to realise the same. In Chapter 4 and 5, we have attempted to discern these two critical
aspects. In Chapter 5, we have identified the barriers and possible solutions.
***

Achieving 12% Green Electricity by 2017
10
Achieving 12% Green Electricity by 2017
11
22
Rationale for and Benefits of Increasing RE in the Energy Mix
2.1 RATIONALE
2.1.1 Rising Energy Demand: The Integrated Energy Policy (IEP) Report, 2006, estimates that
India will need to increase primary energy supply by three to four times and electricity generation
by five to six times to meet the lifeline per capita consumption needs of its citizens and to sustain
an eight percent growth rate. The government plans to provide universal access to electricity and
increase per capita consumption to 1000 kWh by 2012. The Expert Group on Low Carbon Economy
has considered the same energy intensity of 0.95 kWh/Re.1 GDP for future projections as
considered by IEP for projections in 2004–05 to 2011–12 period. According to the expert group
report, in 2020, India will require gross electricity generation of 2104 billion kWh and 2359 billion
kWh under 8% and 9% GDP growth rates respectively. The 17th Electric Power Survey of India
(published by the Central Electricity Authority) under its long-term forecast has projected the
electrical energy requirement as 1914 billion kWh in 2021–22. (planning commission 2011)
In the next 25 years, India’s electricity demand is expected to grow at an average annual rate of
7.4%. Generation capacity will have to increase five-fold to keep pace with this demand growth.
According to the Central Electricity Authority (CEA), as on March 2011, India had 174 GW of
generation capacity, with annual conventional electricity generation of about 811 billion kWh. The
gap between supply and demand is likely to increase unless adequate measures are taken to bring
on new generation capacity and improve operational efficiency in the distribution and
management of power utilities. (CEA, world Bank 2010)
2.1.2 Issues with Conventional Sources of Energy: India imports nearly 72% of its oil
requirements and this share of imported oil is expected to reach 90% by 2031–32; the story of coal
imports is also not very different. According to scenarios developed as part of the IEP by the
Planning Commission, imports could increase to as high as 45% of the total coal requirement by
2031-32. Given this scenario, it is of paramount importance that the country develops all possible
domestic energy sources. Minimizing the dependence on import of conventional fuel and providing
energy to all at affordable prices should be the main concern of India’s energy policy. Therefore,
India must make every effort to harness indigenous renewable resources. During the last three Five
Year Plan periods, the actual conventional electricity capacity addition merely reached around
50% of the targeted capacity addition planned (16,420 MW against 30,540 MW in the 8th Plan;
19,015 MW against 40,250 MW in the 9th Plan; 21,080 MW against 41,110 MW in the 10th Plan).
The situation in the present plan period is not different; already the eleventh plan target for
conventional power stands reduced from 78,700 MW to 62,374 MW, and even this is unlikely to be
reached. The achievement in the first 3 years (FY 2007-08, 08-09, 09-10) is only 22,302 MW as
against the original target of 47,220 MW. And there are problems in the conventional power sector
(coal, gas, hydro). Mining and import of coal are both facing problems, especially since huge
quantities are required. Logistics, transport and price issues are also emerging. Moreover, at
projected usage levels, questions are also being raised as to how long India’s extractable coal
Achieving 12% Green Electricity by 2017
12
reserves could last (52 billion tonnes as per Coal Vision 2025 of Ministry of Coal, 18 billion tonnes
as per 10th Plan document of GoI). One of the major reasons for the shortfall in electricity supply in
India over the past five years has been the shortage of coal and gas. In July 2005, 22 of 75 coal
power stations (with a total capacity of 61,000 MW) faced severe coal shortages, even though all
stations are required to maintain 15–30 days of coal stocks for emergencies. Moreover, around half
of the running coal power plants in 2009 were more than 20 years old. These plants often operate
at low load factors with an efficiency of only 30%. Environmental and climate change threats are
getting more severe and project clearances are increasingly becoming difficult to obtain. In spite of
many policy and infrastructural initiatives, it appears unlikely that the quantities required to
achieve projected conventional power capacity will be available. (MNRE paper, WISE database, World Bank
2010 , IEA 2011 b )
Large hydro projects are also facing problems related to environmental issues, project execution in
difficult terrain, along with attendant issues of building long transmission lines. Natural gas
availability and its competitive usage also do not offer much optimism. Nuclear power capacity
building continues to face problems, especially with the huge targets proposed.
2.1.3 Future Cost Advantages of RE: Fuel costs constitute the largest proportion of total
economic costs for conventional thermal generation, which is therefore exposed to future input
inflation. Given the structural changes in global oil markets in the past decade and the accelerating
global demand and shrinking supply of known fuel sources, fuel costs are projected to increase
consistently in the coming decades. According to the International Energy Agency, demand for
fossil fuels in the base reference scenario is expected to increase by 77% by 2030. In volume terms,
coal is expected to have the largest increase: its share in primary energy demand will rise from
27% to 29% between 2007 and 2030. The average real price of coal is projected to rise from
$65/tonne in 2009 to $100/tonne by 2020 and $110/tonne by 2030. Oil is expected to follow a
similar trend, with the average price projected to rise from $65/barrel to $100/barrel by 2020 and
$115/barrel by 2030 ($190/barrel in nominal terms).
In contrast, trends in international fuel and equipment markets are favourably inclined towards
renewable energy technologies. Among the potential RE technologies in India, fuel expenses form a
substantial part of total cost only for biomass. For other RE technologies, the largest cost
component is the high upfront capital costs of equipment. However, in the recent past, costs of
capital equipment for renewable energy have been decreasing and this is likely to continue as
technology advances. The cost of solar photovoltaic generation is projected to fall from about $4/W
in 2010 to $1.9/W–$2.2/W in 2020 and $1.07/W–$1.23/W in 2050. Electricity generation costs are
projected to be in the range of $0.05 kWh–$0.07 kWh at sites with good irradiation. (World Bank 2010)
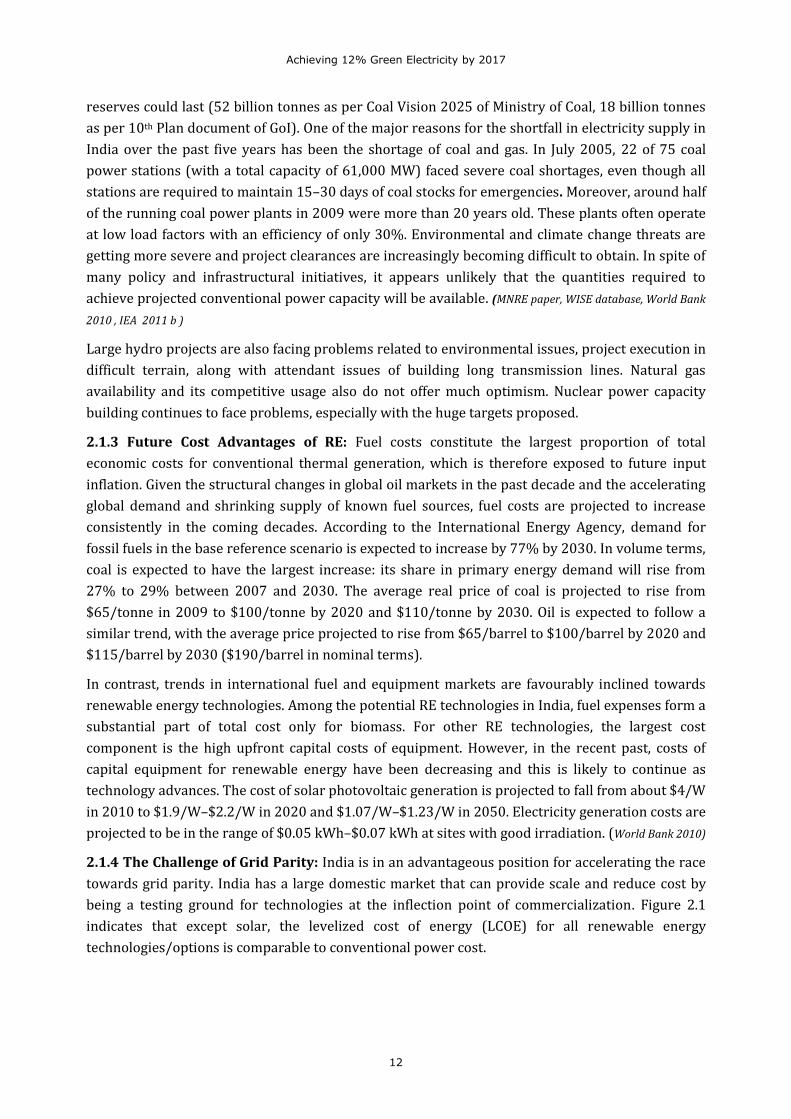
2.1.4 The Challenge of Grid Parity: India is in an advantageous position for accelerating the race
towards grid parity. India has a large domestic market that can provide scale and reduce cost by
being a testing ground for technologies at the inflection point of commercialization. Figure 2.1
indicates that except solar, the levelized cost of energy (LCOE) for all renewable energy
technologies/options is comparable to conventional power cost.
Achieving 12% Green Electricity by 2017
13
Fig 2.1: Increasing Competitiveness of RE-based Generation on LCOE basis
(Source: IIR, 2010)
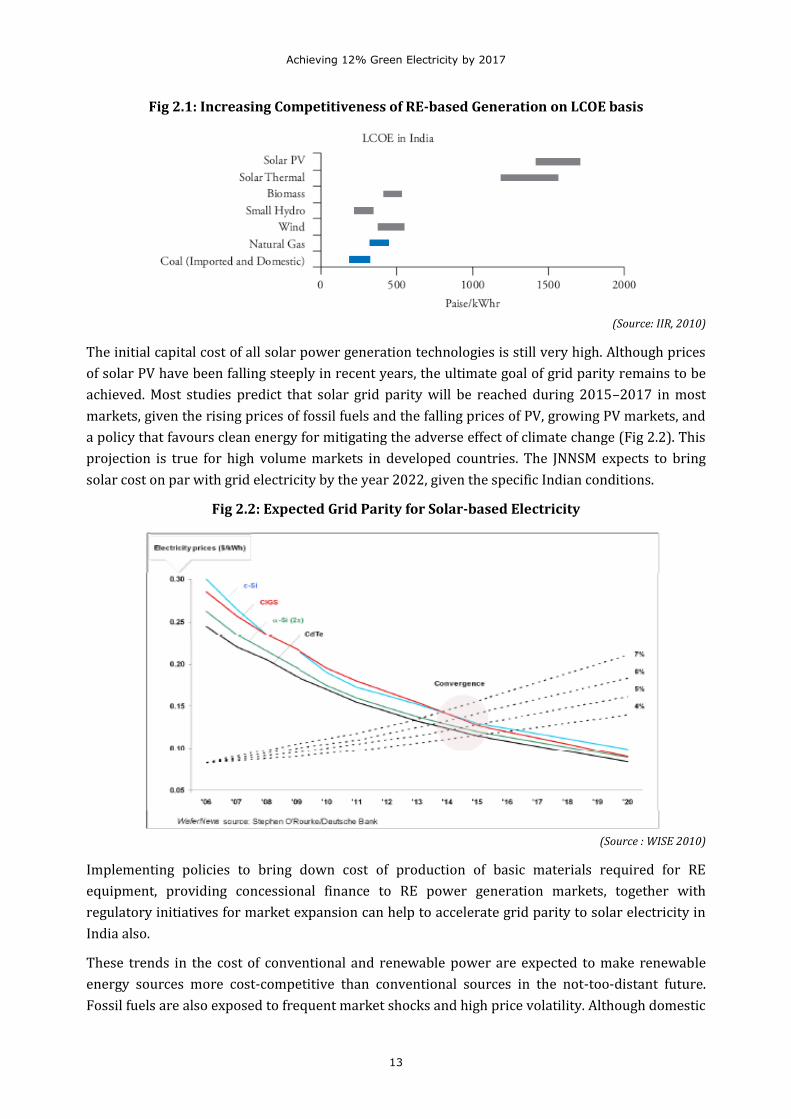
The initial capital cost of all solar power generation technologies is still very high. Although prices
of solar PV have been falling steeply in recent years, the ultimate goal of grid parity remains to be
achieved. Most studies predict that solar grid parity will be reached during 2015–2017 in most
markets, given the rising prices of fossil fuels and the falling prices of PV, growing PV markets, and
a policy that favours clean energy for mitigating the adverse effect of climate change (Fig 2.2). This
projection is true for high volume markets in developed countries. The JNNSM expects to bring
solar cost on par with grid electricity by the year 2022, given the specific Indian conditions.
Fig 2.2: Expected Grid Parity for Solar-based Electricity
(Source : WISE 2010)
Implementing policies to bring down cost of production of basic materials required for RE
equipment, providing concessional finance to RE power generation markets, together with
regulatory initiatives for market expansion can help to accelerate grid parity to solar electricity in
India also.
These trends in the cost of conventional and renewable power are expected to make renewable
energy sources more cost-competitive than conventional sources in the not-too-distant future.
Fossil fuels are also exposed to frequent market shocks and high price volatility. Although domestic
Achieving 12% Green Electricity by 2017
14
coal and gas prices are controlled by the government in India, a significant share of fuel supply is
imported, which increases the risks associated with supply and price.
As per ESMAP (Energy Sector Management Assessment Programme) -World Bank Study (2010)
titled ‘Unleashing the potential of RE in India’, our country could produce about 62 GW in an
economically feasible manner, if the local and global environmental premiums of coal-based
generation are brought into consideration. About 3 GW of renewable energy is economically
feasible at the avoided cost of coal-based generation of Rs.3.08/kWh, all of it from small
hydropower. About 59 GW of renewable energy in wind, biomass, and small hydropower is
available at an avoided cost of less than Rs.5/kWh. The capacity of 68 GW in these three
technologies can be harnessed at a price of less than Rs.6/kWh. About 90 percent of cumulative
renewable capacity of 62 GW in wind, biomass, and small hydropower is available when the local
and global environmental premiums of coal are brought into consideration. Therefore,
development of a substantial volume of renewables is economically justified within the context of
an aggressive low-carbon strategy in which the cost of environmental externalities is added to the
alternative or avoided cost of energy generation. (World Bank 2010) The IPCC special report,
‘Renewable Energy Sources: Summary for Policy Makers’ (approved 5-8 May 2011) has identified
‘non-internalization of environmental and health costs’ as a market failure .(IPCC 2011)
2.1.5 Solar Power now Cheaper than Nuclear Energy in the US: One of the best kept secrets of
the power sector is the real cost of nuclear energy. The veil of secrecy that surrounds the sector is
impenetrable and it is next to impossible to find out the real cost of nuclear power. In addition,
nuclear power continues to enjoy heavy hidden subsidies despite the fact that it is more than forty
years old and should have been a mature industry now. However, a recent report (Blackburn and
Cunningham 2010) from the United States suggests that solar energy is now the better buy. This report
pertains to the state of North Carolina where electricity from new solar installations is now
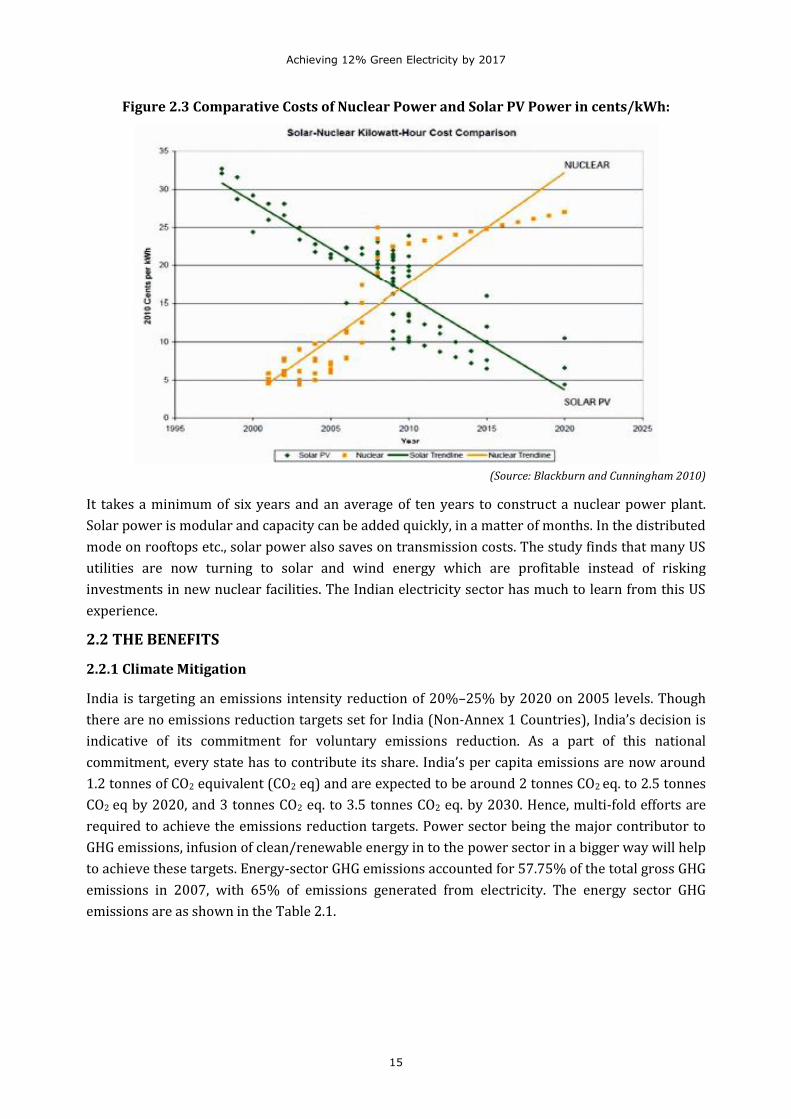
cheaper than electricity from proposed new nuclear plants. Figure 2.3 shows the historic crossover.
Power from nuclear had become more expensive by 2009/10 than that from solar PV. In fact, some
commercial-scale utility solar PV plants are already selling power at $0.14 per kWh. The trends
indicate that nuclear power costs could climb to almost $0.32/kWh by 2020, whereas solar PV
power costs would go down to below $0.04/kWh by then. The conclusions are based on a cost per
kWh comparison between electricity generated by nuclear reactors and solar photovoltaic systems
-both net of subsidies. The report derived a transparent method to obtain kilowatt-hour power
costs from project installation costs.
Achieving 12% Green Electricity by 2017
15
Figure 2.3 Comparative Costs of Nuclear Power and Solar PV Power in cents/kWh:
(Source: Blackburn and Cunningham 2010)
It takes a minimum of six years and an average of ten years to construct a nuclear power plant.
Solar power is modular and capacity can be added quickly, in a matter of months. In the distributed
mode on rooftops etc., solar power also saves on transmission costs. The study finds that many US
utilities are now turning to solar and wind energy which are profitable instead of risking
investments in new nuclear facilities. The Indian electricity sector has much to learn from this US
experience.
2.2 THE BENEFITS
2.2.1 Climate Mitigation
India is targeting an emissions intensity reduction of 20%–25% by 2020 on 2005 levels. Though
there are no emissions reduction targets set for India (Non-Annex 1 Countries), India’s decision is
indicative of its commitment for voluntary emissions reduction. As a part of this national
commitment, every state has to contribute its share. India’s per capita emissions are now around
1.2 tonnes of CO2 equivalent (CO2 eq) and are expected to be around 2 tonnes CO2 eq. to 2.5 tonnes
CO2 eq by 2020, and 3 tonnes CO2 eq. to 3.5 tonnes CO2 eq. by 2030. Hence, multi-fold efforts are
required to achieve the emissions reduction targets. Power sector being the major contributor to
GHG emissions, infusion of clean/renewable energy in to the power sector in a bigger way will help
to achieve these targets. Energy-sector GHG emissions accounted for 57.75% of the total gross GHG
emissions in 2007, with 65% of emissions generated from electricity. The energy sector GHG
emissions are as shown in the Table 2.1.
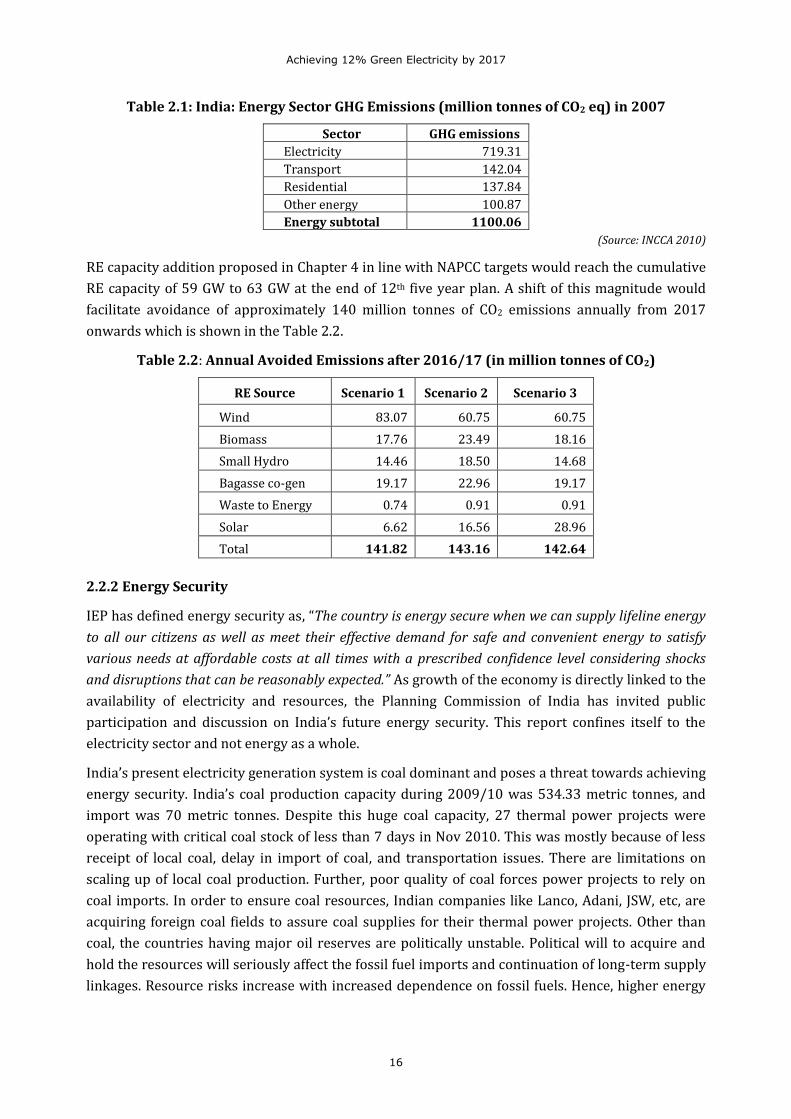
Achieving 12% Green Electricity by 2017
16
Table 2.1: India: Energy Sector GHG Emissions (million tonnes of CO2 eq) in 2007
Sector GHG emissions
Electricity 719.31
Transport 142.04
Residential 137.84
Other energy 100.87
Energy subtotal 1100.06
(Source: INCCA 2010)
RE capacity addition proposed in Chapter 4 in line with NAPCC targets would reach the cumulative
RE capacity of 59 GW to 63 GW at the end of 12th five year plan. A shift of this magnitude would
facilitate avoidance of approximately 140 million tonnes of CO2 emissions annually from 2017
onwards which is shown in the Table 2.2.
Table 2.2: Annual Avoided Emissions after 2016/17 (in million tonnes of CO2)
RE Source Scenario 1 Scenario 2 Scenario 3
Wind 83.07 60.75 60.75
Biomass 17.76 23.49 18.16
Small Hydro 14.46 18.50 14.68
Bagasse co-gen 19.17 22.96 19.17
Waste to Energy 0.74 0.91 0.91
Solar 6.62 16.56 28.96
Total 141.82 143.16 142.64
2.2.2 Energy Security
IEP has defined energy security as, “The country is energy secure when we can supply lifeline energy
to all our citizens as well as meet their effective demand for safe and convenient energy to satisfy
various needs at affordable costs at all times with a prescribed confidence level considering shocks
and disruptions that can be reasonably expected.” As growth of the economy is directly linked to the
availability of electricity and resources, the Planning Commission of India has invited public
participation and discussion on India’s future energy security. This report confines itself to the
electricity sector and not energy as a whole.
India’s present electricity generation system is coal dominant and poses a threat towards achieving
energy security. India’s coal production capacity during 2009/10 was 534.33 metric tonnes, and
import was 70 metric tonnes. Despite this huge coal capacity, 27 thermal power projects were
operating with critical coal stock of less than 7 days in Nov 2010. This was mostly because of less
receipt of local coal, delay in import of coal, and transportation issues. There are limitations on
scaling up of local coal production. Further, poor quality of coal forces power projects to rely on
coal imports. In order to ensure coal resources, Indian companies like Lanco, Adani, JSW, etc, are
acquiring foreign coal fields to assure coal supplies for their thermal power projects. Other than
coal, the countries having major oil reserves are politically unstable. Political will to acquire and
hold the resources will seriously affect the fossil fuel imports and continuation of long-term supply
linkages. Resource risks increase with increased dependence on fossil fuels. Hence, higher energy
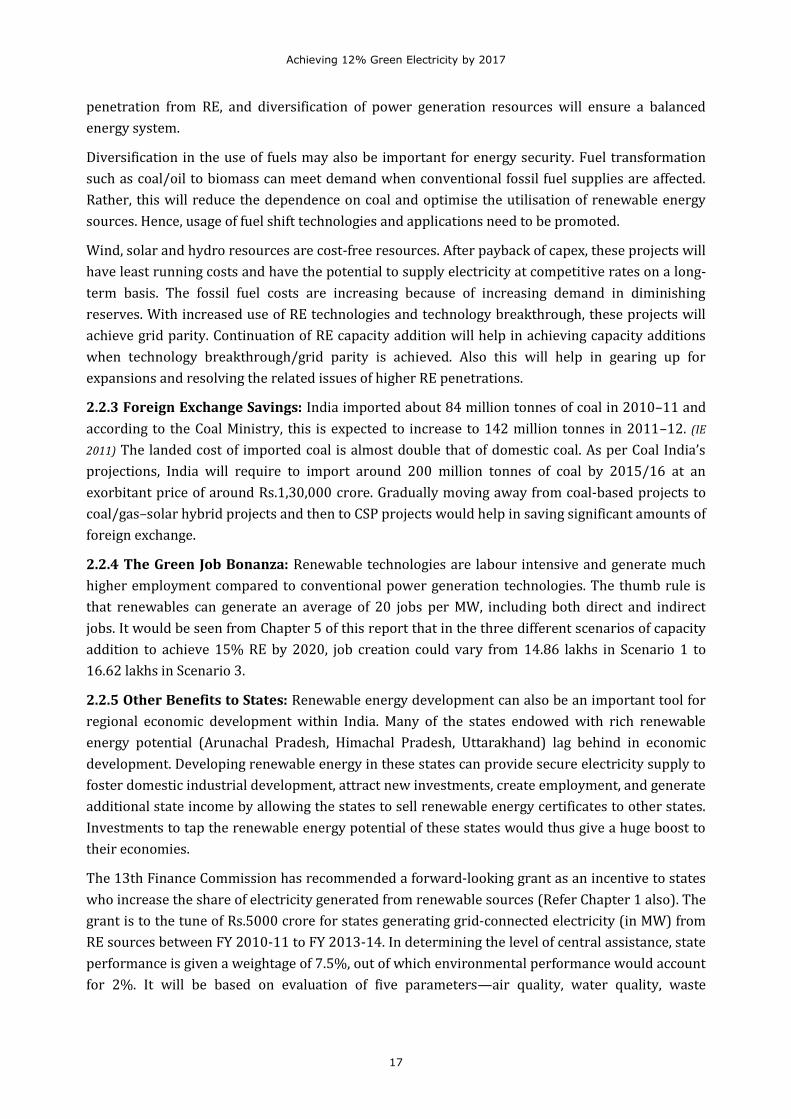
Achieving 12% Green Electricity by 2017
17
penetration from RE, and diversification of power generation resources will ensure a balanced
energy system.
Diversification in the use of fuels may also be important for energy security. Fuel transformation
such as coal/oil to biomass can meet demand when conventional fossil fuel supplies are affected.
Rather, this will reduce the dependence on coal and optimise the utilisation of renewable energy
sources. Hence, usage of fuel shift technologies and applications need to be promoted.
Wind, solar and hydro resources are cost-free resources. After payback of capex, these projects will
have least running costs and have the potential to supply electricity at competitive rates on a long-
term basis. The fossil fuel costs are increasing because of increasing demand in diminishing
reserves. With increased use of RE technologies and technology breakthrough, these projects will
achieve grid parity. Continuation of RE capacity addition will help in achieving capacity additions
when technology breakthrough/grid parity is achieved. Also this will help in gearing up for
expansions and resolving the related issues of higher RE penetrations.
2.2.3 Foreign Exchange Savings: India imported about 84 million tonnes of coal in 2010–11 and
according to the Coal Ministry, this is expected to increase to 142 million tonnes in 2011–12. (IE
2011) The landed cost of imported coal is almost double that of domestic coal. As per Coal India’s
projections, India will require to import around 200 million tonnes of coal by 2015/16 at an
exorbitant price of around Rs.1,30,000 crore. Gradually moving away from coal-based projects to
coal/gas–solar hybrid projects and then to CSP projects would help in saving significant amounts of
foreign exchange.
2.2.4 The Green Job Bonanza: Renewable technologies are labour intensive and generate much
higher employment compared to conventional power generation technologies. The thumb rule is
that renewables can generate an average of 20 jobs per MW, including both direct and indirect
jobs. It would be seen from Chapter 5 of this report that in the three different scenarios of capacity
addition to achieve 15% RE by 2020, job creation could vary from 14.86 lakhs in Scenario 1 to
16.62 lakhs in Scenario 3.
2.2.5 Other Benefits to States: Renewable energy development can also be an important tool for
regional economic development within India. Many of the states endowed with rich renewable
energy potential (Arunachal Pradesh, Himachal Pradesh, Uttarakhand) lag behind in economic
development. Developing renewable energy in these states can provide secure electricity supply to
foster domestic industrial development, attract new investments, create employment, and generate
additional state income by allowing the states to sell renewable energy certificates to other states.
Investments to tap the renewable energy potential of these states would thus give a huge boost to
their economies.
The 13th Finance Commission has recommended a forward-looking grant as an incentive to states
who increase the share of electricity generated from renewable sources (Refer Chapter 1 also). The
grant is to the tune of Rs.5000 crore for states generating grid-connected electricity (in MW) from
RE sources between FY 2010-11 to FY 2013-14. In determining the level of central assistance, state
performance is given a weightage of 7.5%, out of which environmental performance would account
for 2%. It will be based on evaluation of five parameters—air quality, water quality, waste

Achieving 12% Green Electricity by 2017
18
management, forest cover and climate change. Thus, any efforts of the states towards promotion of
RE-based power projects will be useful in obtaining maximum share of central grants in future.
2.2.6 Rural Infrastructure Development, Decentralization of Development: Conventional
power projects are centralized with huge power generation capacity and long transmission lines
reaching the load centres. On the other hand, the clean energy system is moving towards
decentralized power generation distributed across villages, cities and the states. Except for waste-
to-energy projects which are located in urban areas due to availability of the raw material, most of
the RE-powered projects including wind, solar, SHP, biomass and co-generation projects are
located mostly in interior rural areas. These RE projects help in creating infrastructure and
developing community facilities, besides creating direct and indirect jobs in rural areas. This also
leads to massive investment flow to these areas. Hence, development of renewables would be a
perfect complement to decentralized development and governance.
***
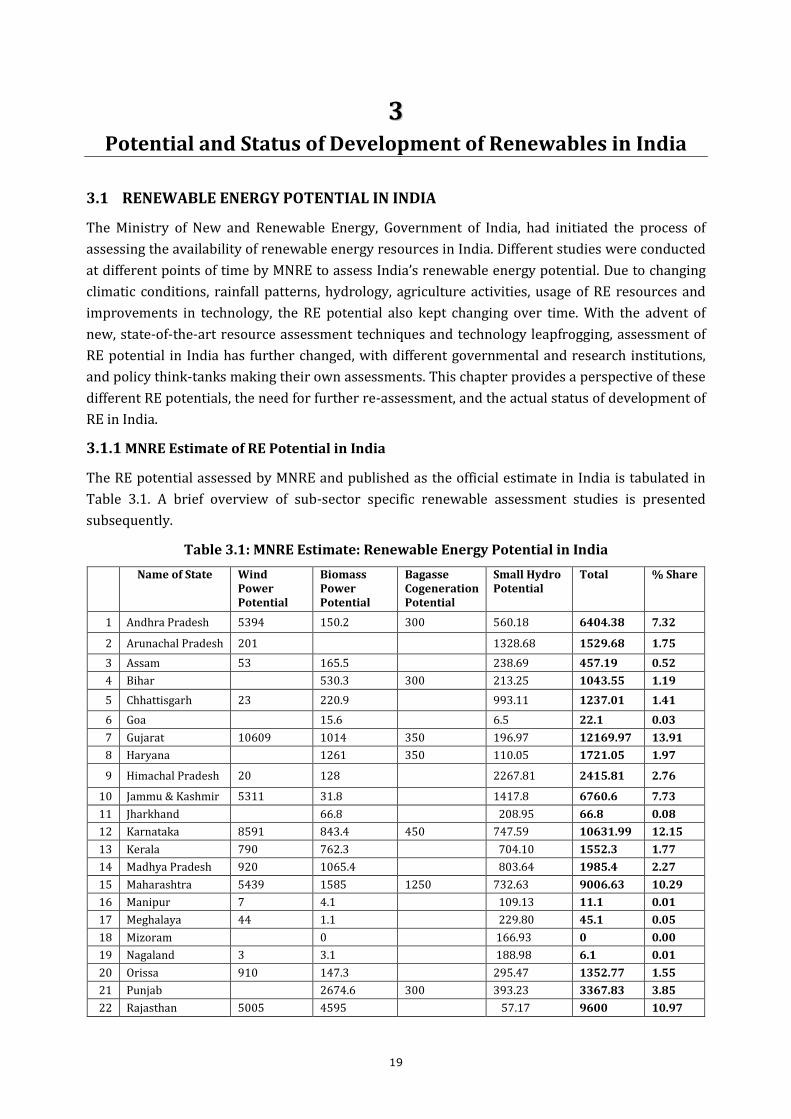
Achieving 12% Green Electricity by 2017
19
33
Potential and Status of Development of Renewables in India
3.1 RENEWABLE ENERGY POTENTIAL IN INDIA
The Ministry of New and Renewable Energy, Government of India, had initiated the process of
assessing the availability of renewable energy resources in India. Different studies were conducted
at different points of time by MNRE to assess India’s renewable energy potential. Due to changing
climatic conditions, rainfall patterns, hydrology, agriculture activities, usage of RE resources and
improvements in technology, the RE potential also kept changing over time. With the advent of
new, state-of-the-art resource assessment techniques and technology leapfrogging, assessment of
RE potential in India has further changed, with different governmental and research institutions,
and policy think-tanks making their own assessments. This chapter provides a perspective of these
different RE potentials, the need for further re-assessment, and the actual status of development of
RE in India.
3.1.1 MNRE Estimate of RE Potential in India
The RE potential assessed by MNRE and published as the official estimate in India is tabulated in
Table 3.1. A brief overview of sub-sector specific renewable assessment studies is presented
subsequently.
Table 3.1: MNRE Estimate: Renewable Energy Potential in India
Name of State Wind Power Potential
Biomass Power Potential
Bagasse Cogeneration Potential
Small Hydro Potential
Total % Share
1 Andhra Pradesh 5394 150.2 300 560.18 6404.38 7.32
2 Arunachal Pradesh 201 1328.68 1529.68 1.75
3 Assam 53 165.5 238.69 457.19 0.52
4 Bihar 530.3 300 213.25 1043.55 1.19
5 Chhattisgarh 23 220.9 993.11 1237.01 1.41
6 Goa 15.6 6.5 22.1 0.03
7 Gujarat 10609 1014 350 196.97 12169.97 13.91
8 Haryana 1261 350 110.05 1721.05 1.97
9 Himachal Pradesh 20 128 2267.81 2415.81 2.76
10 Jammu & Kashmir 5311 31.8 1417.8 6760.6 7.73
11 Jharkhand 66.8 208.95 66.8 0.08
12 Karnataka 8591 843.4 450 747.59 10631.99 12.15
13 Kerala 790 762.3 704.10 1552.3 1.77
14 Madhya Pradesh 920 1065.4 803.64 1985.4 2.27
15 Maharashtra 5439 1585 1250 732.63 9006.63 10.29
16 Manipur 7 4.1 109.13 11.1 0.01
17 Meghalaya 44 1.1 229.80 45.1 0.05
18 Mizoram 0 166.93 0 0.00
19 Nagaland 3 3.1 188.98 6.1 0.01
20 Orissa 910 147.3 295.47 1352.77 1.55
21 Punjab 2674.6 300 393.23 3367.83 3.85
22 Rajasthan 5005 4595 57.17 9600 10.97
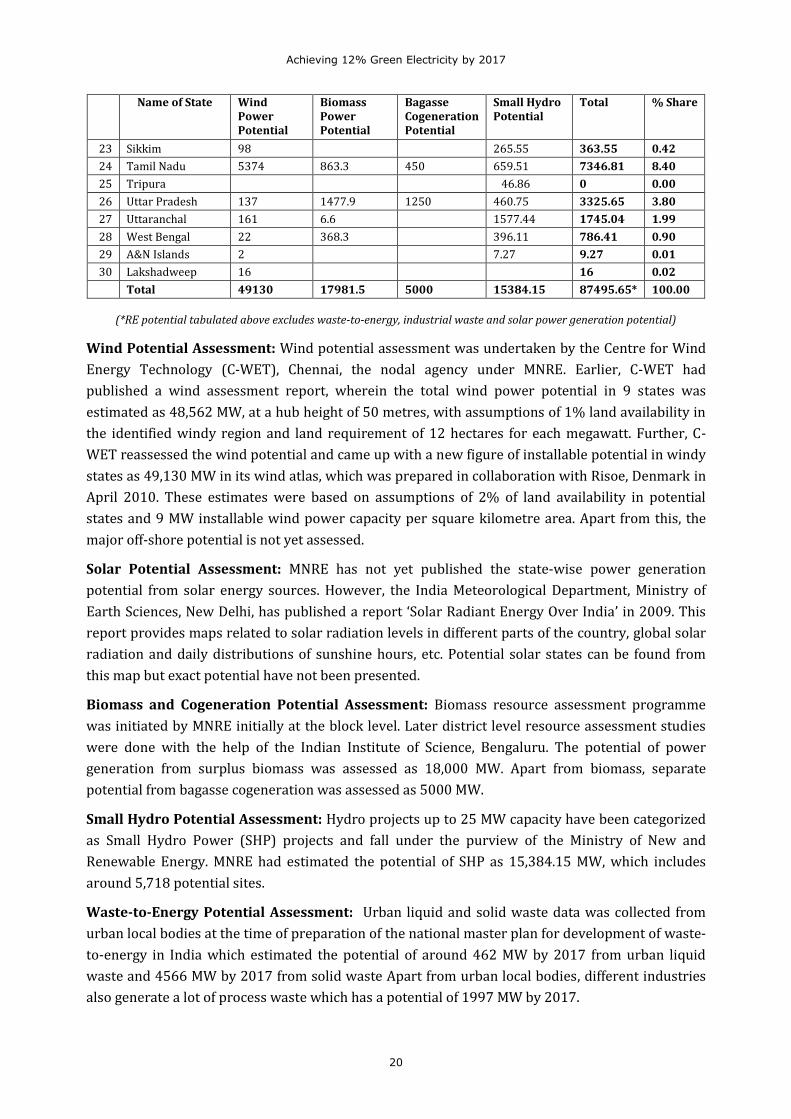
Achieving 12% Green Electricity by 2017
20
Name of State Wind Power Potential
Biomass Power Potential
Bagasse Cogeneration Potential
Small Hydro Potential
Total % Share
23 Sikkim 98 265.55 363.55 0.42
24 Tamil Nadu 5374 863.3 450 659.51 7346.81 8.40
25 Tripura 46.86 0 0.00
26 Uttar Pradesh 137 1477.9 1250 460.75 3325.65 3.80
27 Uttaranchal 161 6.6 1577.44 1745.04 1.99
28 West Bengal 22 368.3 396.11 786.41 0.90
29 A&N Islands 2 7.27 9.27 0.01
30 Lakshadweep 16 16 0.02
Total 49130 17981.5 5000 15384.15 87495.65* 100.00
(*RE potential tabulated above excludes waste-to-energy, industrial waste and solar power generation potential)
Wind Potential Assessment: Wind potential assessment was undertaken by the Centre for Wind
Energy Technology (C-WET), Chennai, the nodal agency under MNRE. Earlier, C-WET had
published a wind assessment report, wherein the total wind power potential in 9 states was
estimated as 48,562 MW, at a hub height of 50 metres, with assumptions of 1% land availability in
the identified windy region and land requirement of 12 hectares for each megawatt. Further, C-
WET reassessed the wind potential and came up with a new figure of installable potential in windy
states as 49,130 MW in its wind atlas, which was prepared in collaboration with Risoe, Denmark in
April 2010. These estimates were based on assumptions of 2% of land availability in potential
states and 9 MW installable wind power capacity per square kilometre area. Apart from this, the
major off-shore potential is not yet assessed.
Solar Potential Assessment: MNRE has not yet published the state-wise power generation
potential from solar energy sources. However, the India Meteorological Department, Ministry of
Earth Sciences, New Delhi, has published a report ‘Solar Radiant Energy Over India’ in 2009. This
report provides maps related to solar radiation levels in different parts of the country, global solar
radiation and daily distributions of sunshine hours, etc. Potential solar states can be found from
this map but exact potential have not been presented.
Biomass and Cogeneration Potential Assessment: Biomass resource assessment programme
was initiated by MNRE initially at the block level. Later district level resource assessment studies
were done with the help of the Indian Institute of Science, Bengaluru. The potential of power
generation from surplus biomass was assessed as 18,000 MW. Apart from biomass, separate
potential from bagasse cogeneration was assessed as 5000 MW.
Small Hydro Potential Assessment: Hydro projects up to 25 MW capacity have been categorized
as Small Hydro Power (SHP) projects and fall under the purview of the Ministry of New and
Renewable Energy. MNRE had estimated the potential of SHP as 15,384.15 MW, which includes
around 5,718 potential sites.
Waste-to-Energy Potential Assessment: Urban liquid and solid waste data was collected from
urban local bodies at the time of preparation of the national master plan for development of waste-
to-energy in India which estimated the potential of around 462 MW by 2017 from urban liquid
waste and 4566 MW by 2017 from solid waste Apart from urban local bodies, different industries
also generate a lot of process waste which has a potential of 1997 MW by 2017.
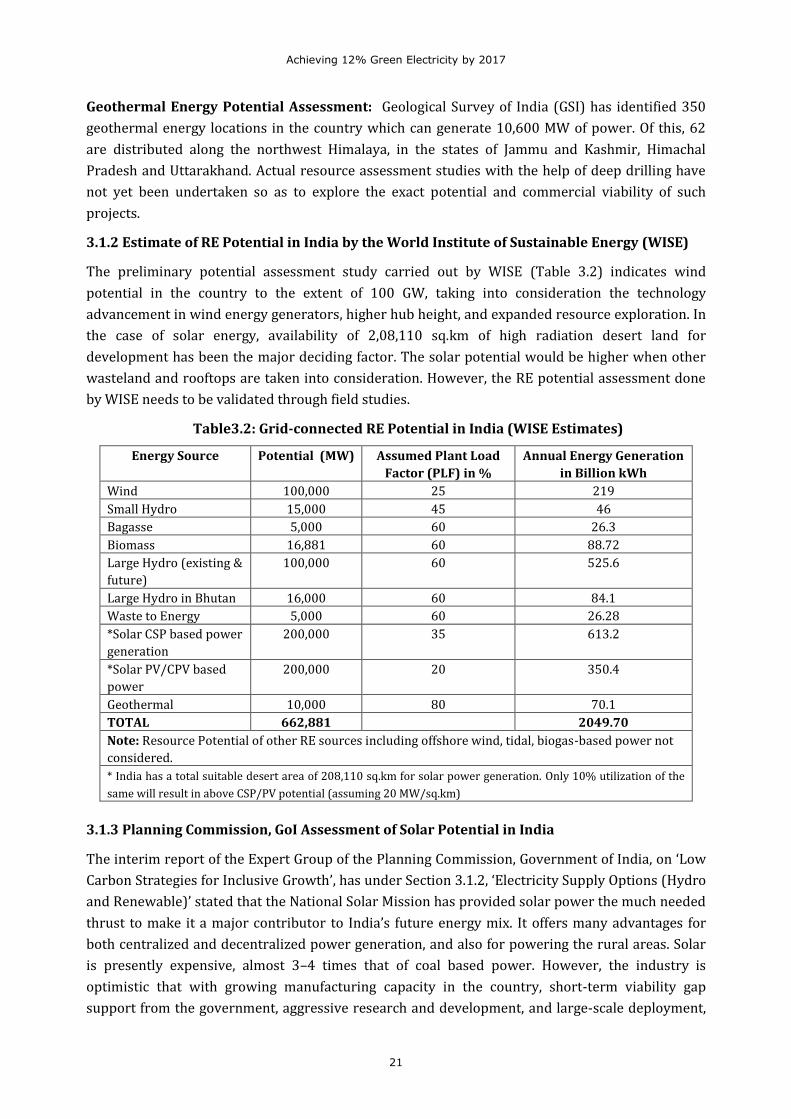
Achieving 12% Green Electricity by 2017
21
Geothermal Energy Potential Assessment: Geological Survey of India (GSI) has identified 350
geothermal energy locations in the country which can generate 10,600 MW of power. Of this, 62
are distributed along the northwest Himalaya, in the states of Jammu and Kashmir, Himachal
Pradesh and Uttarakhand. Actual resource assessment studies with the help of deep drilling have
not yet been undertaken so as to explore the exact potential and commercial viability of such
projects.
3.1.2 Estimate of RE Potential in India by the World Institute of Sustainable Energy (WISE)
The preliminary potential assessment study carried out by WISE (Table 3.2) indicates wind
potential in the country to the extent of 100 GW, taking into consideration the technology
advancement in wind energy generators, higher hub height, and expanded resource exploration. In
the case of solar energy, availability of 2,08,110 sq.km of high radiation desert land for
development has been the major deciding factor. The solar potential would be higher when other
wasteland and rooftops are taken into consideration. However, the RE potential assessment done
by WISE needs to be validated through field studies.
Table3.2: Grid-connected RE Potential in India (WISE Estimates)
Energy Source Potential (MW) Assumed Plant Load
Factor (PLF) in %
Annual Energy Generation
in Billion kWh
Wind 100,000 25 219
Small Hydro 15,000 45 46
Bagasse 5,000 60 26.3
Biomass 16,881 60 88.72
Large Hydro (existing &
future)
100,000 60 525.6
Large Hydro in Bhutan 16,000 60 84.1
Waste to Energy 5,000 60 26.28
*Solar CSP based power
generation
200,000 35 613.2
*Solar PV/CPV based
power
200,000 20 350.4
Geothermal 10,000 80 70.1
TOTAL 662,881 2049.70
Note: Resource Potential of other RE sources including offshore wind, tidal, biogas-based power not
considered.
* India has a total suitable desert area of 208,110 sq.km for solar power generation. Only 10% utilization of the
same will result in above CSP/PV potential (assuming 20 MW/sq.km)
3.1.3 Planning Commission, GoI Assessment of Solar Potential in India
The interim report of the Expert Group of the Planning Commission, Government of India, on ‘Low
Carbon Strategies for Inclusive Growth’, has under Section 3.1.2, ‘Electricity Supply Options (Hydro
and Renewable)’ stated that the National Solar Mission has provided solar power the much needed
thrust to make it a major contributor to India’s future energy mix. It offers many advantages for
both centralized and decentralized power generation, and also for powering the rural areas. Solar
is presently expensive, almost 3–4 times that of coal based power. However, the industry is
optimistic that with growing manufacturing capacity in the country, short-term viability gap
support from the government, aggressive research and development, and large-scale deployment,
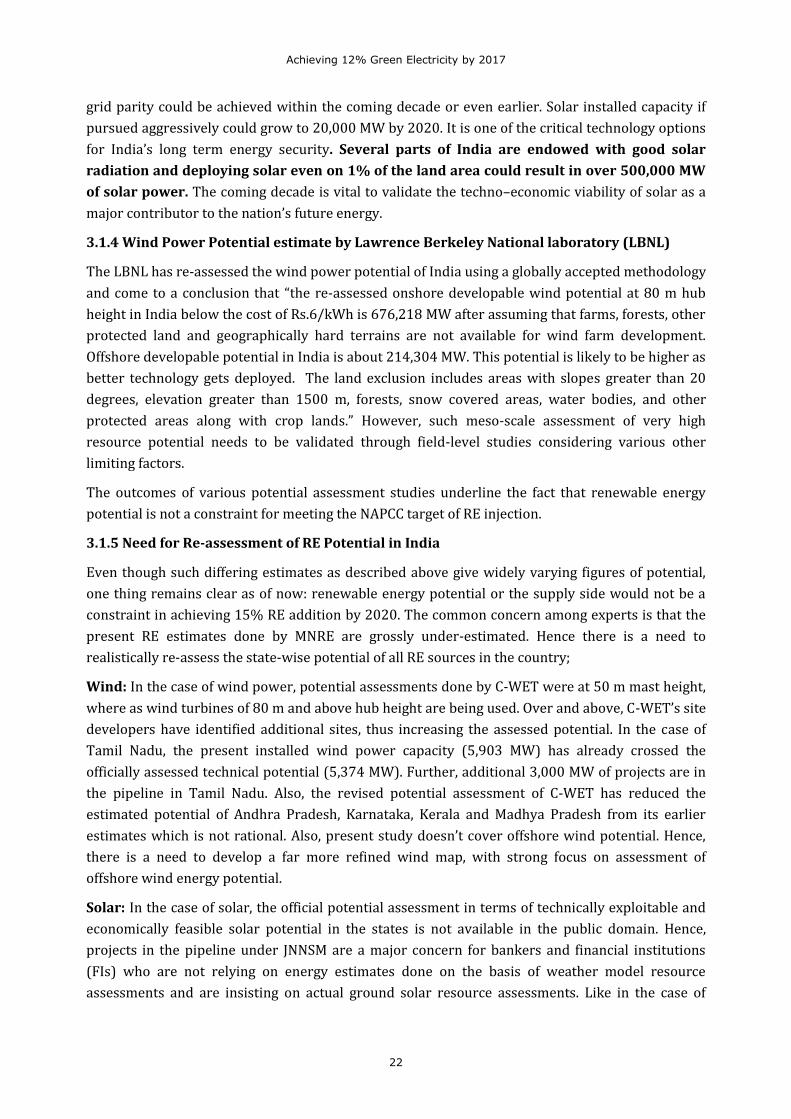
Achieving 12% Green Electricity by 2017
22
grid parity could be achieved within the coming decade or even earlier. Solar installed capacity if
pursued aggressively could grow to 20,000 MW by 2020. It is one of the critical technology options
for India’s long term energy security. Several parts of India are endowed with good solar
radiation and deploying solar even on 1% of the land area could result in over 500,000 MW
of solar power. The coming decade is vital to validate the techno–economic viability of solar as a
major contributor to the nation’s future energy.
3.1.4 Wind Power Potential estimate by Lawrence Berkeley National laboratory (LBNL)
The LBNL has re-assessed the wind power potential of India using a globally accepted methodology
and come to a conclusion that “the re-assessed onshore developable wind potential at 80 m hub
height in India below the cost of Rs.6/kWh is 676,218 MW after assuming that farms, forests, other
protected land and geographically hard terrains are not available for wind farm development.
Offshore developable potential in India is about 214,304 MW. This potential is likely to be higher as
better technology gets deployed. The land exclusion includes areas with slopes greater than 20
degrees, elevation greater than 1500 m, forests, snow covered areas, water bodies, and other
protected areas along with crop lands.” However, such meso-scale assessment of very high
resource potential needs to be validated through field-level studies considering various other
limiting factors.
The outcomes of various potential assessment studies underline the fact that renewable energy
potential is not a constraint for meeting the NAPCC target of RE injection.
3.1.5 Need for Re-assessment of RE Potential in India
Even though such differing estimates as described above give widely varying figures of potential,
one thing remains clear as of now: renewable energy potential or the supply side would not be a
constraint in achieving 15% RE addition by 2020. The common concern among experts is that the
present RE estimates done by MNRE are grossly under-estimated. Hence there is a need to
realistically re-assess the state-wise potential of all RE sources in the country;
Wind: In the case of wind power, potential assessments done by C-WET were at 50 m mast height,
where as wind turbines of 80 m and above hub height are being used. Over and above, C-WET’s site
developers have identified additional sites, thus increasing the assessed potential. In the case of
Tamil Nadu, the present installed wind power capacity (5,903 MW) has already crossed the
officially assessed technical potential (5,374 MW). Further, additional 3,000 MW of projects are in
the pipeline in Tamil Nadu. Also, the revised potential assessment of C-WET has reduced the
estimated potential of Andhra Pradesh, Karnataka, Kerala and Madhya Pradesh from its earlier
estimates which is not rational. Also, present study doesn’t cover offshore wind potential. Hence,
there is a need to develop a far more refined wind map, with strong focus on assessment of
offshore wind energy potential.
Solar: In the case of solar, the official potential assessment in terms of technically exploitable and
economically feasible solar potential in the states is not available in the public domain. Hence,
projects in the pipeline under JNNSM are a major concern for bankers and financial institutions
(FIs) who are not relying on energy estimates done on the basis of weather model resource
assessments and are insisting on actual ground solar resource assessments. Like in the case of
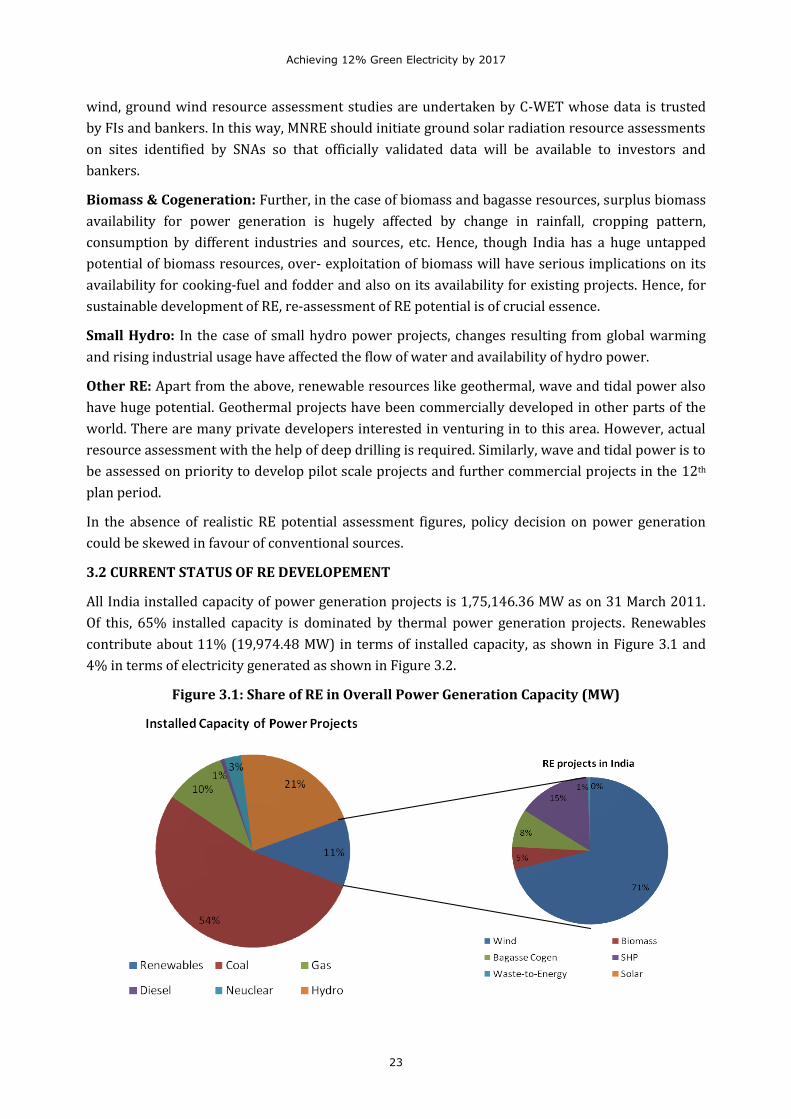
Achieving 12% Green Electricity by 2017
23
wind, ground wind resource assessment studies are undertaken by C-WET whose data is trusted
by FIs and bankers. In this way, MNRE should initiate ground solar radiation resource assessments
on sites identified by SNAs so that officially validated data will be available to investors and
bankers.
Biomass & Cogeneration: Further, in the case of biomass and bagasse resources, surplus biomass
availability for power generation is hugely affected by change in rainfall, cropping pattern,
consumption by different industries and sources, etc. Hence, though India has a huge untapped
potential of biomass resources, over- exploitation of biomass will have serious implications on its
availability for cooking-fuel and fodder and also on its availability for existing projects. Hence, for
sustainable development of RE, re-assessment of RE potential is of crucial essence.
Small Hydro: In the case of small hydro power projects, changes resulting from global warming
and rising industrial usage have affected the flow of water and availability of hydro power.
Other RE: Apart from the above, renewable resources like geothermal, wave and tidal power also
have huge potential. Geothermal projects have been commercially developed in other parts of the
world. There are many private developers interested in venturing in to this area. However, actual
resource assessment with the help of deep drilling is required. Similarly, wave and tidal power is to
be assessed on priority to develop pilot scale projects and further commercial projects in the 12th
plan period.
In the absence of realistic RE potential assessment figures, policy decision on power generation
could be skewed in favour of conventional sources.
3.2 CURRENT STATUS OF RE DEVELOPEMENT
All India installed capacity of power generation projects is 1,75,146.36 MW as on 31 March 2011.
Of this, 65% installed capacity is dominated by thermal power generation projects. Renewables
contribute about 11% (19,974.48 MW) in terms of installed capacity, as shown in Figure 3.1 and
4% in terms of electricity generated as shown in Figure 3.2.
Figure 3.1: Share of RE in Overall Power Generation Capacity (MW)
Achieving 12% Green Electricity by 2017
24
Figure 3.2: Share of RE Generation in Overall Power Generation (MU)
(Source: CEA, MNRE 2011)
Wind: Of the 19,974.48 MW of installed renewable capacity, wind power contributes 71%. This
sector has received continuous state and central government support, preferential feed-in-tariff
and tax sops. Wind technology is well commercialised. The sector has seen many new entrants in
the recent past in the wind turbine manufacturing segment with MW class wind turbines. Most of
the Class I sites have been explored, leaving behind Class II and Class III sites. Designing the project
on such sites and achieving higher generation is a huge challenge. Acquisition of private land,
obtaining forest clearances, development of infrastructure on complex terrains, implementation of
evacuation infrastructure, identification of new sites for development and scheduling and
forecasting generations are some of the challenges faced by this sector.
Small Hydro Power: Small hydro projects have achieved the cumulative capacity addition of
3042.63 MW. However, there is still huge untapped potential to be achieved out of the 15 GW
assessed potential. SHP technology is also well established and commercialised and has low
running cost. Development in this sector has been relatively slow because of time-consuming land
acquisition and forest clearance procedures, lack of clear policy for private sector participation in
some states and delay in getting project clearances.
Biomass: Biomass power projects have the highest PLF among all RE technologies. About 997.10
MW of biomass power projects and 1667.53 MW of bagasse co-generation projects have been
commissioned in India. Biomass power is also unexplored to a large extent, though the technology
is proven. State government support to co-operative sugar factories through the ‘Urjankur Nidhi’ in
Maharashtra has encouraged such projects. The increased use of biomass by other industries,
changing cropping pattern, and reduction in cultivable agriculture land has reduced the surplus
available biomass for power generation. Thus, absence of assured supply chain, presence of
multiple middlemen, the absence of well-defined agro-waste supply contracts, difficulties in
acquiring wastelands for energy plantation are some of the teething problems of the sector.
Achieving 12% Green Electricity by 2017
25
Further, increased demand has inflated the biomass prices, particularly that of rice husk which is
threatening the economical operation of biomass power projects.
Waste-to-Energy: Despite having Municipal Solid Waste (MSW) Management & Handling Rules
2000 in place which obligates the Municipal Corporations to scientifically dispose the waste, these
projects are not picking up. As of 31 March 2011, only 72.46 MW of waste-to-energy projects have
been installed in India. Success stories of running projects in Andhra Pradesh, and huge subsidies
and incentives from the Central Govt could not promote this sector. Increasing waste with rising
population and improved lifestyle, public agitations against open dumping, unavailability of further
sites in suburbs for waste dumping and scientifically disposing such waste is a critical task in front
of corporations. However, though large quantity of waste is available for power generation, there is
no regular supply of processed and segregated waste for energy generation projects.
Solar Power: Government commitments through JNNSM for development of long-term solar
projects has attracted a large number of investors towards this sector in a short time frame. About
37.66 MW of projects have been commissioned in India within the last two years, courtesy the
semiconductor policy, solar SEZ, separate RPO for solar, feed-in-tariff, etc. Development of
evacuation system, land acquisition, bankable PPA, lack of availability of measured solar data,
availability of steam turbine for solar power projects are some of the major barriers for
development of solar projects in India.
In 2010–11, India emerged as the third largest market for wind power after China and US. Similar
potential exists in India to emerge as a world leader in solar energy development. Our country has
taken the first steps in this direction by announcing JNNSM targets and beginning their
implementation. A much bigger emphasis on wind and solar energy development, along with other
renewables can catapult India to be a leading green power producer, thus ensuring our long-term
energy security and autonomy.
(Source MNRE)
***

Achieving 12% Green Electricity by 2017
26
Achieving 12% Green Electricity by 2017
27
44
Capacity Addition Required for Achieving
12% RE by 2017 and 15% RE by 2020
As part of the preparations for launching the 12th Five Year Plan, the Planning Commission,
Government of India has identified twelve ‘strategy challenges’ in some core areas. The Planning
Commission has briefly described these ‘strategy challenges’ and invited responses from the public.
The Commission has decided that the 12th Plan Approach Paper will be evolved through a web-
based consultative process to finalise the major targets and the key challenges in meeting them,
and the broad approach that must be followed to achieve the stated objectives of the Plan. This
Approach Paper will then be approved by the Cabinet and the National Development Council. The
twelve strategy challenges are listed below:
i. Enhancing Capacity for Growth
ii. Enhancing Skills and Faster Generation of Employment
iii. Managing the Environment
iv. Markets for Efficiency and Inclusion
v. Decentralisation, Empowerment and Information
vi. Technology and Innovation
vii. Securing the Energy Future for India
viii. Accelerated Development of Transport Infrastructure
ix. Rural Transformation and Sustained Growth of Agriculture
x. Managing Urbanization
xi. Improved Access to Quality Education
xii. Better Preventive and Curative Health Care
Out of the above twelve strategy challenges, ‘Securing the Energy Future for India’ encompasses
the national targets for renewable energy during the 12th Five Year Plan period.
The National Action Plan on Climate Change has set a goal of a 1% annual increase in renewable
energy in the national grid starting from 5% in FY 2009-10 and increasing to 15% of the energy
mix of India by 2020. The share of renewable energy is currently 4% of the energy mix as on March
2011. This 15% RE by 2020 has thus effectively become a ‘National RPO’ though it is not legally
mandated. After the announcement of the NAPCC (June 2008) and the JNNSM (November 2009),
various initiatives have been taken by the government, the Central Electricity Regulatory
Commission and SERCs, to set the momentum to achieve this target. However, there is no clear
indication or clarity on the grid connected RE capacities that need to be added to achieve this 15%.
This chapter analyses these aspects and projects three different scenarios for RE capacity addition.
Achieving 12% Green Electricity by 2017
28
4.1 THE APPROACH AND METHODOLOGY
Approach: The approach in this study is to see how this national target can be achieved (and not
whether it can be achieved) and to decide the RE capacity additions required to achieve this target.
The study aims to:
Verify adequacy of the government planned capacity additions for 12th and 13th plan periods to
meet 15 % RE injection by 2020 targeted under the NAPCC;
Verify adequacy of the state-level RPO targets in meeting the national RPO;
Review the state–wise RE potential / installed capacity and unexplored potential in order to
ascertain the potential RE sources / states which could contribute substantially;
Project likely RE capacity addition scenarios at Pan India level and at state levels to match
NAPCC target;
Assess the impact of these capacity addition scenarios on average power procurement cost
(APPC) (Pan-India basis).
Adequacy of the government-planned RE capacity addition over 11th and 12th Plan periods has also
been verified by comparing it with the anticipated renewable energy generation envisaged in the
NAPCC. The possible renewable energy injection into the national grid due to mandatory RPO
targets specified by 25 SERCs in India has been worked out considering the state-wise solar and
non-solar RPO targets and state-wise future energy consumption projected by the Central
Electricity Authority (CEA).
Methodology: With the broad objective of meeting the NAPCC target of 15% RE by 2020, different
RE capacity addition scenarios were considered, keeping in mind the availability and commercial
potential of each RE resource in India and finally three scenarios were shortlisted viz: (1) Wind
dominant scenario; (2) SHP-Biomass dominant (on CAGR basis) scenario (3) Solar dominant
scenario. Under each of these scenarios, a particular RE source is identified as a prominent
resource for future capacity addition to meet NAPCC target. A Progressive growth rate was
considered for such prominent RE source while the share of other RE sources has been defined
based on their historical growth rates. By recognizing the various limitations of present officially
assessed RE potential and considering the availability of vast solar resources in India, resource
availability is not considered as a constraint for meeting the NAPCC target.
WISE has also specifically made a request to the state governments/State Nodal Agencies of RE
potential states to share the data of capacity addition plans in their respective states. However, the
response has been very poor and only a few states have responded and shared limited data about
capacity addition over the next two-three years. Secondary data about state level future RE
capacity addition, RE projects in pipeline, quantum RE addition proposed in the applications
received for setting up the RE projects by SNAs, etc., has been collected from various sources.
However, in view of availability of limited data, the RE capacity addition projections made under
different scenarios are developed based on importance of RE technology from the point of energy
security, present stage of development of RE technology, un- tapped RE potential, future cost
reduction trends and scalability, etc. The historical annual capacity addition over the past decade,
Achieving 12% Green Electricity by 2017
29
as well as capacity addition in the recent past, has also been studied before projecting capacity
addition scenarios.
Consequently, the most beneficial scenario from the three has been extended at the state level for
working out possible state-wise, RE technology-wise contribution towards meeting the national
RPO of 15%. The state-wise, non solar RE technology mix is determined on the basis of
preparedness of the respective state in terms of policy and regulatory support as well as resource
availability and past growth records. Whereas, the solar capacity allocation within the states is
governed by the availability of solar radiation, total geographical area and wasteland.
4.2. THE DIFFERENT TARGETS & PLANS
4.2.1. MNRE Planned Capacity Addition for 11th, 12th, & 13th Plan periods
Prior to the recent developments like the NAPCC and JNNSM, the Working Group on New and
Renewable Energy for the 11th plan had specified a targeted capacity addition for the 11th plan
period and projected capacity addition for the 12th and 13th five year plans for RE technologies
other than solar. Same is reproduced in the following Table 4.1.
Table 4.1: Planned capacity addition for 11th, 12th, & 13th Five Year Plan periods
Source 11th Plan ( 2007-12) 12 & 13th Plan (2012-22) Total
Wind 10500 MW 22500 MW 33000 MW
SHP 1400 MW 3140 MW 4540 MW
Bio-energy 2100 MW 4363 MW 6463 MW
Total 44003 MW
(Source : Working Group on New and Renewable Energy for the 11th five year Plan (2007-12), Planning Commission , GoI)
4.2.2. The Jawaharlal Nehru National Solar Mission Target
Under the JNNSM, ambitious targets have been announced for solar energy development. The
Mission will be implemented in three stages up to 2022 leading to an installed capacity of 20,000
MW of grid-connected solar power capacity, 2000 MW of off-grid solar applications, and 20 million
sq.m solar thermal collector area. The immediate aim of the Mission is to focus on setting up an
enabling environment for solar based grid-connected and off-grid technologies, both at the
centralised and decentralized levels. The targets are mentioned in Table 4.2.
Table 4.2 Targets specified under JNNSM
Application Segment Target
Phase I (2010-13) Phase II ( 2013-17) Phase III (2017 – 22)
Solar Thermal Collector 7 million sq m 15 million sq m. 20 million sq.m
Off-grid solar Applications 200 MW 1000 MW 2000 MW
Grid power including roof
top and small plants
1,100 MW
4000–10000 MW 20000 MW
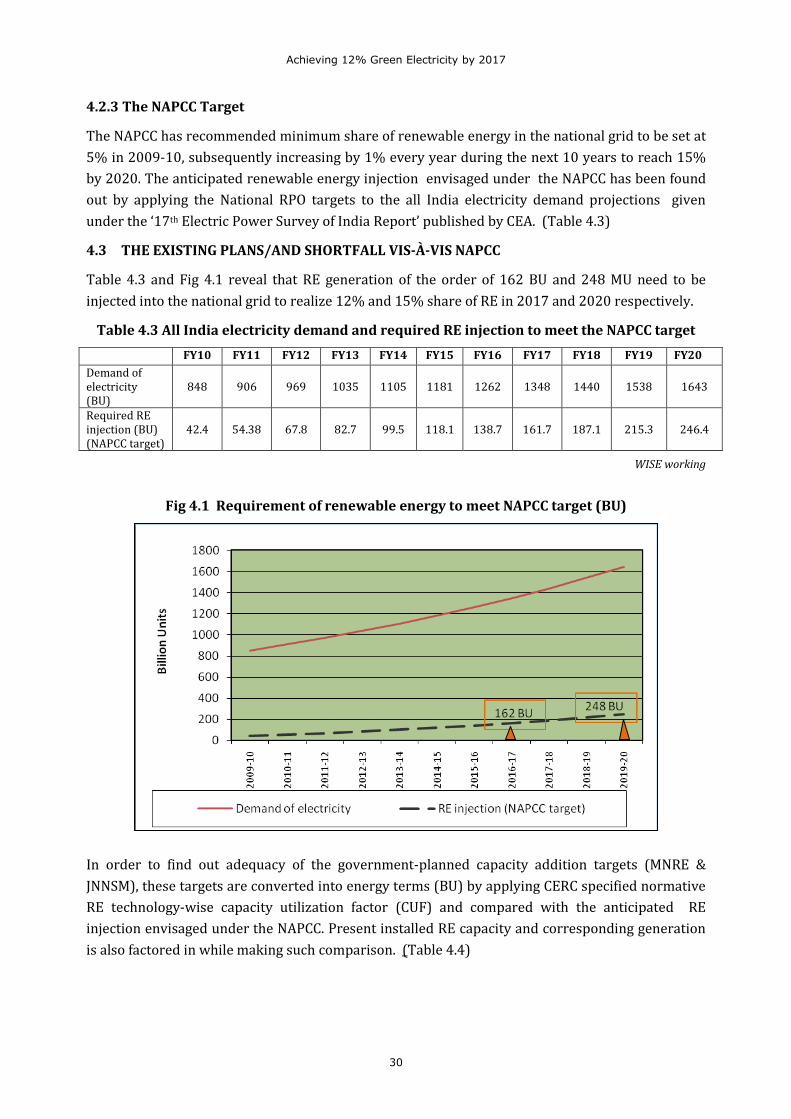
Achieving 12% Green Electricity by 2017
30
4.2.3 The NAPCC Target
The NAPCC has recommended minimum share of renewable energy in the national grid to be set at
5% in 2009-10, subsequently increasing by 1% every year during the next 10 years to reach 15%
by 2020. The anticipated renewable energy injection envisaged under the NAPCC has been found
out by applying the National RPO targets to the all India electricity demand projections given
under the ‘17th Electric Power Survey of India Report’ published by CEA. (Table 4.3)
4.3 THE EXISTING PLANS/AND SHORTFALL VIS-À-VIS NAPCC
Table 4.3 and Fig 4.1 reveal that RE generation of the order of 162 BU and 248 MU need to be
injected into the national grid to realize 12% and 15% share of RE in 2017 and 2020 respectively.
Table 4.3 All India electricity demand and required RE injection to meet the NAPCC target
FY10 FY11 FY12 FY13 FY14 FY15 FY16 FY17 FY18 FY19 FY20
Demand of electricity (BU)
848 906 969 1035 1105 1181 1262 1348 1440 1538 1643
Required RE injection (BU) (NAPCC target)
42.4 54.38 67.8 82.7 99.5 118.1 138.7 161.7 187.1 215.3 246.4
WISE working
Fig 4.1 Requirement of renewable energy to meet NAPCC target (BU)
In order to find out adequacy of the government-planned capacity addition targets (MNRE &
JNNSM), these targets are converted into energy terms (BU) by applying CERC specified normative
RE technology-wise capacity utilization factor (CUF) and compared with the anticipated RE
injection envisaged under the NAPCC. Present installed RE capacity and corresponding generation
is also factored in while making such comparison. (Table 4.4)
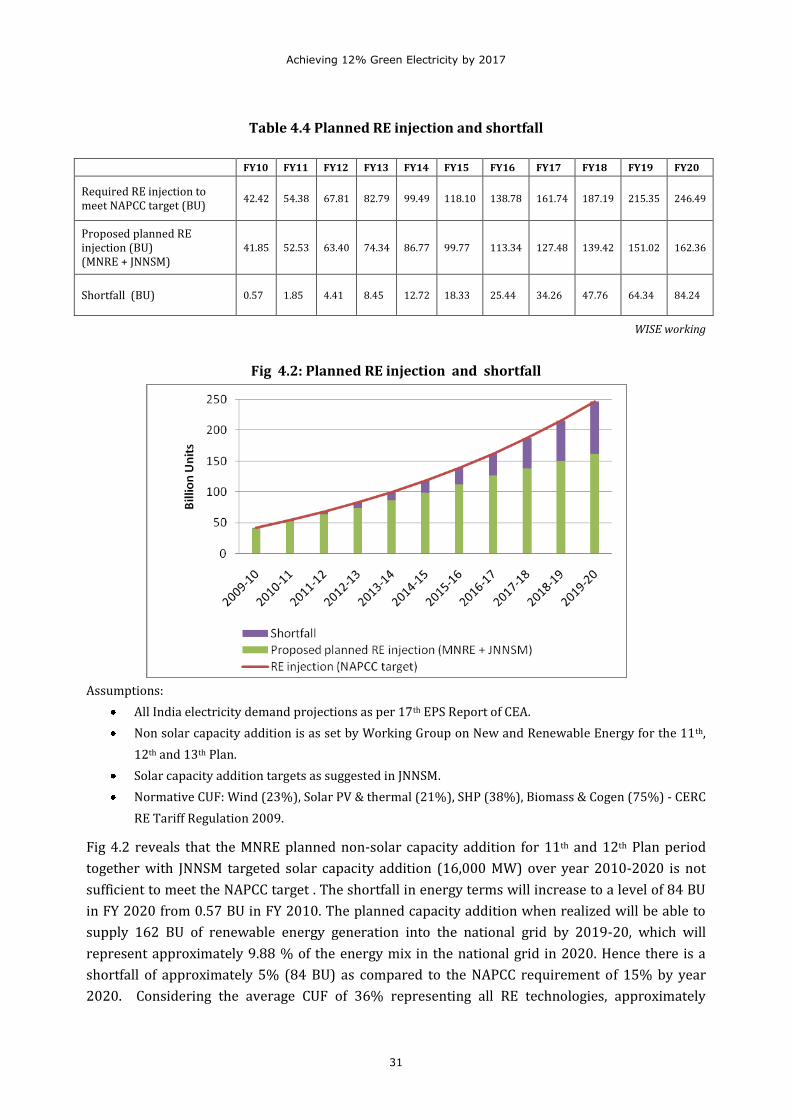
Achieving 12% Green Electricity by 2017
31
Table 4.4 Planned RE injection and shortfall
FY10 FY11 FY12 FY13 FY14 FY15 FY16 FY17 FY18 FY19 FY20
Required RE injection to meet NAPCC target (BU)
42.42 54.38 67.81 82.79 99.49 118.10 138.78 161.74 187.19 215.35 246.49
Proposed planned RE injection (BU) (MNRE + JNNSM)
41.85 52.53 63.40 74.34 86.77 99.77 113.34 127.48 139.42 151.02 162.36
Shortfall (BU) 0.57 1.85 4.41 8.45 12.72 18.33 25.44 34.26 47.76 64.34 84.24
WISE working
Fig 4.2: Planned RE injection and shortfall
Assumptions:
All India electricity demand projections as per 17th EPS Report of CEA.
Non solar capacity addition is as set by Working Group on New and Renewable Energy for the 11th,
12th and 13th Plan.
Solar capacity addition targets as suggested in JNNSM.
Normative CUF: Wind (23%), Solar PV & thermal (21%), SHP (38%), Biomass & Cogen (75%) - CERC
RE Tariff Regulation 2009.
Fig 4.2 reveals that the MNRE planned non-solar capacity addition for 11th and 12th Plan period
together with JNNSM targeted solar capacity addition (16,000 MW) over year 2010-2020 is not
sufficient to meet the NAPCC target . The shortfall in energy terms will increase to a level of 84 BU
in FY 2020 from 0.57 BU in FY 2010. The planned capacity addition when realized will be able to
supply 162 BU of renewable energy generation into the national grid by 2019-20, which will
represent approximately 9.88 % of the energy mix in the national grid in 2020. Hence there is a
shortfall of approximately 5% (84 BU) as compared to the NAPCC requirement of 15% by year
2020. Considering the average CUF of 36% representing all RE technologies, approximately
Achieving 12% Green Electricity by 2017
32
additional 26,000 MW RE capacity over and above planned RE capacity (MNRE & JNNSM) is
required to overcome the shortfall by year 2020. This indicates that approximate cumulative RE
capacity installation of 82,000 MW is required to be put in place by FY 2020 to meet the NAPCC
target which may be subject to change, according to the proportion of different RE technologies in
the energy mix.
Therefore, originally planned RE capacity addition by the working group will have to be revised to
achieve the 12% and 15% RE penetration by FY 2017 and 2020 respectively. The revision in
planned RE capacity in 12th and 13th Plans is still possible as the 12th plan Working Group Report
on RE is yet to be finalized.
4.4. CAPACITY ADDITION SCENARIOS
In Chapter 3 of the report, we had seen that India has enough renewable energy potential to power
our sustainable economic development. So overall, there is no supply side problem in achieving the
targets. While working out the supply-side figures under three scenarios, the following RE
technology–wise key considerations have been taken into account.
4.4.1. Key considerations
Wind: The Indian wind market grew by almost 68% on a year-on-year basis with around 2,300
MW of new wind capacity installed during FY 2010-11. This made India the third largest annual
market after China and the USA for 2010. With more than 14 GW of total installed capacity at the
end of FY 2010-11, India ranks fifth in the world in terms of cumulative installed capacity. During
the first four years of the 11th Plan period ending March 2011, India added 7.04 GW of wind power
capacity. With over a year to go before the current plan period is over, it is very likely that Indian
wind power installations will meet and exceed the 11th plan-period target of 10,500 MW.
Considering the fact that wind is a mature technology and there is no supply side constraint, an
accelerated growth rate slightly more than advanced scenario projected by the Global Wind Energy
Council (GWEC) and WISE in the ‘Indian Wind Energy Outlook 2011’ is considered under
Scenario 1 which is a ‘wind dominant scenario’. For Scenario 2 and Scenario 3, a moderate
growth rate based on historical growth is considered for projecting the likely wind capacity
addition during year 2010-2020. (IWE 2011)
Biomass: While projecting the capacity addition targets for biomass, due weightage has been given
to the critical issue of the reliability of the assessed potential of biomass. The potential estimated
by MNRE / Indian Institute of Science in year 2000 may not represent the real developable
potential because over the past decade, the pattern of alternate usages of biomass has altered
significantly, affecting the availability of surplus biomass, and in turn, the potential for biomass-
based power projects. Other critical issues hampering the development of biomass-based power
projects is the underdeveloped fuel supply chain and presence of multiple middle men, resulting in
unprecedented hike in the fuel price.
Co-generation: A moderate growth rate below the historical growth rate has been considered in
all three scenarios, since our assessment shows that the present assessed co-generation potential
will be exhausted by the end of FY 2020.
Achieving 12% Green Electricity by 2017
33
SHP: Where SHP is concerned, some of the issues like long delay in getting the clearances, absence
of reliable hydrological data, decrease in run-off due to ecological destruction, land acquisition
problems, and lack of clear policy for private sector participation has been posing hurdles in its
development since the past several years. Above limitations with regard to SHP and biomass
technology has been kept in mind. Under Scenario 2, a moderate growth rate of Biomass–SHP
which is more than the historical growth rate has been considered. For Scenarios 1 and 3, growth
rate lower than historical growth rate has been considered.
Solar: The capacity addition targets specified under Phase I, II & III of the JNNSM are considered to
be realized during the stipulated time frame in all three scenarios. However under scenario I, the
solar capacity addition targets are restricted to lower limit specified under JNNSM (4000 MW) by
2017 in order to reduce the impact on pan-India APPC. The state-wise solar power development in
terms of target fixation/number of applications received for setting up projects / clearances given
by state government for setting the project has also been studied in detail. Considering the state
/central government initiatives for solar power development, the overwhelming response received
for JNNSM Phase 1 bidding, the capital cost reduction over last three years at national level, and the
future cost reduction projections published by several reputed international institutions, an
additional 19,490 MW capacity addition over and above JNNSM target has been considered under
Scenario 3 (solar dominant).
As per an analysis carried out by WISE based on all India electricity demand projected by CEA and
normative CUF of solar PV and CSP projects, total 31213 MW cumulative installed capacity needs to
be put in place by 2022 in order to meet the solar RPO of 3% as specified under JNNSM and the
tariff policy. This implies requirement of an additional 11213 MW solar capacity over above targets
specified under JNNSM.
4.4.2. The Three Scenarios
Based on the above key considerations, the following three scenarios have been worked out.
Scenario 1 (Wind dominant): Considering the past growth rate, present stage of development
and future potential availability reported under various studies, wind power has been considered
to be a prominent source of generation in this particular scenario. Therefore, an accelerated
growth rate slightly more than as projected under advanced scenario by the Global Wind Energy
Council and WISE in the ‘Indian Wind Energy Outlook 2011’ has been considered, wherein an
aggressive cumulative capacity addition of 45,812 MW and 74,122 MW is proposed by year 2017
and 2020 respectively. The capacity addition from SHP & biomass is presumed to be at a lower
rate than historical growth rate. The solar capacity addition projections were limited up to 1000
MW, 4000 MW (lower limit for Phase II) and 10000 MW during Phase I, II and III of JNNSM
respectively.
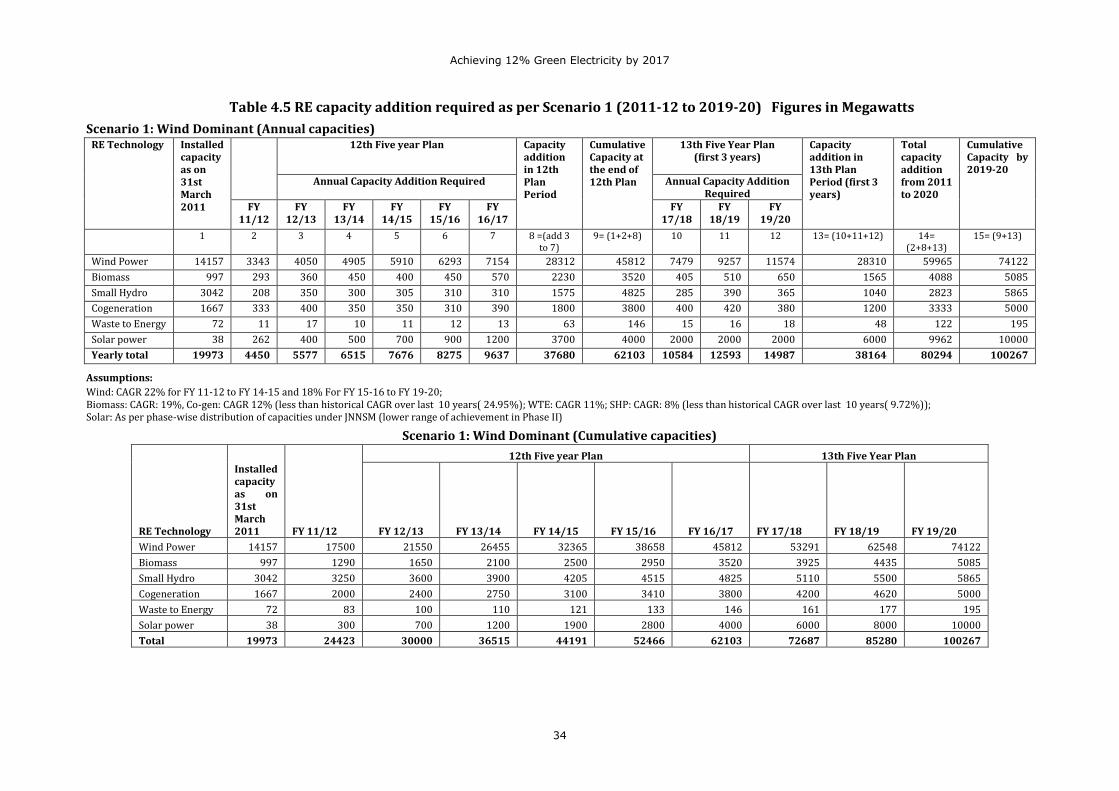
Achieving 12% Green Electricity by 2017
34
Table 4.5 RE capacity addition required as per Scenario 1 (2011-12 to 2019-20) Figures in Megawatts
Scenario 1: Wind Dominant (Annual capacities) RE Technology Installed
capacity as on 31st March 2011
12th Five year Plan Capacity addition in 12th Plan Period
Cumulative Capacity at the end of 12th Plan
13th Five Year Plan (first 3 years)
Capacity addition in 13th Plan Period (first 3 years)
Total capacity addition from 2011 to 2020
Cumulative Capacity by 2019-20
Annual Capacity Addition Required Annual Capacity Addition Required
FY 11/12
FY 12/13
FY 13/14
FY 14/15
FY 15/16
FY 16/17
FY 17/18
FY 18/19
FY 19/20
1 2 3 4 5 6 7 8 =(add 3 to 7)
9= (1+2+8) 10 11 12 13= (10+11+12) 14= (2+8+13)
15= (9+13)
Wind Power 14157 3343 4050 4905 5910 6293 7154 28312 45812 7479 9257 11574 28310 59965 74122
Biomass 997 293 360 450 400 450 570 2230 3520 405 510 650 1565 4088 5085
Small Hydro 3042 208 350 300 305 310 310 1575 4825 285 390 365 1040 2823 5865
Cogeneration 1667 333 400 350 350 310 390 1800 3800 400 420 380 1200 3333 5000
Waste to Energy 72 11 17 10 11 12 13 63 146 15 16 18 48 122 195
Solar power 38 262 400 500 700 900 1200 3700 4000 2000 2000 2000 6000 9962 10000
Yearly total 19973 4450 5577 6515 7676 8275 9637 37680 62103 10584 12593 14987 38164 80294 100267
Assumptions:
Wind: CAGR 22% for FY 11-12 to FY 14-15 and 18% For FY 15-16 to FY 19-20; Biomass: CAGR: 19%, Co-gen: CAGR 12% (less than historical CAGR over last 10 years( 24.95%); WTE: CAGR 11%; SHP: CAGR: 8% (less than historical CAGR over last 10 years( 9.72%)); Solar: As per phase-wise distribution of capacities under JNNSM (lower range of achievement in Phase II)
Scenario 1: Wind Dominant (Cumulative capacities)
RE Technology
Installed capacity as on 31st March 2011 FY 11/12
12th Five year Plan 13th Five Year Plan
FY 12/13 FY 13/14 FY 14/15 FY 15/16 FY 16/17 FY 17/18 FY 18/19 FY 19/20
Wind Power 14157 17500 21550 26455 32365 38658 45812 53291 62548 74122
Biomass 997 1290 1650 2100 2500 2950 3520 3925 4435 5085
Small Hydro 3042 3250 3600 3900 4205 4515 4825 5110 5500 5865
Cogeneration 1667 2000 2400 2750 3100 3410 3800 4200 4620 5000
Waste to Energy 72 83 100 110 121 133 146 161 177 195
Solar power 38 300 700 1200 1900 2800 4000 6000 8000 10000
Total 19973 24423 30000 36515 44191 52466 62103 72687 85280 100267
Achieving 12% Green Electricity by 2017
35
Table 4.5 reveals that the cumulative wind power installation will grow to 74 GW by 2020 in this
scenario. During the 12th plan period on an annual average addition of 5,662 MW of wind power
and 740 MW of solar power capacity needs to be set up if the 12% RE target has to be met. During
first three years of the 13th Plan period, the wind and solar capacity additions need to be further
accelerated to 9,436 MW and 2,000 MW (annual average basis). The combined capacity of biomass
and cogeneration technologies needs to increase by 800 MW (annual average basis).
The projected annual average capacity addition in case of wind is around 5.25 times the past
capacity addition. However, if the capacity addition in 2010-11 is considered as a benchmark,
subsequent CAGR of 20% (which is realistic) can help to achieve this growth. Under this scenario,
during the 12th five year plan, India will have to install 37,680 MW grid-connected capacity from
renewables. The cumulative installed capacity of renewables would be 62,103 MW at the end of the
12th Plan. Whereas, by 2020, the cumulative installed capacity of renewables would be 100,267
MW.
Scenario 2 (Biomass-SHP dominant): Substantial untapped potential and comparative low cost
of generation is the rationale behind this Biomass-SHP dominant scenario. Under this scenario,
biomass and SHP are considered to be dominant irrespective of their limitations. While projecting
the likely capacity addition, growth rate of past ten years was studied and slightly progressive
growth rate is considered over the period 2010-2020. In this scenario wind power growth is
considered in moderate terms based on historical CAGR of 16%. The solar capacity addition is
limited to JNNSM targets which are considered realised.
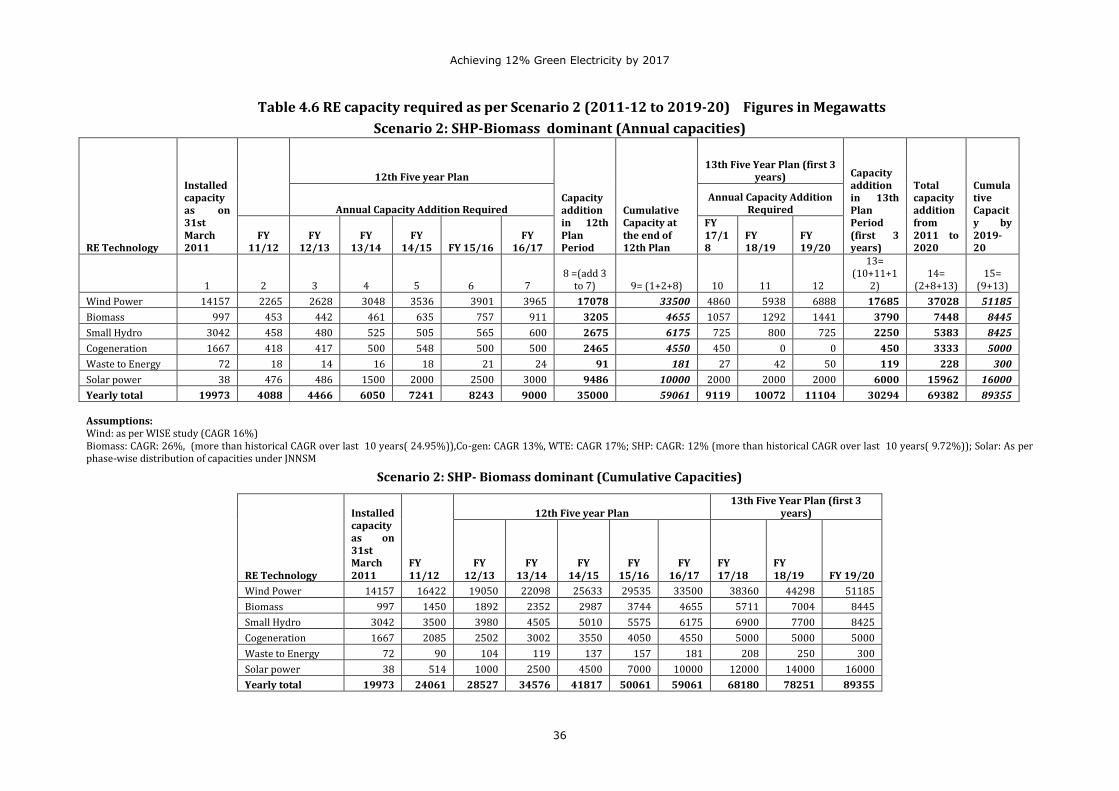
Achieving 12% Green Electricity by 2017
36
Table 4.6 RE capacity required as per Scenario 2 (2011-12 to 2019-20) Figures in Megawatts
Scenario 2: SHP-Biomass dominant (Annual capacities)
RE Technology
Installed capacity as on 31st March 2011
12th Five year Plan
Capacity addition in 12th Plan Period
Cumulative Capacity at the end of 12th Plan
13th Five Year Plan (first 3 years) Capacity
addition in 13th Plan Period (first 3 years)
Total capacity addition from 2011 to 2020
Cumulative Capacity by 2019-20
Annual Capacity Addition Required Annual Capacity Addition
Required
FY 11/12
FY 12/13
FY 13/14
FY 14/15 FY 15/16
FY 16/17
FY 17/18
FY 18/19
FY 19/20
1 2 3 4 5 6 7 8 =(add 3
to 7) 9= (1+2+8) 10 11 12
13= (10+11+1
2) 14=
(2+8+13) 15=
(9+13)
Wind Power 14157 2265 2628 3048 3536 3901 3965 17078 33500 4860 5938 6888 17685 37028 51185
Biomass 997 453 442 461 635 757 911 3205 4655 1057 1292 1441 3790 7448 8445
Small Hydro 3042 458 480 525 505 565 600 2675 6175 725 800 725 2250 5383 8425
Cogeneration 1667 418 417 500 548 500 500 2465 4550 450 0 0 450 3333 5000
Waste to Energy 72 18 14 16 18 21 24 91 181 27 42 50 119 228 300
Solar power 38 476 486 1500 2000 2500 3000 9486 10000 2000 2000 2000 6000 15962 16000
Yearly total 19973 4088 4466 6050 7241 8243 9000 35000 59061 9119 10072 11104 30294 69382 89355 Assumptions: Wind: as per WISE study (CAGR 16%) Biomass: CAGR: 26%, (more than historical CAGR over last 10 years( 24.95%)),Co-gen: CAGR 13%, WTE: CAGR 17%; SHP: CAGR: 12% (more than historical CAGR over last 10 years( 9.72%)); Solar: As per phase-wise distribution of capacities under JNNSM
Scenario 2: SHP- Biomass dominant (Cumulative Capacities)
RE Technology
Installed capacity as on 31st March 2011
FY 11/12
12th Five year Plan 13th Five Year Plan (first 3
years)
FY 12/13
FY 13/14
FY 14/15
FY 15/16
FY 16/17
FY 17/18
FY 18/19 FY 19/20
Wind Power 14157 16422 19050 22098 25633 29535 33500 38360 44298 51185
Biomass 997 1450 1892 2352 2987 3744 4655 5711 7004 8445
Small Hydro 3042 3500 3980 4505 5010 5575 6175 6900 7700 8425
Cogeneration 1667 2085 2502 3002 3550 4050 4550 5000 5000 5000
Waste to Energy 72 90 104 119 137 157 181 208 250 300
Solar power 38 514 1000 2500 4500 7000 10000 12000 14000 16000
Yearly total 19973 24061 28527 34576 41817 50061 59061 68180 78251 89355
Achieving 12% Green Electricity by 2017
37
Table 4.6 reveals that the cumulative biomass and SHP power project installations will rise to 13.4
GW and 8 GW respectively by 2020. In the 12th plan period, on an annual average, 1,134 MW and
535 MW biomass and SHP capacity have to be set up if the 12% RE target has to be met. During
first three years of 13th Plan period, biomass and SHP capacity addition needs to be further
accelerated to 1,413 MW and 750 MW on an annual average basis.
The projected annual average capacity addition in case of biomass and SHP is around 3.5 times
and 2.5 times than the past capacity addition (on annual basis) which is difficult to achieve.
Under Scenario 2, during the 12 five-year plan, India will have to install 35,000 MW of grid-
connected capacity from renewables. The cumulative installed capacity of renewables would be
59,061 MW at the end of 12th plan. Whereas, by 2020, the cumulative installed capacity of
renewables would be 89,355 MW.
Scenario 3 (Solar dominant): India is located in the equatorial sunbelt of the earth. In most parts
of the country, clear sunny weather is experienced 250–300 days a year. The annual global
radiation varies from 1600 to 2200 kWh/m2 which is comparable with radiation received in the
tropical and sub-tropical regions. The highest annual global radiation (≥ 2400kWh/m²) is received
in Rajasthan and northern Gujarat where good concentrated solar power (CSP) potential exists.
Considering the abundant solar potential in the country, the past three years experience in cost
reduction / international solar cost reduction projections, and the fact that the cost reduction can
be achieved by facilitating mass production and R&D efforts, have been taken into account.
Promoting solar energy is essential in view of energy security and for minimizing the dependence
on import of conventional fuel. All the above favourable conditions underline the cause for
development of the solar dominant scenario. Under this scenario, total solar capacity addition of
35,490 MW is envisaged to be realized during year 2011-2020.
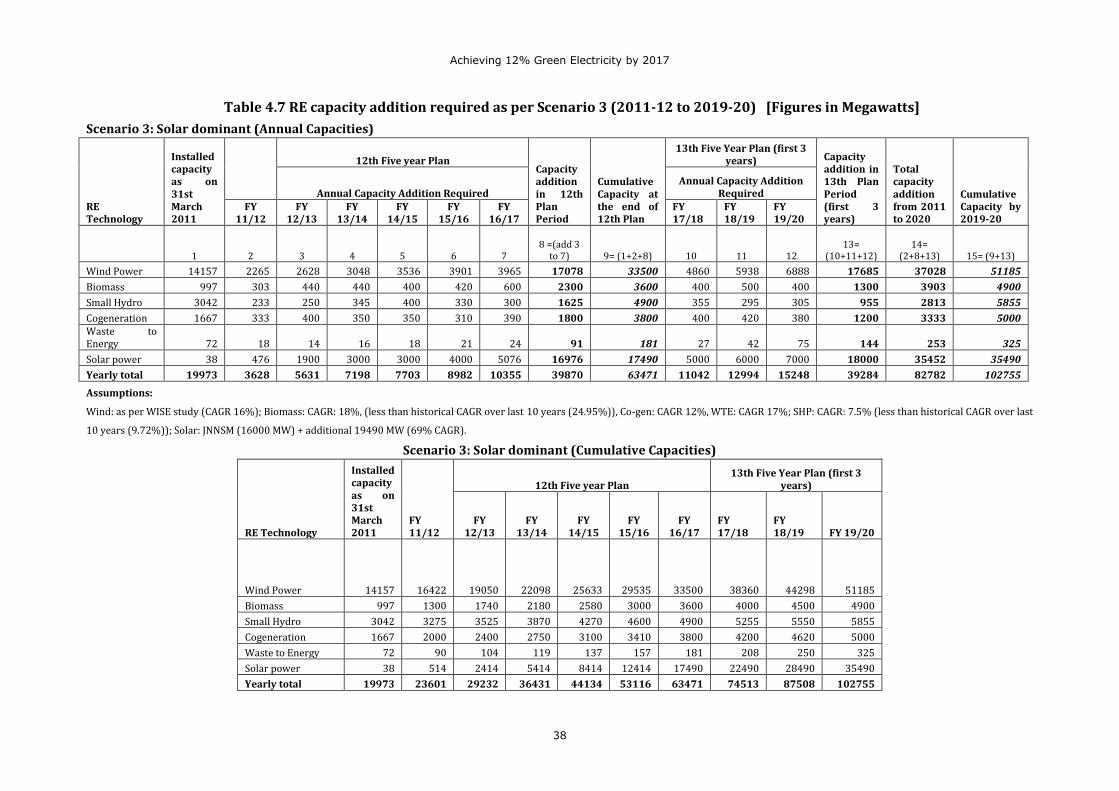
Achieving 12% Green Electricity by 2017
38
Table 4.7 RE capacity addition required as per Scenario 3 (2011-12 to 2019-20) [Figures in Megawatts]
Scenario 3: Solar dominant (Annual Capacities)
RE Technology
Installed capacity as on 31st March 2011
12th Five year Plan Capacity addition in 12th Plan Period
Cumulative Capacity at the end of 12th Plan
13th Five Year Plan (first 3 years) Capacity
addition in 13th Plan Period (first 3 years)
Total capacity addition from 2011 to 2020
Cumulative Capacity by 2019-20
Annual Capacity Addition Required Annual Capacity Addition
Required FY
11/12 FY
12/13 FY
13/14 FY
14/15 FY
15/16 FY
16/17 FY 17/18
FY 18/19
FY 19/20
1 2 3 4 5 6 7 8 =(add 3
to 7) 9= (1+2+8) 10 11 12 13=
(10+11+12) 14=
(2+8+13) 15= (9+13)
Wind Power 14157 2265 2628 3048 3536 3901 3965 17078 33500 4860 5938 6888 17685 37028 51185
Biomass 997 303 440 440 400 420 600 2300 3600 400 500 400 1300 3903 4900
Small Hydro 3042 233 250 345 400 330 300 1625 4900 355 295 305 955 2813 5855
Cogeneration 1667 333 400 350 350 310 390 1800 3800 400 420 380 1200 3333 5000 Waste to Energy 72 18 14 16 18 21 24 91 181 27 42 75 144 253 325
Solar power 38 476 1900 3000 3000 4000 5076 16976 17490 5000 6000 7000 18000 35452 35490
Yearly total 19973 3628 5631 7198 7703 8982 10355 39870 63471 11042 12994 15248 39284 82782 102755
Assumptions:
Wind: as per WISE study (CAGR 16%); Biomass: CAGR: 18%, (less than historical CAGR over last 10 years (24.95%)), Co-gen: CAGR 12%, WTE: CAGR 17%; SHP: CAGR: 7.5% (less than historical CAGR over last
10 years (9.72%)); Solar: JNNSM (16000 MW) + additional 19490 MW (69% CAGR).
Scenario 3: Solar dominant (Cumulative Capacities)
RE Technology
Installed capacity as on 31st March 2011
FY 11/12
12th Five year Plan 13th Five Year Plan (first 3
years)
FY 12/13
FY 13/14
FY 14/15
FY 15/16
FY 16/17
FY 17/18
FY 18/19 FY 19/20
Wind Power 14157 16422 19050 22098 25633 29535 33500 38360 44298 51185
Biomass 997 1300 1740 2180 2580 3000 3600 4000 4500 4900
Small Hydro 3042 3275 3525 3870 4270 4600 4900 5255 5550 5855
Cogeneration 1667 2000 2400 2750 3100 3410 3800 4200 4620 5000
Waste to Energy 72 90 104 119 137 157 181 208 250 325
Solar power 38 514 2414 5414 8414 12414 17490 22490 28490 35490
Yearly total 19973 23601 29232 36431 44134 53116 63471 74513 87508 102755
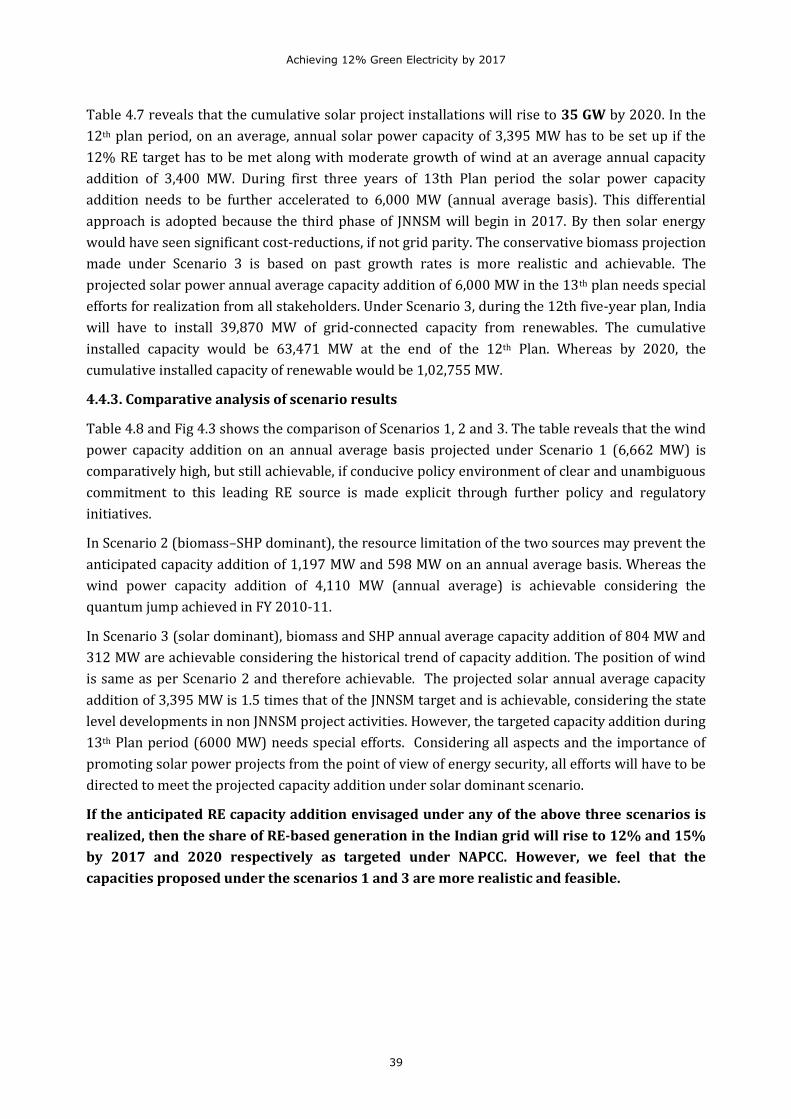
Achieving 12% Green Electricity by 2017
39
Table 4.7 reveals that the cumulative solar project installations will rise to 35 GW by 2020. In the
12th plan period, on an average, annual solar power capacity of 3,395 MW has to be set up if the
12% RE target has to be met along with moderate growth of wind at an average annual capacity
addition of 3,400 MW. During first three years of 13th Plan period the solar power capacity
addition needs to be further accelerated to 6,000 MW (annual average basis). This differential
approach is adopted because the third phase of JNNSM will begin in 2017. By then solar energy
would have seen significant cost-reductions, if not grid parity. The conservative biomass projection
made under Scenario 3 is based on past growth rates is more realistic and achievable. The
projected solar power annual average capacity addition of 6,000 MW in the 13th plan needs special
efforts for realization from all stakeholders. Under Scenario 3, during the 12th five-year plan, India
will have to install 39,870 MW of grid-connected capacity from renewables. The cumulative
installed capacity would be 63,471 MW at the end of the 12th Plan. Whereas by 2020, the
cumulative installed capacity of renewable would be 1,02,755 MW.
4.4.3. Comparative analysis of scenario results
Table 4.8 and Fig 4.3 shows the comparison of Scenarios 1, 2 and 3. The table reveals that the wind
power capacity addition on an annual average basis projected under Scenario 1 (6,662 MW) is
comparatively high, but still achievable, if conducive policy environment of clear and unambiguous
commitment to this leading RE source is made explicit through further policy and regulatory
initiatives.
In Scenario 2 (biomass–SHP dominant), the resource limitation of the two sources may prevent the
anticipated capacity addition of 1,197 MW and 598 MW on an annual average basis. Whereas the
wind power capacity addition of 4,110 MW (annual average) is achievable considering the
quantum jump achieved in FY 2010-11.
In Scenario 3 (solar dominant), biomass and SHP annual average capacity addition of 804 MW and
312 MW are achievable considering the historical trend of capacity addition. The position of wind
is same as per Scenario 2 and therefore achievable. The projected solar annual average capacity
addition of 3,395 MW is 1.5 times that of the JNNSM target and is achievable, considering the state
level developments in non JNNSM project activities. However, the targeted capacity addition during
13th Plan period (6000 MW) needs special efforts. Considering all aspects and the importance of
promoting solar power projects from the point of view of energy security, all efforts will have to be
directed to meet the projected capacity addition under solar dominant scenario.
If the anticipated RE capacity addition envisaged under any of the above three scenarios is
realized, then the share of RE-based generation in the Indian grid will rise to 12% and 15%
by 2017 and 2020 respectively as targeted under NAPCC. However, we feel that the
capacities proposed under the scenarios 1 and 3 are more realistic and feasible.
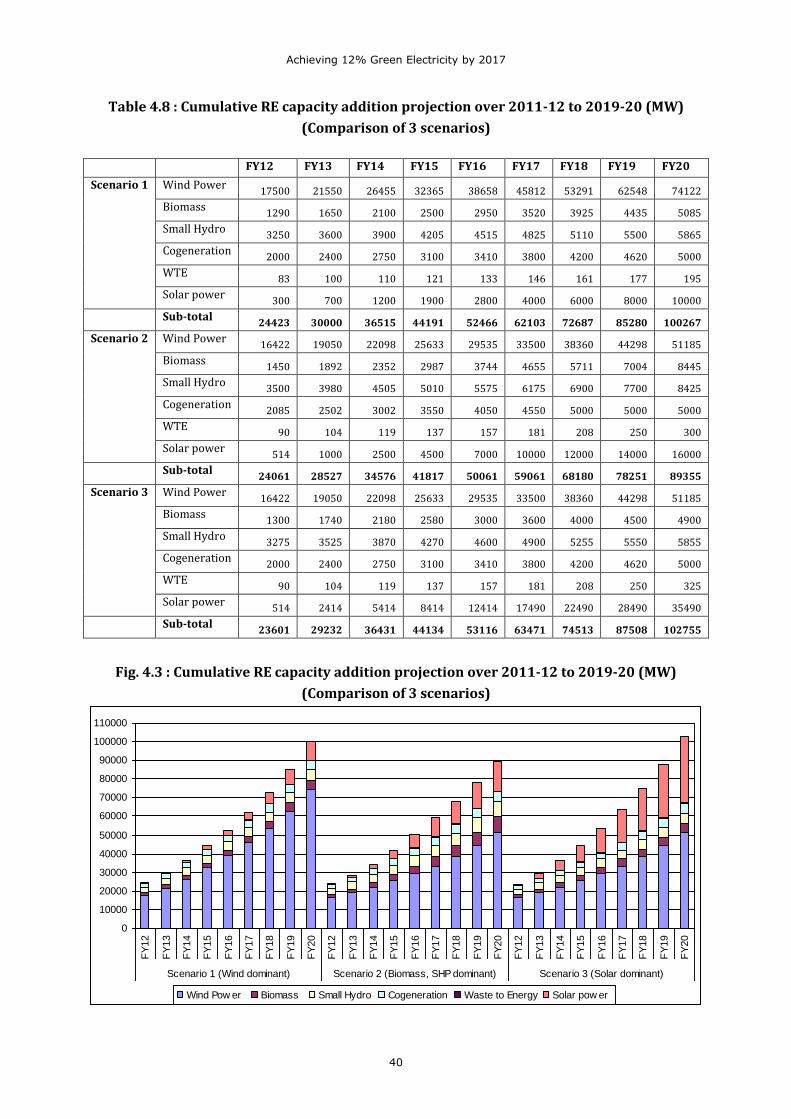
Achieving 12% Green Electricity by 2017
40
Table 4.8 : Cumulative RE capacity addition projection over 2011-12 to 2019-20 (MW)
(Comparison of 3 scenarios)
FY12 FY13 FY14 FY15 FY16 FY17 FY18 FY19 FY20
Scenario 1 Wind Power 17500 21550 26455 32365 38658 45812 53291 62548 74122
Biomass 1290 1650 2100 2500 2950 3520 3925 4435 5085
Small Hydro 3250 3600 3900 4205 4515 4825 5110 5500 5865
Cogeneration 2000 2400 2750 3100 3410 3800 4200 4620 5000
WTE 83 100 110 121 133 146 161 177 195
Solar power 300 700 1200 1900 2800 4000 6000 8000 10000
Sub-total 24423 30000 36515 44191 52466 62103 72687 85280 100267
Scenario 2
Wind Power 16422 19050 22098 25633 29535 33500 38360 44298 51185
Biomass 1450 1892 2352 2987 3744 4655 5711 7004 8445
Small Hydro 3500 3980 4505 5010 5575 6175 6900 7700 8425
Cogeneration 2085 2502 3002 3550 4050 4550 5000 5000 5000
WTE 90 104 119 137 157 181 208 250 300
Solar power 514 1000 2500 4500 7000 10000 12000 14000 16000
Sub-total 24061 28527 34576 41817 50061 59061 68180 78251 89355
Scenario 3 Wind Power 16422 19050 22098 25633 29535 33500 38360 44298 51185
Biomass 1300 1740 2180 2580 3000 3600 4000 4500 4900
Small Hydro 3275 3525 3870 4270 4600 4900 5255 5550 5855
Cogeneration 2000 2400 2750 3100 3410 3800 4200 4620 5000
WTE 90 104 119 137 157 181 208 250 325
Solar power 514 2414 5414 8414 12414 17490 22490 28490 35490
Sub-total 23601 29232 36431 44134 53116 63471 74513 87508 102755
Fig. 4.3 : Cumulative RE capacity addition projection over 2011-12 to 2019-20 (MW)
(Comparison of 3 scenarios)
0
10000
20000
30000
40000
50000
60000
70000
80000
90000
100000
110000
FY
12
FY
13
FY
14
FY
15
FY
16
FY
17
FY
18
FY
19
FY
20
FY
12
FY
13
FY
14
FY
15
FY
16
FY
17
FY
18
FY
19
FY
20
FY
12
FY
13
FY
14
FY
15
FY
16
FY
17
FY
18
FY
19
FY
20
Scenario 1 (Wind dominant) Scenario 2 (Biomass, SHP dominant) Scenario 3 (Solar dominant)
Wind Pow er Biomass Small Hydro Cogeneration Waste to Energy Solar pow er
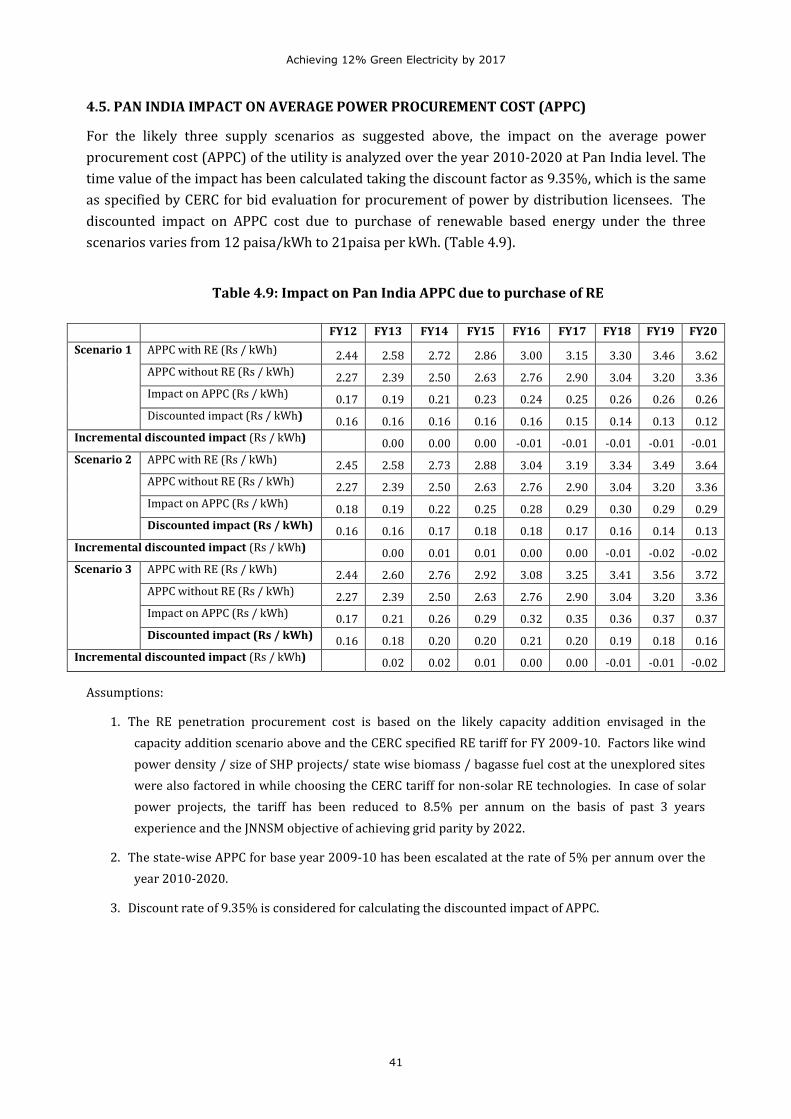
Achieving 12% Green Electricity by 2017
41
4.5. PAN INDIA IMPACT ON AVERAGE POWER PROCUREMENT COST (APPC)
For the likely three supply scenarios as suggested above, the impact on the average power
procurement cost (APPC) of the utility is analyzed over the year 2010-2020 at Pan India level. The
time value of the impact has been calculated taking the discount factor as 9.35%, which is the same
as specified by CERC for bid evaluation for procurement of power by distribution licensees. The
discounted impact on APPC cost due to purchase of renewable based energy under the three
scenarios varies from 12 paisa/kWh to 21paisa per kWh. (Table 4.9).
Table 4.9: Impact on Pan India APPC due to purchase of RE
FY12 FY13 FY14 FY15 FY16 FY17 FY18 FY19 FY20
Scenario 1 APPC with RE (Rs / kWh) 2.44 2.58 2.72 2.86 3.00 3.15 3.30 3.46 3.62
APPC without RE (Rs / kWh) 2.27 2.39 2.50 2.63 2.76 2.90 3.04 3.20 3.36
Impact on APPC (Rs / kWh) 0.17 0.19 0.21 0.23 0.24 0.25 0.26 0.26 0.26
Discounted impact (Rs / kWh) 0.16 0.16 0.16 0.16 0.16 0.15 0.14 0.13 0.12
Incremental discounted impact (Rs / kWh) 0.00 0.00 0.00 -0.01 -0.01 -0.01 -0.01 -0.01
Scenario 2 APPC with RE (Rs / kWh) 2.45 2.58 2.73 2.88 3.04 3.19 3.34 3.49 3.64
APPC without RE (Rs / kWh) 2.27 2.39 2.50 2.63 2.76 2.90 3.04 3.20 3.36
Impact on APPC (Rs / kWh) 0.18 0.19 0.22 0.25 0.28 0.29 0.30 0.29 0.29
Discounted impact (Rs / kWh) 0.16 0.16 0.17 0.18 0.18 0.17 0.16 0.14 0.13
Incremental discounted impact (Rs / kWh) 0.00 0.01 0.01 0.00 0.00 -0.01 -0.02 -0.02
Scenario 3 APPC with RE (Rs / kWh) 2.44 2.60 2.76 2.92 3.08 3.25 3.41 3.56 3.72
APPC without RE (Rs / kWh) 2.27 2.39 2.50 2.63 2.76 2.90 3.04 3.20 3.36
Impact on APPC (Rs / kWh) 0.17 0.21 0.26 0.29 0.32 0.35 0.36 0.37 0.37
Discounted impact (Rs / kWh) 0.16 0.18 0.20 0.20 0.21 0.20 0.19 0.18 0.16
Incremental discounted impact (Rs / kWh) 0.02 0.02 0.01 0.00 0.00 -0.01 -0.01 -0.02
Assumptions:
1. The RE penetration procurement cost is based on the likely capacity addition envisaged in the
capacity addition scenario above and the CERC specified RE tariff for FY 2009-10. Factors like wind
power density / size of SHP projects/ state wise biomass / bagasse fuel cost at the unexplored sites
were also factored in while choosing the CERC tariff for non-solar RE technologies. In case of solar
power projects, the tariff has been reduced to 8.5% per annum on the basis of past 3 years
experience and the JNNSM objective of achieving grid parity by 2022.
2. The state-wise APPC for base year 2009-10 has been escalated at the rate of 5% per annum over the
year 2010-2020.
3. Discount rate of 9.35% is considered for calculating the discounted impact of APPC.
Achieving 12% Green Electricity by 2017
42
The impact on the APPC is significant and it would be impossible for the utilities to absorb the
same. Much of this is due to the high solar tariff. That means the government will have to exercise
serious policy options to make the projects viable. These include:
a. Interest subsidies to provide softer loans;
b. Measures to accelerate grid parity;
c. Generation-based incentives, to keep tariffs low.
4.6 POSSIBLE STATE-WISE / RE TECHNOLOGY-WISE CAPACITY ADDITION PLAN TO MEET
THE NAPCC TARGET (WIND and SOLAR DOMINANT SCENARIO)
As discussed in 4.4.3. above, encouraging a solar dominant scenario is important in view of
achieving energy security. However the wind dominant scenario with solar capacities restricted to
lower limit projection in phase II of JNNSM may also be important from the point of view of
minimal impact on Pan-India APPC. Therefore these two scenarios are considered for state-wise
detailing. The possible RE technology-wise share of states in total is matched with the pan-India RE
technology-wise share. While devising the state-wise/RE technology-wise share as above, a
detailed study of state-wise RE potential/installed capacity and unexplored RE potential, and the
past growth rate of RE capacity addition has been carried out. As the official potential assessment
in terms of state-wise solar capacity is not available, the targeted solar potential is distributed in
selected potential states based on the solar radiation assessment. Table 4.10 and 4.11 provide the
state-wise projected RE capacity addition (cumulative basis) based on the wind and solar dominant
scenarios. It would be seen that along with other policy measures, revision of RPO targets would be
required in many states. This aspect has, however, been discussed in Chapter 5 on barriers and
their remedies.
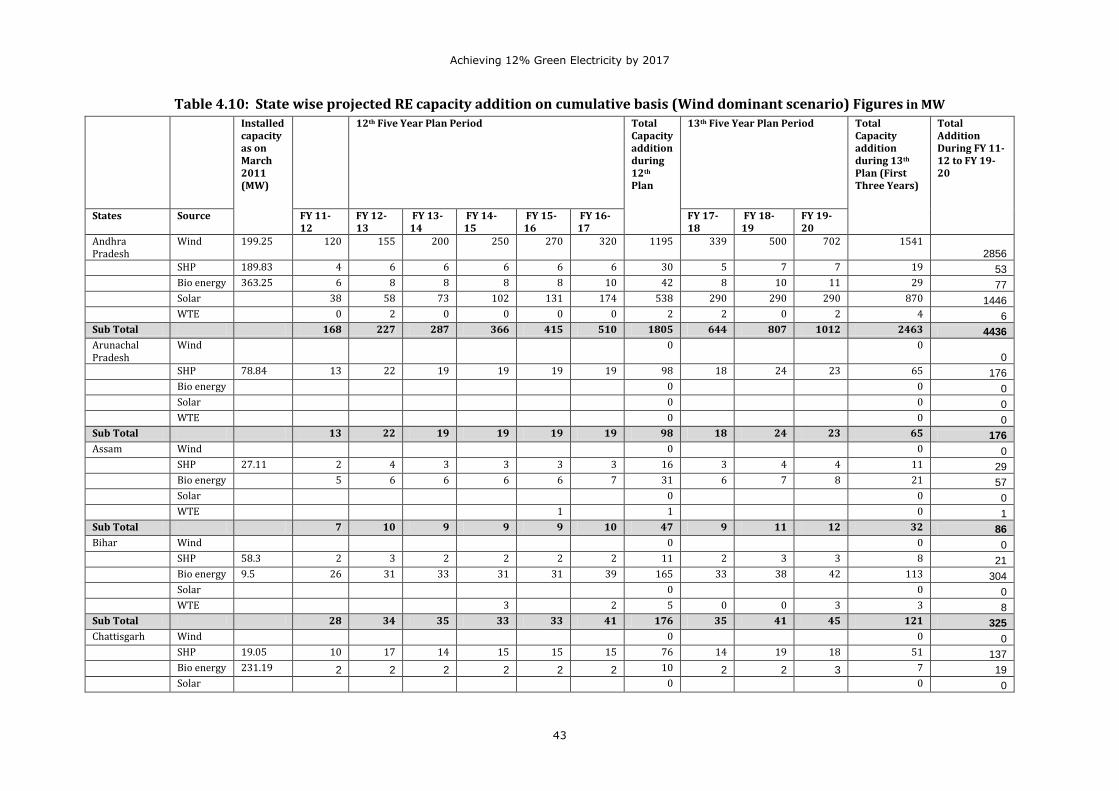
Achieving 12% Green Electricity by 2017
43
Table 4.10: State wise projected RE capacity addition on cumulative basis (Wind dominant scenario) Figures in MW
Installed capacity as on March 2011 (MW)
12th Five Year Plan Period Total Capacity addition during 12th Plan
13th Five Year Plan Period Total Capacity addition during 13th Plan (First Three Years)
Total Addition During FY 11-12 to FY 19-20
States Source FY 11-12
FY 12-13
FY 13-14
FY 14-15
FY 15-16
FY 16-17
FY 17-18
FY 18-19
FY 19-20
Andhra Pradesh
Wind 199.25 120 155 200 250 270 320 1195 339 500 702 1541 2856
SHP 189.83 4 6 6 6 6 6 30 5 7 7 19 53
Bio energy 363.25 6 8 8 8 8 10 42 8 10 11 29 77
Solar 38 58 73 102 131 174 538 290 290 290 870 1446
WTE 0 2 0 0 0 0 2 2 0 2 4 6
Sub Total 168 227 287 366 415 510 1805 644 807 1012 2463 4436
Arunachal Pradesh
Wind 0 0 0
SHP 78.84 13 22 19 19 19 19 98 18 24 23 65 176
Bio energy 0 0 0
Solar 0 0 0
WTE 0 0 0
Sub Total 13 22 19 19 19 19 98 18 24 23 65 176
Assam Wind 0 0 0
SHP 27.11 2 4 3 3 3 3 16 3 4 4 11 29
Bio energy 5 6 6 6 6 7 31 6 7 8 21 57
Solar 0 0 0
WTE 1 1 0 1
Sub Total 7 10 9 9 9 10 47 9 11 12 32 86
Bihar Wind 0 0 0
SHP 58.3 2 3 2 2 2 2 11 2 3 3 8 21
Bio energy 9.5 26 31 33 31 31 39 165 33 38 42 113 304
Solar 0 0 0
WTE 3 2 5 0 0 3 3 8
Sub Total 28 34 35 33 33 41 176 35 41 45 121 325
Chattisgarh Wind 0 0 0
SHP 19.05 10 17 14 15 15 15 76 14 19 18 51 137
Bio energy 231.19 2 2 2 2 2 2 10 2 2 3 7 19
Solar 0 0 0
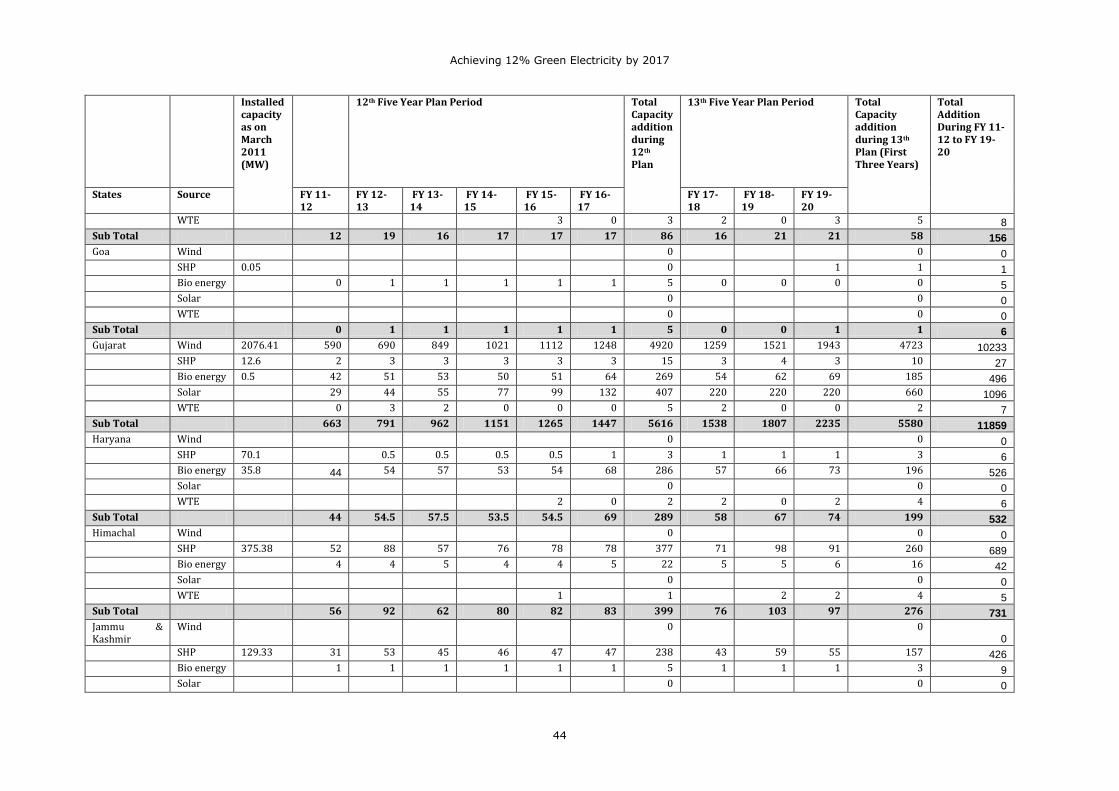
Achieving 12% Green Electricity by 2017
44
Installed capacity as on March 2011 (MW)
12th Five Year Plan Period Total Capacity addition during 12th Plan
13th Five Year Plan Period Total Capacity addition during 13th Plan (First Three Years)
Total Addition During FY 11-12 to FY 19-20
States Source FY 11-12
FY 12-13
FY 13-14
FY 14-15
FY 15-16
FY 16-17
FY 17-18
FY 18-19
FY 19-20
WTE 3 0 3 2 0 3 5 8
Sub Total 12 19 16 17 17 17 86 16 21 21 58 156
Goa Wind 0 0 0
SHP 0.05 0 1 1 1
Bio energy 0 1 1 1 1 1 5 0 0 0 0 5
Solar 0 0 0
WTE 0 0 0
Sub Total 0 1 1 1 1 1 5 0 0 1 1 6
Gujarat Wind 2076.41 590 690 849 1021 1112 1248 4920 1259 1521 1943 4723 10233
SHP 12.6 2 3 3 3 3 3 15 3 4 3 10 27
Bio energy 0.5 42 51 53 50 51 64 269 54 62 69 185 496
Solar 29 44 55 77 99 132 407 220 220 220 660 1096
WTE 0 3 2 0 0 0 5 2 0 0 2 7
Sub Total 663 791 962 1151 1265 1447 5616 1538 1807 2235 5580 11859
Haryana Wind 0 0 0
SHP 70.1 0.5 0.5 0.5 0.5 1 3 1 1 1 3 6
Bio energy 35.8 44 54 57 53 54 68 286 57 66 73 196 526
Solar 0 0 0
WTE 2 0 2 2 0 2 4 6
Sub Total 44 54.5 57.5 53.5 54.5 69 289 58 67 74 199 532
Himachal Wind 0 0 0
SHP 375.38 52 88 57 76 78 78 377 71 98 91 260 689
Bio energy 4 4 5 4 4 5 22 5 5 6 16 42
Solar 0 0 0
WTE 1 1 2 2 4 5
Sub Total 56 92 62 80 82 83 399 76 103 97 276 731
Jammu & Kashmir
Wind 0 0 0
SHP 129.33 31 53 45 46 47 47 238 43 59 55 157 426
Bio energy 1 1 1 1 1 1 5 1 1 1 3 9
Solar 0 0 0
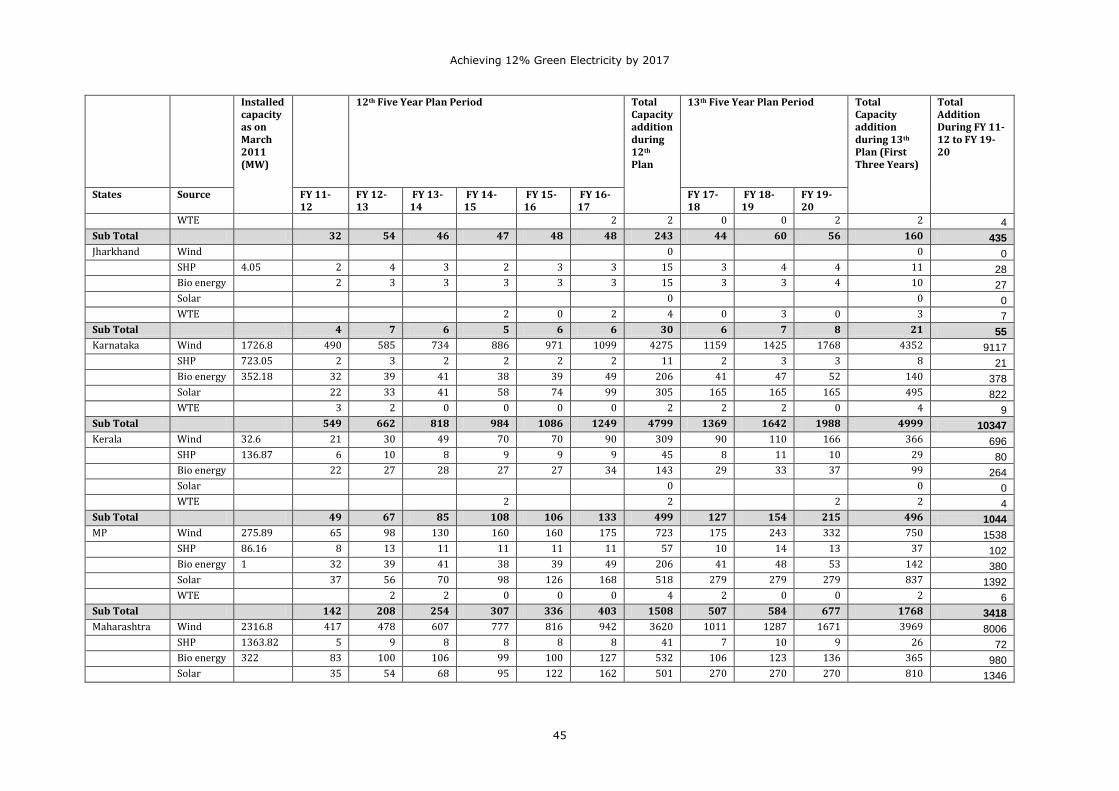
Achieving 12% Green Electricity by 2017
45
Installed capacity as on March 2011 (MW)
12th Five Year Plan Period Total Capacity addition during 12th Plan
13th Five Year Plan Period Total Capacity addition during 13th Plan (First Three Years)
Total Addition During FY 11-12 to FY 19-20
States Source FY 11-12
FY 12-13
FY 13-14
FY 14-15
FY 15-16
FY 16-17
FY 17-18
FY 18-19
FY 19-20
WTE 2 2 0 0 2 2 4
Sub Total 32 54 46 47 48 48 243 44 60 56 160 435
Jharkhand Wind 0 0 0
SHP 4.05 2 4 3 2 3 3 15 3 4 4 11 28
Bio energy 2 3 3 3 3 3 15 3 3 4 10 27
Solar 0 0 0
WTE 2 0 2 4 0 3 0 3 7
Sub Total 4 7 6 5 6 6 30 6 7 8 21 55
Karnataka Wind 1726.8 490 585 734 886 971 1099 4275 1159 1425 1768 4352 9117
SHP 723.05 2 3 2 2 2 2 11 2 3 3 8 21
Bio energy 352.18 32 39 41 38 39 49 206 41 47 52 140 378
Solar 22 33 41 58 74 99 305 165 165 165 495 822
WTE 3 2 0 0 0 0 2 2 2 0 4 9
Sub Total 549 662 818 984 1086 1249 4799 1369 1642 1988 4999 10347
Kerala Wind 32.6 21 30 49 70 70 90 309 90 110 166 366 696
SHP 136.87 6 10 8 9 9 9 45 8 11 10 29 80
Bio energy 22 27 28 27 27 34 143 29 33 37 99 264
Solar 0 0 0
WTE 2 2 2 2 4
Sub Total 49 67 85 108 106 133 499 127 154 215 496 1044
MP Wind 275.89 65 98 130 160 160 175 723 175 243 332 750 1538
SHP 86.16 8 13 11 11 11 11 57 10 14 13 37 102
Bio energy 1 32 39 41 38 39 49 206 41 48 53 142 380
Solar 37 56 70 98 126 168 518 279 279 279 837 1392
WTE 2 2 0 0 0 4 2 0 0 2 6
Sub Total 142 208 254 307 336 403 1508 507 584 677 1768 3418
Maharashtra Wind 2316.8 417 478 607 777 816 942 3620 1011 1287 1671 3969 8006
SHP 1363.82 5 9 8 8 8 8 41 7 10 9 26 72
Bio energy 322 83 100 106 99 100 127 532 106 123 136 365 980
Solar 35 54 68 95 122 162 501 270 270 270 810 1346
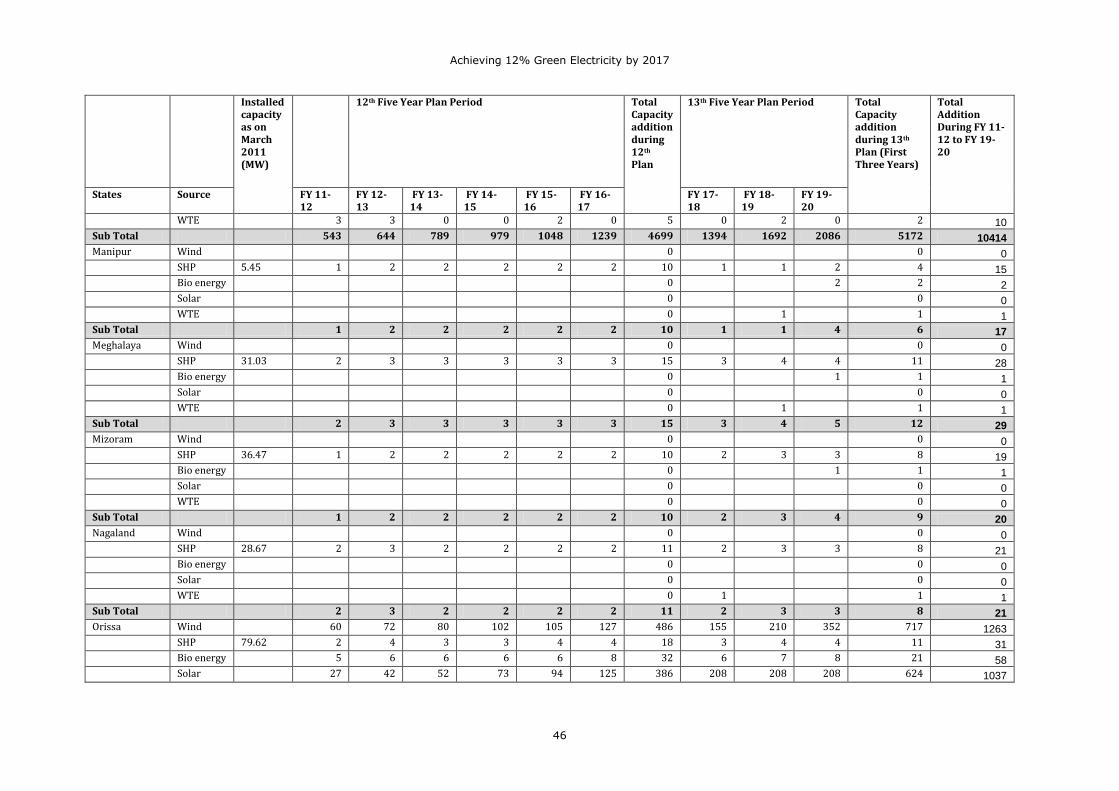
Achieving 12% Green Electricity by 2017
46
Installed capacity as on March 2011 (MW)
12th Five Year Plan Period Total Capacity addition during 12th Plan
13th Five Year Plan Period Total Capacity addition during 13th Plan (First Three Years)
Total Addition During FY 11-12 to FY 19-20
States Source FY 11-12
FY 12-13
FY 13-14
FY 14-15
FY 15-16
FY 16-17
FY 17-18
FY 18-19
FY 19-20
WTE 3 3 0 0 2 0 5 0 2 0 2 10
Sub Total 543 644 789 979 1048 1239 4699 1394 1692 2086 5172 10414
Manipur Wind 0 0 0
SHP 5.45 1 2 2 2 2 2 10 1 1 2 4 15
Bio energy 0 2 2 2
Solar 0 0 0
WTE 0 1 1 1
Sub Total 1 2 2 2 2 2 10 1 1 4 6 17
Meghalaya Wind 0 0 0
SHP 31.03 2 3 3 3 3 3 15 3 4 4 11 28
Bio energy 0 1 1 1
Solar 0 0 0
WTE 0 1 1 1
Sub Total 2 3 3 3 3 3 15 3 4 5 12 29
Mizoram Wind 0 0 0
SHP 36.47 1 2 2 2 2 2 10 2 3 3 8 19
Bio energy 0 1 1 1
Solar 0 0 0
WTE 0 0 0
Sub Total 1 2 2 2 2 2 10 2 3 4 9 20
Nagaland Wind 0 0 0
SHP 28.67 2 3 2 2 2 2 11 2 3 3 8 21
Bio energy 0 0 0
Solar 0 0 0
WTE 0 1 1 1
Sub Total 2 3 2 2 2 2 11 2 3 3 8 21
Orissa Wind 60 72 80 102 105 127 486 155 210 352 717 1263
SHP 79.62 2 4 3 3 4 4 18 3 4 4 11 31
Bio energy 5 6 6 6 6 8 32 6 7 8 21 58
Solar 27 42 52 73 94 125 386 208 208 208 624 1037
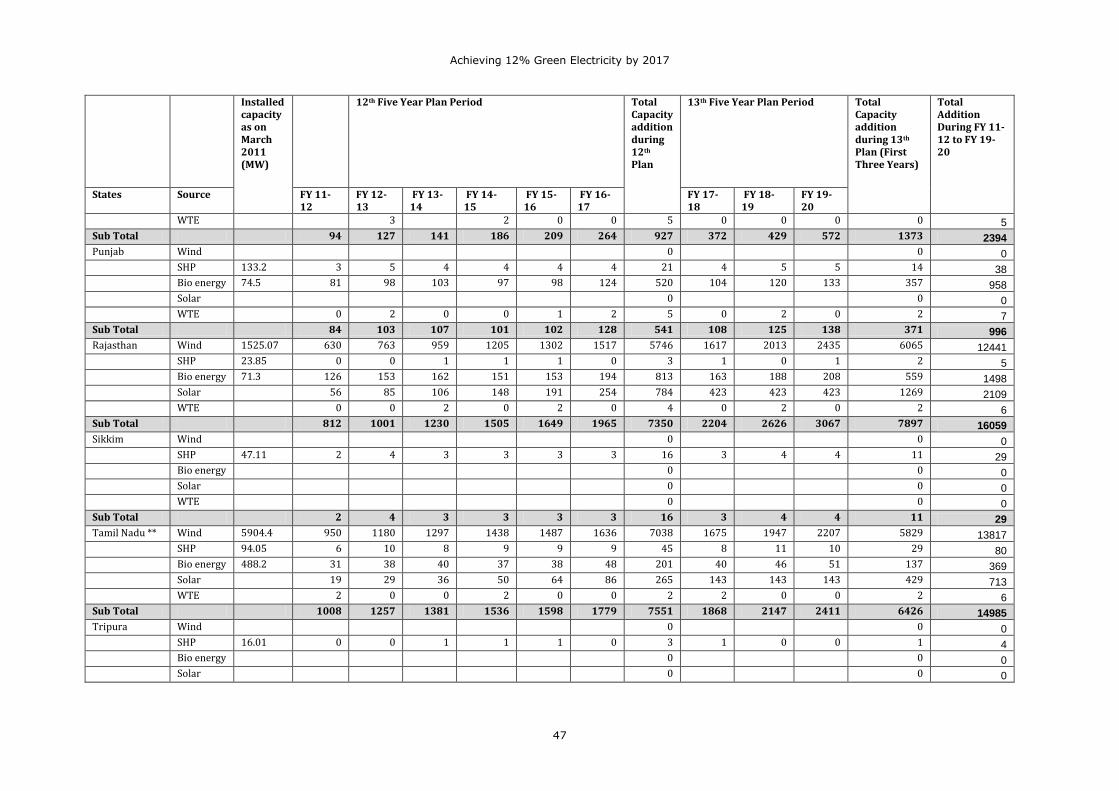
Achieving 12% Green Electricity by 2017
47
Installed capacity as on March 2011 (MW)
12th Five Year Plan Period Total Capacity addition during 12th Plan
13th Five Year Plan Period Total Capacity addition during 13th Plan (First Three Years)
Total Addition During FY 11-12 to FY 19-20
States Source FY 11-12
FY 12-13
FY 13-14
FY 14-15
FY 15-16
FY 16-17
FY 17-18
FY 18-19
FY 19-20
WTE 3 2 0 0 5 0 0 0 0 5
Sub Total 94 127 141 186 209 264 927 372 429 572 1373 2394
Punjab Wind 0 0 0
SHP 133.2 3 5 4 4 4 4 21 4 5 5 14 38
Bio energy 74.5 81 98 103 97 98 124 520 104 120 133 357 958
Solar 0 0 0
WTE 0 2 0 0 1 2 5 0 2 0 2 7
Sub Total 84 103 107 101 102 128 541 108 125 138 371 996
Rajasthan Wind 1525.07 630 763 959 1205 1302 1517 5746 1617 2013 2435 6065 12441
SHP 23.85 0 0 1 1 1 0 3 1 0 1 2 5
Bio energy 71.3 126 153 162 151 153 194 813 163 188 208 559 1498
Solar 56 85 106 148 191 254 784 423 423 423 1269 2109
WTE 0 0 2 0 2 0 4 0 2 0 2 6
Sub Total 812 1001 1230 1505 1649 1965 7350 2204 2626 3067 7897 16059
Sikkim Wind 0 0 0
SHP 47.11 2 4 3 3 3 3 16 3 4 4 11 29
Bio energy 0 0 0
Solar 0 0 0
WTE 0 0 0
Sub Total 2 4 3 3 3 3 16 3 4 4 11 29
Tamil Nadu ** Wind 5904.4 950 1180 1297 1438 1487 1636 7038 1675 1947 2207 5829 13817
SHP 94.05 6 10 8 9 9 9 45 8 11 10 29 80
Bio energy 488.2 31 38 40 37 38 48 201 40 46 51 137 369
Solar 19 29 36 50 64 86 265 143 143 143 429 713
WTE 2 0 0 2 0 0 2 2 0 0 2 6
Sub Total 1008 1257 1381 1536 1598 1779 7551 1868 2147 2411 6426 14985
Tripura Wind 0 0 0
SHP 16.01 0 0 1 1 1 0 3 1 0 0 1 4
Bio energy 0 0 0
Solar 0 0 0
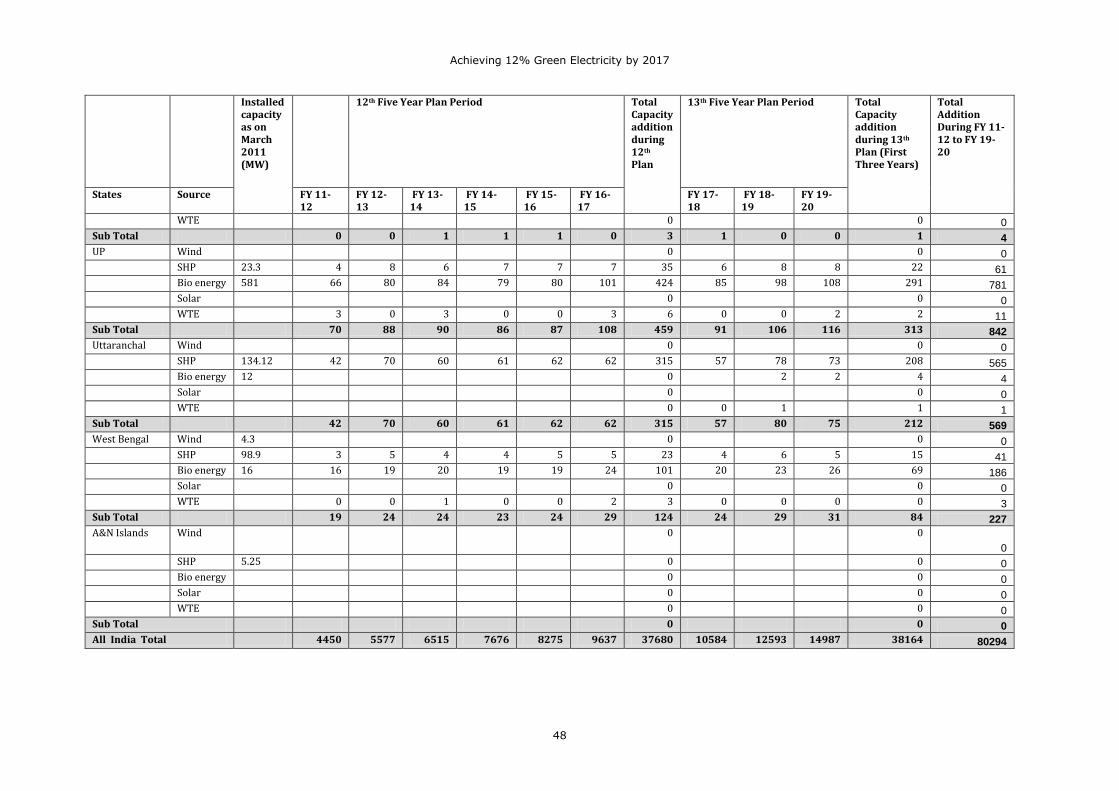
Achieving 12% Green Electricity by 2017
48
Installed capacity as on March 2011 (MW)
12th Five Year Plan Period Total Capacity addition during 12th Plan
13th Five Year Plan Period Total Capacity addition during 13th Plan (First Three Years)
Total Addition During FY 11-12 to FY 19-20
States Source FY 11-12
FY 12-13
FY 13-14
FY 14-15
FY 15-16
FY 16-17
FY 17-18
FY 18-19
FY 19-20
WTE 0 0 0
Sub Total 0 0 1 1 1 0 3 1 0 0 1 4
UP Wind 0 0 0
SHP 23.3 4 8 6 7 7 7 35 6 8 8 22 61
Bio energy 581 66 80 84 79 80 101 424 85 98 108 291 781
Solar 0 0 0
WTE 3 0 3 0 0 3 6 0 0 2 2 11
Sub Total 70 88 90 86 87 108 459 91 106 116 313 842
Uttaranchal Wind 0 0 0
SHP 134.12 42 70 60 61 62 62 315 57 78 73 208 565
Bio energy 12 0 2 2 4 4
Solar 0 0 0
WTE 0 0 1 1 1
Sub Total 42 70 60 61 62 62 315 57 80 75 212 569
West Bengal Wind 4.3 0 0 0
SHP 98.9 3 5 4 4 5 5 23 4 6 5 15 41
Bio energy 16 16 19 20 19 19 24 101 20 23 26 69 186
Solar 0 0 0
WTE 0 0 1 0 0 2 3 0 0 0 0 3
Sub Total 19 24 24 23 24 29 124 24 29 31 84 227
A&N Islands Wind 0 0
0
SHP 5.25 0 0 0
Bio energy 0 0 0
Solar 0 0 0
WTE 0 0 0
Sub Total 0 0 0
All India Total 4450 5577 6515 7676 8275 9637 37680 10584 12593 14987 38164 80294
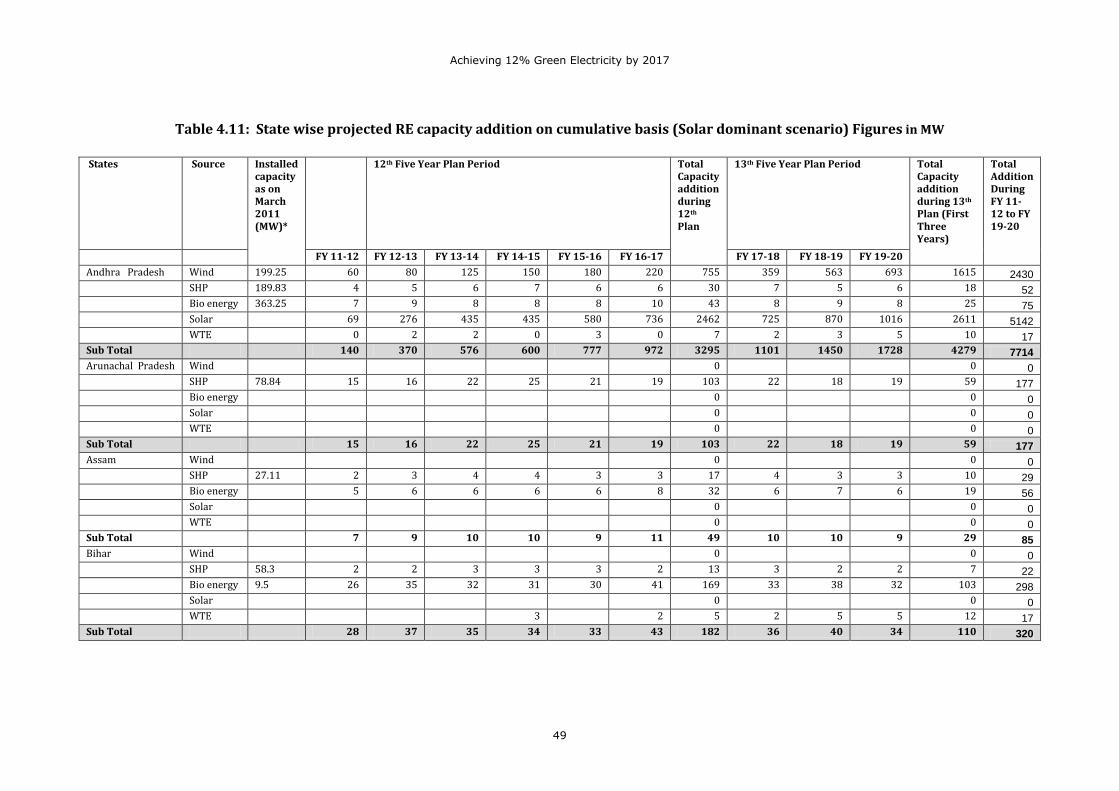
Achieving 12% Green Electricity by 2017
49
Table 4.11: State wise projected RE capacity addition on cumulative basis (Solar dominant scenario) Figures in MW
States Source Installed
capacity as on March 2011 (MW)*
12th Five Year Plan Period Total Capacity addition during 12th Plan
13th Five Year Plan Period Total Capacity addition during 13th Plan (First Three Years)
Total Addition During FY 11-12 to FY 19-20
FY 11-12 FY 12-13 FY 13-14 FY 14-15 FY 15-16 FY 16-17 FY 17-18 FY 18-19 FY 19-20
Andhra Pradesh Wind 199.25 60 80 125 150 180 220 755 359 563 693 1615 2430
SHP 189.83 4 5 6 7 6 6 30 7 5 6 18 52
Bio energy 363.25 7 9 8 8 8 10 43 8 9 8 25 75
Solar 69 276 435 435 580 736 2462 725 870 1016 2611 5142
WTE 0 2 2 0 3 0 7 2 3 5 10 17
Sub Total 140 370 576 600 777 972 3295 1101 1450 1728 4279 7714
Arunachal Pradesh Wind 0 0 0
SHP 78.84 15 16 22 25 21 19 103 22 18 19 59 177
Bio energy 0 0 0
Solar 0 0 0
WTE 0 0 0
Sub Total 15 16 22 25 21 19 103 22 18 19 59 177
Assam Wind 0 0 0
SHP 27.11 2 3 4 4 3 3 17 4 3 3 10 29
Bio energy 5 6 6 6 6 8 32 6 7 6 19 56
Solar 0 0 0
WTE 0 0 0
Sub Total 7 9 10 10 9 11 49 10 10 9 29 85
Bihar Wind 0 0 0
SHP 58.3 2 2 3 3 3 2 13 3 2 2 7 22
Bio energy 9.5 26 35 32 31 30 41 169 33 38 32 103 298
Solar 0 0 0
WTE 3 2 5 2 5 5 12 17
Sub Total 28 37 35 34 33 43 182 36 40 34 110 320
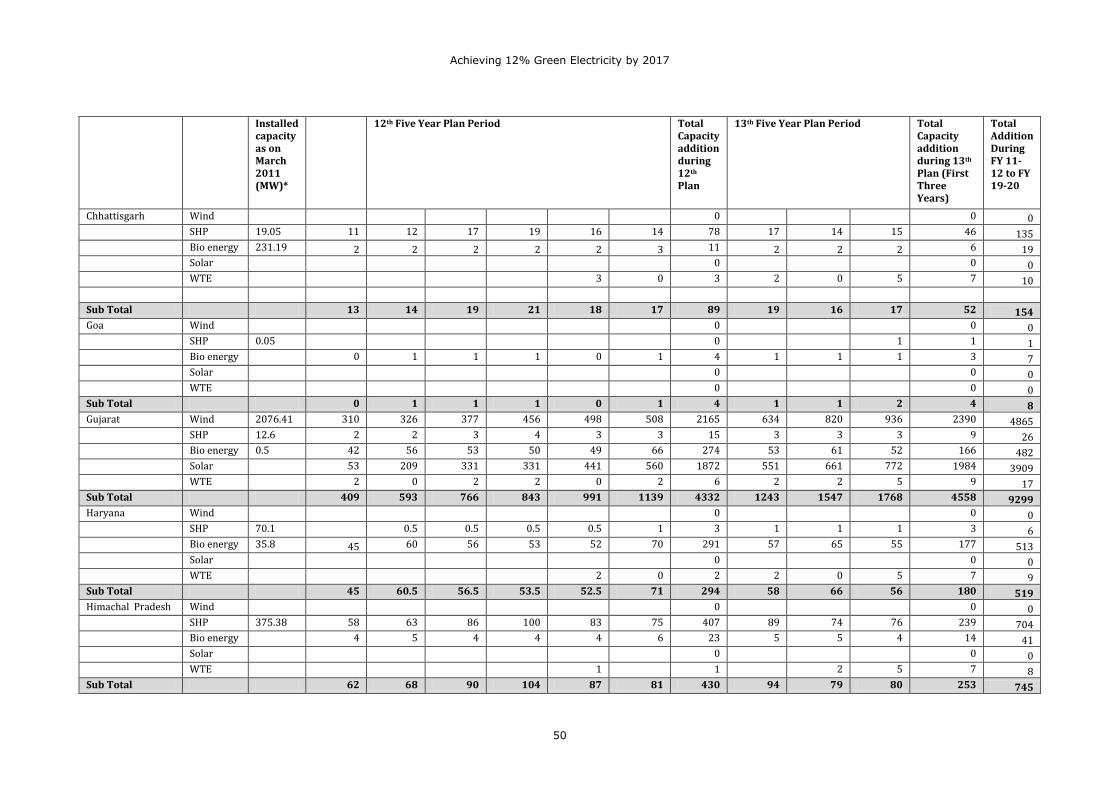
Achieving 12% Green Electricity by 2017
50
Installed
capacity as on March 2011 (MW)*
12th Five Year Plan Period Total Capacity addition during 12th Plan
13th Five Year Plan Period Total Capacity addition during 13th Plan (First Three Years)
Total Addition During FY 11-12 to FY 19-20
Chhattisgarh Wind 0 0 0 SHP 19.05 11 12 17 19 16 14 78 17 14 15 46 135 Bio energy 231.19 2 2 2 2 2 3 11 2 2 2 6 19 Solar 0 0 0 WTE 3 0 3 2 0 5 7 10 Sub Total 13 14 19 21 18 17 89 19 16 17 52 154 Goa Wind 0 0 0 SHP 0.05 0 1 1 1 Bio energy 0 1 1 1 0 1 4 1 1 1 3 7 Solar 0 0 0 WTE 0 0 0 Sub Total 0 1 1 1 0 1 4 1 1 2 4 8 Gujarat Wind 2076.41 310 326 377 456 498 508 2165 634 820 936 2390 4865 SHP 12.6 2 2 3 4 3 3 15 3 3 3 9 26 Bio energy 0.5 42 56 53 50 49 66 274 53 61 52 166 482 Solar 53 209 331 331 441 560 1872 551 661 772 1984 3909 WTE 2 0 2 2 0 2 6 2 2 5 9 17 Sub Total 409 593 766 843 991 1139 4332 1243 1547 1768 4558 9299 Haryana Wind 0 0 0 SHP 70.1 0.5 0.5 0.5 0.5 1 3 1 1 1 3 6 Bio energy 35.8 45 60 56 53 52 70 291 57 65 55 177 513 Solar 0 0 0 WTE 2 0 2 2 0 5 7 9 Sub Total 45 60.5 56.5 53.5 52.5 71 294 58 66 56 180 519 Himachal Pradesh Wind 0 0 0 SHP 375.38 58 63 86 100 83 75 407 89 74 76 239 704 Bio energy 4 5 4 4 4 6 23 5 5 4 14 41 Solar 0 0 0 WTE 1 1 2 5 7 8 Sub Total 62 68 90 104 87 81 430 94 79 80 253 745
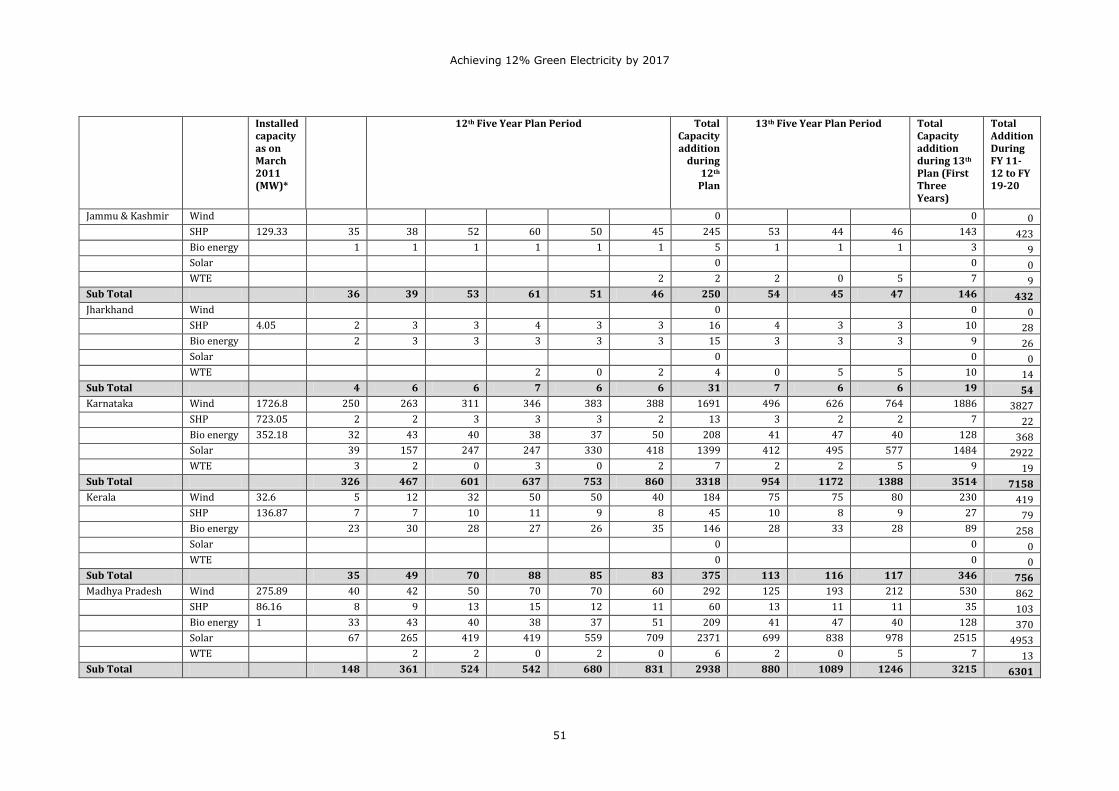
Achieving 12% Green Electricity by 2017
51
Installed
capacity as on March 2011 (MW)*
12th Five Year Plan Period Total Capacity addition
during 12th
Plan
13th Five Year Plan Period Total Capacity addition during 13th Plan (First Three Years)
Total Addition During FY 11-12 to FY 19-20
Jammu & Kashmir Wind 0 0 0 SHP 129.33 35 38 52 60 50 45 245 53 44 46 143 423 Bio energy 1 1 1 1 1 1 5 1 1 1 3 9 Solar 0 0 0 WTE 2 2 2 0 5 7 9 Sub Total 36 39 53 61 51 46 250 54 45 47 146 432 Jharkhand Wind 0 0 0 SHP 4.05 2 3 3 4 3 3 16 4 3 3 10 28 Bio energy 2 3 3 3 3 3 15 3 3 3 9 26 Solar 0 0 0 WTE 2 0 2 4 0 5 5 10 14 Sub Total 4 6 6 7 6 6 31 7 6 6 19 54 Karnataka Wind 1726.8 250 263 311 346 383 388 1691 496 626 764 1886 3827 SHP 723.05 2 2 3 3 3 2 13 3 2 2 7 22 Bio energy 352.18 32 43 40 38 37 50 208 41 47 40 128 368 Solar 39 157 247 247 330 418 1399 412 495 577 1484 2922 WTE 3 2 0 3 0 2 7 2 2 5 9 19 Sub Total 326 467 601 637 753 860 3318 954 1172 1388 3514 7158 Kerala Wind 32.6 5 12 32 50 50 40 184 75 75 80 230 419 SHP 136.87 7 7 10 11 9 8 45 10 8 9 27 79 Bio energy 23 30 28 27 26 35 146 28 33 28 89 258 Solar 0 0 0 WTE 0 0 0 Sub Total 35 49 70 88 85 83 375 113 116 117 346 756 Madhya Pradesh Wind 275.89 40 42 50 70 70 60 292 125 193 212 530 862 SHP 86.16 8 9 13 15 12 11 60 13 11 11 35 103 Bio energy 1 33 43 40 38 37 51 209 41 47 40 128 370 Solar 67 265 419 419 559 709 2371 699 838 978 2515 4953 WTE 2 2 0 2 0 6 2 0 5 7 13 Sub Total 148 361 524 542 680 831 2938 880 1089 1246 3215 6301
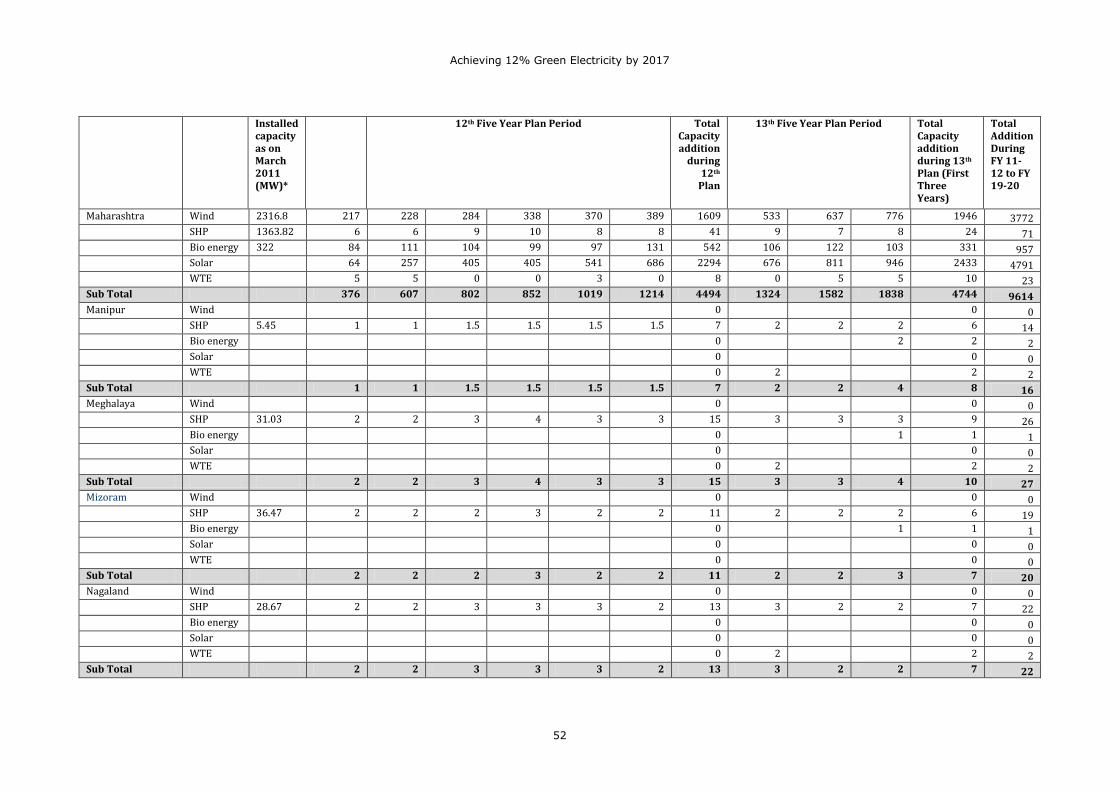
Achieving 12% Green Electricity by 2017
52
Installed
capacity as on March 2011 (MW)*
12th Five Year Plan Period Total Capacity addition
during 12th
Plan
13th Five Year Plan Period Total Capacity addition during 13th Plan (First Three Years)
Total Addition During FY 11-12 to FY 19-20
Maharashtra Wind 2316.8 217 228 284 338 370 389 1609 533 637 776 1946 3772 SHP 1363.82 6 6 9 10 8 8 41 9 7 8 24 71 Bio energy 322 84 111 104 99 97 131 542 106 122 103 331 957 Solar 64 257 405 405 541 686 2294 676 811 946 2433 4791 WTE 5 5 0 0 3 0 8 0 5 5 10 23 Sub Total 376 607 802 852 1019 1214 4494 1324 1582 1838 4744 9614 Manipur Wind 0 0 0 SHP 5.45 1 1 1.5 1.5 1.5 1.5 7 2 2 2 6 14 Bio energy 0 2 2 2 Solar 0 0 0 WTE 0 2 2 2 Sub Total 1 1 1.5 1.5 1.5 1.5 7 2 2 4 8 16 Meghalaya Wind 0 0 0 SHP 31.03 2 2 3 4 3 3 15 3 3 3 9 26 Bio energy 0 1 1 1 Solar 0 0 0 WTE 0 2 2 2 Sub Total 2 2 3 4 3 3 15 3 3 4 10 27 Mizoram Wind 0 0 0 SHP 36.47 2 2 2 3 2 2 11 2 2 2 6 19 Bio energy 0 1 1 1 Solar 0 0 0 WTE 0 0 0 Sub Total 2 2 2 3 2 2 11 2 2 3 7 20 Nagaland Wind 0 0 0 SHP 28.67 2 2 3 3 3 2 13 3 2 2 7 22 Bio energy 0 0 0 Solar 0 0 0 WTE 0 2 2 2 Sub Total 2 2 3 3 3 2 13 3 2 2 7 22
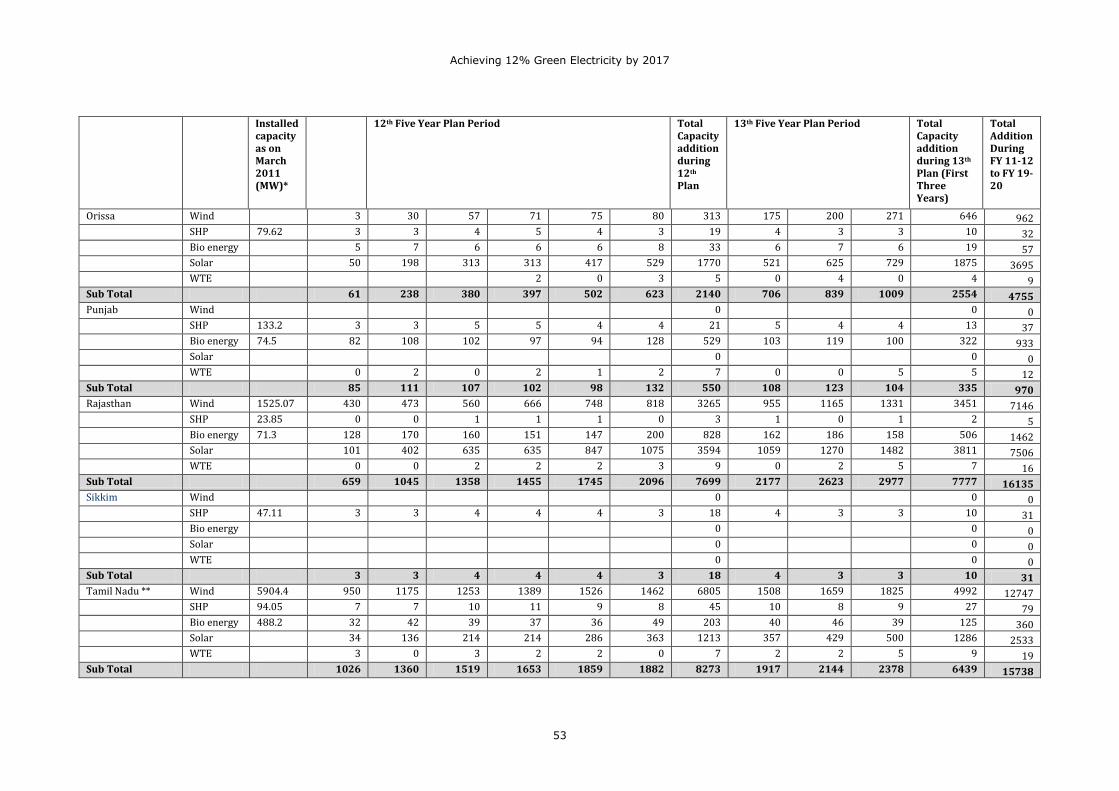
Achieving 12% Green Electricity by 2017
53
Installed
capacity as on March 2011 (MW)*
12th Five Year Plan Period Total Capacity addition during 12th Plan
13th Five Year Plan Period Total Capacity addition during 13th Plan (First Three Years)
Total Addition During FY 11-12 to FY 19-20
Orissa Wind 3 30 57 71 75 80 313 175 200 271 646 962 SHP 79.62 3 3 4 5 4 3 19 4 3 3 10 32 Bio energy 5 7 6 6 6 8 33 6 7 6 19 57 Solar 50 198 313 313 417 529 1770 521 625 729 1875 3695 WTE 2 0 3 5 0 4 0 4 9 Sub Total 61 238 380 397 502 623 2140 706 839 1009 2554 4755 Punjab Wind 0 0 0 SHP 133.2 3 3 5 5 4 4 21 5 4 4 13 37 Bio energy 74.5 82 108 102 97 94 128 529 103 119 100 322 933 Solar 0 0 0 WTE 0 2 0 2 1 2 7 0 0 5 5 12 Sub Total 85 111 107 102 98 132 550 108 123 104 335 970 Rajasthan Wind 1525.07 430 473 560 666 748 818 3265 955 1165 1331 3451 7146 SHP 23.85 0 0 1 1 1 0 3 1 0 1 2 5 Bio energy 71.3 128 170 160 151 147 200 828 162 186 158 506 1462 Solar 101 402 635 635 847 1075 3594 1059 1270 1482 3811 7506 WTE 0 0 2 2 2 3 9 0 2 5 7 16 Sub Total 659 1045 1358 1455 1745 2096 7699 2177 2623 2977 7777 16135 Sikkim Wind 0 0 0 SHP 47.11 3 3 4 4 4 3 18 4 3 3 10 31 Bio energy 0 0 0 Solar 0 0 0 WTE 0 0 0 Sub Total 3 3 4 4 4 3 18 4 3 3 10 31 Tamil Nadu ** Wind 5904.4 950 1175 1253 1389 1526 1462 6805 1508 1659 1825 4992 12747 SHP 94.05 7 7 10 11 9 8 45 10 8 9 27 79 Bio energy 488.2 32 42 39 37 36 49 203 40 46 39 125 360 Solar 34 136 214 214 286 363 1213 357 429 500 1286 2533 WTE 3 0 3 2 2 0 7 2 2 5 9 19 Sub Total 1026 1360 1519 1653 1859 1882 8273 1917 2144 2378 6439 15738
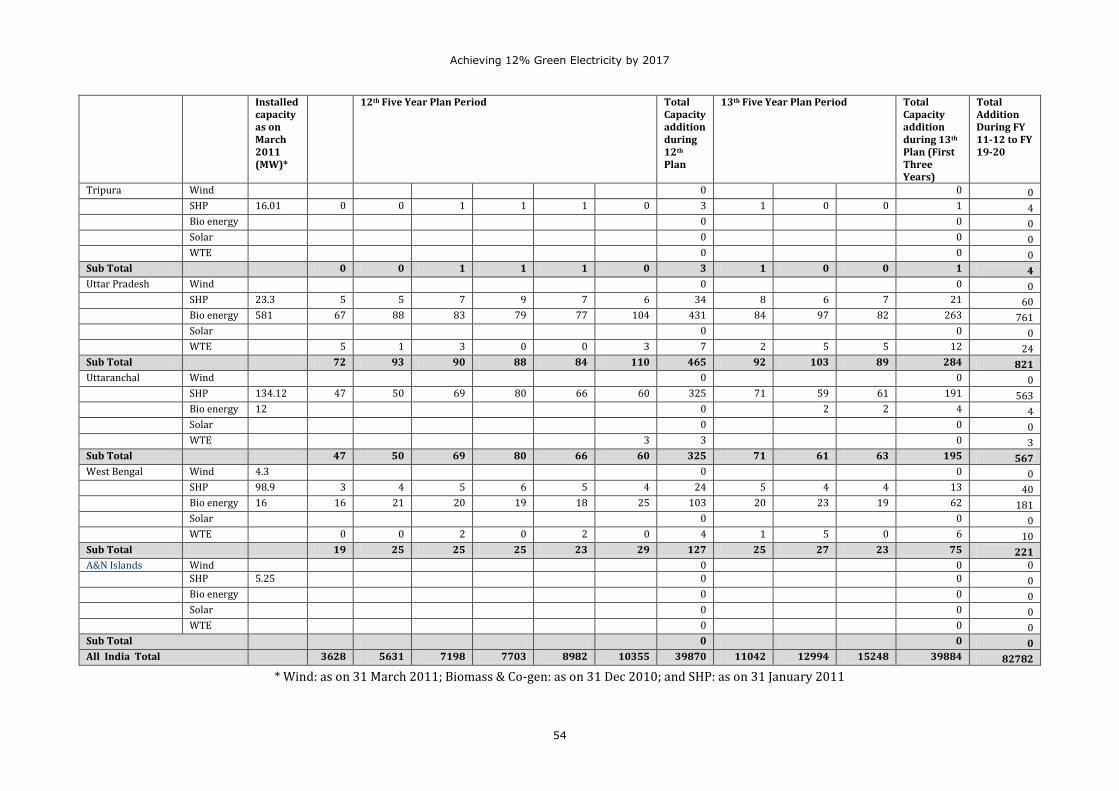
Achieving 12% Green Electricity by 2017
54
Installed capacity as on March 2011 (MW)*
12th Five Year Plan Period Total Capacity addition during 12th Plan
13th Five Year Plan Period Total Capacity addition during 13th Plan (First Three Years)
Total Addition During FY 11-12 to FY 19-20
Tripura Wind 0 0 0 SHP 16.01 0 0 1 1 1 0 3 1 0 0 1 4 Bio energy 0 0 0 Solar 0 0 0 WTE 0 0 0 Sub Total 0 0 1 1 1 0 3 1 0 0 1 4 Uttar Pradesh Wind 0 0 0 SHP 23.3 5 5 7 9 7 6 34 8 6 7 21 60 Bio energy 581 67 88 83 79 77 104 431 84 97 82 263 761 Solar 0 0 0 WTE 5 1 3 0 0 3 7 2 5 5 12 24 Sub Total 72 93 90 88 84 110 465 92 103 89 284 821 Uttaranchal Wind 0 0 0 SHP 134.12 47 50 69 80 66 60 325 71 59 61 191 563 Bio energy 12 0 2 2 4 4 Solar 0 0 0 WTE 3 3 0 3 Sub Total 47 50 69 80 66 60 325 71 61 63 195 567 West Bengal Wind 4.3 0 0 0 SHP 98.9 3 4 5 6 5 4 24 5 4 4 13 40 Bio energy 16 16 21 20 19 18 25 103 20 23 19 62 181 Solar 0 0 0 WTE 0 0 2 0 2 0 4 1 5 0 6 10 Sub Total 19 25 25 25 23 29 127 25 27 23 75 221 A&N Islands Wind 0 0 0 SHP 5.25 0 0 0 Bio energy 0 0 0 Solar 0 0 0 WTE 0 0 0 Sub Total 0 0 0 All India Total 3628 5631 7198 7703 8982 10355 39870 11042 12994 15248 39884 82782
* Wind: as on 31 March 2011; Biomass & Co-gen: as on 31 Dec 2010; and SHP: as on 31 January 2011
Achieving 12% Green Electricity by 2017
55
4.7. KEY OUTCOMES
I. The government’s plans for development of RE are not consistent with the policies. The RE
capacity addition targeted by MNRE and that planned under the JNNSM are inadequate to
meet the target generation mandated under the NAPCC. The targets originally planned by the
working group will have to be revised to achieve the 12% and 15% RE penetration by year
FY 2017 and 2020 respectively. The revision in planned RE capacity in 12th and 13th Plans
are still possible as the 12th plan Working Group Report on RE is yet to be finalized.
II. The analysis of available RE potential, installed capacities and gaps highlights the fact that all
RE sources provide an opportunity to be developed and scaled up, though wind-based power
has the highest share in total RE installed capacity.
III. The preliminary studies of re-assessment of RE potential in India shows that the RE source,
particularly wind, is grossly under-estimated. In case of solar, the official potential
assessment in terms of technically exploitable and economically feasible capacity is not
available in public domain. This calls for an urgent RE potential re-assessment study at the
national level. In the absence of realistic RE potential assessment figures, policy decisions on
power generation could be skewed in favour of conventional sources.
IV. The RE capacity addition projections under all three Scenarios are sufficient to raise the Pan
India level RE-based generation to a level of 12% and 15% in the national grid by end of FY
2017 and 2020 respectively.
V. The capacity addition projections of non-fossil-based co-generation shown in all Scenarios
reveal that the present assessed co-generation potential will be exhausted by the end of FY
2016.
VI. In order to achieve the desired RE share in the all India energy mix, the solar capacity
addition targets mentioned under the three phases of JNNSM have to be realized fully, plus a
substantial contribution is also required from wind power and the relatively unexplored RE
technologies like SHP and biomass.
VII. The Pan India discounted impact on APPC due to purchase of RE power as suggested in
Scenarios 1,2 and 3 is in the range of 12-16 paisa/kWh, 13-18 paisa/kWh, and 16-21
paisa/kWh (read in the same order). This is substantial and utilities will find it difficult to
accommodate in retail tariff. Therefore, to reduce the impact to some extent, appropriate
financial support in the form of soft loan to reduce the cost of generation or generation based
incentives (GBI) should be considered. The adverse impact on financial health of utilities can
also be minimized by reducing the transmission and distribution losses and improving the
billing and collection efficiencies of the utilities, or by increasing the share of large hydro
where possible.
VIII. Although all the three scenarios are capable of meeting the national RPO of 12% and 15% by
year 2017 and 2020, considering the importance of scenario I and III, any one of them may
be adopted at the national level.
IX. The huge untapped solar potential in the country is important from the point of view of
energy security. International experience shows that cost reduction can be achieved by way
of mass production and R&D efforts.
Achieving 12% Green Electricity by 2017
56
X. If capacity addition projections in Scenario 3 (solar dominant) have to be realized, then
annually, on an average basis, solar capacity addition of around 3,395 MW and wind capacity
addition of the order of 3,400 MW is required to be realized during the 12th five year Plan
period. During first three years of the 13th Plan period, solar capacity addition needs to be
further accelerated to 6,000 MW on an annual average basis. This can be achieved
considering the fact that last year India has added 2,300 MW capacity wind power projects.
Our neighbouring country China has increased its installed wind capacity by a factor of 21
between 2004 and 2009, from 1.2 GW to more than 25 GW. Even in India, states like Tamil
Nadu have significantly developed the assessed wind potential in a very short span of time.
XI. Adoption of scenario I (wind dominant) against that of scenario III (solar dominant) at
national level will reduce the impact on pan-India APPC by 4-5 paise / kWh.
XII. The state-wise RE technology wise capacity addition plan envisaged under the wind and solar
dominant scenarios reveal that the individual states can share the national RPO within the
available RE potential.
XIII. The state-wise RE technology mix coming out from state level analysis indicate ample scope
for wind power development in the states of Tamil Nadu, Karnataka, Rajasthan, Maharashtra,
Gujarat, Andhra Pradesh and Orissa. The contribution of SHP can significantly come from the
north and north-eastern states like Himachal Pradesh, J&K, Uttarakhand and Arunachal
Pradesh. Whereas states like Tamil Nadu, Andhra Pradesh and Uttar Pradesh can still develop
biomass power potential to a great extent.
XIV. Based on the analysis of solar radiation data, geographical stretch, and availability of
wasteland, states like Rajasthan, Andhra Pradesh, Gujarat, Madhya Pradesh, Maharashtra,
Orissa, Karnataka, and Tamil Nadu can play a decisive role in realizing the solar capacity
addition under the solar dominant scenario.
***
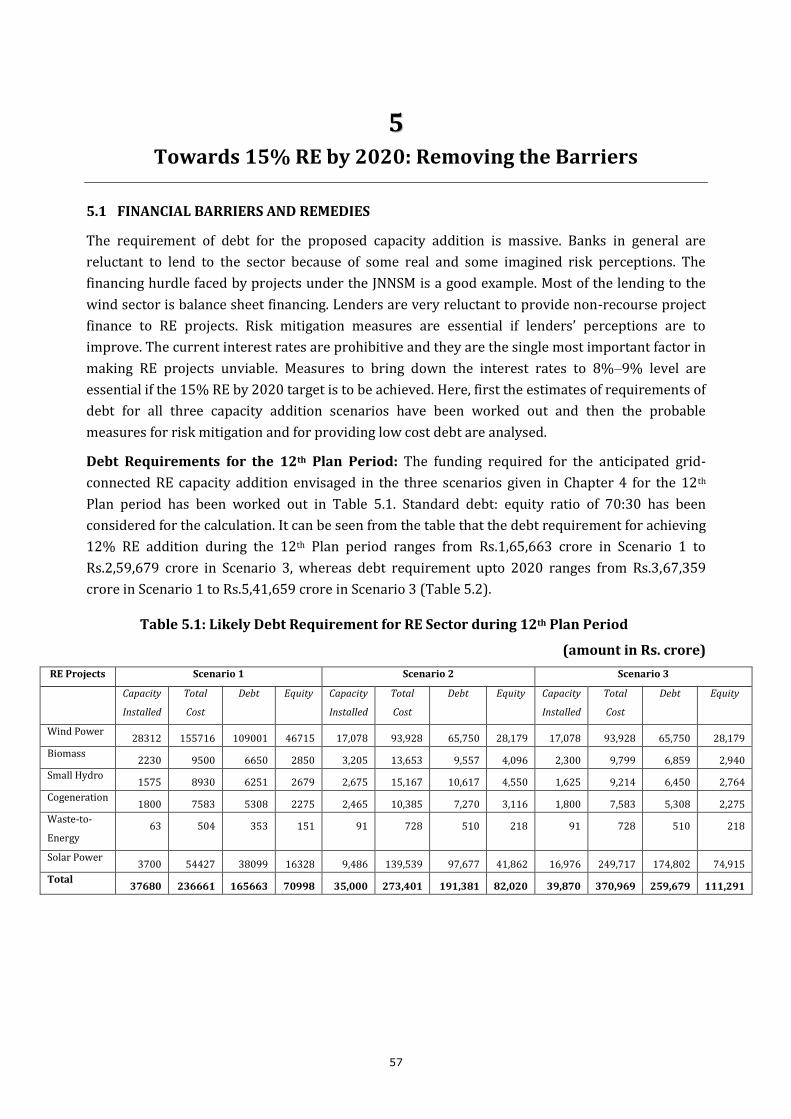
Achieving 12% Green Electricity by 2017
57
55
Towards 15% RE by 2020: Removing the Barriers
5.1 FINANCIAL BARRIERS AND REMEDIES
The requirement of debt for the proposed capacity addition is massive. Banks in general are
reluctant to lend to the sector because of some real and some imagined risk perceptions. The
financing hurdle faced by projects under the JNNSM is a good example. Most of the lending to the
wind sector is balance sheet financing. Lenders are very reluctant to provide non-recourse project
finance to RE projects. Risk mitigation measures are essential if lenders’ perceptions are to
improve. The current interest rates are prohibitive and they are the single most important factor in
making RE projects unviable. Measures to bring down the interest rates to 8%–9% level are
essential if the 15% RE by 2020 target is to be achieved. Here, first the estimates of requirements of
debt for all three capacity addition scenarios have been worked out and then the probable
measures for risk mitigation and for providing low cost debt are analysed.
Debt Requirements for the 12th Plan Period: The funding required for the anticipated grid-
connected RE capacity addition envisaged in the three scenarios given in Chapter 4 for the 12th
Plan period has been worked out in Table 5.1. Standard debt: equity ratio of 70:30 has been
considered for the calculation. It can be seen from the table that the debt requirement for achieving
12% RE addition during the 12th Plan period ranges from Rs.1,65,663 crore in Scenario 1 to
Rs.2,59,679 crore in Scenario 3, whereas debt requirement upto 2020 ranges from Rs.3,67,359
crore in Scenario 1 to Rs.5,41,659 crore in Scenario 3 (Table 5.2).
Table 5.1: Likely Debt Requirement for RE Sector during 12th Plan Period
(amount in Rs. crore)
RE Projects Scenario 1 Scenario 2 Scenario 3
Capacity
Installed
Total
Cost
Debt Equity Capacity
Installed
Total
Cost
Debt Equity Capacity
Installed
Total
Cost
Debt Equity
Wind Power 28312 155716 109001 46715 17,078 93,928 65,750 28,179 17,078 93,928 65,750 28,179
Biomass 2230 9500 6650 2850 3,205 13,653 9,557 4,096 2,300 9,799 6,859 2,940
Small Hydro 1575 8930 6251 2679 2,675 15,167 10,617 4,550 1,625 9,214 6,450 2,764
Cogeneration 1800 7583 5308 2275 2,465 10,385 7,270 3,116 1,800 7,583 5,308 2,275
Waste-to-
Energy 63 504 353 151 91 728 510 218 91 728 510 218
Solar Power 3700 54427 38099 16328 9,486 139,539 97,677 41,862 16,976 249,717 174,802 74,915
Total 37680 236661 165663 70998 35,000 273,401 191,381 82,020 39,870 370,969 259,679 111,291
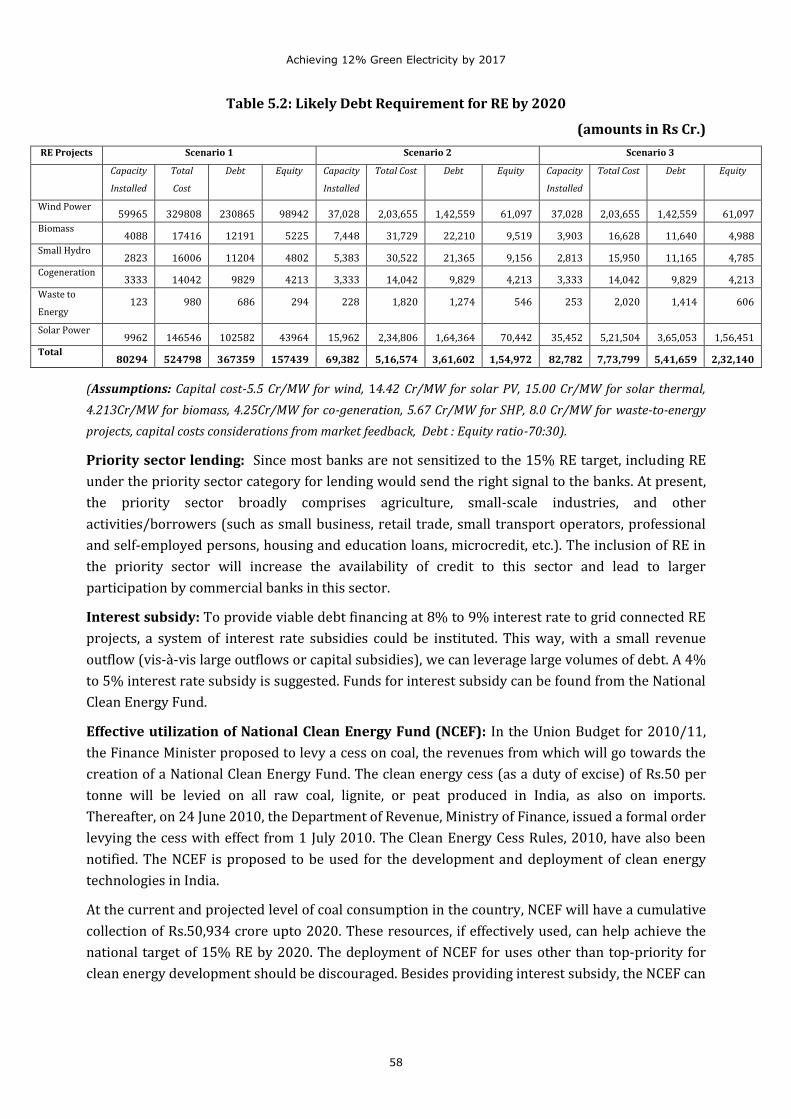
Achieving 12% Green Electricity by 2017
58
Table 5.2: Likely Debt Requirement for RE by 2020
(amounts in Rs Cr.)
RE Projects Scenario 1 Scenario 2 Scenario 3
Capacity
Installed
Total
Cost
Debt Equity Capacity
Installed
Total Cost Debt Equity Capacity
Installed
Total Cost Debt Equity
Wind Power 59965 329808 230865 98942 37,028 2,03,655 1,42,559 61,097 37,028 2,03,655 1,42,559 61,097
Biomass 4088 17416 12191 5225 7,448 31,729 22,210 9,519 3,903 16,628 11,640 4,988
Small Hydro 2823 16006 11204 4802 5,383 30,522 21,365 9,156 2,813 15,950 11,165 4,785
Cogeneration 3333 14042 9829 4213 3,333 14,042 9,829 4,213 3,333 14,042 9,829 4,213
Waste to
Energy 123 980 686 294 228 1,820 1,274 546 253 2,020 1,414 606
Solar Power 9962 146546 102582 43964 15,962 2,34,806 1,64,364 70,442 35,452 5,21,504 3,65,053 1,56,451
Total 80294 524798 367359 157439 69,382 5,16,574 3,61,602 1,54,972 82,782 7,73,799 5,41,659 2,32,140
(Assumptions: Capital cost-5.5 Cr/MW for wind, 14.42 Cr/MW for solar PV, 15.00 Cr/MW for solar thermal,
4.213Cr/MW for biomass, 4.25Cr/MW for co-generation, 5.67 Cr/MW for SHP, 8.0 Cr/MW for waste-to-energy
projects, capital costs considerations from market feedback, Debt : Equity ratio-70:30).
Priority sector lending: Since most banks are not sensitized to the 15% RE target, including RE
under the priority sector category for lending would send the right signal to the banks. At present,
the priority sector broadly comprises agriculture, small-scale industries, and other
activities/borrowers (such as small business, retail trade, small transport operators, professional
and self-employed persons, housing and education loans, microcredit, etc.). The inclusion of RE in
the priority sector will increase the availability of credit to this sector and lead to larger
participation by commercial banks in this sector.
Interest subsidy: To provide viable debt financing at 8% to 9% interest rate to grid connected RE
projects, a system of interest rate subsidies could be instituted. This way, with a small revenue
outflow (vis-à-vis large outflows or capital subsidies), we can leverage large volumes of debt. A 4%
to 5% interest rate subsidy is suggested. Funds for interest subsidy can be found from the National
Clean Energy Fund.
Effective utilization of National Clean Energy Fund (NCEF): In the Union Budget for 2010/11,
the Finance Minister proposed to levy a cess on coal, the revenues from which will go towards the
creation of a National Clean Energy Fund. The clean energy cess (as a duty of excise) of Rs.50 per
tonne will be levied on all raw coal, lignite, or peat produced in India, as also on imports.
Thereafter, on 24 June 2010, the Department of Revenue, Ministry of Finance, issued a formal order
levying the cess with effect from 1 July 2010. The Clean Energy Cess Rules, 2010, have also been
notified. The NCEF is proposed to be used for the development and deployment of clean energy
technologies in India.
At the current and projected level of coal consumption in the country, NCEF will have a cumulative
collection of Rs.50,934 crore upto 2020. These resources, if effectively used, can help achieve the
national target of 15% RE by 2020. The deployment of NCEF for uses other than top-priority for
clean energy development should be discouraged. Besides providing interest subsidy, the NCEF can
Achieving 12% Green Electricity by 2017
59
also be used for providing credit guarantees or for funding transmission infrastructure in priority
states with large potential for renewable power development.
Tax-free Green Bonds: Allowing Indian banks and financial institutions to raise low-cost capital
through tax-free bonds and thereon lending the proceeds at low interest to the RE sector is another
way to facilitate low cost debt for renewables. This mechanism has been adopted many times to
fund the infrastructure sector; RE specific green bonds would be appropriate now.
Role of IREDA and the Green Bank: IREDA should be allowed to raise low cost funds abroad and
thereon lend the same as soft loans to RE projects in India. IREDA should also be enabled to explore
new instruments like green bonds, other new synthesized products with which to raise financing
and enable risk sharing and mitigation in renewable energy projects. A national partial risk
guarantee facility which could be managed by IREDA or private sector financial institutions, could
address specific renewable energy project risks. International financial institutions could be asked
to backstop such a facility if the intention is to attract global financiers and developers. It is noted
that ADB is already planning such a facility in India.
The role of the proposed Green Bank is not yet clear. The Green Bank could deploy many of these
innovative financing instruments. However, considering the large volumes of debt required,
measures by IREDA/Green Bank would not be sufficient; it would be essential to bring in all
commercial banks to RE financing.
Creation of State-Level Clean Energy Funds: In 2004, Maharashtra decided to levy a cess on
conventional power to generate funds for creating a state-level Clean Energy Fund. Subsequently,
Karnataka in its 2009 RE Policy announced its intention to levy a green cess; however the decision
is yet to be implemented. Recently, Gujarat has levied a green cess on conventional power to create
a state-level Clean Energy Fund. Some preliminary steps have been taken in Andhra Pradesh, Tamil
Nadu and Bihar towards discussing the need for levying such a green cess. Even though this is a
state subject, Government of India could persuade the states to set up Clean Energy Funds in all
states. This state-level resource could be utilized for part-funding RE transmission infrastructure,
providing credit guarantee for loans to RE projects, equity funding, offering additional incentives to
RE-based off-grid or micro-grid projects, etc.
5.2 POLICY BARRIERS AND REMEDIES
India lacks a comprehensive policy statement for RE or an enabling legal framework. Different
policy documents, old and new, continue to co-exist creating tremendous confusion among state-
level implementers and investors.
5.2.1 Need for cohesion in GoI policy:
The contradiction with regard to share of RE in the fuel mix over the period 2010–2020 under the
Government of India’s major policy documents, viz the National Action Plan on Climate Change,
Integrated Energy Policy, and the interim report on ‘Low Carbon Strategy for Inclusive Growth in
India’, highlights the need for bringing cohesion in the policy of the Government of India to align
the same with the NAPCC objectives.
Preparing a new Integrated Energy Policy (IEP): The Government of India approved and
published its Integrated Energy Policy in August 2006. Future energy security has been assessed
Achieving 12% Green Electricity by 2017
60
through this document till the 15th Five-year Plan (year 2032). While the IEP put forth some very
welcome objectives, there were some major loopholes in its detailing. The biggest stumbling blocks
lie in the two main assumptions made by the policy, namely that (a) renewables may account for
only 5% to 6% of India’s energy mix by 2031/32; and (b) renewables would be critical to India’s
energy independence only beyond 2050. In view of subsequent NAPCC target of 15% RE by 2020, it
is now necessary to prepare a new IEP.
Aligning the low carbon growth strategy with NAPCC: The Planning Commission, Govt. of India,
had appointed a 26-member expert committee in January 2010 to prepare the report on “Low
Carbon Strategies for Inclusive Growth in India.” The mandate for the expert committee included
preparation of a cross-sectoral study and recommendations on critical low carbon initiatives to be
undertaken, including sector-specific initiatives with timelines and targets starting in 2011. The
committee has submitted its interim report to the government in May 2011. The report analyses
projection of fuel mix and emissions under different scenarios for both 8% and 9% average GDP
growth rate up to 2020. The report is methodologically skewed in favour of fossil fuels. For
example, even though the committee recognises that even if at least 1% of the land of the country is
utilised for solar power generation it could generate 5,00,000 MW of power from solar, there are
no proposals to accelerate solar energy deployment.
While recommending the fuel mix projections for year 2020, the report has not considered the RE
injection targets specified under the NAPCC. Under the different scenarios developed for 8% and
9% GDP growth, the share of RE ranges from 35 GW to 54 GW, with maximum contribution from
wind (30 GW), solar (20 GW), biomass and others (0.4 GW). The RE capacities considered in the
projection can only raise the level of RE penetration to the extent of 3.76% (baseline scenario) to
5.70% (aggressive efficiency scenario) of energy mix in the grid by year 2020.
The interim report has taken cognizance of the past reduction in capital cost of solar power and
considered the JNNSM recommended solar capacity in its design of the fuel mix. However, the
report has totally ignored the biomass, co-generation and SHP technologies. The combined share of
these technologies by 2020 is shown as 4,000 MW in all scenarios, whereas the current combined
installed capacity of these technologies stood at around 6,000 MW. The assumption of a moderate
17% PLF for wind in the report against the CERC approved PLF range of 20%–30% is also not
based on facts and thus underestimates the technology /efficiency improvements in wind
technology. It is necessary to rectify such methodological lapses in the final report of the expert
committee and align it with the NAPCC targets.
Need for a separate RE law: The Electricity Act, 2003, has some enabling provisions to promote
grid connected renewable energy sources. However, there are no legally binding targets facilitating
the creation, transmission, and deployment of renewable energy or provision for accelerating all
round development of renewable energy. So India needs to enact a comprehensive law to facilitate
renewable energy development. Even though there is a government decision to enact such a
law, it has not been implemented yet. Many countries have enacted such RE laws with spectacular
results (as in the case of China). The government decision needs to be implemented and the draft
law should be presented to the Parliament in a time-bound manner.
Achieving 12% Green Electricity by 2017
61
Abolishing subsidies to fossil fuels: Conventional power continues to enjoy various hidden
subsidies. A two-year research study conducted by WISE has revealed that conventional power
projects in India receive subsidies to the extent of 150% of their capital cost over their lifetime
(WISE, 2008). Besides, India continues to subsidise petroleum products, coal mining and
transportation, keeping prices of petroleum products and coal arbitrarily low compared to
international prices. Of late, there has been a welcome move to remove fossil fuel subsidies. In a
world facing the threat of climate change, subsidies to expand the burning of coal and oil can no
longer be justified. A recent study by the International Energy Agency titled ‘Clean Energy Progress
Report’, has said that “fossil fuel has received USD 312 billion subsidy globally as against USD 57
billion for renewable energy in the year 2009” [IEA 2011]. Shifting these subsidies to the
development of climate-benign energy sources would be appropriate.
Internalizing the Cost of Externalities: Fossil-fuel-based power generation creates huge
environmental, social and economic externalities. In the EU countries, extensive research was
undertaken (The ExternE Project) to determine and quantify the cost of externalities of
conventional power generation. Such a scientific assessment has played a major role in evolving
forward-looking policies for RE development in Europe. India also needs to undertake such a study
and internalize those costs in the pricing of fossil-based electricity. Then it would be seen that even
solar energy would achieve grid parity soon.
Creating a manufacturing base for CSP: Concentrating solar power (CSP) holds immense
potential for India. But the biggest barrier to realizing that potential is the absence of a
manufacturing base. Some start-ups are struggling to develop the technology, but they are a long
way off from commercialization. The solar mission document mentions that an incentive package
for CSP manufacturing on the lines of SIPs for PV mentioned earlier, is in the offing, but nothing
further has been heard of the idea so far. This needs to be looked into urgently. This needs to be
looked into urgently. Some foreign manufacturers such as Abengoa Solar of Spain and Infinia
Corporation of USA, have opened offices in India, but have not ventured into local manufacturing.
MNRE needs to take planned steps to create a local manufacturing base. Considering the huge
potential for CSP-based power generation in India, CSP has the potential to be cost-effective but the
recent fall in PV prices has been a setback. Indigenous manufacturing is necessary to lower CSP
costs.
5.2.2. Revisions/Improvement in Policy at the State Level
Inconsistencies and lack of comprehension of the needs of the RE sector pervade many of the state-
level policies published so far. They set lofty objectives but are found lacking in details. The
national objectives are not considered while drafting state policies. Many state polices have
contributed to more uncertainties and confusion instead of promoting RE.
Comprehensive state-specific RE policies: Development of renewable energy largely depends on
multiple institutions which are empowered under different laws. These institutions include
different ministries/departments of central and state governments, as well as the central and state
electricity regulatory commissions. However, the progress of RE projects on the ground depends
mainly on state level policies formulated by the energy/power department and the state nodal
agencies. Most of the state governments have announced their state renewable energy policies in
Achieving 12% Green Electricity by 2017
62
technology-specific or fragmented forms. Multiplicity of policies and agencies governing the
renewable energy sector makes integrated interventions difficult and undermines investors’
confidence. Overlapping in the jurisdiction has also been noticed in some cases like in Punjab,
where the state government has specified RE procurement tariff under the state policy by
transgressing into the SERC’s powers. Discrepancies have also been noticed in the
transmission/wheeling charges and cross subsidy charges in case of third party transaction of RE.
The RE targets set by many states are not in line with the national targets. The state governments
should be persuaded to prepare integrated RE policies (covering all RE technologies) aimed
towards a common national goal of achieving RE capacity addition.
Aligning state targets with national objectives: It is observed that the state Planning Board does
not specify RE capacity addition targets while planning the energy/power sector activities. The
dynamic RE target setting by the State Planning Board will have a positive impact on the RE sector
as other concerned government departments will take note of it and facilitate development of RE in
the state. Therefore, during preparation of the 12th Plan, the Central Planning Commission and
MNRE need to co-ordinate with the State Planning Boards, Energy departments and State Nodal
Agencies to ensure that states accept RE targets in line with national objectives.
Single-window clearance for RE projects (as far as possible): As per the policies and the
procedure set out by the state governments, the project proponents are required to take number of
permissions/approvals from the various state government departments/agencies prior to the
commissioning of an RE project, resulting in delayed implementation and commissioning. For
example, more than 60 percent of project cycle time in small hydropower projects is spent getting
various government clearances. Clearances must be obtained from (i) wildlife, fisheries, panchayat,
irrigation, public health, revenue department; (ii) SERCs (for PPAs); (iii) forest–state and centre,
pollution control board, industrial license, labour permits, state transmission utilities; (iv)
distribution companies’ approval for interconnection and for usage of explosives for excavation;
and (v) state nodal agencies (for implementation agreement, infrastructure permission), techno-
economic approval from state utility and transfer of land in case land is to be procured in tribal
areas. Similarly, a wind power project developer has to obtain more than 30 clearances to get a
project approval.
All states may be persuaded to create Empowered Committees chaired by very few senior officials
like Principal Secretary (Energy) or the Chief Secretary to accord single window clearance for
setting RE projects at the state level. Admitted, such a Committee will not be able to give all
clearances. For example when forest land is involved, clearance of both the state and central
governments are required. Barring such clearances involving concurrent jurisdiction or exclusive
central government agency jurisdiction like aviation, a state empowered committee can give
clearances. Even though some states like Maharashtra, Rajasthan and Karnataka have declared
single-window clearances, in practice, it doesn’t happen. Rajasthan and Karnataka have set
Empowered Committee of Secretaries for this purpose, whereas Maharashtra doesn’t have any
such institutional set-up. There is a need to institutionalise single-window clearance system to the
extent possible.
An alternative would be to pilot a no-objection-based approval process. Such a process would
require officials to explicitly reject an application and provide written explanations for the reasons
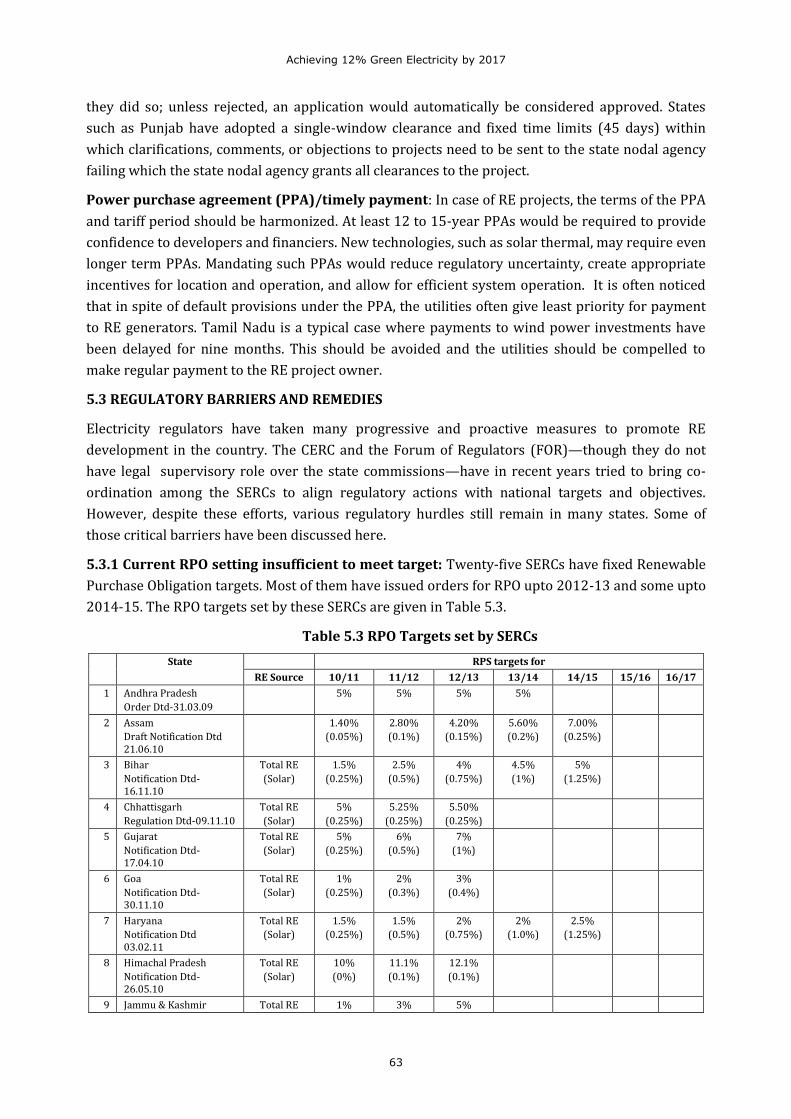
Achieving 12% Green Electricity by 2017
63
they did so; unless rejected, an application would automatically be considered approved. States
such as Punjab have adopted a single-window clearance and fixed time limits (45 days) within
which clarifications, comments, or objections to projects need to be sent to the state nodal agency
failing which the state nodal agency grants all clearances to the project.
Power purchase agreement (PPA)/timely payment: In case of RE projects, the terms of the PPA
and tariff period should be harmonized. At least 12 to 15-year PPAs would be required to provide
confidence to developers and financiers. New technologies, such as solar thermal, may require even
longer term PPAs. Mandating such PPAs would reduce regulatory uncertainty, create appropriate
incentives for location and operation, and allow for efficient system operation. It is often noticed
that in spite of default provisions under the PPA, the utilities often give least priority for payment
to RE generators. Tamil Nadu is a typical case where payments to wind power investments have
been delayed for nine months. This should be avoided and the utilities should be compelled to
make regular payment to the RE project owner.
5.3 REGULATORY BARRIERS AND REMEDIES
Electricity regulators have taken many progressive and proactive measures to promote RE
development in the country. The CERC and the Forum of Regulators (FOR)—though they do not
have legal supervisory role over the state commissions—have in recent years tried to bring co-
ordination among the SERCs to align regulatory actions with national targets and objectives.
However, despite these efforts, various regulatory hurdles still remain in many states. Some of
those critical barriers have been discussed here.
5.3.1 Current RPO setting insufficient to meet target: Twenty-five SERCs have fixed Renewable
Purchase Obligation targets. Most of them have issued orders for RPO upto 2012-13 and some upto
2014-15. The RPO targets set by these SERCs are given in Table 5.3.
Table 5.3 RPO Targets set by SERCs
State RPS targets for
RE Source 10/11 11/12 12/13 13/14 14/15 15/16 16/17
1 Andhra Pradesh
Order Dtd-31.03.09
5% 5% 5% 5%
2 Assam
Draft Notification Dtd 21.06.10
1.40%
(0.05%)
2.80%
(0.1%)
4.20%
(0.15%)
5.60%
(0.2%)
7.00%
(0.25%)
3 Bihar
Notification Dtd-16.11.10
Total RE
(Solar)
1.5%
(0.25%)
2.5%
(0.5%)
4%
(0.75%)
4.5%
(1%)
5%
(1.25%)
4 Chhattisgarh
Regulation Dtd-09.11.10
Total RE
(Solar)
5%
(0.25%)
5.25%
(0.25%)
5.50%
(0.25%)
5 Gujarat
Notification Dtd-17.04.10
Total RE
(Solar)
5%
(0.25%)
6%
(0.5%)
7%
(1%)
6 Goa
Notification Dtd-30.11.10
Total RE
(Solar)
1%
(0.25%)
2%
(0.3%)
3%
(0.4%)
7 Haryana
Notification Dtd 03.02.11
Total RE
(Solar)
1.5%
(0.25%)
1.5%
(0.5%)
2%
(0.75%)
2%
(1.0%)
2.5%
(1.25%)
8 Himachal Pradesh
Notification Dtd-26.05.10
Total RE
(Solar)
10%
(0%)
11.1%
(0.1%)
12.1%
(0.1%)
9 Jammu & Kashmir Total RE 1% 3% 5%
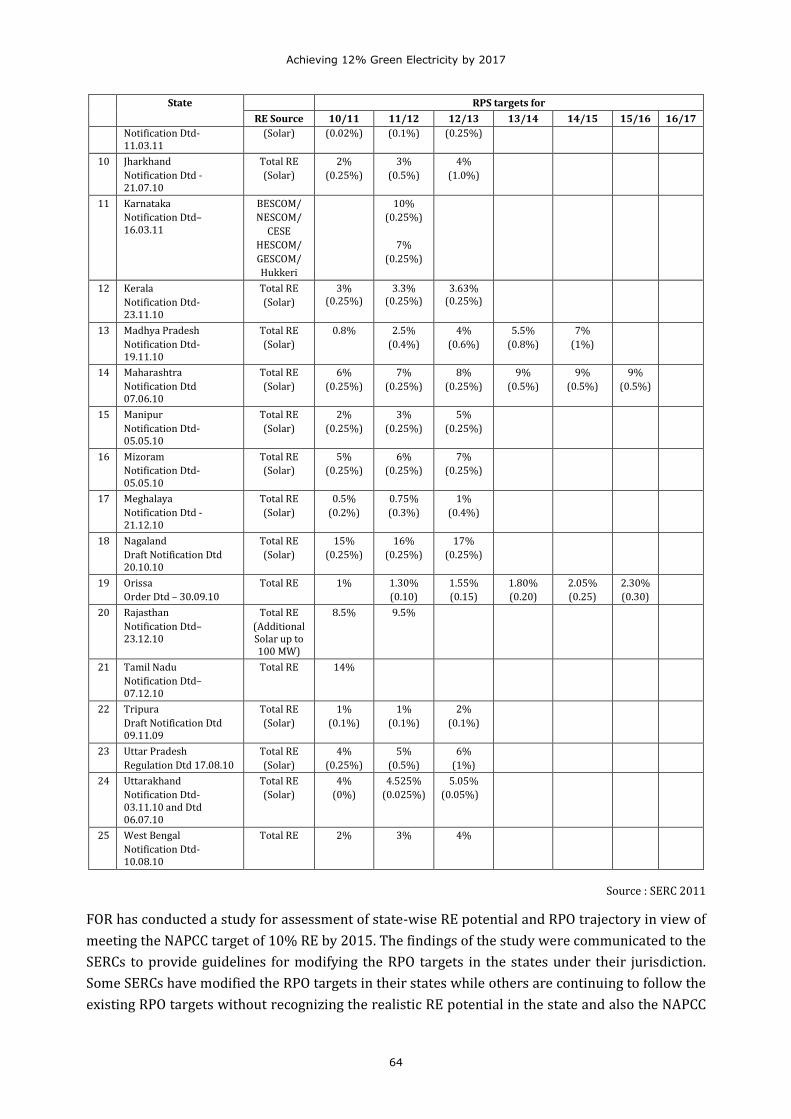
Achieving 12% Green Electricity by 2017
64
State RPS targets for
RE Source 10/11 11/12 12/13 13/14 14/15 15/16 16/17
Notification Dtd-11.03.11
(Solar) (0.02%) (0.1%) (0.25%)
10 Jharkhand
Notification Dtd -21.07.10
Total RE
(Solar)
2%
(0.25%)
3%
(0.5%)
4%
(1.0%)
11 Karnataka
Notification Dtd–16.03.11
BESCOM/
NESCOM/
CESE
HESCOM/
GESCOM/
Hukkeri
10%
(0.25%)
7%
(0.25%)
12 Kerala
Notification Dtd- 23.11.10
Total RE
(Solar)
3% (0.25%)
3.3% (0.25%)
3.63% (0.25%)
13 Madhya Pradesh
Notification Dtd- 19.11.10
Total RE
(Solar)
0.8% 2.5%
(0.4%)
4%
(0.6%)
5.5%
(0.8%)
7%
(1%)
14 Maharashtra
Notification Dtd 07.06.10
Total RE
(Solar)
6%
(0.25%)
7%
(0.25%)
8%
(0.25%)
9%
(0.5%)
9%
(0.5%)
9%
(0.5%)
15 Manipur
Notification Dtd- 05.05.10
Total RE
(Solar)
2%
(0.25%)
3%
(0.25%)
5%
(0.25%)
16 Mizoram
Notification Dtd- 05.05.10
Total RE
(Solar)
5%
(0.25%)
6%
(0.25%)
7%
(0.25%)
17 Meghalaya
Notification Dtd -21.12.10
Total RE
(Solar)
0.5%
(0.2%)
0.75%
(0.3%)
1%
(0.4%)
18 Nagaland
Draft Notification Dtd 20.10.10
Total RE
(Solar)
15%
(0.25%)
16%
(0.25%)
17%
(0.25%)
19 Orissa
Order Dtd – 30.09.10
Total RE 1% 1.30%
(0.10)
1.55%
(0.15)
1.80%
(0.20)
2.05%
(0.25)
2.30%
(0.30)
20 Rajasthan
Notification Dtd– 23.12.10
Total RE
(Additional Solar up to 100 MW)
8.5% 9.5%
21 Tamil Nadu
Notification Dtd– 07.12.10
Total RE
14%
22 Tripura
Draft Notification Dtd 09.11.09
Total RE
(Solar)
1%
(0.1%)
1%
(0.1%)
2%
(0.1%)
23 Uttar Pradesh
Regulation Dtd 17.08.10
Total RE
(Solar)
4%
(0.25%)
5%
(0.5%)
6%
(1%)
24 Uttarakhand
Notification Dtd-03.11.10 and Dtd 06.07.10
Total RE
(Solar)
4%
(0%)
4.525%
(0.025%)
5.05%
(0.05%)
25 West Bengal
Notification Dtd- 10.08.10
Total RE
2% 3% 4%
Source : SERC 2011
FOR has conducted a study for assessment of state-wise RE potential and RPO trajectory in view of
meeting the NAPCC target of 10% RE by 2015. The findings of the study were communicated to the
SERCs to provide guidelines for modifying the RPO targets in the states under their jurisdiction.
Some SERCs have modified the RPO targets in their states while others are continuing to follow the
existing RPO targets without recognizing the realistic RE potential in the state and also the NAPCC
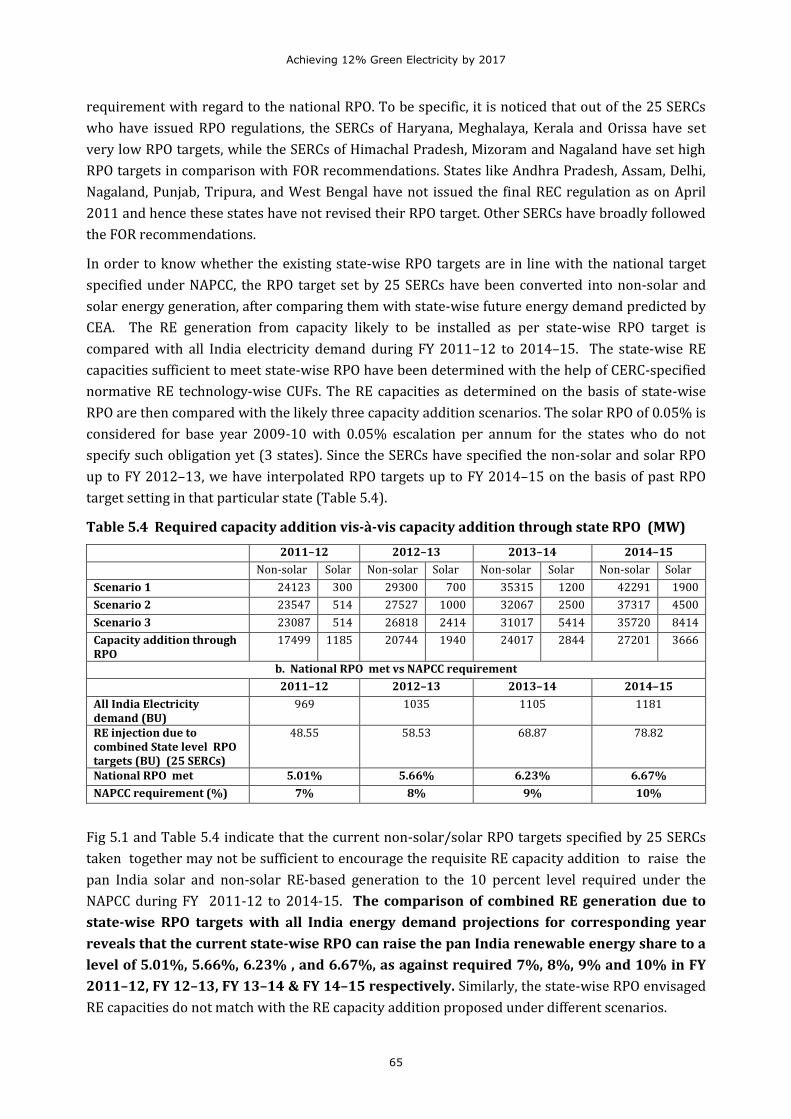
Achieving 12% Green Electricity by 2017
65
requirement with regard to the national RPO. To be specific, it is noticed that out of the 25 SERCs
who have issued RPO regulations, the SERCs of Haryana, Meghalaya, Kerala and Orissa have set
very low RPO targets, while the SERCs of Himachal Pradesh, Mizoram and Nagaland have set high
RPO targets in comparison with FOR recommendations. States like Andhra Pradesh, Assam, Delhi,
Nagaland, Punjab, Tripura, and West Bengal have not issued the final REC regulation as on April
2011 and hence these states have not revised their RPO target. Other SERCs have broadly followed
the FOR recommendations.
In order to know whether the existing state-wise RPO targets are in line with the national target
specified under NAPCC, the RPO target set by 25 SERCs have been converted into non-solar and
solar energy generation, after comparing them with state-wise future energy demand predicted by
CEA. The RE generation from capacity likely to be installed as per state-wise RPO target is
compared with all India electricity demand during FY 2011–12 to 2014–15. The state-wise RE
capacities sufficient to meet state-wise RPO have been determined with the help of CERC-specified
normative RE technology-wise CUFs. The RE capacities as determined on the basis of state-wise
RPO are then compared with the likely three capacity addition scenarios. The solar RPO of 0.05% is
considered for base year 2009-10 with 0.05% escalation per annum for the states who do not
specify such obligation yet (3 states). Since the SERCs have specified the non-solar and solar RPO
up to FY 2012–13, we have interpolated RPO targets up to FY 2014–15 on the basis of past RPO
target setting in that particular state (Table 5.4).
Table 5.4 Required capacity addition vis-à-vis capacity addition through state RPO (MW)
2011–12 2012–13 2013–14 2014–15
Non-solar Solar Non-solar Solar Non-solar Solar Non-solar Solar
Scenario 1 24123 300 29300 700 35315 1200 42291 1900
Scenario 2 23547 514 27527 1000 32067 2500 37317 4500
Scenario 3 23087 514 26818 2414 31017 5414 35720 8414
Capacity addition through RPO
17499 1185 20744 1940 24017 2844 27201 3666
b. National RPO met vs NAPCC requirement
2011–12 2012–13 2013–14 2014–15
All India Electricity demand (BU)
969 1035 1105 1181
RE injection due to combined State level RPO targets (BU) (25 SERCs)
48.55 58.53 68.87 78.82
National RPO met 5.01% 5.66% 6.23% 6.67%
NAPCC requirement (%) 7% 8% 9% 10%
Fig 5.1 and Table 5.4 indicate that the current non-solar/solar RPO targets specified by 25 SERCs
taken together may not be sufficient to encourage the requisite RE capacity addition to raise the
pan India solar and non-solar RE-based generation to the 10 percent level required under the
NAPCC during FY 2011-12 to 2014-15. The comparison of combined RE generation due to
state-wise RPO targets with all India energy demand projections for corresponding year
reveals that the current state-wise RPO can raise the pan India renewable energy share to a
level of 5.01%, 5.66%, 6.23% , and 6.67%, as against required 7%, 8%, 9% and 10% in FY
2011–12, FY 12–13, FY 13–14 & FY 14–15 respectively. Similarly, the state-wise RPO envisaged
RE capacities do not match with the RE capacity addition proposed under different scenarios.
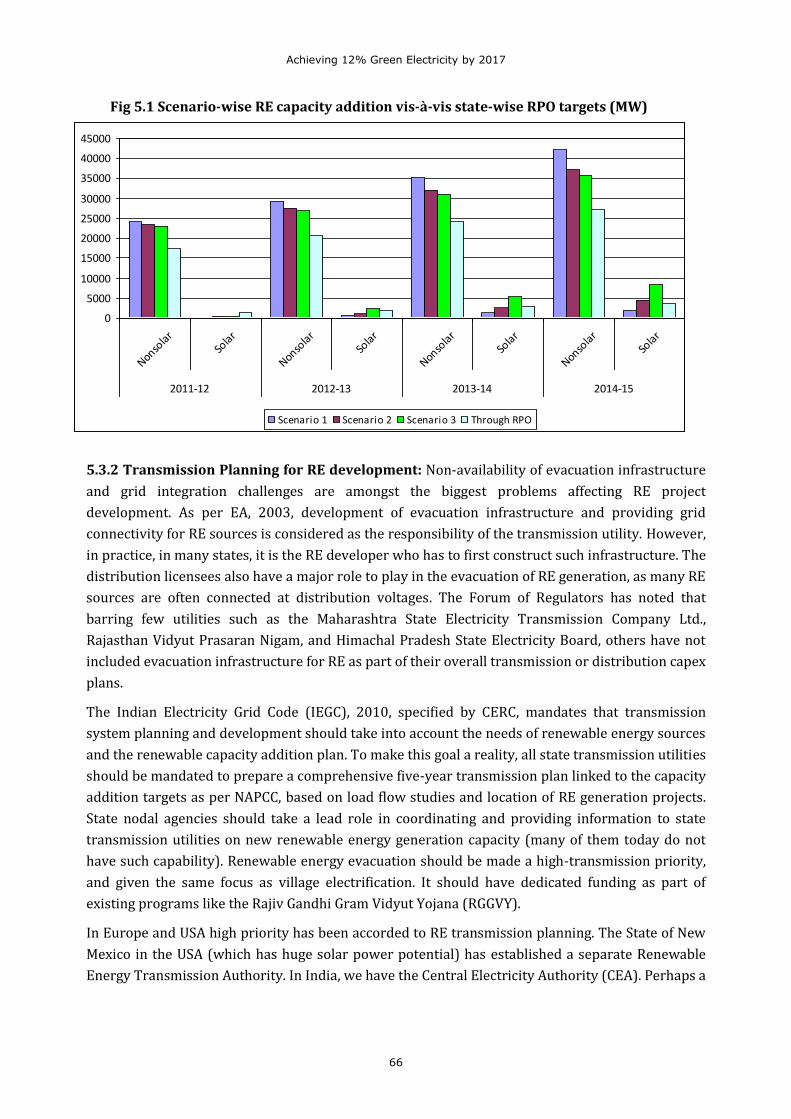
Achieving 12% Green Electricity by 2017
66
Fig 5.1 Scenario-wise RE capacity addition vis-à-vis state-wise RPO targets (MW)
5.3.2 Transmission Planning for RE development: Non-availability of evacuation infrastructure
and grid integration challenges are amongst the biggest problems affecting RE project
development. As per EA, 2003, development of evacuation infrastructure and providing grid
connectivity for RE sources is considered as the responsibility of the transmission utility. However,
in practice, in many states, it is the RE developer who has to first construct such infrastructure. The
distribution licensees also have a major role to play in the evacuation of RE generation, as many RE
sources are often connected at distribution voltages. The Forum of Regulators has noted that
barring few utilities such as the Maharashtra State Electricity Transmission Company Ltd.,
Rajasthan Vidyut Prasaran Nigam, and Himachal Pradesh State Electricity Board, others have not
included evacuation infrastructure for RE as part of their overall transmission or distribution capex
plans.
The Indian Electricity Grid Code (IEGC), 2010, specified by CERC, mandates that transmission
system planning and development should take into account the needs of renewable energy sources
and the renewable capacity addition plan. To make this goal a reality, all state transmission utilities
should be mandated to prepare a comprehensive five-year transmission plan linked to the capacity
addition targets as per NAPCC, based on load flow studies and location of RE generation projects.
State nodal agencies should take a lead role in coordinating and providing information to state
transmission utilities on new renewable energy generation capacity (many of them today do not
have such capability). Renewable energy evacuation should be made a high-transmission priority,
and given the same focus as village electrification. It should have dedicated funding as part of
existing programs like the Rajiv Gandhi Gram Vidyut Yojana (RGGVY).
In Europe and USA high priority has been accorded to RE transmission planning. The State of New
Mexico in the USA (which has huge solar power potential) has established a separate Renewable
Energy Transmission Authority. In India, we have the Central Electricity Authority (CEA). Perhaps a
0
5000
10000
15000
20000
25000
30000
35000
40000
45000
Nonsola
rSo
lar
Nonsola
rSo
lar
Nonsola
rSo
lar
Nonsola
rSo
lar
2011-12 2012-13 2013-14 2014-15
Scenario 1 Scenario 2 Scenario 3 Through RPO
Achieving 12% Green Electricity by 2017
67
separate coordinating division may be established within the CEA for coordinating RE transmission
planning and development across India states.
5.3.3 Strengthening the REC Mechanism: The CERC has issued final regulation on REC
implementation (Terms and Conditions for recognition and issuance of Renewable Energy
Certificates for Renewable Energy Generation 2010) on 14 January 2010, after a detailed study of
international best practices and the power sector governance in India. However, some of the
critical follow-up actions and revisions required are highlighted here.
Capacity building for REC implementation in states: As per the CERC regulation on RECs, the
state agencies are responsible for accreditation and recommending the renewable energy projects
for registration to the Central Agency. As on date, about twenty-one SERCs have designated the
SNAs as “state agency” to perform the REC implementation work specified under the renewable
purchase obligation regulation. All grid-connected RE projects selling power to the utility at
average power procurement cost (APPC), captive projects, merchant RE power projects selling
power to third party, etc., are eligible for REC registration and trading. RE projects having small
installed capacities with a huge investor base will certainly create regular workload for SNAs.
Hence, to expedite the registration and facilitation process of REC accreditation, capacity building
of state agencies is required.
Smaller Denomination of RECs: The present REC regulation defines the denomination of each
REC to represent 1 MWh of electricity generated from an eligible renewable energy source and
injected into the grid. A smaller denomination (such as 100 kWh equivalent) would facilitate
participation of smaller generators and buyers across the country. This would also help in
expanding the scope of voluntary markets (rather than just compliance markets) and facilitate the
reach of the market to individuals and smaller organizations. The JNNSM has given special
emphasis on rooftop solar PV and small scale solar power projects up to 2 MW capacity. Such
projects under JNNSM will also get the benefit of a smaller denomination REC.
Allowing Banking of RECs: Under the present REC Regulation, validity of RECs is limited to 365
days from the date of issuance. Given the uncertainty involved in generation from RE based project
which depend on the nature of the project, flexible mechanisms such as extended validity to
facilitate banking of RECs will be beneficial for the RE developer and obligated entities. With
banking provisions, obligated entities can procure additional RECs in a given year over and above
their current year RPO target and seek credit for the same in a future period. In Italy and Belgium
(Flanders) for instance, the validity of tradable RECs is granted up to two years and five years from
the date of issuance respectively.
5.3.4 Homogeneity in Interconnectivity Norms: Interconnection of the RE projects with the grid
is another important aspect where there is no consistency in the definition of ‘interconnection
point’ across the state. The interconnection point is often left to the whims of the local utility. The
CERC in its RE tariff Regulation 2009 has clearly defined the interconnection points for RE
technologies. For small hydro, biomass and bagasse cogeneration projects, the interconnection
point is defined as line isolator on outgoing feeder on HV side of generator transformer. Whereas
the interconnection point for solar and wind power projects is specified as line isolator on outgoing
feeder on HV side of the pooling sub-station. Stretching the interconnection point away from the
Achieving 12% Green Electricity by 2017
68
RE project will increase the investors expenses towards the power evacuation infrastructure. The
SERCs need to follow the CERC directives while specifying the interconnection points in states.
5.3.5 Overhauling the Cost-plus Methodology: The cost-plus methodology adopted by Indian
electricity regulators is a progressive and forward-looking method of determining tariffs. However,
it is time to overhaul this methodology by considering the following additional factors, viz. the cost
of externalities of conventional power generation, multiple cost curves, and risk-adjusted pricing of
conventional fuels.
Externalities of conventional power generation: Conventional power continues to enjoy various
hidden subsidies. The cost of environmental, social, and health externalities caused by these hidden
subsidies is not factored into the price of conventional power. The findings of a University of Bath
study indicate that the health costs alone work out to Rs.3/kWh (University of Bath, 2008). A study
commissioned by the World Bank in 2001 has estimated that the global and local environmental
cost of coal based generation in India is Rs.1.88/kWh. However, this is not a comprehensive
estimate based on local field study covering environmental, social and economic externalities. Such
a comprehensive study needs to be undertaken in India and the quantified results of such a study
should be factored into the price of conventional power.
Multiple cost curves: It should also be recognized that when nascent renewable technologies are
compared with entrenched conventional technologies, multiple futuristic cost curves come into
play. First and foremost, the historical escalation in the cost of conventional power due to the
variable cost of fuel should be considered. This cost escalation curve will only accelerate in future
as the reserves of fossil fuels are depleted. The other cost curve of great significance is the
technology and efficiency curve across renewables, which will help reduce their costs in future.
Conventional power sources do not have any such advantage. Besides multiple cost curves, there is
also the ‘experience learning curve’. When new RE technologies are commercially developed, they
go through an initial pilot learning phase. Thereafter they mature commercially. This needs to be
factored-in.
Risk-adjusted pricing: Scientific assessments have shown that coal production will peak in India
by 2015 and globally between 2020 and 2025. Thereafter, price and availability could become a
problem. In fact, even today, if the approving authority and the regulators insist that project
developers guarantee the supply of fuel for the 30 years of project life, many of the coal-based
ultra-mega power projects (UMPP) would not qualify for approval. Electricity regulators need to
consider risk differentials of technologies resulting from risks inherent in the supply and prices of
fossil fuels. Today, fossil fuels invariably provide a high-risk cost stream. Like oil, coal prices have
also moved into the volatile realm as supply pressures mount, carbon taxes or cess are imposed,
and global demand peaks. Therefore, the cost of electricity is better understood only in terms of the
risk differentials of different technologies.
5.3.6 Feed–in Tariffs: With regard to feed-in tariffs, it is preferable that the SERC should notify
regulations presenting the terms and condition for determination of RE tariff before issuing the RE
technology-wise tariff orders. This will bring consistency in the tariff determination process and
also provide comfort to the investor, who can then envisage the possible tariff with the help of the
normative parameters specified under the RE tariff regulation. SERCs of Maharashtra, Rajasthan
Achieving 12% Green Electricity by 2017
69
and Uttarakhand have followed this practice effectively. The CERC RE tariff Regulation 2009 is
available for providing the guidelines for SERCs in this regard and the same may be considered for
specifying methodology and normative parameters for tariff determination.
5.3.7. Open Access Regulation and State Grid Codes: System related regulations such as open
access (OA) regulation, and state grid code regulations are required to be framed keeping in mind
the low capacity utilization factors (CUF) and intermittent nature of RE technologies. SERCs should
oversee that the stringent norms and high transmission/wheeling/cross subsidy charges under OA
Regulation should not act as a barrier to the third party/captive transaction of RE. For encouraging
solar power development, CERC has recently waived the inter-state transmission charges and
losses for the useful life of the solar projects to be commissioned in the next 3 years (Notification
dated 15.06.2010). A similar action from the SERCs at state level would boost the grid-connected
solar power project development at the state level.
5.4 INSTITUTIONAL BARRIERS AND REMEDIES
Many institutional barriers involving lack of inter-agency co-ordination among and within Central
and State agencies have been discussed in the previous sections. The issue of institutional
bottlenecks in speedy project approvals through single-window clearance have also been
addressed. The discussion here pertains to barriers resulting from lack of institutional capacity or
capability. To facilitate accelerated development of renewable energy in India, capacity building
and human resource development will have to be undertaken in a number of institutions at the
central and state levels as follows.
(i) Central Sector organizations
(ii) State sector agencies
(iii) All electricity utilities
(iv) State electricity regulatory commissions
(v) Academic and research institutions
(vi) Banks and financial institutions
(vii) Civil society organizations like NGOs, etc
Of the above, the details regarding capacity building of some of the main institutions have been
elaborated below.
5.4.1. Central Sector Organizations
Ministry of New and Renewable Energy (MNRE): The MNRE looks after the overall development
of RE in India and is responsible for resource mapping, implementing various programmes for grid
connected RE as well as off-grid RE systems, providing finance for setting up demonstration RE
projects in the states, conducting R&D related to RE, etc. There are many areas where the Ministry
and the organizations under it will have to be strengthened.
(i) Reliable RE resource data in the public domain: Selection of project site and feasibility of
any RE project depends on the accuracy and authenticity of resource assessment data of
particular RE source. Although the MNRE has invested heavily in collecting renewable energy
data, lack of good-quality data remains a big problem. Even basic data on the actual generation
volume of renewable energy by technologies are not available in the public domain. Wind data
Achieving 12% Green Electricity by 2017
70
available through Centre for Wind Energy Technology (C-WET) are often inaccurate because of
lack of adequate investment in improved and multi-year measurements on sites. As a result, the
plant capacity factor for many wind plants is lower than what was envisaged at the design
stage. Similar problems exist with hydrology data. There is also a strong need to integrate these
data resources and present them to potential developers in a user-friendly way. Foremost is
the need for realistic assessment of project development potential in the solar sector based on
decisive factors like land availability, water availability, etc.
(ii) Strengthening Solar R&D: The Centre for Solar Energy needs to be strengthened, diversified
and expanded considering the diversity of solar technologies. It should be made autonomous
with adequate funding and time-bound targets. Under the ambit of the Centre, specialist
research centres for diverse solar technologies need to be established. The Centre also needs to
network with various labs across the country for advanced research into priority areas for
solar research.
Indian Renewable Energy Development Agency (IREDA): IREDA’s role will be critical in the
future. IREDA, during FY 2010–11, has disbursed a loan of Rs.917 crore to 36 RE power projects,
which is only approximately 8% of the total debt disbursed for 3156 MW of RE capacity added in
2010–11. However, if we compare the performance with that of Power Finance Corporation (PFC),
it would be seen that PFC has disbursed Rs.2,22,69.5 crore to conventional power projects during
the same period. PFC has also established ten to thirteen subsidiaries and JVs for business
expansion out of which PFC Green Energy Ltd is dedicated for funding green energy projects.
IREDA (1987) which is as old as PFC (1986) needs to be strengthened and expanded.
In order to achieve the NAPCC targets, substantial funding will be required. Therefore IREDA needs
substantial equity infusion, expansion and capacity building. The aspects relating to IREDA’s role in
RE financing have been discussed under ‘Financing Barriers.’
5.4.2 State Sector Agencies
Capacity building of SNAs-National Project required in the 12th Plan: The role of State Nodal
Agencies in the development of renewable energy in the country is a critical one. The mammoth
responsibility of carrying out MNRE’s mandate of implementing RE programmes across the
country and leading the way to a green economy lies with the SNAs. Originally, renewable energy
projects and programmes were mostly centred around stand-alone devices and rural programmes.
Thus, the SNAs were structured and equipped to handle such programmes only. In the last few
years, grid-connected RE projects have become an important activity in many states. Consequently,
new responsibilities like RE regulation, RE transmission planning, RE resource assessment, other
infrastructure planning, identification of private developers to set up RE projects in the state and
handling REC transactions are being shouldered by SNAs. It is time to enhance their capabilities
and strengthen their functioning through capacity building and various associated activities.
Recognising this fact, there is need of capacity building of SNAs through a national project to be
funded and co-ordinated by the MNRE in the 12th five year plan period.
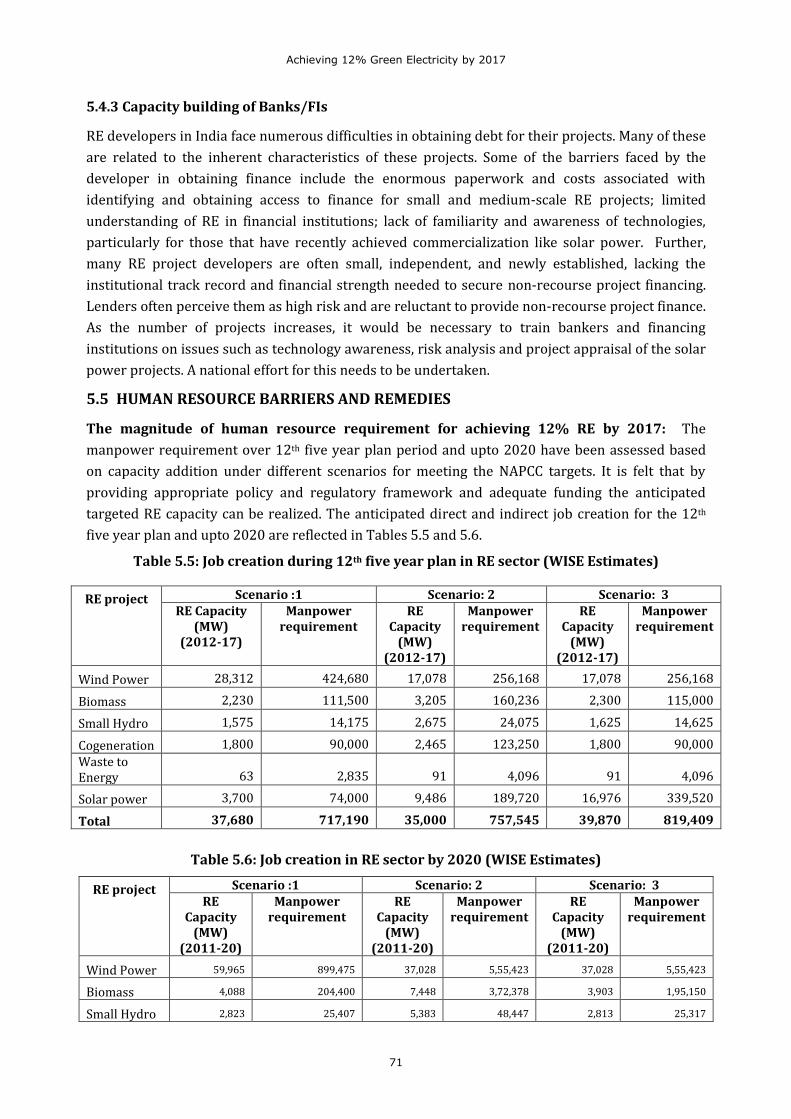
Achieving 12% Green Electricity by 2017
71
5.4.3 Capacity building of Banks/FIs
RE developers in India face numerous difficulties in obtaining debt for their projects. Many of these
are related to the inherent characteristics of these projects. Some of the barriers faced by the
developer in obtaining finance include the enormous paperwork and costs associated with
identifying and obtaining access to finance for small and medium-scale RE projects; limited
understanding of RE in financial institutions; lack of familiarity and awareness of technologies,
particularly for those that have recently achieved commercialization like solar power. Further,
many RE project developers are often small, independent, and newly established, lacking the
institutional track record and financial strength needed to secure non-recourse project financing.
Lenders often perceive them as high risk and are reluctant to provide non-recourse project finance.
As the number of projects increases, it would be necessary to train bankers and financing
institutions on issues such as technology awareness, risk analysis and project appraisal of the solar
power projects. A national effort for this needs to be undertaken.
5.5 HUMAN RESOURCE BARRIERS AND REMEDIES
The magnitude of human resource requirement for achieving 12% RE by 2017: The
manpower requirement over 12th five year plan period and upto 2020 have been assessed based
on capacity addition under different scenarios for meeting the NAPCC targets. It is felt that by
providing appropriate policy and regulatory framework and adequate funding the anticipated
targeted RE capacity can be realized. The anticipated direct and indirect job creation for the 12th
five year plan and upto 2020 are reflected in Tables 5.5 and 5.6.
Table 5.5: Job creation during 12th five year plan in RE sector (WISE Estimates)
RE project Scenario :1 Scenario: 2 Scenario: 3 RE Capacity
(MW) (2012-17)
Manpower requirement
RE Capacity
(MW) (2012-17)
Manpower requirement
RE Capacity
(MW) (2012-17)
Manpower requirement
Wind Power 28,312 424,680 17,078 256,168 17,078 256,168
Biomass 2,230 111,500 3,205 160,236 2,300 115,000
Small Hydro 1,575 14,175 2,675 24,075 1,625 14,625
Cogeneration 1,800 90,000 2,465 123,250 1,800 90,000
Waste to Energy 63 2,835 91 4,096 91 4,096
Solar power 3,700 74,000 9,486 189,720 16,976 339,520
Total 37,680 717,190 35,000 757,545 39,870 819,409
Table 5.6: Job creation in RE sector by 2020 (WISE Estimates)
RE project Scenario :1 Scenario: 2 Scenario: 3 RE
Capacity (MW)
(2011-20)
Manpower requirement
RE Capacity
(MW) (2011-20)
Manpower requirement
RE Capacity
(MW) (2011-20)
Manpower requirement
Wind Power 59,965 899,475 37,028 5,55,423 37,028 5,55,423
Biomass 4,088 204,400 7,448 3,72,378 3,903 1,95,150
Small Hydro 2,823 25,407 5,383 48,447 2,813 25,317
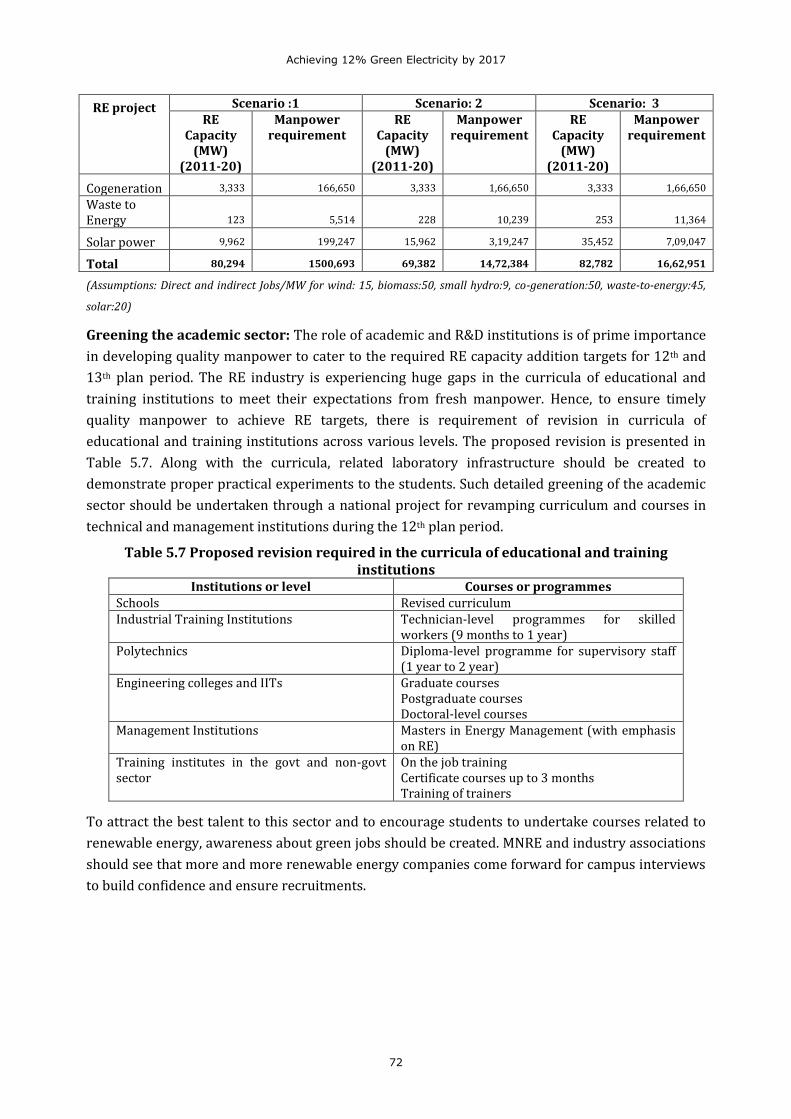
Achieving 12% Green Electricity by 2017
72
RE project Scenario :1 Scenario: 2 Scenario: 3 RE
Capacity (MW)
(2011-20)
Manpower requirement
RE Capacity
(MW) (2011-20)
Manpower requirement
RE Capacity
(MW) (2011-20)
Manpower requirement
Cogeneration 3,333 166,650 3,333 1,66,650 3,333 1,66,650
Waste to Energy 123 5,514 228 10,239 253 11,364
Solar power 9,962 199,247 15,962 3,19,247 35,452 7,09,047
Total 80,294 1500,693 69,382 14,72,384 82,782 16,62,951
(Assumptions: Direct and indirect Jobs/MW for wind: 15, biomass:50, small hydro:9, co-generation:50, waste-to-energy:45,
solar:20)
Greening the academic sector: The role of academic and R&D institutions is of prime importance
in developing quality manpower to cater to the required RE capacity addition targets for 12th and
13th plan period. The RE industry is experiencing huge gaps in the curricula of educational and
training institutions to meet their expectations from fresh manpower. Hence, to ensure timely
quality manpower to achieve RE targets, there is requirement of revision in curricula of
educational and training institutions across various levels. The proposed revision is presented in
Table 5.7. Along with the curricula, related laboratory infrastructure should be created to
demonstrate proper practical experiments to the students. Such detailed greening of the academic
sector should be undertaken through a national project for revamping curriculum and courses in
technical and management institutions during the 12th plan period.
Table 5.7 Proposed revision required in the curricula of educational and training institutions
Institutions or level Courses or programmes Schools Revised curriculum Industrial Training Institutions Technician-level programmes for skilled
workers (9 months to 1 year) Polytechnics Diploma-level programme for supervisory staff
(1 year to 2 year) Engineering colleges and IITs Graduate courses
Postgraduate courses Doctoral-level courses
Management Institutions Masters in Energy Management (with emphasis on RE)
Training institutes in the govt and non-govt sector
On the job training Certificate courses up to 3 months Training of trainers
To attract the best talent to this sector and to encourage students to undertake courses related to
renewable energy, awareness about green jobs should be created. MNRE and industry associations
should see that more and more renewable energy companies come forward for campus interviews
to build confidence and ensure recruitments.
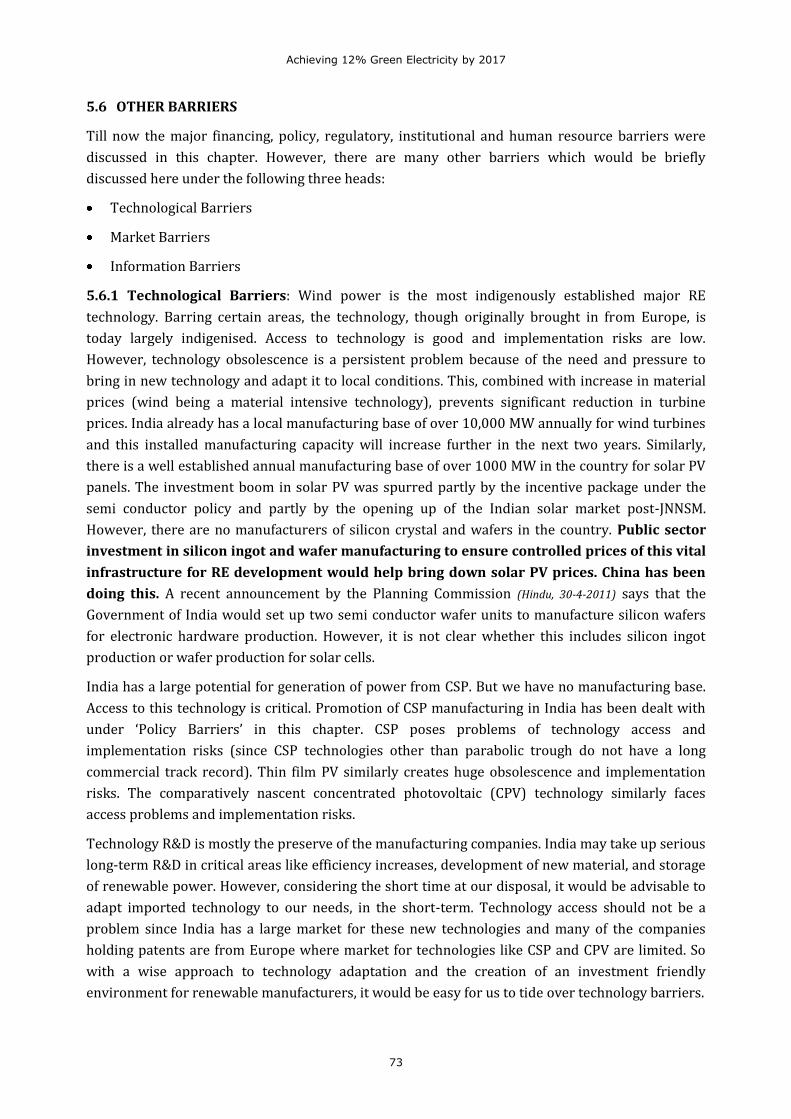
Achieving 12% Green Electricity by 2017
73
5.6 OTHER BARRIERS
Till now the major financing, policy, regulatory, institutional and human resource barriers were
discussed in this chapter. However, there are many other barriers which would be briefly
discussed here under the following three heads:
Technological Barriers
Market Barriers
Information Barriers
5.6.1 Technological Barriers: Wind power is the most indigenously established major RE
technology. Barring certain areas, the technology, though originally brought in from Europe, is
today largely indigenised. Access to technology is good and implementation risks are low.
However, technology obsolescence is a persistent problem because of the need and pressure to
bring in new technology and adapt it to local conditions. This, combined with increase in material
prices (wind being a material intensive technology), prevents significant reduction in turbine
prices. India already has a local manufacturing base of over 10,000 MW annually for wind turbines
and this installed manufacturing capacity will increase further in the next two years. Similarly,
there is a well established annual manufacturing base of over 1000 MW in the country for solar PV
panels. The investment boom in solar PV was spurred partly by the incentive package under the
semi conductor policy and partly by the opening up of the Indian solar market post-JNNSM.
However, there are no manufacturers of silicon crystal and wafers in the country. Public sector
investment in silicon ingot and wafer manufacturing to ensure controlled prices of this vital
infrastructure for RE development would help bring down solar PV prices. China has been
doing this. A recent announcement by the Planning Commission (Hindu, 30-4-2011) says that the
Government of India would set up two semi conductor wafer units to manufacture silicon wafers
for electronic hardware production. However, it is not clear whether this includes silicon ingot
production or wafer production for solar cells.
India has a large potential for generation of power from CSP. But we have no manufacturing base.
Access to this technology is critical. Promotion of CSP manufacturing in India has been dealt with
under ‘Policy Barriers’ in this chapter. CSP poses problems of technology access and
implementation risks (since CSP technologies other than parabolic trough do not have a long
commercial track record). Thin film PV similarly creates huge obsolescence and implementation
risks. The comparatively nascent concentrated photovoltaic (CPV) technology similarly faces
access problems and implementation risks.
Technology R&D is mostly the preserve of the manufacturing companies. India may take up serious
long-term R&D in critical areas like efficiency increases, development of new material, and storage
of renewable power. However, considering the short time at our disposal, it would be advisable to
adapt imported technology to our needs, in the short-term. Technology access should not be a
problem since India has a large market for these new technologies and many of the companies
holding patents are from Europe where market for technologies like CSP and CPV are limited. So
with a wise approach to technology adaptation and the creation of an investment friendly
environment for renewable manufacturers, it would be easy for us to tide over technology barriers.

Achieving 12% Green Electricity by 2017
74
5.6.2 Market Barriers: One of the most significant market barriers is the high cost of debt and the
difficulty in obtaining finance for RE projects. This has already been discussed in the ‘Financing
Barriers’ in this chapter. Absence or inadequacy of supply chain in terms of components for
technologies like wind and solar and in respect of fuel supply for technologies like biomass are
problematic. Biomass projects face unreliable feedstock supply both in terms of availability and
price. Some mechanism of controlling the fuel price would be appropriate. Another market barrier
is the absence of manufacturing equipment suppliers for technologies like solar PV. Such
manufacturing equipment base will also need to be created.
5.6.3 Information Barriers: Awareness about RE technologies are very low among policy makers,
technologists, academia and the general civil society. On the other hand, availability data (like
resource data) and information (like compilation of policies) to potential investors, financing
institutions or the public in general is also poor. Change of mindsets at all levels through wide-
spread sensitization, media campaigns, etc, is critical to the growth of the sector.
***
Achieving 12% Green Electricity by 2017
75
66 Roadmap of Actions Needed
Based on the discussions in the previous two chapters, a summary of the critical actions needed to
achieve 15% RE electricity in the grid by 2020 has been attempted in this Roadmap. The actions
needed are as follows:
6.1 PLANNING
Capacity addition plans for grid-connected RE for the 12th Plan needs to be revised to ensure
achievement of 15% RE electricity injection into the grid by 2020.
(Planning Commission & MNRE)
State-wise capacity addition plans should be communicated to the State Planning Boards,
energy departments, and State Nodal Agencies, for incorporation in the 12th Plan of the states.
(Planning Commission & MNRE)
The CERC/FOR may take coordinated action to persuade those SERCs who have not set the RPO
targets as per the national objective to revise their RPO regulations.
(CERC/FOR)
Transmission planning and development should be institutionalised both at the level of the
CEA, state electricity utilities, and State Nodal Agencies.
(Ministry of Power/CEA)
Separate divisions may be created in CEA and state utilities for this purpose.
(Ministry of Power/CEA)
A realistic re-assessment of all RE resources, considering geographical and other field issues
like water availability etc., should be undertaken, to ascertain the real potential of RE in
India—both grid and off-grid. Such re-assessment is essential for policy formation and realistic
planning for transitioning to a post-fossil fuel world.
(MNRE)
6.2 FINANCING
6.2.1. Development Financing by Government
The National Clean Energy Fund should be utilised for top-priority funding of clean energy
development to achieve 15% RE by 2020.
(Ministry of Finance GoI)
Adequate funding may be provided in advance for developing transmission infrastructure for
RE.
Achieving 12% Green Electricity by 2017
76
(Ministry of Power)
Since scaling up RE to 15% would result in significant impact on APPC, in order to assuage
financial difficulties of utilities by bringing down tariffs, indirect or direct support mechanisms
like interest subsidies, generation-based incentives, soft loans, etc., should be provided to RE
projects.
(Planning Commission/MNRE)
States should be persuaded to create state-level clean energy funds by levying “green cess”, so
that the proceeds can be utilized for part-funding RE transmission infrastructure, providing
credit guarantees, equity funding, etc.
(MNRE)
6.2.2. Debt Financing
Ways and means should be evolved to provide soft loans to RE projects, because the high
interest rates make most RE projects unviable.
(Ministry of Finance/Planning Commission/RBI)
Providing interest subsidy or allowing banks/FIs to raise tax-free bonds to provide soft loans to
RE projects may be considered.
(MNRE/Ministry of Finance)
Allowing IREDA (or the proposed Green Bank) to raise low-interest finance from abroad and
on-lending the same to RE development in India at 8%-9% would go a long way in achieving
national RE targets.
(MNRE)
Banks/FIs/IREDA/Green Bank could evolve other innovative financing instruments or
synthesized products for RE funding.
(MNRE/Planning Commission/Ministry of Finance)
A Government/RBI decision to give the status of priority sector lending to RE would send the
right signal to the banks.
(Ministry of Finance/RBI)
6.3 POLICY
Lack of cohesion in GOI policy should be addressed. The IEP should be revised (or a new IEP
prepared) to align it with new realities and the NAPCC objectives. Similarly, the low-carbon
growth strategy should follow the national objective of 15% RE.
(Planning Commission)
The stand taken in the recent document prepared by MNRE (Strategic Plan for RE 2011-17,
February 2011) that renewables can contribute only 6% of the energy mix of the total energy
mix by 2022 (and 10% contribution to total electricity mix) sends the wrong signals and
contradicts the national policy. MNRE should align its strategic plan with the NAPCC objective.
Achieving 12% Green Electricity by 2017
77
(MNRE)
Since the EA, 2003, is insufficient to address development concerns of RE, a separate law for
renewable energy development should be enacted. The decision already taken by the
government to do so should be implemented.
(MNRE)
Fossil fuel subsidies should be phased out. Subsidy shifting in favour of clean energy may be
considered.
(Planning Commission/Ministry of Finance)
The cost of externalities of conventional power generation should be quantified (through a
scientific study) and the same internalized in the pricing of fossil-fuel-based electricity.
(CERC)
As declared in the JNNSM, an incentive package for CSP manufacturing in India should be
announced to create a strong CSP manufacturing base in India. This will help bring CSP
equipment price and enable large-scale power production from CSP.
(MNRE)
All states should be persuaded to bring comprehensive RE policies.
(MNRE)
Single window clearance (to the extent possible) should be provided to RE projects in all states.
(MNRE/State Governments)
All states should offer long-term PPAs (12 to 15 years at least) to RE power generators.
(State Governments)
Mechanisms should be evolved to ensure timely payment by electricity utilities to RE
generators.
(State Governments)
6.4 REGULATION
State ERCs who have not declared RPOs in line with the NAPCC should do so.
(FOR/SERCs)
The REC mechanism should be strengthened through capacity building of nodal agencies in
states, bringing out smaller denomination RECs, and allowing banking of RECs, etc.
(CERC)
Homogeneity in inter-connectivity norms should be brought about across different states.
Similarly, OA charges should be rationalised and state grid codes enacted to provide RE.
Achieving 12% Green Electricity by 2017
78
(FOR)
The regulators may consider overhauling the cost-plus methodology for tariff determination by
factoring-in the cost externalities of fossil-fuel-based generation, considering multiple curves
and risk-adjusted pricing.
(CERC/FOR)
6.5. CAPACITY BUILDING
Systematic capacity building should be undertaken in various central and state level
organisations and utilities involved in RE development.
(Initiative by MNRE)
The most important institutions which require capacity building are the State Nodal Agencies
of MNRE. The Ministry had submitted a National Programme for capacity building of SNAs to
the Planning Commission in 2011. But the Planning Commission advised the MNRE that the
same should be taken up in the 12th Plan (since 2011-12 is the last year of the 11th Plan). This
programme should be taken on priority during the 12th Plan if we have to achieve the RE
deployment targets.
(MNRE/Planning Commission)
Another priority area for capacity building is the banks and financial institutions. A programme
for this is also essential.
(MNRE)
The R&D institutions in the RE sector needs to be strengthened and new institutions need to be
established to cover diverse RE targets. They should be given autonomy, adequate financing,
and time-bound targets for technology development in critical futuristic areas like materials,
storage, etc.
(MNRE)
6.6 HUMAN RESOURCE S
A National Programme for curriculum revision, new curriculum development, beginning new
RE courses and training of technical institution faculty should be undertaken. Providing
adequately trained skilled manpower (whose requirement is very high) is critical to RE
development. We have a vast educational infrastructure, but this needs to be revamped.
(MNRE)
A focus on green jobs and awareness generation about the same is essential. A study to assess
the potential of green technologies to create jobs should be undertaken, as is being done in
many other developed countries.
(MNRE)
Achieving 12% Green Electricity by 2017
79
6.7 OTHER AREAS
Public sector investment in manufacture of silicon ingots and wafers should be done, to make
this basic infrastructure available at reasonable prices.
(MNRE/Planning Commission)
Quick measures for global technology access and adaptation should be put in place in the short
and medium term. For the long-term, we should focus on R&D for developing indigenous
technology in critical areas.
(MNRE)
Certain other market barriers clogging the deployment of RE technologies should be identified
and remedies found.
(MNRE)
One of the major problems in RE development is the information barrier. Reliable information
and data on RE resources should be available in the public domain so that industries, investors,
etc., can access the same. On the other hand, information devices, technologies, policies,
incentives, financing, etc., should be made available to the public.
(MNRE)
***
Achieving 12% Green Electricity by 2017
80
References
1. 13th Finance Commission 2011, “Report of the Thirteenth Finance Commission (2010-
2015)”, Chapter 12, Finance Commission India, http://fincomindia.nic.in
2. Blackburn J O and Cunningham S, 2010, “Solar and Nuclear Costs - the historic crossover”,
NCWARN (Waste Awareness and Reduction Network), Durham, North Carolina, USA.
3. CEA 2011, Central Electricity Authority website
4. Gujarat 2011,Finance Ministers Budget Speech for FY 2011-12, State Govt. of Gujarat
5. Hindu 30-4-2011, Centre to set up two semi-conductor wafer units, The Hindu, 3-4-2011
6. IEA 2011 a , “Clean Energy Progress Report”, International Energy Agency
7. IEA 2011 b , “Technology Development Prospect for the Indian Power Sector”,
International Energy Agency 8. 9.
10. IEGC 2010, Indian Electricity Grid Code, 2010, CERC.
11. IIR 2010, “India Infrastructure Report 2010: Infrastructure Development in A Low Carbon
Economy”, 3iNetwork.
12. INCCA 2010 , “India : Greenhouse Gas Emissions 2007”, Indian Network for Climate Change
Assessment, Ministry of Environment and Forest, Govt. of India
13. IPCC 2011 , “Summary for Policy Makers. In IPCC Special Report on Renewable Energy
Sources and Climate Change Mitigation”, Cambridge University Press, Cambridge, United
Kingdom and New York, USA
14. IWE 2011 , “Indian Wind Energy Outlook 2011”, published by GWEC , WISE and IWTMA
15. JNNSM 2009, Jawaharlal Nehru National Solar Mission document.
16. MNRE 2010 , “Renewable Energy in India : progress, vision and strategy” , MNRE , GoI
17. MNRE 2011, “Strategic Plan for New and Renewable Energy Sector for the period 2011-17”,
Ministry of New and Renewable Energy
18. NVVN 2011, NTPC Vidyut Vyapar Nigam Ltd (NVVN), www.nvvn.co.in
19. Planning Commission, 2011, “Low Carbon Strategies for Inclusive Growth: Interim Report”,
May 2011, Planning Commission, Government of India.
20. SERC 2011, Orders of respective State Electricity Regulatory Commission,
21. WISE 2010, “Solar Future for India”, World Institute of Sustainable Energy
22. World Bank 2010, “Unleashing the Potential of Renewable Energy in India”, South Asia
Energy Unit, Sustainable Development Department, The World Bank
***