Embed Size (px)
Citation preview

Docket No.: A.09-12-020Exhibit No.:Date:Witness: Ian Goodman
PREPARED DIRECT TESTIMONY
OF IAN GOODMAN
CALIFORNIA PUBLIC UTILITIES COMMISSION
APPLICATION NO. 09-12-020
PACIFIC GAS & ELECTRIC COMPANY
GENERAL RATE CASE 2011
Prepared by
The Goodman Group, Ltd.
On Behalf of
THE GREENLINING INSTITUTE
May 19, 2010
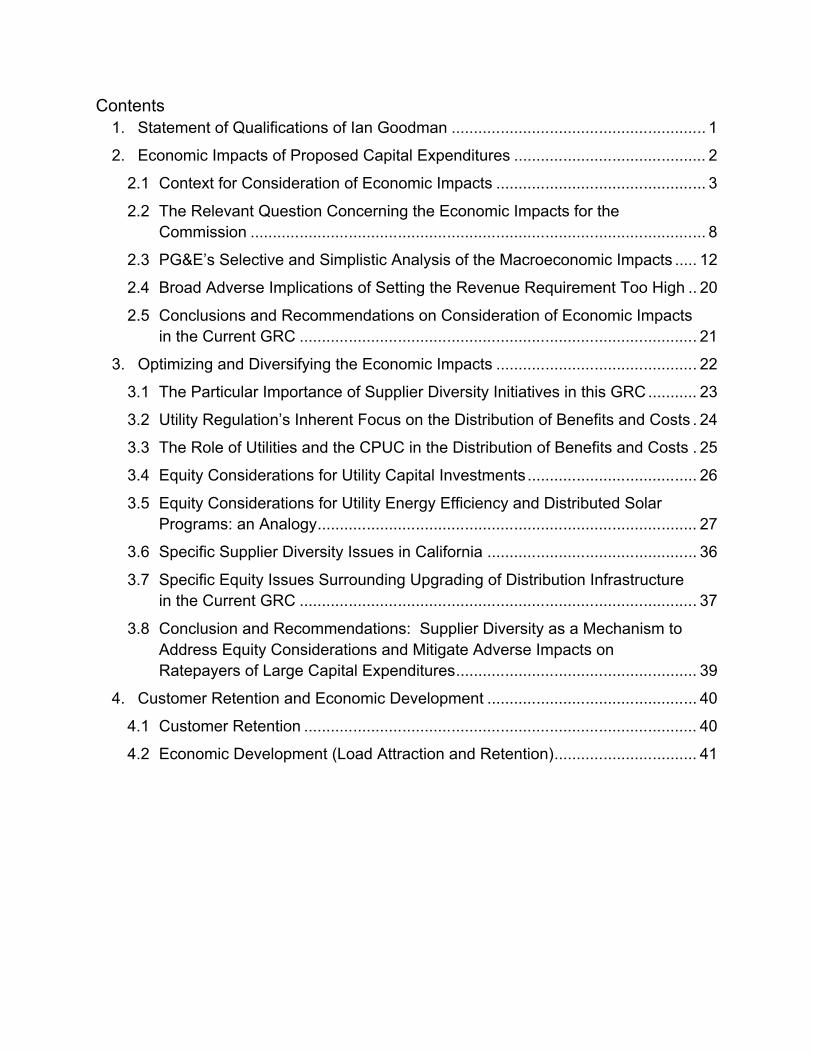
Contents1. Statement of Qualifications of Ian Goodman ......................................................... 1
2. Economic Impacts of Proposed Capital Expenditures ........................................... 2
2.1 Context for Consideration of Economic Impacts ............................................... 3
2.2 The Relevant Question Concerning the Economic Impacts for the Commission ...................................................................................................... 8
2.3 PG&E’s Selective and Simplistic Analysis of the Macroeconomic Impacts ..... 12
2.4 Broad Adverse Implications of Setting the Revenue Requirement Too High .. 20
2.5 Conclusions and Recommendations on Consideration of Economic Impacts in the Current GRC ......................................................................................... 21
3. Optimizing and Diversifying the Economic Impacts ............................................. 22
3.1 The Particular Importance of Supplier Diversity Initiatives in this GRC........... 23
3.2 Utility Regulation’s Inherent Focus on the Distribution of Benefits and Costs . 24
3.3 The Role of Utilities and the CPUC in the Distribution of Benefits and Costs . 25
3.4 Equity Considerations for Utility Capital Investments...................................... 26
3.5 Equity Considerations for Utility Energy Efficiency and Distributed Solar Programs: an Analogy..................................................................................... 27
3.6 Specific Supplier Diversity Issues in California ............................................... 36
3.7 Specific Equity Issues Surrounding Upgrading of Distribution Infrastructure in the Current GRC ......................................................................................... 37
3.8 Conclusion and Recommendations: Supplier Diversity as a Mechanism to Address Equity Considerations and Mitigate Adverse Impacts on Ratepayers of Large Capital Expenditures...................................................... 39
4. Customer Retention and Economic Development ............................................... 40
4.1 Customer Retention ........................................................................................ 40
4.2 Economic Development (Load Attraction and Retention)................................ 41

1
1. Statement of Qualifications of Ian Goodman12
My name is Ian Goodman. My business address is 2515 Piedmont Avenue, Suite 11, 3Berkeley, California 94704-3142.4
My professional and educational qualifications are described in my résumé (Attachment 5A) and summarized below. In 1977, I graduated from the Massachusetts Institute of 6Technology with a Bachelor's in Civil Engineering/Transportation Systems. I have over 730 years of experience in research and consulting regarding various aspects of utility 8regulation and economics. Since 1989, I have been president of The Goodman Group, 9Ltd. (TGG), an energy and economic consulting firm in Berkeley, California (formerly 10Boston, Massachusetts).11
I have submitted expert testimony in over 45 regulatory, environmental assessment, 12and legal proceedings in various North American jurisdictions including California, New 13York, Massachusetts, Vermont, Maine, Florida, Manitoba, Ontario, Quebec, as well as 14the Federal Energy Regulatory Commission (FERC) in the US and the National Energy 15Board (NEB) in Canada. I am also author or co-author of over 50 publications relating to 16the energy industry, economics, and environmental issues.17
A major focus of my work over the last two decades has been the relationship between 18energy and economic development/regional economics. I have testified before the 19California Public Utilities Commission in A.97-12-048 and A.96-03-031/96-04-030 on 20behalf of The Utility Reform Network (TURN). My evidence included: a review of claims 21by Southern California Gas Company and other parties that economic development 22would be promoted by allocating transition costs away from large industrial and other 23noncore gas customers; evaluation of how economic development will be impacted by 24the period selected for amortization of these transition costs; and provision of 25recommendations regarding consideration of economic development issues by the 26Commission.27
My firm’s Regional Economics practice is primarily focused on the employment and 28environmental impacts of energy options on a state and provincial level. Since 1991, 29TGG has conducted over 15 national, regional, and state/provincial studies on the 30economic development impacts (notably jobs) and environmental impacts of various 31energy options in the US and Canada. TGG has performed such studies for the US, 32New York, Massachusetts, Vermont, Rhode Island, New Hampshire, California, Florida, 33the Southern States region, and Quebec. 34
The Goodman Group's Regional Economics practice and research is supported by an 35extensive database containing information on a wide range of energy efficiency 36measures and supply options. This database has been compiled from contractor 37

2
records, utility and other efficiency program data, and detailed engineering studies. In 1conjunction with TGG's extensive database, TGG developed E3AS (Energy, Economic, 2and Environmental Analysis System) software on behalf of the US EPA in 1996. TGG 3has made E3AS available to assist government agencies in evaluating the economic 4and environmental impacts of energy supply and efficiency programs, and in 5considering both the benefits and costs of energy alternatives. E3AS model analysis is 6state-specific and has been incorporated into all TGG economic development studies 7since 1996.8
In addition to my focus on regional economics and economic development, my practice 9has addressed a broad range of issues, including special rates and other promotion of 10customer/load retention/growth. I have also testified in proceedings in Maine, Ontario, 11and Québec regarding special discount rates. Some of these rates were targeted to 12commercial and residential customers, but they were principally intended to promote 13industrial sector load retention and load growth. 14
My practice has also addressed the consideration of equity issues in regulation and 15policy making, notably in my work for clients such as regulators, government, customer 16and environmental groups, and North American Native/First Nations organizations. In 17particular, equity considerations have arisen in my previous testimony before the 18Commission in A.97-12-048 and A.96-03-031/96-04-030, and in reviews of DSM and 19Energy Efficiency programs in numerous jurisdictions throughout North America. 20
21
2. Economic Impacts of Proposed Capital Expenditures2223
This section analyzes the economic impacts of PG&E’s proposed capital expenditures, 24as set out in PG&E’s filing. Specifically, this section will analyze PG&E’s claims (in Ex. 25PG&E-1) that these capital investments will provide a positive economic stimulus, 26creating additional employment and other economic activity: 27
28Our Request: Catalyzing and Sustaining Economic Recovery29PG&E needs to be ready to provide dependable electric and gas service to support 30our customers when the economy improves. Our request in fact can assist in that 31recovery, as our planned capital expenditures will provide a positive economic 32stimulus, creating, directly or indirectly, thousands of jobs and generating significant 33additional state and local tax revenues over the 3-year GRC cycle.134
35
1 Ex. PG&E-1, p. 1-18.

3
Specifically, PG&E’s request will fund investments and the purchase of services that 1will create approximately 16,000 jobs, primarily within California. [Footnote in 2original: Based on a study performed by HIS (sic) Global Insight dated July 17, 2009. 3The study is included in the appendix to this chapter.] 24
5As noted by PG&E, the basis for these claims is provided in the IHS Global Insight 6study (Ex. PG&E-1, Appendix 2A):7
8Economic Impacts of Proposed Capital Expenditures by the Pacific Gas 9and Electric Company in Northern and Central California, prepared by IHS 10Global Insight. 11
12
2.1 Context for Consideration of Economic Impacts1314
Prior to delving into the details of PG&E’s claims regarding economic stimulus and job 15creation, it is useful to step back and consider how such claims should be considered in 16the context of a GRC. This is after all a process whose main focus is setting utility rates. 17
18The GRC process results in significant economic impacts. PG&E is spending billions of 19dollars and recovering these costs from ratepayers. The results of the GRC process 20thus have important ramifications for the overall service area economy. This is very 21much a process of economic regulation.22
23Nonetheless, a GRC is not an exercise in broad macroeconomic policy making. PG&E 24and the Commission are not the Federal Reserve, or other governmental entities whose 25normal focus includes issues such as economic stimulus and job creation. Nor is the 26GRC process taking place in the areas of government that are tasked with policies to 27collect and spend tax revenues so as to further the public good (including as it relates to 28economic stimulus and job creation).29
30Given that this is a GRC involving PG&E (an investor-owned utility), any claims 31regarding economic stimulus should be evaluated in a manner that is appropriate for 32this context. Therefore, we must first consider a threshold question as to the relevance 33of the consideration of macroeconomic impacts3 (economic stimulus and job creation)34within a GRC. 35
2 Ex. PG&E-1, p. 2-2.3 In this testimony, macroeconomic impacts of utility activites refer to impacts upon the overall performance of the service area economy. As a short-hand, and in line with terminology adopted by PG&E, macroeconomic impacts will sometimes be made reference to by the terms “economic stimulus”, (footnote continued on next page)

4
1In response to an Information Request, PG&E stated its position as to the relevance 2and proper consideration of issues such as economic stimulus and job creation:3
4QUESTION 15At page 2 2:17 you say, “PG&E’s request will fund investments and the 6purchase of services that will create approximately 16,000 jobs, primarily 7within California.8
9a. Where in the Code do you find authority to use ratepayer money to 10
create jobs?11[…]12
13ANSWER 114a. PG&E is not seeking Commission authority to use ratepayer money to 15
create jobs, as the data request suggests. Rather, PG&E is seeking 16Commission authority to fund much-needed capital investments in 17PG&E's gas and electric infrastructure, among other things. While 18intervenors may argue that such investments are inappropriate given 19the current economic climate, PG&E believes that such investments 20will benefit California's economy, as supported by the IHS Global 21Insight report referenced in and appended to the testimony. It is 22PG&E’s position that, pursuant to Sections 454 and 701 of the Public 23Utilities Code, the Commission has discretion to consider a broad 24range of factors in determining a utility's "just and reasonable" rates, 25including whether the costs of the utility's planned capital expenditures 26are justified by the benefits to safety, reliability, and the economy.427
According to PG&E’s response, macroeconomic impacts (such as stimulus and jobs) 28fall within a broad range of factors that the Commission has discretion to consider within 29its authority as a regulator.30
“job creation”, and jobs. In general, there is strong corelationship between jobs (employment) and other commonly used macroeconomic indicators (earnings, labor income, value added, gross regional product, and output).
By comparison, in this testimony, economic impacts of utility activities refer to the short- and long-term benefits and costs of these activities on ratepayers and communities in the service area. Economic impacts include the benefits and costs traditionally considered in rate-making. As will be discussed in this section, economic impacts can also include consideration of a broader range of factors including impacts on customers and communities, equity considerations, and macroeconomic impacts, as warranted. 4 Response to CFC 002-01.

5
And put in those terms, it could be relevant and appropriate for the Commission to 1consider a broad range of factors that are (and could be) affected by the activities 2regulated by the Commission. Electric and gas utilities have a very large footprint in 3terms of economy, environment, and in many other regards. So within reasonable limits, 4the Commission has an important role to play in terms of oversight and seeking to 5improve outcomes.6
But we do need to think about where consideration of this broad range of factors is 7leading us. PG&E is attempting to justify capital expenditures (and the associated 8increase in revenue requirements) on the basis of claims about macroeconomic 9impacts:10
QUESTION 3311In Exhibit (PG&E 1), Appendix 2A, PG&E presents a study, “Economic 12Impacts of Proposed Capital Expenditures by the Pacific Gas and Electric 13Company in Northern and Central California.” [. . .] Why did PG&E 14decide to include the report in its showing in this proceeding?15ANSWER 3316PG&E included the study report in its application as support for a finding 17that capital spending of the type and magnitude that PG&E proposes in 18this GRC application will have a positive economic impact on the Service 19Area during the GRC period above and beyond the benefits associated 20with increased safety and reliability in the provision of gas and electric 21services. 522
In response to another interrogatory request, PG&E again justifies its proposed capital 23expenditures on the basis of claims about economic stimulus:24
While intervenors may argue that such investments are inappropriate 25given the current economic climate, PG&E believes that such investments 26will benefit California's economy627
Moreover, as part of its Economic Development Program, PG&E engages in activities 28relating to Load Attraction and Retention (Ex. PG&E-4, Chapter 9). As will be further 29discussed in Section 4.2 below, PG&E is also claiming that ratepayers should fund a 30dramatic expansion in these activities, in response to claims about competition from 31
5 Response to Aglet-001-33.6 Response to CFC 002-01.

6
other states.7 This expanded funding is intended to support trade missions and other 1broadly-defined business promotion activities.8 2
So in thinking about what broad range of factors should be considered, we also need to 3consider what broad range of activities they might foster. And while there might not 4always be a well-defined line as to the outer limits of what utilities and the Commission 5should do, there are clearly some very real constraints as to the role of utilities and the 6Commission. 7
So for a proposed action to be justified, it is not sufficient that it appears to have the 8potential for good outcomes according to a broad range of factors relating to societal 9well-being. Rather, any proposed action also needs to fall within the appropriate role of 10the utilities and Commission. 11
There are many potentially good ideas to make the world a better place, but only some 12are appropriate for implementation by utilities and funding by ratepayers. Some actions 13(if done at all) are best accomplished through direct governmental involvement, as 14opposed to utilities attempting to take on a quasi-governmental role.9 Likewise, some 15actions do not require governmental involvement, nor do they require involvement by 16utilities and funding by ratepayers. Especially given the huge complexity and challenges 17entailed with fulfilling even their core responsibilities, the utilities and Commission need 18to remain focused on their unique and very important roles relating to the provision of 19energy services.20
In the context of this testimony (and the current proceeding), it is not feasible (or 21necessary) to engage in a far-ranging debate over what broad range of actions utilities 22might undertake and what broad range of factors might be used to evaluate those 23actions. Rather, the primary focus needs to be on what PG&E is proposing to do, and 24how that should be evaluated.25
That said, PG&E’s filing in this GRC is based (in part) on claims related to the 26consideration of a broad range of factors. Such factors may be of some relevance in 27evaluating how PG&E spends its money (and otherwise does business). However, to 28the extent that it is appropriate to consider a broad range of factors, choices must be 29made as to what factors are relevant and how much weight to give them. 30
7 Ex. PG&E-4, p. 9-1, 9-7.8 Ex. PG&E-4, p. 9-9 to 9-10.9 As will be further discussed in Section 4.2 below, some of PG&E’s planned activities regarding economic development have substantial overlap with governmental activities and raise issues concerning the appropriateness of PG&E’s role and ratepayer funding.

7
PG&E advocates that consideration be given to macroeconomic impacts (such as 1stimulus and job creation). There can be merits to considering macroeconomic impacts 2as a measure of how various actions and alternatives could affect the overall functioning 3of the economy.4
However, as will be explored below (in Sections 2.2, 2.3, and 2.4), great caution must 5be exercised in estimating and interpreting macroeconomic impacts. A selective and 6simplistic analysis may provide little useful information for ratemaking, and could even 7be misleading.8
As noted above, a GRC is not an exercise in broad macroeconomic policy making. So 9factors such as macroeconomic impacts should only be considered in a GRC to the 10extent that there is some clearly useful information regarding these impacts. Otherwise, 11this is a situation where we are probably better off giving little weight to (or even wholly 12ignoring) what we can not readily understand and rely upon.13
That is not to say that macroeconomic impacts should always be ignored in terms of 14utility planning and ratemaking. The Commission can give guidance as to what type of 15information would be useful and suggest that an issue be further considered in the 16future when and if more useful information becomes available. High quality analyses of 17macroeconomic impacts can help to identify actions that are beneficial for the overall 18functioning of the economy. For example, such analyses have helped to demonstrate 19that cost-effective energy efficiency has significant benefits in terms of job creation and 20other macroeconomic impacts. Thus, these analyses have provided useful guidance to 21utilities, regulators, and others engaged in energy policy making.22
But macroeconomic impacts are not the only, or even the primary, candidate for 23inclusion within the broad range of factors for consideration by the Commission within a 24GRC (and elsewhere). Given that utilities have such a large footprint and range of 25impacts, it is also very much appropriate to take into consideration other factors such as 26how PG&E’s actions are affecting the customers and communities that it serves.27
Each year, PG&E is spending billions of dollars, with funds flowing to suppliers, 28employees, shareholders, and government. Likewise, PG&E is collecting billions of 29dollars from its ratepayers. This large scale of operations inevitably creates large 30economic impacts. The benefits and costs are both quite sizable. So there are 31significant equity considerations relating to how these benefits and costs are distributed.32
These equity considerations have many aspects, including geography and 33demographics. Utilities have large networks and operations that are spread across 34(almost) all communities and (almost) all Californians are utility customers. Still, that 35does not mean that everywhere or everyone is affected the same way in terms of either 36benefits or costs. Moreover, utilities are operating in a context where there are already 37

8
very large disparities in terms of income, education, medical care, health outcomes, 1longevity, and other factors.102
Equity considerations do already receive some attention in “traditional” ratemaking and 3are a key factor in terms of both cost allocation and rate design.4
But there are certainly many equity considerations that have traditionally received only 5limited attention by utilities and the Commission. So to the extent that we are 6considering a broad range of factors, impacts on customers and communities have 7strong merit as primary factors; and they are a potentially very useful guide. Section 38will provide further discussion of how equity considerations can be taken into account so 9as to optimize and diversify the economic impacts associated with utility capital 10expenditures and other activities. So to return to the threshold question concerning the 11relevance of economic stimulus and job creation within a GRC, we can conclude that 12such macroeconomic indicators are just one type of broader measure to evaluate a rate 13application. Impacts on customers and communities are of equal and potentially greater 14relevance in terms of broader measures. A focus on such impacts would also facilitate 15considering and addressing equity issues. And as will be discussed in Section 3, a 16focus on such impacts would also encourage initiatives such as energy efficiency for 17low-income customers, workforce inclusion, and supplier diversity.18
19
2.2 The Relevant Question Concerning the Economic Impacts for the 20Commission21
22The previous section addressed the threshold question regarding the relevance of 23macroeconomic impacts (i.e. economic stimulus and job creation) within a GRC. Now, 24the relevant question for us to consider with respect to the specific economic impacts of 25the proposed capital expenditures is the following:26
27What are the short- and long-term economic benefits and costs over the life of the 28capital expenditures (the period over which costs are recovered from 29ratepayers)? 30
31In giving full consideration to the benefits and costs of the capital expenditures over the 32lifetime of the investments, the Commission can make an informed valuation of:33
10 See e.g., <www.barhii.org>. Longevity is one indicator of these huge disparities. Life expectancies in affluent Bay Area communities (“the hills”) are on average ten years greater than in areas with lower incomes (“the flats”); there are also large disparities related to income and ethnicity <www.barhii.org/press/download/barhii_report08.pdf>.

9
1 the trade-offs involved in setting the level of capital expenditures in any GRC;2 the trade-offs involved in a higher level of capital spending in this GRC;3 equity considerations regarding the distribution of the short- and long-term 4
benefits and costs.56
The trade-offs involved in setting the level of capital expenditures in any GRC7
Customers pay for capital expenditures through rates, and this rate impact persists 8long-term over the period while the capital expenditures are in rate base. Capital 9spending does add some jobs in the short-term (while the money is being spent). But 10there are offsetting job losses as customers pay for these expenditures through rates 11(while the money is being paid back). Moreover, each dollar of capital expenditures 12results in substantially more than a dollar of lifetime cost recovery. Cost recovery 13includes return on rate base (financing costs), as well as associated taxes. Put more 14simply, the money is paid back with interest (as well as dividends and taxes). 15
So with respect to macroeconomic impacts in any GRC, capital expenditures result in 16long-term losses, which exceed the short-term gains. Thus, there are increased jobs in 17the short-term in exchange for higher rates and fewer jobs in the long-term.18
For simplicity, the above discussion of trade-offs is limited to consideration of the 19economic impacts associated with capital spending and cost recovery. It does not take 20into account the benefits that utility capital spending may also provide in terms of energy 21supply.1122
So conceptually, the above discussion could be characterized as an analysis of the 23macroeconomic impacts associated with “gold-plating” (a situation where the utility is 24making incremental capital expenditures that provide no marginal benefits in terms of 25energy supply).1226
This is not to say that the capital expenditures forecast by PG&E in GRC 2011 are all 27gold-plating or otherwise unwarranted.13 Rather, the above discussion is provided to 28demonstrate that utility capital spending is not a macroeconomic free lunch. Rather it is 29a lunch paid for by customers, with a substantial adder for financing costs and taxes.30
11 PG&E’s analysis of macroeconomic impacts was similarly limited; it did not take into account the benefits in terms of energy supply provided by capital spending (Ex. PG&E-1, Appendix 2A, p. 8).12 There has been extensive consideration of issues relating to gold-plating by utilities, specifically in regard to the Averch-Johnson effect.13 Some portion of the capital expenditures forecast by PG&E in GRC 2011 may in fact be unwarranted, as will be discussed in Section 2.4. DRA has submitted extensive testimony which (among other aspects) forecasts a substantially lower level of capital expenditures (see e.g., Ex. DRA-6 and Ex. DRA-8).

10
The above discussion has clear policy implications. PG&E should make the capital 1investments required to provide needed energy supply. But it should not spend more 2than is required. Spending more in a poorly targeted attempt to provide economic 3stimulus and job creation is spending that is unwarranted. 4
Even capital spending that is necessary will have some adverse macroeconomic 5impacts owing to long-term impact on rates. But any such adverse impacts will be offset 6by the benefits provided by needed energy supply.7
But utility capital spending that is unnecessary will result in a long-term drag on the 8service area economy. There will a short-term economic boost when the money is being 9spent, but this will be more than offset as costs are recovered. Customers will be 10paying, but not getting any benefit in terms of needed supply. In terms of economic 11stimulus and job creation, unnecessary utility capital spending is very expensive, 12inequitable, and (especially over the long-term) quite counterproductive. 13
The trade-offs involved in setting the level of capital expenditures in GRC 201114
In the current GRC, the general trade-offs described above for any GRC are still 15applicable. But given economic conditions, there may be somewhat different than usual 16trade-offs between short-term and long-term impacts. Put more simply, we may be more 17willing than usual to accept long-term costs in exchange for short-term benefits.18
The current economic crisis is very deep and persistent in its impacts. Economic 19conditions are now beginning to improve, but unemployment and other aspects of 20economic difficulty will remain high during most (and likely all) of the GRC period (2011-212013). Capital spending in this GRC thus could have some benefits as a countercyclical 22initiative. 23
An economic or financial policy is defined as countercyclical if it works against the 24cyclical tendencies in the economy. That is, countercyclical policies are ones that 25stimulate the economy when it is in a downturn, and cool down the economy when it is 26in an upswing.27
In a weak economy, there is substantial slack capacity; a countercyclical intervention 28(such as a government program to encourage business investment) can significantly 29improve outcomes by helping to increase the utilization of resources that would not 30otherwise be employed. Still any intervention must be well designed and implemented; 31otherwise the intervention may actually harm the economy, moving it even further away 32from efficient use of resources.33
In a strong economy, a cyclical intervention (which stimulates the economy) is less likely 34to significantly improve outcomes. With the economy operating at (or near) full 35

11
capacity, an intervention may produce only small shifts between activities, with no 1overall net gain. Moreover, with the economy already at or near equilibrium, an 2intervention may actually harm the economy by moving it away from what is already an 3efficient use of resources.4
As stated above, the impacts of the current economic crisis will persist through most 5(and likely all) of the GRC period. These weak economic conditions are characterized 6by a high level of unemployment and other slack capacity. Thus, an argument can be 7made that it is advantageous to undertake countercyclical initiatives to increase jobs in 8the short term, even at the cost of higher rates and job losses in the long term. 9Moreover, a utility like PG&E can borrow money relatively easily, and short-term 10borrowing costs are relatively low. So there could be an economic rationale for 11undertaking countercyclical initiatives during the upcoming GRC in order to provide 12short-term economic stimulus and job creation.13
14Given current economic conditions, there is a better-than-usual trade-off for a job gain in 15the short term against a net job loss in the long term. Still, the Commission must decide 16whether such a trade-off is warranted. In order to make an informed decision as to 17whether countercyclical spending is advantageous in the current GRC, the Commission 18should be provided with complete information regarding the short- and long-term 19economic benefits and costs over the life of the capital expenditures. As will be 20discussed in Section 2.3, PG&E’s evidence has not provided an accurate and complete 21description of these benefits and costs. 22
23Moreover, the Commission will also require sufficient information to accurately assess 24the distribution of these economic benefits and costs (i.e. who are the winners and who 25are the losers). On a policy level, the Commission should also determine to what26degree it wants to utilize rate-making as a counter-cyclical economic initiative.1427
28If the Commission approves a higher level of capital spending, justified in part as a 29countercyclical initiative, it is important that it consider the adverse impacts resulting 30from higher rates over the entire cost recovery period, as well as the uneven distribution 31of the benefits and costs of capital spending throughout the economy. In particular, 32customers will be thus paying more during the GRC period, when many are already 33struggling with unemployment and other economic difficulties. So, as will be further 34discussed in Section 3, to the extent that there is a rationale for higher capital spending 35
14 As discussed in Section 2.1, the Commission’s focus is not broad economic policy making; put more simply, it is not the Federal Reserve. The ratemaking process is sufficiently complex and constrained, such that it may be poor tool for undertaking countercyclical initiatives and other macroeconomic fine-tuning.

12
in this GRC, there is a particular need to address equity considerations through 1mechanisms that optimize and diversify economic impacts.2
3Equity considerations regarding the distribution of short- and long-term benefits and 4costs5
As will be discussed in more detail in Section 3, utility capital investment gives rise to 6equity considerations because the short- and long-term benefits and costs of the capital 7spending are not spread evenly throughout the economy. Typically, the winners from 8capital investment will be PG&E employees, contractors, and suppliers of materials and 9services related to the capital spending; some of these winners (notably suppliers of 10materials) will be located outside the service area and California.11
Meanwhile, the ratepayers will bear the costs of the investments for years to come.12
And with the high level of capital investment proposed in this GRC, concurrent with the 13ongoing economic crisis, the winners may do especially well, and the losers may do 14especially poorly. Therefore, in its evaluation of PG&E’s capital investment proposal, the 15Commission should also consider the resulting distribution of the short- and long-term 16benefits through the economy and consider ways to mitigate the equity considerations 17that arise from the unevenness of this distribution.18
19
2.3 PG&E’s Selective and Simplistic Analysis of the Macroeconomic Impacts2021
Section 2.1 addresses the relevance of macroeconomic impacts (i.e. economic stimulus 22and job creation) within a GRC, and Section 2.2 identifies the relevant issues for the 23Commission to consider regarding the economic impacts of the proposed capital 24expenditures. Section 2.3 will now comment on and critique PG&E’s analysis of the 25macroeconomic impacts.26
27PG&E’s claims about macroeconomic impacts are based on an analysis which is 28selective and simplistic. PG&E’s analysis regarding these impacts provides little 29information that is useful for ratemaking, and could even be misleading.30
31Especially in the GRC context, great caution must be exercised in estimating and 32interpreting macroeconomic impacts. As discussed in Section 2.1, a GRC is not an 33exercise in broad macroeconomic policymaking. So factors such as macroeconomic 34impacts should only be considered in a GRC to the extent that there is some clearly 35useful information regarding these impacts. PG&E’s analysis provides little useful 36

13
information and it should not be relied upon as a basis for an appropriate analysis of 1macroeconomic impacts.2
3PG&E’s analysis of macroeconomic impacts is based on the IHS Global Insight study 4(Ex. PG&E-1, Appendix 2A).15 As described in the study’s Introduction and Conclusion:5
6Under the PG&E proposal, annual capital spending will range between 7$2,500 million and $2,800 million during the three-year period. PG&E's 8proposed expenditure has sizeable economic impacts on employment, 9output, value added and wages. On average, more than 16,000 jobs are 10created16 per year.1711[…]12The study results suggest that every one million dollars of capital spending 13by PG&E creates more than 6 jobs in the Northern and Central California 14economy. These jobs are highly desirable, earning a real income of 15$80,000 per year and a real value added of $132,000 per year measured 16at 2011 prices.1817
18Taken at face value, the IHS Global Insight study would seem to indicate that PG&E’s 19proposed capital investments are an overall plus for service area macroeconomic 20activity. PG&E will spend about $8 billion on capital projects, and high paying jobs will 21be created.22
23These conclusions are frankly surprising. As explained in Section 2.2, utility capital 24expenditures can result in some job gains over the short-term, but any such gains are 25rapidly eroded as the costs of these expenditures are recovered from ratepayers. 26Moreover, each dollar of capital expenditures results in substantially more than a dollar 27of lifetime cost recovery.19 So with respect to macroeconomic impacts, capital 28
15 This study is only 8 pages long, and only limited documentation is provided therein. Moreover, no additional documentation or workpapers from IHS Global Insight have been made available in this proceeding (Response to DRA 098-04, Response to CFC-002-01c).16 [Footnote in original omitted]17 Ex. PGE-1, p. Appendix 2A, p. 2.18 Ex. PGE-1, p. Appendix 2A, p. 8.19 Cost recovery includes return on rate base (financing costs), as well as associated taxes. Financing costs and taxes will have a larger impact upon lifetime cost recovery as the following factors increase: useful/ratebase life, interest rates, required equity returns, and effective tax rates. The capital spending proposed by PG&E in GRC 2011 includes a large amount of distribution system and other investments with long useful lives. So PG&E’s proposal will entail very sizeable lifetime financing and tax costs. By comparison, a dollar of capital spending in the rate base for a short period would give rise to only slightly more than a dollar of lifetime cost recovery. And a dollar of utility spending that was expensed would entail only a dollar of cost recovery.

14
expenditures result in long-term losses, which exceed the short-term gains. Put another 1way, the net impacts are negative over the long-term.2
3There are situations where utility spending can result in positive net macroeconomic 4impacts. First, in some cases, the utility is not recovering the costs from customers 5within the economy where the spending is taking place. A common real world example 6would be a generation project built to supply power to customers in another state. So 7the economy of the state where the power plant is located will have the short-term 8gains, but not the long-term losses associated with cost recovery.9
10Second, utility spending can have positive impacts in regard to energy provision such 11that there are ratepayer benefits that offset ratepayer costs. A common real world 12example would be cost-effective energy efficiency. As many jobs studies have shown, 13utility spending that helps to reduce energy consumption and customer bills can have 14quite beneficial macroeconomic impacts.15
16So for there to be a finding of positive net macroeconomic impacts from utility capital 17spending, a jobs study would have to assume that (a) costs will not be recovered from 18customers in the economy being modeled, or (b) there were some offsetting benefits to 19ratepayers.2020
21But the conclusions of the IHS Global Insight study clearly state that neither of the 22above assumptions were made in this study:23
24The positive economic impacts shown here are net of any offsetting 25impacts of increases in the cost of electric service to final consumers. The 26impacts reported in this study are conservative both because they are net 27of possible impacts on electricity price but, perhaps more importantly, 28because they do not include possible positive impacts on the local 29economy due to the provision of enhanced energy delivery services that 30result from the proposed capital spending.2131
32A simple reading of the IHS Global Insight study results is that there will be more jobs 33and other economic activity in the PG&E service area owing to the utility spending $8 34
20 There are situations where it might be appropriate for a jobs study to assume some combination of (a) and (b). And as noted in footnote 19, the impact of financing costs and taxes will vary depending on the useful/ratebase life of the capital spending and other factors; but for the type of capital spending proposed by PG&E in GRC 2011, the net macroeconomic impacts would be negative absent some combination of assumptions (a) and/or ( b) and/or some other special circumstances.21 Ex. PGE-1, p. Appendix 2A, p. 8, emphasis added.

15
billion in capital expenditures; according to the study, these are the results even after 1costs are recovered from ratepayers. 2
3Given the nature of utility ratemaking and the PG&E service area economy, this is a 4very surprising and unlikely result. Typically, once the impacts of cost recovery are 5factored in, the net macroeconomic impacts would be negative (or at best zero), rather 6than substantially positive.7
8But in fact, the positive macroeconomic impacts shown by IHS Global Insight are not9net of any offsetting impacts of increases in the cost of electric service to final 10consumers. The study actually takes into account only a very small portion of the cost 11recovery from customers. And by assuming away most of the costs, net impacts are 12made to appear positive when they will actually be negative. 13
14The IHS Global Insight study analyzes proposed capital investments to be made in the 15three-year GRC rate cycle (2011-2013). For each of the three years of capital 16investments, IHS Global Insight assumes an 18% adjustment for cost recovery.2217
18This 18% adjustment factor is based on a single year of cost recovery:19
20The 18% adjustment factor represents the annual capital related revenue 21requirement. This estimate is based on discussions with PG&E’s analysts 22who are familiar with the revenue requirements model. The 18% capital 23related annual revenue requirement is primarily composed of return on 24invested capital, depreciation on invested capital and taxes related to 25capital investments. In other words an increase in annual capital spending 26of $1 billion will result in an increase in the annual revenue requirement of 27approximately $180 million. Only the net of those two numbers, $820 28million, is being considered in IHS Global Insights impact analysis.2329
30The basis for the 18% estimate is that each $1.00 in capital investment will 31produce a revenue requirement increase of approximately $0.18. The 32primary components of this $0.18 in capital related revenue requirement 33are the cost of capital ($.13), depreciation on capital invested ($.04), and 34property taxes ($.01).24 35
36
22 Ex. PGE-1, p. Appendix 2A, p. 6; Responses to DRA-098-09, DRA-098-09, DRA-147-03 and DRA-165-04; Response to South San Joaquin-002-15d; Response to CFBF-002-03.23Response to DRA-098-08.24 Response to CFBF-002-03.

16
In effect, the IHS Global Insight study captures only the first year of cost recovery, for 1each of the three years of investments. So there is cost recovery in 2011 for the 2011 2investments, cost recovery in 2012 for the 2012 investments, and cost recovery in 2013 3for the 2013 investments. But there is no cost recovery in 2012 for the 2011 4investments, and no cost recovery in 2013 for the 2011 and 2012 investments.5
6Thus, the IHS Global study Insight includes the capital investments made over the 7entire three-year rate cycle period, but fails to include the full cost recovery over the 8same three years. So the study incorporates the benefits of a full three years of 9spending (yielding all the spending benefits in terms of macroeconomic impacts), but 10fails to even include a full three years of cost recovery. 11
12Meanwhile, long-term impacts are completely ignored. There is absolutely no 13consideration of any cost recovery after 2013. So the vast majority of lifetime cost 14recovery has been excluded from the analysis. As a result, the net macroeconomic 15impacts are claimed to be positive, when they will actually be strongly negative over the 16long-term life of the capital investments (i.e. the period over which the costs are 17recovered from ratepayers).18
19Put another way, the IHS Global Insight study is in effect assuming that these capital 20investments will be in rate base for just one year. And on that wholly unrealistic basis 21(which takes into account only a fraction of the cost recovery), the study then claims that 22there are positive net macroeconomic impacts. But in this GRC, PG&E is certainly not 23proposing that these capital investments be treated this way for the purposes of 24ratemaking. Instead, the utility proposes to undertake these capital investments, which 25will be in the rate base for decades, with associated cost recovery from ratepayers. The 26real result will be adverse macroeconomic impacts on both ratepayers and the service 27area economy far into the future. 28
29In Section 2.2, the point was made that utility capital spending is not a macroeconomic 30free lunch. Rather it is a lunch paid for by customers, with a substantial adder for 31financing costs and taxes. The IHS Global Insight study does not quite assume that 32utility capital spending is a free lunch, but close. It assumes only one year of cost 33recovery, equal to 18% of the capital spending. 34
35On this basis, it might appear that IHS Global Insight is assuming that capital spending 36is a lunch that is discounted by 82%.25 But actually, the discount assumed by IHS 37Global Insight is much greater. As previously noted, customers pay a substantial adder 38
25 100%-18%.

17
for financing costs and taxes. So each dollar of capital spending results in more than a 1dollar of cost recovery.2
3Thus, the cost recovery included in the IHS Global Insight study is actually less than 410% of what would be reflected in a more appropriate analysis of macroeconomic 5impacts over the full cost recovery period.26 In effect, IHS Global Insight is assuming 6that capital spending is a lunch that is discounted by over 90%. Given the level of 7approximation inherent in estimating jobs and related macroeconomic impacts, a 8discount of over 90% is basically a free lunch.9
10To the extent that the results of the IHS Global Insight study provide any useful 11information for this GRC, they do help to demonstrate the scale of the positive 12macroeconomic impacts associated with the proposed capital spending (while ignoring 13the adverse impacts associated with cost recovery). Put more simply, spending $8 14billion will (by itself and prior to consideration of cost recovery) result in some jobs 15creation and other economic stimulus. So there will certainly be some winners 16associated with spending all this money.17
18The scale of the proposed capital spending, and the associated macroeconomic 19impacts, serve once again to demonstrate the importance of enhanced consideration of 20impacts on customers and communities. As noted above, there will be some benefits 21and some winners associated with all this spending. Based on an input-output analysis, 22the IHS Global Insight study claims that the proposed capital expenditures will result in 23significant macroeconomic impacts within the service territory. But this input-output 24macroeconomic analysis is mute on the geographic and demographic distribution of 25such impacts. 26
27Given the potential magnitude of these impacts (both positive and negative) and their 28uneven distribution, it is certainly worth considering the development of tools to support 29a more granular determination of how these capital expenditures will impact customers 30and communities throughout the service territory. As Section 2.1 concludes, a focus on 31such impacts would facilitate the consideration of equity issues and encourage 32initiatives such as energy efficiency for low-income customers, workforce inclusion, and 33supplier diversity. These initiatives will be further discussed in Section 3.34
35
26 As further discussed in footnote 28, there is some judgment involved as to how long-term cost recovery is modeled for the purposes of estimating macroeconomic impacts. Substantial effort would be required to undertake a detailed estimation regarding the lifetime rate recovery for the proposed capital expenditures. So the estimates provided herein regarding how much the discount exceeds 82% are approximate.

18
Once again, the benefits of this spending must be considered with the costs, notably the 1costs that will be recovered from ratepayers. An appropriate analysis of macroeconomic 2impacts would indicate that the long-term job losses far exceed any short-term gains. 3That said, as discussed in Sections 2.1 and 2.2, there are trade-offs between the long-4term losses and short-term gains. Moreover, in the context of the ongoing economic 5crisis, there is a better than usual trade-off for a job gain in the short-term against a net 6job loss in the long term. Capital spending in this GRC thus could have some benefits 7as a countercyclical initiative. Still, the Commission must decide whether such a trade-8off is warranted.9
10In order to make an informed decision as to whether countercyclical spending is 11advantageous in the current GRC, the Commission should be provided with complete 12information regarding the short- and long-term economic benefits and costs over the life 13of the capital expenditures. The IHS Global Insight study is completely deficient in that 14regard. It provides no information about impacts after 2013. And even the analysis that 15is provided regarding impacts during the 2011-2013 period is too flawed to be relied 16upon.17
18In the context of this proceeding, I have not been able to undertake an independent jobs 19study to provide more reliable guidance for the Commission. However, I am able to 20provide some approximations. These rough estimates are based on my extensive 21experience regarding jobs studies, as well some adjustments that I have applied to 22correct the most serious flaws in the IHS Global insight study.2723
24The starting point is a more appropriate modeling of cost recovery. Based on the IHS 25Global Insight assumption that first year rate recovery is 18%, we can get a quick sense 26of trade-offs regarding the short-term job gains and long-term job losses. 28 The 27
27 As noted in Section 1, a major focus of my work over the last two decades has been the relationship between energy and economic development/regional economics. In that period, I have conducted over 15 national, regional, and state/provincial studies on the macroeconomic impacts (notably jobs) of various energy options in California and elsewhere in the US and Canada. And I have reviewed (and in some cases critiqued) over 100 jobs studies performed by others.
Thus, the subject matter of the IHS Global Insight study is very familiar territory for me. Moreover, this study used the IMPLAN input/output model (Ex. PGE-1, p. Appendix 2A, p. 3). I have utilized IMPLAN as the basis for most of my own jobs studies. And many of the studies I have reviewed were produced using IMPLAN.28 There is some judgment involved as to how long-term cost recovery is modeled for the purposes of estimating macroeconomic impacts. Substantial effort would be required to undertake a detailed estimation regarding the lifetime rate recovery for the proposed capital expenditures. Notably, these investments include many components, with different useful lives and other aspects affecting rate recovery. So the estimates provided herein are approximate.
Assuming that 18% represents a first year nominal carrying charge rate, some components could be adjusted or netted out. The amount of annual cost recovery should decline as the amount in ratebase (footnote continued on next page)

19
cumulative cost recovery over the first three years will equal about half of the 1investment spending. After six or seven years, cost recovery will equal the full amount 2of the investment spending. And there will then be decades more of cost recovery and 3job losses.294
5So the trade-off between short-term job gains and long-term losses is more a trade-off 6between very short-term, and mid-term and long-term.7
8To be more specific, for 2011 capital expenditures, half of the investment spending will 9have been offset by cost recovery within the GRC rate cycle (2011-2013).30 And by 102016 or 2017, all of the investment will have been offset. And there will then be decades 11more of cost recovery and job losses.12
13So from a countercyclical standpoint, there is only a weak case (at best) to be made for 14capital spending in 2011. There is some economic stimulus (net positive impacts) in 152011, but these benefits are rapidly eroded by ongoing cost recovery. If it was expected 16that the economy would rapidly recover and return to full employment after 2011, there 17might be some merit to such a trade-off. But it seems more likely that the recovery will 18be more gradual, and there will be an extended period when unemployment remains 19high. So in conclusion, it does not seem warranted for the Commission to now approve 20these types of countercyclical initiatives and other macroeconomic fine-tuning.31 21
22
is depreciated. Inflation should be adjusted for (either by performing the analysis in real dollars, or by deflating the future year cost recoveries). Finally as noted by PG&E (Response to DRA-098-08), property taxes could be netted out; a similar adjustment for at least a portion of state taxes could be appropriate.. PG&E (Response to DRA-098-08) also raises the issue of netting out returns paid to shareholders and bondholders who reside in the service area. Such an adjustment does not seem warranted, since this is a capital market issue; if local investors do not need to fund PG&E capital investments, they can earn returns from other investments, including from those not based in the service territory.29 Some PG&E capital investments are assumed to have negative net salvage value, sometimes exceeding 100%. A comprehensive long-term macroeconomic analysis would include the jobs and other impacts associated with removal and end-of-life activities. But given that such activities occur far into the future, and are uncertain as to their actual costs and impacts, they may not be essential to consider in a macroeconomic analysis. 30 If it is assumed that investment is not added to ratebase until later in the year, then the first three years of recovery will stretch into 2014. But this level of precision is beyond the scope of this approximate analysis. 31 A similar analysis could be undertaken for capital spending in 2012 and 2013. Spending in those later years would also provide some economic stimulus. But any such boost will be of somewhat less value than for 2011 capital spending, since economic conditions will likely be improving as time goes on. On the other hand, the cost recovery associated with investments in later years may actually be somewhat better matched to economic cycles. Notably this cost recovery may start to cool the economy at a time when that could be a beneficial result in terms countercyclical fine-tuning. But as with capital investments in 2011, it does not seem warranted for the Commission to embark upon this kind of macroeconomic polcymaking.

20
2.4 Broad Adverse Implications of Setting the Revenue Requirement Too High12
In evaluating PG&E’s proposed capital expenditures, there is another key issue related 3to service area macroeconomic impacts and utility ratemaking that we should not lose 4sight of. The claims made by PG&E as to how its spending may benefit the service area 5economy are contingent upon PG&E actually using the money it receives from 6ratepayers to provide required energy supply in a manner that benefits ratepayers. As 7discussed by DRA, and also considered in Section 4.2 (regarding the Economic 8Development program), there have been cases in the past where PG&E’s forecasted 9spending has substantially exceeded actual.32 In other words, there have been 10instances where PG&E has collected for activities that it did not actually undertake.11
And to the extent that PG&E’s revenue requirements are set based on an overestimate 12of future costs, the customers are paying for expenditures not actually being made. 13
Thus, the customers are paying, without receiving offsetting benefits. Instead, the 14shareholders are benefitting. And such an outcome is problematic both in terms of 15service territory economic activity and equity considerations. 16
All else equal, greater cost recovery from utility ratepayers is an impediment to service 17area economic activity.33 When PG&E customers pay more to the utility, and do not 18receive offsetting benefits, they have less funds available for all other activities. They 19are losers, as is the service area economy as a whole. 20
The winners are the shareholders. As PG&E notes, some of these shareholders will be 21located within the service area “and spend at least some portion of those investment 22returns on goods and services in the local economy.”34 On the other hand, all PG&E 23customers are (by definition) located within the service area. So it is reasonable to 24assume that spending by ratepayers is more oriented to the service area than is 25spending by shareholders. Thus, transferring income from ratepayers to shareholders 26will typically be a net loss for the service area economy.27
32 See e.g., Ex. DRA-6, pp. 8-13, 25-38; Ex. DRA-8, pp. 4-5.33 In general, all else being equal, lower costs are better than higher costs. However, in the real world, all else is frequently not equal. When comparing alternative scenarios for the energy system, it is important to factor in other considerations (e.g., productivity) that are affected by these costs.
Energy costs are oftentimes related to other factors that can have significant economic effects. There may be tradeoffs between energy costs and other considerations such as reliability and environmental impacts. For example, the regional economy may perform better with somewhat higher costs for a highly reliable energy system with good power quality and relatively low environmental impacts than it would with somewhat lower costs for a less reliable system with lesser power quality and higher environmental impacts.34 Response to DRA-098-08.

21
And when income is unnecessarily transferred from ratepayers to shareholders, it is 1certainly a net loss in terms of equity considerations. Not all shareholders are located in 2the service territory. And even the shareholders located within the service territory are 3unlikely to be a representative sample of ratepayers.354
The preceding discussion is not intended as a rationale for ratepayers to generally pay 5less to the utility, so as to achieve a general transfer of income from shareholders to 6ratepayers. Rather, it is intended to point out that there are broader implications when 7revenue requirements are set higher than they need to be in order to recover the costs 8of providing utility service. Ratepayers, the service area economy, and equity are all 9losers. Only the shareholders are winners. 10
Thus in determining the appropriate level of capital expenditures, consideration should 11be given to the broad adverse implications of unduly high rates, as well as the extent to 12which PG&E has been recovering costs for activities that were not undertaken.13
14
2.5 Conclusions and Recommendations on Consideration of Economic Impacts 15in the Current GRC16
17
Section 2.1 concludes that macroeconomic impacts (which have been used by PG&E to 18justify its capital expenditure proposal) are just one type of broader measure to consider 19in the evaluation of utility expenditures. In terms of broader measures, impacts on 20customers and communities are of equal or greater relevance, and have the further 21advantage of addressing equity considerations. 22
Section 2.2 then examines how utility capital expenditures can result in some job gains 23over the short-term, but that any such gains are rapidly eroded as the costs of these 24expenditures are recovered from ratepayers. Moreover, these short-term job gains are 25unevenly distributed among the service area’s customers and communities. 26
Section 2.3 reviews PG&E’s analysis of the macroeconomic impacts from the proposed 27capital spending, as presented in the IHS Global Insight study. PG&E’s claims about 28macroeconomic impacts are based on an analysis that is selective and simplistic. The 29
35 See e.g., www.census.gov/prod/2008pubs/p70-115.pdf. For US households, there is a strong relationship between equity ownership and attributes such as income, age, and ethnicity. Equity ownership increases with income and age and is also higher for whites and Asians than for blacks and Hispanics.
Income transfers from ratepayers to shareholders would raise equity considerations even in the highly unlikely case where shareholders were all located within the service area and were a representative sample of ratepayers. In such a case, the many would still be paying to benefit the few.

22
IHS Global Insight study provides little information that is useful for ratemaking, and 1could even be misleading. This study ignores virtually all of cost recovery and assumes 2that utility capital spending is a macroeconomic free lunch. Given the study’s failure to 3provide an appropriate analysis of macroeconomic impacts, PG&E’s claims about these 4impacts are unsupported.5
Section 2.4 discusses the broad adverse implications of setting the revenue 6requirement too high. 7
But while the Global Insight study provides no sound basis for PG&E’s claims, it does 8help to demonstrate the scale of impacts associated with the proposed high level of 9capital expenditure during the GRC. $8 billion of capital spending will lead to significant 10economic impacts within the service territory, both positive and negative, including 11significant macroeconomic impacts, both positive and negative. As discussed in Section 122.3, input-output macroeconomic analysis (used in the IHS Global Insight study) is mute 13on the geographic and demographic distribution of macroeconomic impacts. But in the 14real economy, the significant economic impacts (both positive and negative) resulting 15from a high level of utility spending will be distributed unevenly across the service 16territory. There will be very substantial impacts upon customers and communities. 17
Therefore, given the potential magnitude of these impacts and their uneven distribution, 18I recommend that impacts on customers and communities be considered as primary 19factors in terms of the broader factors for the evaluation of the capital spending. As 20such, PG&E should develop tools to support a more granular determination of how 21capital expenditures will impact customers and communities throughout the service 22territory. Using impacts on customers and communities as a guide, and with a more 23granular understanding of these impacts, PG&E should then implement activities that 24offset the adverse impacts on customers and communities of the proposed capital 25spending and while addressing equity concerns. Section 3 provides an overview of such 26activities, which serve to optimize and diversify the economic impacts of utility capital 27spending.28
29
3. Optimizing and Diversifying the Economic Impacts3031
The Commission is currently faced with an application for a high level of capital 32investment and other utility spending. This section delves further into the issue of how 33the short- and long-term benefits and costs of this spending are distributed (i.e. who are 34the winners and who are the losers?), as well as how to mitigate the adverse impacts on 35ratepayers during the cost recovery period. As discussed in Section 2.1, impacts on 36customers and communities are primary factors to be considered in terms of broader 37
23
factors for the evaluation of utility capital expenditures. This section examines the 1activities that are encouraged by prioritization of these impacts, including Low-Income 2Energy Efficiency (LIEE), low-income solar initiatives, low-income training and 3workforce inclusion, and supplier diversity. In the particular context of this GRC, a 4strong economic rationale is provided for supplier diversity.5
As such, this section relates to the macroeconomic impacts of PG&E’s proposed capital 6expenditures as set out in PG&E’s filing (Ex. PG&E-1, and particularly in Appendix 2A). 7This section is also relevant in relation to PG&E’s Supplier Diversity and Workplace 8Diversity initiatives (Ex. PG&E-6, pp. 15-14 to 15-24) and specifically to PG&E’s 9$2,904,927 cost request related its Diversity and Inclusion Department (Ex. PG&E-6, p. 1015-25). 11
3.1 The Particular Importance of Supplier Diversity Initiatives in this GRC1213
As discussed in Section 2, even if higher capital spending is somehow justified as a 14short-term economic stimulus in this GRC, there will still be adverse impacts owing to 15higher rates over the entire cost recovery period. As a result, with higher spending, the 16winners will do even better, and the losers will do even worse. In particular, PG&E 17customers will be paying more during the GRC period, when many will already be 18struggling in a very deep and persistent economic crises. So to the extent that there is 19a rationale for higher capital spending in this GRC, there is a particular need to consider 20the impacts on customers and communities, and to address related equity 21considerations.22 23Supplier diversity initiatives are of particular importance in this GRC given the significant 24amount of benefits and costs involved in the proposed capital expenditures (and other 25expenditures), as well as the uneven distribution of these benefits and costs.36 Even if a 26portion of the proposed capital expenditures are approved, the amount will be 27substantial. And such a substantial level of capital investment will result in a sizable 28amount of economic activity, as well as sizable costs, as discussed in Section 2. 29
30These benefits and costs will not be evenly distributed throughout the economy. Indeed, 31the winners will be those who benefit from three years of capital expenditures of 32approximately $8 billion (PG&E employees, contractors, providers of materials and 33services related to the capital investments, etc.) and the costs (rate recovery 34substantially in excess of $1 billion per year) will be borne by the ratepayers for many 35
36 Supplier diversity efforts are those undertaken by a business (or other economic actor) to broaden its pool of contractors in the procurement of goods and services. Typically these efforts are focused on businesses in underutilized or "minority" sectors of the population, such as those owned by women, racial minorities, or disabled veterans.

24
years to come. Put another way, there are major equity issues associated with the high 1level of proposed capital expenditures, particularly during the current economic 2downturn. 3
One way of optimizing the $8 billion investment and of better aligning the costs and 4benefits for the ratepayers (who are bearing the costs) is to ensure that PG&E 5implements strong supplier diversity initiatives. Supplier diversity initiatives are an 6effective mechanism to mitigate the adverse impacts of cost recovery on ratepayers and 7to address related equity issues. 8
Put simply, targeting diverse suppliers can mitigate some of the burden of high capital 9investment spending on ratepayers. Supplier diversity can help to spread out the 10winnings in local communities and create some greater overlap/offset between winners 11and losers. If PG&E has strong supplier diversity initiatives in place, local and diverse 12businesses and suppliers can become the recipients of the PG&E capital expenditure. 13Some of the economic burden of the capital expenditure can be offset, and there will be 14more winners and fewer losers as a result.15
In the context of the high level of proposed capital expenditures, supplier diversity is 16both relevant and important (i.e., of material concern in this GRC). The remaining 17subsections (3.2 to 3.8) further develop the economic rationale for strong supplier 18diversity initiatives, particularly in the context of the current GRC.19
20
3.2 Utility Regulation’s Inherent Focus on the Distribution of Benefits and Costs2122
The provision of electricity and gas involves activities that are inextricably linked to the 23public interest. Energy supply is a foundation of economic activity, has a very large 24environmental footprint, and utilities are (to a sizable extent) monopoly suppliers.25
Thus, within PG&E’s service area, (almost) all residents and businesses are customers 26of the utility. So (almost) all businesses and residents pay rates, and (almost) all are 27affected by rate increases. In that sense, all are “winners” in the terms of having energy 28supply, but all are also “losers” in terms of paying for it (via both rates and through other 29channels like environmental degradation). But while all entities are affected in both 30positive and negative ways, all are not all equally affected. The distribution of benefits 31and costs is sensitive to how energy is supplied and how the costs are recovered. A 32key reason why many intervenors are active at the Commission is to influence the 33distribution of these sizable benefits and costs.34
35

25
3.3 The Role of Utilities and the CPUC in the Distribution of Benefits and Costs12
In the current context (notably the GRC), the key question to be considered here is what 3(if anything) should be done by the Commission in regard to equity issues. Clearly, the 4Commission has to consider equity issues in terms of cost allocation and rate design. 5In effect, the Commission is deciding who pays, and issues of equity/fairness are thus 6quite central.7
Beyond core areas of cost allocation and rate design, there are various actions (by the 8utility and Commission) that affect distribution of costs and benefits. Utilities (and the 9overall energy system) have a very large environmental and economic footprint, which 10have important impacts on the distribution of benefits and costs. There are major 11environmental justice issues in regard to the energy system. And to the extent that 12there are such issues, there is a rationale for policies both to reduce the overall 13environmental burden of the energy system, and to mitigate this burden by policies 14favorable to those otherwise adversely affected.15
Given utilities’ large economic footprint, utilities and regulators should also take into 16account the broader economic impacts of utility investments, as well as associated 17equity issues. 18
In justifying its large proposed capital expenditures in the current GRC, PG&E attempts 19to make the case that these expenditures will stimulate the economy. Section 220questions the claim that such capital expenditures will result in significant economic 21stimulus. In using an economic stimulus rationale to support its capital investment 22proposal, PG&E characterizes the existing policy framework for the consideration of 23economic development issues by the Commission in utility rate cases:24
It is PG&E’s position that, pursuant to Sections 454 and 701 of the Public 25Utilities Code, the Commission has discretion to consider a broad range of 26factors in determining a utility's "just and reasonable" rates, including 27whether the costs of the utility's planned capital expenditures are justified 28by the benefits to safety, reliability, and the economy.3729
So as discussed in Section 2.1, PG&E is asking the Commission to apply a 30broad perspective by taking into account the macroeconomic impacts of PG&E’s 31investments, and is making reference to the policy framework for potential32consideration of such issues. Section 2.1 concludes that in terms of broader 33factors, impacts on customers and communities are of equal and potentially 34
37 Response to CFC 002-01a.

26
greater relevance than macroeconomic impacts, and have the further advantage 1of addressing equity considerations. Sections 3.4 to 3.8 further explore equity 2considerations related to utility expenditures. 3
4
3.4 Equity Considerations for Utility Capital Investments56
Consistent with Commission’s existing policy framework, which includes some 7consideration of wider economic impacts in determining rates, there is typically 8some attention paid to equity considerations for utility capital investments in most 9North American jurisdictions. 10
Notably, utilities and regulatory bodies generally make some effort to apply a 11user-pay principle. Some distribution system activities (such as new 12connections) are subject to contributions in aid of construction. And part of the 13goal for cost allocation and rate design is to provide a linkage between cost 14causation and cost recovery.15
That said, the utility system inevitably involves a substantial degree of cost 16averaging/cost shifting. This means there are many winners and many losers, 17certainly in the short-term, but even in the long-term. With new technologies 18(such as improved metering), it may be possible to more closely relate cost 19causation and cost recovery; however, this is a complex topic that extends far 20beyond the scope of this testimony and the current proceeding. Suffice it to say 21here that there has never been, and will never be, a precise (and universally 22accepted) linkage between costs and what each customer pays. There are a 23variety of constraints and considerations, such that there will inevitably be some 24winners and losers.25
In this context, effective mechanisms are highly recommended in order to 26address the uneven distribution of benefits and costs across customers and 27communities. As evidenced by the current proceeding, we may be entering a 28period of increased capital expenditures as utilities replace and upgrade their 29infrastructure, notably in regard to distribution systems. And in this context, 30suppler diversity could be an important initiative to improve outcomes, by 31mitigating negative impacts on customers and communities. Supplier diversity 32can help to address equity considerations, notably in regard to: (a) customer 33choice; and (b) geographic and demographic concentration. 34
Regarding the issue of customer choice, utility customers do not have direct say35in who gets hired to do work for the utility (either as suppliers or employees). 36

27
Unlike the case of a home improvement project, utility customers do not get to 1pick the contractor or utility; instead, they are paying rates to the utility and the 2utility is picking the contractors. So this alone is a rationale for initiatives that will 3help to increase supplier diversity, and make it more representative of (and 4supportive for) a utility’s diverse service area and customer base.5
Second, there is also the issue of geography and the related issue of 6demographics. Generally, utility capital investments, especially for distribution 7system activities, may go disproportionately to more newly developed and more 8rapidly growing portions of the service area. Certainly, spending for new 9connections and major capacity additions and other upgrading will be 10concentrated where customers are being added and usage is growing fastest.3811As such, supplier diversity initiatives will again help to address equity issues by 12spreading out the winners and losers throughout the geography and different 13demographics of the service area. As will be discussed in Section 3.7, these 14equity problems are highly relevant, and (if anything) even more pronounced, in 15PG&E’s service territory in the current GRC.16
3.5 Equity Considerations for Utility Energy Efficiency and Distributed Solar 17Programs: an Analogy18
19
Equity considerations related to utility capital investments (such as distribution system 20upgrading) have some analogies to other major utility initiatives such as energy 21efficiency and customer-side distributed solar. And experience with energy efficiency 22(EE) and distributed solar demonstrates that it is important to give strong consideration 23to equity issues.3924
38 Some capital investments relate to serving existing usage, and specifically to replacing and upgrading existing facilities that have reached the end of their useful lives or are otherwise no longer adequate to serve existing usage. Such investments may be more widely distributed across the service territory. On the other hand, even these types of investments may be geographically concentrated in various ways, especially in the short-term. Many types of utility equipment have long lifetimes, and thus give rise to occasional large investments. For the system as whole, investments will be less lumpy and concentrated. Still, it is likely that investments will prove to be somewhat uneven as to where and when they occur. Moreover, even if some investments are more widely distributed across the service territory, this does not imply that the related suppliers will be evenly distributed in terms of geography or demographics.39 EE and customer-side distributed solar are behind-the-meter and typically involve some direct participation by customers. By comparison, capital investments (such as distribution system upgrading)are utility-side and part of the utility’s overall infrastructure. Therefore the point of examining these analogies is not to make a case that all utility initiatives entail the same equity considerations. Rather, in evaluating utility capital investments, it is useful to review the experience of equity considerations in regard to other utility initiatives.
Moreover, even if capital investments are utility-side, some are quite proximate (both physically and conceptually) to customer-side EE and distributed solar. Notably, the distribution system closest to (footnote continued on next page)

28
Since the last GRC (GRC 2007), there have been major new developments in EE and 1solar initiatives, and especially in Low-Income Energy Efficiency (LIEE) and low-income 2solar initiatives. And there have many other deep changes in the California policy and 3economic environment, including: the economic crisis, the focus on green jobs, the4increasing awareness of climate change and the environmental crisis, and the 5implementation of AB 32.40 So there is significantly more focus on how utility spending 6can be done in ways that are efficient and beneficial to a wider number of low-income 7customers. The discussion of California’s experience with LIEE and low-income solar 8initiatives provides lessons for addressing equity considerations and increasing LI 9customer and community benefits from other capital expenditures. 10
Analogy With Equity Considerations Relating to Energy Efficiency Programs11
There are a variety of equity considerations relating to EE programs. In particular, 12absent a particular targeting of low-income residential customers, such customers may 13not be well-positioned to participate in (and benefit from) EE programs. To provide a 14local example, what works to reach affluent residential customers in Walnut Creek may 15not work to reach low-income customers in East Oakland. 16
Moreover, especially traditionally, much of the low-hanging fruit (the largest and most 17cost-effective EE) was in the commercial sector. So absent particular targeting of 18residential (and perhaps industrial) customers, EE programs could be very much 19focused on the commercial sector. And even within the commercial sector, there can 20be equity issues similar to those in the residential sector. The low-hanging fruit in the 21commercial sector may be concentrated with large (and relatively well-off) customers 22versus smaller (and less well-off) customers. What works to reach large commercial 23complexes in Walnut Creek may not work to reach corner stores in East Oakland.24
So for various reasons, it is desirable for EE programs to target a broad array of 25customers and sectors. This helps to maximize overall energy savings (and 26environmental and economic development benefits). Moreover, it helps to build and 27maintain broad support for EE programs.28
each customer meter is serving only a single or small number of customers. So if a sizable investment is required to connect a new customer to the distribution system, there can be equity considerations similar to those that arise when the utility pays for EE and/or distributed solar for that same customer. And there can be important interrelationships between these various undertakings. Notably, EE and distributed solar can be targeted to reduce distribution system investments.
For all these initiatives, there are issues (and equity considerations) concerning user-pay, customer contributions, and rate-making. And these equity considerations can be further intensified by customer demographics. In situations where connection costs and potential for EE and/or distributed solar are especially high, customer incomes may also be especially high. 40 AB 32 (the Global Warming Solutions Act of 2006) was signed into law in September 2006 (during GRC 2007); AB 32 implementation mainly postdates GRC 2007.

29
Notably, a sizable portion of the cost of EE programs is typically recovered from non-1participants. So if EE programs are narrowly targeted, this can undercut support for 2these programs. If many customers are paying for EE, but are not participating (and are 3unlikely to ever participate), these customers will tend not to support EE (even if they 4are getting some environmental benefits). 5
Moreover, narrowly targeted EE programs can be regressive. In effect, less affluent 6residential and commercial customers may be largely non-participants, and may be 7helping to pay for the EE implanted by those more affluent.8
So to mitigate these equity considerations, comprehensive EE programs typically 9include a strong focus to target low-income residential and small/less well-off 10commercial. And aside from the usual benefits of EE, programs targeted to those less 11well-off can help to reduce payment problems/uncollectibles, improve customer quality 12of life/comfort/health/safety, and address equity considerations.13
In California, the history of LIEE programs dates back to the early 1980s, when the 14Commission instituted energy efficiency programs in response to the energy crisis of the 151970s. Perhaps needless to say, equity considerations have been important throughout 16the history of California’s LIEE programs.41 In fact, until recently:17
the Commission has identified LIEE programs as equity programs 18designed primarily to reduce the burden of energy bills of participating 19customers and promote their comfort and safety.4220
Equity considerations have also been a factor in LIEE program design. As with other EE 21programs, there are issues as to how to achieve broad participation in LIEE programs.43 22If only a small portion of customers are participants, they are winners. And non-23participants are losers (at least relatively). So to mitigate equity considerations 24regarding non-participants, it is not enough to just have programs targeted to low-25income customers. It is also important that these programs achieve broad participation 26by low-income customers. In other words, even equity programs need to be 27implemented so that the distribution of benefits (and costs) is reasonably equitable, both 28within the targeted population and relative to the broader population. 29
As noted above, until recently, LIEE was seen more as an equity program, than as a 30resource to achieve significant energy savings. LIEE budgets were highly constrained. 31So participation was very limited, both in terms of breadth (participation levels) and 32
41 See e.g., D.07-12-051, pp. 6, 15, 18, 20-26, 54-56, 67. 42 [Footnote in original: See, for example, D.05-12-026, D.05-10-044, D.86-12-095, D.87-12-057, D.95-05-045 and D.99-03-056.] D.07-12-051, p. 15.43 See e.g., D.07-12-051, p. 55.

30
depth (the amount and effectiveness of the measures implemented).44 Thus, LIEE 1programs were far from adequate to tap the full potential for increased energy efficiency 2among low-income consumers.3
In recent years, there have been very major changes regarding California EE and 4especially LIEE programs. And these changes have had important ramifications in 5terms of equity considerations.6
While California has long been a national leader regarding EE, numerous events have 7converged such that a major expansion of EE and especially LIEE programs is now 8underway:9
In October 2007, the California Public Utilities Commission (CPUC) 10created a framework to make energy efficiency a way of life in California 11by refocusing ratepayer-funded energy efficiency programs on achieving 12long-term savings through structural changes in the way Californians use 13energy.4514
The Commission recognized that California’s very ambitious energy 15efficiency and greenhouse gas reduction goals require long-term strategic 16planning to eliminate persistent market barriers and effect lasting 17transformation in the market for energy efficiency across the economy. 18Accordingly, the Commission committed to prepare and adopt a long-term 19strategic plan for California energy efficiency through 2020 and beyond.4620
Simply put:21
California’s highest energy priority is to pursue cost-effective energy 22efficiency measures over both the short- and long-term.4723
44 Annual participation was limited to about 3% of qualified customers (D.07-12-051, pp. 5, 23, 85). To spread these limited resources and mitigate equity considerations, PG&E and other utilities restricted repeat participation, even when such participation was otherwise warranted. Under the Ten Year Rule, a residence could receive LIEE programs no more than once every 10 years (D.07-12-051, p. 55).
Part of the justification for this rule was to promote equity (e.g., continuing expansion of dwellings previously not provided LIEE measures), considering the utilities’ constrained budgets.
45 [Footnote in original: California Public Utilities Commission Decision 07-10-032. (D.07-10-023) Available at: http://docs.cpuc.ca.gov/word_pdf/FINAL_DECISION/74107.pdf]46 California Long Term Energy Efficiency Strategic Plan, CPUC, September 2008, p. 1. <www.californiaenergyefficiency.com/docs/EEStrategicPlan.pdf>.47 D.07-10-032, p. 2.

31
To achieve California’s goals and priorities, a major expansion and redirection of LIEE 1programs was essential. This was necessary not just to address equity considerations, 2but also to meet California’s energy savings goals:3
4Today we clarify that the complementary objectives of LIEE programs are 5to provide an energy resource for California, consistent with our “loading6order” that establishes energy efficiency as our first priority, while reducing 7low-income customers’ bills and improving their quality of life. We commit 8to expand LIEE programs by making them available to more customers, 9improving their cost-effectiveness and designing them in ways to make 10them a reliable energy resource. To achieve these objectives, we adopt a 11programmatic LIEE initiative to provide all eligible LIEE customers the 12opportunity to participate in LIEE programs and to offer those who wish to 13participate all cost-effective energy efficiency measures in their residences 14by 2020.4815
Under this new policy direction, LIEE would longer be mainly an equity program. It 16would now become an important resource program that would move rapidly to achieve 17all cost-effective EE.49 And it would also enhance equity by reducing low-income 18customers’ bills and improving their quality of life. 19
To achieve these complementary objectives, a major increase in LIEE activity levels 20was required. A large portion of all customers are low-income. But even by 2009, after 21decades of LIEE program implementation; most low-income customers were still waiting 22to participate in LIEE. 50 23
At PG&E (and also at other IOUs),51 over 30% of all residential households are low-24income and eligible for LIEE.52 As shown in Table 1, there are almost 2 million LIEE-25eligible households at PG&E, and almost 6 million at all IOUs. 26
48 D.07-12-051, p. 2.49 According to D.08-11-031, p. 7:
Resource programs are designed to save energy, limit the need for new power plants, and curb greenhouse gas emissions.
50 Low-income customers are experiencing substantial energy-related hardships, including high energy usage, high energy bills, energy burden, and energy insecurity; LIEE can help to ameliorate these energy-related hardships. See D. 08-11-031, pp. 3-4; D.07-12-051, pp. 21, 23, 36-37.51 California Investor-owned utilities (IOUs) are subject to regulation by the Commission.52 Final Report on Phase 2 Low Income Needs Assessment, KEMA, Inc., prepared for CPUC, September 7, 2007, p. 4-4. <http://docs.cpuc.ca.gov/published/GRAPHICS/73106.PDF>. This report is extensively cited in D.08-11-031, notably as a basis for the Commission’s findings (pp. 99-114) regarding LIEE Eligible Population.

32
Table 1 : LIEE Eligible Households: Program Year (PY) 200953 541
UtilityTotal LIEE
Eligible
Unwilling to Participate
in LIEE
Treated by LIEE
PY 2002 - PY 2008
Treated by LIHEAP
PY 2002 - PY 2007
Remaining to be
TreatedPG&E 1,906,157 95,308 407,172 76,537 1,327,140All IOUs 5,751,076 287,554 1,138,349 224,387 4,100,786
% of Total LIEE EligiblePG&E 100% 5% 21% 4% 70%All IOUs 100% 5% 20% 4% 71%
2Prior to 2009, only about 20% of these eligible households had been “treated by LIEE” 3(i.e., received services); another 4% had been treated by other programs 4(LIHEAP/DOE). 5
So three-quarters of these low-income households were still waiting to receive 6services.55 These millions of low-income households left in the LIEE queue comprise 7over 20% of all residential households at PG&E (and other IOUs).568
The Commission established the following clear vision for this very large segment of the 9residential sector:10
11By 2020, 100 percent of eligible and willing customers will have received 12all cost-effective Low Income Energy Efficiency measures.57 13
To carry out this vision, spending on LIEE programs has to be much higher than in 14previous years. And commencing with the 2009-2011 program period, LIEE budgets are 15
53 D.08-11-031, p. 113 (source of table summarized herein as Table 1); pp. 99-114 (documentation of table).54 Source: D.08-11-031, p. 113 (data), pp. 99-114 (derivation of data).Notes:(1) PY = Program year.(2) “All IOUs” = PG&E + SCE + SDG&E + SCG (SoCalGas); (3) 5% of eligible households were assumed unwilling to participate and thus excluded from the population remaining to be treated (receive LIEE services) (D.08-11-031, p. 110); (4) The Ten Year rule (footnote 44) was assumed, so that only customers that had received efficiency services (from LIEE, LIHEAP, and DOE) from 2003 onward are restricted from subsequent LIEE participation (D.08-11-031, pp. 94-95,-111-112).55 In D.08-11-031, p. 110, the Commission assumed that 5% of households could be unwilling to participate in LIEE. On this basis, 70% of the eligible low-income population, who are willing and waiting to participate, remain to be treated.56 % Remaining to be Treated * % Low Income/LIEE Eligible = ~70% * ~ 30% = >20%. Sources :Table 1, Footnote 52.57 D. 08-11-031, p. 7.
33
rising to meet the challenge: over $400 million at PG&E, and almost $1 billion at all 1IOUs.582
With ratepayer funding at these levels, the low income programs can no 3longer operate with a business-as-usual approach. As we state in our 4recently adopted California Long-Term Energy Efficiency Strategic Plan 5(Plan),59 the LIEE program must evolve into a resource program that 6garners significant energy savings in our state while providing an 7improved quality of life for California's low income population. 608
More specifically, now that LIEE will involve spending sizable amounts of money, 9it becomes all the more important that this money be spent in a way that provides 10sizable benefits to low-income customers (and their communities), in addition to 11increased energy savings. So it is not just a matter of how much money is spent, 12but also how well it is spent.13
There are two aspects that relate to the matter of “how well” the LIEE money is 14spent. Neither is unique to LIEE. First, as with any EE, LIEE should be conducted 15efficiently and effectively so as to produce results in terms of saving energy and 16lowering customer bills. In the parlance of economics, increased efficiency in the 17delivery of LIEE programs can also result in increased equity. A well-run LIEE 18program will deliver more results per dollar spent, and this will maximize benefits 19to low-income customers (and their communities) in terms of lower bills and 20improved quality of life. In effect, those with low incomes are receiving services 21that provide benefits to those with low incomes. Services provided more 22efficiently deliver more benefits to more recipients than do services provided less 23efficiently. 24
The second aspect of “how well” relates to the participation of low-income 25customers (and communities) in EE program delivery. As a major utility initiative 26involving substantial expenditures, LIEE should be conducted so that low-income 27customers (and their communities) benefit through participation as workers and 28suppliers for these utility activities.61 In effect, those with low incomes are no 29longer just recipients of services, they are now involved in the provision of those 30
58 D.08-11-031, pp. 1-2.59 [Footnote in original: See <www.californiaenergyefficiency.com>.]60 D.08-11-031, p. 2.61 The issue of customer and community participation is relevant for all EE programs, but it is moreimportant in a low-income context. Put simply, initiatives that provide jobs are especially important to those who most need them.

34
services. This synergy can greatly increase the overall benefits to those with low 1incomes.622
Moreover, low-income participation in EE program delivery is not just an issue for 3LIEE programs. LIEE is just one component of a much larger set of EE 4programs. Other EE programs that are not specifically targeted to low-income 5customers (as service recipients) can also be conducted so that low-income 6customers (and their communities) benefit through participation as workers and 7suppliers for the EE initiatives. 8
Fortunately, the Commission has provided direction that LIEE and other EE 9programs should be implemented so that low-income customers (and their 10communities) can actually participate as workers:11
Goal 2: Ensure that minority, low income and disadvantaged communities 12fully participate in training and education programs at all levels of the DSM 13and the energy efficiency industry.14
Coordination of LIEE workforce training with other energy efficiency 15training programs is essential. This includes coordination with The Green 16Jobs Act of 2007 as well as with existing programs associated with State 17agencies such as the Employment Development Department (EDD) and 18the Department of Social Services (DSS). The Green Jobs Act of 2007, 19approved as part of the recent Federal Energy Bill, authorizes funding up 20to $125 million annually for job training in the energy efficiency and 21renewable energy industries and facilitates economic development within 22minority, low income, and economically disadvantaged communities. The 23IOUs will work to coordinate both the federally-supported training to be 24offered under this Act, as well as other State employment training 25resources, with the LIEE workforce training. Recruiting for trainees may be 26accomplished within the targeted communities served by LIEE 27contractors. This coordination should expand employment options for 28those in disadvantaged communities beyond the LIEE program itself. 29Finally, as new legislation is adopted and AB 32 begins implementation, 30additional funding and programs from those activities need to be 31leveraged to the advantage of the energy efficiency WE&T effort. 6332
62 As a result, some with low incomes may even do well enough so that they are no longer low-income. This is a very positive outcome not just for those who have moved up the income scale; it also means that resources can be redirected to benefit others who are still low-income.63 California Long Term Energy Efficiency Strategic Plan, CPUC, September 2008, p. 79. <www.californiaenergyefficiency.com/docs/EEStrategicPlan.pdf>.

35
The next section briefly examines equity considerations related to distributed 1customer-side solar initiatives. This will be followed by an overview of lessons 2learned from LIEE and low-income solar initiatives for addressing equity 3considerations and increasing LI customer and community benefits from other 4capital expenditures.5
Analogy With Equity Considerations Relating to Distributed Customer-Side Solar6
To focus on another utility initiative with potential equity considerations, California (along 7with other states and countries) is actively promoting the implementation of distributed 8solar (both PV and solar thermal). Distributed customer-side systems are mainly 9intended to offset retail electric and gas usage, in contrast with larger installations that 10are mainly supplying the grid (as opposed to displacing retail load).11
For various reasons, customers who can and will implement solar may tend to be more 12affluent. So absent some efforts to address equity considerations, efforts to promote 13solar may be regressive. Or to expand on the previous example, those less well-off in 14East Oakland may be helping to pay for solar implemented by those more affluent in 15Walnut Creek.16
To address these equity considerations, California has established a variety of low-17income solar initiatives.64 These initiatives incorporate job training programs intended to 18promote green-collar jobs in low-income communities and to develop a trained 19workforce, who will help foster a sustainable solar industry in California. Participation in 20low-income programs for solar is also tied to participation in LIEE programs. 21
Lessons Learned from LIEE and Low-Income Solar Initiatives for Addressing Equity 22Considerations23
These analogies demonstrate the importance of equity considerations and mitigatory 24strategies related to the adverse impacts to customers and communities of various 25utility initiatives. The experience until recently with LIEE is that a narrowly-focused26equity program may be highly constrained in what it can accomplish to improve equity. 27Budgets were low, and benefits were limited for lower-income customers and everyone 28else. Traditionally, LIEE was not a strong resource program, and resulted in limited 29energy savings and thus limited benefits for other ratepayers and the environment.30
The lesson of the new LIEE programs (recently expanded and redirected) and recent 31low-income solar initiatives is that low-income targeting continues to be more important 32and necessary than ever; but money can be better spent on large well-run LI programs 33
64 Extensive information regarding the California Solar Initiative, and its low-income components, is available on the Commission’s website: <www.cpuc.ca.gov/PUC/energy/Solar/>.

36
that maximize benefits all around. Moreover, these new more broadly focused LIEE 1programs provide a natural bridge, so that the low-income workforce and contractors 2can also work in the bigger/broader non-low-income EE and solar initiatives.3
In the context, it is also a natural progression to enhance diversity/inclusion initiatives 4(such as supplier diversity) relating to utility capital expenditures. There is no reason 5that the distribution system on the utility side of the meter should be treated differently 6from EE and solar on the customer side.657
As such, over this GRC cycle (2011-2013), PG&E should determine how it can apply 8the lessons learned from LIEE and low-income solar initiatives. Specifically, PG&E 9should evaluate how to increase low-income customer and community benefits from 10other utility capital expenditures, and particularly those related to the distribution system 11(which is highly dispersed throughout the communities of the service area). 12
13
3.6 Specific Supplier Diversity Issues in California14An important reason why active steps must be taken to ensure the implementation of 15utility supplier diversity initiatives is the tendency towards a high degree of 16continuity/inertia in supplier choice, perhaps especially in entities like utilities and 17government.66 Absent strong opposing forces, there is a major tendency to keep doing 18whatever has been done in the past. 19
In a highly diverse and rapidly changing place like California, maintaining the status quo 20can have the effect (whether intentional or not) of restricting participation by newcomers 21and those not previously involved. And especially in a place like California, the 22
65 To the extent that a compelling rationale exists for differentiation based on type of utility activity, there should be some flexibility to tailor initiatives so they are effective given the attributes of each type of utility activity.66 Utilities and government share many attributes in terms of being typically large, complex, bureaucratic,risk-adverse, legacy entities with a very strong orientation towards continuity, reliability, security, and stability. Their processes and procedures tend to be highly formalized and rule/law-based, Moreover, long-term employment and other on-going professional relationships are common and highly valued, as are ownership/control/reliance upon major long-lived physical assets.
The preceding characterizations are in no way intended to be critical. Rather, these attributes have been identified as seeming commonalities for entities (such as utilities and government), which (a) provide essential services on a continuous basis; (b) have major responsibilities for emergency response; and (c) have (at least to some extent) an obligation-to-serve, as well franchises/service areas/monopolies/restrictions upon alternative suppliers.
Another indication of the commonalities between utilities and government is that many utilities are in fact governmental entities. While investor-ownership is the norm for US gas utilities, and predominant for US electric utilities, many US electric utilities are governmental (especially in areas such as the Pacific Northwest where there has been extensive hydroelectric development). And in Canada, and many other countries, governmental provision of electric services is predominant or the norm. Moreover, governmental provision of water utility services is predominant in the US.

37
newcomers and those not previously involved tend to vary (in a number of regards) in 1comparison to the traditional insiders. 2
California has a large older, mainly white population, as well as a large (and growing) 3younger, mainly non-white population. The older more white population tends to be 4middle class or wealthier.5
By contrast, the younger and more ethnically diverse population includes a large 6number of people with lower incomes, as well as some which are quite affluent (notably 7those with high levels of formal education employed in high paying sectors like high-8tech).9
So given these demographics, and the bureaucratic tendency towards the status quo, 10there is a strong case for supplier diversity initiatives in California. And given the 11specifics of PG&E’s current GRC with its high level of capital spending, this case is 12particularly strong. 13
Based on the Company’s filing, PG&E is claiming that it is doing a good job in 14regard to diversity (both in terms of suppliers and employees). However, 15according to The Greenlining Institute 2009 Supplier Diversity Report Card, 16PG&E has lagged behind other utilities in terms of supplier diversity.67 In fact, 17Greenlining assigned PG&E a grade of C- for Total Minority-Owned Business 18Enterprise Spending, putting the utility well behind Verizon, San Diego Gas & 19Electric, Southern California Gas and AT&T and only slightly ahead of Southern 20California Edison (which did not even meet the CPUC’s 15% procurement goals 21for minority-owned businesses). 22
With just 15.71% as a percentage of contractor dollars going to Minority-Owned 23Businesses, PG&E barely met the CPUC’s 15% procurement goal. While 24PG&E’s Total Minority Spending has increased considerably since 2004 when it 25was just over 10%, it is by no means an industry leader in supplier diversity and 26there is significant room for improvement. Given the particular importance of 27supplier diversity initiatives at this time, the Commission should direct PG&E to 28improve its current performance and should ensure that all possible efficient 29supplier diversity is being carried out in this GRC.30
3.7 Specific Equity Issues Surrounding Upgrading of Distribution Infrastructure 31in the Current GRC32
As discussed in Section 3.4, supplier diversity is an effective mechanism to mitigate 33equity problems related to geographic and demographic concentration. This is 34 67 2009 Supplier Diversity Report Card, The Greenlining Institue, June 2009, p 5. <www.greenlining.org/resources/pdfs/2009GreenliningSupplierDiversityReportCard.pdf>.

38
particularly true in PG&E’s service territory in the context of the proposed upgrades of 1the distribution infrastructure in the current GRC.2
As outlined above, utility capital investments, especially for distribution system 3activities, may go disproportionately to more newly developed and more rapidly 4growing portions of the service area. Spending for new connections and major 5capacity additions will be concentrated where usage is growing fastest. So at 6least during recent years (notably the housing boom/bubble), if not currently, 7PG&E likely invested considerably in the expansion of the distribution system in 8outer suburbs where there was a boom of new construction. Such areas vary in 9terms of income and demographics, but they are not typically low income.68 10
On the other hand, PG&E claims it will now be investing heavily to replace and 11upgrade existing distribution equipment that is old and wearing out. So this type 12of investment may subsequently be somewhat more oriented towards areas that 13are older, perhaps in some cases lower income, and possibly more ethnically 14diverse.15
Of course, even if the utility capital investment is being done in an area like East 16Oakland, this does not imply that the work will be done by people living in East 17Oakland and firms located there. It does imply that people and businesses in 18East Oakland will at least probably be getting some benefit in terms of improved 19facilities and service, at least once the work is done and if it is done well. And it 20could imply that people and firms in East Oakland could get hired if there are 21mechanisms to encourage supplier diversity. 22
Moreover, replacing these older facilities will entail substantial growth in rate 23base, since new equipment/installations costs much more than did the old. So 24as a result of all this new investment, PG&E’s customers will be paying high 25levels of cost recovery through their rates over many years. 26
And a substantial portion of these costs will be borne by residential and small 27commercial customers. Such customers are small and highly dispersed 28geographically, so require relatively higher levels of distribution infrastructure and 29hence will be allocated more of the distribution costs. 30
68 This statement is a generalization. Indeed, some newer and fast growing areas in California are fairly diverse in terms of incomes and demographics. Such areas have often been perceived to provide housing that is more affordable (and in some cases more desirable) compared with locations that are closer to the coast and jobs centers. Thus, some outer suburbs attracted people of color and lower-income consumers, who found that closer in locations were less desirable in terms of costs and quality of life (e.g., schools, crime, and social problems).

39
So in that sense, while all PG&E customers will be losers in terms of having to 1pay for all this, residential and small commercial will likely bear more of the costs. 2Moreover, the winners will be those directly involved in supplying labor and 3materials for all of this work. Customers who will be getting improved and more 4reliable service will also be winners, although costs will probably be spread more 5widely than any such benefits.6
As such supplier diversity can help to spread the out the winnings throughout the 7geography and different demographics of the service area, and create some 8greater overlap/offset between winners and losers. Strong supplier diversity 9initiatives will ensure that at least some of the economic burden of the capital 10expenditure can be offset, and economic opportunity will be created and broadly 11distributed.12
13
3.8 Conclusion and Recommendations: Supplier Diversity as a Mechanism to 14Address Equity Considerations and Mitigate Adverse Impacts on Ratepayers 15of Large Capital Expenditures16
Section 3 builds on the conclusion of Section 2.1 in terms of broader factors for the 17evaluation of the rate application. Section 2.1 concludes that impacts on customers and 18communities are primary factors to be considered. Section 3 then examines equity 19considerations in utility initiatives. In this examination, the section reviews activities that 20are encouraged by a focus on customer and community impacts, including LIEE, low-21income solar initiatives, low-income training and workforce inclusion, and supplier 22diversity. 23
As demonstrated in Section 3, there is a strong economic rationale for supplier diversity 24initiatives. Such initiatives provide a mechanism to both address equity considerations 25and to mitigate adverse impacts of large capital expenditures on ratepayers (i.e. 26mitigating both customer and community impacts). While there is a strong case in 27general for supplier diversity, the current GRC is particularly appropriate for 28consideration of such initiatives. The review of LIEE and low-income solar initiatives has 29provided a number of lessons as to how PG&E should increase low-income customer 30and community benefits from other capital expenditures. One of the key means by 31which customer and community benefits could be increased to enhance32diversity/inclusion initiatives (such as supplier diversity) relating to utility capital 33expenditures. 34
Given the lessons learned from the review of LIEE and low-income solar, as well as the 35strong economic case developed for supplier diversity, I support the PG&E proposal to 36increase and improve diversity and inclusion. The approximately $3 million proposal is a 37

40
modest sum, considering the potential for supplier diversity to mitigate adverse impacts 1to customers and communities and address equity considerations arising from the 2utility’s proposed capital expenditures. If anything, PG&E needs to do and spend more 3on supplier diversity.694
5
4. Customer Retention and Economic Development6This section analyzes PG&E’s Customer Retention and Economic Development (Load 7Attraction and Retention) activities, as described in Ex. PG&E-4, Chapter 9. This 8section refers to some of the concepts that have been developed in Section 2. Section 92.1. Notably, this section examines the relevance of using factors broader than the 10traditional economic impacts as a basis for ratemaking. PG&E has justified its proposal 11for Customer Retention and Economic Development in terms of such broader 12measures. 13
Section 2.4 discusses the broad adverse implications of setting the revenue 14requirement too high. As will be examined in this section, PG&E’s proposal for 15Customer Retention and Economic Development may result in setting the revenue 16requirement too high. 17
4.1 Customer Retention18PG&E’s Customer Retention activities involve efforts to retain customers, assets and/or 19service areas that would otherwise be taken over by publicly owned utilities (POU). For 20a variety of reasons discussed below, ratepayers should not provide funding in support 21of Customer Retention.22
First, Customer Retention relates to choice of suppliers for provision of utility services to 23California customers, but it has little (if any) effect on the overall California economy. 24Put more simply, the customer retention issue relates to whether PG&E’s customers will 25move to other suppliers, not whether they will move from California to other locations. 26So regardless of how these California customers receive utility service, they will still be 27at the same physical locations and remain part of the California economy.28
29Second, the supplier choice/customer retention issue is clearly of great concern to 30PG&E. The shareholders of this utility have demonstrated that they are willing to 31expend substantial resources in an effort to influence supplier choice/customer 32retention. Ratepayer funding of Customer Retention activities has been disallowed in 33
69 PG&E is requesting costs of $2,904,927 related to its Diversity and Inclusion Department (Ex. PG&E-6, p. 15-25). DRA has recommended downward adjustment of $97,896 in the revenue requirement for the Diversity and Inclusion Department (Ex. DRA-13, pp. 9-10). Given the small amount of this suggested adjustment, I have not investigated this issue and take no position on it.

41
previous GRCs, but PG&E has continued to request ratepayer funding for expenditures 1on these activities. So it is unclear what impact (if any) would result from ratepayer 2funding, other than to increase costs to ratepayers, and decrease costs to shareholders. 3
4Third, PG&E claims that its customers will benefit somewhat from Customer Retention. 5However, these benefits are highly uncertain and sensitive to a variety of assumptions 6(notably regarding free-ridership).707
8Fourth, absent some compelling rationale to the contrary, it is typically preferable for 9regulatory bodies to maintain a high level of impartiality and avoid unnecessary 10involvement in regards to commercial disputes between alternative suppliers within the 11same jurisdiction. There is no compelling rationale in this case such that the 12Commission should authorize ratepayer funding in support of customer retention 13activities.14
15Fifth, especially in the midst of an ongoing economic crisis and the associated 16difficulties being experienced by many ratepayers , there is no reason why PG&E 17customers should pay higher rates to fund activities whose cost is more appropriately 18borne by PG&E shareholders. 19
20
4.2 Economic Development (Load Attraction and Retention)21Together with Customer Retention, Major Work Category (MWC) FK includes the 22Economic Development Program, associated with load attraction and retention. This 23program involves efforts in conjunction with economic development organizations to 24attract, retain or facilitate business customer expansions where those customers have 25location options outside PG&E’s electric service territory.7126
PG&E is requesting $3.0 million for the Economic Development Program, which is an 27increase of $2.3 million or 328% above 2008 recorded expenses.72 The amount 28requested is a very large increase relative to any recent year. From 2004 to 2010, 29annual expenses ranged from $0.6 million to $1.1 million, averaging $0.9 million 30
70 It is difficult to briefly characterize the complex context associated with Customer Retention. But it is unambiguous that Customer Retention has been a source of substantial ongoing controversy. Especially in this context, a very sizable effort would be required to fully and meaningfully evaluate the benefits and costs associated with Customer Retention activities. Within the context of the current proceeding, I have not attempted this type of large-scale analysis.71 Ex. PG&E-4, p. 9-1.72 Ex. PG&E-4, p. WP 9-4.

42
(nominal dollars).73 Thus, a forecast of $1.0 million in 2011 expenses would be 1consistent with historical spending for the Economic Development Program.742
Given that PG&E is now forecasting such dramatic growth in Economic Development 3expenses, I reviewed the level of Economic Development expenses in PG&E’s prior 4rate cases. In GRC 2007, $1.65 million was allowed by the Commission, the full 5amount requested by PG&E.75 In GRC 2003, none of the Economic Development 6expenses requested by the PG&E were allowed.767
So in recent years, there seems to have been little (if any) relationship between the 8amount of Economic Development expenses allowed and the amount actually spent by 9PG&E. $1.65 million was allowed in GRC 2007, but actual spending has been 10substantially less ($1.1 million in 2007, and even lower subsequently).11
Given just the analysis above, forecasts in the range of $0 to $1.0 million in 2011 12expenses could be justified for the Economic Development Program. The higher end of 13this range is consistent with actual spending in recent years. But there seems to be no 14clear relationship between expenses allowed and actually expended, so a lower 15forecast could be warranted. And a zero allowance for these expenses would be 16consistent with the results in GRC 1999 and GRC 2003.17
73 Ex. PG&E-4, WP 9-4, nominal dollars.74 From 2004 to 2010, annual expenses averaged $1.0 million (Ex. PG&E-4, WP 9-4, Base Year (2008) dollars, converted to 2011 forecast dollars).75 D.07-03-044, pp. 38-46.76 D.04-05-055, pp. 17, 46-47, Attachment 1, pp. 8 & 14. Likewise, in GRC 1999, none of the Economic Development expenses requested by the PG&E were allowed (D.00-02.046, pp. 335, 342-346).
BEFORE THE PUBLIC UTILITIES COMMISSION OF THE STATE OF CALIFORNIA
Application of Pacific Gas and Electric Company for Authority, Among Other Things, to Increase Rates and Charges for Electric and Gas Service Effective on January 1, 2011.
(U 39 M)
Application 09-12-020
(Filed December 21, 2009)
CERTIFICATE OF SERVICE
I, Stephanie Chen, am 18 years of age or older and a non-party to the within proceeding.
I hereby certify that I have this day served a copy of
TESTIMONY OF IAN GOODMAN ON BEHALF OF THE GREENLINING INSTITUTE IN A.09-12-020
on all known parties to A.09-12-020 by transmitting an e-mail message with the document
attached to each party named in the official service list and by faxing or mailing a properly
addressed copy by first-class mail with postage prepaid to those whose e-mail address is not
available.
I certify that the foregoing is true and correct.
Executed in Berkeley, California on May 19, 2010.
/s/ Stephanie Chen
Stephanie Chen

SERVICE LIST FOR A.09-12-020
[email protected]@[email protected]@[email protected]@[email protected]@[email protected]@[email protected]@[email protected]@[email protected]@[email protected]@[email protected]@[email protected]@[email protected]@[email protected]@[email protected]@[email protected]@[email protected]@[email protected]@[email protected]@[email protected]@[email protected]
[email protected]@[email protected]@[email protected]@[email protected]@[email protected]@[email protected]@[email protected]@[email protected]@[email protected]@[email protected]@[email protected]@[email protected]@[email protected]@[email protected]@[email protected]@[email protected]@[email protected]@[email protected]@[email protected]@[email protected]