Embed Size (px)
Citation preview

Prepared for:
APPENDICES
Prepared by:
Michael Baker Jr., Inc.October 22, 2010
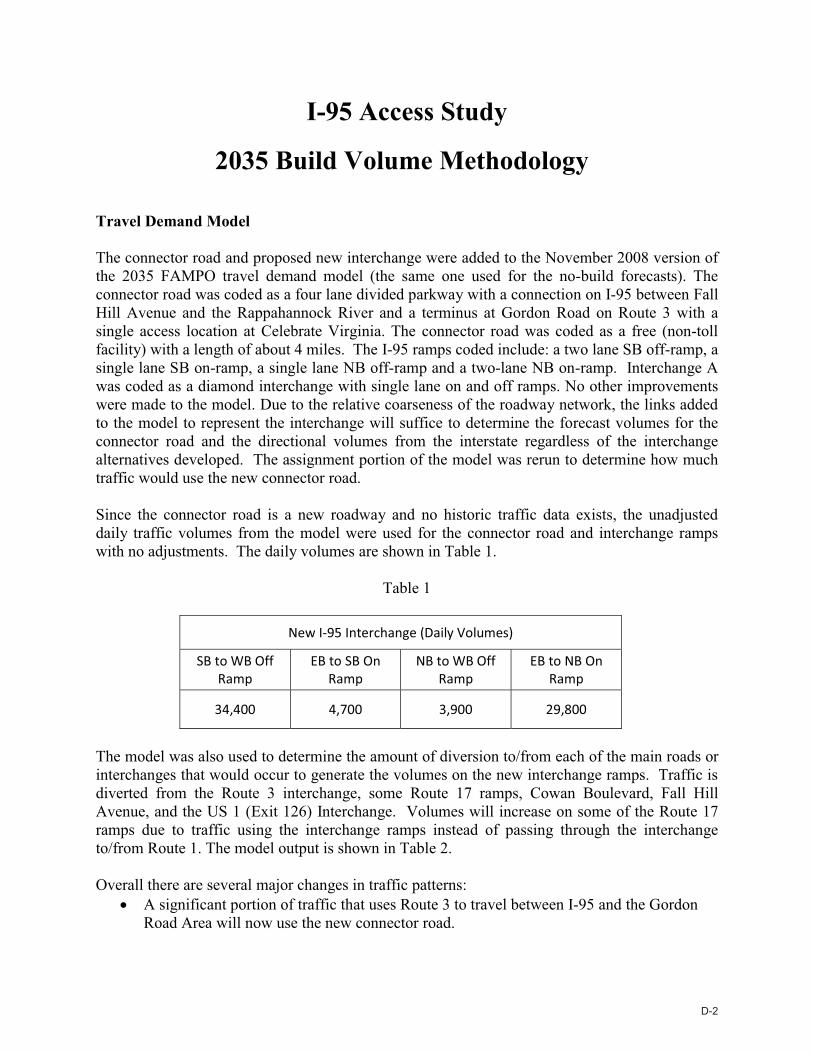
Appendices for the I-95 ACCESS STUDY bound under a separate cover.
New Access to I-95 between Route 3 and the Rappahannock River
Appendix A……………………..Existing Conditions Appendix B……………………..No-Build Conditions Appendix C……………………..Alternatives Analysis Appendix D……………………..Preferred Alternatives
Prepared for:
George Washington Regional Commission / Fredericksburg Area MPO Virginia Department of Transportation
Prepared by:
Michael Baker Jr., Inc.
In association with: Vanasse Hangen Brustlin, Inc
T3 Design, PC Peggy Malone & Associates
October 22, 2010

Appendix D – Preferred Alternative
2035 Build Volume Methodology D-1 Intersection Turn Movement Counts D-19 Capacity Analysis Output D-32 I-95 Mainline, C-D Road, and Ramp D-33 Route 3 and Route 17 Intersections D-99 Connector Road D-126 Route 3 / Connector Road Interchange Operations D-147


2035 Build Volume Methodology
D-1

I-95 Access Study
2035 Build Volume Methodology
Travel Demand Model
The connector road and proposed new interchange were added to the November 2008 version of the 2035 FAMPO travel demand model (the same one used for the no-build forecasts). The connector road was coded as a four lane divided parkway with a connection on I-95 between Fall Hill Avenue and the Rappahannock River and a terminus at Gordon Road on Route 3 with a single access location at Celebrate Virginia. The connector road was coded as a free (non-toll facility) with a length of about 4 miles. The I-95 ramps coded include: a two lane SB off-ramp, a single lane SB on-ramp, a single lane NB off-ramp and a two-lane NB on-ramp. Interchange Awas coded as a diamond interchange with single lane on and off ramps. No other improvements were made to the model. Due to the relative coarseness of the roadway network, the links added to the model to represent the interchange will suffice to determine the forecast volumes for the connector road and the directional volumes from the interstate regardless of the interchange alternatives developed. The assignment portion of the model was rerun to determine how much traffic would use the new connector road.
Since the connector road is a new roadway and no historic traffic data exists, the unadjusted daily traffic volumes from the model were used for the connector road and interchange ramps with no adjustments. The daily volumes are shown in Table 1.
Table 1
New I-95 Interchange (Daily Volumes)
SB to WB Off Ramp
EB to SB On Ramp
NB to WB Off Ramp
EB to NB On Ramp
34,400 4,700 3,900 29,800
The model was also used to determine the amount of diversion to/from each of the main roads or interchanges that would occur to generate the volumes on the new interchange ramps. Traffic is diverted from the Route 3 interchange, some Route 17 ramps, Cowan Boulevard, Fall Hill Avenue, and the US 1 (Exit 126) Interchange. Volumes will increase on some of the Route 17 ramps due to traffic using the interchange ramps instead of passing through the interchange to/from Route 1. The model output is shown in Table 2.
Overall there are several major changes in traffic patterns: � A significant portion of traffic that uses Route 3 to travel between I-95 and the Gordon
Road Area will now use the new connector road.
D-2

� A portion of Spotsylvania County traffic that uses Route 3 to travel between the retail areas near I-95 and the Gordon Road Area will now use the new connector road.
� A portion of the traffic that travels east to I-95 and uses the Route 1 interchange (Exit 126) and then north on I-95 will now travel north on Gordon Road, cross Route 3 and travel on the new connector road to I-95. This reduces traffic on I-95 between Route 1 and Route 3.
� A portion of traffic from north of the study area that previously utilized the Route 17/I-95 Interchange and travelled east to Route 1 and then used either Fall Hill Avenue or Cowan Boulevard to access the retail areas will now use I-95 and the new interchange.
� A portion of the traffic from west of the study area that previously travelled east on Route 17 to Route 1 and then used either Fall Hill Avenue or Cowan Boulevard to access the retail areas will now get on I-95 and use the new interchange.
Table 2
When looking at the diversion calculated in the model, there is a big difference between the SB to WB off-Ramp volume that is diverted from the Route 3 Interchange and the EB to NB on-Ramp volume that is diverted from the Route 3 Interchange. Since these are complementary movements, it would be expected that the diversion volume for one movement would be similar to the other for a daily volume (the notion of returning to where you came from). However, asshown in Table 3, existing volumes at the Route 3 Interchange show this same trend for the same SB to WB and EB to NB movements.
Diversion to/from (1) SB to WB Off Ramp
EB to SB On RampNB to WB Off
RampEB to NB On Ramp TOTAL
Route 17 Interchange 3100 0 0 4400 7500
Route 3 Interchange 17200 4700 3900 7600 33400
Cowan Boulevard 3100 0 0 4700 7800
Fall Hill Avenue 4100 0 0 3800 7900
US 1 Interchange 6900 0 0 9300 16200
TOTAL 34400 4700 3900 29800 72800
(1) Traffic is diverted from all roads and interchanges except for some Route 17 ramps which increase.
New Interchange (Daily Diversion Volumes)
D-3

Table 3
The ratio between the two Route 3 Interchange ramp volumes is similar to the ratio between the forecast volumes for the two new interchange ramps (shown in Table 3). It is expected that the diversion from the two Route 3 Interchange ramps would be similar to this ratio. Below the diversion volumes were adjusted to match this ratio. The same ratio was used for diversion from the other adjacent interchanges and directional movements on Cowan Boulevard and Fall Hill Avenue. The total diversion volume was not altered. Below in Table 4 are the adjusted diversion volumes.
Table 4
In Table 5, the diversion for each Route 3 interchange ramp is calculated by looking at one or more ramps that will lose volume to one of the new interchange ramps. The diversion split for each ramp is then determined based on a ratio of its existing volume as compared to the existing volume of the other ramp. The other column refers to ramps that do not have a same directionalmovement as one of the new interchange ramps. The two ramps facing south and providing
Existing Daily Volume
RatioForecast Daily
VolumeRatio
SB to WB Off Ramp 22,500 0.53 34,400 0.54
EB to NB On Ramp 20,200 0.47 29,800 0.46
TOTAL 42,700 1.00 64,200 1.00
Route 3 Interchange New Interchange
Diversion to/from (Adjusted) (1)
SB to WB Off Ramp
EB to SB On RampNB to WB Off
RampEB to NB On Ramp TOTAL
Route 17 Interchange 4000 0 0 3500 7500
Route 3 Interchange 13300 4700 3900 11500 33400
Cowan Boulevard 4200 0 0 3600 7800
Fall Hill Avenue 4200 0 0 3700 7900
US 1 Interchange 8700 0 0 7500 16200
TOTAL 34400 4700 3900 29800 72800
(1) Traffic is diverted from all roads and interchanges except for some Route 17 ramps which increase.
New Interchange (Adjusted Daily Diversion Volumes)
D-4

access to and from the east increase in volume under the Build condition due to traffic diverting from US 1 to I-95 as a result of the reduction in traffic on I-95.
Table 5. Daily Volume to divert from each Route 3 Ramp to the New Interchange
A similar calculation was done for the Route 17 Interchange Ramps facing to and from the north(see Table 6). The remaining volume was split evenly between the ramps facing to the south as it was predicted that diversion from Route 1 to I-95 would occur evenly between the ramps.
Table 6. Daily Volume to divert from each Route 17 Ramp to the New Interchange
Volumes will increase on some of the Route 17 on ramps due to traffic using the interchange ramps instead of passing through the interchange to/from Route 1.
Existing Volume
SB to WB Off Ramp
EB to SB On Ramp
NB to WB Off Ramp
EB to NB On Ramp
I) NB to EB Off Ramp 3920 3800
J) EB to NB On Loop Ramp 20160 -7900
K) NB to WB Off Loop Ramp 6520 -3900
L) WB to NB On Ramp 9090 -3600
M) SB to WB Off Ramp 22530 -9900
N) WB to SB On Loop Ramp 3260 3100
O) SB to EB Off Loop Ramp 7630 -3400
P) EB to SB On Ramp 8150 -4700
-13300 -4700 -3900 -11500 6900Total
Route 3 Interchange
New Interchange
Other
Existing Volume
SB to WB Off Ramp
EB to SB On Ramp
NB to WB Off Ramp
EB to NB On Ramp
A) NB to EB Off Ramp 2930 900
B) EB to NB On Loop Ramp 6620
C) NB to WB Off Loop Ramp 18250 900
D) WB to NB On Ramp 6050 -1600
E) SB to WB Off Ramp 7430
F) WB to SB On Loop Ramp 2070 1100
G) SB to EB Off Loop Ramp 6360 -1800
H) EB to SB On Ramp 21130 1100
4000 0 0 3500Total
Route 17 Interchange
New Interchange
D-5

HOT Lanes Traffic Volumes
HOT lane volumes were not changed from the No-Build forecasts. The HOT lane volumes shown are consistent through the study area between the Route 3 interchange and the Route 17 Interchange. The status of the HOT lanes project is not known at this time. The location of the entrance and exit lanes to the HOT lanes are also unknown but for this study it was assumedaccess to and from the HOT lanes would occur north of Route 17 or south of Route 3.
2035 Build I-95 Mainline Daily Volumes
Diversion for the I-95 mainline volume south of Route 3 was taken from the model and is equal to -5600 daily volume for southbound I-95 and -5900 daily volume for northbound I-95 for the build condition. The diversion rates developed above were applied to the 2035 No-Build traffic volumes for the mainline sections of I-95, south of Route 3 and also to the No-Build ramp volumes at Exit 130 and Exit 133. The resulting ramp traffic volumes were added to and subtracted from the mainline volume south of Route 3 to develop northbound and southbound mainline volumes at locations between the interchanges, and north of Exit 133. The process is outlined below for both northbound and southbound directions. Please see the attached spreadsheet for the northbound and southbound directions showing the addition and subtraction of ramp volumes.
Northbound:
NB Mainline Volume south of Route 3 Interchange (diversion applied) Subtract NB to EB Off-Ramp at Exit 130 (diversion applied) Add EB to NB On-Ramp at Exit 130 (diversion applied)
Subtract NB to WB Off-Ramp at Exit 130 (diversion applied) Add WB to NB On-Ramp at Exit 130 (diversion applied)
NB Mainline Volume between Route 3 & New Interchange (calculated)Subtract NB to WB Off-Ramp at New Interchange (from model)
Add EB to NB On-Ramp at New Interchange (from model)NB Mainline Volume between New Interchange & Route 17 Interchange (calculated)
Subtract NB to EB Off-Ramp at Exit 133 (diversion applied) Add EB to NB On-Ramp at Exit 133 (diversion applied)
Subtract NB to WB Off-Ramp at Exit 133 (diversion applied) Add WB to NB On-Ramp at Exit 133 (diversion applied)
NB Mainline Volume north of Route 17 Interchange (calculated)
D-6

Southbound:
SB Mainline Volume south of Route 3 Interchange (diversion applied) Subtract EB to SB On-Ramp at Exit 130 (diversion applied) Add SB to EB Off-Ramp at Exit 130 (diversion applied)
Subtract WB to SB On-Ramp at Exit 130 (diversion applied) Add SB to WB Off-Ramp at Exit 130 (diversion applied) SB Mainline Volume between Route 3 & New Interchange (calculated)
Subtract EB to SB On-Ramp at New Interchange (from model) Add SB to WB Off-Ramp at New Interchange (from model) SB Mainline Volume between New Interchange & Route 17 Interchange (calculated)
Subtract EB to SB On-Ramp at Exit 133 (diversion applied) Add SB to EB Off-Ramp at Exit 133 (diversion applied)
Subtract WB to SB On-Ramp at Exit 133 (diversion applied) Add SB to WB Off-Ramp at Exit 133 (diversion applied) SB Mainline Volume north of Route 17 Interchange (calculated)
Below are the 2035 No-Build volumes and Build volumes (totals for both directions) for I-95.
Table 7
Peak Hour I-95 Mainline and Ramp Volumes
The build ramp volumes for the AM and PM peak hours were calculated by taking the ratio of the peak hour no-build ramp volume versus the daily ramp volume for each ramp and applying the ratio to the build ramp daily volumes. The same calculation was done for the mainline volume south of Route 3. The peak hour HOT lane volumes were not changed from the No-Build forecasts. The resulting ramp traffic volumes were added to and subtracted from the mainline volume south of Route 3 to develop northbound and southbound mainline volumes at locations between the interchanges, and north of Exit 133. The process is outlined above under the section 2035 Build I-95 Mainline Daily Volumes for both northbound and southbounddirections. For the new interchange ramps, the ratio of the peak hour no-build ramp volume versus the daily ramp volume for the same directional movement at the Route 3 Interchange was used to calculated peak hour volumes. Please see Table 8 for the northbound and southbound directions showing the addition and subtraction of ramp volumes. Table 9 shows the peak hours volumes for the new I-95 Interchange.
Difference
GP Lanes HOT Lanes Total GP Lanes HOT Lanes Total Total
South of Route 3 174,600 18,300 192,900 163,100 18,300 181,400 -11,500
At River Crossing 226,000 18,300 244,300 247,000 18,300 265,300 21,000
North of US 17 194,000 18,300 212,300 207,600 18,300 225,900 13,600
Daily Volumes
I-952035 No-Build 2035 Build
D-7

GeneralPurposeMainline
Vol
HOT Lane Daily VolGen.
Purpose & HOT
Ramp Vol CD Road Vol
GeneralPurposeMainline
Vol
HOT Lane Peak Hour Vol
Gen.Purpose &
HOTRamp Vol CD Road
Vol
GeneralPurposeMainline
Vol
HOT Lane Peak Hour Vol
Gen.Purpose &
HOTRamp Vol CD Road
Vol Mainline Ramp CD Road
GeneralPurposeMainline
Vol
HOT Lane Daily VolGen.
Purpose & HOT & CD
Ramp Vol CD Road Vol
GeneralPurposeMainline
Vol
HOT Lane Peak Hour Vol
Gen.Purpose & HOT & CD
Ramp Vol CD Road Vol
GeneralPurposeMainline
Vol
HOT Lane Peak Hour Vol
Gen.Purpose & HOT & CD
Ramp Vol CD Road Vol
SOUTHBOUND I-95Entering Volume (N of US 17) 92,920 104,470 4,130 4,130 5,850 8,330 101,320 112,870 4,160 4,160 7,000 9,480
US 17 CD Road Off-Ramp 19,590 1,080 1,32081,730 112,870 19,590 3,080 4,160 1,080 5,680 9,480 1,320
E) SB to WB Off Ramp 12,450 700 790 0 12,450 700 79080,470 92,020 3,430 3,430 5,060 7,540 81,730 100,420 7,140 3,080 3,460 380 5,680 8,690 530
F) WB to SB On Loop Ramp 2,910 150 200 1100 4,010 210 280(Now left turn onto EB/SB ramp 83,380 94,930 3,580 3,580 5,260 7,740G) SB to EB Off Loop Ramp 8,940 480 660 -1800 7,140 380 530
74,440 85,990 3,100 3,100 4,600 7,080 0 0 0
CD Road Off-Ramp for New TI 28,370 810 2,87053,360 93,280 28,370 2,270 3,080 810 2,810 8,160 2,870
Braided Ramp Volume 53,360 9,380 2,270 280 2,810 840H) EB to SB On Ramp 35,390 1,390 2,660 1100 36,490 1,430 2,740
53,360 102,660 37,750 2,270 3,360 1,090 2,810 9,000 3,710Combined B&H Ramp onto I-95 31,120 1,360 2,180(minus braided volume)River Crossing 109,830 121,380 4,490 4,490 7,260 9,740 84,480 133,780 37,750 3,630 4,720 1,090 4,990 11,180 3,710
SB to WB Off Ramp 34400 34,400 940 3,44084,480 96,030 3,630 3,630 4,990 7,470
EB to SB On Ramp 4700 4,700 180 37089,180 104,080 3,350 3,810 3,960 150 5,360 8,110 270
SB to WB Off Ramp 3,350 150 270 0 3,350 150 270106,480 118,030 4,340 4,340 6,990 9,470 89,180 100,730 3,810 3,810 5,360 7,840
WB to SB On Ramp 3,350 150 270 0 3,350 150 270
Cowan Boulevard Underpass 109,830 121,380 4,490 4,490 7,260 9,740 92,530 104,080 3,960 3,960 5,630 8,110
M) SB to WB Off Ramp 31,650 860 3,160 -13300 18,350 500 1,83078,180 89,730 3,630 3,630 4,100 6,580 74,180 85,730 3,460 3,460 3,800 6,280
N) WB to SB On Loop Ramp 4,140 180 340 3100 7,240 310 59082,320 93,870 3,810 3,810 4,440 6,920 81,420 92,970 3,770 3,770 4,390 6,870
O) SB to EB Off Loop Ramp 9,690 510 720 0 9,690 510 72072,630 84,180 3,300 3,300 3,720 6,200 71,730 83,280 3,260 3,260 3,670 6,150
P) EB to SB On Ramp 11,450 450 890 -4700 6,750 270 520
South of Route 3 84,080 95,630 3,750 3,750 4,610 7,090 -5600 78,480 90,030 3,530 3,530 4,190 6,670
SB Off Ramp
SB On Ramp
South of US 1
NORTHBOUND I-95
Entering Volume (S of Route1)
NB to EB Off Ramp
NB to WB Off Loop Ramp
EB/WB to NB On Ramp
Entering Volume (S of Route3) 90,480 97,180 3,390 5,850 5,540 5,540 -5900 84,580 91,280 3,040 5,500 5,200 5,200
I) NB to EB Off Ramp 4,980 340 300 3800 8,780 600 53085,500 92,200 3,050 5,510 5,240 5,240 75,800 82,500 2,440 4,900 4,670 4,670
J) EB to NB On Loop Ramp 28,320 2,700 1,260 -11500 16,820 1,600 750113,820 120,520 5,750 8,210 6,500 6,500 92,620 99,320 4,040 6,500 5,420 5,420
K) NB to WB Off Loop Ramp 9,160 390 690 -3900 5,260 220 400104,660 111,360 5,360 7,820 5,810 5,810 87,360 94,060 3,820 6,280 5,020 5,020
L) WB to NB On Ramp 11,540 1,050 620 0 11,540 1,050 620
Cowan Boulevard Underpass 116,200 122,900 6,410 8,870 6,430 6,430 98,900 105,600 4,870 7,330 5,640 5,640
NB to WB Off Ramp 0 3,900 170 29095,000 101,700 4,700 7,160 5,350 5,350
EB to NB On Ramp 29800 29,800 2,840 1,330
River Crossing 95,000 131,500 29,800 4,700 10,000 2,840 5,350 6,680 1,330
US 17 CD Road Off Ramp 34,690 2,680 2,180 28,220 2,000 1,830Braided Ramp Volume 66,780 8,270 2,700 790 3,520 460New TI CD On-Ramp 21,530 2,050 870
88,310 131,500 36,490 4,750 10,000 2,790 4,390 6,680 2,290A) NB to EB Off Ramp 4,120 170 250 900 5,020 210 300
81,510 88,210 30,570 3,730 6,190 2,510 4,250 4,250 1,930 88,310 126,480 31,470 4,750 9,790 2,580 4,390 6,380 1,990C) NB to WB Off Loop Ramp 30,570 2,510 1,930 900 31,470 2,580 1,990
81,510 88,210 0 3,730 6,190 0 4,250 4,250 0 88,310 95,010 4,750 7,210 4,390 4,390B) EB to NB On Loop Ramp 11,090 1,020 570 0 11,090 1,020 570
81,510 88,210 11,090 3,730 6,190 1,020 4,250 4,250 570 88,310 106,100 11,090 4,750 8,230 1,020 4,390 4,960 570D) WB to NB On Ramp 8,500 580 460 -1600 6,900 470 370
19,590 1,600 1,030 17,990 1,490 940North of Route 17 101,100 107,800 5,330 7,790 5,280 5,280 106,300 113,000 6,240 8,700 5,330 5,330
BAKER
DailyFuture 2035 NB Volume
BAKER
AM Peak HourFuture 2035 Build Volume
BAKER
PM Peak HourFuture 2035 Build Volume
BAKER
AM Peak HourFuture 2035 NB Volume
BAKER
PM Peak HourFuture 2035 NB Volume
BAKER
Route 3 Interchange
New TI
US 17 Interchange
6,700 2,460 0 6,700 2,460 0
US 17 Interchange
New TI
Rest Area
Route 3 Interchange
US 1 Interchange
US 1 Interchange
11,550 0 2,480 11,550 0 2,480
DailyFuture 2035 Build VolumeDiversion
BAKER
TABLE 8: 2035 Build Traffic Volumes for Alternative N5 Full Interchange
D-8


Table 9. New I-95 Interchange Volumes
Connector Road Volumes
The connector road will have one access point between its I-95 and Route 3 termini providing access to the retail areas adjacent to I-95. The interchange is labeled as Interchange A for this study. Since the connector road is a new roadway and no historic traffic data exists, the unadjusted daily traffic volumes from the model were used for the new ramps of Interchange Awith no adjustments. The daily volumes are shown in Table 10. For the Interchange A ramps, the ratio of the peak hour new I-95 ramp volumes (for the respective direction of travel) versus the new I-95 daily ramp volume for the same directional movement at was used to calculated peak hour volumes.
Table 10. Interchange A Volumes
The new I-95 ramp traffic volumes (Table 9) were added together by direction to get the connector road mainline volume between I-95 and Interchange A. Interchange A ramp volumes were added and subtracted from the connector road mainline volumes (between I-95 and Interchange A) to get connector road mainline volumes between Route 3 and Interchange A. The same process was completed for both the daily and peak hour volumes (see Table 11).
SB to WB Off Ramp EB to SB On Ramp NB to WB Off Ramp EB to NB On Ramp Total
Daily Volume 34400 4700 3900 29800 72800
AM Peak Hour Volume 940 190 170 2850 4150
PM Peak Hour Volume 3440 370 290 1330 5430
New Interchange @ I-95
WB Off Ramp WB On Ramp EB Off Ramp EB On Ramp Total
Daily Volume 13600 9000 9800 13500 45900
AM Peak Hour Volume 390 260 290 1290 2230
PM Peak Hour Volume 1320 880 480 670 3350
New Interchange with Connector Road (Interchange A)
D-9

Table 11. New Connector Road Volumes
Intersection Turn Movement Volumes
Build turn movement volumes for the intersections along Route 3 were calculated by determining how much of the Interchange A volumes (Table 10) would divert from the Route 3 intersections. Through movements at the three intersections were also adjusted by volume diverted from the I-95/ Route 3 Interchange ramps to the new Connector Road. Daily diversion was calculated by taking the volumes shown in Table 4 and subtracting them from Table 10. (45900-10800-12400=22700). Peak hour diversion was calculated the same way using the same peak hour ratios calculated previously for the Connector Road. Diversion volumes are shown in Table 12.
Table 12. Diversion Volumes to Connector Road
Traffic diverted to Interchange A would come from the three intersections on Route 3 nearest I-95 including Bragg Road, Central Park Boulevard, and Carl D. Silver Parkway. The turn movements at the three intersections that would be affected by Interchange A include the eastbound left turns into Central Park, the westbound right turns into Central Park, and the southbound left and right turns out of Central Park. Table 13 shows the existing 2008 turn movements at these intersections. Table 14 shows the ratio of turns at each intersection compared to the total volume making that movement from or to Route 3.
Table 15 shows the change in each turn movement by applying the Interchange A ramp volumes from Table 10 to the ratio in Table 14. For example the eastbound off-ramp has an AM peak hour volume of 290. Travelers using this ramp are diverted from the eastbound left turn off of Route 3 from the three intersections. Since the eastbound left turn at the Bragg Road intersection handles 42% of the total eastbound left turns from the three intersection then it is expected that 42% (of 290) or ~120 vehicles will divert from the eastbound left turn at Bragg Road to the new
Westbound Eastbound Total Westbound Eastbound Total
Daily Volume 38300 34500 72800 33700 30800 64500
AM Peak Hour Volume 1110 3040 4150 980 2020 3000
PM Peak Hour Volume 3730 1700 5430 3290 1510 4800
Connector Road
Between I-95 and Interchange A Between Interchange A and Route 3
Remaining to Route 3 Intersections
Eastbound Westbound Eastbound Westbound Eatbound Westbound Eastbound Westbound Total
Daily Volume -3700 -4200 -3600 -4200 -3500 -4000 -10800 -12400 -22700
AM Peak Hour Volume -330 -120 -320 -120 -200 -120 -850 -360 -860
PM Peak Hour Volume -180 -410 -180 -410 -170 -390 -530 -1210 -1610
TotalCowan BoulevardFall Hill US 17 Interchange
D-10

Interchange A eastbound off-ramp. The change in intersection volumes between the Build and No-Build Conditions is shown in Figure 1.
Table 13. 2008 Peak Hour Turn Movements
Table 14. Ratio of Turns between Intersections
Table 15. Diversion Volumes to New Connector Road
Bragg Road Central Park Blvd Carl D. Silver Total Bragg Road Central Park Blvd Carl D. Silver Total
Eastbound Lefts In 295 256 144 695 217 313 273 803
Westbound Rights In 69 29 455 553 249 66 935 1250
Soutbound to WB Rights Out 209 77 55 341 483 362 303 1148
Southbound to EB Lefts Out 118 7 351 476 117 97 848 1062
AM Peak HourExisting Counts PM Peak Hour
Route 3 Intersections
Bragg Road Central Park Blvd Carl D. Silver Total Bragg Road Central Park Blvd Carl D. Silver Total
Eastbound Lefts In 0.42 0.37 0.21 1.00 0.27 0.39 0.34 1.00
Westbound Rights In 0.12 0.05 0.82 1.00 0.20 0.05 0.75 1.00
Soutbound to WB Rights Out 0.61 0.23 0.16 1.00 0.42 0.32 0.26 1.00
Southbound to EB Lefts Out 0.25 0.01 0.74 1.00 0.11 0.09 0.80 1.00
% of Total
Route 3 Intersections
AM Peak Hour PM Peak Hour
Bragg Road Central Park Blvd Carl D. Silver Total Bragg Road Central Park Blvd Carl D. Silver Total
Eastbound Lefts In -120 -110 -60 -290 -130 -190 -160 -480
Westbound Rights In 0 0 -20 -30 -20 -10 -80 -110
Soutbound to WB Rights Out -160 -60 -40 -260 -370 -280 -230 -880
Southbound to EB Lefts Out -70 -10 -210 -280 -20 -10 -110 -140
TOTAL -860 -1610
Diversion
Route 3 Intersections
AM Peak Hour PM Peak Hour
D-11

Figure 1. Change in Turn Movement Volumes between Build and No-Build Conditions (Eastern Route 3 Intersections)
Bragg Road Central Park Blvd Carl D Silver Parkway
AM PEAK HOUR
-160 -70 0 -60 -10 -10 -40 -210 -20-760 -600 -540 -510 -530
Route 3
-1280 -120 -110 -60 -1280-1160 -1120 -1070
Through movements are sum of diversion from Route 3 ramps
Bragg Road Central Park Blvd Carl D Silver Parkway
PM PEAK HOUR
-370 -20 -20 -280 -10 -10 -230 -110 -80-2390 -2020 -1760 -1540 -1620
Route 3
-1220 -130 -190 -160 -880-1090 -920 -770
Left and Right Turn Movements at intersections are from Table 15.
D-12

The same process was used to determine the Build turn movements at the western intersectionson Route 3, Harrison Road, Gordon Road, and Five Mile Extension. Table 16 shows the diversion for eastbound Route 3 on and off movements at the three intersections. Table 17 shows the diversion for westbound Route 3 on and off movements at the three intersections. The total diversion for each direction matches the diversion shown in Figure 1 for eastbound and westbound Route 3 traffic. The change in intersection volumes between the Build and No-Build Conditions for the three western intersections is shown in Figure 2.
Table 16. 2008 Peak Hour Turn Movement Diversion (Eastbound Route 3)
Table 17. 2008 Peak Hour Turn Movement Diversion (Westbound Route 3)
Intersection Movement Existing Count Ratio Diversion Existing Count Ratio Diversion
SB Left 57 0.02 -30 123 0.08 -100
EB Thru 1614 0.64 -820 903 0.58 -700
NB Right 14 0.01 -10 27 0.02 -20
Gordon Road NB Right 447 0.18 -230 248 0.16 -190
SB Left 50 0.02 -30 30 0.02 -20
NB Right 332 0.13 -170 238 0.15 -190
Total 2514 -1280 1569 -1220
PM Peak HourAM Peak HourEastbound Route 3
Harrison Rd
Five Mile Extension
Intersection Movement Existing Count Ratio Diversion Existing Count Ratio Diversion
WB Right 56 0.06 -50 265 0.09 -230
WB Thru 614 0.71 -540 1636 0.58 -1400
WB Left 23 0.03 -20 57 0.02 -50
Gordon Road WB Left 124 0.14 -110 601 0.21 -510
WB Right 10 0.01 -10 54 0.02 -50
WB Left 38 0.04 -30 184 0.07 -160
Total 865 -760 2797 -2390
Harrison Rd
Five Mile Extension
Westbound Route 3 AM Peak Hour PM Peak Hour
D-13

Figure 2. Change in Turn Movement Volumes between Build and No-Build Conditions (Western Route 3 Interse
Harrison Road Gordon Road/Connector Road Five Mile Road
AM PEAK HOUR 9802020
0 190 -100 0 0 20 630 310 40 -610 30 0 -30 -730 -770
20 0 -110 -530 -30 -760Route 3
60 0 920 10 -1290 -128060 0 0 0 -860 0 910 -230 -1050 -1090 170 0 -1700 0 30
200
680
Harrison Road Gordon Road/Connector Road Five Mile Road
PM PEAK HOUR 32901510
0 210 -500 0 0 110 1790 1300 200 -1680 20 0 -20 -2190 -2400
110 0 -510 -1980 -160 -2390Route 3
20 0 840 50 -1230 -122020 0 0 0 -820 0 460 -190 -810 -1020 190 0 -1900 0 160
790
270
Left and Right Turn Movements at intersections are from Table 16 and Table 17.
D-14

As was done for the existing conditions and no-build conditions, the turn movement volumes at the intersections adjacent to the I-95 interchanges at Exit 130 (Route 3) and Exit 133 (Route 17), were adjusted to balance the intersection volumes with the ramp volumes through the interchange. The methodology of balancing volumes at the Route 3 and Route 17 interchanges is discussed below. Route 3 and Route 17 intersection balancing adjustment spreadsheets are included after the discussion for reference. Note that this was mainly a checking exercise since the No-build volumes were already balanced from which volumes were diverted to the new connector road.
Route 3 Intersection Balancing Adjustment:The intersections of Route 3/Carl D Silver Pkwy (west of the Exit 130 interchange) and Route 3/Gateway Blvd (east of the Exit 130 interchange) were adjusted to balance the volumes across the interchange. To balance the eastbound and westbound directions, the turn movements at the Carl D Silver Pkwy intersection were totaled to determine the eastbound and westbound volumes to the west of the intersection. The previously developed eastbound and westbound ramp peak hour volumes were then added or subtracted to the appropriate Route 3 directional volume to determine the peak hour volume of Route 3 to the west of the Gateway Blvd intersection. These eastbound and westbound volumes were compared to the volumes based on the Gateway Blvd intersection turn movement volumes. The Carl D Silver and the Gateway Blvd turn movement volumes were adjusted to balance the intersection turn movements. Half of the volume difference was applied to the intersection at Carl D Silver Pkwy and the other half applied to the Gateway Blvd intersection. The applied adjusted approach volumes were divided among the appropriate turn movements based on the actual turn movement percentages of each approach (i.e. 12% Left, 72% Thru, 16% Right, etc.).
Route 17 Intersection Balancing Adjustment: The intersections of Route 17/Sanford Dr (west of the Exit 133 interchange) and Route 17/Short St (east of the Exit 133 interchange) were adjusted to balance the volumes across the interchange. To balance the northbound and southbound directions, the turn movements at the Sanford Dr intersection were totaled to determine the northbound and southbound volumes to the west of the intersection. The developed northbound and southbound ramp peak hour volumes were then added or subtracted to the appropriate Route 17 directional volume to determine the peak hour volume of Route 17 to the west of the Short St intersection. These northbound and southbound volumes were compared to the volumes based on the Short St intersection turn movement volumes. The Sanford Dr and the Short St turn movement volumes were adjusted to balance the intersection turn movements. Half of the volume difference was applied to the intersection at Sanford Dr and the other half applied to the Short St intersection. The applied adjusted approach volumes were divided among the appropriate turn movements based on the actual turn movement percentages of each approach (i.e. 12% Left, 72% Thru, 16% Right, etc.).
D-15

Route 3 - Intersection Balancing 2035 Build
1830 600 400 620500 320 220 1050
3500 3500 1670 1670 2270 2270 1870 1870 2490 2490 5 5 2485 2485Route 3 1640 1640 1140 1140 1460 1460 1240 1240 2290 2290 10 10 2280 2280 Route 3
3210 3210 2940 2940 3450 3450 1850 1850 2450 2450 10 10 2440 24402860 2860 2330 2330 3050 3050 2300 2300 2830 2830 -10 -10 2840 2840
270 510 1600 600530 720 750 530
# AM Peak Hour Volume
# PM Peak Hour Volume
Route 3 / Carl D Silver Pkwy 2035 Build
AM PM AM PM AM PMLeft 20 30 20 30Thru 10 10 10 10Right 30 40 -0.05 0.07 30 40Left 270 1060 -0.42 1.85 270 1060Thru 10 20 10 20Right 40 200 40 200Left 140 220 140 220Thru 2910 1760 -4.53 3.08 2910 1760Right 20 20 20 20Left 30 50 -0.09 -0.04 30 50Thru 1000 2230 -3.05 -1.59 1000 2230Right 610 1220 -1.86 -0.87 610 1220
Route 3 / Gateway Blvd 2035 Build
AM PM AM PM AM PMLeft 310 400 0.68 0.40 310 400Thru 10 5 10 5Right 140 280 140 280Left 10 10 10 10Thru 5 5 5 5Right 30 5 0.07 0.01 30 5Left 40 40 0.08 -0.07 40 40Thru 1970 2200 4.04 -3.87 1970 2200Right 430 600 0.88 -1.06 430 600Left 140 290 140 290Thru 1940 2080 4.25 2.09 1940 2080Right 10 0 10 0
Eastbound
Westbound
Westbound
Original Peak Hour TM Balance Adjustment
Adjusted Peak Hour TM
Northbound
Southbound
Original Peak Hour TM Balance Adjustment
Adjusted Peak Hour TM
Northbound
Southbound
Eastbound
Carl
D S
ilver
Pkw
y
Gatew
ayBlvd
Route 3 Peak Hour volume based on Adjusted Carl D Silver Pkwy and Ramp Volumes
Route 3Original
Difference
Original Route 3
Peak Hour volume
based on Gateway
Blvd
Original Route 3 Volume from Carl D
Silver Pkwy TM
Adjusted Route 3 Volume from Carl D
Silver Pkwy TM
AdjustedRoute 3
Peak Hour volume
based on Gateway
Blvd
Route 3Adjusted
Difference
Route 3 Peak Hour volume
based on Original Carl D
Silver Pkwy and Ramp Volumes
D-16

Route 17 - Intersection Balancing 2035 Build
790 280 1990 370700 210 2580 470
3630 3630 2840 2840 3120 3120 1130 1130 1500 1500 0 0 1500 1500Route 17 4290 4290 3590 3590 3800 3800 1220 1220 1690 1690 10 10 1680 1680
3410 3410 1980 1980 2360 2360 1340 1340 1550 1550 0 0 1550 15505120 5120 2380 2380 2910 2910 2340 2340 2650 2650 0 0 2650 2650
1430 380 1020 2102740 530 570 310
# AM Peak Hour Volume
# PM Peak Hour Volume
Route 17 / Sanford Dr 2035 Build
AM PM AM PM AM PMLeft 480 530 -0.56 0.00 480 530Thru 3620 2960 -4.22 0.00 3620 2960Right 190 140 -0.22 0.00 190 140Left 20 10 20 10Thru 2950 3660 0.00 0.00 2950 3660Right 30 70 30 70Left 90 50 90 50Thru 10 10 10 10Right 390 1350 0.00 0.00 390 1350Left 70 110 0.00 0.00 70 110Thru 100 30 100 30Right 30 10 30 10
Route 17 / Short Rd 2035 Build
AM PM AM PM AM PMLeft 20 20 20 20Thru 1530 1380 4.55 0.00 1530 1380Right 5 5 5 5Left 10 10 0.00 0.00 10 10Thru 1470 2520 0.00 0.00 1470 2520Right 70 120 0.00 0.00 70 120Left 130 110 0.39 0.00 130 110Thru 0 5 0 5Right 20 40 20 40Left 5 5 5 5Thru 0 5 0 5Right 20 10 0.06 0.00 20 10
Eastbound
Westbound
Westbound
Original Peak Hour TM Balance Adjustment
Adjusted Peak Hour TM
Northbound
Southbound
Original Peak Hour TM Balance Adjustment
Adjusted Peak Hour TM
Northbound
Southbound
Eastbound
Sanf
ord
Dr
Short Rd
Route 17 Peak Hour volume based on
Adjusted Sanford Dr and Ramp Volumes
Route 17Adjusted
Difference
Route 17 Peak Hour volume based on Adjusted Short Rd
Route 17Original
Difference
Route 17 Peak Hour volume based on Original Sanford
Dr and Ramp Volumes
Route 17 Peak Hour volume based on Original Short Rd
Original Route 17 Volume from
Sanford Dr TM
Adjusted Route 17 Volume from
Sanford Dr TM
D-17

Route 3 and Route 17 Volumes Average Daily Traffic Volumes (ADT)
As was done for the existing and no-build conditions, ADT volumes were developed on Route 3 and Route 17 to the immediate east and west of the I-95 interchange. The ramp tube counts at Exit 130 and Exit 133 were utilized to determine AM and PM peak hour K-Factors for both Eastbound and Westbound Route 3 and WB/NB Route 17 (shown as NB in tables below) and EB/SB Route 17 (shown as SB in tables below). The respective K-Factors were applied to the peak hour turn movements of the intersections adjacent to the interchange. The ADT volumes developed based on the AM peak hour turn movements and K-Factor were averaged with the ADT volumes developed based on the PM peak hour turn movements and K-Factor for each roadway direction. Detailed information for each location is shown below.
Route 3 - Western Area
EB WB EB WB EB WB TotalAM Peak Hour 2,130 280 0.06 0.06 37,714 4,958 42,672 (based on AM peaks)PM Peak Hour 990 1,140 0.07 0.07 14,118 16,258 30,376 (based on PM peaks)
25,900 10,600 36,500 AM & PM Average
Route 3 - West of Bragg RoadPeak Hour K-Factor Calculated Daily Volume
Route 3 w/o Interchange Route 3 w/o Interchange Route 3 w/o InterchangeEB WB EB WB EB WB Total
AM Peak Hour 2,880 1,160 0.06 0.06 50,994 20,539 71,533 (based on AM peaks)PM Peak Hour 1,980 2,040 0.07 0.07 28,237 29,092 57,329 (based on PM peaks)
39,600 24,800 64,400 AM & PM Averagebased on Carl D Silver Pkwy TMs based on Exit 130 Ramps
Route 3 - East of Altoona DrivePeak Hour K-Factor Calculated Daily Volume
Route 3 e/o Interchange Route 3 e/o Interchange Route 3 e/o InterchangeEB WB EB WB EB WB Total
AM Peak Hour 2,360 1,760 0.06 0.06 41,786 31,163 72,949 (based on AM peaks)PM Peak Hour 2,420 2,510 0.07 0.07 34,512 35,795 70,307 (based on PM peaks)
38,100 33,500 71,600 AM & PM Averagebased on Gateway Blvd TMs based on Exit 130 Ramps
Route 17 - West of Falls Run DrivePeak Hour K-Factor Calculated Daily Volume
Route 17 w/o Interchange Route 17 w/o Interchange Route 17 w/o InterchangeNB SB NB SB NB SB Total
AM Peak Hour 3,320 3,000 0.06 0.06 53,867 48,675 102,543 (based on AM peaks)PM Peak Hour 3,540 3,450 0.07 0.07 53,328 51,972 105,301 (based on PM peaks)
53,600 50,300 103,900 AM & PM Averagebased on Sanford Dr TMs based on Exit 133 Ramps
Route 17 - East of Short Street
NB SB NB SB NB SB TotalAM Peak Hour 1,560 1,500 0.06 0.06 25,311 24,338 49,649 (based on AM peaks)PM Peak Hour 1,410 2,570 0.07 0.07 21,241 38,716 59,957 (based on PM peaks)
23,300 31,500 54,800 AM & PM Averagebased on Short St TMs based on Exit 133 Ramps
Peak Hour K-Factor Calculated Daily VolumeRoute 17 e/o Interchange Route 17 e/o Interchange Route 17 e/o Interchange
based on Carl D Silver Pkwy TMs based on Exit 130 Ramps
Peak Hour K-Factor Calculated Daily VolumeRoute 3 w/o Interchange Route 3 w/o Interchange Route 3 w/o Interchange
D-18
Intersection Turn Movement Counts
D-19


Intersection:�Route�3�/�Harrison�Road
Start�DateStart�Time 6:30
Street�Name AM�Total�Intersection�Peak�Hour�VolumeStart�Time Right� Thru� Left� Right� Thru� Left� Right� Thru� Left� Right� Thru� Left� 3104
Cars 6:30�AM 2 2 5 16 117 5 4 5 28 65 407 9 665Trucks� 6:30�AM 0 0 0 0 7 0 0 0 0 0 9 0 16 AM�Total�Truck�PercentageTotal 6:30�AM 2 2 5 16 124 5 4 5 28 65 416 9 681 2.4%Cars 6:45�AM 2 2 15 17 124 5 3 18 41 74 384 23 708
Trucks� 6:45�AM 0 0 0 0 5 0 0 0 2 0 13 0 20 AM�Intersection�PHFTotal 6:45�AM 2 2 15 17 129 5 3 18 43 74 397 23 728 0.97Cars 7:00�AM 2 7 7 14 166 9 4 18 51 76 369 39 762
Trucks� 7:00�AM 0 0 0 1 3 0 0 0 0 0 6 0 10Total 7:00�AM 2 7 7 15 169 9 4 18 51 76 375 39 772Cars 7:15�AM 1 7 20 14 177 5 4 12 59 100 366 24 789
Trucks� 7:15�AM 0 0 0 0 6 0 0 0 1 0 7 0 14Total 7:15�AM 1 7 20 14 183 5 4 12 60 100 373 24 803Cars 7:30�AM 1 10 15 10 125 4 3 7 19 107 460 21 782
Trucks� 7:30�AM 0 1 0 0 8 0 0 1 0 0 9 0 19Total 7:30�AM 1 11 15 10 133 4 3 8 19 107 469 21 801Cars 7:45�AM 5 12 16 14 124 3 5 11 44 74 384 15 707
Trucks� 7:45�AM 0 0 1 2 7 0 0 0 2 0 8 0 20Total 7:45�AM 5 12 17 16 131 3 5 11 46 74 392 15 727Cars 8:00�AM 4 6 8 9 128 4 4 7 36 72 327 23 628
Trucks� 8:00�AM 0 0 0 2 8 0 0 1 1 0 12 0 24Total 8:00�AM 4 6 8 11 136 4 4 8 37 72 339 23 652Cars 8:15�AM 2 4 13 20 157 4 2 15 33 60 366 21 697
Trucks� 8:15�AM 0 0 0 1 12 1 0 1 0 0 3 1 19Total 8:15�AM 2 4 13 21 169 5 2 16 33 60 369 22 716
Grand�Total 38 102 200 240 2348 80 58 192 634 1256 6260 352 11760
2008 6:45�7:45 6 27 57 56 614 23 14 56 173 357 1614 107 3104
Vehicles 19 50 99 114 1118 39 29 93 311 628 3063 175 5738Trucks 0 1 1 6 56 1 0 3 6 0 67 1 142
%�Trucks 0.0% 2.0% 1.0% 5.0% 4.8% 2.5% 0.0% 3.1% 1.9% 0.0% 2.1% 0.6% 2.4%
PHF 0.75 0.61 0.71 0.82 0.84 0.64 0.88 0.78 0.72 0.83 0.86 0.69 0.97
Growth�Rate 1.5% 1.5% 1.5% 1.5% 1.5% 1.5% 1.5% 1.5% 1.5% 1.5% 1.5% 1.5%Vehicles 10 40 80 80 860 30 20 80 240 500 2270 150 4360
Adjustment 0 0 0 0 20 0 0 0 0 0 60 0 80Vehicles 10 40 80 80 880 30 20 80 240 500 2330 150 4440
Start�DateStart�Time 16:00
Street�NameStart�Time Right� Thru� Left� Right� Thru� Left� Right� Thru� Left� Right� Thru� Left� PM�Total�Intersection�Peak�Hour�Volume
Cars 4:00�PM 17 23 21 56 396 15 6 12 50 61 215 29 901 3839Trucks� 4:00�PM 0 0 1 1 7 0 0 0 1 1 8 1 20Total 4:00�PM 17 23 22 57 403 15 6 12 51 62 223 30 921 PM�Total�Truck�PercentageCars 4:15�PM 25 25 25 58 330 9 1 23 38 45 223 18 820 1.8%
Trucks� 4:15�PM 0 0 0 0 10 0 0 0 0 0 16 1 27Total 4:15�PM 25 25 25 58 340 9 1 23 38 45 239 19 847 PM�Intersection�PHFCars 4:30�PM 27 29 32 59 342 19 1 24 42 54 214 20 863 0.97
Trucks� 4:30�PM 0 0 1 0 1 0 0 0 0 1 9 0 12Total 4:30�PM 27 29 33 59 343 19 1 24 42 55 223 20 875Cars 4:45�PM 22 22 17 71 359 15 4 28 67 49 205 28 887
Trucks� 4:45�PM 0 0 0 0 3 0 0 0 0 1 6 0 10Total 4:45�PM 22 22 17 71 362 15 4 28 67 50 211 28 897Cars 5:00�PM 18 30 30 70 406 11 7 21 45 46 233 62 979
Trucks� 5:00�PM 0 0 0 2 6 0 0 1 0 2 7 0 18Total 5:00�PM 18 30 30 72 412 11 7 22 45 48 240 62 997Cars 5:15�PM 29 40 40 73 412 10 7 21 63 47 210 19 971
Trucks� 5:15�PM 1 0 0 0 3 0 0 0 0 0 9 1 14Total 5:15�PM 30 40 40 73 415 10 7 21 63 47 219 20 985Cars 5:30�PM 36 22 26 71 395 22 9 17 44 50 222 26 940
Trucks� 5:30�PM 0 0 0 1 2 0 0 0 0 0 10 0 13Total 5:30�PM 36 22 26 72 397 22 9 17 44 50 232 26 953Cars 5:45�PM 36 25 27 47 405 14 4 28 43 42 205 12 888
Trucks� 5:45�PM 0 0 0 1 7 0 0 1 0 0 7 0 16Total 5:45�PM 36 25 27 48 412 14 4 29 43 42 212 12 904
Grand�Total 422 432 440 1020 6168 230 78 352 786 798 3598 434 14758
2008 5:00�6:00 120 117 123 265 1636 57 27 89 195 187 903 120 3839
Vehicles 210 216 218 505 3045 115 39 174 392 394 1727 214 7249Trucks 1 0 2 5 39 0 0 2 1 5 72 3 130
%�Trucks 0.5% 0.0% 0.9% 1.0% 1.3% 0.0% 0.0% 1.1% 0.3% 1.3% 4.0% 1.4% 1.8%
PHF 0.83 0.73 0.77 0.91 0.99 0.65 0.75 0.77 0.77 0.94 0.94 0.48 0.97
Growth�Rate 1.5% 1.5% 1.5% 1.5% 1.5% 1.5% 1.5% 1.5% 1.5% 1.5% 1.5% 1.5%Vehicles 170 160 170 370 2300 80 40 130 270 260 1270 170 5390
Adjustment 0 0 0 0 110 0 0 0 0 0 20 0 130Vehicles 170 160 170 370 2410 80 40 130 270 260 1290 170 5520
2035�No�Build
2035�Build
2035�No�Build
2035�Build
5/13/2008
Harrison�Road��Southbound Route�3��Westbound Harrison�Road��Northbound Route�3��EastboundTotal
5/13/2008
Harrison�Road��Southbound Route�3��Westbound Harrison�Road��Northbound Route�3��EastboundTotal
D-20

Intersection:�Route�3�/�Gordon�Road
Start�DateStart�Time 6:30
Street�Name AM�Total�Intersection�Peak�Hour�VolumeStart�Time Right� Thru� Left� Right� Thru� Left� Right� Thru� Left� Right� Thru� Left� 2969
Cars 6:30�AM 0 0 0 0 108 18 111 0 11 13 405 0 666Trucks� 6:30�AM 0 0 0 0 7 0 0 0 0 0 3 0 10 AM�Total�Truck�PercentageTotal 6:30�AM 0 0 0 0 115 18 111 0 11 13 408 0 676 3.8%Cars 6:45�AM 0 0 0 0 116 29 116 0 17 21 346 0 645
Trucks� 6:45�AM 0 0 0 0 7 0 1 0 0 0 10 0 18 AM�Intersection�PHFTotal 6:45�AM 0 0 0 0 123 29 117 0 17 21 356 0 663 0.98Cars 7:00�AM 0 0 0 0 150 25 129 0 48 18 363 0 733
Trucks� 7:00�AM 0 0 0 0 13 1 1 0 0 1 12 0 28Total 7:00�AM 0 0 0 0 163 26 130 0 48 19 375 0 761Cars 7:15�AM 0 0 0 0 164 28 108 0 47 18 349 0 714
Trucks� 7:15�AM 0 0 0 0 16 1 2 0 1 2 13 0 35Total 7:15�AM 0 0 0 0 180 29 110 0 48 20 362 0 749Cars 7:30�AM 0 0 0 0 142 21 104 0 27 17 422 0 733
Trucks� 7:30�AM 0 0 0 0 16 3 0 0 1 1 7 0 28Total 7:30�AM 0 0 0 0 158 24 104 0 28 18 429 0 761Cars 7:45�AM 0 0 0 0 133 45 100 0 20 15 362 0 675
Trucks� 7:45�AM 0 0 0 0 5 0 3 0 0 1 14 0 23Total 7:45�AM 0 0 0 0 138 45 103 0 20 16 376 0 698Cars 8:00�AM 0 0 0 0 150 35 74 0 12 11 319 0 601
Trucks� 8:00�AM 0 0 0 0 18 1 1 0 1 0 15 0 36Total 8:00�AM 0 0 0 0 168 36 75 0 13 11 334 0 637Cars 8:15�AM 0 0 0 0 158 47 103 0 11 13 368 0 700
Trucks� 8:15�AM 0 0 0 0 15 1 4 0 1 3 14 0 38Total 8:15�AM 0 0 0 0 173 48 107 0 12 16 382 0 738
Grand�Total 0 0 0 0 2436 510 1714 0 394 268 6044 0 11366
2008 7:00�8:00 0 0 0 0 639 124 447 0 144 73 1542 0 2969
Vehicles 0 0 0 0 1121 248 845 0 193 126 2934 0 5467Trucks 0 0 0 0 97 7 12 0 4 8 88 0 216
%�Trucks #DIV/0! #DIV/0! #DIV/0! #DIV/0! 8.0% 2.7% 1.4% #DIV/0! 2.0% 6.0% 2.9% #DIV/0! 3.8%
PHF #DIV/0! #DIV/0! #DIV/0! #DIV/0! 0.89 0.69 0.86 #DIV/0! 0.75 0.91 0.90 #DIV/0! 0.98
Growth�Rate 1.5% 1.5% 1.5% 1.5% 1.5% 1.5% 1.5% 1.5% 1.5% 1.5% 1.5% 1.5%Vehicles 0 0 0 0 900 170 630 0 200 100 2170 0 4170
Adjustment 630 310 40 190 �610 �110 �230 910 0 0 �860 920 1190Vehicles 630 310 40 190 290 60 400 910 200 100 1310 920 5360
Start�DateStart�Time 16:00
Street�Name PM�Total�Intersection�Peak�Hour�VolumeStart�Time Right� Thru� Left� Right� Thru� Left� Right� Thru� Left� Right� Thru� Left� 3822
Cars 4:00�PM 0 0 0 0 383 111 65 0 22 13 278 0 872Trucks� 4:00�PM 0 0 0 0 15 1 1 0 2 0 24 0 43 PM�Total�Truck�PercentageTotal 4:00�PM 0 0 0 0 398 112 66 0 24 13 302 0 915 2.9%Cars 4:15�PM 0 0 0 0 400 129 53 0 17 16 228 0 843
Trucks� 4:15�PM 0 0 0 0 9 2 2 0 1 0 10 0 24 PM�Intersection�PHFTotal 4:15�PM 0 0 0 0 409 131 55 0 18 16 238 0 867 0.98Cars 4:30�PM 0 0 0 0 384 117 68 0 35 8 208 0 820
Trucks� 4:30�PM 0 0 0 0 12 1 0 0 1 1 13 0 28Total 4:30�PM 0 0 0 0 396 118 68 0 36 9 221 0 848Cars 4:45�PM 0 0 0 0 435 126 48 0 39 15 258 0 921
Trucks� 4:45�PM 0 0 0 0 8 7 2 0 0 2 12 0 31Total 4:45�PM 0 0 0 0 443 133 50 0 39 17 270 0 952Cars 5:00�PM 0 0 0 0 440 166 58 0 35 25 212 0 936
Trucks� 5:00�PM 0 0 0 0 7 4 4 0 0 1 6 0 22Total 5:00�PM 0 0 0 0 447 170 62 0 35 26 218 0 958Cars 5:15�PM 0 0 0 0 421 131 70 0 59 19 228 0 928
Trucks� 5:15�PM 0 0 0 0 10 2 0 0 1 0 11 0 24Total 5:15�PM 0 0 0 0 431 133 70 0 60 19 239 0 952Cars 5:30�PM 0 0 0 0 436 144 51 0 39 18 232 0 920
Trucks� 5:30�PM 0 0 0 0 8 1 0 0 0 0 11 0 20Total 5:30�PM 0 0 0 0 444 145 51 0 39 18 243 0 940Cars 5:45�PM 0 0 0 0 440 151 64 0 35 15 244 0 949
Trucks� 5:45�PM 0 0 0 0 9 2 1 0 0 0 11 0 23Total 5:45�PM 0 0 0 0 449 153 65 0 35 15 255 0 972
Grand�Total 0 0 0 0 6834 2190 974 0 572 266 3972 0 14808
2008 5:00�6:00 0 0 0 0 1771 601 248 0 169 78 955 0 3822
Vehicles 0 0 0 0 3339 1075 477 0 281 129 1888 0 7189Trucks 0 0 0 0 78 20 10 0 5 4 98 0 215
%�Trucks #DIV/0! #DIV/0! #DIV/0! #DIV/0! 2.3% 1.8% 2.1% #DIV/0! 1.7% 3.0% 4.9% #DIV/0! 2.9%
PHF #DIV/0! #DIV/0! #DIV/0! #DIV/0! 0.99 0.88 0.89 #DIV/0! 0.70 0.75 0.94 #DIV/0! 0.98
Growth�Rate 1.5% 1.5% 1.5% 1.5% 1.5% 1.5% 1.5% 1.5% 1.5% 1.5% 1.5% 1.5%Vehicles 0 0 0 0 2490 840 350 0 240 110 1340 0 5370
Adjustment 1790 1300 200 210 �1680 �510 �190 460 0 0 �820 840 1600Vehicles 1790 1300 200 210 810 330 160 460 240 110 520 840 6970
2035�No�Build
2035�Build
2035�No�Build
2035�Build
5/14/2008
Gordon�Road��Southbound Route�3��Westbound Gordon�Road��Northbound Route�3��EastboundTotal
5/14/2008
Gordon�Road��Southbound Route�3��Westbound Gordon�Road��Northbound Route�3��EastboundTotal
D-21

Intersection:�Route�3�/�Five�Mile�Road
Start�DateStart�Time 6:30
Street�Name AM�Total�Intersection�Peak�Hour�VolumeStart�Time Right� Thru� Left� Right� Thru� Left� Right� Thru� Left� Right� Thru� Left� 3207
Cars 6:30�AM 0Trucks� 6:30�AM 0 AM�Total�Truck�PercentageTotal 6:30�AM 0Cars 6:45�AM 0
Trucks� 6:45�AM 0 AM�Intersection�PHFTotal 6:45�AM 0Cars 7:00�AM 0
Trucks� 7:00�AM 0Total 7:00�AM 0Cars 7:15�AM 0
Trucks� 7:15�AM 0Total 7:15�AM 0Cars 7:30�AM 0
Trucks� 7:30�AM 0Total 7:30�AM 0Cars 7:45�AM 0
Trucks� 7:45�AM 0Total 7:45�AM 0Cars 8:00�AM 0
Trucks� 8:00�AM 0Total 8:00�AM 0Cars 8:15�AM 0
Trucks� 8:15�AM 0Total 8:15�AM 0
Grand�Total 0 0 0 0 0 0 0 0 0 0 0 0 0
2008 AM�Peak 5 10 50 10 694 38 332 12 5 5 2041 5 3207
VehiclesTrucks
%�Trucks
PHF
Growth�Rate 1.5% 1.5% 1.5% 1.5% 1.5% 1.5% 1.5% 1.5% 1.5% 1.5% 1.5% 1.5%Vehicles 10 10 70 10 980 50 470 20 10 10 2870 10 4520
Adjustment 30 0 �30 �10 �730 �30 �170 0 170 30 �1090 10 �1820Vehicles 40 10 40 0 250 20 300 20 180 40 1780 20 2700
Start�DateStart�Time 16:00
Street�Name PM�Total�Intersection�Peak�Hour�VolumeStart�Time Right� Thru� Left� Right� Thru� Left� Right� Thru� Left� Right� Thru� Left� 4138
Cars 4:00�PMTrucks� 4:00�PM PM�Total�Truck�PercentageTotal 4:00�PMCars 4:15�PM
Trucks� 4:15�PM PM�Intersection�PHFTotal 4:15�PMCars 4:30�PM
Trucks� 4:30�PMTotal 4:30�PMCars 4:45�PM
Trucks� 4:45�PMTotal 4:45�PMCars 5:00�PM
Trucks� 5:00�PMTotal 5:00�PMCars 5:15�PM
Trucks� 5:15�PMTotal 5:15�PMCars 5:30�PM
Trucks� 5:30�PMTotal 5:30�PMCars 5:45�PM
Trucks� 5:45�PMTotal 5:45�PM
Grand�Total
2008 PM�Peak 16 30 30 54 2268 184 238 30 26 12 1238 12 4138
VehiclesTrucks
%�Trucks
PHF
Growth�Rate 1.5% 1.5% 1.5% 1.5% 1.5% 1.5% 1.5% 1.5% 1.5% 1.5% 1.5% 1.5%Vehicles 20 40 40 80 3190 260 330 40 40 20 1740 20 5820
Adjustment 20 0 �20 �50 �2190 �160 �190 0 190 160 �1020 50 �3210Vehicles 40 40 20 30 1000 100 140 40 230 180 720 70 2610
Intersection�Turn�Movements�Hand�Counted�by�Baker
Intersection�Turn�Movements�Hand�Counted�by�Baker
Route�3��Westbound Five�Mile�Road��Northbound Route�3��EastboundTotal
5/13/2008
Five�Mile�Road��Southbound Route�3��Westbound Five�Mile�Road��Northbound Route�3��EastboundTotal
2035�No�Build
2035�Build
2035�No�Build
2035�Build
5/13/2008
Five�Mile�Road��Southbound
D-22

Intersection:�Route�3�/�Bragg�Road
Start�DateStart�Time 6:30
Street�Name AM�Total�Intersection�Peak�Hour�VolumeStart�Time Right� Thru� Left� Right� Thru� Left� Right� Thru� Left� Right� Thru� Left� 4840
Cars 6:30�AM 22 5 29 4 138 12 14 10 6 11 679 52 982Trucks� 6:30�AM 2 0 0 0 8 1 0 0 0 0 4 0 15 AM�Total�Truck�PercentageTotal 6:30�AM 24 5 29 4 146 13 14 10 6 11 683 52 997 2.5%Cars 6:45�AM 30 2 24 7 154 18 24 3 7 25 712 65 1071
Trucks� 6:45�AM 0 0 0 0 7 1 0 0 0 0 6 1 15 AM�Intersection�PHFTotal 6:45�AM 30 2 24 7 161 19 24 3 7 25 718 66 1086 0.95Cars 7:00�AM 54 4 22 9 201 18 20 4 6 18 672 69 1097
Trucks� 7:00�AM 0 0 1 0 20 0 1 0 0 1 12 3 38Total 7:00�AM 54 4 23 9 221 18 21 4 6 19 684 72 1135Cars 7:15�AM 33 9 32 9 213 23 23 6 6 22 681 66 1123
Trucks� 7:15�AM 0 0 0 0 15 0 1 0 1 0 15 2 34Total 7:15�AM 33 9 32 9 228 23 24 6 7 22 696 68 1157Cars 7:30�AM 39 5 38 14 222 22 12 2 13 17 730 77 1191
Trucks� 7:30�AM 0 0 1 0 16 1 0 0 0 0 6 0 24Total 7:30�AM 39 5 39 14 238 23 12 2 13 17 736 77 1215Cars 7:45�AM 67 10 28 19 254 46 30 11 12 45 650 76 1248
Trucks� 7:45�AM 0 0 0 0 9 0 0 0 0 0 16 4 29Total 7:45�AM 67 10 28 19 263 46 30 11 12 45 666 80 1277Cars 8:00�AM 43 13 20 14 269 55 42 5 28 34 534 69 1126
Trucks� 8:00�AM 0 0 0 0 18 0 1 0 1 1 10 1 32Total 8:00�AM 43 13 20 14 287 55 43 5 29 35 544 70 1158Cars 8:15�AM 59 12 29 19 291 21 24 11 12 35 564 67 1144
Trucks� 8:15�AM 1 0 2 3 17 0 0 0 0 0 22 1 46Total 8:15�AM 60 12 31 22 308 21 24 11 12 35 586 68 1190
Grand�Total 700 120 452 196 3704 436 384 104 184 418 10626 1106 18430
2008 7:30�8:30 209 40 118 69 1096 145 109 29 66 132 2532 295 4840
Vehicles 347 60 222 95 1742 215 189 52 90 207 5222 541 8982Trucks 3 0 4 3 110 3 3 0 2 2 91 12 233
%�Trucks 0.9% 0.0% 1.8% 3.1% 5.9% 1.4% 1.6% 0.0% 2.2% 1.0% 1.7% 2.2% 2.5%
PHF 0.78 0.77 0.76 0.78 0.89 0.66 0.63 0.66 0.57 0.73 0.86 0.92 0.95
Growth�Rate 1.5% 1.5% 1.5% 1.5% 1.5% 1.5% 1.5% 1.5% 1.5% 1.5% 1.5% 1.5%Vehicles 290 60 170 100 1540 200 150 40 90 190 3560 410 6800
Adjustment �160 0 �70 0 �600 0 0 0 0 0 �1160 �120 �2110Vehicles 130 60 100 100 940 200 150 40 90 190 2400 290 4690
Start�DateStart�Time 16:00
Street�Name PM�Total�Intersection�Peak�Hour�VolumeStart�Time Right� Thru� Left� Right� Thru� Left� Right� Thru� Left� Right� Thru� Left� 6264
Cars 4:00�PM 107 19 33 39 601 49 35 23 48 39 420 62 1475Trucks� 4:00�PM 1 0 0 0 11 0 0 0 0 0 20 4 36 PM�Total�Truck�PercentageTotal 4:00�PM 108 19 33 39 612 49 35 23 48 39 440 66 1511 1.6%Cars 4:15�PM 120 30 27 44 604 50 29 14 53 43 401 53 1468
Trucks� 4:15�PM 1 0 1 0 6 0 2 0 0 0 12 0 22 PM�Intersection�PHFTotal 4:15�PM 121 30 28 44 610 50 31 14 53 43 413 53 1490 0.98Cars 4:30�PM 123 27 24 49 629 43 35 19 45 41 450 65 1550
Trucks� 4:30�PM 0 0 0 2 11 1 0 0 0 0 16 4 34Total 4:30�PM 123 27 24 51 640 44 35 19 45 41 466 69 1584Cars 4:45�PM 143 33 30 47 566 34 30 23 44 58 406 68 1482
Trucks� 4:45�PM 0 0 1 1 7 0 0 0 0 0 18 0 27Total 4:45�PM 143 33 31 48 573 34 30 23 44 58 424 68 1509Cars 5:00�PM 122 17 34 59 600 29 37 26 50 54 501 44 1573
Trucks� 5:00�PM 0 0 0 0 10 0 0 0 0 0 8 0 18Total 5:00�PM 122 17 34 59 610 29 37 26 50 54 509 44 1591Cars 5:15�PM 133 41 28 66 595 26 33 20 39 40 483 59 1563
Trucks� 5:15�PM 0 0 1 0 7 0 0 0 0 0 7 0 15Total 5:15�PM 133 41 29 66 602 26 33 20 39 40 490 59 1578Cars 5:30�PM 133 39 32 62 580 34 25 21 51 44 406 61 1488
Trucks� 5:30�PM 0 0 0 0 9 0 0 0 0 0 15 0 24Total 5:30�PM 133 39 32 62 589 34 25 21 51 44 421 61 1512Cars 5:45�PM 95 23 22 62 676 35 28 29 42 40 454 53 1559
Trucks� 5:45�PM 0 0 0 0 9 0 0 0 0 1 14 0 24Total 5:45�PM 95 23 22 62 685 35 28 29 42 41 468 53 1583
Grand�Total 1956 458 466 862 9842 602 508 350 744 720 7262 946 24716
2008 5:00�6:00 483 120 117 249 2486 124 123 96 182 179 1888 217 6264
Vehicles 976 229 230 428 4851 300 252 175 372 359 3521 465 12158Trucks 2 0 3 3 70 1 2 0 0 1 110 8 200
%�Trucks 0.2% 0.0% 1.3% 0.7% 1.4% 0.3% 0.8% 0.0% 0.0% 0.3% 3.0% 1.7% 1.6%
PHF 0.91 0.73 0.86 0.94 0.91 0.89 0.83 0.83 0.89 0.83 0.93 0.89 0.98
Growth�Rate 1.5% 1.5% 1.5% 1.5% 1.5% 1.5% 1.5% 1.5% 1.5% 1.5% 1.5% 1.5%Vehicles 680 170 160 350 3490 170 170 130 260 250 2650 300 8780
Adjustment �370 0 �20 �20 �2020 0 0 0 0 0 �1090 �130 �3650Vehicles 310 170 140 330 1470 170 170 130 260 250 1560 170 5130
5/14/2008
Bragg�Road��Southbound
5/14/2008
2035�No�Build
2035�Build
2035�No�Build
2035�Build
Route�3��Westbound Bragg�Road��Northbound Route�3��EastboundTotal
Bragg�Road��Southbound Route�3��Westbound Bragg�Road��Northbound Route�3��EastboundTotal
D-23
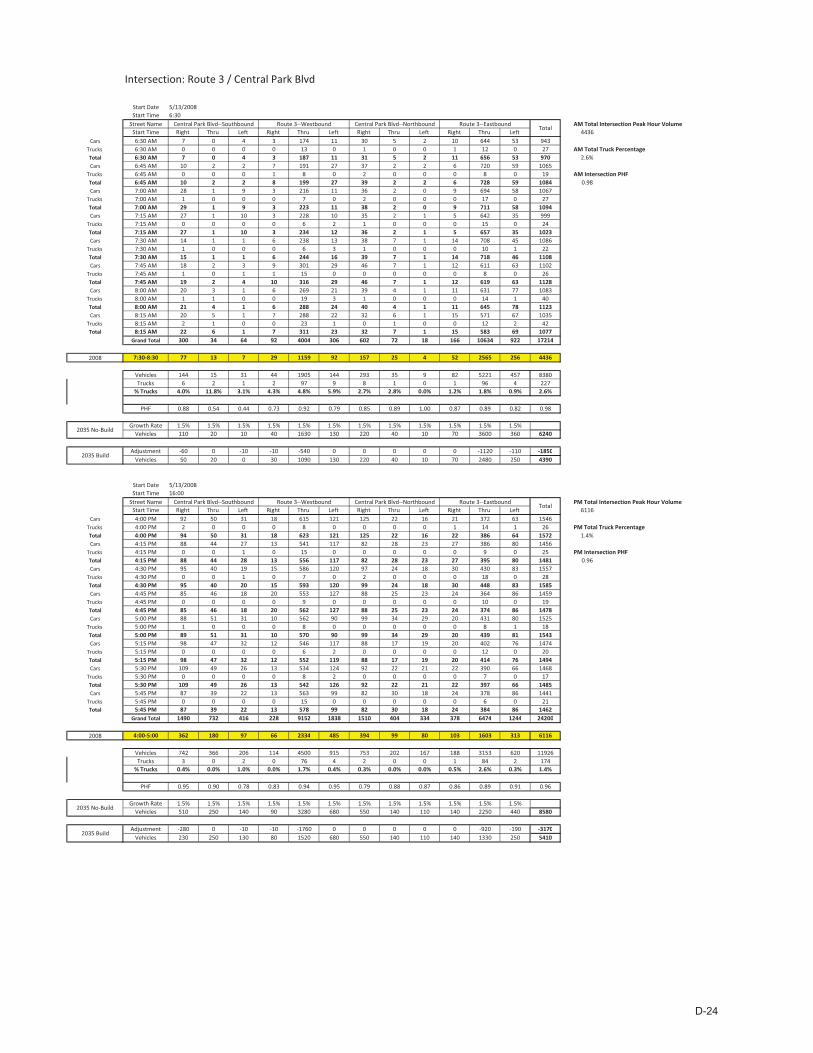
Intersection:�Route�3�/�Central�Park�Blvd
Start�DateStart�Time 6:30
Street�Name AM�Total�Intersection�Peak�Hour�VolumeStart�Time Right� Thru� Left� Right� Thru� Left� Right� Thru� Left� Right� Thru� Left� 4436
Cars 6:30�AM 7 0 4 3 174 11 30 5 2 10 644 53 943Trucks� 6:30�AM 0 0 0 0 13 0 1 0 0 1 12 0 27 AM�Total�Truck�PercentageTotal 6:30�AM 7 0 4 3 187 11 31 5 2 11 656 53 970 2.6%Cars 6:45�AM 10 2 2 7 191 27 37 2 2 6 720 59 1065
Trucks� 6:45�AM 0 0 0 1 8 0 2 0 0 0 8 0 19 AM�Intersection�PHFTotal 6:45�AM 10 2 2 8 199 27 39 2 2 6 728 59 1084 0.98Cars 7:00�AM 28 1 9 3 216 11 36 2 0 9 694 58 1067
Trucks� 7:00�AM 1 0 0 0 7 0 2 0 0 0 17 0 27Total 7:00�AM 29 1 9 3 223 11 38 2 0 9 711 58 1094Cars 7:15�AM 27 1 10 3 228 10 35 2 1 5 642 35 999
Trucks� 7:15�AM 0 0 0 0 6 2 1 0 0 0 15 0 24Total 7:15�AM 27 1 10 3 234 12 36 2 1 5 657 35 1023Cars 7:30�AM 14 1 1 6 238 13 38 7 1 14 708 45 1086
Trucks� 7:30�AM 1 0 0 0 6 3 1 0 0 0 10 1 22Total 7:30�AM 15 1 1 6 244 16 39 7 1 14 718 46 1108Cars 7:45�AM 18 2 3 9 301 29 46 7 1 12 611 63 1102
Trucks� 7:45�AM 1 0 1 1 15 0 0 0 0 0 8 0 26Total 7:45�AM 19 2 4 10 316 29 46 7 1 12 619 63 1128Cars 8:00�AM 20 3 1 6 269 21 39 4 1 11 631 77 1083
Trucks� 8:00�AM 1 1 0 0 19 3 1 0 0 0 14 1 40Total 8:00�AM 21 4 1 6 288 24 40 4 1 11 645 78 1123Cars 8:15�AM 20 5 1 7 288 22 32 6 1 15 571 67 1035
Trucks� 8:15�AM 2 1 0 0 23 1 0 1 0 0 12 2 42Total 8:15�AM 22 6 1 7 311 23 32 7 1 15 583 69 1077
Grand�Total 300 34 64 92 4004 306 602 72 18 166 10634 922 17214
2008 7:30�8:30 77 13 7 29 1159 92 157 25 4 52 2565 256 4436
Vehicles 144 15 31 44 1905 144 293 35 9 82 5221 457 8380Trucks 6 2 1 2 97 9 8 1 0 1 96 4 227
%�Trucks 4.0% 11.8% 3.1% 4.3% 4.8% 5.9% 2.7% 2.8% 0.0% 1.2% 1.8% 0.9% 2.6%
PHF 0.88 0.54 0.44 0.73 0.92 0.79 0.85 0.89 1.00 0.87 0.89 0.82 0.98
Growth�Rate 1.5% 1.5% 1.5% 1.5% 1.5% 1.5% 1.5% 1.5% 1.5% 1.5% 1.5% 1.5%Vehicles 110 20 10 40 1630 130 220 40 10 70 3600 360 6240
Adjustment �60 0 �10 �10 �540 0 0 0 0 0 �1120 �110 �1850Vehicles 50 20 0 30 1090 130 220 40 10 70 2480 250 4390
Start�DateStart�Time 16:00
Street�Name PM�Total�Intersection�Peak�Hour�VolumeStart�Time Right� Thru� Left� Right� Thru� Left� Right� Thru� Left� Right� Thru� Left� 6116
Cars 4:00�PM 92 50 31 18 615 121 125 22 16 21 372 63 1546Trucks� 4:00�PM 2 0 0 0 8 0 0 0 0 1 14 1 26 PM�Total�Truck�PercentageTotal 4:00�PM 94 50 31 18 623 121 125 22 16 22 386 64 1572 1.4%Cars 4:15�PM 88 44 27 13 541 117 82 28 23 27 386 80 1456
Trucks� 4:15�PM 0 0 1 0 15 0 0 0 0 0 9 0 25 PM�Intersection�PHFTotal 4:15�PM 88 44 28 13 556 117 82 28 23 27 395 80 1481 0.96Cars 4:30�PM 95 40 19 15 586 120 97 24 18 30 430 83 1557
Trucks� 4:30�PM 0 0 1 0 7 0 2 0 0 0 18 0 28Total 4:30�PM 95 40 20 15 593 120 99 24 18 30 448 83 1585Cars 4:45�PM 85 46 18 20 553 127 88 25 23 24 364 86 1459
Trucks� 4:45�PM 0 0 0 0 9 0 0 0 0 0 10 0 19Total 4:45�PM 85 46 18 20 562 127 88 25 23 24 374 86 1478Cars 5:00�PM 88 51 31 10 562 90 99 34 29 20 431 80 1525
Trucks� 5:00�PM 1 0 0 0 8 0 0 0 0 0 8 1 18Total 5:00�PM 89 51 31 10 570 90 99 34 29 20 439 81 1543Cars 5:15�PM 98 47 32 12 546 117 88 17 19 20 402 76 1474
Trucks� 5:15�PM 0 0 0 0 6 2 0 0 0 0 12 0 20Total 5:15�PM 98 47 32 12 552 119 88 17 19 20 414 76 1494Cars 5:30�PM 109 49 26 13 534 124 92 22 21 22 390 66 1468
Trucks� 5:30�PM 0 0 0 0 8 2 0 0 0 0 7 0 17Total 5:30�PM 109 49 26 13 542 126 92 22 21 22 397 66 1485Cars 5:45�PM 87 39 22 13 563 99 82 30 18 24 378 86 1441
Trucks� 5:45�PM 0 0 0 0 15 0 0 0 0 0 6 0 21Total 5:45�PM 87 39 22 13 578 99 82 30 18 24 384 86 1462
Grand�Total 1490 732 416 228 9152 1838 1510 404 334 378 6474 1244 24200
2008 4:00�5:00 362 180 97 66 2334 485 394 99 80 103 1603 313 6116
Vehicles 742 366 206 114 4500 915 753 202 167 188 3153 620 11926Trucks 3 0 2 0 76 4 2 0 0 1 84 2 174
%�Trucks 0.4% 0.0% 1.0% 0.0% 1.7% 0.4% 0.3% 0.0% 0.0% 0.5% 2.6% 0.3% 1.4%
PHF 0.95 0.90 0.78 0.83 0.94 0.95 0.79 0.88 0.87 0.86 0.89 0.91 0.96
Growth�Rate 1.5% 1.5% 1.5% 1.5% 1.5% 1.5% 1.5% 1.5% 1.5% 1.5% 1.5% 1.5%Vehicles 510 250 140 90 3280 680 550 140 110 140 2250 440 8580
Adjustment �280 0 �10 �10 �1760 0 0 0 0 0 �920 �190 �3170Vehicles 230 250 130 80 1520 680 550 140 110 140 1330 250 5410
Route�3��Westbound Central�Park�Blvd��Northbound Route�3��EastboundTotal
Central�Park�Blvd��Southbound Route�3��Westbound Central�Park�Blvd��Northbound Route�3��EastboundTotal
2035�No�Build
2035�Build
2035�No�Build
2035�Build
5/13/2008
Central�Park�Blvd��Southbound
5/13/2008
D-24

Intersection:�Route�3�/�Carl�D�Silver
Start�DateStart�Time 6:30
Street�Name AM�Total�Intersection�Peak�Hour�VolumeStart�Time Right� Thru� Left� Right� Thru� Left� Right� Thru� Left� Right� Thru� Left� 4951
Cars 6:30�AM 7 2 65 83 181 2 5 1 2 1 649 11 1009Trucks� 6:30�AM 0 0 0 1 7 0 1 0 0 0 13 0 22 AM�Total�Truck�PercentageTotal 6:30�AM 7 2 65 84 188 2 6 1 2 1 662 11 1031 1.9%Cars 6:45�AM 9 2 65 75 214 6 2 3 2 4 731 19 1132
Trucks� 6:45�AM 0 0 1 2 5 1 0 0 0 0 5 1 15 AM�Intersection�PHFTotal 6:45�AM 9 2 66 77 219 7 2 3 2 4 736 20 1147 0.98Cars 7:00�AM 10 1 64 72 224 6 8 4 5 2 665 26 1087
Trucks� 7:00�AM 0 0 0 0 6 0 0 0 0 0 13 0 19Total 7:00�AM 10 1 64 72 230 6 8 4 5 2 678 26 1106Cars 7:15�AM 4 3 93 71 248 7 8 4 3 1 697 22 1161
Trucks� 7:15�AM 0 0 3 2 6 0 0 0 0 0 9 0 20Total 7:15�AM 4 3 96 73 254 7 8 4 3 1 706 22 1181Cars 7:30�AM 14 1 84 98 245 4 6 3 3 1 749 27 1235
Trucks� 7:30�AM 0 0 7 1 6 0 1 0 0 1 9 0 25Total 7:30�AM 14 1 91 99 251 4 7 3 3 2 758 27 1260Cars 7:45�AM 9 4 77 123 311 9 3 1 4 3 656 42 1242
Trucks� 7:45�AM 0 0 1 2 14 0 0 0 0 0 8 0 25Total 7:45�AM 9 4 78 125 325 9 3 1 4 3 664 42 1267Cars 8:00�AM 14 1 72 126 288 4 3 3 1 5 651 33 1201
Trucks� 8:00�AM 0 0 0 2 20 0 1 0 0 0 12 0 35Total 8:00�AM 14 1 72 128 308 4 4 3 1 5 663 33 1236Cars 8:15�AM 18 1 83 143 304 6 2 0 4 2 565 42 1170
Trucks� 8:15�AM 0 0 0 3 10 0 1 0 0 0 4 0 18Total 8:15�AM 18 1 83 146 314 6 3 0 4 2 569 42 1188
Grand�Total 170 30 1230 1608 4178 90 82 38 48 40 10872 446 18832
2008 7:30�8:30 55 7 324 498 1198 23 17 7 12 12 2654 144 4951
Vehicles 85 15 603 791 2015 44 37 19 24 19 5363 222 9237Trucks 0 0 12 13 74 1 4 0 0 1 73 1 179
%�Trucks 0.0% 0.0% 2.0% 1.6% 3.5% 2.2% 9.8% 0.0% 0.0% 5.0% 1.3% 0.4% 1.9%
PHF 0.76 0.44 0.89 0.85 0.92 0.64 0.61 0.58 0.75 0.60 0.88 0.86 0.98
2008�Balanced* 7:30�8:30 55 7 351 455 1094 21 18 7 12 12 2875 144 5051*�Intersection�volumes�adjsuted�to�balance�volumes�across�the�Route�3�Interchange�(See�interchange�balancing�worksheet)
Growth�Rate 1.5% 1.5% 1.5% 1.5% 1.5% 1.5% 1.5% 1.5% 1.5% 1.5% 1.5% 1.5%Vehicles 80 10 490 640 1540 30 30 10 20 20 4040 200 7110
7:30�8:30 80 10 480 630 1510 30 30 10 20 20 3980 200 7000*�Intersection�volumes�adjusted�to�balance�volumes�across�the�Route�3�Interchange�(See�interchange�balancing�worksheet
Adjustment �40 0 �210 �20 �510 0 0 0 0 0 �1070 �60 �1910Vehicles 40 10 270 610 1000 30 30 10 20 20 2910 140 5090
7:30�8:30 40 10 270 610 1000 30 30 10 20 20 2910 140 5090*�Intersection�volumes�adjusted�to�balance�volumes�across�the�Route�3�Interchange�(See�interchange�balancing�worksheet
Start�DateStart�Time 16:00
Street�Name PM�Total�Intersection�Peak�Hour�VolumeStart�Time Right� Thru� Left� Right� Thru� Left� Right� Thru� Left� Right� Thru� Left� 6831
Cars 4:00�PM 77 3 242 208 680 12 8 5 6 6 452 61 1760Trucks� 4:00�PM 0 0 0 2 9 0 0 0 0 0 9 0 20 PM�Total�Truck�PercentageTotal 4:00�PM 77 3 242 210 689 12 8 5 6 6 461 61 1780 1.0%Cars 4:15�PM 90 1 241 230 615 6 9 3 7 1 437 59 1699
Trucks� 4:15�PM 0 0 0 0 8 0 0 0 0 0 5 0 13 PM�Intersection�PHFTotal 4:15�PM 90 1 241 230 623 6 9 3 7 1 442 59 1712 0.96Cars 4:30�PM 75 2 177 226 678 10 3 1 4 2 446 59 1683
Trucks� 4:30�PM 0 0 0 1 2 1 0 0 0 0 14 0 18Total 4:30�PM 75 2 177 227 680 11 3 1 4 2 460 59 1701Cars 4:45�PM 61 7 158 240 638 7 5 1 4 2 403 94 1620
Trucks� 4:45�PM 0 0 0 1 8 0 0 0 0 0 9 0 18Total 4:45�PM 61 7 158 241 646 7 5 1 4 2 412 94 1638Cars 5:00�PM 75 7 237 202 601 5 6 4 4 1 476 59 1677
Trucks� 5:00�PM 0 0 1 2 7 0 0 1 0 0 8 0 19Total 5:00�PM 75 7 238 204 608 5 6 5 4 1 484 59 1696Cars 5:15�PM 71 3 205 245 597 11 1 6 4 3 376 63 1585
Trucks� 5:15�PM 0 0 0 1 3 0 1 0 0 0 7 0 12Total 5:15�PM 71 3 205 246 600 11 2 6 4 3 383 63 1597Cars 5:30�PM 88 0 193 260 568 11 7 3 8 1 415 63 1617
Trucks� 5:30�PM 0 0 2 0 7 1 0 0 0 0 9 0 19Total 5:30�PM 88 0 195 260 575 12 7 3 8 1 424 63 1636Cars 5:45�PM 65 3 171 247 592 12 4 1 2 4 392 57 1550
Trucks� 5:45�PM 0 0 1 0 8 2 0 0 0 0 7 0 18Total 5:45�PM 65 3 172 247 600 14 4 1 2 4 399 57 1568
Grand�Total 1204 52 3256 3730 10042 156 88 50 78 40 6930 1030 26656
2008 4:00�5:00 303 13 818 908 2638 36 25 10 21 11 1775 273 6831
Vehicles 602 26 1624 1858 4969 74 43 24 39 20 3397 515 13191Trucks 0 0 4 7 52 4 1 1 0 0 68 0 137
%�Trucks 0.0% 0.0% 0.2% 0.4% 1.0% 5.1% 2.3% 4.0% 0.0% 0.0% 2.0% 0.0% 1.0%
PHF 0.84 0.46 0.85 0.94 0.96 0.75 0.69 0.50 0.75 0.46 0.96 0.73 0.96
2008�Balanced* 4:00�5:00 303 13 848 935 2715 37 26 10 21 11 1839 273 7031*�Intersection�volumes�adjusted�to�balance�volumes�across�the�Route�3�Interchange�(See�interchange�balancing�worksheet)
Growth�Rate 1.5% 1.5% 1.5% 1.5% 1.5% 1.5% 1.5% 1.5% 1.5% 1.5% 1.5% 1.5%Vehicles 430 20 1190 1310 3810 50 40 10 30 20 2580 380 9870
4:00�5:00 430 20 1170 1300 3770 50 40 10 30 20 2530 380 9750*�Intersection�volumes�adjusted�to�balance�volumes�across�the�Route�3�Interchange�(See�interchange�balancing�worksheet
Adjustment �230 0 �110 �80 �1540 0 0 0 0 0 �770 �160 �2890Vehicles 200 20 1060 1220 2230 50 40 10 30 20 1760 220 6860
4:00�5:00 200 20 1060 1220 2230 50 40 10 30 20 1760 220 6860*�Intersection�volumes�adjusted�to�balance�volumes�across�the�Route�3�Interchange�(See�interchange�balancing�worksheet
2035�Build
2035�No�Build�Balanced*
2035�Build�Balanced*
Route�3��Westbound Carl�D�Silver��Northbound Route�3��EastboundTotal
5/14/2008
Carl�D�Silver���Southbound Route�3��Westbound Carl�D�Silver��Northbound Route�3��EastboundTotal
2035�No�Build
2035�No�Build�Balanced*
2035�No�Build
5/13/2008
Carl�D�Silver���Southbound
2035�Build
2035�Build�Balanced*
D-25

Intersection:�Route�3�/�Gateway�Blvd
Start�DateStart�Time 6:30
Street�Name AM�Total�Intersection�Peak�Hour�VolumeStart�Time Right� Thru� Left� Right� Thru� Left� Right� Thru� Left� Right� Thru� Left� 3672
Cars 6:30�AM 19 1 0 0 255 20 24 9 47 41 239 27 682Trucks� 6:30�AM 0 0 0 0 15 0 0 0 1 2 9 0 27 AM�Total�Truck�PercentageTotal 6:30�AM 19 1 0 0 270 20 24 9 48 43 248 27 709 4.9%Cars 6:45�AM 16 0 0 1 238 37 32 2 48 47 285 28 734
Trucks� 6:45�AM 0 0 0 0 9 1 0 0 1 1 9 0 21 AM�Intersection�PHFTotal 6:45�AM 16 0 0 1 247 38 32 2 49 48 294 28 755 0.95Cars 7:00�AM 18 0 3 2 242 21 27 6 78 48 249 24 718
Trucks� 7:00�AM 0 0 1 0 8 0 2 0 0 1 10 0 22Total 7:00�AM 18 0 4 2 250 21 29 6 78 49 259 24 740Cars 7:15�AM 19 0 1 2 232 15 25 3 38 61 296 12 704
Trucks� 7:15�AM 0 0 0 0 19 0 2 0 1 0 14 0 36Total 7:15�AM 19 0 1 2 251 15 27 3 39 61 310 12 740Cars 7:30�AM 9 1 2 4 268 35 19 4 53 70 338 15 818
Trucks� 7:30�AM 0 0 0 0 25 0 0 0 0 3 5 0 33Total 7:30�AM 9 1 2 4 293 35 19 4 53 73 343 15 851Cars 7:45�AM 7 2 0 2 276 22 24 1 55 97 392 4 882
Trucks� 7:45�AM 0 0 0 0 38 1 0 0 1 3 16 0 59Total 7:45�AM 7 2 0 2 314 23 24 1 56 100 408 4 941Cars 8:00�AM 1 0 3 1 284 22 20 4 51 101 353 10 850
Trucks� 8:00�AM 0 0 0 0 35 2 1 0 1 6 14 0 59Total 8:00�AM 1 0 3 1 319 24 21 4 52 107 367 10 909Cars 8:15�AM 4 0 5 2 299 24 40 1 56 90 377 9 907
Trucks� 8:15�AM 0 0 0 0 38 1 5 0 0 10 10 0 64Total 8:15�AM 4 0 5 2 337 25 45 1 56 100 387 9 971
Grand�Total 186 8 30 28 4562 402 442 60 862 1162 5232 258 13232
2008 7:30�8:30 21 3 10 9 1263 107 109 10 217 380 1505 38 3672
Vehicles 93 4 14 14 2094 196 211 30 426 555 2529 129 6295Trucks 0 0 1 0 187 5 10 0 5 26 87 0 321
%�Trucks 0.0% 0.0% 6.7% 0.0% 8.2% 2.5% 4.5% 0.0% 1.2% 4.5% 3.3% 0.0% 4.9%
PHF 0.58 0.38 0.50 0.56 0.94 0.76 0.61 0.63 0.97 0.89 0.92 0.63 0.95
2008�Balanced* 7:30�8:30 23 3 10 9 1388 107 109 10 239 331 1310 33 3572*�Intersection�volumes�adjsuted�to�balance�volumes�across�the�Route�3�Interchange�(See�interchange�balancing�worksheet)
Growth�Rate 1.0% 1.0% 1.0% 1.0% 1.0% 1.0% 1.0% 1.0% 1.0% 1.0% 1.0% 1.0%Vehicles 30 4 10 10 1760 140 140 10 300 420 1660 40 4524
7:30�8:30 30 5 10 10 1800 140 140 10 310 430 1710 40 4635*�Intersection�volumes�adjusted�to�balance�volumes�across�the�Route�3�Interchange�(See�interchange�balancing�worksheet
Adjustment 0 0 0 0 140 0 0 0 0 0 260 0 400Vehicles 30 5 10 10 1940 140 140 10 310 430 1970 40 5035
7:30�8:30 30 5 10 10 1940 140 140 10 310 430 1970 40 5035*�Intersection�volumes�adjusted�to�balance�volumes�across�the�Route�3�Interchange�(See�interchange�balancing�worksheet
Start�DateStart�Time 16:00
Street�Name PM�Total�Intersection�Peak�Hour�VolumeStart�Time Right� Thru� Left� Right� Thru� Left� Right� Thru� Left� Right� Thru� Left� 4358
Cars 4:00�PM 4 0 2 1 389 59 65 0 71 116 340 14 1061Trucks� 4:00�PM 0 0 0 0 15 0 0 0 0 0 4 0 19 PM�Total�Truck�PercentageTotal 4:00�PM 4 0 2 1 404 59 65 0 71 116 344 14 1080 2.4%Cars 4:15�PM 1 2 3 0 387 60 48 0 110 160 390 17 1178
Trucks� 4:15�PM 0 0 0 0 15 1 1 0 1 0 12 0 30 PM�Intersection�PHFTotal 4:15�PM 1 2 3 0 402 61 49 0 111 160 402 17 1208 0.94Cars 4:30�PM 3 0 3 0 335 49 53 0 81 121 352 8 1005
Trucks� 4:30�PM 0 0 0 1 13 1 1 0 0 0 16 0 32Total 4:30�PM 3 0 3 1 348 50 54 0 81 121 368 8 1037Cars 4:45�PM 4 0 2 0 307 68 42 0 84 97 347 15 966
Trucks� 4:45�PM 0 0 0 0 5 3 1 0 2 1 10 0 22Total 4:45�PM 4 0 2 0 312 71 43 0 86 98 357 15 988Cars 5:00�PM 2 1 4 0 333 87 69 0 74 114 391 7 1082
Trucks� 5:00�PM 0 0 0 0 10 0 1 0 2 0 11 0 24Total 5:00�PM 2 1 4 0 343 87 70 0 76 114 402 7 1106Cars 5:15�PM 0 0 4 0 400 52 51 1 95 130 385 9 1127
Trucks� 5:15�PM 0 0 0 0 16 0 0 0 4 4 7 1 32Total 5:15�PM 0 0 4 0 416 52 51 1 99 134 392 10 1159Cars 5:30�PM 1 0 1 0 318 58 46 1 77 106 366 5 979
Trucks� 5:30�PM 0 0 0 0 17 0 0 0 0 1 10 0 28Total 5:30�PM 1 0 1 0 335 58 46 1 77 107 376 5 1007Cars 5:45�PM 0 0 1 0 377 31 49 0 73 122 399 11 1063
Trucks� 5:45�PM 0 0 0 0 11 0 1 0 2 0 9 0 23Total 5:45�PM 0 0 1 0 388 31 50 0 75 122 408 11 1086
Grand�Total 30 6 40 4 5896 938 856 4 1352 1944 6098 174 17342
2008 5:00�6:00 3 1 10 0 1482 228 217 2 327 477 1578 33 4358
Vehicles 15 3 20 1 2846 464 423 2 665 966 2970 86 8461Trucks 0 0 0 1 102 5 5 0 11 6 79 1 210
%�Trucks 0.0% 0.0% 0.0% 50.0% 3.5% 1.1% 1.2% 0.0% 1.6% 0.6% 2.6% 1.1% 2.4%
PHF 0.38 0.25 0.63 � 0.89 0.66 0.78 0.50 0.83 0.89 0.97 0.75 0.94
2008�Balanced* 5:00�6:00 3 1 10 0 1396 228 217 2 308 455 1506 31 4157*�Intersection�volumes�adjsuted�to�balance�volumes�across�the�Route�3�Interchange�(See�interchange�balancing�worksheet)
Growth�Rate 1.0% 1.0% 1.0% 1.0% 1.0% 1.0% 1.0% 1.0% 1.0% 1.0% 1.0% 1.0%Vehicles 4 1 10 0 1770 290 280 3 390 580 1910 40 5278
5:00�6:00 5 5 10 0 1820 290 280 5 400 600 1970 40 5425*�Intersection�volumes�adjusted�to�balance�volumes�across�the�Route�3�Interchange�(See�interchange�balancing�worksheet
Adjustment 0 0 0 0 260 0 0 0 0 0 230 0 490Vehicles 5 5 10 0 2080 290 280 5 400 600 2200 40 5915
5:00�6:00 5 5 10 0 2080 290 280 5 400 600 2200 40 5915*�Intersection�volumes�adjusted�to�balance�volumes�across�the�Route�3�Interchange�(See�interchange�balancing�worksheet
2035�Build
2035�Build�Balanced*
2035�No�Build
2035�No�Build
2035�No�Build�Balanced*
2035�Build
2035�Build�Balanced*
2035�No�Build�Balanced*
Total
5/13/2008
Gateway�Blvd��Southbound Route�3��Westbound Gateway�Blvd��Northbound Route�3��EastboundTotal
5/13/2008
Gateway�Blvd��Southbound Route�3��Westbound Gateway�Blvd��Northbound Route�3��Eastbound
D-26

Intersection:�Route�3�/�Mahone�St�(Atoona�Drive)
Start�DateStart�Time 6:30
Street�Name AM�Total�Intersection�Peak�Hour�VolumeStart�Time Right� Thru� Left� Right� Thru� Left� Right� Thru� Left� Right� Thru� Left� 3041
Cars 6:30�AM 5 0 0 2 232 5 3 0 9 1 244 5 506Trucks� 6:30�AM 0 0 0 0 9 0 0 0 0 0 24 0 33 AM�Total�Truck�PercentageTotal 6:30�AM 5 0 0 2 241 5 3 0 9 1 268 5 539 5.6%Cars 6:45�AM 15 0 6 3 231 2 4 1 10 2 290 9 573
Trucks� 6:45�AM 0 0 0 0 11 0 0 0 0 0 14 1 26 AM�Intersection�PHFTotal 6:45�AM 15 0 6 3 242 2 4 1 10 2 304 10 599 0.90Cars 7:00�AM 9 0 7 5 244 3 7 0 5 3 277 10 570
Trucks� 7:00�AM 0 0 0 0 15 0 0 0 0 1 20 0 36Total 7:00�AM 9 0 7 5 259 3 7 0 5 4 297 10 606Cars 7:15�AM 0 2 18 3 262 4 9 1 8 5 303 1 616
Trucks� 7:15�AM 0 0 0 0 14 0 0 0 0 0 19 0 33Total 7:15�AM 0 2 18 3 276 4 9 1 8 5 322 1 649Cars 7:30�AM 5 1 11 2 295 5 12 0 7 2 340 5 685
Trucks� 7:30�AM 0 0 0 0 14 0 0 0 0 0 20 0 34Total 7:30�AM 5 1 11 2 309 5 12 0 7 2 360 5 719Cars 7:45�AM 2 0 21 6 285 12 6 1 10 3 438 10 794
Trucks� 7:45�AM 0 0 0 0 23 1 0 0 0 0 26 0 50Total 7:45�AM 2 0 21 6 308 13 6 1 10 3 464 10 844Cars 8:00�AM 2 1 15 5 287 7 8 1 10 2 370 10 718
Trucks� 8:00�AM 0 0 0 0 27 0 0 0 0 0 18 0 45Total 8:00�AM 2 1 15 5 314 7 8 1 10 2 388 10 763Cars 8:15�AM 6 1 8 4 273 9 8 2 10 7 332 7 667
Trucks� 8:15�AM 0 0 0 0 24 1 0 0 1 0 22 0 48Total 8:15�AM 6 1 8 4 297 10 8 2 11 7 354 7 715
Grand�Total 88 10 172 60 4492 98 114 12 140 52 5514 116 10868
2008 7:30�8:30 15 3 55 17 1228 35 34 4 38 14 1566 32 3041
Vehicles 44 5 86 30 2109 47 57 6 69 25 2594 57 5129Trucks 0 0 0 0 137 2 0 0 1 1 163 1 305
%�Trucks 0.0% 0.0% 0.0% 0.0% 6.1% 4.1% 0.0% 0.0% 1.4% 3.8% 5.9% 1.7% 5.6%
PHF 0.63 0.75 0.65 0.71 0.98 0.67 0.71 0.50 0.86 0.50 0.84 0.80 0.90
Growth�Rate 1.0% 1.0% 1.0% 1.0% 1.0% 1.0% 1.0% 1.0% 1.0% 1.0% 1.0% 1.0%Vehicles 20 0 70 20 1560 40 40 10 50 20 1990 40 3860
Adjustment 0 0 0 0 140 0 0 0 0 0 260 0 400Vehicles 20 0 70 20 1700 40 40 10 50 20 2250 40 4260
Start�DateStart�Time 16:00
Street�Name PM�Total�Intersection�Peak�Hour�VolumeStart�Time Right� Thru� Left� Right� Thru� Left� Right� Thru� Left� Right� Thru� Left� 3707
Cars 4:00�PM 1 2 13 2 380 6 16 4 21 7 360 12 824Trucks� 4:00�PM 0 0 0 0 13 0 1 0 0 0 11 0 25 PM�Total�Truck�PercentageTotal 4:00�PM 1 2 13 2 393 6 17 4 21 7 371 12 849 2.5%Cars 4:15�PM 0 1 8 5 394 8 7 2 17 8 392 15 857
Trucks� 4:15�PM 0 0 0 0 14 0 0 0 0 0 20 0 34 PM�Intersection�PHFTotal 4:15�PM 0 1 8 5 408 8 7 2 17 8 412 15 891 0.96Cars 4:30�PM 1 0 8 1 388 9 8 0 21 7 327 7 777
Trucks� 4:30�PM 0 0 0 0 8 0 0 0 0 0 13 0 21Total 4:30�PM 1 0 8 1 396 9 8 0 21 7 340 7 798Cars 4:45�PM 2 1 6 4 391 5 11 1 11 13 373 37 855
Trucks� 4:45�PM 0 0 0 0 12 0 1 0 0 0 11 0 24Total 4:45�PM 2 1 6 4 403 5 12 1 11 13 384 37 879Cars 5:00�PM 3 1 9 6 440 8 7 4 28 12 412 19 949
Trucks� 5:00�PM 0 0 0 0 8 0 0 0 0 0 9 0 17Total 5:00�PM 3 1 9 6 448 8 7 4 28 12 421 19 966Cars 5:15�PM 7 2 16 3 465 4 7 2 18 6 400 14 944
Trucks� 5:15�PM 1 0 0 0 11 0 0 0 0 0 12 0 24Total 5:15�PM 8 2 16 3 476 4 7 2 18 6 412 14 968Cars 5:30�PM 2 0 8 7 402 9 11 1 18 8 382 13 861
Trucks� 5:30�PM 0 0 0 0 7 0 0 0 0 0 8 0 15Total 5:30�PM 2 0 8 7 409 9 11 1 18 8 390 13 876Cars 5:45�PM 2 1 9 8 370 7 9 1 17 12 426 17 879
Trucks� 5:45�PM 0 0 0 0 15 0 0 0 0 0 3 0 18Total 5:45�PM 2 1 9 8 385 7 9 1 17 12 429 17 897
Grand�Total 38 16 154 72 6636 112 156 30 302 146 6318 268 14248
2008 5:00�6:00 15 4 42 24 1718 28 34 8 81 38 1652 63 3707
Vehicles 18 8 77 36 3230 56 76 15 151 73 3072 134 6946Trucks 1 0 0 0 88 0 2 0 0 0 87 0 178
%�Trucks 5.3% 0.0% 0.0% 0.0% 2.7% 0.0% 2.6% 0.0% 0.0% 0.0% 2.8% 0.0% 2.5%
PHF 0.47 0.50 0.66 0.75 0.90 0.78 0.77 0.50 0.72 0.79 0.96 0.83 0.96
Growth�Rate 1.0% 1.0% 1.0% 1.0% 1.0% 1.0% 1.0% 1.0% 1.0% 1.0% 1.0% 1.0%Vehicles 20 10 50 30 2180 40 40 10 100 50 2100 80 4710
Adjustment 0 0 0 0 260 0 0 0 0 0 230 0 490Vehicles 20 10 50 30 2440 40 40 10 100 50 2330 80 5200
Route�3��Westbound Mahone�Street��Northbound Route�3��EastboundTotal
Altoona�Drive��Southbound Route�3��Westbound Mahone�Street��Northbound Route�3��EastboundTotal
2035�No�Build
2035�Build
2035�No�Build
2035�Build
5/14/2008
Altoona�Drive��Southbound
5/14/2008
D-27

Intersection:�Route�17�/�Falls�Run�Drive
Start�DateStart�Time 7:00
Street�Name AM�Total�Intersection�Peak�Hour�VolumeStart�Time Right� Thru� Left� Right� Thru� Left� Right� Thru� Left� Right� Thru� Left� 4203
Cars 6:30�AM 0Trucks� 6:30�AM 0 AM�Total�Truck�PercentageTotal 6:30�AM 0 0 0 0 0 0 0 0 0 0 0 0 0 #DIV/0!Cars 6:45�AM 0
Trucks� 6:45�AM 0 AM�Intersection�PHFTotal 6:45�AM 0 0 0 0 0 0 0 0 0 0 0 0 0 0.94Cars 7:00�AM 0
Trucks� 7:00�AM 0Total 7:00�AM 17 422 4 5 2 10 28 457 41 24 0 0 1010Cars 7:15�AM 0
Trucks� 7:15�AM 0Total 7:15�AM 8 404 14 7 4 20 58 500 17 10 0 0 1042Cars 7:30�AM 0
Trucks� 7:30�AM 0Total 7:30�AM 15 439 11 12 0 15 52 533 28 8 0 0 1113Cars 7:45�AM 0
Trucks� 7:45�AM 0Total 7:45�AM 5 428 17 9 1 17 74 459 18 10 0 0 1038Cars 8:00�AM 0
Trucks� 8:00�AM 0Total 8:00�AM 3 377 15 10 0 26 55 411 12 4 0 0 913Cars 8:15�AM 0
Trucks� 8:15�AM 0Total 8:15�AM 1 364 34 1 0 8 83 329 11 5 0 0 836
Grand�Total 49 2434 95 44 7 96 350 2689 127 61 0 0 5952
2008 7:00�8:00 45 1693 46 33 7 62 212 1949 104 52 0 0 4203
Vehicles 0 0 0 0 0 0 0 0 0 0 0 0 0Trucks 0 0 0 0 0 0 0 0 0 0 0 0 0
%�Trucks #DIV/0! #DIV/0! #DIV/0! #DIV/0! #DIV/0! #DIV/0! #DIV/0! #DIV/0! #DIV/0! #DIV/0! #DIV/0! #DIV/0! #DIV/0!
PHF 0.66 0.96 0.68 0.69 0.44 0.78 0.72 0.91 0.63 0.54 #DIV/0! #DIV/0! 0.94
Growth�Rate 2.5% 2.5% 2.5% 2.5% 2.5% 2.5% 2.5% 2.5% 2.5% 2.5% 2.5% 2.5%Vehicles 80 2840 80 60 10 100 360 3260 170 90 0 0 7050
Adjustment 0 0 0 0 0 0 0 0 0 0 0 0 0Vehicles 80 2840 80 60 10 100 360 3260 170 90 0 0 7050
Start�DateStart�Time 16:00
Street�Name PM�Total�Intersection�Peak�Hour�VolumeStart�Time Right� Thru� Left� Right� Thru� Left� Right� Thru� Left� Right� Thru� Left� 4901
Cars 4:00�PM 0Trucks� 4:00�PM 0 PM�Total�Truck�PercentageTotal 4:00�PM 1 495 4 4 1 59 8 437 0 7 1 0 1017 #DIV/0!Cars 4:15�PM 0
Trucks� 4:15�PM 0 PM�Intersection�PHFTotal 4:15�PM 1 509 7 12 0 64 43 530 4 38 0 18 1226 0.96Cars 4:30�PM 0
Trucks� 4:30�PM 0Total 4:30�PM 1 530 7 15 1 72 10 467 21 104 0 42 1270Cars 4:45�PM 0
Trucks� 4:45�PM 0Total 4:45�PM 3 487 13 23 1 65 4 431 19 107 0 70 1223Cars 5:00�PM 0
Trucks� 5:00�PM 0Total 5:00�PM 0 491 9 9 0 63 25 459 24 67 0 35 1182Cars 5:15�PM 0
Trucks� 5:15�PM 0Total 5:15�PM 1 450 16 20 2 51 5 436 48 146 0 48 1223Cars 5:30�PM 0
Trucks� 5:30�PM 0Total 5:30�PM 3 391 98 14 1 37 3 401 15 70 0 41 1074Cars 5:45�PM 0
Trucks� 5:45�PM 0Total 5:45�PM 5 484 18 13 3 40 3 381 31 116 2 72 1168
Grand�Total 15 3837 172 110 9 451 101 3542 162 655 3 326 9383
2008 4:15�5:15 5 2017 36 59 2 264 82 1887 68 316 0 165 4901
Vehicles 0 0 0 0 0 0 0 0 0 0 0 0 0Trucks 0 0 0 0 0 0 0 0 0 0 0 0 0
%�Trucks #DIV/0! #DIV/0! #DIV/0! #DIV/0! #DIV/0! #DIV/0! #DIV/0! #DIV/0! #DIV/0! #DIV/0! #DIV/0! #DIV/0! #DIV/0!
PHF 0.42 0.95 0.69 0.64 0.50 0.92 0.48 0.89 0.71 0.74 #DIV/0! 0.59 0.96
Growth�Rate 2.5% 2.5% 2.5% 2.5% 2.5% 2.5% 2.5% 2.5% 2.5% 2.5% 2.5% 2.5%Vehicles 10 3380 60 100 5 440 140 3160 110 530 0 280 8215
Adjustment 0 0 0 0 0 0 0 0 0 0 0 0 0Vehicles 10 3380 60 100 5 440 140 3160 110 530 0 280 8215
2035�No�Build
2035�Build
2035�No�Build
2035�Build
6/7/2007
Route�17��Southbound Falls�Run�Dr��Westbound Route�17��Northbound Commuter�Lot��EastboundTotal
6/7/2007
Route�17��Southbound Falls�Run�Dr��Westbound Route�17��Northbound Commuter�Lot��EastboundTotal
D-28

Intersection:�Route�17�/�McLane�Drive
Start�DateStart�Time 7:00
Street�Name AM�Total�Intersection�Peak�Hour�VolumeStart�Time Right� Thru� Left� Right� Thru� Left� Right� Thru� Left� Right� Thru� Left� 4135
Cars 6:30�AM 0Trucks� 6:30�AM 0 AM�Total�Truck�PercentageTotal 6:30�AM 0 #DIV/0!Cars 6:45�AM 0
Trucks� 6:45�AM 0 AM�Intersection�PHFTotal 6:45�AM 0 0.85Cars 7:00�AM 0
Trucks� 7:00�AM 0Total 7:00�AM 9 582 5 3 0 11 8 317 2 0 0 0 937Cars 7:15�AM 0
Trucks� 7:15�AM 0Total 7:15�AM 8 631 9 4 0 2 5 340 2 1 2 5 1009Cars 7:30�AM 0
Trucks� 7:30�AM 0Total 7:30�AM 12 734 4 6 0 9 7 433 3 2 4 7 1221Cars 7:45�AM 0
Trucks� 7:45�AM 0Total 7:45�AM 8 721 15 4 1 6 5 416 2 3 2 4 1187Cars 8:00�AM 0
Trucks� 8:00�AM 0Total 8:00�AM 3 687 5 0 0 5 10 428 3 0 1 3 1145Cars 8:15�AM 0
Trucks� 8:15�AM 0Total 8:15�AM 2 545 2 2 0 12 11 435 7 1 1 3 1021
Grand�Total 42 3900 40 19 1 45 46 2369 19 7 10 22 6520
2008 7:30�8:30 25 1770* 26 12 1 32 33 2190* 15 6 8 17 4135*Adjusted�to�balance��between�adjacent�intersections
Vehicles 0 0 0 0 0 0 0 0 0 0 0 0 0Trucks 0 0 0 0 0 0 0 0 0 0 0 0 0
%�Trucks #DIV/0! #DIV/0! #DIV/0! #DIV/0! #DIV/0! #DIV/0! #DIV/0! #DIV/0! #DIV/0! #DIV/0! #DIV/0! #DIV/0! #DIV/0!
PHF 0.52 0.92 0.43 0.50 0.25 0.67 0.75 0.98 0.54 0.50 0.50 0.61 0.85
Growth�Rate 2.5% 2.5% 2.5% 2.5% 2.5% 2.5% 2.5% 2.5% 2.5% 2.5% 2.5% 2.5%Vehicles 40 2960 40 20 5 50 60 3670 30 10 10 30 6925
Adjustment 0 0 0 0 0 0 0 0 0 0 0 0 0Vehicles 40 2960 40 20 5 50 60 3670 30 10 10 30 6925
Start�DateStart�Time 16:00
Street�Name PM�Total�Intersection�Peak�Hour�VolumeStart�Time Right� Thru� Left� Right� Thru� Left� Right� Thru� Left� Right� Thru� Left� 4657
Cars 4:00�PM 0Trucks� 4:00�PM 0 PM�Total�Truck�PercentageTotal 4:00�PM 4 554 5 3 0 7 2 424 0 2 0 3 1004 #DIV/0!Cars 4:15�PM 0
Trucks� 4:15�PM 0 PM�Intersection�PHFTotal 4:15�PM 2 451 3 0 0 6 2 642 2 0 0 1 1109 0.95Cars 4:30�PM 0
Trucks� 4:30�PM 0Total 4:30�PM 3 521 5 3 0 18 5 685 2 0 0 1 1243Cars 4:45�PM 0
Trucks� 4:45�PM 0Total 4:45�PM 3 448 3 1 0 3 3 560 2 2 1 3 1029Cars 5:00�PM 0
Trucks� 5:00�PM 0Total 5:00�PM 3 513 3 7 2 11 6 581 2 0 0 5 1133Cars 5:15�PM 0
Trucks� 5:15�PM 0Total 5:15�PM 2 535 4 6 1 15 5 565 3 1 0 0 1137Cars 5:30�PM 0
Trucks� 5:30�PM 0Total 5:30�PM 10 671 1 2 0 8 1 521 2 6 0 1 1223Cars 5:45�PM 0
Trucks� 5:45�PM 0Total 5:45�PM 5 602 2 2 1 4 3 539 2 0 1 3 1164
Grand�Total 32 4295 26 24 4 72 27 4517 15 11 2 17 9042
2008 5:00�6:00 20 2321 10 17 4 38 15 2206 9 7 1 9 4657
Vehicles 0 0 0 0 0 0 0 0 0 0 0 0 0Trucks 0 0 0 0 0 0 0 0 0 0 0 0 0
%�Trucks #DIV/0! #DIV/0! #DIV/0! #DIV/0! #DIV/0! #DIV/0! #DIV/0! #DIV/0! #DIV/0! #DIV/0! #DIV/0! #DIV/0! #DIV/0!
PHF 0.50 0.86 0.63 0.61 0.50 0.63 0.63 0.95 0.75 0.29 0.25 0.45 0.95
Growth�Rate 2.5% 2.5% 2.5% 2.5% 2.5% 2.5% 2.5% 2.5% 2.5% 2.5% 2.5% 2.5%Vehicles 30 3890 20 30 10 60 30 3700 20 10 5 20 7825
Adjustment 0 0 0 0 0 0 0 0 0 0 0 0 0Vehicles 30 3890 20 30 10 60 30 3700 20 10 5 20 7825
McLane�Dr��Westbound Route�17��Northbound Hardee's�Access��EastboundTotal
Route�17��Southbound McLane�Dr��Westbound Route�17��Northbound Hardee's�Access��EastboundTotal
2035�No�Build
2035�Build
2035�No�Build
2035�Build
7/17/2007
Route�17��Southbound
7/17/2007
D-29

Intersection:�Route�17�/�Sanford�Drive
Start�DateStart�Time 7:00
Street�Name AM�Total�Intersection�Peak�Hour�VolumeStart�Time Right� Thru� Left� Right� Thru� Left� Right� Thru� Left� Right� Thru� Left� 4844
Cars 6:30�AM 0Trucks� 6:30�AM 0 AM�Total�Truck�PercentageTotal 6:30�AM 0 #DIV/0!Cars 6:45�AM 0
Trucks� 6:45�AM 0 AM�Intersection�PHFTotal 6:45�AM 0 0.95Cars 7:00�AM 0
Trucks� 7:00�AM 0Total 7:00�AM 3 466 2 6 2 12 23 522 52 39 1 14 1142Cars 7:15�AM 0
Trucks� 7:15�AM 0Total 7:15�AM 5 445 1 3 7 16 15 552 63 39 3 12 1161Cars 7:30�AM 0
Trucks� 7:30�AM 0Total 7:30�AM 7 463 4 3 28 9 41 538 105 60 0 11 1269Cars 7:45�AM 0
Trucks� 7:45�AM 0Total 7:45�AM 5 449 4 3 24 7 32 560 67 105 1 15 1272Cars 8:00�AM 0
Trucks� 8:00�AM 0Total 8:00�AM 6 428 1 7 8 9 28 549 61 32 1 1 1131Cars 8:15�AM 0
Trucks� 8:15�AM 0Total 8:15�AM 12 459 2 0 7 11 16 421 48 40 1 10 1027
Grand�Total 38 2710 14 22 76 64 155 3142 396 315 7 63 7002
2008 7:00�8:00 20 1823 11 15 61 44 111 2172 287 243 5 52 4844
Vehicles 0 0 0 0 0 0 0 0 0 0 0 0 0Trucks 0 0 0 0 0 0 0 0 0 0 0 0 0
%�Trucks #DIV/0! #DIV/0! #DIV/0! #DIV/0! #DIV/0! #DIV/0! #DIV/0! #DIV/0! #DIV/0! #DIV/0! #DIV/0! #DIV/0! #DIV/0!
PHF 0.71 0.98 0.69 0.63 0.54 0.69 0.68 0.97 0.68 0.58 0.42 0.87 0.95
2008�Balanced* 7:00�8:00 20 1807 11 15 61 44 113 2208 292 241 5 52 4869*�Intersection�volumes�adjsuted�to�balance�volumes�across�the�Route�17�Interchange�(See�interchange�balancing�worksheet)
Growth�Rate 2.5% 2.5% 2.5% 2.5% 2.5% 2.5% 2.5% 2.5% 2.5% 2.5% 2.5% 2.5%Vehicles 30 3030 20 30 100 70 190 3700 490 400 10 90 8160
7:00�8:00 30 2950 20 30 100 70 190 3620 480 390 10 90 7980*�Intersection�volumes�adjusted�to�balance�volumes�across�the�Route�17�Interchange�(See�interchange�balancing�worksheet
Adjustment 0 0 0 0 0 0 0 0 0 0 0 0Vehicles 30 2950 20 30 100 70 190 3620 480 390 10 90 7980
7:00�8:00 30 2950 20 30 100 70 190 3640 480 390 10 90 8000*�Intersection�volumes�adjusted�to�balance�volumes�across�the�Route�17�Interchange�(See�interchange�balancing�worksheet
Start�DateStart�Time 16:00
Street�Name PM�Total�Intersection�Peak�Hour�VolumeStart�Time Right� Thru� Left� Right� Thru� Left� Right� Thru� Left� Right� Thru� Left� 5600
Cars 4:00�PM 0Trucks� 4:00�PM 0 PM�Total�Truck�PercentageTotal 4:00�PM 6 603 1 4 5 28 16 498 29 81 5 25 1301 #DIV/0!Cars 4:15�PM 0
Trucks� 4:15�PM 0 PM�Intersection�PHFTotal 4:15�PM 7 621 1 0 3 12 21 445 20 141 0 11 1282 0.94Cars 4:30�PM 0
Trucks� 4:30�PM 0Total 4:30�PM 6 589 0 2 3 12 13 476 43 161 2 7 1314Cars 4:45�PM 0
Trucks� 4:45�PM 0Total 4:45�PM 7 593 3 1 2 21 14 454 66 319 1 1 1482Cars 5:00�PM 0
Trucks� 5:00�PM 0Total 5:00�PM 7 639 1 0 5 10 26 424 84 184 2 13 1395Cars 5:15�PM 0
Trucks� 5:15�PM 0Total 5:15�PM 17 579 1 3 6 26 22 449 58 147 0 6 1314Cars 5:30�PM 0
Trucks� 5:30�PM 0Total 5:30�PM 13 558 1 2 6 13 18 452 111 222 1 12 1409Cars 5:45�PM 0
Trucks� 5:45�PM 0Total 5:45�PM 7 491 0 0 7 13 29 429 49 99 0 6 1130
Grand�Total 70 4673 8 12 37 135 159 3627 460 1354 11 81 10627
2008 4:45�5:45 44 2369 6 6 19 70 80 1779 319 872 4 32 5600
Vehicles 0 0 0 0 0 0 0 0 0 0 0 0 0Trucks 0 0 0 0 0 0 0 0 0 0 0 0 0
%�Trucks #DIV/0! #DIV/0! #DIV/0! #DIV/0! #DIV/0! #DIV/0! #DIV/0! #DIV/0! #DIV/0! #DIV/0! #DIV/0! #DIV/0! #DIV/0!
PHF 0.65 0.93 0.50 0.50 0.79 0.67 0.77 0.98 0.72 0.68 0.50 0.62 0.94
2008�Balanced* 4:45�5:45 44 2255 6 6 19 67 81 1807 324 830 4 32 5475*�Intersection�volumes�adjsuted�to�balance�volumes�across�the�Route�17�Interchange�(See�interchange�balancing�worksheet)
Growth�Rate 2.5% 2.5% 2.5% 2.5% 2.5% 2.5% 2.5% 2.5% 2.5% 2.5% 2.5% 2.5%Vehicles 70 3780 10 10 30 110 140 3030 540 1390 10 50 9170
4:45�5:45 70 3660 10 10 30 110 140 2960 530 1350 10 50 8930*�Intersection�volumes�adjusted�to�balance�volumes�across�the�Route�17�Interchange�(See�interchange�balancing�worksheet
Adjustment 0 0 0 0 0 0 0 0 0 0 0 0Vehicles 70 3660 10 10 30 110 140 2960 530 1350 10 50 8930
4:45�5:45 70 3660 10 10 30 110 140 2940 530 1350 10 50 8910*�Intersection�volumes�adjusted�to�balance�volumes�across�the�Route�17�Interchange�(See�interchange�balancing�worksheet
Sanford�Dr��Westbound Route�17��Northbound Sanford�Dr��EastboundTotal
Sanford�Dr��Westbound Route�17��Northbound Sanford�Dr��EastboundTotal
6/6/2007
Route�17��Southbound
2035�No�Build�Balanced*
6/6/2007
Route�17��Southbound
2035�Build
2035�Build�Balanced*
2035�No�Build
2035�No�Build�Balanced*
2035�Build
2035�Build�Balanced*
2035�No�Build
D-30

Intersection:�Route�17�/�Short�Road
Start�DateStart�Time 6:30
Street�Name AM�Total�Intersection�Peak�Hour�VolumeStart�Time Right� Thru� Left� Right� Thru� Left� Right� Thru� Left� Right� Thru� Left� 2377
Cars 6:30�AM 1 0 1 0 268 1 4 0 25 10 169 1 480Trucks� 6:30�AM 0 0 0 0 2 0 0 0 1 0 6 0 9 AM�Total�Truck�PercentageTotal 6:30�AM 1 0 1 0 270 1 4 0 26 10 175 1 489 2.6%Cars 6:45�AM 5 0 2 1 273 3 4 0 28 14 214 1 545
Trucks� 6:45�AM 0 0 0 0 2 0 1 0 1 0 5 0 9 AM�Intersection�PHFTotal 6:45�AM 5 0 2 1 275 3 5 0 29 14 219 1 554 0.92Cars 7:00�AM 2 0 0 2 255 3 3 0 28 14 177 1 485
Trucks� 7:00�AM 0 0 0 0 7 0 0 0 1 0 7 0 15Total 7:00�AM 2 0 0 2 262 3 3 0 29 14 184 1 500Cars 7:15�AM 3 0 2 0 301 3 3 0 20 13 216 2 563
Trucks� 7:15�AM 0 0 0 0 5 0 0 0 1 1 8 0 15Total 7:15�AM 3 0 2 0 306 3 3 0 21 14 224 2 578Cars 7:30�AM 4 0 0 1 307 3 5 0 24 10 254 3 611
Trucks� 7:30�AM 0 0 0 0 4 0 0 0 2 0 8 1 15Total 7:30�AM 4 0 0 1 311 3 5 0 26 10 262 4 626Cars 7:45�AM 1 0 0 0 287 2 3 0 22 11 293 1 620
Trucks� 7:45�AM 4 0 0 0 10 0 0 0 0 0 10 1 25Total 7:45�AM 5 0 0 0 297 2 3 0 22 11 303 2 645Cars 8:00�AM 0 0 0 0 227 6 0 0 21 15 240 0 509
Trucks� 8:00�AM 0 0 0 0 11 0 0 0 1 1 6 0 19Total 8:00�AM 0 0 0 0 238 6 0 0 22 16 246 0 528Cars 8:15�AM 1 0 1 0 249 2 7 0 30 4 268 0 562
Trucks� 8:15�AM 0 0 0 0 7 0 0 0 0 0 4 0 11Total 8:15�AM 1 0 1 0 256 2 7 0 30 4 272 0 573
Grand�Total 42 0 12 8 4430 46 60 0 410 186 3770 22 8986
2008 7:15�8:15 12 0 2 1 1152 14 11 0 91 51 1035 8 2377
Vehicles 17 0 6 4 2167 23 29 0 198 91 1831 9 4375Trucks 4 0 0 0 48 0 1 0 7 2 54 2 118
%�Trucks 19.0% #DIV/0! 0.0% 0.0% 2.2% 0.0% 3.3% #DIV/0! 3.4% 2.2% 2.9% 18.2% 2.6%
PHF 0.60 #DIV/0! 0.25 0.25 0.93 1.17 0.55 #DIV/0! 0.88 0.80 0.85 0.50 0.92
2008�Balanced* 7:15�8:15 12 0 2 1 1113 14 11 0 88 52 1052 8 2353*�Intersection�volumes�adjsuted�to�balance�volumes�across�the�Route�17�Interchange�(See�interchange�balancing�worksheet)
Growth�Rate 1.5% 1.5% 1.5% 1.5% 1.5% 1.5% 1.5% 1.5% 1.5% 1.5% 1.5% 1.5%Vehicles 20 0 3 1 1560 20 20 0 120 70 1480 10 3304
7:15�8:15 20 0 5 5 1650 20 20 0 130 70 1570 10 3500*�Intersection�volumes�adjusted�to�balance�volumes�across�the�Route�17�Interchange�(See�interchange�balancing�worksheet
Adjustment 0 0 0 0 �120 0 0 0 0 0 �100 0Vehicles 20 0 5 5 1530 20 20 0 130 70 1470 10 3280
7:15�8:15 20 0 5 5 1530 20 20 0 130 70 1470 10 3280*�Intersection�volumes�adjusted�to�balance�volumes�across�the�Route�17�Interchange�(See�interchange�balancing�worksheet
Start�DateStart�Time 16:00
Street�Name PM�Total�Intersection�Peak�Hour�VolumeStart�Time Right� Thru� Left� Right� Thru� Left� Right� Thru� Left� Right� Thru� Left� 2851
Cars 4:00�PM 0 0 2 0 255 3 4 1 27 20 406 2 720Trucks� 4:00�PM 0 0 0 0 9 0 0 0 1 0 8 0 18 PM�Total�Truck�PercentageTotal 4:00�PM 0 0 2 0 264 3 4 1 28 20 414 2 738 2.1%Cars 4:15�PM 1 0 1 0 240 5 2 0 19 18 369 3 658
Trucks� 4:15�PM 0 0 0 0 2 0 0 0 0 0 12 0 14 PM�Intersection�PHFTotal 4:15�PM 1 0 1 0 242 5 2 0 19 18 381 3 672 0.96Cars 4:30�PM 1 0 0 0 257 4 6 0 17 25 362 1 673
Trucks� 4:30�PM 0 0 0 0 3 0 0 0 2 0 10 0 15Total 4:30�PM 1 0 0 0 260 4 6 0 19 25 372 1 688Cars 4:45�PM 1 0 0 0 233 0 1 1 28 17 387 1 669
Trucks� 4:45�PM 0 0 0 0 5 1 0 0 0 0 9 0 15Total 4:45�PM 1 0 0 0 238 1 1 1 28 17 396 1 684Cars 5:00�PM 1 1 1 1 240 4 9 0 13 22 429 2 723
Trucks� 5:00�PM 0 0 0 0 4 0 0 0 0 2 11 0 17Total 5:00�PM 1 1 1 1 244 4 9 0 13 24 440 2 740Cars 5:15�PM 2 0 0 0 284 3 10 1 13 13 380 1 707
Trucks� 5:15�PM 0 0 0 0 2 0 0 0 0 1 9 0 12Total 5:15�PM 2 0 0 0 286 3 10 1 13 14 389 1 719Cars 5:30�PM 3 0 1 0 247 3 6 0 20 15 403 1 699
Trucks� 5:30�PM 0 0 0 0 1 0 0 0 0 0 8 0 9Total 5:30�PM 3 0 1 0 248 3 6 0 20 15 411 1 708Cars 5:45�PM 3 1 3 1 208 6 5 1 22 23 346 3 622
Trucks� 5:45�PM 0 0 0 0 5 0 0 0 0 1 9 0 15Total 5:45�PM 3 1 3 1 213 6 5 1 22 24 355 3 637
Grand�Total 24 4 16 4 3990 58 86 8 324 314 6316 28 11172
2008 4:45�5:45 7 1 2 1 1016 11 26 2 74 70 1636 5 2851
Vehicles 12 2 8 2 1964 28 43 4 159 153 3082 14 5471Trucks 0 0 0 0 31 1 0 0 3 4 76 0 115
%�Trucks 0.0% 0.0% 0.0% 0.0% 1.6% 3.4% 0.0% 0.0% 1.9% 2.5% 2.4% 0.0% 2.1%
PHF 0.58 0.25 0.50 0.25 0.89 0.69 0.65 0.50 0.66 0.73 0.93 0.63 0.96
2008�Balanced* 4:45�5:45 7 1 2 1 984 11 26 2 72 77 1789 5 2977*�Intersection�volumes�adjsuted�to�balance�volumes�across�the�Route�17�Interchange�(See�interchange�balancing�worksheet)
Growth�Rate 1.5% 1.5% 1.5% 1.5% 1.5% 1.5% 1.5% 1.5% 1.5% 1.5% 1.5% 1.5%Vehicles 10 5 5 5 1380 20 40 5 100 110 2510 10 4200
4:45�5:45 10 5 5 5 1450 20 40 5 110 120 2670 10 4450*�Intersection�volumes�adjusted�to�balance�volumes�across�the�Route�17�Interchange�(See�interchange�balancing�worksheet
Adjustment 0 0 0 0 �70 0 0 0 0 0 �150 0Vehicles 10 5 5 5 1380 20 40 5 110 120 2520 10
4:45�5:45 10 5 5 5 1380 20 40 5 110 120 2520 10 4230*�Intersection�volumes�adjusted�to�balance�volumes�across�the�Route�17�Interchange�(See�interchange�balancing�worksheet
2035�No�Build
2035�No�Build
5/14/2008
Short�Road��Southbound
2035�Build
2035�Build�Balanced*
2035�No�Build�Balanced*
2035�Build
2035�Build�Balanced*
5/14/2008
Short�Road��Southbound
2035�No�Build�Balanced*
Route�17��Westbound Short�Road��Northbound Route�17��EastboundTotal
Route�17��Westbound Short�Road��Northbound Route�17��EastboundTotal
D-31

Capacity Analysis Output
I-95 Mainline, C-D Road, Ramp Junctions
I-95 Northbound Mainline Analysis – AM & PM Peak HourI-95 Southbound Mainline Analysis – AM & PM Peak HourI-95 Northbound Ramp Junctions AM & PM Peak HoursI-95 Southbound Ramp Junctions AM & PM Peak Hours
Route 3 and Route 17 Intersections
2035 No-Build HCS+ Intersection Analysis Summary2035 No-Build Conditions HCS+ Output - AM & PM Peak Hour
Connector Road
Route 3 / Connector Road Interchange
D-32

I-95 Mainline, C-D Road, and Ramp
D-33


BASIC FREEWAY SEGMENTS WORKSHEET
General Information Site Information Analyst JM Highway/Direction of Travel NBAgency or Company Michael Baker Jr, Inc. From/To I-95 s/o Route 3 Interchange Date Performed 7-7-10 Jurisdiction MS-1 Analysis Time Period AM Peak Analysis Year 2035 N5 Full Interchange Project Description Fampo Radco/I-95 Transportation Analysis
Oper.(LOS)������ Des.(N)����� Planning Data �����
Flow InputsVolume, V 3040 veh/h Peak-Hour Factor, PHF 0.94 AADT veh/day %Trucks and Buses, PT 13 Peak-Hr Prop. of AADT, K %RVs, PR 0Peak-Hr Direction Prop, D General Terrain: Rolling DDHV = AADT x K x D veh/h Grade % Length mi Driver type adjustment 1.00 Up/Down %Calculate Flow Adjustments fp 1.00 ER 2.0
ET 2.5 fHV = 1/[1+PT(ET - 1) + PR(ER - 1)] 0.837
Speed Inputs Calc Speed Adj and FFSLane Width 12.0 ftRt-Shoulder Lat. Clearance 6.0 ftInterchange Density 0.50 I/mi Number of Lanes, N 3FFS (measured) mi/h Base free-flow Speed, BFFS 70.0 mi/h
fLW 0.0 mi/h fLC 0.0 mi/h fID 0.0 mi/h
fN 3.0 mi/h
FFS 67.0 mi/h
LOS and Performance Measures Design (N)
Operational (LOS)vp = (V or DDHV) / (PHF x N x fHV x fp)
1288 pc/h/ln
S 67.0 mi/h D = vp / S 19.2 pc/mi/ln LOS C
Design (N) Design LOSvp = (V or DDHV) / (PHF x N x fHV x fp)
pc/h
S mi/h D = vp / S pc/mi/ln Required Number of Lanes, N
Glossary Factor LocationN - Number of lanes S - SpeedV - Hourly volume D - Densityvp - Flow rate FFS - Free-flow speedLOS - Level of service BFFS - Base free-flow speedDDHV - Directional design hour volume
ER - Exhibits23-8, 23-10 fLW - Exhibit 23-4ET - Exhibits 23-8, 23-10, 23-11 fLC - Exhibit 23-5fp - Page 23-12 fN - Exhibit 23-6LOS, S, FFS, vp - Exhibits 23-2, 23-3 fID - Exhibit 23-7
Copyright © 2005 University of Florida, All Rights Reserved HCS+TM Version 5.21 Generated: 7/9/2010 9:04 AM
Page 1 of 1BASIC FREEWAY WORKSHEET
7/9/2010file://C:\Documents and Settings\JMasinick\Local Settings\Temp\f2k21A9.tmp
D-34

BASIC FREEWAY SEGMENTS WORKSHEET
General Information Site Information Analyst JM Highway/Direction of Travel NBAgency or Company Michael Baker Jr, Inc. From/To I-95 s/o Route 3 Interchange Date Performed 7-7-10 Jurisdiction MS-1 Analysis Time Period PM Peak Analysis Year 2035 N5 Full Interchange Project Description Fampo Radco/I-95 Transportation Analysis
Oper.(LOS)������ Des.(N)����� Planning Data �����
Flow InputsVolume, V 5200 veh/h Peak-Hour Factor, PHF 0.98 AADT veh/day %Trucks and Buses, PT 12 Peak-Hr Prop. of AADT, K %RVs, PR 0Peak-Hr Direction Prop, D General Terrain: Rolling DDHV = AADT x K x D veh/h Grade % Length mi Driver type adjustment 1.00 Up/Down %Calculate Flow Adjustments fp 1.00 ER 2.0
ET 2.5 fHV = 1/[1+PT(ET - 1) + PR(ER - 1)] 0.847
Speed Inputs Calc Speed Adj and FFSLane Width 12.0 ftRt-Shoulder Lat. Clearance 6.0 ftInterchange Density 0.50 I/mi Number of Lanes, N 3FFS (measured) mi/h Base free-flow Speed, BFFS 70.0 mi/h
fLW 0.0 mi/h fLC 0.0 mi/h fID 0.0 mi/h
fN 3.0 mi/h
FFS 67.0 mi/h
LOS and Performance Measures Design (N)
Operational (LOS)vp = (V or DDHV) / (PHF x N x fHV x fp)
2087 pc/h/ln
S 61.1 mi/h D = vp / S 34.2 pc/mi/ln LOS D
Design (N) Design LOSvp = (V or DDHV) / (PHF x N x fHV x fp)
pc/h
S mi/h D = vp / S pc/mi/ln Required Number of Lanes, N
Glossary Factor LocationN - Number of lanes S - SpeedV - Hourly volume D - Densityvp - Flow rate FFS - Free-flow speedLOS - Level of service BFFS - Base free-flow speedDDHV - Directional design hour volume
ER - Exhibits23-8, 23-10 fLW - Exhibit 23-4ET - Exhibits 23-8, 23-10, 23-11 fLC - Exhibit 23-5fp - Page 23-12 fN - Exhibit 23-6LOS, S, FFS, vp - Exhibits 23-2, 23-3 fID - Exhibit 23-7
Copyright © 2005 University of Florida, All Rights Reserved HCS+TM Version 5.21 Generated: 7/9/2010 9:04 AM
Page 1 of 1BASIC FREEWAY WORKSHEET
7/9/2010file://C:\Documents and Settings\JMasinick\Local Settings\Temp\f2k21AE.tmp
D-35

BASIC FREEWAY SEGMENTS WORKSHEET
General Information Site Information Analyst JM Highway/Direction of Travel SB I-95 Agency or Company Michael Baker Jr, Inc. From/To s/o Route 3 Interchange Date Performed 7-7-10 Jurisdiction MS-1 Analysis Time Period AM Peak Analysis Year 2035 N5 Full Interchange Project Description Fampo Radco/I-95 Transportation Analysis
Oper.(LOS)������ Des.(N)����� Planning Data �����
Flow InputsVolume, V 3530 veh/h Peak-Hour Factor, PHF 0.93 AADT veh/day %Trucks and Buses, PT 18 Peak-Hr Prop. of AADT, K %RVs, PR 0Peak-Hr Direction Prop, D General Terrain: Rolling DDHV = AADT x K x D veh/h Grade % Length mi Driver type adjustment 1.00 Up/Down %Calculate Flow Adjustments fp 1.00 ER 2.0
ET 2.5 fHV = 1/[1+PT(ET - 1) + PR(ER - 1)] 0.787
Speed Inputs Calc Speed Adj and FFSLane Width 12.0 ftRt-Shoulder Lat. Clearance 6.0 ftInterchange Density 0.50 I/mi Number of Lanes, N 3FFS (measured) mi/h Base free-flow Speed, BFFS 70.0 mi/h
fLW 0.0 mi/h fLC 0.0 mi/h fID 0.0 mi/h
fN 3.0 mi/h
FFS 67.0 mi/h
LOS and Performance Measures Design (N)
Operational (LOS)vp = (V or DDHV) / (PHF x N x fHV x fp)
1607 pc/h/ln
S 66.7 mi/h D = vp / S 24.1 pc/mi/ln LOS C
Design (N) Design LOSvp = (V or DDHV) / (PHF x N x fHV x fp)
pc/h
S mi/h D = vp / S pc/mi/ln Required Number of Lanes, N
Glossary Factor LocationN - Number of lanes S - SpeedV - Hourly volume D - Densityvp - Flow rate FFS - Free-flow speedLOS - Level of service BFFS - Base free-flow speedDDHV - Directional design hour volume
ER - Exhibits23-8, 23-10 fLW - Exhibit 23-4ET - Exhibits 23-8, 23-10, 23-11 fLC - Exhibit 23-5fp - Page 23-12 fN - Exhibit 23-6LOS, S, FFS, vp - Exhibits 23-2, 23-3 fID - Exhibit 23-7
Copyright © 2005 University of Florida, All Rights Reserved HCS+TM Version 5.21 Generated: 7/9/2010 9:11 AM
Page 1 of 1BASIC FREEWAY WORKSHEET
7/9/2010file://C:\Documents and Settings\JMasinick\Local Settings\Temp\f2k21B6.tmp
D-36

BASIC FREEWAY SEGMENTS WORKSHEET
General Information Site Information Analyst JM Highway/Direction of Travel SB I-95 Agency or Company Michael Baker Jr, Inc. From/To s/o Route 3 Interchange Date Performed 7-7-10 Jurisdiction MS-1 Analysis Time Period PM Peak Analysis Year 2035 N5 Full Interchange Project Description Fampo Radco/I-95 Transportation Analysis
Oper.(LOS)������ Des.(N)����� Planning Data �����
Flow InputsVolume, V 4190 veh/h Peak-Hour Factor, PHF 0.96 AADT veh/day %Trucks and Buses, PT 13 Peak-Hr Prop. of AADT, K %RVs, PR 0Peak-Hr Direction Prop, D General Terrain: Rolling DDHV = AADT x K x D veh/h Grade % Length mi Driver type adjustment 1.00 Up/Down %Calculate Flow Adjustments fp 1.00 ER 2.0
ET 2.5 fHV = 1/[1+PT(ET - 1) + PR(ER - 1)] 0.837
Speed Inputs Calc Speed Adj and FFSLane Width 12.0 ftRt-Shoulder Lat. Clearance 6.0 ftInterchange Density 0.50 I/mi Number of Lanes, N 3FFS (measured) mi/h Base free-flow Speed, BFFS 70.0 mi/h
fLW 0.0 mi/h fLC 0.0 mi/h fID 0.0 mi/h
fN 3.0 mi/h
FFS 67.0 mi/h
LOS and Performance Measures Design (N)
Operational (LOS)vp = (V or DDHV) / (PHF x N x fHV x fp)
1739 pc/h/ln
S 66.0 mi/h D = vp / S 26.3 pc/mi/ln LOS D
Design (N) Design LOSvp = (V or DDHV) / (PHF x N x fHV x fp)
pc/h
S mi/h D = vp / S pc/mi/ln Required Number of Lanes, N
Glossary Factor LocationN - Number of lanes S - SpeedV - Hourly volume D - Densityvp - Flow rate FFS - Free-flow speedLOS - Level of service BFFS - Base free-flow speedDDHV - Directional design hour volume
ER - Exhibits23-8, 23-10 fLW - Exhibit 23-4ET - Exhibits 23-8, 23-10, 23-11 fLC - Exhibit 23-5fp - Page 23-12 fN - Exhibit 23-6LOS, S, FFS, vp - Exhibits 23-2, 23-3 fID - Exhibit 23-7
Copyright © 2005 University of Florida, All Rights Reserved HCS+TM Version 5.21 Generated: 7/9/2010 9:11 AM
Page 1 of 1BASIC FREEWAY WORKSHEET
7/9/2010file://C:\Documents and Settings\JMasinick\Local Settings\Temp\f2k21BB.tmp
D-37

BASIC FREEWAY SEGMENTS WORKSHEET
General Information Site Information Analyst JM Highway/Direction of Travel NBAgency or Company Michael Baker Jr, Inc. From/To I-95 n/o Route 3 Interchange Date Performed 03-02-10 Jurisdiction MS-2 Analysis Time Period AM Peak Analysis Year 2035 N5 Full Interchange Project Description Fampo Radco/I-95 Transportation Analysis
Oper.(LOS)������ Des.(N)����� Planning Data �����
Flow InputsVolume, V 4870 veh/h Peak-Hour Factor, PHF 0.94 AADT veh/day %Trucks and Buses, PT 13 Peak-Hr Prop. of AADT, K %RVs, PR 0Peak-Hr Direction Prop, D General Terrain: Rolling DDHV = AADT x K x D veh/h Grade % Length mi Driver type adjustment 1.00 Up/Down %Calculate Flow Adjustments fp 1.00 ER 2.0
ET 2.5 fHV = 1/[1+PT(ET - 1) + PR(ER - 1)] 0.837
Speed Inputs Calc Speed Adj and FFSLane Width 12.0 ftRt-Shoulder Lat. Clearance 6.0 ftInterchange Density 0.50 I/mi Number of Lanes, N 3FFS (measured) mi/h Base free-flow Speed, BFFS 70.0 mi/h
fLW 0.0 mi/h fLC 0.0 mi/h fID 0.0 mi/h
fN 0.0 mi/h
FFS 70.0 mi/h
LOS and Performance Measures Design (N)
Operational (LOS)vp = (V or DDHV) / (PHF x N x fHV x fp)
2064 pc/h/ln
S 63.5 mi/h D = vp / S 32.5 pc/mi/ln LOS D
Design (N) Design LOSvp = (V or DDHV) / (PHF x N x fHV x fp)
pc/h
S mi/h D = vp / S pc/mi/ln Required Number of Lanes, N
Glossary Factor LocationN - Number of lanes S - SpeedV - Hourly volume D - Densityvp - Flow rate FFS - Free-flow speedLOS - Level of service BFFS - Base free-flow speedDDHV - Directional design hour volume
ER - Exhibits23-8, 23-10 fLW - Exhibit 23-4ET - Exhibits 23-8, 23-10, 23-11 fLC - Exhibit 23-5fp - Page 23-12 fN - Exhibit 23-6LOS, S, FFS, vp - Exhibits 23-2, 23-3 fID - Exhibit 23-7
Copyright © 2005 University of Florida, All Rights Reserved HCS+TM Version 5.21 Generated: 9/8/2010 4:49 PM
Page 1 of 1BASIC FREEWAY WORKSHEET
9/8/2010file://C:\Documents and Settings\JMasinick\Local Settings\Temp\f2k2A0.tmp
D-38

BASIC FREEWAY SEGMENTS WORKSHEET
General Information Site Information Analyst JM Highway/Direction of Travel NBAgency or Company Michael Baker Jr, Inc. From/To I-95 n/o Route 3 Interchange Date Performed 03-02-10 Jurisdiction MS-2 Analysis Time Period PM Peak Analysis Year 2035 N5 Full Interchange Project Description Fampo Radco/I-95 Transportation Analysis
Oper.(LOS)������ Des.(N)����� Planning Data �����
Flow InputsVolume, V 5640 veh/h Peak-Hour Factor, PHF 0.97 AADT veh/day %Trucks and Buses, PT 12 Peak-Hr Prop. of AADT, K %RVs, PR 0Peak-Hr Direction Prop, D General Terrain: Rolling DDHV = AADT x K x D veh/h Grade % Length mi Driver type adjustment 1.00 Up/Down %Calculate Flow Adjustments fp 1.00 ER 2.0
ET 2.5 fHV = 1/[1+PT(ET - 1) + PR(ER - 1)] 0.847
Speed Inputs Calc Speed Adj and FFSLane Width 12.0 ftRt-Shoulder Lat. Clearance 6.0 ftInterchange Density 0.50 I/mi Number of Lanes, N 3FFS (measured) mi/h Base free-flow Speed, BFFS 70.0 mi/h
fLW 0.0 mi/h fLC 0.0 mi/h fID 0.0 mi/h
fN 0.0 mi/h
FFS 70.0 mi/h
LOS and Performance Measures Design (N)
Operational (LOS)vp = (V or DDHV) / (PHF x N x fHV x fp)
2287 pc/h/ln
S 57.4 mi/h D = vp / S 39.8 pc/mi/ln LOS E
Design (N) Design LOSvp = (V or DDHV) / (PHF x N x fHV x fp)
pc/h
S mi/h D = vp / S pc/mi/ln Required Number of Lanes, N
Glossary Factor LocationN - Number of lanes S - SpeedV - Hourly volume D - Densityvp - Flow rate FFS - Free-flow speedLOS - Level of service BFFS - Base free-flow speedDDHV - Directional design hour volume
ER - Exhibits23-8, 23-10 fLW - Exhibit 23-4ET - Exhibits 23-8, 23-10, 23-11 fLC - Exhibit 23-5fp - Page 23-12 fN - Exhibit 23-6LOS, S, FFS, vp - Exhibits 23-2, 23-3 fID - Exhibit 23-7
Copyright © 2005 University of Florida, All Rights Reserved HCS+TM Version 5.21 Generated: 9/8/2010 4:50 PM
Page 1 of 1BASIC FREEWAY WORKSHEET
9/8/2010file://C:\Documents and Settings\JMasinick\Local Settings\Temp\f2k2A6.tmp
D-39
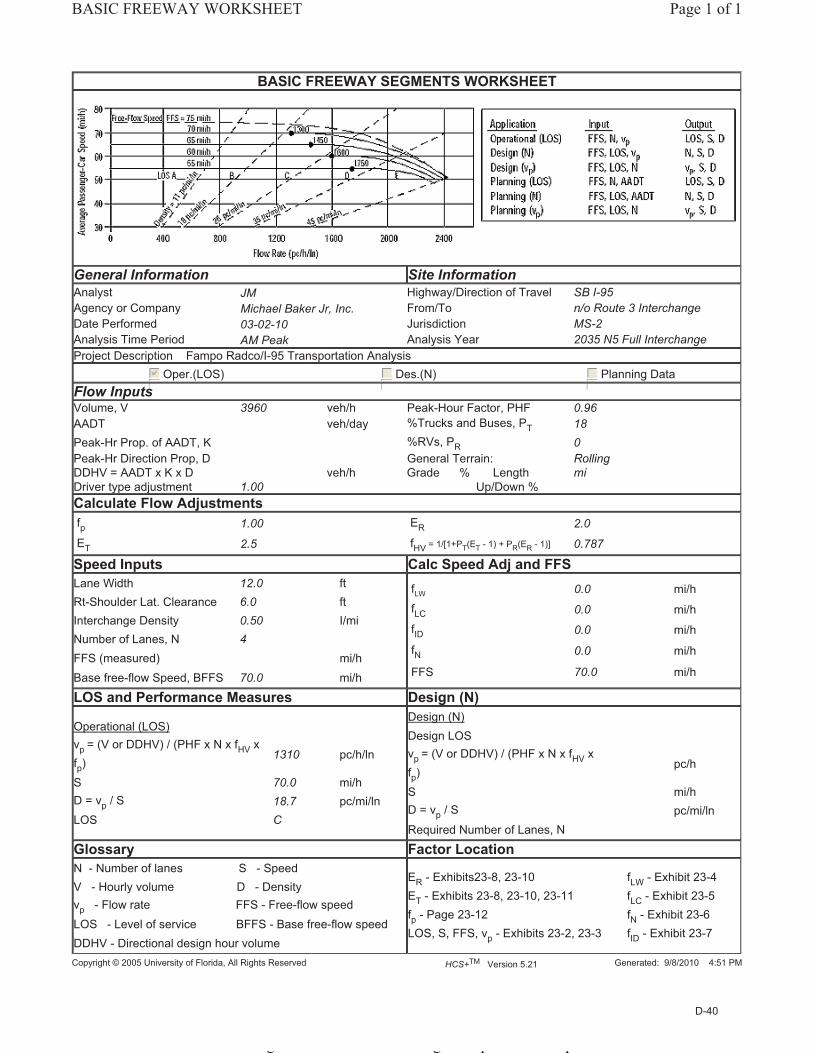
BASIC FREEWAY SEGMENTS WORKSHEET
General Information Site Information Analyst JM Highway/Direction of Travel SB I-95 Agency or Company Michael Baker Jr, Inc. From/To n/o Route 3 Interchange Date Performed 03-02-10 Jurisdiction MS-2 Analysis Time Period AM Peak Analysis Year 2035 N5 Full Interchange Project Description Fampo Radco/I-95 Transportation Analysis
Oper.(LOS)������ Des.(N)����� Planning Data �����
Flow InputsVolume, V 3960 veh/h Peak-Hour Factor, PHF 0.96 AADT veh/day %Trucks and Buses, PT 18 Peak-Hr Prop. of AADT, K %RVs, PR 0Peak-Hr Direction Prop, D General Terrain: Rolling DDHV = AADT x K x D veh/h Grade % Length mi Driver type adjustment 1.00 Up/Down %Calculate Flow Adjustments fp 1.00 ER 2.0
ET 2.5 fHV = 1/[1+PT(ET - 1) + PR(ER - 1)] 0.787
Speed Inputs Calc Speed Adj and FFSLane Width 12.0 ftRt-Shoulder Lat. Clearance 6.0 ftInterchange Density 0.50 I/mi Number of Lanes, N 4FFS (measured) mi/h Base free-flow Speed, BFFS 70.0 mi/h
fLW 0.0 mi/h fLC 0.0 mi/h fID 0.0 mi/h
fN 0.0 mi/h
FFS 70.0 mi/h
LOS and Performance Measures Design (N)
Operational (LOS)vp = (V or DDHV) / (PHF x N x fHV x fp)
1310 pc/h/ln
S 70.0 mi/h D = vp / S 18.7 pc/mi/ln LOS C
Design (N) Design LOSvp = (V or DDHV) / (PHF x N x fHV x fp)
pc/h
S mi/h D = vp / S pc/mi/ln Required Number of Lanes, N
Glossary Factor LocationN - Number of lanes S - SpeedV - Hourly volume D - Densityvp - Flow rate FFS - Free-flow speedLOS - Level of service BFFS - Base free-flow speedDDHV - Directional design hour volume
ER - Exhibits23-8, 23-10 fLW - Exhibit 23-4ET - Exhibits 23-8, 23-10, 23-11 fLC - Exhibit 23-5fp - Page 23-12 fN - Exhibit 23-6LOS, S, FFS, vp - Exhibits 23-2, 23-3 fID - Exhibit 23-7
Copyright © 2005 University of Florida, All Rights Reserved HCS+TM Version 5.21 Generated: 9/8/2010 4:51 PM
Page 1 of 1BASIC FREEWAY WORKSHEET
9/8/2010file://C:\Documents and Settings\JMasinick\Local Settings\Temp\f2k2AC.tmp
D-40

BASIC FREEWAY SEGMENTS WORKSHEET
General Information Site Information Analyst JM Highway/Direction of Travel SB I-95 Agency or Company Michael Baker Jr, Inc. From/To n/o Route 3 Interchange Date Performed 03-02-10 Jurisdiction MS-2 Analysis Time Period PM Peak Analysis Year 2035 N5 Full Interchange Project Description Fampo Radco/I-95 Transportation Analysis
Oper.(LOS)������ Des.(N)����� Planning Data �����
Flow InputsVolume, V 5630 veh/h Peak-Hour Factor, PHF 0.96 AADT veh/day %Trucks and Buses, PT 18 Peak-Hr Prop. of AADT, K %RVs, PR 0Peak-Hr Direction Prop, D General Terrain: Rolling DDHV = AADT x K x D veh/h Grade % Length mi Driver type adjustment 1.00 Up/Down %Calculate Flow Adjustments fp 1.00 ER 2.0
ET 2.5 fHV = 1/[1+PT(ET - 1) + PR(ER - 1)] 0.787
Speed Inputs Calc Speed Adj and FFSLane Width 12.0 ftRt-Shoulder Lat. Clearance 6.0 ftInterchange Density 0.50 I/mi Number of Lanes, N 4FFS (measured) mi/h Base free-flow Speed, BFFS 70.0 mi/h
fLW 0.0 mi/h fLC 0.0 mi/h fID 0.0 mi/h
fN 0.0 mi/h
FFS 70.0 mi/h
LOS and Performance Measures Design (N)
Operational (LOS)vp = (V or DDHV) / (PHF x N x fHV x fp)
1862 pc/h/ln
S 67.1 mi/h D = vp / S 27.8 pc/mi/ln LOS D
Design (N) Design LOSvp = (V or DDHV) / (PHF x N x fHV x fp)
pc/h
S mi/h D = vp / S pc/mi/ln Required Number of Lanes, N
Glossary Factor LocationN - Number of lanes S - SpeedV - Hourly volume D - Densityvp - Flow rate FFS - Free-flow speedLOS - Level of service BFFS - Base free-flow speedDDHV - Directional design hour volume
ER - Exhibits23-8, 23-10 fLW - Exhibit 23-4ET - Exhibits 23-8, 23-10, 23-11 fLC - Exhibit 23-5fp - Page 23-12 fN - Exhibit 23-6LOS, S, FFS, vp - Exhibits 23-2, 23-3 fID - Exhibit 23-7
Copyright © 2005 University of Florida, All Rights Reserved HCS+TM Version 5.21 Generated: 9/8/2010 4:51 PM
Page 1 of 1BASIC FREEWAY WORKSHEET
9/8/2010file://C:\Documents and Settings\JMasinick\Local Settings\Temp\f2k2B2.tmp
D-41
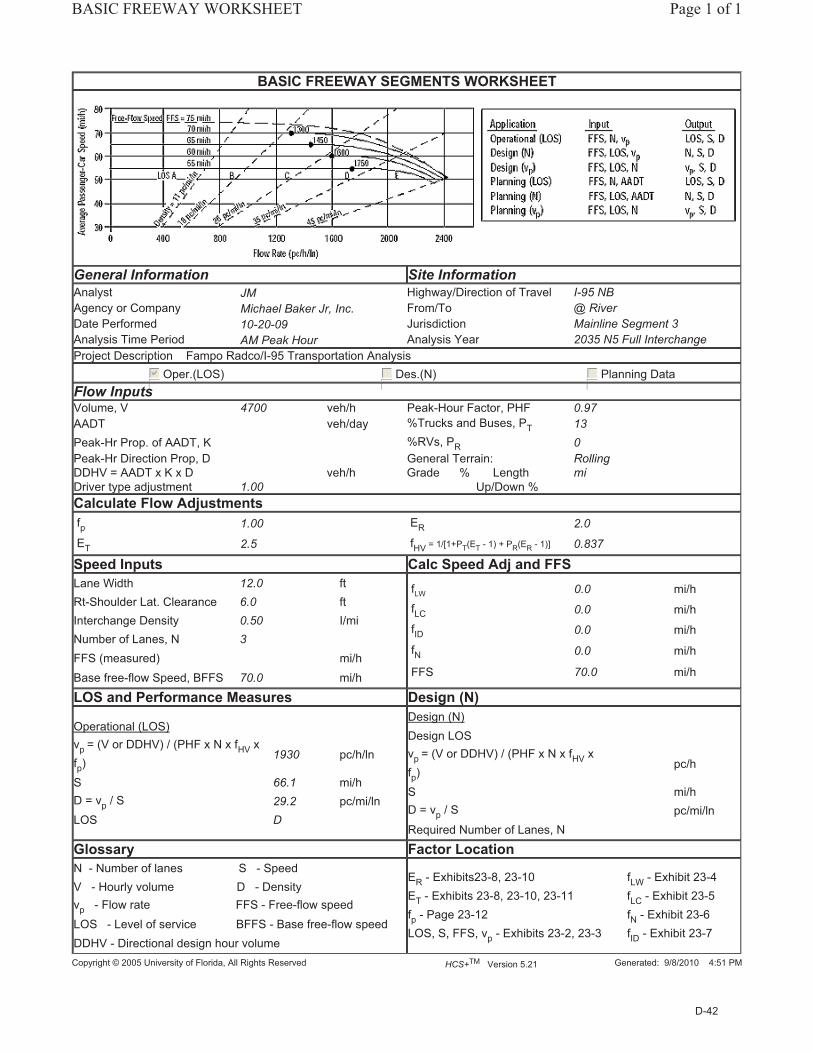
BASIC FREEWAY SEGMENTS WORKSHEET
General Information Site Information Analyst JM Highway/Direction of Travel I-95 NB Agency or Company Michael Baker Jr, Inc. From/To @ River Date Performed 10-20-09 Jurisdiction Mainline Segment 3 Analysis Time Period AM Peak Hour Analysis Year 2035 N5 Full Interchange Project Description Fampo Radco/I-95 Transportation Analysis
Oper.(LOS)������ Des.(N)����� Planning Data �����
Flow InputsVolume, V 4700 veh/h Peak-Hour Factor, PHF 0.97 AADT veh/day %Trucks and Buses, PT 13 Peak-Hr Prop. of AADT, K %RVs, PR 0Peak-Hr Direction Prop, D General Terrain: Rolling DDHV = AADT x K x D veh/h Grade % Length mi Driver type adjustment 1.00 Up/Down %Calculate Flow Adjustments fp 1.00 ER 2.0
ET 2.5 fHV = 1/[1+PT(ET - 1) + PR(ER - 1)] 0.837
Speed Inputs Calc Speed Adj and FFSLane Width 12.0 ftRt-Shoulder Lat. Clearance 6.0 ftInterchange Density 0.50 I/mi Number of Lanes, N 3FFS (measured) mi/h Base free-flow Speed, BFFS 70.0 mi/h
fLW 0.0 mi/h fLC 0.0 mi/h fID 0.0 mi/h
fN 0.0 mi/h
FFS 70.0 mi/h
LOS and Performance Measures Design (N)
Operational (LOS)vp = (V or DDHV) / (PHF x N x fHV x fp)
1930 pc/h/ln
S 66.1 mi/h D = vp / S 29.2 pc/mi/ln LOS D
Design (N) Design LOSvp = (V or DDHV) / (PHF x N x fHV x fp)
pc/h
S mi/h D = vp / S pc/mi/ln Required Number of Lanes, N
Glossary Factor LocationN - Number of lanes S - SpeedV - Hourly volume D - Densityvp - Flow rate FFS - Free-flow speedLOS - Level of service BFFS - Base free-flow speedDDHV - Directional design hour volume
ER - Exhibits23-8, 23-10 fLW - Exhibit 23-4ET - Exhibits 23-8, 23-10, 23-11 fLC - Exhibit 23-5fp - Page 23-12 fN - Exhibit 23-6LOS, S, FFS, vp - Exhibits 23-2, 23-3 fID - Exhibit 23-7
Copyright © 2005 University of Florida, All Rights Reserved HCS+TM Version 5.21 Generated: 9/8/2010 4:51 PM
Page 1 of 1BASIC FREEWAY WORKSHEET
9/8/2010file://C:\Documents and Settings\JMasinick\Local Settings\Temp\f2k2B8.tmp
D-42

BASIC FREEWAY SEGMENTS WORKSHEET
General Information Site Information Analyst JM Highway/Direction of Travel NB I-95 Agency or Company Michael Baker Jr, Inc. From/To @ River Date Performed 03-03-10 Jurisdiction Mainline Segment 3 Analysis Time Period PM Peak Hour Analysis Year 2035 N5 Full Interchange Project Description Fampo Radco/I-95 Transportation Analysis
Oper.(LOS)������ Des.(N)����� Planning Data �����
Flow InputsVolume, V 5350 veh/h Peak-Hour Factor, PHF 0.98 AADT veh/day %Trucks and Buses, PT 12 Peak-Hr Prop. of AADT, K %RVs, PR 0Peak-Hr Direction Prop, D General Terrain: Rolling DDHV = AADT x K x D veh/h Grade % Length mi Driver type adjustment 1.00 Up/Down %Calculate Flow Adjustments fp 1.00 ER 2.0
ET 2.5 fHV = 1/[1+PT(ET - 1) + PR(ER - 1)] 0.847
Speed Inputs Calc Speed Adj and FFSLane Width 12.0 ftRt-Shoulder Lat. Clearance 6.0 ftInterchange Density 0.50 I/mi Number of Lanes, N 3FFS (measured) mi/h Base free-flow Speed, BFFS 70.0 mi/h
fLW 0.0 mi/h fLC 0.0 mi/h fID 0.0 mi/h
fN 0.0 mi/h
FFS 70.0 mi/h
LOS and Performance Measures Design (N)
Operational (LOS)vp = (V or DDHV) / (PHF x N x fHV x fp)
2147 pc/h/ln
S 61.6 mi/h D = vp / S 34.9 pc/mi/ln LOS D
Design (N) Design LOSvp = (V or DDHV) / (PHF x N x fHV x fp)
pc/h
S mi/h D = vp / S pc/mi/ln Required Number of Lanes, N
Glossary Factor LocationN - Number of lanes S - SpeedV - Hourly volume D - Densityvp - Flow rate FFS - Free-flow speedLOS - Level of service BFFS - Base free-flow speedDDHV - Directional design hour volume
ER - Exhibits23-8, 23-10 fLW - Exhibit 23-4ET - Exhibits 23-8, 23-10, 23-11 fLC - Exhibit 23-5fp - Page 23-12 fN - Exhibit 23-6LOS, S, FFS, vp - Exhibits 23-2, 23-3 fID - Exhibit 23-7
Copyright © 2005 University of Florida, All Rights Reserved HCS+TM Version 5.21 Generated: 9/8/2010 4:51 PM
Page 1 of 1BASIC FREEWAY WORKSHEET
9/8/2010file://C:\Documents and Settings\JMasinick\Local Settings\Temp\f2k2BE.tmp
D-43

BASIC FREEWAY SEGMENTS WORKSHEET
General Information Site Information Analyst JM Highway/Direction of Travel I-95 SB Agency or Company Michael Baker Jr, Inc. From/To @ River Date Performed 03-05-10 Jurisdiction Mainline Segment 3 Analysis Time Period AM Peak Analysis Year 2035 N5 Full Interchange Project Description
Oper.(LOS)������ Des.(N)����� Planning Data �����
Flow InputsVolume, V 3630 veh/h Peak-Hour Factor, PHF 0.96 AADT veh/day %Trucks and Buses, PT 18 Peak-Hr Prop. of AADT, K %RVs, PR 0Peak-Hr Direction Prop, D General Terrain: Rolling DDHV = AADT x K x D veh/h Grade % Length mi Driver type adjustment 1.00 Up/Down %Calculate Flow Adjustments fp 1.00 ER 2.0
ET 2.5 fHV = 1/[1+PT(ET - 1) + PR(ER - 1)] 0.787
Speed Inputs Calc Speed Adj and FFSLane Width 12.0 ftRt-Shoulder Lat. Clearance 6.0 ftInterchange Density 0.50 I/mi Number of Lanes, N 3FFS (measured) mi/h Base free-flow Speed, BFFS 70.0 mi/h
fLW 0.0 mi/h fLC 0.0 mi/h fID 0.0 mi/h
fN 0.0 mi/h
FFS 70.0 mi/h
LOS and Performance Measures Design (N)
Operational (LOS)vp = (V or DDHV) / (PHF x N x fHV x fp)
1601 pc/h/ln
S 69.4 mi/h D = vp / S 23.1 pc/mi/ln LOS C
Design (N) Design LOSvp = (V or DDHV) / (PHF x N x fHV x fp)
pc/h
S mi/h D = vp / S pc/mi/ln Required Number of Lanes, N
Glossary Factor LocationN - Number of lanes S - SpeedV - Hourly volume D - Densityvp - Flow rate FFS - Free-flow speedLOS - Level of service BFFS - Base free-flow speedDDHV - Directional design hour volume
ER - Exhibits23-8, 23-10 fLW - Exhibit 23-4ET - Exhibits 23-8, 23-10, 23-11 fLC - Exhibit 23-5fp - Page 23-12 fN - Exhibit 23-6LOS, S, FFS, vp - Exhibits 23-2, 23-3 fID - Exhibit 23-7
Copyright © 2005 University of Florida, All Rights Reserved HCS+TM Version 5.21 Generated: 9/8/2010 4:52 PM
Page 1 of 1BASIC FREEWAY WORKSHEET
9/8/2010file://C:\Documents and Settings\JMasinick\Local Settings\Temp\f2k2C4.tmp
D-44

BASIC FREEWAY SEGMENTS WORKSHEET
General Information Site Information Analyst JM Highway/Direction of Travel I-95 SB Agency or Company Michael Baker Jr, Inc. From/To @ River Date Performed 7-13-10 Jurisdiction Mainline Segment 3 Analysis Time Period PM Peak Analysis Year 2035 N5 Full Interchange Project Description Fampo Radco/I-95 Transportation Analysis
Oper.(LOS)������ Des.(N)����� Planning Data �����
Flow InputsVolume, V 4990 veh/h Peak-Hour Factor, PHF 0.97 AADT veh/day %Trucks and Buses, PT 13 Peak-Hr Prop. of AADT, K %RVs, PR 0Peak-Hr Direction Prop, D General Terrain: Rolling DDHV = AADT x K x D veh/h Grade % Length mi Driver type adjustment 1.00 Up/Down %Calculate Flow Adjustments fp 1.00 ER 2.0
ET 2.5 fHV = 1/[1+PT(ET - 1) + PR(ER - 1)] 0.837
Speed Inputs Calc Speed Adj and FFSLane Width 12.0 ftRt-Shoulder Lat. Clearance 6.0 ftInterchange Density 0.50 I/mi Number of Lanes, N 3FFS (measured) mi/h Base free-flow Speed, BFFS 70.0 mi/h
fLW 0.0 mi/h fLC 0.0 mi/h fID 0.0 mi/h
fN 0.0 mi/h
FFS 70.0 mi/h
LOS and Performance Measures Design (N)
Operational (LOS)vp = (V or DDHV) / (PHF x N x fHV x fp)
2049 pc/h/ln
S 63.9 mi/h D = vp / S 32.1 pc/mi/ln LOS D
Design (N) Design LOSvp = (V or DDHV) / (PHF x N x fHV x fp)
pc/h
S mi/h D = vp / S pc/mi/ln Required Number of Lanes, N
Glossary Factor LocationN - Number of lanes S - SpeedV - Hourly volume D - Densityvp - Flow rate FFS - Free-flow speedLOS - Level of service BFFS - Base free-flow speedDDHV - Directional design hour volume
ER - Exhibits23-8, 23-10 fLW - Exhibit 23-4ET - Exhibits 23-8, 23-10, 23-11 fLC - Exhibit 23-5fp - Page 23-12 fN - Exhibit 23-6LOS, S, FFS, vp - Exhibits 23-2, 23-3 fID - Exhibit 23-7
Copyright © 2005 University of Florida, All Rights Reserved HCS+TM Version 5.21 Generated: 9/8/2010 4:52 PM
Page 1 of 1BASIC FREEWAY WORKSHEET
9/8/2010file://C:\Documents and Settings\JMasinick\Local Settings\Temp\f2k2CA.tmp
D-45

BASIC FREEWAY SEGMENTS WORKSHEET
General Information Site Information Analyst JM Highway/Direction of Travel I-95 NB Agency or Company Michael Baker Jr, Inc. From/To n/o Route 17 Interchange Date Performed 7-7-10 Jurisdiction Mainline Segment 4 Analysis Time Period AM Peak Hour Analysis Year 2035 N5 Full Interchange Project Description Fampo Radco/I-95 Transportation Analysis
Oper.(LOS)������ Des.(N)����� Planning Data �����
Flow InputsVolume, V 6240 veh/h Peak-Hour Factor, PHF 0.92 AADT veh/day %Trucks and Buses, PT 13 Peak-Hr Prop. of AADT, K %RVs, PR 0Peak-Hr Direction Prop, D General Terrain: Rolling DDHV = AADT x K x D veh/h Grade % Length mi Driver type adjustment 1.00 Up/Down %Calculate Flow Adjustments fp 1.00 ER 2.0
ET 2.5 fHV = 1/[1+PT(ET - 1) + PR(ER - 1)] 0.837
Speed Inputs Calc Speed Adj and FFSLane Width 12.0 ftRt-Shoulder Lat. Clearance 6.0 ftInterchange Density 0.50 I/mi Number of Lanes, N 3FFS (measured) mi/h Base free-flow Speed, BFFS 70.0 mi/h
fLW 0.0 mi/h fLC 0.0 mi/h fID 0.0 mi/h
fN 3.0 mi/h
FFS 67.0 mi/h
LOS and Performance Measures Design (N)
Operational (LOS)vp = (V or DDHV) / (PHF x N x fHV x fp)
2702 pc/h/ln
S mi/h D = vp / S pc/mi/ln LOS F
Design (N) Design LOSvp = (V or DDHV) / (PHF x N x fHV x fp)
pc/h
S mi/h D = vp / S pc/mi/ln Required Number of Lanes, N
Glossary Factor LocationN - Number of lanes S - SpeedV - Hourly volume D - Densityvp - Flow rate FFS - Free-flow speedLOS - Level of service BFFS - Base free-flow speedDDHV - Directional design hour volume
ER - Exhibits23-8, 23-10 fLW - Exhibit 23-4ET - Exhibits 23-8, 23-10, 23-11 fLC - Exhibit 23-5fp - Page 23-12 fN - Exhibit 23-6LOS, S, FFS, vp - Exhibits 23-2, 23-3 fID - Exhibit 23-7
Copyright © 2005 University of Florida, All Rights Reserved HCS+TM Version 5.21 Generated: 7/9/2010 9:16 AM
Page 1 of 1BASIC FREEWAY WORKSHEET
7/9/2010file://C:\Documents and Settings\JMasinick\Local Settings\Temp\f2k21E9.tmp
D-46

BASIC FREEWAY SEGMENTS WORKSHEET
General Information Site Information Analyst JM Highway/Direction of Travel NB I-95 Agency or Company Michael Baker Jr, Inc. From/To n/o Route 17 Interchange Date Performed 7-7-10 Jurisdiction Mainline Segment 4 Analysis Time Period PM Peak Hour Analysis Year 2035 N5 Full Interchange Project Description Fampo Radco/I-95 Transportation Analysis
Oper.(LOS)������ Des.(N)����� Planning Data �����
Flow InputsVolume, V 5330 veh/h Peak-Hour Factor, PHF 0.94 AADT veh/day %Trucks and Buses, PT 12 Peak-Hr Prop. of AADT, K %RVs, PR 0Peak-Hr Direction Prop, D General Terrain: Rolling DDHV = AADT x K x D veh/h Grade % Length mi Driver type adjustment 1.00 Up/Down %Calculate Flow Adjustments fp 1.00 ER 2.0
ET 2.5 fHV = 1/[1+PT(ET - 1) + PR(ER - 1)] 0.847
Speed Inputs Calc Speed Adj and FFSLane Width 12.0 ftRt-Shoulder Lat. Clearance 6.0 ftInterchange Density 0.50 I/mi Number of Lanes, N 3FFS (measured) mi/h Base free-flow Speed, BFFS 70.0 mi/h
fLW 0.0 mi/h fLC 0.0 mi/h fID 0.0 mi/h
fN 3.0 mi/h
FFS 67.0 mi/h
LOS and Performance Measures Design (N)
Operational (LOS)vp = (V or DDHV) / (PHF x N x fHV x fp)
2230 pc/h/ln
S 57.4 mi/h D = vp / S 38.9 pc/mi/ln LOS E
Design (N) Design LOSvp = (V or DDHV) / (PHF x N x fHV x fp)
pc/h
S mi/h D = vp / S pc/mi/ln Required Number of Lanes, N
Glossary Factor LocationN - Number of lanes S - SpeedV - Hourly volume D - Densityvp - Flow rate FFS - Free-flow speedLOS - Level of service BFFS - Base free-flow speedDDHV - Directional design hour volume
ER - Exhibits23-8, 23-10 fLW - Exhibit 23-4ET - Exhibits 23-8, 23-10, 23-11 fLC - Exhibit 23-5fp - Page 23-12 fN - Exhibit 23-6LOS, S, FFS, vp - Exhibits 23-2, 23-3 fID - Exhibit 23-7
Copyright © 2005 University of Florida, All Rights Reserved HCS+TM Version 5.21 Generated: 7/9/2010 9:18 AM
Page 1 of 1BASIC FREEWAY WORKSHEET
7/9/2010file://C:\Documents and Settings\JMasinick\Local Settings\Temp\f2k21EE.tmp
D-47

BASIC FREEWAY SEGMENTS WORKSHEET
General Information Site Information Analyst JM Highway/Direction of Travel I-95 SB Agency or Company Michael Baker Jr, Inc. From/To North of US17 Date Performed 03-03-10 Jurisdiction Mainline Segment 4 Analysis Time Period AM Peak Analysis Year 2035 N5 Full Interchange Project Description I-95 Access Study
Oper.(LOS)������ Des.(N)����� Planning Data �����
Flow InputsVolume, V 4160 veh/h Peak-Hour Factor, PHF 0.96 AADT veh/day %Trucks and Buses, PT 18 Peak-Hr Prop. of AADT, K %RVs, PR 0Peak-Hr Direction Prop, D General Terrain: Rolling DDHV = AADT x K x D veh/h Grade % Length mi Driver type adjustment 1.00 Up/Down %Calculate Flow Adjustments fp 1.00 ER 2.0
ET 2.5 fHV = 1/[1+PT(ET - 1) + PR(ER - 1)] 0.787
Speed Inputs Calc Speed Adj and FFSLane Width 12.0 ftRt-Shoulder Lat. Clearance 6.0 ftInterchange Density 0.50 I/mi Number of Lanes, N 3FFS (measured) mi/h Base free-flow Speed, BFFS 70.0 mi/h
fLW 0.0 mi/h fLC 0.0 mi/h fID 0.0 mi/h
fN 3.0 mi/h
FFS 67.0 mi/h
LOS and Performance Measures Design (N)
Operational (LOS)vp = (V or DDHV) / (PHF x N x fHV x fp)
1834 pc/h/ln
S 65.2 mi/h D = vp / S 28.1 pc/mi/ln LOS D
Design (N) Design LOSvp = (V or DDHV) / (PHF x N x fHV x fp)
pc/h
S mi/h D = vp / S pc/mi/ln Required Number of Lanes, N
Glossary Factor LocationN - Number of lanes S - SpeedV - Hourly volume D - Densityvp - Flow rate FFS - Free-flow speedLOS - Level of service BFFS - Base free-flow speedDDHV - Directional design hour volume
ER - Exhibits23-8, 23-10 fLW - Exhibit 23-4ET - Exhibits 23-8, 23-10, 23-11 fLC - Exhibit 23-5fp - Page 23-12 fN - Exhibit 23-6LOS, S, FFS, vp - Exhibits 23-2, 23-3 fID - Exhibit 23-7
Copyright © 2005 University of Florida, All Rights Reserved HCS+TM Version 5.21 Generated: 7/9/2010 9:18 AM
Page 1 of 1BASIC FREEWAY WORKSHEET
7/9/2010file://C:\Documents and Settings\JMasinick\Local Settings\Temp\f2k21F3.tmp
D-48

BASIC FREEWAY SEGMENTS WORKSHEET
General Information Site Information Analyst JM Highway/Direction of Travel I-95 SB Agency or Company Michael Baker Jr, Inc. From/To North of US17 Date Performed 03-03-10 Jurisdiction Mainline Segment 4 Analysis Time Period PM Peak Analysis Year 2035 N5 Full Interchange Project Description I-95 Access Study
Oper.(LOS)������ Des.(N)����� Planning Data �����
Flow InputsVolume, V 7000 veh/h Peak-Hour Factor, PHF 0.97 AADT veh/day %Trucks and Buses, PT 13 Peak-Hr Prop. of AADT, K %RVs, PR 0Peak-Hr Direction Prop, D General Terrain: Rolling DDHV = AADT x K x D veh/h Grade % Length mi Driver type adjustment 1.00 Up/Down %Calculate Flow Adjustments fp 1.00 ER 2.0
ET 2.5 fHV = 1/[1+PT(ET - 1) + PR(ER - 1)] 0.837
Speed Inputs Calc Speed Adj and FFSLane Width 12.0 ftRt-Shoulder Lat. Clearance 6.0 ftInterchange Density 0.50 I/mi Number of Lanes, N 3FFS (measured) mi/h Base free-flow Speed, BFFS 70.0 mi/h
fLW 0.0 mi/h fLC 0.0 mi/h fID 0.0 mi/h
fN 3.0 mi/h
FFS 67.0 mi/h
LOS and Performance Measures Design (N)
Operational (LOS)vp = (V or DDHV) / (PHF x N x fHV x fp)
2875 pc/h/ln
S mi/h D = vp / S pc/mi/ln LOS F
Design (N) Design LOSvp = (V or DDHV) / (PHF x N x fHV x fp)
pc/h
S mi/h D = vp / S pc/mi/ln Required Number of Lanes, N
Glossary Factor LocationN - Number of lanes S - SpeedV - Hourly volume D - Densityvp - Flow rate FFS - Free-flow speedLOS - Level of service BFFS - Base free-flow speedDDHV - Directional design hour volume
ER - Exhibits23-8, 23-10 fLW - Exhibit 23-4ET - Exhibits 23-8, 23-10, 23-11 fLC - Exhibit 23-5fp - Page 23-12 fN - Exhibit 23-6LOS, S, FFS, vp - Exhibits 23-2, 23-3 fID - Exhibit 23-7
Copyright © 2005 University of Florida, All Rights Reserved HCS+TM Version 5.21 Generated: 7/9/2010 9:19 AM
Page 1 of 1BASIC FREEWAY WORKSHEET
7/9/2010file://C:\Documents and Settings\JMasinick\Local Settings\Temp\f2k21F8.tmp
D-49

2035 No-Build Analysis - Manual Freeway Analysis
JunctionID Location Analysis
IDAM Peak
VolAM Truck
% AM PHF Terrain Fhv VolumeEquivalent
Number of lanes Vp Speed Density LOS PM Peak
VolPM Truck
% PM PHF Terrain Fhv VolumeEquivalent
Number of lanes Vp Speed Density LOS
Northbound AM Peak Hour PM Peak Hour
ID ID Vol % Equivalent lanes Vol % Equivalent lanes
NB MS-1 South of Route 3 Interchange
MainlineSegment
1Mainline
NB MS-2 North of Route 3 Interchange
MainlineSegment
2
NB MS-3 South of Route 17 Interchange
MainlineSegmentNB MS 3 Interchange Segment
3
NB MS-4 North of Route 17 Interchange
MainlineSegment
46240 12.6% 0.92 Rolling* 0.841 8,065 3 2,688 35.7 75.2 F
Southbound AM Peak Hour PM Peak Hour
JunctionID Location Analysis
TypeAM Peak
VolAM Truck
% AM PHF Terrain Fhv VolumeEquivalent
Number of lanes Vp Speed Density LOS PM Peak
VolPM Truck
% PM PHF Terrain Fhv VolumeEquivalent
Number of lanes Vp Speed Density LOS
SB MS-4 North of Route 17 Interchange
MainlineSegment 7,000 12.5% 0.97 Rolling* 0.842 8,570 3 2,857 24.2 117.9 FSB MS 4 Interchange Segment
47,000 12.5% 0.97 Rolling 0.842 8,570 3 2,857 24.2 117.9 F
SB MS-3 South of Route 17 Interchange
MainlineSegment
3M i li
SB MS-2 North of Route 3 Interchange
MainlineSegment
25630 12.5% 0.97 Rolling* 0.842 6,892 3 2,297 54.1 42.5 F
SB MS-1 South of Route 3 MainlineSegmentSB MS-1 Interchange Segment
1
* For Rolling Terrain - Et = 2 5 Er=2
LOS Criteria for MainlineLOS Density
For Rolling Terrain - Et = 2.5, Er=2
LOS DensityA 0-11B >11-18C >18-26D >26-35E >35-45F >45
D-50


BASIC FREEWAY SEGMENTS WORKSHEET
General Information Site Information Analyst JM Highway/Direction of Travel NBAgency or Company Michael Baker Jr, Inc. From/To CD-1 NB C/D Road @ River Date Performed 7-7-10 JurisdictionAnalysis Time Period AM Peak Hour Analysis Year 2035 Build N5 Full Interchange Project Description Fampo Radco/I-95 Transportation Analysis
Oper.(LOS)������ Des.(N)����� Planning Data �����
Flow InputsVolume, V 2840 veh/h Peak-Hour Factor, PHF 0.97 AADT veh/day %Trucks and Buses, PT 13 Peak-Hr Prop. of AADT, K %RVs, PR 0Peak-Hr Direction Prop, D General Terrain: Rolling DDHV = AADT x K x D veh/h Grade % Length mi Driver type adjustment 1.00 Up/Down %Calculate Flow Adjustments fp 1.00 ER 2.0
ET 2.5 fHV = 1/[1+PT(ET - 1) + PR(ER - 1)] 0.837
Speed Inputs Calc Speed Adj and FFSLane Width 12.0 ftRt-Shoulder Lat. Clearance 6.0 ftInterchange Density 0.50 I/mi Number of Lanes, N 2FFS (measured) mi/h Base free-flow Speed, BFFS 70.0 mi/h
fLW 0.0 mi/h fLC 0.0 mi/h fID 0.0 mi/h
fN 4.5 mi/h
FFS 65.5 mi/h
LOS and Performance Measures Design (N)
Operational (LOS)vp = (V or DDHV) / (PHF x N x fHV x fp)
1749 pc/h/ln
S 64.7 mi/h D = vp / S 27.0 pc/mi/ln LOS D
Design (N) Design LOSvp = (V or DDHV) / (PHF x N x fHV x fp)
pc/h
S mi/h D = vp / S pc/mi/ln Required Number of Lanes, N
Glossary Factor LocationN - Number of lanes S - SpeedV - Hourly volume D - Densityvp - Flow rate FFS - Free-flow speedLOS - Level of service BFFS - Base free-flow speedDDHV - Directional design hour volume
ER - Exhibits23-8, 23-10 fLW - Exhibit 23-4ET - Exhibits 23-8, 23-10, 23-11 fLC - Exhibit 23-5fp - Page 23-12 fN - Exhibit 23-6LOS, S, FFS, vp - Exhibits 23-2, 23-3 fID - Exhibit 23-7
Copyright © 2005 University of Florida, All Rights Reserved HCS+TM Version 5.21 Generated: 7/9/2010 8:59 AM
Page 1 of 1BASIC FREEWAY WORKSHEET
7/9/2010file://C:\Documents and Settings\JMasinick\Local Settings\Temp\f2k218A.tmp
D-51

BASIC FREEWAY SEGMENTS WORKSHEET
General Information Site Information Analyst JM Highway/Direction of Travel NBAgency or Company Michael Baker Jr, Inc. From/To CD-1 NB C/D Road @ River Date Performed 7-7-10 JurisdictionAnalysis Time Period PM Peak Hour Analysis Year 2035 Build N5 Full Interchange Project Description Fampo Radco/I-95 Transportation Analysis
Oper.(LOS)������ Des.(N)����� Planning Data �����
Flow InputsVolume, V 1330 veh/h Peak-Hour Factor, PHF 0.97 AADT veh/day %Trucks and Buses, PT 12 Peak-Hr Prop. of AADT, K %RVs, PR 0Peak-Hr Direction Prop, D General Terrain: Rolling DDHV = AADT x K x D veh/h Grade % Length mi Driver type adjustment 1.00 Up/Down %Calculate Flow Adjustments fp 1.00 ER 2.0
ET 2.5 fHV = 1/[1+PT(ET - 1) + PR(ER - 1)] 0.847
Speed Inputs Calc Speed Adj and FFSLane Width 12.0 ftRt-Shoulder Lat. Clearance 6.0 ftInterchange Density 0.50 I/mi Number of Lanes, N 2FFS (measured) mi/h Base free-flow Speed, BFFS 70.0 mi/h
fLW 0.0 mi/h fLC 0.0 mi/h fID 0.0 mi/h
fN 4.5 mi/h
FFS 65.5 mi/h
LOS and Performance Measures Design (N)
Operational (LOS)vp = (V or DDHV) / (PHF x N x fHV x fp)
809 pc/h/ln
S 65.5 mi/h D = vp / S 12.4 pc/mi/ln LOS B
Design (N) Design LOSvp = (V or DDHV) / (PHF x N x fHV x fp)
pc/h
S mi/h D = vp / S pc/mi/ln Required Number of Lanes, N
Glossary Factor LocationN - Number of lanes S - SpeedV - Hourly volume D - Densityvp - Flow rate FFS - Free-flow speedLOS - Level of service BFFS - Base free-flow speedDDHV - Directional design hour volume
ER - Exhibits23-8, 23-10 fLW - Exhibit 23-4ET - Exhibits 23-8, 23-10, 23-11 fLC - Exhibit 23-5fp - Page 23-12 fN - Exhibit 23-6LOS, S, FFS, vp - Exhibits 23-2, 23-3 fID - Exhibit 23-7
Copyright © 2005 University of Florida, All Rights Reserved HCS+TM Version 5.21 Generated: 7/9/2010 9:01 AM
Page 1 of 1BASIC FREEWAY WORKSHEET
7/9/2010file://C:\Documents and Settings\JMasinick\Local Settings\Temp\f2k218F.tmp
D-52

BASIC FREEWAY SEGMENTS WORKSHEET
General Information Site Information Analyst JM Highway/Direction of Travel SBAgency or Company Michael Baker Jr, Inc. From/To CD-2 SB C/D Road @ River Date Performed 07-07-10 JurisdictionAnalysis Time Period AM Peak Hour Analysis Year 2035 N5 Full Interchange Project Description Fampo Radco/I-95 Transportation Analysis
Oper.(LOS)������ Des.(N)����� Planning Data �����
Flow InputsVolume, V 1090 veh/h Peak-Hour Factor, PHF 0.96 AADT veh/day %Trucks and Buses, PT 18 Peak-Hr Prop. of AADT, K %RVs, PR 0Peak-Hr Direction Prop, D General Terrain: Rolling DDHV = AADT x K x D veh/h Grade % Length mi Driver type adjustment 1.00 Up/Down %Calculate Flow Adjustments fp 1.00 ER 2.0
ET 2.5 fHV = 1/[1+PT(ET - 1) + PR(ER - 1)] 0.787
Speed Inputs Calc Speed Adj and FFSLane Width 12.0 ftRt-Shoulder Lat. Clearance 6.0 ftInterchange Density 0.50 I/mi Number of Lanes, N 2FFS (measured) mi/h Base free-flow Speed, BFFS 70.0 mi/h
fLW 0.0 mi/h fLC 0.0 mi/h fID 0.0 mi/h
fN 4.5 mi/h
FFS 65.5 mi/h
LOS and Performance Measures Design (N)
Operational (LOS)vp = (V or DDHV) / (PHF x N x fHV x fp)
721 pc/h/ln
S 65.5 mi/h D = vp / S 11.0 pc/mi/ln LOS B
Design (N) Design LOSvp = (V or DDHV) / (PHF x N x fHV x fp)
pc/h
S mi/h D = vp / S pc/mi/ln Required Number of Lanes, N
Glossary Factor LocationN - Number of lanes S - SpeedV - Hourly volume D - Densityvp - Flow rate FFS - Free-flow speedLOS - Level of service BFFS - Base free-flow speedDDHV - Directional design hour volume
ER - Exhibits23-8, 23-10 fLW - Exhibit 23-4ET - Exhibits 23-8, 23-10, 23-11 fLC - Exhibit 23-5fp - Page 23-12 fN - Exhibit 23-6LOS, S, FFS, vp - Exhibits 23-2, 23-3 fID - Exhibit 23-7
Copyright © 2005 University of Florida, All Rights Reserved HCS+TM Version 5.21 Generated: 7/9/2010 9:03 AM
Page 1 of 1BASIC FREEWAY WORKSHEET
7/9/2010file://C:\Documents and Settings\JMasinick\Local Settings\Temp\f2k219E.tmp
D-53

BASIC FREEWAY SEGMENTS WORKSHEET
General Information Site Information Analyst JM Highway/Direction of Travel SBAgency or Company Michael Baker Jr, Inc. From/To CD-2 SB C/D Road @ River Date Performed 7-7-10 JurisdictionAnalysis Time Period PM Peak Analysis Year 2035 N5 Full Interchange Project Description Fampo Radco/I-95 Transportation Analysis
Oper.(LOS)������ Des.(N)����� Planning Data �����
Flow InputsVolume, V 3710 veh/h Peak-Hour Factor, PHF 0.97 AADT veh/day %Trucks and Buses, PT 13 Peak-Hr Prop. of AADT, K %RVs, PR 0Peak-Hr Direction Prop, D General Terrain: Rolling DDHV = AADT x K x D veh/h Grade % Length mi Driver type adjustment 1.00 Up/Down %Calculate Flow Adjustments fp 1.00 ER 2.0
ET 2.5 fHV = 1/[1+PT(ET - 1) + PR(ER - 1)] 0.837
Speed Inputs Calc Speed Adj and FFSLane Width 12.0 ftRt-Shoulder Lat. Clearance 6.0 ftInterchange Density 0.50 I/mi Number of Lanes, N 2FFS (measured) mi/h Base free-flow Speed, BFFS 70.0 mi/h
fLW 0.0 mi/h fLC 0.0 mi/h fID 0.0 mi/h
fN 4.5 mi/h
FFS 65.5 mi/h
LOS and Performance Measures Design (N)
Operational (LOS)vp = (V or DDHV) / (PHF x N x fHV x fp)
2285 pc/h/ln
S 54.8 mi/h D = vp / S 41.7 pc/mi/ln LOS E
Design (N) Design LOSvp = (V or DDHV) / (PHF x N x fHV x fp)
pc/h
S mi/h D = vp / S pc/mi/ln Required Number of Lanes, N
Glossary Factor LocationN - Number of lanes S - SpeedV - Hourly volume D - Densityvp - Flow rate FFS - Free-flow speedLOS - Level of service BFFS - Base free-flow speedDDHV - Directional design hour volume
ER - Exhibits23-8, 23-10 fLW - Exhibit 23-4ET - Exhibits 23-8, 23-10, 23-11 fLC - Exhibit 23-5fp - Page 23-12 fN - Exhibit 23-6LOS, S, FFS, vp - Exhibits 23-2, 23-3 fID - Exhibit 23-7
Copyright © 2005 University of Florida, All Rights Reserved HCS+TM Version 5.21 Generated: 7/9/2010 9:03 AM
Page 1 of 1BASIC FREEWAY WORKSHEET
7/9/2010file://C:\Documents and Settings\JMasinick\Local Settings\Temp\f2k21A4.tmp
D-54

RAMPS AND RAMP JUNCTIONS WORKSHEETGeneral Information Site Information Analyst JM Freeway/Dir of Travel NBAgency or Company Michael Baker Jr, Inc Junction D-1 NB 95 to EB 3Date Performed 10-20-09 JurisdictionAnalysis Time Period AM peak Analysis Year 2035 Build ConditionsProject Description Radco/I-95 Transportation AnalysisInputsUpstream Adj Ramp
Yes����� On�����
No������ Off�����
Lup = ft
Vu = veh/h
Terrain: Rolling Downstream Adj Ramp
Yes������ On������
No����� Off�����
Ldown = 1000 ft
VD = 1600 veh/h S FF = 70.0 mph SFR = 50.0 mph
Sketch ( show lanes, LA, LD,VR,Vf)
Conversion to pc/h Under Base Conditions (pc/h) V
(Veh/hr) PHF Terrain %Truck %Rv fHV fp v = V/PHF x fHV x fp
Freeway 3040 0.94 Rolling 13 0 0.837 1.00 3865 Ramp 600 0.84 Rolling 13 0 0.837 1.00 854 UpStream DownStream 1600 0.98 Rolling 13 0 0.837 1.00 1951
Merge Areas Diverge AreasEstimation of v12 Estimation of v12
V12 = VF ( PFM )LEQ = (Equation 25-2 or 25-3)PFM = using Equation (Exhibit 25-5) V12 = pc/h V3 or Vav34 pc/h (Equation 25-4 or 25-5) Is V3 or Vav34 > 2,700 pc/h? Yes No����� �����
Is V3 or Vav34 > 1.5 * V12/2 Yes No����� �����
If Yes,V12a = pc/h (Equation 25-8)
V12 = VR + (VF - VR)PFDLEQ = (Equation 25-8 or 25-9) PFD = 0.624 using Equation (Exhibit 25-12) V12 = 2733 pc/h V3 or Vav34 1132 pc/h (Equation 25-15 or 25-16) Is V3 or Vav34 > 2,700 pc/h? Yes No����� ������
Is V3 or Vav34 > 1.5 * V12/2 Yes No����� ������
If Yes,V12a = pc/h (Equation 25-18)
Capacity Checks Capacity ChecksActual Capacity LOS F? Actual Capacity LOS F?
VFO Exhibit 25-7
VF 3865 Exhibit 25-14 7200 NoVFO = VF - VR 3011 Exhibit 25-14 7200 No
VR 854 Exhibit 25-3 2100 No
Flow Entering Merge Influence Area Flow Entering Merge Influence AreaActual Max Desirable Violation? Actual Max Desirable Violation?
VR12 Exhibit 25-7 V12 2733 Exhibit 25-14 4400:All NoLevel of Service Determination (if not F) Level of Service Determination (if not F)
DR = 5.475 + 0.00734 v R + 0.0078 V12 - 0.00627 LA
DR = (pc/mi/ln)LOS = (Exhibit 25-4)
DR = 4.252 + 0.0086 V12 - 0.0009 LD
DR = 20.8 (pc/mi/ln)LOS = C (Exhibit 25-4)
Speed Determination Speed DeterminationMS = (Exibit 25-19) SR= mph (Exhibit 25-19) S0= mph (Exhibit 25-19) S = mph (Exhibit 25-14)
Ds = 0.310 (Exhibit 25-19) SR= 61.3 mph (Exhibit 25-19) S0= 76.3 mph (Exhibit 25-19) S = 65.1 mph (Exhibit 25-15)
Copyright © 2005 University of Florida, All Rights Reserved HCS+TM Version 5.21 Generated: 7/8/2010 3:09 PM
Page 1 of 1RAMPS AND RAMP JUNCTIONS WORKSHEET
7/8/2010file://C:\Documents and Settings\JMasinick\Local Settings\Temp\r2k208D.tmp
D-55

RAMPS AND RAMP JUNCTIONS WORKSHEETGeneral Information Site Information Analyst JM Freeway/Dir of Travel NBAgency or Company Michael Baker Jr, Inc Junction D-1 95 NB to Rt 3 EBDate Performed 7-7-10 JurisdictionAnalysis Time Period PM peak Analysis Year 2035 Build ConditionsProject Description Fampo Radco/I-95 Transportation Analysis InputsUpstream Adj Ramp
Yes����� On�����
No������ Off�����
Lup = ft
Vu = veh/h
Terrain: Rolling Downstream Adj Ramp
Yes������ On������
No����� Off�����
Ldown = 1000 ft
VD = 750 veh/h S FF = 70.0 mph SFR = 50.0 mph
Sketch ( show lanes, LA, LD,VR,Vf)
Conversion to pc/h Under Base Conditions (pc/h) V
(Veh/hr) PHF Terrain %Truck %Rv fHV fp v = V/PHF x fHV x fp
Freeway 5200 0.98 Rolling 12 0 0.847 1.00 6261 Ramp 530 1.00 Rolling 12 0 0.847 1.00 625 UpStream DownStream 750 0.98 Rolling 12 0 0.847 1.00 903
Merge Areas Diverge AreasEstimation of v12 Estimation of v12
V12 = VF ( PFM )LEQ = (Equation 25-2 or 25-3)PFM = using Equation (Exhibit 25-5) V12 = pc/h V3 or Vav34 pc/h (Equation 25-4 or 25-5) Is V3 or Vav34 > 2,700 pc/h? Yes No����� �����
Is V3 or Vav34 > 1.5 * V12/2 Yes No����� �����
If Yes,V12a = pc/h (Equation 25-8)
V12 = VR + (VF - VR)PFDLEQ = (Equation 25-8 or 25-9) PFD = 0.575 using Equation (Exhibit 25-12) V12 = 3864 pc/h V3 or Vav34 2397 pc/h (Equation 25-15 or 25-16) Is V3 or Vav34 > 2,700 pc/h? Yes No����� ������
Is V3 or Vav34 > 1.5 * V12/2 Yes No����� ������
If Yes,V12a = pc/h (Equation 25-18)
Capacity Checks Capacity ChecksActual Capacity LOS F? Actual Capacity LOS F?
VFO Exhibit 25-7
VF 6261 Exhibit 25-14 7200 NoVFO = VF - VR 5636 Exhibit 25-14 7200 No
VR 625 Exhibit 25-3 2100 No
Flow Entering Merge Influence Area Flow Entering Merge Influence AreaActual Max Desirable Violation? Actual Max Desirable Violation?
VR12 Exhibit 25-7 V12 3864 Exhibit 25-14 4400:All NoLevel of Service Determination (if not F) Level of Service Determination (if not F)
DR = 5.475 + 0.00734 v R + 0.0078 V12 - 0.00627 LA
DR = (pc/mi/ln)LOS = (Exhibit 25-4)
DR = 4.252 + 0.0086 V12 - 0.0009 LD
DR = 30.5 (pc/mi/ln)LOS = D (Exhibit 25-4)
Speed Determination Speed DeterminationMS = (Exibit 25-19) SR= mph (Exhibit 25-19) S0= mph (Exhibit 25-19) S = mph (Exhibit 25-14)
Ds = 0.289 (Exhibit 25-19) SR= 61.9 mph (Exhibit 25-19) S0= 71.3 mph (Exhibit 25-19) S = 65.2 mph (Exhibit 25-15)
Copyright © 2005 University of Florida, All Rights Reserved HCS+TM Version 5.21 Generated: 7/8/2010 3:38 PM
Page 1 of 1RAMPS AND RAMP JUNCTIONS WORKSHEET
7/8/2010file://C:\Documents and Settings\JMasinick\Local Settings\Temp\r2k2092.tmp
D-56

RAMPS AND RAMP JUNCTIONS WORKSHEETGeneral Information Site Information Analyst JM Freeway/Dir of Travel NBAgency or Company Michael Baker Jr, Inc Junction D-2 95 NB to 17 CD roadDate Performed 03-05-10 JurisdictionAnalysis Time Period AM peak Analysis Year 2035 Build N5 FullProject Description Fampo Radco/I-95 Transportation Analysis InputsUpstream Adj Ramp
Yes����� On�����
No������ Off�����
Lup = ft
Vu = veh/h
Terrain: Rolling Downstream Adj Ramp
Yes����� On�����
No������ Off�����
Ldown = ft
VD = veh/h S FF = 70.0 mph SFR = 50.0 mph
Sketch ( show lanes, LA, LD,VR,Vf)
Conversion to pc/h Under Base Conditions (pc/h) V
(Veh/hr) PHF Terrain %Truck %Rv fHV fp v = V/PHF x fHV x fp
Freeway 4700 0.97 Rolling 13 0 0.837 1.00 5790 Ramp 2000 0.86 Rolling 13 0 0.837 1.00 2779 UpStream DownStream
Merge Areas Diverge AreasEstimation of v12 Estimation of v12
V12 = VF ( PFM )LEQ = (Equation 25-2 or 25-3)PFM = using Equation (Exhibit 25-5) V12 = pc/h V3 or Vav34 pc/h (Equation 25-4 or 25-5) Is V3 or Vav34 > 2,700 pc/h? Yes No����� �����
Is V3 or Vav34 > 1.5 * V12/2 Yes No����� �����
If Yes,V12a = pc/h (Equation 25-8)
V12 = VR + (VF - VR)PFDLEQ = (Equation 25-8 or 25-9) PFD = 0.450 using Equation (Exhibit 25-12) V12 = 4134 pc/h V3 or Vav34 1656 pc/h (Equation 25-15 or 25-16) Is V3 or Vav34 > 2,700 pc/h? Yes No����� ������
Is V3 or Vav34 > 1.5 * V12/2 Yes No����� ������
If Yes,V12a = pc/h (Equation 25-18)
Capacity Checks Capacity ChecksActual Capacity LOS F? Actual Capacity LOS F?
VFO Exhibit 25-7
VF 5790 Exhibit 25-14 7200 NoVFO = VF - VR 3011 Exhibit 25-14 7200 No
VR 2779 Exhibit 25-3 4100 No
Flow Entering Merge Influence Area Flow Entering Merge Influence AreaActual Max Desirable Violation? Actual Max Desirable Violation?
VR12 Exhibit 25-7 V12 4134 Exhibit 25-14 4400:All NoLevel of Service Determination (if not F) Level of Service Determination (if not F)
DR = 5.475 + 0.00734 v R + 0.0078 V12 - 0.00627 LA
DR = (pc/mi/ln)LOS = (Exhibit 25-4)
DR = 4.252 + 0.0086 V12 - 0.0009 LD
DR = 21.8 (pc/mi/ln)LOS = C (Exhibit 25-4)
Speed Determination Speed DeterminationMS = (Exibit 25-19) SR= mph (Exhibit 25-19) S0= mph (Exhibit 25-19) S = mph (Exhibit 25-14)
Ds = 0.483 (Exhibit 25-19) SR= 56.5 mph (Exhibit 25-19) S0= 74.2 mph (Exhibit 25-19) S = 60.6 mph (Exhibit 25-15)
Copyright © 2005 University of Florida, All Rights Reserved HCS+TM Version 5.21 Generated: 7/13/2010 1:16 PM
Page 1 of 1RAMPS AND RAMP JUNCTIONS WORKSHEET
7/13/2010file://C:\Documents and Settings\JMasinick\Local Settings\Temp\r2kF5.tmp
D-57

RAMPS AND RAMP JUNCTIONS WORKSHEETGeneral Information Site Information Analyst JM Freeway/Dir of Travel NBAgency or Company Michael Baker Jr, Inc Junction D-2 95 NB to 17 CD roadDate Performed 03-05-10 JurisdictionAnalysis Time Period PM peak Analysis Year 2035 Build N5 FullProject Description Fampo Radco/I-95 Transportation Analysis InputsUpstream Adj Ramp
Yes����� On�����
No������ Off�����
Lup = ft
Vu = veh/h
Terrain: Rolling Downstream Adj Ramp
Yes����� On�����
No������ Off�����
Ldown = ft
VD = veh/h S FF = 70.0 mph SFR = 50.0 mph
Sketch ( show lanes, LA, LD,VR,Vf)
Conversion to pc/h Under Base Conditions (pc/h) V
(Veh/hr) PHF Terrain %Truck %Rv fHV fp v = V/PHF x fHV x fp
Freeway 5350 0.97 Rolling 12 0 0.847 1.00 6508 Ramp 1830 0.95 Rolling 12 0 0.847 1.00 2273 UpStream DownStream
Merge Areas Diverge AreasEstimation of v12 Estimation of v12
V12 = VF ( PFM )LEQ = (Equation 25-2 or 25-3)PFM = using Equation (Exhibit 25-5) V12 = pc/h V3 or Vav34 pc/h (Equation 25-4 or 25-5) Is V3 or Vav34 > 2,700 pc/h? Yes No����� �����
Is V3 or Vav34 > 1.5 * V12/2 Yes No����� �����
If Yes,V12a = pc/h (Equation 25-8)
V12 = VR + (VF - VR)PFDLEQ = (Equation 25-8 or 25-9) PFD = 0.450 using Equation (Exhibit 25-12) V12 = 4179 pc/h V3 or Vav34 2329 pc/h (Equation 25-15 or 25-16) Is V3 or Vav34 > 2,700 pc/h? Yes No����� ������
Is V3 or Vav34 > 1.5 * V12/2 Yes No����� ������
If Yes,V12a = pc/h (Equation 25-18)
Capacity Checks Capacity ChecksActual Capacity LOS F? Actual Capacity LOS F?
VFO Exhibit 25-7
VF 6508 Exhibit 25-14 7200 NoVFO = VF - VR 4235 Exhibit 25-14 7200 No
VR 2273 Exhibit 25-3 4100 No
Flow Entering Merge Influence Area Flow Entering Merge Influence AreaActual Max Desirable Violation? Actual Max Desirable Violation?
VR12 Exhibit 25-7 V12 4179 Exhibit 25-14 4400:All NoLevel of Service Determination (if not F) Level of Service Determination (if not F)
DR = 5.475 + 0.00734 v R + 0.0078 V12 - 0.00627 LA
DR = (pc/mi/ln)LOS = (Exhibit 25-4)
DR = 4.252 + 0.0086 V12 - 0.0009 LD
DR = 22.2 (pc/mi/ln)LOS = C (Exhibit 25-4)
Speed Determination Speed DeterminationMS = (Exibit 25-19) SR= mph (Exhibit 25-19) S0= mph (Exhibit 25-19) S = mph (Exhibit 25-14)
Ds = 0.438 (Exhibit 25-19) SR= 57.7 mph (Exhibit 25-19) S0= 71.6 mph (Exhibit 25-19) S = 62.0 mph (Exhibit 25-15)
Copyright © 2005 University of Florida, All Rights Reserved HCS+TM Version 5.21 Generated: 7/13/2010 1:15 PM
Page 1 of 1RAMPS AND RAMP JUNCTIONS WORKSHEET
7/13/2010file://C:\Documents and Settings\JMasinick\Local Settings\Temp\r2kEF.tmp
D-58
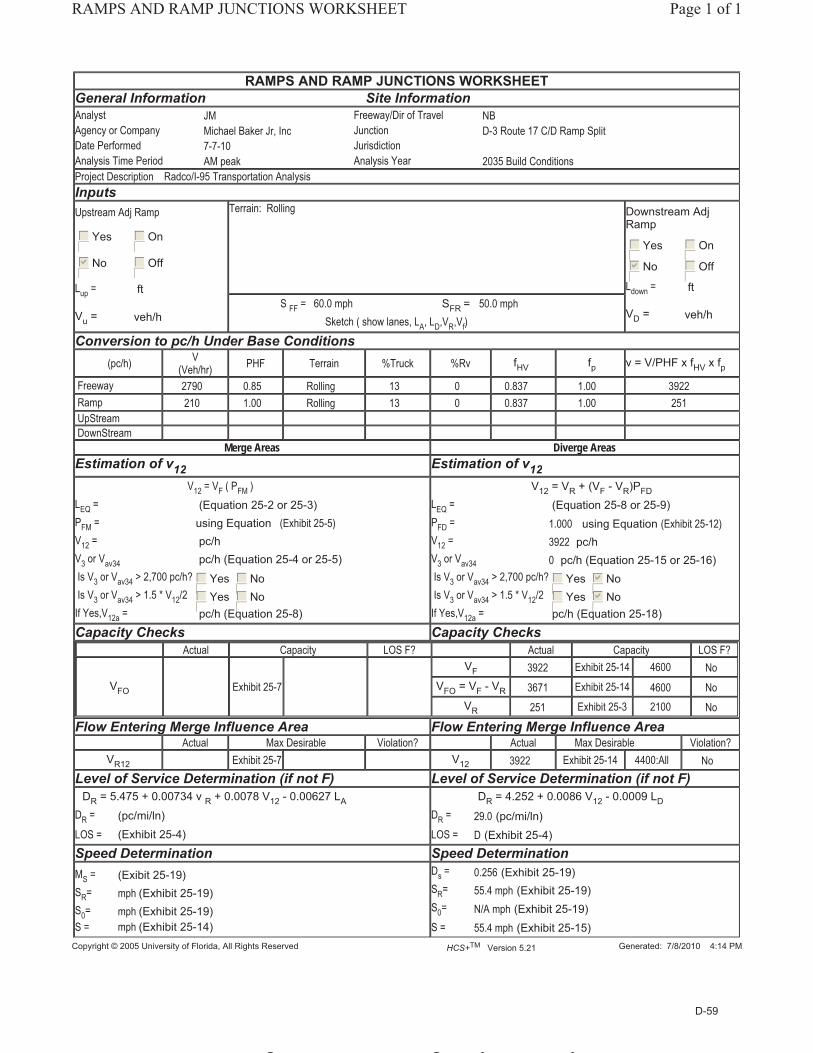
RAMPS AND RAMP JUNCTIONS WORKSHEETGeneral Information Site Information Analyst JM Freeway/Dir of Travel NBAgency or Company Michael Baker Jr, Inc Junction D-3 Route 17 C/D Ramp SplitDate Performed 7-7-10 JurisdictionAnalysis Time Period AM peak Analysis Year 2035 Build ConditionsProject Description Radco/I-95 Transportation AnalysisInputsUpstream Adj Ramp
Yes����� On�����
No������ Off�����
Lup = ft
Vu = veh/h
Terrain: Rolling Downstream Adj Ramp
Yes����� On�����
No������ Off�����
Ldown = ft
VD = veh/h S FF = 60.0 mph SFR = 50.0 mph
Sketch ( show lanes, LA, LD,VR,Vf)
Conversion to pc/h Under Base Conditions (pc/h) V
(Veh/hr) PHF Terrain %Truck %Rv fHV fp v = V/PHF x fHV x fp
Freeway 2790 0.85 Rolling 13 0 0.837 1.00 3922 Ramp 210 1.00 Rolling 13 0 0.837 1.00 251 UpStream DownStream
Merge Areas Diverge AreasEstimation of v12 Estimation of v12
V12 = VF ( PFM )LEQ = (Equation 25-2 or 25-3)PFM = using Equation (Exhibit 25-5) V12 = pc/h V3 or Vav34 pc/h (Equation 25-4 or 25-5) Is V3 or Vav34 > 2,700 pc/h? Yes No����� �����
Is V3 or Vav34 > 1.5 * V12/2 Yes No����� �����
If Yes,V12a = pc/h (Equation 25-8)
V12 = VR + (VF - VR)PFDLEQ = (Equation 25-8 or 25-9) PFD = 1.000 using Equation (Exhibit 25-12) V12 = 3922 pc/h V3 or Vav34 0 pc/h (Equation 25-15 or 25-16) Is V3 or Vav34 > 2,700 pc/h? Yes No����� ������
Is V3 or Vav34 > 1.5 * V12/2 Yes No����� ������
If Yes,V12a = pc/h (Equation 25-18)
Capacity Checks Capacity ChecksActual Capacity LOS F? Actual Capacity LOS F?
VFO Exhibit 25-7
VF 3922 Exhibit 25-14 4600 NoVFO = VF - VR 3671 Exhibit 25-14 4600 No
VR 251 Exhibit 25-3 2100 No
Flow Entering Merge Influence Area Flow Entering Merge Influence AreaActual Max Desirable Violation? Actual Max Desirable Violation?
VR12 Exhibit 25-7 V12 3922 Exhibit 25-14 4400:All NoLevel of Service Determination (if not F) Level of Service Determination (if not F)
DR = 5.475 + 0.00734 v R + 0.0078 V12 - 0.00627 LA
DR = (pc/mi/ln)LOS = (Exhibit 25-4)
DR = 4.252 + 0.0086 V12 - 0.0009 LD
DR = 29.0 (pc/mi/ln)LOS = D (Exhibit 25-4)
Speed Determination Speed DeterminationMS = (Exibit 25-19) SR= mph (Exhibit 25-19) S0= mph (Exhibit 25-19) S = mph (Exhibit 25-14)
Ds = 0.256 (Exhibit 25-19) SR= 55.4 mph (Exhibit 25-19) S0= N/A mph (Exhibit 25-19) S = 55.4 mph (Exhibit 25-15)
Copyright © 2005 University of Florida, All Rights Reserved HCS+TM Version 5.21 Generated: 7/8/2010 4:14 PM
Page 1 of 1RAMPS AND RAMP JUNCTIONS WORKSHEET
7/8/2010file://C:\Documents and Settings\JMasinick\Local Settings\Temp\r2k20A3.tmp
D-59

RAMPS AND RAMP JUNCTIONS WORKSHEETGeneral Information Site Information Analyst JM Freeway/Dir of Travel NBAgency or Company Michael Baker Jr, Inc Junction D-3 Route 17 C/D Ramp SplitDate Performed 7-7-10 JurisdictionAnalysis Time Period PM peak Analysis Year 2035 Build ConditionsProject Description Radco/I-95 Transportation AnalysisInputsUpstream Adj Ramp
Yes����� On�����
No������ Off�����
Lup = ft
Vu = veh/h
Terrain: Rolling Downstream Adj Ramp
Yes����� On�����
No������ Off�����
Ldown = ft
VD = veh/h S FF = 60.0 mph SFR = 50.0 mph
Sketch ( show lanes, LA, LD,VR,Vf)
Conversion to pc/h Under Base Conditions (pc/h) V
(Veh/hr) PHF Terrain %Truck %Rv fHV fp v = V/PHF x fHV x fp
Freeway 2290 0.96 Rolling 13 0 0.837 1.00 2851 Ramp 300 0.90 Rolling 13 0 0.837 1.00 398 UpStream DownStream
Merge Areas Diverge AreasEstimation of v12 Estimation of v12
V12 = VF ( PFM )LEQ = (Equation 25-2 or 25-3)PFM = using Equation (Exhibit 25-5) V12 = pc/h V3 or Vav34 pc/h (Equation 25-4 or 25-5) Is V3 or Vav34 > 2,700 pc/h? Yes No����� �����
Is V3 or Vav34 > 1.5 * V12/2 Yes No����� �����
If Yes,V12a = pc/h (Equation 25-8)
V12 = VR + (VF - VR)PFDLEQ = (Equation 25-8 or 25-9) PFD = 1.000 using Equation (Exhibit 25-12) V12 = 2851 pc/h V3 or Vav34 0 pc/h (Equation 25-15 or 25-16) Is V3 or Vav34 > 2,700 pc/h? Yes No����� ������
Is V3 or Vav34 > 1.5 * V12/2 Yes No����� ������
If Yes,V12a = pc/h (Equation 25-18)
Capacity Checks Capacity ChecksActual Capacity LOS F? Actual Capacity LOS F?
VFO Exhibit 25-7
VF 2851 Exhibit 25-14 4600 NoVFO = VF - VR 2453 Exhibit 25-14 4600 No
VR 398 Exhibit 25-3 2100 No
Flow Entering Merge Influence Area Flow Entering Merge Influence AreaActual Max Desirable Violation? Actual Max Desirable Violation?
VR12 Exhibit 25-7 V12 2851 Exhibit 25-14 4400:All NoLevel of Service Determination (if not F) Level of Service Determination (if not F)
DR = 5.475 + 0.00734 v R + 0.0078 V12 - 0.00627 LA
DR = (pc/mi/ln)LOS = (Exhibit 25-4)
DR = 4.252 + 0.0086 V12 - 0.0009 LD
DR = 19.8 (pc/mi/ln)LOS = B (Exhibit 25-4)
Speed Determination Speed DeterminationMS = (Exibit 25-19) SR= mph (Exhibit 25-19) S0= mph (Exhibit 25-19) S = mph (Exhibit 25-14)
Ds = 0.269 (Exhibit 25-19) SR= 55.2 mph (Exhibit 25-19) S0= N/A mph (Exhibit 25-19) S = 55.2 mph (Exhibit 25-15)
Copyright © 2005 University of Florida, All Rights Reserved HCS+TM Version 5.21 Generated: 7/8/2010 4:14 PM
Page 1 of 1RAMPS AND RAMP JUNCTIONS WORKSHEET
7/8/2010file://C:\Documents and Settings\JMasinick\Local Settings\Temp\r2k20A8.tmp
D-60

RAMPS AND RAMP JUNCTIONS WORKSHEETGeneral Information Site Information Analyst JM Freeway/Dir of Travel SBAgency or Company Michael Baker Jr, Inc Junction D-4 95 SB to 17 CD OffDate Performed 03-05-10 JurisdictionAnalysis Time Period AM peak Analysis Year 2035 Build N5 FullProject Description Fampo Radco/I-95 Transportation Analysis InputsUpstream Adj Ramp
Yes����� On�����
No������ Off�����
Lup = ft
Vu = veh/h
Terrain: Rolling Downstream Adj Ramp
Yes����� On�����
No������ Off�����
Ldown = ft
VD = veh/h S FF = 70.0 mph SFR = 50.0 mph
Sketch ( show lanes, LA, LD,VR,Vf)
Conversion to pc/h Under Base Conditions (pc/h) V
(Veh/hr) PHF Terrain %Truck %Rv fHV fp v = V/PHF x fHV x fp
Freeway 4160 0.96 Rolling 18 0 0.787 1.00 5503 Ramp 1080 0.88 Rolling 18 0 0.787 1.00 1559 UpStream DownStream
Merge Areas Diverge AreasEstimation of v12 Estimation of v12
V12 = VF ( PFM )LEQ = (Equation 25-2 or 25-3)PFM = using Equation (Exhibit 25-5) V12 = pc/h V3 or Vav34 pc/h (Equation 25-4 or 25-5) Is V3 or Vav34 > 2,700 pc/h? Yes No����� �����
Is V3 or Vav34 > 1.5 * V12/2 Yes No����� �����
If Yes,V12a = pc/h (Equation 25-8)
V12 = VR + (VF - VR)PFDLEQ = (Equation 25-8 or 25-9) PFD = 0.551 using Equation (Exhibit 25-12) V12 = 3731 pc/h V3 or Vav34 1772 pc/h (Equation 25-15 or 25-16) Is V3 or Vav34 > 2,700 pc/h? Yes No����� ������
Is V3 or Vav34 > 1.5 * V12/2 Yes No����� ������
If Yes,V12a = pc/h (Equation 25-18)
Capacity Checks Capacity ChecksActual Capacity LOS F? Actual Capacity LOS F?
VFO Exhibit 25-7
VF 5503 Exhibit 25-14 7200 NoVFO = VF - VR 3944 Exhibit 25-14 7200 No
VR 1559 Exhibit 25-3 2100 No
Flow Entering Merge Influence Area Flow Entering Merge Influence AreaActual Max Desirable Violation? Actual Max Desirable Violation?
VR12 Exhibit 25-7 V12 3731 Exhibit 25-14 4400:All NoLevel of Service Determination (if not F) Level of Service Determination (if not F)
DR = 5.475 + 0.00734 v R + 0.0078 V12 - 0.00627 LA
DR = (pc/mi/ln)LOS = (Exhibit 25-4)
DR = 4.252 + 0.0086 V12 - 0.0009 LD
DR = 27.3 (pc/mi/ln)LOS = C (Exhibit 25-4)
Speed Determination Speed DeterminationMS = (Exibit 25-19) SR= mph (Exhibit 25-19) S0= mph (Exhibit 25-19) S = mph (Exhibit 25-14)
Ds = 0.373 (Exhibit 25-19) SR= 59.5 mph (Exhibit 25-19) S0= 73.8 mph (Exhibit 25-19) S = 63.5 mph (Exhibit 25-15)
Copyright © 2005 University of Florida, All Rights Reserved HCS+TM Version 5.21 Generated: 7/8/2010 4:14 PM
Page 1 of 1RAMPS AND RAMP JUNCTIONS WORKSHEET
7/8/2010file://C:\Documents and Settings\JMasinick\Local Settings\Temp\r2k20AD.tmp
D-61

RAMPS AND RAMP JUNCTIONS WORKSHEETGeneral Information Site Information Analyst JM Freeway/Dir of Travel SBAgency or Company Michael Baker Jr, Inc Junction D-4 SB 95 to NB 17 CD OffDate Performed 03-05-10 JurisdictionAnalysis Time Period PM peak Analysis Year 2035 Build N5 FullProject Description Fampo Radco/I-95 Transportation Analysis InputsUpstream Adj Ramp
Yes����� On�����
No������ Off�����
Lup = ft
Vu = veh/h
Terrain: Rolling Downstream Adj Ramp
Yes����� On�����
No������ Off�����
Ldown = ft
VD = veh/h S FF = 70.0 mph SFR = 50.0 mph
Sketch ( show lanes, LA, LD,VR,Vf)
Conversion to pc/h Under Base Conditions (pc/h) V
(Veh/hr) PHF Terrain %Truck %Rv fHV fp v = V/PHF x fHV x fp
Freeway 7000 0.97 Rolling 13 0 0.837 1.00 8624 Ramp 1320 0.98 Rolling 13 0 0.837 1.00 1610 UpStream DownStream
Merge Areas Diverge AreasEstimation of v12 Estimation of v12
V12 = VF ( PFM )LEQ = (Equation 25-2 or 25-3)PFM = using Equation (Exhibit 25-5) V12 = pc/h V3 or Vav34 pc/h (Equation 25-4 or 25-5) Is V3 or Vav34 > 2,700 pc/h? Yes No����� �����
Is V3 or Vav34 > 1.5 * V12/2 Yes No����� �����
If Yes,V12a = pc/h (Equation 25-8)
V12 = VR + (VF - VR)PFDLEQ = (Equation 25-8 or 25-9) PFD = 0.470 using Equation (Exhibit 25-12) V12 = 4909 pc/h V3 or Vav34 3715 pc/h (Equation 25-15 or 25-16) Is V3 or Vav34 > 2,700 pc/h? Yes No������ �����
Is V3 or Vav34 > 1.5 * V12/2 Yes No������ �����
If Yes,V12a = 5924 pc/h (Equation 25-18)Capacity Checks Capacity Checks
Actual Capacity LOS F? Actual Capacity LOS F?
VFO Exhibit 25-7
VF 8624 Exhibit 25-14 7200 YesVFO = VF - VR 7014 Exhibit 25-14 7200 No
VR 1610 Exhibit 25-3 2100 No
Flow Entering Merge Influence Area Flow Entering Merge Influence AreaActual Max Desirable Violation? Actual Max Desirable Violation?
VR12 Exhibit 25-7 V12 4909 Exhibit 25-14 4400:All NoLevel of Service Determination (if not F) Level of Service Determination (if not F)
DR = 5.475 + 0.00734 v R + 0.0078 V12 - 0.00627 LA
DR = (pc/mi/ln)LOS = (Exhibit 25-4)
DR = 4.252 + 0.0086 V12 - 0.0009 LD
DR = 46.2 (pc/mi/ln)LOS = F (Exhibit 25-4)
Speed Determination Speed DeterminationMS = (Exibit 25-19) SR= mph (Exhibit 25-19) S0= mph (Exhibit 25-19) S = mph (Exhibit 25-14)
Ds = 0.378 (Exhibit 25-19) SR= 59.4 mph (Exhibit 25-19) S0= 70.2 mph (Exhibit 25-19) S = 62.4 mph (Exhibit 25-15)
Copyright © 2005 University of Florida, All Rights Reserved HCS+TM Version 5.21 Generated: 7/8/2010 4:14 PM
Page 1 of 1RAMPS AND RAMP JUNCTIONS WORKSHEET
7/8/2010file://C:\Documents and Settings\JMasinick\Local Settings\Temp\r2k20B2.tmp
D-62

RAMPS AND RAMP JUNCTIONS WORKSHEETGeneral Information Site Information Analyst JM Freeway/Dir of Travel I-95 SouthboundAgency or Company Michael Baker Jr, Inc. Junction D-5 SB CD Rd to WB Connect RdDate Performed 3/5/2010 JurisdictionAnalysis Time Period AM Peak Analysis Year 2035 Build N5 FullProject Description Fampo Radco/I-95 Transportation Analysis InputsUpstream Adj Ramp
Yes����� On�����
No������ Off�����
Lup = ft
Vu = veh/h
Terrain: Rolling Downstream Adj Ramp
Yes����� On�����
No������ Off�����
Ldown = ft
VD = veh/h S FF = 70.0 mph SFR = 60.0 mph
Sketch ( show lanes, LA, LD,VR,Vf)
Conversion to pc/h Under Base Conditions (pc/h) V
(Veh/hr) PHF Terrain %Truck %Rv fHV fp v = V/PHF x fHV x fp
Freeway 1090 0.96 Rolling 18 0 0.787 1.00 1442 Ramp 150 0.96 Rolling 18 0 0.787 1.00 198 UpStream DownStream
Merge Areas Diverge AreasEstimation of v12 Estimation of v12
V12 = VF ( PFM )LEQ = (Equation 25-2 or 25-3)PFM = using Equation (Exhibit 25-5) V12 = pc/h V3 or Vav34 pc/h (Equation 25-4 or 25-5) Is V3 or Vav34 > 2,700 pc/h? Yes No����� �����
Is V3 or Vav34 > 1.5 * V12/2 Yes No����� �����
If Yes,V12a = pc/h (Equation 25-8)
V12 = VR + (VF - VR)PFDLEQ = (Equation 25-8 or 25-9) PFD = 1.000 using Equation (Exhibit 25-12) V12 = 1442 pc/h V3 or Vav34 0 pc/h (Equation 25-15 or 25-16) Is V3 or Vav34 > 2,700 pc/h? Yes No����� ������
Is V3 or Vav34 > 1.5 * V12/2 Yes No����� ������
If Yes,V12a = pc/h (Equation 25-18)
Capacity Checks Capacity ChecksActual Capacity LOS F? Actual Capacity LOS F?
VFO Exhibit 25-7
VF 1442 Exhibit 25-14 4800 NoVFO = VF - VR 1244 Exhibit 25-14 4800 No
VR 198 Exhibit 25-3 2200 No
Flow Entering Merge Influence Area Flow Entering Merge Influence AreaActual Max Desirable Violation? Actual Max Desirable Violation?
VR12 Exhibit 25-7 V12 1442 Exhibit 25-14 4400:All NoLevel of Service Determination (if not F) Level of Service Determination (if not F)
DR = 5.475 + 0.00734 v R + 0.0078 V12 - 0.00627 LA
DR = (pc/mi/ln)LOS = (Exhibit 25-4)
DR = 4.252 + 0.0086 V12 - 0.0009 LD
DR = 7.7 (pc/mi/ln)LOS = A (Exhibit 25-4)
Speed Determination Speed DeterminationMS = (Exibit 25-19) SR= mph (Exhibit 25-19) S0= mph (Exhibit 25-19) S = mph (Exhibit 25-14)
Ds = 0.121 (Exhibit 25-19) SR= 66.6 mph (Exhibit 25-19) S0= N/A mph (Exhibit 25-19) S = 66.6 mph (Exhibit 25-15)
Copyright © 2005 University of Florida, All Rights Reserved HCS+TM Version 5.21 Generated: 7/8/2010 4:15 PM
Page 1 of 1RAMPS AND RAMP JUNCTIONS WORKSHEET
7/8/2010file://C:\Documents and Settings\JMasinick\Local Settings\Temp\r2k20B7.tmp
D-63

RAMPS AND RAMP JUNCTIONS WORKSHEETGeneral Information Site Information Analyst JM Freeway/Dir of Travel I-95 SouthboundAgency or Company Michael Baker Jr, Inc. Junction D-5 SB CD Rd to WB Connect RdDate Performed 3/5/2010 JurisdictionAnalysis Time Period PM Peak Analysis Year 2035 Build N5 fullProject Description Fampo Radco/I-95 Transportation Analysis InputsUpstream Adj Ramp
Yes����� On�����
No������ Off�����
Lup = ft
Vu = veh/h
Terrain: Rolling Downstream Adj Ramp
Yes����� On�����
No������ Off�����
Ldown = ft
VD = veh/h S FF = 70.0 mph SFR = 60.0 mph
Sketch ( show lanes, LA, LD,VR,Vf)
Conversion to pc/h Under Base Conditions (pc/h) V
(Veh/hr) PHF Terrain %Truck %Rv fHV fp v = V/PHF x fHV x fp
Freeway 3710 0.97 Rolling 13 0 0.837 1.00 4571 Ramp 270 0.97 Rolling 13 0 0.837 1.00 333 UpStream DownStream
Merge Areas Diverge AreasEstimation of v12 Estimation of v12
V12 = VF ( PFM )LEQ = (Equation 25-2 or 25-3)PFM = using Equation (Exhibit 25-5) V12 = pc/h V3 or Vav34 pc/h (Equation 25-4 or 25-5) Is V3 or Vav34 > 2,700 pc/h? Yes No����� �����
Is V3 or Vav34 > 1.5 * V12/2 Yes No����� �����
If Yes,V12a = pc/h (Equation 25-8)
V12 = VR + (VF - VR)PFDLEQ = (Equation 25-8 or 25-9) PFD = 1.000 using Equation (Exhibit 25-12) V12 = 4571 pc/h V3 or Vav34 0 pc/h (Equation 25-15 or 25-16) Is V3 or Vav34 > 2,700 pc/h? Yes No����� ������
Is V3 or Vav34 > 1.5 * V12/2 Yes No����� ������
If Yes,V12a = pc/h (Equation 25-18)
Capacity Checks Capacity ChecksActual Capacity LOS F? Actual Capacity LOS F?
VFO Exhibit 25-7
VF 4571 Exhibit 25-14 4800 NoVFO = VF - VR 4238 Exhibit 25-14 4800 No
VR 333 Exhibit 25-3 2200 No
Flow Entering Merge Influence Area Flow Entering Merge Influence AreaActual Max Desirable Violation? Actual Max Desirable Violation?
VR12 Exhibit 25-7 V12 4571 Exhibit 25-14 4400:All NoLevel of Service Determination (if not F) Level of Service Determination (if not F)
DR = 5.475 + 0.00734 v R + 0.0078 V12 - 0.00627 LA
DR = (pc/mi/ln)LOS = (Exhibit 25-4)
DR = 4.252 + 0.0086 V12 - 0.0009 LD
DR = 34.6 (pc/mi/ln)LOS = D (Exhibit 25-4)
Speed Determination Speed DeterminationMS = (Exibit 25-19) SR= mph (Exhibit 25-19) S0= mph (Exhibit 25-19) S = mph (Exhibit 25-14)
Ds = 0.133 (Exhibit 25-19) SR= 66.3 mph (Exhibit 25-19) S0= N/A mph (Exhibit 25-19) S = 66.3 mph (Exhibit 25-15)
Copyright © 2005 University of Florida, All Rights Reserved HCS+TM Version 5.21 Generated: 7/8/2010 4:15 PM
Page 1 of 1RAMPS AND RAMP JUNCTIONS WORKSHEET
7/8/2010file://C:\Documents and Settings\JMasinick\Local Settings\Temp\r2k20BC.tmp
D-64

RAMPS AND RAMP JUNCTIONS WORKSHEETGeneral Information Site Information Analyst JM Freeway/Dir of Travel SBAgency or Company Michael Baker Jr, Inc Junction D-6 SB 95 to WB 3Date Performed 03-05-10 JurisdictionAnalysis Time Period AM peak Analysis Year 2035 Build N5 FullProject Description Fampo Radco/I-95 Transportation Analysis InputsUpstream Adj Ramp
Yes����� On�����
No������ Off�����
Lup = ft
Vu = veh/h
Terrain: Rolling Downstream Adj Ramp
Yes������ On������
No����� Off�����
Ldown = 1000 ft
VD = 310 veh/h S FF = 70.0 mph SFR = 50.0 mph
Sketch ( show lanes, LA, LD,VR,Vf)
Conversion to pc/h Under Base Conditions (pc/h) V
(Veh/hr) PHF Terrain %Truck %Rv fHV fp v = V/PHF x fHV x fp
Freeway 3780 0.97 Rolling 18 0 0.787 1.00 4949 Ramp 500 0.95 Rolling 18 0 0.787 1.00 668 UpStream DownStream 310 0.88 Rolling 18 0 0.787 1.00 447
Merge Areas Diverge AreasEstimation of v12 Estimation of v12
V12 = VF ( PFM )LEQ = (Equation 25-2 or 25-3)PFM = using Equation (Exhibit 25-5) V12 = pc/h V3 or Vav34 pc/h (Equation 25-4 or 25-5) Is V3 or Vav34 > 2,700 pc/h? Yes No����� �����
Is V3 or Vav34 > 1.5 * V12/2 Yes No����� �����
If Yes,V12a = pc/h (Equation 25-8)
V12 = VR + (VF - VR)PFDLEQ = (Equation 25-8 or 25-9) PFD = 0.606 using Equation (Exhibit 25-12) V12 = 3260 pc/h V3 or Vav34 1689 pc/h (Equation 25-15 or 25-16) Is V3 or Vav34 > 2,700 pc/h? Yes No����� ������
Is V3 or Vav34 > 1.5 * V12/2 Yes No����� ������
If Yes,V12a = pc/h (Equation 25-18)
Capacity Checks Capacity ChecksActual Capacity LOS F? Actual Capacity LOS F?
VFO Exhibit 25-7
VF 4949 Exhibit 25-14 7200 NoVFO = VF - VR 4281 Exhibit 25-14 7200 No
VR 668 Exhibit 25-3 2100 No
Flow Entering Merge Influence Area Flow Entering Merge Influence AreaActual Max Desirable Violation? Actual Max Desirable Violation?
VR12 Exhibit 25-7 V12 3260 Exhibit 25-14 4400:All NoLevel of Service Determination (if not F) Level of Service Determination (if not F)
DR = 5.475 + 0.00734 v R + 0.0078 V12 - 0.00627 LA
DR = (pc/mi/ln)LOS = (Exhibit 25-4)
DR = 4.252 + 0.0086 V12 - 0.0009 LD
DR = 18.8 (pc/mi/ln)LOS = B (Exhibit 25-4)
Speed Determination Speed DeterminationMS = (Exibit 25-19) SR= mph (Exhibit 25-19) S0= mph (Exhibit 25-19) S = mph (Exhibit 25-14)
Ds = 0.293 (Exhibit 25-19) SR= 61.8 mph (Exhibit 25-19) S0= 74.1 mph (Exhibit 25-19) S = 65.5 mph (Exhibit 25-15)
Copyright © 2005 University of Florida, All Rights Reserved HCS+TM Version 5.21 Generated: 7/8/2010 4:15 PM
Page 1 of 1RAMPS AND RAMP JUNCTIONS WORKSHEET
7/8/2010file://C:\Documents and Settings\JMasinick\Local Settings\Temp\r2k20C1.tmp
D-65

RAMPS AND RAMP JUNCTIONS WORKSHEETGeneral Information Site Information Analyst JM Freeway/Dir of Travel SBAgency or Company Michael Baker Jr, Inc Junction D-6 SB 95 to WB 3Date Performed 03-05-10 JurisdictionAnalysis Time Period PM peak Analysis Year 2035 Build N5 FULLProject Description Fampo Radco/I-95 Transportation Analysis InputsUpstream Adj Ramp
Yes����� On�����
No������ Off�����
Lup = ft
Vu = veh/h
Terrain: Rolling Downstream Adj Ramp
Yes������ On������
No����� Off�����
Ldown = 1000 ft
VD = 590 veh/h S FF = 70.0 mph SFR = 50.0 mph
Sketch ( show lanes, LA, LD,VR,Vf)
Conversion to pc/h Under Base Conditions (pc/h) V
(Veh/hr) PHF Terrain %Truck %Rv fHV fp v = V/PHF x fHV x fp
Freeway 5630 0.97 Rolling 13 0 0.837 1.00 6936 Ramp 1830 0.95 Rolling 13 0 0.837 1.00 2302 UpStream DownStream 590 0.96 Rolling 13 0 0.837 1.00 734
Merge Areas Diverge AreasEstimation of v12 Estimation of v12
V12 = VF ( PFM )LEQ = (Equation 25-2 or 25-3)PFM = using Equation (Exhibit 25-5) V12 = pc/h V3 or Vav34 pc/h (Equation 25-4 or 25-5) Is V3 or Vav34 > 2,700 pc/h? Yes No����� �����
Is V3 or Vav34 > 1.5 * V12/2 Yes No����� �����
If Yes,V12a = pc/h (Equation 25-8)
V12 = VR + (VF - VR)PFDLEQ = (Equation 25-8 or 25-9) PFD = 0.481 using Equation (Exhibit 25-12) V12 = 4530 pc/h V3 or Vav34 2406 pc/h (Equation 25-15 or 25-16) Is V3 or Vav34 > 2,700 pc/h? Yes No����� ������
Is V3 or Vav34 > 1.5 * V12/2 Yes No����� ������
If Yes,V12a = pc/h (Equation 25-18)
Capacity Checks Capacity ChecksActual Capacity LOS F? Actual Capacity LOS F?
VFO Exhibit 25-7
VF 6936 Exhibit 25-14 7200 NoVFO = VF - VR 4634 Exhibit 25-14 7200 No
VR 2302 Exhibit 25-3 2100 Yes
Flow Entering Merge Influence Area Flow Entering Merge Influence AreaActual Max Desirable Violation? Actual Max Desirable Violation?
VR12 Exhibit 25-7 V12 4530 Exhibit 25-14 4400:All NoLevel of Service Determination (if not F) Level of Service Determination (if not F)
DR = 5.475 + 0.00734 v R + 0.0078 V12 - 0.00627 LA
DR = (pc/mi/ln)LOS = (Exhibit 25-4)
DR = 4.252 + 0.0086 V12 - 0.0009 LD
DR = 29.7 (pc/mi/ln)LOS = F (Exhibit 25-4)
Speed Determination Speed DeterminationMS = (Exibit 25-19) SR= mph (Exhibit 25-19) S0= mph (Exhibit 25-19) S = mph (Exhibit 25-14)
Ds = 0.440 (Exhibit 25-19) SR= 57.7 mph (Exhibit 25-19) S0= 71.3 mph (Exhibit 25-19) S = 61.8 mph (Exhibit 25-15)
Copyright © 2005 University of Florida, All Rights Reserved HCS+TM Version 5.21 Generated: 7/8/2010 4:16 PM
Page 1 of 1RAMPS AND RAMP JUNCTIONS WORKSHEET
7/8/2010file://C:\Documents and Settings\JMasinick\Local Settings\Temp\r2k20C6.tmp
D-66

RAMPS AND RAMP JUNCTIONS WORKSHEETGeneral Information Site Information Analyst JM Freeway/Dir of Travel NBAgency or Company Michael Baker Jr, Inc Junction D-7 NB 95 to WB ConnectorDate Performed 7-7-10 JurisdictionAnalysis Time Period AM peak Analysis Year 2035 Build ConditionsProject Description Radco/I-95 Transportation AnalysisInputsUpstream Adj Ramp
Yes����� On�����
No������ Off�����
Lup = ft
Vu = veh/h
Terrain: Rolling Downstream Adj Ramp
Yes����� On�����
No������ Off�����
Ldown = ft
VD = veh/h S FF = 70.0 mph SFR = 50.0 mph
Sketch ( show lanes, LA, LD,VR,Vf)
Conversion to pc/h Under Base Conditions (pc/h) V
(Veh/hr) PHF Terrain %Truck %Rv fHV fp v = V/PHF x fHV x fp
Freeway 4870 0.97 Rolling 13 0 0.837 1.00 6000 Ramp 170 0.97 Rolling 13 0 0.837 1.00 209 UpStream DownStream
Merge Areas Diverge AreasEstimation of v12 Estimation of v12
V12 = VF ( PFM )LEQ = (Equation 25-2 or 25-3)PFM = using Equation (Exhibit 25-5) V12 = pc/h V3 or Vav34 pc/h (Equation 25-4 or 25-5) Is V3 or Vav34 > 2,700 pc/h? Yes No����� �����
Is V3 or Vav34 > 1.5 * V12/2 Yes No����� �����
If Yes,V12a = pc/h (Equation 25-8)
V12 = VR + (VF - VR)PFDLEQ = (Equation 25-8 or 25-9) PFD = 0.600 using Equation (Exhibit 25-12) V12 = 3686 pc/h V3 or Vav34 2314 pc/h (Equation 25-15 or 25-16) Is V3 or Vav34 > 2,700 pc/h? Yes No����� ������
Is V3 or Vav34 > 1.5 * V12/2 Yes No����� ������
If Yes,V12a = pc/h (Equation 25-18)
Capacity Checks Capacity ChecksActual Capacity LOS F? Actual Capacity LOS F?
VFO Exhibit 25-7
VF 6000 Exhibit 25-14 7200 NoVFO = VF - VR 5791 Exhibit 25-14 7200 No
VR 209 Exhibit 25-3 2100 No
Flow Entering Merge Influence Area Flow Entering Merge Influence AreaActual Max Desirable Violation? Actual Max Desirable Violation?
VR12 Exhibit 25-7 V12 3686 Exhibit 25-14 4400:All NoLevel of Service Determination (if not F) Level of Service Determination (if not F)
DR = 5.475 + 0.00734 v R + 0.0078 V12 - 0.00627 LA
DR = (pc/mi/ln)LOS = (Exhibit 25-4)
DR = 4.252 + 0.0086 V12 - 0.0009 LD
DR = 27.0 (pc/mi/ln)LOS = C (Exhibit 25-4)
Speed Determination Speed DeterminationMS = (Exibit 25-19) SR= mph (Exhibit 25-19) S0= mph (Exhibit 25-19) S = mph (Exhibit 25-14)
Ds = 0.252 (Exhibit 25-19) SR= 62.9 mph (Exhibit 25-19) S0= 71.7 mph (Exhibit 25-19) S = 66.0 mph (Exhibit 25-15)
Copyright © 2005 University of Florida, All Rights Reserved HCS+TM Version 5.21 Generated: 7/8/2010 4:16 PM
Page 1 of 1RAMPS AND RAMP JUNCTIONS WORKSHEET
7/8/2010file://C:\Documents and Settings\JMasinick\Local Settings\Temp\r2k20CB.tmp
D-67

RAMPS AND RAMP JUNCTIONS WORKSHEETGeneral Information Site Information Analyst JM Freeway/Dir of Travel NBAgency or Company Michael Baker Jr, Inc Junction D-7 NB 95 to WB ConnectorDate Performed 7-7-10 JurisdictionAnalysis Time Period PM peak Analysis Year 2035 Build ConditionsProject Description Radco/I-95 Transportation AnalysisInputsUpstream Adj Ramp
Yes����� On�����
No������ Off�����
Lup = ft
Vu = veh/h
Terrain: Rolling Downstream Adj Ramp
Yes����� On�����
No������ Off�����
Ldown = ft
VD = veh/h S FF = 70.0 mph SFR = 50.0 mph
Sketch ( show lanes, LA, LD,VR,Vf)
Conversion to pc/h Under Base Conditions (pc/h) V
(Veh/hr) PHF Terrain %Truck %Rv fHV fp v = V/PHF x fHV x fp
Freeway 5640 0.97 Rolling 12 0 0.847 1.00 6861 Ramp 290 0.97 Rolling 12 0 0.847 1.00 353 UpStream DownStream
Merge Areas Diverge AreasEstimation of v12 Estimation of v12
V12 = VF ( PFM )LEQ = (Equation 25-2 or 25-3)PFM = using Equation (Exhibit 25-5) V12 = pc/h V3 or Vav34 pc/h (Equation 25-4 or 25-5) Is V3 or Vav34 > 2,700 pc/h? Yes No����� �����
Is V3 or Vav34 > 1.5 * V12/2 Yes No����� �����
If Yes,V12a = pc/h (Equation 25-8)
V12 = VR + (VF - VR)PFDLEQ = (Equation 25-8 or 25-9) PFD = 0.572 using Equation (Exhibit 25-12) V12 = 4077 pc/h V3 or Vav34 2784 pc/h (Equation 25-15 or 25-16) Is V3 or Vav34 > 2,700 pc/h? Yes No������ �����
Is V3 or Vav34 > 1.5 * V12/2 Yes No����� ������
If Yes,V12a = 4161 pc/h (Equation 25-18)Capacity Checks Capacity Checks
Actual Capacity LOS F? Actual Capacity LOS F?
VFO Exhibit 25-7
VF 6861 Exhibit 25-14 7200 NoVFO = VF - VR 6508 Exhibit 25-14 7200 No
VR 353 Exhibit 25-3 2100 No
Flow Entering Merge Influence Area Flow Entering Merge Influence AreaActual Max Desirable Violation? Actual Max Desirable Violation?
VR12 Exhibit 25-7 V12 4077 Exhibit 25-14 4400:All NoLevel of Service Determination (if not F) Level of Service Determination (if not F)
DR = 5.475 + 0.00734 v R + 0.0078 V12 - 0.00627 LA
DR = (pc/mi/ln)LOS = (Exhibit 25-4)
DR = 4.252 + 0.0086 V12 - 0.0009 LD
DR = 31.0 (pc/mi/ln)LOS = D (Exhibit 25-4)
Speed Determination Speed DeterminationMS = (Exibit 25-19) SR= mph (Exhibit 25-19) S0= mph (Exhibit 25-19) S = mph (Exhibit 25-14)
Ds = 0.265 (Exhibit 25-19) SR= 62.6 mph (Exhibit 25-19) S0= 70.2 mph (Exhibit 25-19) S = 65.4 mph (Exhibit 25-15)
Copyright © 2005 University of Florida, All Rights Reserved HCS+TM Version 5.21 Generated: 7/8/2010 4:16 PM
Page 1 of 1RAMPS AND RAMP JUNCTIONS WORKSHEET
7/8/2010file://C:\Documents and Settings\JMasinick\Local Settings\Temp\r2k20D0.tmp
D-68

RAMPS AND RAMP JUNCTIONS WORKSHEETGeneral Information Site Information Analyst JM Freeway/Dir of Travel NBAgency or Company Michael Baker Jr, Inc Junction D-8 Connector Ramp SplitDate Performed 7-7-10 JurisdictionAnalysis Time Period AM peak Analysis Year 2035 Build ConditionsProject Description Radco/I-95 Transportation AnalysisInputsUpstream Adj Ramp
Yes����� On�����
No������ Off�����
Lup = ft
Vu = veh/h
Terrain: Rolling Downstream Adj Ramp
Yes����� On�����
No������ Off�����
Ldown = ft
VD = veh/h S FF = 60.0 mph SFR = 50.0 mph
Sketch ( show lanes, LA, LD,VR,Vf)
Conversion to pc/h Under Base Conditions (pc/h) V
(Veh/hr) PHF Terrain %Truck %Rv fHV fp v = V/PHF x fHV x fp
Freeway 2840 0.97 Rolling 13 0 0.837 1.00 3499 Ramp 790 0.85 Rolling 13 0 0.837 1.00 1111 UpStream DownStream
Merge Areas Diverge AreasEstimation of v12 Estimation of v12
V12 = VF ( PFM )LEQ = (Equation 25-2 or 25-3)PFM = using Equation (Exhibit 25-5) V12 = pc/h V3 or Vav34 pc/h (Equation 25-4 or 25-5) Is V3 or Vav34 > 2,700 pc/h? Yes No����� �����
Is V3 or Vav34 > 1.5 * V12/2 Yes No����� �����
If Yes,V12a = pc/h (Equation 25-8)
V12 = VR + (VF - VR)PFDLEQ = (Equation 25-8 or 25-9) PFD = 1.000 using Equation (Exhibit 25-12) V12 = 3499 pc/h V3 or Vav34 0 pc/h (Equation 25-15 or 25-16) Is V3 or Vav34 > 2,700 pc/h? Yes No����� ������
Is V3 or Vav34 > 1.5 * V12/2 Yes No����� ������
If Yes,V12a = pc/h (Equation 25-18)
Capacity Checks Capacity ChecksActual Capacity LOS F? Actual Capacity LOS F?
VFO Exhibit 25-7
VF 3499 Exhibit 25-14 4600 NoVFO = VF - VR 2388 Exhibit 25-14 4600 No
VR 1111 Exhibit 25-3 2100 No
Flow Entering Merge Influence Area Flow Entering Merge Influence AreaActual Max Desirable Violation? Actual Max Desirable Violation?
VR12 Exhibit 25-7 V12 3499 Exhibit 25-14 4400:All NoLevel of Service Determination (if not F) Level of Service Determination (if not F)
DR = 5.475 + 0.00734 v R + 0.0078 V12 - 0.00627 LA
DR = (pc/mi/ln)LOS = (Exhibit 25-4)
DR = 4.252 + 0.0086 V12 - 0.0009 LD
DR = 25.3 (pc/mi/ln)LOS = C (Exhibit 25-4)
Speed Determination Speed DeterminationMS = (Exibit 25-19) SR= mph (Exhibit 25-19) S0= mph (Exhibit 25-19) S = mph (Exhibit 25-14)
Ds = 0.333 (Exhibit 25-19) SR= 54.0 mph (Exhibit 25-19) S0= N/A mph (Exhibit 25-19) S = 54.0 mph (Exhibit 25-15)
Copyright © 2005 University of Florida, All Rights Reserved HCS+TM Version 5.21 Generated: 7/8/2010 4:17 PM
Page 1 of 1RAMPS AND RAMP JUNCTIONS WORKSHEET
7/8/2010file://C:\Documents and Settings\JMasinick\Local Settings\Temp\r2k20D6.tmp
D-69

RAMPS AND RAMP JUNCTIONS WORKSHEETGeneral Information Site Information Analyst JM Freeway/Dir of Travel NBAgency or Company Michael Baker Jr, Inc Junction D-8 Connector Ramp SplitDate Performed 7-7-10 JurisdictionAnalysis Time Period PM peak Analysis Year 2035 Build ConditionsProject Description Radco/I-95 Transportation AnalysisInputsUpstream Adj Ramp
Yes����� On�����
No������ Off�����
Lup = ft
Vu = veh/h
Terrain: Rolling Downstream Adj Ramp
Yes����� On�����
No������ Off�����
Ldown = ft
VD = veh/h S FF = 60.0 mph SFR = 50.0 mph
Sketch ( show lanes, LA, LD,VR,Vf)
Conversion to pc/h Under Base Conditions (pc/h) V
(Veh/hr) PHF Terrain %Truck %Rv fHV fp v = V/PHF x fHV x fp
Freeway 1330 0.97 Rolling 12 0 0.847 1.00 1618 Ramp 460 0.96 Rolling 12 0 0.847 1.00 565 UpStream DownStream
Merge Areas Diverge AreasEstimation of v12 Estimation of v12
V12 = VF ( PFM )LEQ = (Equation 25-2 or 25-3)PFM = using Equation (Exhibit 25-5) V12 = pc/h V3 or Vav34 pc/h (Equation 25-4 or 25-5) Is V3 or Vav34 > 2,700 pc/h? Yes No����� �����
Is V3 or Vav34 > 1.5 * V12/2 Yes No����� �����
If Yes,V12a = pc/h (Equation 25-8)
V12 = VR + (VF - VR)PFDLEQ = (Equation 25-8 or 25-9) PFD = 1.000 using Equation (Exhibit 25-12) V12 = 1618 pc/h V3 or Vav34 0 pc/h (Equation 25-15 or 25-16) Is V3 or Vav34 > 2,700 pc/h? Yes No����� ������
Is V3 or Vav34 > 1.5 * V12/2 Yes No����� ������
If Yes,V12a = pc/h (Equation 25-18)
Capacity Checks Capacity ChecksActual Capacity LOS F? Actual Capacity LOS F?
VFO Exhibit 25-7
VF 1618 Exhibit 25-14 4600 NoVFO = VF - VR 1053 Exhibit 25-14 4600 No
VR 565 Exhibit 25-3 2100 No
Flow Entering Merge Influence Area Flow Entering Merge Influence AreaActual Max Desirable Violation? Actual Max Desirable Violation?
VR12 Exhibit 25-7 V12 1618 Exhibit 25-14 4400:All NoLevel of Service Determination (if not F) Level of Service Determination (if not F)
DR = 5.475 + 0.00734 v R + 0.0078 V12 - 0.00627 LA
DR = (pc/mi/ln)LOS = (Exhibit 25-4)
DR = 4.252 + 0.0086 V12 - 0.0009 LD
DR = 9.2 (pc/mi/ln)LOS = A (Exhibit 25-4)
Speed Determination Speed DeterminationMS = (Exibit 25-19) SR= mph (Exhibit 25-19) S0= mph (Exhibit 25-19) S = mph (Exhibit 25-14)
Ds = 0.284 (Exhibit 25-19) SR= 54.9 mph (Exhibit 25-19) S0= N/A mph (Exhibit 25-19) S = 54.9 mph (Exhibit 25-15)
Copyright © 2005 University of Florida, All Rights Reserved HCS+TM Version 5.21 Generated: 7/8/2010 4:17 PM
Page 1 of 1RAMPS AND RAMP JUNCTIONS WORKSHEET
7/8/2010file://C:\Documents and Settings\JMasinick\Local Settings\Temp\r2k20DB.tmp
D-70

RAMPS AND RAMP JUNCTIONS WORKSHEETGeneral Information Site Information Analyst JM Freeway/Dir of Travel SBAgency or Company Michael Baker Jr, Inc Junction D-9 SB C/D Rd to 17 NBDate Performed 7-7-10 JurisdictionAnalysis Time Period AM peak Analysis Year 2035 Build N5 FullProject Description Fampo Radco/I-95 Transportation Analysis InputsUpstream Adj Ramp
Yes����� On�����
No������ Off�����
Lup = ft
Vu = veh/h
Terrain: Rolling Downstream Adj Ramp
Yes����� On�����
No������ Off�����
Ldown = ft
VD = veh/h S FF = 60.0 mph SFR = 50.0 mph
Sketch ( show lanes, LA, LD,VR,Vf)
Conversion to pc/h Under Base Conditions (pc/h) V
(Veh/hr) PHF Terrain %Truck %Rv fHV fp v = V/PHF x fHV x fp
Freeway 1080 0.96 Rolling 18 0 0.787 1.00 1429 Ramp 700 0.88 Rolling 18 0 0.787 1.00 1010 UpStream DownStream
Merge Areas Diverge AreasEstimation of v12 Estimation of v12
V12 = VF ( PFM )LEQ = (Equation 25-2 or 25-3)PFM = using Equation (Exhibit 25-5) V12 = pc/h V3 or Vav34 pc/h (Equation 25-4 or 25-5) Is V3 or Vav34 > 2,700 pc/h? Yes No����� �����
Is V3 or Vav34 > 1.5 * V12/2 Yes No����� �����
If Yes,V12a = pc/h (Equation 25-8)
V12 = VR + (VF - VR)PFDLEQ = (Equation 25-8 or 25-9) PFD = 1.000 using Equation (Exhibit 25-12) V12 = 1429 pc/h V3 or Vav34 0 pc/h (Equation 25-15 or 25-16) Is V3 or Vav34 > 2,700 pc/h? Yes No����� ������
Is V3 or Vav34 > 1.5 * V12/2 Yes No����� ������
If Yes,V12a = pc/h (Equation 25-18)
Capacity Checks Capacity ChecksActual Capacity LOS F? Actual Capacity LOS F?
VFO Exhibit 25-7
VF 1429 Exhibit 25-14 4600 NoVFO = VF - VR 419 Exhibit 25-14 4600 No
VR 1010 Exhibit 25-3 2100 No
Flow Entering Merge Influence Area Flow Entering Merge Influence AreaActual Max Desirable Violation? Actual Max Desirable Violation?
VR12 Exhibit 25-7 V12 1429 Exhibit 25-14 4400:All NoLevel of Service Determination (if not F) Level of Service Determination (if not F)
DR = 5.475 + 0.00734 v R + 0.0078 V12 - 0.00627 LA
DR = (pc/mi/ln)LOS = (Exhibit 25-4)
DR = 4.252 + 0.0086 V12 - 0.0009 LD
DR = 7.5 (pc/mi/ln)LOS = A (Exhibit 25-4)
Speed Determination Speed DeterminationMS = (Exibit 25-19) SR= mph (Exhibit 25-19) S0= mph (Exhibit 25-19) S = mph (Exhibit 25-14)
Ds = 0.324 (Exhibit 25-19) SR= 54.2 mph (Exhibit 25-19) S0= N/A mph (Exhibit 25-19) S = 54.2 mph (Exhibit 25-15)
Copyright © 2005 University of Florida, All Rights Reserved HCS+TM Version 5.21 Generated: 7/8/2010 4:17 PM
Page 1 of 1RAMPS AND RAMP JUNCTIONS WORKSHEET
7/8/2010file://C:\Documents and Settings\JMasinick\Local Settings\Temp\r2k20E0.tmp
D-71

RAMPS AND RAMP JUNCTIONS WORKSHEETGeneral Information Site Information Analyst JM Freeway/Dir of Travel SBAgency or Company Michael Baker Jr, Inc Junction D-9 SB C/D Rd to 17 NBDate Performed 7-7-10 JurisdictionAnalysis Time Period PM Peak Analysis Year 2035 Build N5 FullProject Description Fampo Radco/I-95 Transportation Analysis InputsUpstream Adj Ramp
Yes����� On�����
No������ Off�����
Lup = ft
Vu = veh/h
Terrain: Rolling Downstream Adj Ramp
Yes����� On�����
No������ Off�����
Ldown = ft
VD = veh/h S FF = 60.0 mph SFR = 50.0 mph
Sketch ( show lanes, LA, LD,VR,Vf)
Conversion to pc/h Under Base Conditions (pc/h) V
(Veh/hr) PHF Terrain %Truck %Rv fHV fp v = V/PHF x fHV x fp
Freeway 1320 0.97 Rolling 13 0 0.837 1.00 1626 Ramp 790 0.98 Rolling 13 0 0.837 1.00 963 UpStream DownStream
Merge Areas Diverge AreasEstimation of v12 Estimation of v12
V12 = VF ( PFM )LEQ = (Equation 25-2 or 25-3)PFM = using Equation (Exhibit 25-5) V12 = pc/h V3 or Vav34 pc/h (Equation 25-4 or 25-5) Is V3 or Vav34 > 2,700 pc/h? Yes No����� �����
Is V3 or Vav34 > 1.5 * V12/2 Yes No����� �����
If Yes,V12a = pc/h (Equation 25-8)
V12 = VR + (VF - VR)PFDLEQ = (Equation 25-8 or 25-9) PFD = 1.000 using Equation (Exhibit 25-12) V12 = 1626 pc/h V3 or Vav34 0 pc/h (Equation 25-15 or 25-16) Is V3 or Vav34 > 2,700 pc/h? Yes No����� ������
Is V3 or Vav34 > 1.5 * V12/2 Yes No����� ������
If Yes,V12a = pc/h (Equation 25-18)
Capacity Checks Capacity ChecksActual Capacity LOS F? Actual Capacity LOS F?
VFO Exhibit 25-7
VF 1626 Exhibit 25-14 4600 NoVFO = VF - VR 663 Exhibit 25-14 4600 No
VR 963 Exhibit 25-3 2100 No
Flow Entering Merge Influence Area Flow Entering Merge Influence AreaActual Max Desirable Violation? Actual Max Desirable Violation?
VR12 Exhibit 25-7 V12 1626 Exhibit 25-14 4400:All NoLevel of Service Determination (if not F) Level of Service Determination (if not F)
DR = 5.475 + 0.00734 v R + 0.0078 V12 - 0.00627 LA
DR = (pc/mi/ln)LOS = (Exhibit 25-4)
DR = 4.252 + 0.0086 V12 - 0.0009 LD
DR = 9.2 (pc/mi/ln)LOS = A (Exhibit 25-4)
Speed Determination Speed DeterminationMS = (Exibit 25-19) SR= mph (Exhibit 25-19) S0= mph (Exhibit 25-19) S = mph (Exhibit 25-14)
Ds = 0.320 (Exhibit 25-19) SR= 54.2 mph (Exhibit 25-19) S0= N/A mph (Exhibit 25-19) S = 54.2 mph (Exhibit 25-15)
Copyright © 2005 University of Florida, All Rights Reserved HCS+TM Version 5.21 Generated: 7/8/2010 4:17 PM
Page 1 of 1RAMPS AND RAMP JUNCTIONS WORKSHEET
7/8/2010file://C:\Documents and Settings\JMasinick\Local Settings\Temp\r2k20E5.tmp
D-72

RAMPS AND RAMP JUNCTIONS WORKSHEETGeneral Information Site Information Analyst JM Freeway/Dir of Travel SBAgency or Company Michael Baker Jr, Inc Junction D-10 SB 95 to SB C/D RdDate Performed 7-7-10 JurisdictionAnalysis Time Period AM peak Analysis Year 2035 Build N5 FullProject Description Fampo Radco/I-95 Transportation Analysis InputsUpstream Adj Ramp
Yes����� On�����
No������ Off�����
Lup = ft
Vu = veh/h
Terrain: Rolling Downstream Adj Ramp
Yes����� On�����
No������ Off�����
Ldown = ft
VD = veh/h S FF = 70.0 mph SFR = 60.0 mph
Sketch ( show lanes, LA, LD,VR,Vf)
Conversion to pc/h Under Base Conditions (pc/h) V
(Veh/hr) PHF Terrain %Truck %Rv fHV fp v = V/PHF x fHV x fp
Freeway 3080 0.96 Rolling 18 0 0.787 1.00 4075 Ramp 810 0.96 Rolling 18 0 0.787 1.00 1072 UpStream DownStream
Merge Areas Diverge AreasEstimation of v12 Estimation of v12
V12 = VF ( PFM )LEQ = (Equation 25-2 or 25-3)PFM = using Equation (Exhibit 25-5) V12 = pc/h V3 or Vav34 pc/h (Equation 25-4 or 25-5) Is V3 or Vav34 > 2,700 pc/h? Yes No����� �����
Is V3 or Vav34 > 1.5 * V12/2 Yes No����� �����
If Yes,V12a = pc/h (Equation 25-8)
V12 = VR + (VF - VR)PFDLEQ = (Equation 25-8 or 25-9) PFD = 0.450 using Equation (Exhibit 25-12) V12 = 2423 pc/h V3 or Vav34 1652 pc/h (Equation 25-15 or 25-16) Is V3 or Vav34 > 2,700 pc/h? Yes No����� ������
Is V3 or Vav34 > 1.5 * V12/2 Yes No����� ������
If Yes,V12a = pc/h (Equation 25-18)
Capacity Checks Capacity ChecksActual Capacity LOS F? Actual Capacity LOS F?
VFO Exhibit 25-7
VF 4075 Exhibit 25-14 7200 NoVFO = VF - VR 3003 Exhibit 25-14 7200 No
VR 1072 Exhibit 25-3 4400 No
Flow Entering Merge Influence Area Flow Entering Merge Influence AreaActual Max Desirable Violation? Actual Max Desirable Violation?
VR12 Exhibit 25-7 V12 2423 Exhibit 25-14 4400:All NoLevel of Service Determination (if not F) Level of Service Determination (if not F)
DR = 5.475 + 0.00734 v R + 0.0078 V12 - 0.00627 LA
DR = (pc/mi/ln)LOS = (Exhibit 25-4)
DR = 4.252 + 0.0086 V12 - 0.0009 LD
DR = 7.1 (pc/mi/ln)LOS = A (Exhibit 25-4)
Speed Determination Speed DeterminationMS = (Exibit 25-19) SR= mph (Exhibit 25-19) S0= mph (Exhibit 25-19) S = mph (Exhibit 25-14)
Ds = 0.199 (Exhibit 25-19) SR= 64.4 mph (Exhibit 25-19) S0= 74.2 mph (Exhibit 25-19) S = 68.1 mph (Exhibit 25-15)
Copyright © 2005 University of Florida, All Rights Reserved HCS+TM Version 5.21 Generated: 7/8/2010 4:18 PM
Page 1 of 1RAMPS AND RAMP JUNCTIONS WORKSHEET
7/8/2010file://C:\Documents and Settings\JMasinick\Local Settings\Temp\r2k20EA.tmp
D-73

RAMPS AND RAMP JUNCTIONS WORKSHEETGeneral Information Site Information Analyst JM Freeway/Dir of Travel SBAgency or Company Michael Baker Jr, Inc Junction D-10 SB 95 to SB C/D RdDate Performed 7-7-10 JurisdictionAnalysis Time Period PM Peak Analysis Year 2035 Build N5 FullProject Description Fampo Radco/I-95 Transportation Analysis InputsUpstream Adj Ramp
Yes����� On�����
No������ Off�����
Lup = ft
Vu = veh/h
Terrain: Rolling Downstream Adj Ramp
Yes����� On�����
No������ Off�����
Ldown = ft
VD = veh/h S FF = 70.0 mph SFR = 60.0 mph
Sketch ( show lanes, LA, LD,VR,Vf)
Conversion to pc/h Under Base Conditions (pc/h) V
(Veh/hr) PHF Terrain %Truck %Rv fHV fp v = V/PHF x fHV x fp
Freeway 5680 0.97 Rolling 13 0 0.837 1.00 6998 Ramp 2870 0.97 Rolling 13 0 0.837 1.00 3536 UpStream DownStream
Merge Areas Diverge AreasEstimation of v12 Estimation of v12
V12 = VF ( PFM )LEQ = (Equation 25-2 or 25-3)PFM = using Equation (Exhibit 25-5) V12 = pc/h V3 or Vav34 pc/h (Equation 25-4 or 25-5) Is V3 or Vav34 > 2,700 pc/h? Yes No����� �����
Is V3 or Vav34 > 1.5 * V12/2 Yes No����� �����
If Yes,V12a = pc/h (Equation 25-8)
V12 = VR + (VF - VR)PFDLEQ = (Equation 25-8 or 25-9) PFD = 0.450 using Equation (Exhibit 25-12) V12 = 5094 pc/h V3 or Vav34 1904 pc/h (Equation 25-15 or 25-16) Is V3 or Vav34 > 2,700 pc/h? Yes No����� ������
Is V3 or Vav34 > 1.5 * V12/2 Yes No����� ������
If Yes,V12a = pc/h (Equation 25-18)
Capacity Checks Capacity ChecksActual Capacity LOS F? Actual Capacity LOS F?
VFO Exhibit 25-7
VF 6998 Exhibit 25-14 7200 NoVFO = VF - VR 3462 Exhibit 25-14 7200 No
VR 3536 Exhibit 25-3 4400 No
Flow Entering Merge Influence Area Flow Entering Merge Influence AreaActual Max Desirable Violation? Actual Max Desirable Violation?
VR12 Exhibit 25-7 V12 5094 Exhibit 25-14 4400:All NoLevel of Service Determination (if not F) Level of Service Determination (if not F)
DR = 5.475 + 0.00734 v R + 0.0078 V12 - 0.00627 LA
DR = (pc/mi/ln)LOS = (Exhibit 25-4)
DR = 4.252 + 0.0086 V12 - 0.0009 LD
DR = 25.6 (pc/mi/ln)LOS = C (Exhibit 25-4)
Speed Determination Speed DeterminationMS = (Exibit 25-19) SR= mph (Exhibit 25-19) S0= mph (Exhibit 25-19) S = mph (Exhibit 25-14)
Ds = 0.421 (Exhibit 25-19) SR= 58.2 mph (Exhibit 25-19) S0= 73.3 mph (Exhibit 25-19) S = 61.7 mph (Exhibit 25-15)
Copyright © 2005 University of Florida, All Rights Reserved HCS+TM Version 5.21 Generated: 7/8/2010 4:18 PM
Page 1 of 1RAMPS AND RAMP JUNCTIONS WORKSHEET
7/8/2010file://C:\Documents and Settings\JMasinick\Local Settings\Temp\r2k20EF.tmp
D-74

RAMPS AND RAMP JUNCTIONS WORKSHEETGeneral Information Site Information Analyst JM Freeway/Dir of Travel NBAgency or Company Michael Baker Jr, Inc Junction M-1 Rt 3 WB to 95 NBDate Performed 03-05-10 JurisdictionAnalysis Time Period AM peak Analysis Year 2035 Build N5 fullProject Description Fampo Radco/I-95 Transportation Analysis InputsUpstream Adj Ramp
Yes������ On�����
No����� Off������
Lup = 1000 ft
Vu = 390 veh/h
Terrain: Rolling Downstream Adj Ramp
Yes����� On�����
No������ Off�����
Ldown = ft
VD = veh/h S FF = 70.0 mph SFR = 50.0 mph
Sketch ( show lanes, LA, LD,VR,Vf)
Conversion to pc/h Under Base Conditions (pc/h) V
(Veh/hr) PHF Terrain %Truck %Rv fHV fp v = V/PHF x fHV x fp
Freeway 3820 0.97 Rolling 13 0 0.837 1.00 4706 Ramp 1050 0.99 Rolling 13 0 0.837 1.00 1267 UpStream 390 0.88 Rolling 13 0 0.837 1.00 530 DownStream
Merge Areas Diverge AreasEstimation of v12 Estimation of v12
V12 = VF ( PFM )LEQ = 2157.22 (Equation 25-2 or 25-3)PFM = 0.546 using Equation (Exhibit 25-5) V12 = 2572 pc/h
V3 or Vav342134 pc/h (Equation 25-4 or 25-5)
Is V3 or Vav34 > 2,700 pc/h? Yes No����� ������
Is V3 or Vav34 > 1.5 * V12/2 Yes No������ �����
If Yes,V12a = 2689 pc/h (Equation 25-8)
V12 = VR + (VF - VR)PFDLEQ = (Equation 25-8 or 25-9) PFD = using Equation (Exhibit 25-12) V12 = pc/h V3 or Vav34 pc/h (Equation 25-15 or 25-16) Is V3 or Vav34 > 2,700 pc/h? Yes No����� �����
Is V3 or Vav34 > 1.5 * V12/2 Yes No����� �����
If Yes,V12a = pc/h (Equation 25-18)
Capacity Checks Capacity ChecksActual Capacity LOS F? Actual Capacity LOS F?
VFO 5973 Exhibit 25-7 No
VF Exhibit 25-14VFO = VF - VR Exhibit 25-14
VR Exhibit 25-3
Flow Entering Merge Influence Area Flow Entering Merge Influence AreaActual Max Desirable Violation? Actual Max Desirable Violation?
VR12 3956 Exhibit 25-7 4600:All No V12 Exhibit 25-14Level of Service Determination (if not F) Level of Service Determination (if not F)
DR = 5.475 + 0.00734 v R + 0.0078 V12 - 0.00627 LADR = 26.3 (pc/mi/ln) LOS = C (Exhibit 25-4)
DR = 4.252 + 0.0086 V12 - 0.0009 LD
DR = (pc/mi/ln)LOS = (Exhibit 25-4)
Speed Determination Speed DeterminationMS = 0.375 (Exibit 25-19) SR= 59.5 mph (Exhibit 25-19) S0= 64.5 mph (Exhibit 25-19) S = 61.1 mph (Exhibit 25-14)
Ds = (Exhibit 25-19) SR= mph (Exhibit 25-19) S0= mph (Exhibit 25-19) S = mph (Exhibit 25-15)
Copyright © 2005 University of Florida, All Rights Reserved HCS+TM Version 5.21 Generated: 7/8/2010 4:22 PM
Page 1 of 1RAMPS AND RAMP JUNCTIONS WORKSHEET
7/8/2010file://C:\Documents and Settings\JMasinick\Local Settings\Temp\r2k20F4.tmp
D-75
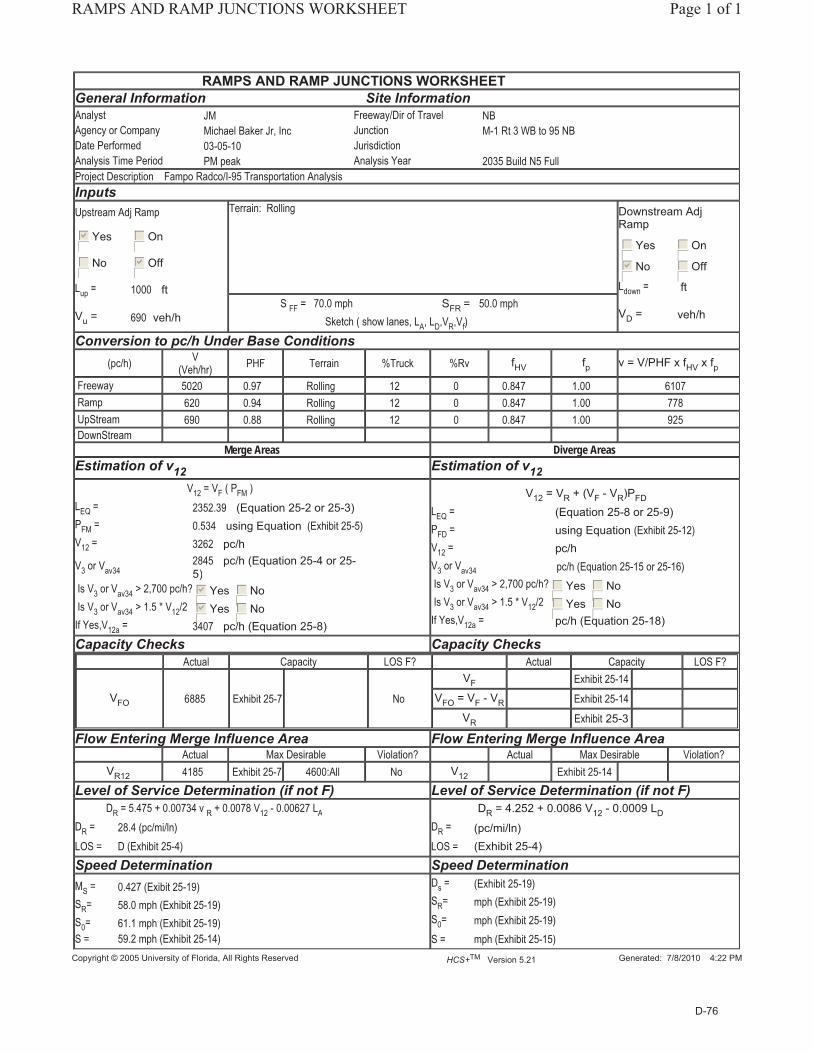
RAMPS AND RAMP JUNCTIONS WORKSHEETGeneral Information Site Information Analyst JM Freeway/Dir of Travel NBAgency or Company Michael Baker Jr, Inc Junction M-1 Rt 3 WB to 95 NBDate Performed 03-05-10 JurisdictionAnalysis Time Period PM peak Analysis Year 2035 Build N5 FullProject Description Fampo Radco/I-95 Transportation Analysis InputsUpstream Adj Ramp
Yes������ On�����
No����� Off������
Lup = 1000 ft
Vu = 690 veh/h
Terrain: Rolling Downstream Adj Ramp
Yes����� On�����
No������ Off�����
Ldown = ft
VD = veh/h S FF = 70.0 mph SFR = 50.0 mph
Sketch ( show lanes, LA, LD,VR,Vf)
Conversion to pc/h Under Base Conditions (pc/h) V
(Veh/hr) PHF Terrain %Truck %Rv fHV fp v = V/PHF x fHV x fp
Freeway 5020 0.97 Rolling 12 0 0.847 1.00 6107 Ramp 620 0.94 Rolling 12 0 0.847 1.00 778 UpStream 690 0.88 Rolling 12 0 0.847 1.00 925 DownStream
Merge Areas Diverge AreasEstimation of v12 Estimation of v12
V12 = VF ( PFM )LEQ = 2352.39 (Equation 25-2 or 25-3)PFM = 0.534 using Equation (Exhibit 25-5) V12 = 3262 pc/h
V3 or Vav342845 pc/h (Equation 25-4 or 25-5)
Is V3 or Vav34 > 2,700 pc/h? Yes No������ �����
Is V3 or Vav34 > 1.5 * V12/2 Yes No������ �����
If Yes,V12a = 3407 pc/h (Equation 25-8)
V12 = VR + (VF - VR)PFDLEQ = (Equation 25-8 or 25-9) PFD = using Equation (Exhibit 25-12) V12 = pc/h V3 or Vav34 pc/h (Equation 25-15 or 25-16) Is V3 or Vav34 > 2,700 pc/h? Yes No����� �����
Is V3 or Vav34 > 1.5 * V12/2 Yes No����� �����
If Yes,V12a = pc/h (Equation 25-18)
Capacity Checks Capacity ChecksActual Capacity LOS F? Actual Capacity LOS F?
VFO 6885 Exhibit 25-7 No
VF Exhibit 25-14VFO = VF - VR Exhibit 25-14
VR Exhibit 25-3
Flow Entering Merge Influence Area Flow Entering Merge Influence AreaActual Max Desirable Violation? Actual Max Desirable Violation?
VR12 4185 Exhibit 25-7 4600:All No V12 Exhibit 25-14Level of Service Determination (if not F) Level of Service Determination (if not F)
DR = 5.475 + 0.00734 v R + 0.0078 V12 - 0.00627 LADR = 28.4 (pc/mi/ln) LOS = D (Exhibit 25-4)
DR = 4.252 + 0.0086 V12 - 0.0009 LD
DR = (pc/mi/ln)LOS = (Exhibit 25-4)
Speed Determination Speed DeterminationMS = 0.427 (Exibit 25-19) SR= 58.0 mph (Exhibit 25-19) S0= 61.1 mph (Exhibit 25-19) S = 59.2 mph (Exhibit 25-14)
Ds = (Exhibit 25-19) SR= mph (Exhibit 25-19) S0= mph (Exhibit 25-19) S = mph (Exhibit 25-15)
Copyright © 2005 University of Florida, All Rights Reserved HCS+TM Version 5.21 Generated: 7/8/2010 4:22 PM
Page 1 of 1RAMPS AND RAMP JUNCTIONS WORKSHEET
7/8/2010file://C:\Documents and Settings\JMasinick\Local Settings\Temp\r2k20F9.tmp
D-76

Man
ual�L
evel
�of�S
ervi
ce�A
naly
sis�
US�
17�N
B�to
�C/D
�Roa
dway
���M
erge
2035
�N5�
Full�
Build
�Con
ditio
ns���
AM
�Pea
k�H
our
Volu
mes
PHF
Adj
�Vol
Mai
nlin
e�(b
efor
e�m
erge
)10
200.
851,
427
Vf�(m
ainl
ine�
befo
re�m
erge
)1,
427
Mer
ge�R
amp
470
0.93
601
Vr�(m
erge
�ram
p)60
1M
ainl
ine�
(aft
er�m
erge
)14
900.
911,
947
Vfo�
(mai
nlin
e�af
ter�
mer
ge)
1,94
7
V12=
Vf*P
fm1,
426.
80Tr
uck�
%�(d
ecim
al)
0.12
6Is
�V12
�(mai
nlin
e�CD
)�ove
r�ca
paci
ty?
noFh
v0.
8410
43Is
�Vr�
(ram
p�vo
lum
e)�o
ver�
capa
city
?no
acce
l�len
gth�
(La)
750
Fp�(=
1�fo
r�co
mm
uter
�traf
fic)
1Pf
m�(e
xhib
it�25
�12)
1D
r=5.
475+
0.00
734*
Vr+0
.007
8*V1
2�0.
0062
7*L
16.3
Max
�mai
nlin
e�do
wns
trea
m�c
apac
ity22
50LO
S�(if
�ram
p�or
�mai
nlin
e�ov
er�c
ap�th
en�F
)B
Max
�mer
ge�r
amp�
capa
city
2000
Vr12
�=�V
12�+
�Vr
2,02
7.69
Free
�Flo
w�S
peed
�of�R
amp�
(FFS
r)50
Ms�
=�0.
321+
0.00
39*e
^(Vr
12/1
000)
�0.0
02(L
a*Sf
r/1
0.27
5626
Sr=F
FSr�
(FFS
r�42
)*M
s47
.794
99
D-77

Man
ual�L
evel
�of�S
ervi
ce�A
naly
sis�
US�
17�N
B�to
�C/D
�Roa
dway
���M
erge
2035
�N5�
Full�
Build
�Con
ditio
ns���
PM�P
eak�
Hou
r
Volu
mes
PHF
Adj
�Vol
Mai
nlin
e�(b
efor
e�m
erge
)57
00.
9471
8Vf
�(mai
nlin
e�be
fore
�mer
ge)
718
Mer
ge�R
amp
370
0.92
476
Vr�(m
erge
�ram
p)47
6M
ainl
ine�
(aft
er�m
erge
)94
00.
931,
197
Vfo�
(mai
nlin
e�af
ter�
mer
ge)
1,19
7
V12=
Vf*P
fm71
8.26
Truc
k�%
�(dec
imal
)0.
123
Is�V
12�(m
ainl
ine�
CD)�o
ver�
capa
city
?no
Fhv
0.84
4238
Is�V
r�(r
amp�
volu
me)
�ove
r�ca
paci
ty?
noac
cel�l
engt
h�(L
a)75
0Fp
�(=1�
for�
com
mut
er�tr
affic
)1
Pfm
�(exh
ibit�
25�1
2)1
Dr=
5.47
5+0.
0073
4*Vr
+0.0
078*
V12�
0.00
627*
L9.
9M
ax�m
ainl
ine�
dow
nstr
eam
�cap
acity
2250
LOS�
(if�r
amp�
or�m
ainl
ine�
over
�cap
�then
�F)
AM
ax�m
erge
�ram
p�ca
paci
ty20
00Vr
12�=
�V12
�+�V
r1,
194.
64Fr
ee�F
low
�Spe
ed�o
f�Ram
p�(F
FSr)
50M
s�=�
0.32
1+0.
0039
*e^(
Vr12
/100
0)�0
.002
(La*
Sfr/
10.
2588
79Sr
=FFS
r�(F
FSr�
42)*
Ms
47.9
2897
D-78

RAMPS AND RAMP JUNCTIONS WORKSHEETGeneral Information Site Information Analyst JM Freeway/Dir of Travel NBAgency or Company Michael Baker Jr, Inc Junction M-3 17 CD to 95 NBDate Performed 03-05-10 JurisdictionAnalysis Time Period AM peak Analysis Year 2035 Build N5 FullProject Description Fampo Radco/I-95 Transportation Analysis InputsUpstream Adj Ramp
Yes����� On�����
No������ Off�����
Lup = ft
Vu = veh/h
Terrain: Rolling Downstream Adj Ramp
Yes����� On�����
No������ Off�����
Ldown = ft
VD = veh/h S FF = 70.0 mph SFR = 50.0 mph
Sketch ( show lanes, LA, LD,VR,Vf)
Conversion to pc/h Under Base Conditions (pc/h) V
(Veh/hr) PHF Terrain %Truck %Rv fHV fp v = V/PHF x fHV x fp
Freeway 4750 0.92 Rolling 13 0 0.837 1.00 6170 Ramp 1490 0.91 Rolling 13 0 0.837 1.00 1957 UpStream DownStream
Merge Areas Diverge AreasEstimation of v12 Estimation of v12
V12 = VF ( PFM )LEQ = (Equation 25-2 or 25-3)PFM = 0.619 using Equation (Exhibit 25-5) V12 = 3822 pc/h
V3 or Vav342348 pc/h (Equation 25-4 or 25-5)
Is V3 or Vav34 > 2,700 pc/h? Yes No����� ������
Is V3 or Vav34 > 1.5 * V12/2 Yes No����� ������
If Yes,V12a = pc/h (Equation 25-8)
V12 = VR + (VF - VR)PFDLEQ = (Equation 25-8 or 25-9) PFD = using Equation (Exhibit 25-12) V12 = pc/h V3 or Vav34 pc/h (Equation 25-15 or 25-16) Is V3 or Vav34 > 2,700 pc/h? Yes No����� �����
Is V3 or Vav34 > 1.5 * V12/2 Yes No����� �����
If Yes,V12a = pc/h (Equation 25-18)
Capacity Checks Capacity ChecksActual Capacity LOS F? Actual Capacity LOS F?
VFO 8127 Exhibit 25-7 Yes
VF Exhibit 25-14VFO = VF - VR Exhibit 25-14
VR Exhibit 25-3
Flow Entering Merge Influence Area Flow Entering Merge Influence AreaActual Max Desirable Violation? Actual Max Desirable Violation?
VR12 5779 Exhibit 25-7 4600:All No V12 Exhibit 25-14Level of Service Determination (if not F) Level of Service Determination (if not F)
DR = 5.475 + 0.00734 v R + 0.0078 V12 - 0.00627 LADR = 40.2 (pc/mi/ln) LOS = F (Exhibit 25-4)
DR = 4.252 + 0.0086 V12 - 0.0009 LD
DR = (pc/mi/ln)LOS = (Exhibit 25-4)
Speed Determination Speed DeterminationMS = 1.432 (Exibit 25-19) SR= 29.9 mph (Exhibit 25-19) S0= 63.2 mph (Exhibit 25-19) S = 35.3 mph (Exhibit 25-14)
Ds = (Exhibit 25-19) SR= mph (Exhibit 25-19) S0= mph (Exhibit 25-19) S = mph (Exhibit 25-15)
Copyright © 2005 University of Florida, All Rights Reserved HCS+TM Version 5.21 Generated: 7/8/2010 4:22 PM
Page 1 of 1RAMPS AND RAMP JUNCTIONS WORKSHEET
7/8/2010file://C:\Documents and Settings\JMasinick\Local Settings\Temp\r2k20FE.tmp
D-79

RAMPS AND RAMP JUNCTIONS WORKSHEETGeneral Information Site Information Analyst JM Freeway/Dir of Travel NBAgency or Company Michael Baker Jr, Inc Junction M-3 NB CD to 95 NBDate Performed 03-05-10 JurisdictionAnalysis Time Period PM peak Analysis Year 2035 Build N5 fullProject Description Fampo Radco/I-95 Transportation Analysis InputsUpstream Adj Ramp
Yes����� On�����
No������ Off�����
Lup = ft
Vu = veh/h
Terrain: Rolling Downstream Adj Ramp
Yes����� On�����
No������ Off�����
Ldown = ft
VD = veh/h S FF = 70.0 mph SFR = 50.0 mph
Sketch ( show lanes, LA, LD,VR,Vf)
Conversion to pc/h Under Base Conditions (pc/h) V
(Veh/hr) PHF Terrain %Truck %Rv fHV fp v = V/PHF x fHV x fp
Freeway 4390 0.94 Rolling 12 0 0.847 1.00 5511 Ramp 940 0.93 Rolling 12 0 0.847 1.00 1193 UpStream DownStream
Merge Areas Diverge AreasEstimation of v12 Estimation of v12
V12 = VF ( PFM )LEQ = (Equation 25-2 or 25-3)PFM = 0.619 using Equation (Exhibit 25-5) V12 = 3414 pc/h
V3 or Vav342097 pc/h (Equation 25-4 or 25-5)
Is V3 or Vav34 > 2,700 pc/h? Yes No����� ������
Is V3 or Vav34 > 1.5 * V12/2 Yes No����� ������
If Yes,V12a = pc/h (Equation 25-8)
V12 = VR + (VF - VR)PFDLEQ = (Equation 25-8 or 25-9) PFD = using Equation (Exhibit 25-12) V12 = pc/h V3 or Vav34 pc/h (Equation 25-15 or 25-16) Is V3 or Vav34 > 2,700 pc/h? Yes No����� �����
Is V3 or Vav34 > 1.5 * V12/2 Yes No����� �����
If Yes,V12a = pc/h (Equation 25-18)
Capacity Checks Capacity ChecksActual Capacity LOS F? Actual Capacity LOS F?
VFO 6704 Exhibit 25-7 No
VF Exhibit 25-14VFO = VF - VR Exhibit 25-14
VR Exhibit 25-3
Flow Entering Merge Influence Area Flow Entering Merge Influence AreaActual Max Desirable Violation? Actual Max Desirable Violation?
VR12 4607 Exhibit 25-7 4600:All No V12 Exhibit 25-14Level of Service Determination (if not F) Level of Service Determination (if not F)
DR = 5.475 + 0.00734 v R + 0.0078 V12 - 0.00627 LADR = 31.5 (pc/mi/ln) LOS = D (Exhibit 25-4)
DR = 4.252 + 0.0086 V12 - 0.0009 LD
DR = (pc/mi/ln)LOS = (Exhibit 25-4)
Speed Determination Speed DeterminationMS = 0.562 (Exibit 25-19) SR= 54.3 mph (Exhibit 25-19) S0= 64.3 mph (Exhibit 25-19) S = 57.0 mph (Exhibit 25-14)
Ds = (Exhibit 25-19) SR= mph (Exhibit 25-19) S0= mph (Exhibit 25-19) S = mph (Exhibit 25-15)
Copyright © 2005 University of Florida, All Rights Reserved HCS+TM Version 5.21 Generated: 7/8/2010 4:22 PM
Page 1 of 1RAMPS AND RAMP JUNCTIONS WORKSHEET
7/8/2010file://C:\Documents and Settings\JMasinick\Local Settings\Temp\r2k2103.tmp
D-80

RAMPS AND RAMP JUNCTIONS WORKSHEETGeneral Information Site Information Analyst JM Freeway/Dir of Travel SBAgency or Company Michael Baker Jr, Inc Junction M-4 17 NB/SB to 95 SBDate Performed 03-05-10 JurisdictionAnalysis Time Period AM peak Analysis Year 2035 Build N5 fullProject Description Fampo Radco/I-95 Transportation Analysis InputsUpstream Adj Ramp
Yes������ On�����
No����� Off������
Lup = 1000 ft
Vu = 2870 veh/h
Terrain: Rolling Downstream Adj Ramp
Yes����� On�����
No������ Off�����
Ldown = ft
VD = veh/h S FF = 70.0 mph SFR = 50.0 mph
Sketch ( show lanes, LA, LD,VR,Vf)
Conversion to pc/h Under Base Conditions (pc/h) V
(Veh/hr) PHF Terrain %Truck %Rv fHV fp v = V/PHF x fHV x fp
Freeway 2270 0.97 Rolling 18 0 0.787 1.00 2972 Ramp 1360 0.90 Rolling 18 0 0.787 1.00 1919 UpStream 2870 0.85 Rolling 18 0 0.787 1.00 4288 DownStream
Merge Areas Diverge AreasEstimation of v12 Estimation of v12
V12 = VF ( PFM )LEQ = (Equation 25-2 or 25-3)PFM = 0.555 using Equation (Exhibit 25-5) V12 = 1649 pc/h
V3 or Vav341323 pc/h (Equation 25-4 or 25-5)
Is V3 or Vav34 > 2,700 pc/h? Yes No����� ������
Is V3 or Vav34 > 1.5 * V12/2 Yes No������ �����
If Yes,V12a = 1698 pc/h (Equation 25-8)
V12 = VR + (VF - VR)PFDLEQ = (Equation 25-8 or 25-9) PFD = using Equation (Exhibit 25-12) V12 = pc/h V3 or Vav34 pc/h (Equation 25-15 or 25-16) Is V3 or Vav34 > 2,700 pc/h? Yes No����� �����
Is V3 or Vav34 > 1.5 * V12/2 Yes No����� �����
If Yes,V12a = pc/h (Equation 25-18)
Capacity Checks Capacity ChecksActual Capacity LOS F? Actual Capacity LOS F?
VFO 4891 Exhibit 25-7 No
VF Exhibit 25-14VFO = VF - VR Exhibit 25-14
VR Exhibit 25-3
Flow Entering Merge Influence Area Flow Entering Merge Influence AreaActual Max Desirable Violation? Actual Max Desirable Violation?
VR12 3617 Exhibit 25-7 4600:All No V12 Exhibit 25-14Level of Service Determination (if not F) Level of Service Determination (if not F)
DR = 5.475 + 0.00734 v R + 0.0078 V12 - 0.00627 LADR = 7.7 (pc/mi/ln) LOS = A (Exhibit 25-4)
DR = 4.252 + 0.0086 V12 - 0.0009 LD
DR = (pc/mi/ln)LOS = (Exhibit 25-4)
Speed Determination Speed DeterminationMS = 0.066 (Exibit 25-19) SR= 68.1 mph (Exhibit 25-19) S0= 67.2 mph (Exhibit 25-19) S = 67.9 mph (Exhibit 25-14)
Ds = (Exhibit 25-19) SR= mph (Exhibit 25-19) S0= mph (Exhibit 25-19) S = mph (Exhibit 25-15)
Copyright © 2005 University of Florida, All Rights Reserved HCS+TM Version 5.21 Generated: 7/8/2010 4:23 PM
Page 1 of 1RAMPS AND RAMP JUNCTIONS WORKSHEET
7/8/2010file://C:\Documents and Settings\JMasinick\Local Settings\Temp\r2k2108.tmp
D-81

RAMPS AND RAMP JUNCTIONS WORKSHEETGeneral Information Site Information Analyst JM Freeway/Dir of Travel SBAgency or Company Michael Baker Jr, Inc Junction M-4 17 NB/SB to 95 SBDate Performed 03-05-10 JurisdictionAnalysis Time Period PM peak Analysis Year 2035 Build N5 fullProject Description Fampo Radco/I-95 Transportation Analysis InputsUpstream Adj Ramp
Yes������ On�����
No����� Off������
Lup = 1000 ft
Vu = 2870 veh/h
Terrain: Rolling Downstream Adj Ramp
Yes����� On�����
No������ Off�����
Ldown = ft
VD = veh/h S FF = 70.0 mph SFR = 50.0 mph
Sketch ( show lanes, LA, LD,VR,Vf)
Conversion to pc/h Under Base Conditions (pc/h) V
(Veh/hr) PHF Terrain %Truck %Rv fHV fp v = V/PHF x fHV x fp
Freeway 2810 0.97 Rolling 13 0 0.837 1.00 3462 Ramp 2180 0.95 Rolling 13 0 0.837 1.00 2742 UpStream 2870 0.98 Rolling 13 0 0.837 1.00 3500 DownStream
Merge Areas Diverge AreasEstimation of v12 Estimation of v12
V12 = VF ( PFM )LEQ = (Equation 25-2 or 25-3)PFM = 0.555 using Equation (Exhibit 25-5) V12 = 1921 pc/h
V3 or Vav341541 pc/h (Equation 25-4 or 25-5)
Is V3 or Vav34 > 2,700 pc/h? Yes No����� ������
Is V3 or Vav34 > 1.5 * V12/2 Yes No������ �����
If Yes,V12a = 1978 pc/h (Equation 25-8)
V12 = VR + (VF - VR)PFDLEQ = (Equation 25-8 or 25-9) PFD = using Equation (Exhibit 25-12) V12 = pc/h V3 or Vav34 pc/h (Equation 25-15 or 25-16) Is V3 or Vav34 > 2,700 pc/h? Yes No����� �����
Is V3 or Vav34 > 1.5 * V12/2 Yes No����� �����
If Yes,V12a = pc/h (Equation 25-18)
Capacity Checks Capacity ChecksActual Capacity LOS F? Actual Capacity LOS F?
VFO 6204 Exhibit 25-7 No
VF Exhibit 25-14VFO = VF - VR Exhibit 25-14
VR Exhibit 25-3
Flow Entering Merge Influence Area Flow Entering Merge Influence AreaActual Max Desirable Violation? Actual Max Desirable Violation?
VR12 4720 Exhibit 25-7 4600:All No V12 Exhibit 25-14Level of Service Determination (if not F) Level of Service Determination (if not F)
DR = 5.475 + 0.00734 v R + 0.0078 V12 - 0.00627 LADR = 15.9 (pc/mi/ln) LOS = B (Exhibit 25-4)
DR = 4.252 + 0.0086 V12 - 0.0009 LD
DR = (pc/mi/ln)LOS = (Exhibit 25-4)
Speed Determination Speed DeterminationMS = 0.358 (Exibit 25-19) SR= 60.0 mph (Exhibit 25-19) S0= 66.5 mph (Exhibit 25-19) S = 61.4 mph (Exhibit 25-14)
Ds = (Exhibit 25-19) SR= mph (Exhibit 25-19) S0= mph (Exhibit 25-19) S = mph (Exhibit 25-15)
Copyright © 2005 University of Florida, All Rights Reserved HCS+TM Version 5.21 Generated: 7/8/2010 4:23 PM
Page 1 of 1RAMPS AND RAMP JUNCTIONS WORKSHEET
7/8/2010file://C:\Documents and Settings\JMasinick\Local Settings\Temp\r2k210D.tmp
D-82

RAMPS AND RAMP JUNCTIONS WORKSHEETGeneral Information Site Information Analyst JM Freeway/Dir of Travel SBAgency or Company Michael Baker Jr, Inc Junction M-5 Rest Area to 95 SBDate Performed 7-7-10 JurisdictionAnalysis Time Period AM peak Analysis Year 2035 Build N5 fullProject Description Fampo Radco/I-95 Transportation Analysis InputsUpstream Adj Ramp
Yes������ On������
No����� Off�����
Lup = 1000 ft
Vu = 180 veh/h
Terrain: Rolling Downstream Adj Ramp
Yes����� On�����
No������ Off�����
Ldown = ft
VD = veh/h S FF = 70.0 mph SFR = 50.0 mph
Sketch ( show lanes, LA, LD,VR,Vf)
Conversion to pc/h Under Base Conditions (pc/h) V
(Veh/hr) PHF Terrain %Truck %Rv fHV fp v = V/PHF x fHV x fp
Freeway 3810 0.97 Rolling 18 0 0.787 1.00 4988 Ramp 150 0.97 Rolling 18 0 0.787 1.00 196 UpStream 180 0.97 Rolling 18 0 0.787 1.00 236 DownStream
Merge Areas Diverge AreasEstimation of v12 Estimation of v12
V12 = VF ( PFM )LEQ = (Equation 25-2 or 25-3)PFM = 0.611 using Equation (Exhibit 25-5) V12 = 3048 pc/h
V3 or Vav341940 pc/h (Equation 25-4 or 25-5)
Is V3 or Vav34 > 2,700 pc/h? Yes No����� ������
Is V3 or Vav34 > 1.5 * V12/2 Yes No����� ������
If Yes,V12a = pc/h (Equation 25-8)
V12 = VR + (VF - VR)PFDLEQ = (Equation 25-8 or 25-9) PFD = using Equation (Exhibit 25-12) V12 = pc/h V3 or Vav34 pc/h (Equation 25-15 or 25-16) Is V3 or Vav34 > 2,700 pc/h? Yes No����� �����
Is V3 or Vav34 > 1.5 * V12/2 Yes No����� �����
If Yes,V12a = pc/h (Equation 25-18)
Capacity Checks Capacity ChecksActual Capacity LOS F? Actual Capacity LOS F?
VFO 5184 Exhibit 25-7 No
VF Exhibit 25-14VFO = VF - VR Exhibit 25-14
VR Exhibit 25-3
Flow Entering Merge Influence Area Flow Entering Merge Influence AreaActual Max Desirable Violation? Actual Max Desirable Violation?
VR12 3244 Exhibit 25-7 4600:All No V12 Exhibit 25-14Level of Service Determination (if not F) Level of Service Determination (if not F)
DR = 5.475 + 0.00734 v R + 0.0078 V12 - 0.00627 LADR = 23.2 (pc/mi/ln) LOS = C (Exhibit 25-4)
DR = 4.252 + 0.0086 V12 - 0.0009 LD
DR = (pc/mi/ln)LOS = (Exhibit 25-4)
Speed Determination Speed DeterminationMS = 0.301 (Exibit 25-19) SR= 61.6 mph (Exhibit 25-19) S0= 64.8 mph (Exhibit 25-19) S = 62.7 mph (Exhibit 25-14)
Ds = (Exhibit 25-19) SR= mph (Exhibit 25-19) S0= mph (Exhibit 25-19) S = mph (Exhibit 25-15)
Copyright © 2005 University of Florida, All Rights Reserved HCS+TM Version 5.21 Generated: 7/8/2010 4:23 PM
Page 1 of 1RAMPS AND RAMP JUNCTIONS WORKSHEET
7/8/2010file://C:\Documents and Settings\JMasinick\Local Settings\Temp\r2k2112.tmp
D-83

RAMPS AND RAMP JUNCTIONS WORKSHEETGeneral Information Site Information Analyst JM Freeway/Dir of Travel SBAgency or Company Michael Baker Jr, Inc Junction M-5 Rest Area to 95 SBDate Performed 7-7-10 JurisdictionAnalysis Time Period PM peak Analysis Year 2035 Build N5 fullProject Description Fampo Radco/I-95 Transportation Analysis InputsUpstream Adj Ramp
Yes������ On������
No����� Off�����
Lup = 1000 ft
Vu = 370 veh/h
Terrain: Rolling Downstream Adj Ramp
Yes����� On�����
No������ Off�����
Ldown = ft
VD = veh/h S FF = 70.0 mph SFR = 50.0 mph
Sketch ( show lanes, LA, LD,VR,Vf)
Conversion to pc/h Under Base Conditions (pc/h) V
(Veh/hr) PHF Terrain %Truck %Rv fHV fp v = V/PHF x fHV x fp
Freeway 5360 0.97 Rolling 13 0 0.837 1.00 6603 Ramp 270 0.97 Rolling 13 0 0.837 1.00 333 UpStream 370 0.97 Rolling 13 0 0.837 1.00 456 DownStream
Merge Areas Diverge AreasEstimation of v12 Estimation of v12
V12 = VF ( PFM )LEQ = (Equation 25-2 or 25-3)PFM = 0.611 using Equation (Exhibit 25-5) V12 = 4035 pc/h
V3 or Vav342568 pc/h (Equation 25-4 or 25-5)
Is V3 or Vav34 > 2,700 pc/h? Yes No����� ������
Is V3 or Vav34 > 1.5 * V12/2 Yes No����� ������
If Yes,V12a = pc/h (Equation 25-8)
V12 = VR + (VF - VR)PFDLEQ = (Equation 25-8 or 25-9) PFD = using Equation (Exhibit 25-12) V12 = pc/h V3 or Vav34 pc/h (Equation 25-15 or 25-16) Is V3 or Vav34 > 2,700 pc/h? Yes No����� �����
Is V3 or Vav34 > 1.5 * V12/2 Yes No����� �����
If Yes,V12a = pc/h (Equation 25-18)
Capacity Checks Capacity ChecksActual Capacity LOS F? Actual Capacity LOS F?
VFO 6936 Exhibit 25-7 No
VF Exhibit 25-14VFO = VF - VR Exhibit 25-14
VR Exhibit 25-3
Flow Entering Merge Influence Area Flow Entering Merge Influence AreaActual Max Desirable Violation? Actual Max Desirable Violation?
VR12 4368 Exhibit 25-7 4600:All No V12 Exhibit 25-14Level of Service Determination (if not F) Level of Service Determination (if not F)
DR = 5.475 + 0.00734 v R + 0.0078 V12 - 0.00627 LADR = 31.9 (pc/mi/ln) LOS = D (Exhibit 25-4)
DR = 4.252 + 0.0086 V12 - 0.0009 LD
DR = (pc/mi/ln)LOS = (Exhibit 25-4)
Speed Determination Speed DeterminationMS = 0.509 (Exibit 25-19) SR= 55.8 mph (Exhibit 25-19) S0= 61.9 mph (Exhibit 25-19) S = 57.9 mph (Exhibit 25-14)
Ds = (Exhibit 25-19) SR= mph (Exhibit 25-19) S0= mph (Exhibit 25-19) S = mph (Exhibit 25-15)
Copyright © 2005 University of Florida, All Rights Reserved HCS+TM Version 5.21 Generated: 7/8/2010 4:24 PM
Page 1 of 1RAMPS AND RAMP JUNCTIONS WORKSHEET
7/8/2010file://C:\Documents and Settings\JMasinick\Local Settings\Temp\r2k2117.tmp
D-84

RAMPS AND RAMP JUNCTIONS WORKSHEETGeneral Information Site Information Analyst JM Freeway/Dir of Travel SBAgency or Company Michael Baker Jr, Inc Junction M-6 Rt 3 EB to 95 SBDate Performed 7-7-10 JurisdictionAnalysis Time Period AM peak Analysis Year 2035 Build ConditionsProject Description Radco/I-95 Transportation AnalysisInputsUpstream Adj Ramp
Yes������ On�����
No����� Off������
Lup = 1000 ft
Vu = 510 veh/h
Terrain: Rolling Downstream Adj Ramp
Yes����� On�����
No������ Off�����
Ldown = ft
VD = veh/h S FF = 70.0 mph SFR = 50.0 mph
Sketch ( show lanes, LA, LD,VR,Vf)
Conversion to pc/h Under Base Conditions (pc/h) V
(Veh/hr) PHF Terrain %Truck %Rv fHV fp v = V/PHF x fHV x fp
Freeway 3260 0.93 Rolling 18 0 0.787 1.00 4452 Ramp 270 0.80 Rolling 18 0 0.787 1.00 429 UpStream 510 0.91 Rolling 18 0 0.787 1.00 712 DownStream
Merge Areas Diverge AreasEstimation of v12 Estimation of v12
V12 = VF ( PFM )LEQ = 1834.73 (Equation 25-2 or 25-3)PFM = 0.561 using Equation (Exhibit 25-5) V12 = 2498 pc/h
V3 or Vav341954 pc/h (Equation 25-4 or 25-5)
Is V3 or Vav34 > 2,700 pc/h? Yes No����� ������
Is V3 or Vav34 > 1.5 * V12/2 Yes No������ �����
If Yes,V12a = 2544 pc/h (Equation 25-8)
V12 = VR + (VF - VR)PFDLEQ = (Equation 25-8 or 25-9) PFD = using Equation (Exhibit 25-12) V12 = pc/h V3 or Vav34 pc/h (Equation 25-15 or 25-16) Is V3 or Vav34 > 2,700 pc/h? Yes No����� �����
Is V3 or Vav34 > 1.5 * V12/2 Yes No����� �����
If Yes,V12a = pc/h (Equation 25-18)
Capacity Checks Capacity ChecksActual Capacity LOS F? Actual Capacity LOS F?
VFO 4881 Exhibit 25-7 No
VF Exhibit 25-14VFO = VF - VR Exhibit 25-14
VR Exhibit 25-3
Flow Entering Merge Influence Area Flow Entering Merge Influence AreaActual Max Desirable Violation? Actual Max Desirable Violation?
VR12 2973 Exhibit 25-7 4600:All No V12 Exhibit 25-14Level of Service Determination (if not F) Level of Service Determination (if not F)
DR = 5.475 + 0.00734 v R + 0.0078 V12 - 0.00627 LADR = 20.3 (pc/mi/ln) LOS = C (Exhibit 25-4)
DR = 4.252 + 0.0086 V12 - 0.0009 LD
DR = (pc/mi/ln)LOS = (Exhibit 25-4)
Speed Determination Speed DeterminationMS = 0.267 (Exibit 25-19) SR= 62.5 mph (Exhibit 25-19) S0= 64.9 mph (Exhibit 25-19) S = 63.4 mph (Exhibit 25-14)
Ds = (Exhibit 25-19) SR= mph (Exhibit 25-19) S0= mph (Exhibit 25-19) S = mph (Exhibit 25-15)
Copyright © 2005 University of Florida, All Rights Reserved HCS+TM Version 5.21 Generated: 7/8/2010 4:24 PM
Page 1 of 1RAMPS AND RAMP JUNCTIONS WORKSHEET
7/8/2010file://C:\Documents and Settings\JMasinick\Local Settings\Temp\r2k211C.tmp
D-85

RAMPS AND RAMP JUNCTIONS WORKSHEETGeneral Information Site Information Analyst JM Freeway/Dir of Travel SBAgency or Company Michael Baker Jr, inc Junction M-6 Rt 3 EB to 95 SBDate Performed 7-7-10 JurisdictionAnalysis Time Period PM peak Analysis Year 2035 Build ConditionsProject Description Radco/I-95 Transportation AnalysisInputsUpstream Adj Ramp
Yes������ On�����
No����� Off������
Lup = 1000 ft
Vu = 720 veh/h
Terrain: Rolling Downstream Adj Ramp
Yes����� On�����
No������ Off�����
Ldown = ft
VD = veh/h S FF = 70.0 mph SFR = 50.0 mph
Sketch ( show lanes, LA, LD,VR,Vf)
Conversion to pc/h Under Base Conditions (pc/h) V
(Veh/hr) PHF Terrain %Truck %Rv fHV fp v = V/PHF x fHV x fp
Freeway 3670 0.97 Rolling 13 0 0.837 1.00 4521 Ramp 520 0.93 Rolling 13 0 0.837 1.00 668 UpStream 720 0.95 Rolling 13 0 0.837 1.00 906 DownStream
Merge Areas Diverge AreasEstimation of v12 Estimation of v12
V12 = VF ( PFM )LEQ = 1900.65 (Equation 25-2 or 25-3)PFM = 0.557 using Equation (Exhibit 25-5) V12 = 2518 pc/h
V3 or Vav342003 pc/h (Equation 25-4 or 25-5)
Is V3 or Vav34 > 2,700 pc/h? Yes No����� ������
Is V3 or Vav34 > 1.5 * V12/2 Yes No������ �����
If Yes,V12a = 2583 pc/h (Equation 25-8)
V12 = VR + (VF - VR)PFDLEQ = (Equation 25-8 or 25-9) PFD = using Equation (Exhibit 25-12) V12 = pc/h V3 or Vav34 pc/h (Equation 25-15 or 25-16) Is V3 or Vav34 > 2,700 pc/h? Yes No����� �����
Is V3 or Vav34 > 1.5 * V12/2 Yes No����� �����
If Yes,V12a = pc/h (Equation 25-18)
Capacity Checks Capacity ChecksActual Capacity LOS F? Actual Capacity LOS F?
VFO 5189 Exhibit 25-7 No
VF Exhibit 25-14VFO = VF - VR Exhibit 25-14
VR Exhibit 25-3
Flow Entering Merge Influence Area Flow Entering Merge Influence AreaActual Max Desirable Violation? Actual Max Desirable Violation?
VR12 3251 Exhibit 25-7 4600:All No V12 Exhibit 25-14Level of Service Determination (if not F) Level of Service Determination (if not F)
DR = 5.475 + 0.00734 v R + 0.0078 V12 - 0.00627 LADR = 22.4 (pc/mi/ln) LOS = C (Exhibit 25-4)
DR = 4.252 + 0.0086 V12 - 0.0009 LD
DR = (pc/mi/ln)LOS = (Exhibit 25-4)
Speed Determination Speed DeterminationMS = 0.292 (Exibit 25-19) SR= 61.8 mph (Exhibit 25-19) S0= 64.8 mph (Exhibit 25-19) S = 62.9 mph (Exhibit 25-14)
Ds = (Exhibit 25-19) SR= mph (Exhibit 25-19) S0= mph (Exhibit 25-19) S = mph (Exhibit 25-15)
Copyright © 2005 University of Florida, All Rights Reserved HCS+TM Version 5.21 Generated: 7/8/2010 4:24 PM
Page 1 of 1RAMPS AND RAMP JUNCTIONS WORKSHEET
7/8/2010file://C:\Documents and Settings\JMasinick\Local Settings\Temp\r2k2121.tmp
D-86

RAMPS AND RAMP JUNCTIONS WORKSHEETGeneral Information Site Information Analyst JM Freeway/Dir of Travel I-95 NBAgency or Company Michael Baker Jr, Inc Junction New Rd to Mainline mergeDate Performed 03-02-10 Jurisdiction M-7Analysis Time Period AM peak Analysis Year 2035 Build N5 fullProject Description Fampo Radco/I-95 Transportation Analysis InputsUpstream Adj Ramp
Yes����� On�����
No������ Off�����
Lup = ft
Vu = veh/h
Terrain: Rolling Downstream Adj Ramp
Yes����� On�����
No������ Off�����
Ldown = ft
VD = veh/h S FF = 70.0 mph SFR = 50.0 mph
Sketch ( show lanes, LA, LD,VR,Vf)
Conversion to pc/h Under Base Conditions (pc/h) V
(Veh/hr) PHF Terrain %Truck %Rv fHV fp v = V/PHF x fHV x fp
Freeway 2700 0.97 Rolling 13 0 0.837 1.00 3326 Ramp 2050 0.97 Rolling 13 0 0.837 1.00 2526 UpStream DownStream
Merge Areas Diverge AreasEstimation of v12 Estimation of v12
V12 = VF ( PFM )LEQ = (Equation 25-2 or 25-3)PFM = 0.619 using Equation (Exhibit 25-5) V12 = 2060 pc/h
V3 or Vav341266 pc/h (Equation 25-4 or 25-5)
Is V3 or Vav34 > 2,700 pc/h? Yes No����� ������
Is V3 or Vav34 > 1.5 * V12/2 Yes No����� ������
If Yes,V12a = pc/h (Equation 25-8)
V12 = VR + (VF - VR)PFDLEQ = (Equation 25-8 or 25-9) PFD = using Equation (Exhibit 25-12) V12 = pc/h V3 or Vav34 pc/h (Equation 25-15 or 25-16) Is V3 or Vav34 > 2,700 pc/h? Yes No����� �����
Is V3 or Vav34 > 1.5 * V12/2 Yes No����� �����
If Yes,V12a = pc/h (Equation 25-18)
Capacity Checks Capacity ChecksActual Capacity LOS F? Actual Capacity LOS F?
VFO 5852 Exhibit 25-7 No
VF Exhibit 25-14VFO = VF - VR Exhibit 25-14
VR Exhibit 25-3
Flow Entering Merge Influence Area Flow Entering Merge Influence AreaActual Max Desirable Violation? Actual Max Desirable Violation?
VR12 4586 Exhibit 25-7 4600:All No V12 Exhibit 25-14Level of Service Determination (if not F) Level of Service Determination (if not F)
DR = 5.475 + 0.00734 v R + 0.0078 V12 - 0.00627 LADR = 30.7 (pc/mi/ln) LOS = D (Exhibit 25-4)
DR = 4.252 + 0.0086 V12 - 0.0009 LD
DR = (pc/mi/ln)LOS = (Exhibit 25-4)
Speed Determination Speed DeterminationMS = 0.554 (Exibit 25-19) SR= 54.5 mph (Exhibit 25-19) S0= 67.2 mph (Exhibit 25-19) S = 56.8 mph (Exhibit 25-14)
Ds = (Exhibit 25-19) SR= mph (Exhibit 25-19) S0= mph (Exhibit 25-19) S = mph (Exhibit 25-15)
Copyright © 2005 University of Florida, All Rights Reserved HCS+TM Version 5.21 Generated: 9/10/2010 2:01 PM
Page 1 of 1RAMPS AND RAMP JUNCTIONS WORKSHEET
9/10/2010file://C:\Documents and Settings\JMasinick\Local Settings\Temp\r2k1BEE.tmp
D-87

RAMPS AND RAMP JUNCTIONS WORKSHEETGeneral Information Site Information Analyst JM Freeway/Dir of Travel I-95 NBAgency or Company Michael Baker Jr, Inc Junction New Rd to Mainline mergeDate Performed 03-02-10 Jurisdiction M-7Analysis Time Period PM peak Analysis Year 2035 Build N5 FullProject Description Fampo Radco/I-95 Transportation Analysis InputsUpstream Adj Ramp
Yes����� On�����
No������ Off�����
Lup = ft
Vu = veh/h
Terrain: Rolling Downstream Adj Ramp
Yes����� On�����
No������ Off�����
Ldown = ft
VD = veh/h S FF = 70.0 mph SFR = 50.0 mph
Sketch ( show lanes, LA, LD,VR,Vf)
Conversion to pc/h Under Base Conditions (pc/h) V
(Veh/hr) PHF Terrain %Truck %Rv fHV fp v = V/PHF x fHV x fp
Freeway 3520 0.97 Rolling 12 0 0.847 1.00 4282 Ramp 1830 0.97 Rolling 12 0 0.847 1.00 2226 UpStream DownStream
Merge Areas Diverge AreasEstimation of v12 Estimation of v12
V12 = VF ( PFM )LEQ = (Equation 25-2 or 25-3)PFM = 0.619 using Equation (Exhibit 25-5) V12 = 2653 pc/h
V3 or Vav341629 pc/h (Equation 25-4 or 25-5)
Is V3 or Vav34 > 2,700 pc/h? Yes No����� ������
Is V3 or Vav34 > 1.5 * V12/2 Yes No����� ������
If Yes,V12a = pc/h (Equation 25-8)
V12 = VR + (VF - VR)PFDLEQ = (Equation 25-8 or 25-9) PFD = using Equation (Exhibit 25-12) V12 = pc/h V3 or Vav34 pc/h (Equation 25-15 or 25-16) Is V3 or Vav34 > 2,700 pc/h? Yes No����� �����
Is V3 or Vav34 > 1.5 * V12/2 Yes No����� �����
If Yes,V12a = pc/h (Equation 25-18)
Capacity Checks Capacity ChecksActual Capacity LOS F? Actual Capacity LOS F?
VFO 6508 Exhibit 25-7 No
VF Exhibit 25-14VFO = VF - VR Exhibit 25-14
VR Exhibit 25-3
Flow Entering Merge Influence Area Flow Entering Merge Influence AreaActual Max Desirable Violation? Actual Max Desirable Violation?
VR12 4879 Exhibit 25-7 4600:All No V12 Exhibit 25-14Level of Service Determination (if not F) Level of Service Determination (if not F)
DR = 5.475 + 0.00734 v R + 0.0078 V12 - 0.00627 LADR = 33.1 (pc/mi/ln) LOS = D (Exhibit 25-4)
DR = 4.252 + 0.0086 V12 - 0.0009 LD
DR = (pc/mi/ln)LOS = (Exhibit 25-4)
Speed Determination Speed DeterminationMS = 0.684 (Exibit 25-19) SR= 50.9 mph (Exhibit 25-19) S0= 65.9 mph (Exhibit 25-19) S = 53.9 mph (Exhibit 25-14)
Ds = (Exhibit 25-19) SR= mph (Exhibit 25-19) S0= mph (Exhibit 25-19) S = mph (Exhibit 25-15)
Copyright © 2005 University of Florida, All Rights Reserved HCS+TM Version 5.21 Generated: 9/10/2010 2:02 PM
Page 1 of 1RAMPS AND RAMP JUNCTIONS WORKSHEET
9/10/2010file://C:\Documents and Settings\JMasinick\Local Settings\Temp\r2k1BF5.tmp
D-88

RAMPS AND RAMP JUNCTIONS WORKSHEETGeneral Information Site Information Analyst JM Freeway/Dir of Travel NBAgency or Company Michael Baker Jr, Inc Junction M-8 C/D Road to Rte 17 RampsDate Performed 7-7-10 JurisdictionAnalysis Time Period AM peak Analysis Year 2035 Build N5 fullProject Description Fampo Radco/I-95 Transportation Analysis InputsUpstream Adj Ramp
Yes����� On�����
No������ Off�����
Lup = ft
Vu = veh/h
Terrain: Rolling Downstream Adj Ramp
Yes������ On�����
No����� Off������
Ldown = 2000 ft
VD = 300 veh/h S FF = 55.0 mph SFR = 50.0 mph
Sketch ( show lanes, LA, LD,VR,Vf)
Conversion to pc/h Under Base Conditions (pc/h) V
(Veh/hr) PHF Terrain %Truck %Rv fHV fp v = V/PHF x fHV x fp
Freeway 2000 0.85 Rolling 13 0 0.837 1.00 2812 Ramp 790 0.85 Rolling 13 0 0.837 1.00 1111 UpStream DownStream 300 1.00 Rolling 13 0 0.837 1.00 359
Merge Areas Diverge AreasEstimation of v12 Estimation of v12
V12 = VF ( PFM )LEQ = (Equation 25-2 or 25-3)PFM = 1.000 using Equation (Exhibit 25-5) V12 = 2812 pc/h V3 or Vav34 0 pc/h (Equation 25-4 or 25-5) Is V3 or Vav34 > 2,700 pc/h? Yes No����� ������
Is V3 or Vav34 > 1.5 * V12/2 Yes No����� ������
If Yes,V12a = pc/h (Equation 25-8)
V12 = VR + (VF - VR)PFDLEQ = (Equation 25-8 or 25-9) PFD = using Equation (Exhibit 25-12) V12 = pc/h V3 or Vav34 pc/h (Equation 25-15 or 25-16) Is V3 or Vav34 > 2,700 pc/h? Yes No����� �����
Is V3 or Vav34 > 1.5 * V12/2 Yes No����� �����
If Yes,V12a = pc/h (Equation 25-18)
Capacity Checks Capacity ChecksActual Capacity LOS F? Actual Capacity LOS F?
VFO 3923 Exhibit 25-7 No
VF Exhibit 25-14VFO = VF - VR Exhibit 25-14
VR Exhibit 25-3
Flow Entering Merge Influence Area Flow Entering Merge Influence AreaActual Max Desirable Violation? Actual Max Desirable Violation?
VR12 3923 Exhibit 25-7 4600:All No V12 Exhibit 25-14Level of Service Determination (if not F) Level of Service Determination (if not F)
DR = 5.475 + 0.00734 v R + 0.0078 V12 - 0.00627 LADR = 26.2 (pc/mi/ln) LOS = C (Exhibit 25-4)
DR = 4.252 + 0.0086 V12 - 0.0009 LD
DR = (pc/mi/ln)LOS = (Exhibit 25-4)
Speed Determination Speed DeterminationMS = 0.368 (Exibit 25-19) SR= 50.2 mph (Exhibit 25-19) S0= N/A mph (Exhibit 25-19) S = 50.2 mph (Exhibit 25-14)
Ds = (Exhibit 25-19) SR= mph (Exhibit 25-19) S0= mph (Exhibit 25-19) S = mph (Exhibit 25-15)
Copyright © 2005 University of Florida, All Rights Reserved HCS+TM Version 5.21 Generated: 7/8/2010 4:25 PM
Page 1 of 1RAMPS AND RAMP JUNCTIONS WORKSHEET
7/8/2010file://C:\Documents and Settings\JMasinick\Local Settings\Temp\r2k2130.tmp
D-89

RAMPS AND RAMP JUNCTIONS WORKSHEETGeneral Information Site Information Analyst JM Freeway/Dir of Travel NBAgency or Company Michael Baker Jr, Inc Junction M-8 C/D Road to Rte 17 RampsDate Performed 7-7-10 JurisdictionAnalysis Time Period PM peak Analysis Year 2035 Build N5 fullProject Description Fampo Radco/I-95 Transportation Analysis InputsUpstream Adj Ramp
Yes����� On�����
No������ Off�����
Lup = ft
Vu = veh/h
Terrain: Rolling Downstream Adj Ramp
Yes������ On�����
No����� Off������
Ldown = 2000 ft
VD = 300 veh/h S FF = 55.0 mph SFR = 50.0 mph
Sketch ( show lanes, LA, LD,VR,Vf)
Conversion to pc/h Under Base Conditions (pc/h) V
(Veh/hr) PHF Terrain %Truck %Rv fHV fp v = V/PHF x fHV x fp
Freeway 1830 0.96 Rolling 12 0 0.847 1.00 2249 Ramp 460 0.96 Rolling 12 0 0.847 1.00 565 UpStream DownStream 300 0.90 Rolling 12 0 0.847 1.00 393
Merge Areas Diverge AreasEstimation of v12 Estimation of v12
V12 = VF ( PFM )LEQ = (Equation 25-2 or 25-3)PFM = 1.000 using Equation (Exhibit 25-5) V12 = 2249 pc/h V3 or Vav34 0 pc/h (Equation 25-4 or 25-5) Is V3 or Vav34 > 2,700 pc/h? Yes No����� ������
Is V3 or Vav34 > 1.5 * V12/2 Yes No����� ������
If Yes,V12a = pc/h (Equation 25-8)
V12 = VR + (VF - VR)PFDLEQ = (Equation 25-8 or 25-9) PFD = using Equation (Exhibit 25-12) V12 = pc/h V3 or Vav34 pc/h (Equation 25-15 or 25-16) Is V3 or Vav34 > 2,700 pc/h? Yes No����� �����
Is V3 or Vav34 > 1.5 * V12/2 Yes No����� �����
If Yes,V12a = pc/h (Equation 25-18)
Capacity Checks Capacity ChecksActual Capacity LOS F? Actual Capacity LOS F?
VFO 2814 Exhibit 25-7 No
VF Exhibit 25-14VFO = VF - VR Exhibit 25-14
VR Exhibit 25-3
Flow Entering Merge Influence Area Flow Entering Merge Influence AreaActual Max Desirable Violation? Actual Max Desirable Violation?
VR12 2814 Exhibit 25-7 4600:All No V12 Exhibit 25-14Level of Service Determination (if not F) Level of Service Determination (if not F)
DR = 5.475 + 0.00734 v R + 0.0078 V12 - 0.00627 LADR = 17.8 (pc/mi/ln) LOS = B (Exhibit 25-4)
DR = 4.252 + 0.0086 V12 - 0.0009 LD
DR = (pc/mi/ln)LOS = (Exhibit 25-4)
Speed Determination Speed DeterminationMS = 0.236 (Exibit 25-19) SR= 51.9 mph (Exhibit 25-19) S0= N/A mph (Exhibit 25-19) S = 51.9 mph (Exhibit 25-14)
Ds = (Exhibit 25-19) SR= mph (Exhibit 25-19) S0= mph (Exhibit 25-19) S = mph (Exhibit 25-15)
Copyright © 2005 University of Florida, All Rights Reserved HCS+TM Version 5.21 Generated: 7/8/2010 4:26 PM
Page 1 of 1RAMPS AND RAMP JUNCTIONS WORKSHEET
7/8/2010file://C:\Documents and Settings\JMasinick\Local Settings\Temp\r2k2136.tmp
D-90

RAMPS AND RAMP JUNCTIONS WORKSHEETGeneral Information Site Information Analyst JM Freeway/Dir of Travel SBAgency or Company Michael Baker Jr, Inc Junction M-9 17 NB/SB to SB C/D RdDate Performed 7-7-10 JurisdictionAnalysis Time Period AM peak Analysis Year 2035 Build N5 fullProject Description Fampo Radco/I-95 Transportation Analysis InputsUpstream Adj Ramp
Yes����� On�����
No������ Off�����
Lup = ft
Vu = veh/h
Terrain: Rolling Downstream Adj Ramp
Yes����� On�����
No������ Off�����
Ldown = ft
VD = veh/h S FF = 60.0 mph SFR = 50.0 mph
Sketch ( show lanes, LA, LD,VR,Vf)
Conversion to pc/h Under Base Conditions (pc/h) V
(Veh/hr) PHF Terrain %Truck %Rv fHV fp v = V/PHF x fHV x fp
Freeway 810 0.97 Rolling 18 0 0.787 1.00 1061 Ramp 280 0.97 Rolling 18 0 0.787 1.00 367 UpStream DownStream
Merge Areas Diverge AreasEstimation of v12 Estimation of v12
V12 = VF ( PFM )LEQ = (Equation 25-2 or 25-3)PFM = 1.000 using Equation (Exhibit 25-5) V12 = 1061 pc/h V3 or Vav34 0 pc/h (Equation 25-4 or 25-5) Is V3 or Vav34 > 2,700 pc/h? Yes No����� ������
Is V3 or Vav34 > 1.5 * V12/2 Yes No����� ������
If Yes,V12a = pc/h (Equation 25-8)
V12 = VR + (VF - VR)PFDLEQ = (Equation 25-8 or 25-9) PFD = using Equation (Exhibit 25-12) V12 = pc/h V3 or Vav34 pc/h (Equation 25-15 or 25-16) Is V3 or Vav34 > 2,700 pc/h? Yes No����� �����
Is V3 or Vav34 > 1.5 * V12/2 Yes No����� �����
If Yes,V12a = pc/h (Equation 25-18)
Capacity Checks Capacity ChecksActual Capacity LOS F? Actual Capacity LOS F?
VFO 1428 Exhibit 25-7 No
VF Exhibit 25-14VFO = VF - VR Exhibit 25-14
VR Exhibit 25-3
Flow Entering Merge Influence Area Flow Entering Merge Influence AreaActual Max Desirable Violation? Actual Max Desirable Violation?
VR12 1555 Exhibit 25-7 4600:All No V12 Exhibit 25-14Level of Service Determination (if not F) Level of Service Determination (if not F)
DR = 5.475 + 0.00734 v R + 0.0078 V12 - 0.00627 LADR = 10.2 (pc/mi/ln) LOS = B (Exhibit 25-4)
DR = 4.252 + 0.0086 V12 - 0.0009 LD
DR = (pc/mi/ln)LOS = (Exhibit 25-4)
Speed Determination Speed DeterminationMS = 0.239 (Exibit 25-19) SR= 55.7 mph (Exhibit 25-19) S0= N/A mph (Exhibit 25-19) S = 55.7 mph (Exhibit 25-14)
Ds = (Exhibit 25-19) SR= mph (Exhibit 25-19) S0= mph (Exhibit 25-19) S = mph (Exhibit 25-15)
Copyright © 2005 University of Florida, All Rights Reserved HCS+TM Version 5.21 Generated: 7/8/2010 4:28 PM
Page 1 of 1RAMPS AND RAMP JUNCTIONS WORKSHEET
7/8/2010file://C:\Documents and Settings\JMasinick\Local Settings\Temp\r2k213C.tmp
D-91

RAMPS AND RAMP JUNCTIONS WORKSHEETGeneral Information Site Information Analyst JM Freeway/Dir of Travel SBAgency or Company Michael Baker Jr, Inc Junction M-9 17 NB/SB to SB C/D RdDate Performed 7-7-10 JurisdictionAnalysis Time Period PM peak Analysis Year 2035 Build N5 fullProject Description Fampo Radco/I-95 Transportation Analysis InputsUpstream Adj Ramp
Yes����� On�����
No������ Off�����
Lup = ft
Vu = veh/h
Terrain: Rolling Downstream Adj Ramp
Yes����� On�����
No������ Off�����
Ldown = ft
VD = veh/h S FF = 60.0 mph SFR = 50.0 mph
Sketch ( show lanes, LA, LD,VR,Vf)
Conversion to pc/h Under Base Conditions (pc/h) V
(Veh/hr) PHF Terrain %Truck %Rv fHV fp v = V/PHF x fHV x fp
Freeway 2870 0.97 Rolling 13 0 0.837 1.00 3536 Ramp 840 0.95 Rolling 13 0 0.837 1.00 1057 UpStream DownStream
Merge Areas Diverge AreasEstimation of v12 Estimation of v12
V12 = VF ( PFM )LEQ = (Equation 25-2 or 25-3)PFM = 1.000 using Equation (Exhibit 25-5) V12 = 3536 pc/h V3 or Vav34 0 pc/h (Equation 25-4 or 25-5) Is V3 or Vav34 > 2,700 pc/h? Yes No����� ������
Is V3 or Vav34 > 1.5 * V12/2 Yes No����� ������
If Yes,V12a = pc/h (Equation 25-8)
V12 = VR + (VF - VR)PFDLEQ = (Equation 25-8 or 25-9) PFD = using Equation (Exhibit 25-12) V12 = pc/h V3 or Vav34 pc/h (Equation 25-15 or 25-16) Is V3 or Vav34 > 2,700 pc/h? Yes No����� �����
Is V3 or Vav34 > 1.5 * V12/2 Yes No����� �����
If Yes,V12a = pc/h (Equation 25-18)
Capacity Checks Capacity ChecksActual Capacity LOS F? Actual Capacity LOS F?
VFO 4593 Exhibit 25-7 No
VF Exhibit 25-14VFO = VF - VR Exhibit 25-14
VR Exhibit 25-3
Flow Entering Merge Influence Area Flow Entering Merge Influence AreaActual Max Desirable Violation? Actual Max Desirable Violation?
VR12 5017 Exhibit 25-7 4600:All No V12 Exhibit 25-14Level of Service Determination (if not F) Level of Service Determination (if not F)
DR = 5.475 + 0.00734 v R + 0.0078 V12 - 0.00627 LADR = 34.5 (pc/mi/ln) LOS = D (Exhibit 25-4)
DR = 4.252 + 0.0086 V12 - 0.0009 LD
DR = (pc/mi/ln)LOS = (Exhibit 25-4)
Speed Determination Speed DeterminationMS = 0.810 (Exibit 25-19) SR= 45.4 mph (Exhibit 25-19) S0= N/A mph (Exhibit 25-19) S = 45.4 mph (Exhibit 25-14)
Ds = (Exhibit 25-19) SR= mph (Exhibit 25-19) S0= mph (Exhibit 25-19) S = mph (Exhibit 25-15)
Copyright © 2005 University of Florida, All Rights Reserved HCS+TM Version 5.21 Generated: 7/8/2010 4:28 PM
Page 1 of 1RAMPS AND RAMP JUNCTIONS WORKSHEET
7/8/2010file://C:\Documents and Settings\JMasinick\Local Settings\Temp\r2k2141.tmp
D-92

RAMPS AND RAMP JUNCTIONS WORKSHEETGeneral Information Site Information Analyst JM Freeway/Dir of Travel SBAgency or Company Michael Baker Jr, Inc Junction M-10 EB Connector Rd to SB 95Date Performed 7-7-10 JurisdictionAnalysis Time Period AM peak Analysis Year 2035 Build N5 fullProject Description Fampo Radco/I-95 Transportation Analysis InputsUpstream Adj Ramp
Yes����� On�����
No������ Off�����
Lup = ft
Vu = veh/h
Terrain: Rolling Downstream Adj Ramp
Yes����� On�����
No������ Off�����
Ldown = ft
VD = veh/h S FF = 70.0 mph SFR = 50.0 mph
Sketch ( show lanes, LA, LD,VR,Vf)
Conversion to pc/h Under Base Conditions (pc/h) V
(Veh/hr) PHF Terrain %Truck %Rv fHV fp v = V/PHF x fHV x fp
Freeway 3630 0.97 Rolling 18 0 0.787 1.00 4753 Ramp 180 0.97 Rolling 18 0 0.787 1.00 236 UpStream DownStream
Merge Areas Diverge AreasEstimation of v12 Estimation of v12
V12 = VF ( PFM )LEQ = (Equation 25-2 or 25-3)PFM = 0.614 using Equation (Exhibit 25-5) V12 = 2918 pc/h
V3 or Vav341835 pc/h (Equation 25-4 or 25-5)
Is V3 or Vav34 > 2,700 pc/h? Yes No����� ������
Is V3 or Vav34 > 1.5 * V12/2 Yes No����� ������
If Yes,V12a = pc/h (Equation 25-8)
V12 = VR + (VF - VR)PFDLEQ = (Equation 25-8 or 25-9) PFD = using Equation (Exhibit 25-12) V12 = pc/h V3 or Vav34 pc/h (Equation 25-15 or 25-16) Is V3 or Vav34 > 2,700 pc/h? Yes No����� �����
Is V3 or Vav34 > 1.5 * V12/2 Yes No����� �����
If Yes,V12a = pc/h (Equation 25-18)
Capacity Checks Capacity ChecksActual Capacity LOS F? Actual Capacity LOS F?
VFO 4989 Exhibit 25-7 No
VF Exhibit 25-14VFO = VF - VR Exhibit 25-14
VR Exhibit 25-3
Flow Entering Merge Influence Area Flow Entering Merge Influence AreaActual Max Desirable Violation? Actual Max Desirable Violation?
VR12 3154 Exhibit 25-7 4600:All No V12 Exhibit 25-14Level of Service Determination (if not F) Level of Service Determination (if not F)
DR = 5.475 + 0.00734 v R + 0.0078 V12 - 0.00627 LADR = 21.8 (pc/mi/ln) LOS = C (Exhibit 25-4)
DR = 4.252 + 0.0086 V12 - 0.0009 LD
DR = (pc/mi/ln)LOS = (Exhibit 25-4)
Speed Determination Speed DeterminationMS = 0.282 (Exibit 25-19) SR= 62.1 mph (Exhibit 25-19) S0= 65.2 mph (Exhibit 25-19) S = 63.2 mph (Exhibit 25-14)
Ds = (Exhibit 25-19) SR= mph (Exhibit 25-19) S0= mph (Exhibit 25-19) S = mph (Exhibit 25-15)
Copyright © 2005 University of Florida, All Rights Reserved HCS+TM Version 5.21 Generated: 7/8/2010 4:29 PM
Page 1 of 1RAMPS AND RAMP JUNCTIONS WORKSHEET
7/8/2010file://C:\Documents and Settings\JMasinick\Local Settings\Temp\r2k2146.tmp
D-93

RAMPS AND RAMP JUNCTIONS WORKSHEETGeneral Information Site Information Analyst JM Freeway/Dir of Travel SBAgency or Company Michael Baker Jr, Inc Junction M-10 EB Connector Rd to SB 95Date Performed 7-7-10 JurisdictionAnalysis Time Period PM peak Analysis Year 2035 Build N5 fullProject Description Fampo Radco/I-95 Transportation Analysis InputsUpstream Adj Ramp
Yes����� On�����
No������ Off�����
Lup = ft
Vu = veh/h
Terrain: Rolling Downstream Adj Ramp
Yes����� On�����
No������ Off�����
Ldown = ft
VD = veh/h S FF = 70.0 mph SFR = 50.0 mph
Sketch ( show lanes, LA, LD,VR,Vf)
Conversion to pc/h Under Base Conditions (pc/h) V
(Veh/hr) PHF Terrain %Truck %Rv fHV fp v = V/PHF x fHV x fp
Freeway 4990 0.97 Rolling 13 0 0.837 1.00 6147 Ramp 370 0.97 Rolling 13 0 0.837 1.00 456 UpStream DownStream
Merge Areas Diverge AreasEstimation of v12 Estimation of v12
V12 = VF ( PFM )LEQ = (Equation 25-2 or 25-3)PFM = 0.614 using Equation (Exhibit 25-5) V12 = 3774 pc/h
V3 or Vav342373 pc/h (Equation 25-4 or 25-5)
Is V3 or Vav34 > 2,700 pc/h? Yes No����� ������
Is V3 or Vav34 > 1.5 * V12/2 Yes No����� ������
If Yes,V12a = pc/h (Equation 25-8)
V12 = VR + (VF - VR)PFDLEQ = (Equation 25-8 or 25-9) PFD = using Equation (Exhibit 25-12) V12 = pc/h V3 or Vav34 pc/h (Equation 25-15 or 25-16) Is V3 or Vav34 > 2,700 pc/h? Yes No����� �����
Is V3 or Vav34 > 1.5 * V12/2 Yes No����� �����
If Yes,V12a = pc/h (Equation 25-18)
Capacity Checks Capacity ChecksActual Capacity LOS F? Actual Capacity LOS F?
VFO 6603 Exhibit 25-7 No
VF Exhibit 25-14VFO = VF - VR Exhibit 25-14
VR Exhibit 25-3
Flow Entering Merge Influence Area Flow Entering Merge Influence AreaActual Max Desirable Violation? Actual Max Desirable Violation?
VR12 4230 Exhibit 25-7 4600:All No V12 Exhibit 25-14Level of Service Determination (if not F) Level of Service Determination (if not F)
DR = 5.475 + 0.00734 v R + 0.0078 V12 - 0.00627 LADR = 30.1 (pc/mi/ln) LOS = D (Exhibit 25-4)
DR = 4.252 + 0.0086 V12 - 0.0009 LD
DR = (pc/mi/ln)LOS = (Exhibit 25-4)
Speed Determination Speed DeterminationMS = 0.459 (Exibit 25-19) SR= 57.1 mph (Exhibit 25-19) S0= 63.0 mph (Exhibit 25-19) S = 59.1 mph (Exhibit 25-14)
Ds = (Exhibit 25-19) SR= mph (Exhibit 25-19) S0= mph (Exhibit 25-19) S = mph (Exhibit 25-15)
Copyright © 2005 University of Florida, All Rights Reserved HCS+TM Version 5.21 Generated: 7/8/2010 4:29 PM
Page 1 of 1RAMPS AND RAMP JUNCTIONS WORKSHEET
7/8/2010file://C:\Documents and Settings\JMasinick\Local Settings\Temp\r2k214B.tmp
D-94

FREEWAY WEAVING WORKSHEETGeneral Information Site Information
Analyst JMAgency/Company Michael Baker Jr, Inc Date Performed 03-04-10 Analysis Time Period AM Peak
Freeway/Dir of Travel I-95 NB Weaving Seg Location W-1 NB 95 at Rt 3 weave JurisdictionAnalysis Year 2035 Build N5 full
InputsFreeway free-flow speed, SFF (mi/h) 70 Weaving number of lanes, N 4 Weaving seg length, L (ft) 900 Terrain Rolling
Weaving type AVolume ratio, VR 0.44 Weaving ratio, R 0.13
Conversions to pc/h Under Base Conditions(pc/h) V PHF Truck % RV % E T E R fHV fp vVo1 2220 0.94 13 0 2.5 2.0 0.837 1.00 2822 Vo2 0 0.93 13 0 2.5 2.0 0.837 1.00 0Vw1 1600 0.98 13 0 2.5 2.0 0.837 1.00 1951 Vw2 220 0.88 13 0 2.5 2.0 0.837 1.00 298 Vw 2249 Vnw 2822 V 5071 Weaving and Non-Weaving Speeds
Unconstrained ConstrainedWeaving (i = w) Non-Weaving (i = nw) Weaving (i = w) Non-Weaving ( = nw)
a (Exhibit 24-6) 0.35 0.0020 b (Exhibit 24-6) 2.20 4.00 c (Exhibit 24-6) 0.97 1.30 d (Exhibit 24-6) 0.80 0.75 Weaving intensity factor, Wi 3.48 0.57 Weaving and non-weaving speeds, Si (mi/h) 28.40 53.18 Number of lanes required for unconstrained operation, Nw 1.83 Maximum number of lanes, Nw (max) 1.40
If Nw < Nw(max) unconstrained operation����� if Nw > Nw (max) constrained operation������
Weaving Segment Speed, Density, Level of Service, and CapacityWeaving segment speed, S (mi/h) 38.34 Weaving segment density, D (pc/mi/ln) 33.06 Level of service, LOS DCapacity of base condition, cb (pc/h) 6708 Capacity as a 15-minute flow rate, c (veh/h) 5613 Capacity as a full-hour volume, ch (veh/h) 5347 Notesa. Weaving segments longer than 2500 ft. are treated as isolated merge and diverge areas using the procedures of Chapter 25, "Ramps and Ramp Junctions". b. Capacity constrained by basic freeway capacity. c. Capacity occurs under constrained operating conditions. d. Three-lane Type A segments do not operate well at volume ratios greater than 0.45. Poor operations and some local queuing are expected in such cases. e. Four-lane Type A segments do not operate well at volume ratios greater than 0.35. Poor operations and some local queuing are expected in such cases. f. Capacity constrained by maximum allowable weaving flow rate: 2,800 pc/h (Type A), 4,000 (Type B), 3,500 (Type C). g. Five-lane Type A segments do not operate well at volume ratios greater than 0.20. Poor operations and some local queuing are expected in such cases. h. Type B weaving segments do not operate well at volume ratios greater than 0.80. Poor operations and some local queuing are expected in such cases. i. Type C weaving segments do not operate well at volume ratios greater than 0.50. Poor operations and some local queuing are expected in such cases.
Copyright © 2005 University of Florida, All Rights Reserved HCS+TM Version 5.21 Generated: 7/8/2010 4:32 PM
Page 1 of 1FREEWAY WEAVING WORKSHEET
7/8/2010file://C:\Documents and Settings\JMasinick\Local Settings\Temp\s2k2159.tmp
D-95

FREEWAY WEAVING WORKSHEETGeneral Information Site Information
Analyst JMAgency/Company Michael Baker Jr, Inc Date Performed 03-05-10 Analysis Time Period PM Peak
Freeway/Dir of Travel I-95 NB Weaving Seg Location W-1 Rt 3 NB weave JurisdictionAnalysis Year 2035 Build N5 Full
InputsFreeway free-flow speed, SFF (mi/h) 70 Weaving number of lanes, N 4 Weaving seg length, L (ft) 900 Terrain Rolling
Weaving type AVolume ratio, VR 0.22 Weaving ratio, R 0.37
Conversions to pc/h Under Base Conditions(pc/h) V PHF Truck % RV % E T E R fHV fp vVo1 4270 0.98 12 0 2.5 2.0 0.847 1.00 5141 Vo2 0 0.96 12 0 2.5 2.0 0.847 1.00 0Vw1 750 0.98 12 0 2.5 2.0 0.847 1.00 903 Vw2 400 0.88 12 0 2.5 2.0 0.847 1.00 536 Vw 1439 Vnw 5141 V 6580 Weaving and Non-Weaving Speeds
Unconstrained ConstrainedWeaving (i = w) Non-Weaving (i = nw) Weaving (i = w) Non-Weaving ( = nw)
a (Exhibit 24-6) 0.15 0.0035 b (Exhibit 24-6) 2.20 4.00 c (Exhibit 24-6) 0.97 1.30 d (Exhibit 24-6) 0.80 0.75 Weaving intensity factor, Wi 1.32 0.71 Weaving and non-weaving speeds, Si (mi/h) 40.84 50.03 Number of lanes required for unconstrained operation, Nw 1.20 Maximum number of lanes, Nw (max) 1.40
If Nw < Nw(max) unconstrained operation������ if Nw > Nw (max) constrained operation�����
Weaving Segment Speed, Density, Level of Service, and CapacityWeaving segment speed, S (mi/h) 47.68 Weaving segment density, D (pc/mi/ln) 34.50 Level of service, LOS DCapacity of base condition, cb (pc/h) 7656 Capacity as a 15-minute flow rate, c (veh/h) 6488 Capacity as a full-hour volume, ch (veh/h) 6310 Notesa. Weaving segments longer than 2500 ft. are treated as isolated merge and diverge areas using the procedures of Chapter 25, "Ramps and Ramp Junctions". b. Capacity constrained by basic freeway capacity. c. Capacity occurs under constrained operating conditions. d. Three-lane Type A segments do not operate well at volume ratios greater than 0.45. Poor operations and some local queuing are expected in such cases. e. Four-lane Type A segments do not operate well at volume ratios greater than 0.35. Poor operations and some local queuing are expected in such cases. f. Capacity constrained by maximum allowable weaving flow rate: 2,800 pc/h (Type A), 4,000 (Type B), 3,500 (Type C). g. Five-lane Type A segments do not operate well at volume ratios greater than 0.20. Poor operations and some local queuing are expected in such cases. h. Type B weaving segments do not operate well at volume ratios greater than 0.80. Poor operations and some local queuing are expected in such cases. i. Type C weaving segments do not operate well at volume ratios greater than 0.50. Poor operations and some local queuing are expected in such cases.
Copyright © 2005 University of Florida, All Rights Reserved HCS+TM Version 5.21 Generated: 7/8/2010 4:32 PM
Page 1 of 1FREEWAY WEAVING WORKSHEET
7/8/2010file://C:\Documents and Settings\JMasinick\Local Settings\Temp\s2k215E.tmp
D-96

FREEWAY WEAVING WORKSHEETGeneral Information Site Information
Analyst JMAgency/Company Michael Baker Jr, Inc Date Performed 03-05-10 Analysis Time Period AM Peak
Freeway/Dir of Travel I-95 SB Weaving Seg Location W-4 SB VA 3 Weave JurisdictionAnalysis Year 2035 Build N5 full
InputsFreeway free-flow speed, SFF (mi/h) 70 Weaving number of lanes, N 3 Weaving seg length, L (ft) 950 Terrain Rolling
Weaving type AVolume ratio, VR 0.23 Weaving ratio, R 0.39
Conversions to pc/h Under Base Conditions(pc/h) V PHF Truck % RV % E T E R fHV fp vVo1 2950 0.96 18 0 2.5 2.0 0.787 1.00 3902 Vo2 0 0.96 18 0 2.5 2.0 0.787 1.00 0Vw1 510 0.91 18 0 2.5 2.0 0.787 1.00 711 Vw2 310 0.88 18 0 2.5 2.0 0.787 1.00 447 Vw 1158 Vnw 3902 V 5060 Weaving and Non-Weaving Speeds
Unconstrained ConstrainedWeaving (i = w) Non-Weaving (i = nw) Weaving (i = w) Non-Weaving ( = nw)
a (Exhibit 24-6) 0.15 0.0035 b (Exhibit 24-6) 2.20 4.00 c (Exhibit 24-6) 0.97 1.30 d (Exhibit 24-6) 0.80 0.75 Weaving intensity factor, Wi 1.32 0.73 Weaving and non-weaving speeds, Si (mi/h) 40.85 49.66 Number of lanes required for unconstrained operation, Nw 0.94 Maximum number of lanes, Nw (max) 1.40
If Nw < Nw(max) unconstrained operation������ if Nw > Nw (max) constrained operation�����
Weaving Segment Speed, Density, Level of Service, and CapacityWeaving segment speed, S (mi/h) 47.32 Weaving segment density, D (pc/mi/ln) 35.64 Level of service, LOS ECapacity of base condition, cb (pc/h) 5782 Capacity as a 15-minute flow rate, c (veh/h) 4553 Capacity as a full-hour volume, ch (veh/h) 4310 Notesa. Weaving segments longer than 2500 ft. are treated as isolated merge and diverge areas using the procedures of Chapter 25, "Ramps and Ramp Junctions". b. Capacity constrained by basic freeway capacity. c. Capacity occurs under constrained operating conditions. d. Three-lane Type A segments do not operate well at volume ratios greater than 0.45. Poor operations and some local queuing are expected in such cases. e. Four-lane Type A segments do not operate well at volume ratios greater than 0.35. Poor operations and some local queuing are expected in such cases. f. Capacity constrained by maximum allowable weaving flow rate: 2,800 pc/h (Type A), 4,000 (Type B), 3,500 (Type C). g. Five-lane Type A segments do not operate well at volume ratios greater than 0.20. Poor operations and some local queuing are expected in such cases. h. Type B weaving segments do not operate well at volume ratios greater than 0.80. Poor operations and some local queuing are expected in such cases. i. Type C weaving segments do not operate well at volume ratios greater than 0.50. Poor operations and some local queuing are expected in such cases.
Copyright © 2005 University of Florida, All Rights Reserved HCS+TM Version 5.21 Generated: 7/8/2010 4:33 PM
Page 1 of 1FREEWAY WEAVING WORKSHEET
7/8/2010file://C:\Documents and Settings\JMasinick\Local Settings\Temp\s2k2163.tmp
D-97
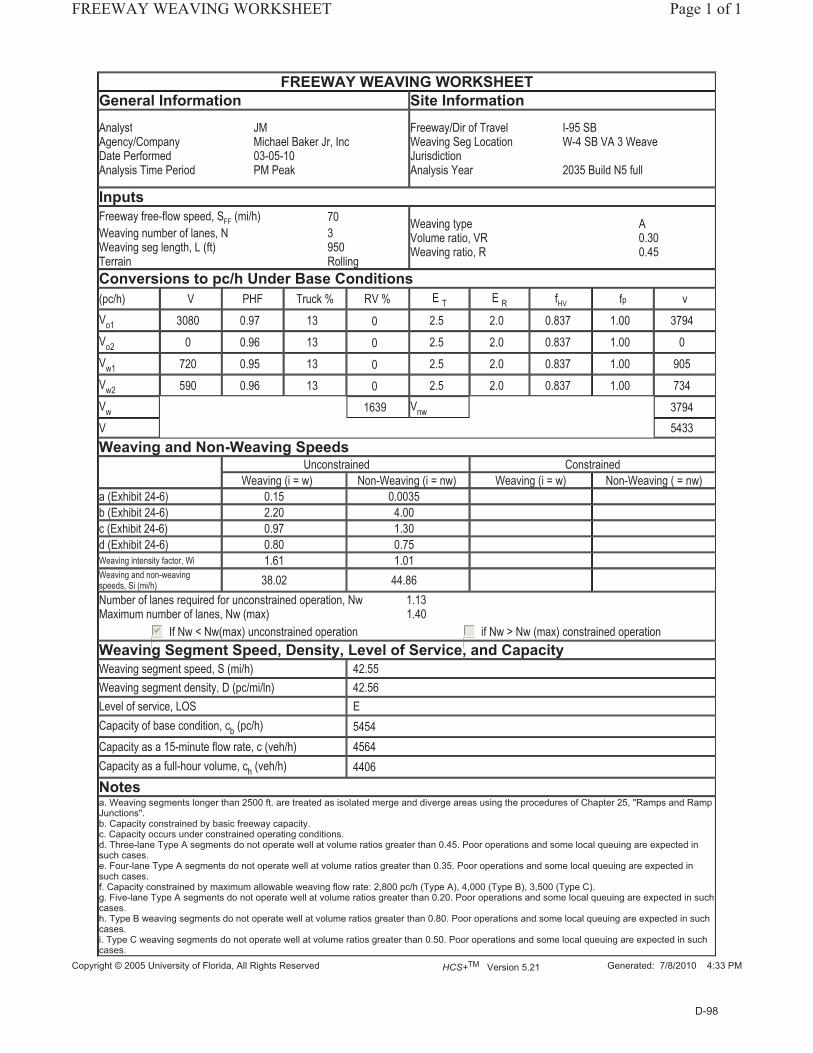
FREEWAY WEAVING WORKSHEETGeneral Information Site Information
Analyst JMAgency/Company Michael Baker Jr, Inc Date Performed 03-05-10 Analysis Time Period PM Peak
Freeway/Dir of Travel I-95 SB Weaving Seg Location W-4 SB VA 3 Weave JurisdictionAnalysis Year 2035 Build N5 full
InputsFreeway free-flow speed, SFF (mi/h) 70 Weaving number of lanes, N 3 Weaving seg length, L (ft) 950 Terrain Rolling
Weaving type AVolume ratio, VR 0.30 Weaving ratio, R 0.45
Conversions to pc/h Under Base Conditions(pc/h) V PHF Truck % RV % E T E R fHV fp vVo1 3080 0.97 13 0 2.5 2.0 0.837 1.00 3794 Vo2 0 0.96 13 0 2.5 2.0 0.837 1.00 0Vw1 720 0.95 13 0 2.5 2.0 0.837 1.00 905 Vw2 590 0.96 13 0 2.5 2.0 0.837 1.00 734 Vw 1639 Vnw 3794 V 5433 Weaving and Non-Weaving Speeds
Unconstrained ConstrainedWeaving (i = w) Non-Weaving (i = nw) Weaving (i = w) Non-Weaving ( = nw)
a (Exhibit 24-6) 0.15 0.0035 b (Exhibit 24-6) 2.20 4.00 c (Exhibit 24-6) 0.97 1.30 d (Exhibit 24-6) 0.80 0.75 Weaving intensity factor, Wi 1.61 1.01 Weaving and non-weaving speeds, Si (mi/h) 38.02 44.86 Number of lanes required for unconstrained operation, Nw 1.13 Maximum number of lanes, Nw (max) 1.40
If Nw < Nw(max) unconstrained operation������ if Nw > Nw (max) constrained operation�����
Weaving Segment Speed, Density, Level of Service, and CapacityWeaving segment speed, S (mi/h) 42.55 Weaving segment density, D (pc/mi/ln) 42.56 Level of service, LOS ECapacity of base condition, cb (pc/h) 5454 Capacity as a 15-minute flow rate, c (veh/h) 4564 Capacity as a full-hour volume, ch (veh/h) 4406 Notesa. Weaving segments longer than 2500 ft. are treated as isolated merge and diverge areas using the procedures of Chapter 25, "Ramps and Ramp Junctions". b. Capacity constrained by basic freeway capacity. c. Capacity occurs under constrained operating conditions. d. Three-lane Type A segments do not operate well at volume ratios greater than 0.45. Poor operations and some local queuing are expected in such cases. e. Four-lane Type A segments do not operate well at volume ratios greater than 0.35. Poor operations and some local queuing are expected in such cases. f. Capacity constrained by maximum allowable weaving flow rate: 2,800 pc/h (Type A), 4,000 (Type B), 3,500 (Type C). g. Five-lane Type A segments do not operate well at volume ratios greater than 0.20. Poor operations and some local queuing are expected in such cases. h. Type B weaving segments do not operate well at volume ratios greater than 0.80. Poor operations and some local queuing are expected in such cases. i. Type C weaving segments do not operate well at volume ratios greater than 0.50. Poor operations and some local queuing are expected in such cases.
Copyright © 2005 University of Florida, All Rights Reserved HCS+TM Version 5.21 Generated: 7/8/2010 4:33 PM
Page 1 of 1FREEWAY WEAVING WORKSHEET
7/8/2010file://C:\Documents and Settings\JMasinick\Local Settings\Temp\s2k2168.tmp
D-98

Route 3 and Route 17 Intersection
D-99


SHORT REPORT General Information Site Information
Analyst ZPH Agency or Co. Baker Date Performed 03/01/2010 Time Period AM Peak Hour
Intersection #1 Germanna Hwy & Shopping Ctr
Area Type All other areas Jurisdiction Analysis Year 2035 Build Conditions
Volume and Timing InputEB WB NB SB
LT TH RT LT TH RT LT TH RT LT TH RT Number of Lanes 2 3 1 2 3 1 2 2 1 1 2 1 Lane Group L T R L T R L T R L T R Volume (vph) 150 2330 500 30 880 80 240 80 20 80 40 10 % Heavy Vehicles 1 2 0 3 5 5 2 3 0 1 2 0 PHF 0.80 0.86 0.83 0.80 0.84 0.82 0.80 0.80 0.88 0.80 0.80 0.80 Pretimed/Actuated (P/A) A P P A P P P P P P P P Startup Lost Time 2.0 2.0 2.0 2.0 2.0 2.0 2.0 2.0 2.0 2.0 2.0 2.0 Extension of Effective Green 6.0 8.0 8.0 6.0 8.0 8.0 6.0 6.0 6.0 6.0 6.0 6.0 Arrival Type 3 3 3 2 5 5 3 3 3 3 3 3 Unit Extension 3.0 3.0 3.0 3.0 3.0 3.0 3.0 3.0 3.0 3.0 3.0 3.0 Ped/Bike/RTOR Volume 0 0 50 0 0 8 0 0 2 0 0 1 Lane Width 12.0 12.0 12.0 12.0 12.0 12.0 12.0 12.0 12.0 12.0 12.0 12.0 Parking/Grade/Parking N 0 N N 0 N N 0 N N 0 N Parking/Hour Bus Stops/Hour 0 0 0 0 0 0 0 0 0 0 0 0 Minimum Pedestrian Time 3.2 3.2 3.2 3.2 Phasing EB Only Thru & RT WB Only 04 NB Only SB Only 07 08
Timing G = 8.0 G = 36.0 G = 6.0 G = 0.0 G = 8.0 G = 8.0 G = G = Y = 8 Y = 10 Y = 10 Y = 0 Y = 8 Y = 8 Y = Y =
Duration of Analysis (hrs) = 0.25 Cycle Length C = 110.0 Lane Group Capacity, Control Delay, and LOS Determination
EB WB NB SB
Adjusted Flow Rate 187 2709 542 37 1048 88 300 100 20 100 50 11
Lane Group Capacity 379 2675 852 309 2599 811 375 383 176 195 387 176
v/c Ratio 0.49 1.01 0.64 0.12 0.40 0.11 0.80 0.26 0.11 0.51 0.13 0.06
Green Ratio 0.11 0.53 0.53 0.09 0.53 0.53 0.11 0.11 0.11 0.11 0.11 0.11
Uniform Delay d1 46.1 26.0 18.5 46.0 15.6 13.0 47.8 44.9 44.2 46.2 44.3 44.0
Delay Factor k 0.11 0.50 0.50 0.11 0.50 0.50 0.50 0.50 0.50 0.50 0.50 0.50
Incremental Delay d2 1.0 20.6 3.6 0.2 0.5 0.3 16.3 1.7 1.3 9.3 0.7 0.7 PF Factor 1.000 1.000 1.000 1.000 0.256 0.256 1.000 1.000 1.000 1.000 1.000 1.000 Control Delay 47.2 46.6 22.1 46.1 4.5 3.6 64.1 46.6 45.5 55.6 45.0 44.6
Lane Group LOS D D C D A A E D D E D D
Approach Delay 42.8 5.7 59.0 51.5
Approach LOS D A E D
Intersection Delay 36.0 Intersection LOS DCopyright © 2005 University of Florida, All Rights Reserved HCS+TM Version 5.21 Generated: 7/6/2010 1:28 PM
Page 1 of 1Short Report
7/6/2010file://C:\Documents and Settings\JMasinick\Local Settings\Temp\s2k1470.tmp
D-100

SHORT REPORT General Information Site Information
Analyst ZH Agency or Co. Baker Date Performed 03/01/2010 Time Period PM Peak Hour
Intersection #1 Germanna Hwy & Shopping Ctr
Area Type All other areas Jurisdiction Analysis Year 2035 Build Conditions
Volume and Timing InputEB WB NB SB
LT TH RT LT TH RT LT TH RT LT TH RT Number of Lanes 2 3 1 2 3 1 2 2 1 1 2 1 Lane Group L T R L T R L T R L T R Volume (vph) 170 1290 260 80 2410 370 270 130 40 170 160 170 % Heavy Vehicles 1 4 1 0 1 1 0 1 0 1 0 1 PHF 0.80 0.94 0.94 0.80 0.99 0.91 0.80 0.80 0.80 0.80 0.80 0.83 Pretimed/Actuated (P/A) A P P A P P P P P P P P Startup Lost Time 2.0 2.0 2.0 2.0 2.0 2.0 2.0 2.0 2.0 2.0 2.0 2.0 Extension of Effective Green 6.0 8.0 8.0 6.0 8.0 8.0 6.0 6.0 6.0 6.0 6.0 6.0 Arrival Type 3 3 3 2 4 3 3 3 3 3 3 3 Unit Extension 3.0 3.0 3.0 3.0 3.0 3.0 3.0 3.0 3.0 3.0 3.0 3.0 Ped/Bike/RTOR Volume 0 0 26 0 0 37 0 0 4 0 0 17 Lane Width 12.0 12.0 12.0 12.0 12.0 12.0 12.0 12.0 12.0 12.0 12.0 12.0 Parking/Grade/Parking N 0 N N 0 N N 0 N N 0 N Parking/Hour Bus Stops/Hour 0 0 0 0 0 0 0 0 0 0 0 0 Minimum Pedestrian Time 3.2 3.2 3.2 3.2 Phasing WB Only Thru & RT EB Only 04 SB Only NB Only 07 08
Timing G = 8.0 G = 51.0 G = 6.0 G = 0.0 G = 16.0 G = 11.0 G = 0.0 G = 0.0 Y = 8 Y = 10 Y = 10 Y = 0 Y = 8 Y = 8 Y = 0 Y = 0
Duration of Analysis (hrs) = 0.25 Cycle Length C = 136.0 Lane Group Capacity, Control Delay, and LOS Determination
EB WB NB SB
Adjusted Flow Rate 212 1372 249 100 2434 366 337 162 45 212 200 184
Lane Group Capacity 255 2671 858 309 2750 858 387 395 178 263 532 235
v/c Ratio 0.83 0.51 0.29 0.32 0.89 0.43 0.87 0.41 0.25 0.81 0.38 0.78
Green Ratio 0.07 0.54 0.54 0.09 0.54 0.54 0.11 0.11 0.11 0.15 0.15 0.15
Uniform Delay d1 62.2 20.1 17.3 58.2 27.8 18.9 59.5 56.4 55.4 56.1 52.4 55.9
Delay Factor k 0.37 0.50 0.50 0.11 0.50 0.50 0.50 0.50 0.50 0.50 0.50 0.50
Incremental Delay d2 20.2 0.7 0.9 0.5 3.7 1.2 22.6 3.1 3.4 22.6 2.0 22.5 PF Factor 1.000 1.000 1.000 1.000 0.706 1.000 1.000 1.000 1.000 1.000 1.000 1.000 Control Delay 82.4 20.9 18.1 58.7 23.3 20.1 82.1 59.5 58.8 78.7 54.4 78.4
Lane Group LOS F C B E C C F E E E D E
Approach Delay 27.6 24.1 73.5 70.4
Approach LOS C C E E
Intersection Delay 34.5 Intersection LOS CCopyright © 2005 University of Florida, All Rights Reserved HCS+TM Version 5.21 Generated: 7/6/2010 1:31 PM
Page 1 of 1Short Report
7/6/2010file://C:\Documents and Settings\JMasinick\Local Settings\Temp\s2k1488.tmp
D-101

SHORT REPORT General Information Site Information
Analyst ZH Agency or Co. Baker Date Performed 03/01/2010 Time Period AM Peak Hour
Intersection #2 Germanna Hwy & Gordon Rd
Area Type All other areas Jurisdiction Analysis Year 2035 Build Condition
Volume and Timing InputEB WB NB SB
LT TH RT LT TH RT LT TH RT LT TH RT Number of Lanes 2 3 1 1 3 1 2 2 1 2 2 1 Lane Group L T R L T R L T R L T R Volume (vph) 920 1310 100 60 290 190 200 910 400 40 310 630 % Heavy Vehicles 0 3 6 3 8 0 2 0 1 1 1 1 PHF 0.90 0.90 0.91 0.80 0.89 0.90 0.80 0.90 0.86 0.90 0.90 0.90 Pretimed/Actuated (P/A) A P P A P P A A A A A A Startup Lost Time 2.0 2.0 2.0 2.0 2.0 2.0 2.0 2.0 2.0 2.0 2.0 2.0 Extension of Effective Green 2.0 6.0 6.0 3.5 6.0 2.0 4.0 2.0 4.0 2.0 2.0 2.0 Arrival Type 3 1 1 1 1 3 3 3 3 3 3 3 Unit Extension 3.0 3.0 3.0 3.0 3.0 3.0 3.0 3.0 3.0 3.0 3.0 3.0 Ped/Bike/RTOR Volume 0 0 7 0 0 19 0 0 45 0 0 63 Lane Width 12.0 12.0 12.0 12.0 12.0 12.0 12.0 12.0 12.0 12.0 12.0 12.0 Parking/Grade/Parking N 0 N N 0 N N 0 N N 0 N Parking/Hour Bus Stops/Hour 0 0 0 0 0 0 0 0 0 0 0 0 Minimum Pedestrian Time 3.2 3.2 3.2 3.2 Phasing Excl. Left EB Only Thru & RT 04 Excl. Left Thru & RT 07 08
Timing G = 8.1 G = 21.4 G = 17.0 G = 0.0 G = 6.0 G = 30.0 G = G = Y = 5.5 Y = 4 Y = 8 Y = 0 Y = 4 Y = 6 Y = Y =
Duration of Analysis (hrs) = 0.25 Cycle Length C = 110.0 Lane Group Capacity, Control Delay, and LOS Determination
EB WB NB SB
Adjusted Flow Rate 1022 1456 102 75 326 190 250 1011 413 44 344 630
Lane Group Capacity 1115 2120 643 153 915 250 250 987 465 189 977 436
v/c Ratio 0.92 0.69 0.16 0.49 0.36 0.76 1.00 1.02 0.89 0.23 0.35 1.44
Green Ratio 0.32 0.42 0.42 0.09 0.19 0.15 0.07 0.27 0.29 0.05 0.27 0.27
Uniform Delay d1 36.1 25.9 19.7 47.9 38.6 44.5 51.0 40.0 37.3 49.8 32.2 40.0
Delay Factor k 0.43 0.50 0.50 0.11 0.50 0.50 0.50 0.50 0.41 0.11 0.11 0.50
Incremental Delay d2 8.8 1.3 0.4 2.3 1.0 18.5 56.9 35.0 18.5 0.6 0.2 212.2 PF Factor 1.000 1.486 1.486 1.064 1.157 1.000 1.000 1.000 1.000 1.000 1.000 1.000 Control Delay 44.9 39.8 29.7 53.3 45.7 63.0 107.9 75.0 55.8 50.4 32.4 252.2
Lane Group LOS D D C D D E F E E D C F
Approach Delay 41.4 52.2 75.2 169.2
Approach LOS D D E F
Intersection Delay 74.3 Intersection LOS ECopyright © 2005 University of Florida, All Rights Reserved HCS+TM Version 5.21 Generated: 7/6/2010 1:33 PM
Page 1 of 1Short Report
7/6/2010file://C:\Documents and Settings\JMasinick\Local Settings\Temp\s2k149A.tmp
D-102

SHORT REPORT General Information Site Information
Analyst ZH Agency or Co. Baker Date Performed 03/01/2010 Time Period PM Peak Hour
Intersection #2 Germanna Hwy & Gordon Rd
Area Type All other areas Jurisdiction Analysis Year 2035 Build Conditions
Volume and Timing InputEB WB NB SB
LT TH RT LT TH RT LT TH RT LT TH RT Number of Lanes 2 3 1 1 3 1 2 2 1 2 2 1 Lane Group L T R L T R L T R L T R Volume (vph) 840 520 110 330 810 210 240 460 160 200 1300 1790 % Heavy Vehicles 0 5 3 2 2 0 2 0 2 0 0 0 PHF 0.90 0.94 0.80 0.88 0.99 0.90 0.80 0.90 0.89 0.90 0.90 0.90 Pretimed/Actuated (P/A) A P P A P P A A A A A A Startup Lost Time 2.0 2.0 2.0 2.0 2.0 2.0 2.0 2.0 2.0 2.0 2.0 2.0 Extension of Effective Green 2.0 6.0 6.0 3.5 6.0 2.0 4.0 2.0 4.0 2.0 2.0 2.0 Arrival Type 3 1 1 2 2 3 3 3 3 3 3 3 Unit Extension 3.0 3.0 3.0 3.0 3.0 3.0 3.0 3.0 3.0 3.0 3.0 3.0 Ped/Bike/RTOR Volume 0 0 11 0 0 21 0 0 16 0 0 179 Lane Width 12.0 12.0 12.0 12.0 12.0 12.0 12.0 12.0 12.0 12.0 12.0 12.0 Parking/Grade/Parking N 0 N N 0 N N 0 N N 0 N Parking/Hour Bus Stops/Hour 0 0 0 0 0 0 0 0 0 0 0 0 Minimum Pedestrian Time 3.2 3.2 3.2 3.2 Phasing Excl. Left Thru & RT 03 04 Excl. Left Thru & RT 07 08
Timing G = 19.5 G = 16.0 G = G = G = 7.0 G = 70.0 G = G = Y = 5.5 Y = 8 Y = Y = Y = 6 Y = 4 Y = Y =
Duration of Analysis (hrs) = 0.25 Cycle Length C = 136.0 Lane Group Capacity, Control Delay, and LOS Determination
EB WB NB SB
Adjusted Flow Rate 933 553 124 375 818 210 300 511 162 222 1444 1790
Lane Group Capacity 503 725 231 273 746 190 227 1862 838 180 1862 831
v/c Ratio 1.85 0.76 0.54 1.37 1.10 1.11 1.32 0.27 0.19 1.23 0.78 2.15
Green Ratio 0.14 0.15 0.15 0.15 0.15 0.12 0.07 0.51 0.53 0.05 0.51 0.51
Uniform Delay d1 58.3 55.7 53.7 57.5 58.0 60.0 63.5 18.6 16.8 64.5 26.7 33.0
Delay Factor k 0.50 0.50 0.50 0.50 0.50 0.50 0.50 0.11 0.11 0.50 0.32 0.50
Incremental Delay d2 391.7 6.9 8.0 173.6 49.1 64.5 172.1 0.1 0.1 116.2 0.5 520.3
PF Factor 1.000 1.115 1.115 1.000 1.000 1.000 1.000 1.000 1.000 1.000 1.000 1.000
Control Delay 450.0 69.0 67.9 231.1 107.1 124.5 235.6 18.7 16.9 180.7 27.2 553.3
Lane Group LOS F E E F F F F B B F C F
Approach Delay 289.7 142.9 85.3 309.5
Approach LOS F F F F
Intersection Delay 244.5 Intersection LOS FCopyright © 2005 University of Florida, All Rights Reserved HCS+TM Version 5.21 Generated: 7/6/2010 1:34 PM
Page 1 of 1Short Report
7/6/2010file://C:\Documents and Settings\JMasinick\Local Settings\Temp\s2k14AD.tmp
D-103

SHORT REPORT General Information Site Information
Analyst ZH Agency or Co. Baker Date Performed 03/01/2010 Time Period AM Peak Hour
Intersection #3 Route 3 & Five Mile Rd Ext
Area Type All other areas Jurisdiction Analysis Year 2035 Build Conditions
Volume and Timing InputEB WB NB SB
LT TH RT LT TH RT LT TH RT LT TH RT Number of Lanes 1 3 1 1 3 1 0 1 1 0 1 1 Lane Group L T R L T R LT R LT R Volume (vph) 20 1780 40 20 250 0 180 20 300 40 10 40 % Heavy Vehicles 4 4 4 4 4 4 4 4 4 4 4 4 PHF 0.90 0.90 0.90 0.90 0.90 0.90 0.90 0.90 0.90 0.90 0.90 0.90 Pretimed/Actuated (P/A) A P P A P P A A A A A A Startup Lost Time 2.0 2.0 2.0 2.0 2.0 2.0 2.0 2.0 2.0 2.0 Extension of Effective Green 3.5 5.0 5.0 4.5 5.0 5.0 4.0 4.0 4.0 4.0 Arrival Type 2 4 5 3 3 3 3 3 3 3 Unit Extension 3.0 3.0 3.0 3.0 3.0 3.0 3.0 3.0 3.0 3.0 Ped/Bike/RTOR Volume 0 0 4 0 0 0 0 0 30 0 0 4 Lane Width 12.0 12.0 12.0 12.0 12.0 12.0 12.0 12.0 12.0 12.0 Parking/Grade/Parking N 0 N N 0 N N 0 N N 0 N Parking/Hour Bus Stops/Hour 0 0 0 0 0 0 0 0 0 0 Minimum Pedestrian Time 3.2 3.2 3.2 3.2 Phasing WB Only Thru & RT EB Only 04 NB Only SB Only 07 08
Timing G = 5.0 G = 39.0 G = 5.0 G = G = 23.0 G = 7.0 G = G = Y = 6.5 Y = 7 Y = 5.5 Y = Y = 6 Y = 6 Y = Y =
Duration of Analysis (hrs) = 0.25 Cycle Length C = 110.0 Lane Group Capacity, Control Delay, and LOS Determination
EB WB NB SB
Adjusted Flow Rate 22 1978 40 22 278 0 222 300 55 40
Lane Group Capacity 103 2443 762 118 2421 755 397 353 144 127
v/c Ratio 0.21 0.81 0.05 0.19 0.11 0.00 0.56 0.85 0.38 0.31
Green Ratio 0.06 0.49 0.49 0.07 0.49 0.49 0.23 0.23 0.08 0.08
Uniform Delay d1 49.3 23.7 14.6 48.4 15.4 14.5 37.6 40.7 47.9 47.6
Delay Factor k 0.11 0.50 0.50 0.11 0.50 0.50 0.16 0.38 0.11 0.11
Incremental Delay d2 0.5 1.5 0.1 0.8 0.1 0.0 1.8 17.5 1.7 1.4 PF Factor 1.000 0.780 0.357 1.000 1.000 1.000 1.000 1.000 1.000 1.000 Control Delay 49.8 19.9 5.3 49.1 15.5 14.5 39.4 58.2 49.6 49.0
Lane Group LOS D B A D B B D E D D
Approach Delay 20.0 17.9 50.2 49.3
Approach LOS B B D D
Intersection Delay 26.0 Intersection LOS CCopyright © 2005 University of Florida, All Rights Reserved HCS+TM Version 5.21 Generated: 7/6/2010 1:34 PM
Page 1 of 1Short Report
7/6/2010file://C:\Documents and Settings\JMasinick\Local Settings\Temp\s2k14C0.tmp
D-104

SHORT REPORT General Information Site Information
Analyst ZH Agency or Co. Baker Date Performed 03/01/2010 Time Period PM Peak Hour
Intersection #3 Route 3 & Five Mile Rd Ext
Area Type All other areas Jurisdiction Analysis Year 2035 Build Condirions
Volume and Timing InputEB WB NB SB
LT TH RT LT TH RT LT TH RT LT TH RT Number of Lanes 1 3 1 1 3 1 0 1 1 0 1 1 Lane Group L T R L T R LT R LT R Volume (vph) 70 720 180 100 1000 30 230 40 140 20 40 40 % Heavy Vehicles 4 4 4 4 4 4 4 4 4 4 4 4 PHF 0.90 0.90 0.90 0.90 0.90 0.90 0.90 0.90 0.90 0.90 0.90 0.90 Pretimed/Actuated (P/A) A P P A P P P P P P P P Startup Lost Time 2.0 2.0 2.0 2.0 2.0 2.0 2.0 2.0 2.0 2.0 Extension of Effective Green 3.5 5.0 5.0 4.5 5.0 5.0 4.0 4.0 4.0 4.0 Arrival Type 4 1 1 3 3 3 3 3 3 3 Unit Extension 3.0 3.0 3.0 3.0 3.0 3.0 3.0 3.0 3.0 3.0 Ped/Bike/RTOR Volume 0 0 18 0 0 3 0 0 14 0 0 4 Lane Width 12.0 12.0 12.0 12.0 12.0 12.0 12.0 12.0 12.0 12.0 Parking/Grade/Parking N 0 N N 0 N N 0 N N 0 N Parking/Hour Bus Stops/Hour 0 0 0 0 0 0 0 0 0 0 Minimum Pedestrian Time 3.2 3.2 3.2 3.2 Phasing Excl. Left Thru & RT 03 04 SB Only NB Only 07 08
Timing G = 17.0 G = 44.0 G = 0.0 G = G = 11.0 G = 40.0 G = G = Y = 5.5 Y = 7 Y = 0 Y = Y = 6 Y = 6 Y = Y =
Duration of Analysis (hrs) = 0.25 Cycle Length C = 136.5 Lane Group Capacity, Control Delay, and LOS Determination
EB WB NB SB
Adjusted Flow Rate 78 800 180 111 1111 30 300 140 66 40
Lane Group Capacity 235 1714 535 248 1714 535 539 478 171 148
v/c Ratio 0.33 0.47 0.34 0.45 0.65 0.06 0.56 0.29 0.39 0.27
Green Ratio 0.14 0.34 0.34 0.14 0.34 0.34 0.31 0.31 0.10 0.10
Uniform Delay d1 53.4 35.0 33.2 53.6 37.8 29.9 39.5 36.0 58.0 57.3
Delay Factor k 0.11 0.50 0.50 0.11 0.50 0.50 0.50 0.50 0.50 0.50
Incremental Delay d2 0.6 0.7 1.3 1.3 1.9 0.2 4.1 1.6 6.5 4.4 PF Factor 1.000 1.350 1.350 1.000 1.000 1.000 1.000 1.000 1.000 1.000 Control Delay 54.0 47.9 46.1 54.9 39.7 30.1 43.6 37.5 64.5 61.8
Lane Group LOS D D D D D C D D E E
Approach Delay 48.0 40.8 41.6 63.5
Approach LOS D D D E
Intersection Delay 44.5 Intersection LOS DCopyright © 2005 University of Florida, All Rights Reserved HCS+TM Version 5.21 Generated: 7/6/2010 1:34 PM
Page 1 of 1Short Report
7/6/2010file://C:\Documents and Settings\JMasinick\Local Settings\Temp\s2k14D3.tmp
D-105

SHORT REPORT General Information Site Information
Analyst ZH Agency or Co. Baker Date Performed 03/01/2010 Time Period AM Peak Hour
Intersection #4 Germanna Hwy & Bragg Rd
Area Type All other areas Jurisdiction Analysis Year 2035 Build Conditions
Volume and Timing InputEB WB NB SB
LT TH RT LT TH RT LT TH RT LT TH RT Number of Lanes 2 3 1 2 3 1 1 1 1 2 1 2 Lane Group L T R L T R L LT R L T R Volume (vph) 290 2400 190 200 940 100 90 40 150 100 60 130 % Heavy Vehicles 2 2 1 1 6 3 2 0 2 2 0 1 PHF 0.92 0.86 0.80 0.80 0.89 0.80 0.80 0.80 0.80 0.80 0.80 0.80 Pretimed/Actuated (P/A) A A A A A A P P P P P P Startup Lost Time 2.0 2.0 2.0 2.0 2.0 2.0 2.0 2.0 2.0 2.0 2.0 2.0 Extension of Effective Green 3.5 4.5 4.5 3.5 4.5 4.5 4.0 4.0 4.0 4.0 4.0 4.0 Arrival Type 3 3 3 4 1 1 3 3 3 3 3 3 Unit Extension 3.0 3.0 3.0 3.0 3.0 3.0 3.0 3.0 3.0 3.0 3.0 3.0 Ped/Bike/RTOR Volume 0 0 19 0 0 10 0 0 15 0 0 13 Lane Width 12.0 12.0 12.0 12.0 12.0 12.0 12.0 12.0 12.0 12.0 12.0 12.0 Parking/Grade/Parking N 0 N N 0 N N 0 N N 0 N Parking/Hour Bus Stops/Hour 0 0 0 0 0 0 0 0 0 0 0 0 Minimum Pedestrian Time 3.2 3.2 3.2 3.2 Phasing WB Only Thru & RT EB Only 04 NB Only SB Only 07 08
Timing G = 9.5 G = 43.5 G = 13.5 G = 0.0 G = 7.0 G = 6.0 G = G = Y = 5.5 Y = 6.5 Y = 6.5 Y = 0 Y = 6 Y = 6 Y = Y =
Duration of Analysis (hrs) = 0.25 Cycle Length C = 110.0 Lane Group Capacity, Control Delay, and LOS Determination
EB WB NB SB
Adjusted Flow Rate 315 2791 214 250 1056 112 78 84 169 125 75 146
Lane Group Capacity 469 3044 959 347 2708 870 145 151 130 250 138 206
v/c Ratio 0.67 0.92 0.22 0.72 0.39 0.13 0.54 0.56 1.30 0.50 0.54 0.71
Green Ratio 0.14 0.60 0.60 0.10 0.55 0.55 0.08 0.08 0.08 0.07 0.07 0.07
Uniform Delay d1 45.2 19.6 10.2 48.0 13.9 11.8 48.5 48.6 50.5 49.1 49.2 49.9
Delay Factor k 0.24 0.44 0.11 0.28 0.11 0.11 0.50 0.50 0.50 0.50 0.50 0.50
Incremental Delay d2 3.7 5.0 0.1 6.9 0.1 0.1 13.6 14.0 180.0 7.0 14.5 18.6 PF Factor 1.000 1.000 1.000 1.000 1.830 1.830 1.000 1.000 1.000 1.000 1.000 1.000 Control Delay 48.9 24.6 10.3 54.9 25.6 21.6 62.1 62.5 230.5 56.1 63.7 68.5
Lane Group LOS D C B D C C E E F E E E
Approach Delay 26.0 30.4 148.2 63.0
Approach LOS C C F E
Intersection Delay 37.0 Intersection LOS DCopyright © 2005 University of Florida, All Rights Reserved HCS+TM Version 5.21 Generated: 7/6/2010 1:34 PM
Page 1 of 1Short Report
7/6/2010file://C:\Documents and Settings\JMasinick\Local Settings\Temp\s2k14E6.tmp
D-106

SHORT REPORT General Information Site Information
Analyst ZH Agency or Co. Baker Date Performed 03/01/2010 Time Period PM Peak Hour
Intersection #4 Germanna Hwy & Bragg Rd
Area Type All other areas Jurisdiction Analysis Year 2035 Build Conditions
Volume and Timing InputEB WB NB SB
LT TH RT LT TH RT LT TH RT LT TH RT Number of Lanes 2 3 1 2 3 1 1 1 1 2 1 2 Lane Group L T R L T R L LT R L T R Volume (vph) 170 1560 250 170 1470 330 260 130 170 140 170 310 % Heavy Vehicles 2 3 0 0 1 1 0 0 1 1 0 0 PHF 0.89 0.93 0.83 0.89 0.91 0.94 0.89 0.83 0.83 0.86 0.80 0.91 Pretimed/Actuated (P/A) A A A A A A P P P P P P Startup Lost Time 2.0 2.0 2.0 2.0 2.0 2.0 2.0 2.0 2.0 2.0 2.0 2.0 Extension of Effective Green 3.5 4.5 4.5 3.5 4.5 4.5 4.0 4.0 4.0 4.0 4.0 4.0 Arrival Type 3 3 3 2 5 5 3 3 3 3 3 3 Unit Extension 3.0 3.0 3.0 3.0 3.0 3.0 3.0 3.0 3.0 3.0 3.0 3.0 Ped/Bike/RTOR Volume 0 0 25 0 0 33 0 0 17 0 0 31 Lane Width 12.0 12.0 12.0 12.0 12.0 12.0 12.0 12.0 12.0 12.0 12.0 12.0 Parking/Grade/Parking N 0 N N 0 N N 0 N N 0 N Parking/Hour Bus Stops/Hour 0 0 0 0 0 0 0 0 0 0 0 0 Minimum Pedestrian Time 3.2 3.2 3.2 3.2 Phasing WB Only Thru & RT EB Only 04 NB Only SB Only 07 08
Timing G = 11.5 G = 38.5 G = 10.5 G = 0.0 G = 20.0 G = 25.0 G = G = Y = 5.5 Y = 6.5 Y = 6.5 Y = 0 Y = 6 Y = 6 Y = Y =
Duration of Analysis (hrs) = 0.25 Cycle Length C = 136.0 Lane Group Capacity, Control Delay, and LOS Determination
EB WB NB SB
Adjusted Flow Rate 191 1677 271 191 1615 316 204 245 184 163 212 307
Lane Group Capacity 303 2143 689 335 2185 682 292 302 259 689 377 568
v/c Ratio 0.63 0.78 0.39 0.57 0.74 0.46 0.70 0.81 0.71 0.24 0.56 0.54
Green Ratio 0.09 0.43 0.43 0.10 0.43 0.43 0.16 0.16 0.16 0.20 0.20 0.20
Uniform Delay d1 59.9 33.6 26.9 58.8 32.7 27.9 53.9 55.0 54.0 45.8 49.2 48.9
Delay Factor k 0.21 0.33 0.11 0.16 0.30 0.11 0.50 0.50 0.50 0.50 0.50 0.50
Incremental Delay d2 4.2 2.0 0.4 1.6 0.9 0.3 13.0 20.6 15.3 0.8 6.0 3.7 PF Factor 1.000 1.000 1.000 1.000 0.504 0.504 1.000 1.000 1.000 1.000 1.000 1.000 Control Delay 64.0 35.5 27.2 60.4 17.4 14.4 66.9 75.6 69.2 46.6 55.1 52.6
Lane Group LOS E D C E B B E E E D E D
Approach Delay 37.0 20.8 71.0 52.0
Approach LOS D C E D
Intersection Delay 36.5 Intersection LOS DCopyright © 2005 University of Florida, All Rights Reserved HCS+TM Version 5.21 Generated: 7/6/2010 1:40 PM
Page 1 of 1Short Report
7/6/2010file://C:\Documents and Settings\JMasinick\Local Settings\Temp\s2k14F9.tmp
D-107

SHORT REPORT General Information Site Information
Analyst ZH Agency or Co. Baker Date Performed 03/01/2010 Time Period AM Peak Hour
Intersection #5 Germanna Hwy & Central Park
Area Type All other areas Jurisdiction Analysis Year 2035 Build Conditions
Volume and Timing InputEB WB NB SB
LT TH RT LT TH RT LT TH RT LT TH RT Number of Lanes 2 3 1 2 4 0 1 1 1 1 2 1 Lane Group L T R L TR L LT R L LT R Volume (vph) 250 2480 70 130 1090 30 10 40 220 1 20 50 % Heavy Vehicles 1 2 1 6 5 4 0 3 3 3 12 4 PHF 0.82 0.89 0.87 0.80 0.92 0.80 1.00 0.89 0.85 0.80 0.80 0.88 Pretimed/Actuated (P/A) A P P A P P P P P P P P Startup Lost Time 2.0 2.0 2.0 2.0 2.0 2.0 2.0 2.0 2.0 2.0 2.0 Extension of Effective Green 3.5 4.5 4.5 3.5 4.5 4.0 4.0 4.0 4.0 4.0 4.0 Arrival Type 2 5 6 4 5 3 3 3 3 3 3 Unit Extension 3.0 3.0 3.0 3.0 3.0 3.0 3.0 3.0 3.0 3.0 3.0 Ped/Bike/RTOR Volume 0 0 7 0 0 3 0 0 22 0 0 5 Lane Width 12.0 12.0 12.0 12.0 12.0 12.0 12.0 12.0 12.0 12.0 12.0 Parking/Grade/Parking N 0 N N 0 N N 0 N N 0 N Parking/Hour Bus Stops/Hour 0 0 0 0 0 0 0 0 0 0 0 Minimum Pedestrian Time 3.2 3.2 3.2 3.2 Phasing EB Only Thru & RT WB Only 04 NB Only SB Only 07 08
Timing G = 12.8 G = 43.7 G = 9.0 G = G = 6.0 G = 8.0 G = G = Y = 5.5 Y = 6.5 Y = 6.5 Y = Y = 6 Y = 6 Y = Y =
Duration of Analysis (hrs) = 0.25 Cycle Length C = 110.0 Lane Group Capacity, Control Delay, and LOS Determination
EB WB NB SB
Adjusted Flow Rate 305 2787 72 162 1219 7 48 233 1 25 51
Lane Group Capacity 451 2975 938 316 3672 131 134 114 159 294 141
v/c Ratio 0.68 0.94 0.08 0.51 0.33 0.05 0.36 2.04 0.01 0.09 0.36
Green Ratio 0.13 0.59 0.59 0.10 0.56 0.07 0.07 0.07 0.09 0.09 0.09
Uniform Delay d1 45.6 20.9 9.9 47.3 13.0 47.5 48.6 51.0 45.5 45.8 47.0
Delay Factor k 0.25 0.50 0.50 0.12 0.50 0.50 0.50 0.50 0.50 0.50 0.50
Incremental Delay d2 1.9 3.7 0.1 1.3 0.2 0.8 7.3 498.8 0.1 0.6 7.1 PF Factor 1.000 0.121 0.121 1.000 0.148 1.000 1.000 1.000 1.000 1.000 1.000 Control Delay 47.5 6.2 1.3 48.6 2.2 48.2 55.9 549.8 45.6 46.4 54.1
Lane Group LOS D A A D A D E F D D D
Approach Delay 10.1 7.6 455.3 51.5
Approach LOS B A F D
Intersection Delay 36.1 Intersection LOS DCopyright © 2005 University of Florida, All Rights Reserved HCS+TM Version 5.21 Generated: 7/6/2010 1:40 PM
Page 1 of 1Short Report
7/6/2010file://C:\Documents and Settings\JMasinick\Local Settings\Temp\s2k150C.tmp
D-108

SHORT REPORT General Information Site Information
Analyst ZH Agency or Co. Baker Date Performed 03/01/2010 Time Period PM Peak Hour
Intersection #5 Germanna Hy & Central Park
Area Type All other areas Jurisdiction Analysis Year 2035 Build Conditions
Volume and Timing InputEB WB NB SB
LT TH RT LT TH RT LT TH RT LT TH RT Number of Lanes 2 3 1 2 4 0 1 1 1 1 2 1 Lane Group L T R L TR L LT R L LT R Volume (vph) 250 1330 140 680 1520 80 110 140 550 130 250 230 % Heavy Vehicles 0 3 1 0 2 0 0 0 0 1 0 0 PHF 0.91 0.89 0.86 0.95 0.94 0.83 0.87 0.88 0.90 0.80 0.90 0.95 Pretimed/Actuated (P/A) A P P A P P P P P P P P Startup Lost Time 2.0 2.0 2.0 2.0 2.0 2.0 2.0 2.0 2.0 2.0 2.0 Extension of Effective Green 3.5 4.5 4.5 3.5 4.5 4.0 4.0 4.0 4.0 4.0 4.0 Arrival Type 3 1 1 4 5 3 3 3 3 3 3 Unit Extension 3.0 3.0 3.0 3.0 3.0 3.0 3.0 3.0 3.0 3.0 3.0 Ped/Bike/RTOR Volume 0 0 14 0 0 0 0 0 55 0 0 51 Lane Width 12.0 12.0 12.0 12.0 12.0 12.0 12.0 12.0 12.0 12.0 12.0 Parking/Grade/Parking N 0 N N 0 N N 0 N N 0 N Parking/Hour Bus Stops/Hour 0 0 0 0 0 0 0 0 0 0 0 Minimum Pedestrian Time 3.2 3.2 3.2 3.2 Phasing EB Only Thru & RT WB Only 04 NB Only SB Only 07 08
Timing G = 20.3 G = 20.7 G = 24.5 G = G = 29.0 G = 11.0 G = G = Y = 5.5 Y = 6.5 Y = 6.5 Y = Y = 6 Y = 6 Y = Y =
Duration of Analysis (hrs) = 0.25 Cycle Length C = 136.0 Lane Group Capacity, Control Delay, and LOS Determination
EB WB NB SB
Adjusted Flow Rate 275 1494 147 716 1713 88 197 550 113 327 188
Lane Group Capacity 562 1810 576 670 2677 411 429 368 171 343 154
v/c Ratio 0.49 0.83 0.26 1.07 0.64 0.21 0.46 1.49 0.66 0.95 1.22
Green Ratio 0.16 0.36 0.36 0.19 0.40 0.23 0.23 0.23 0.10 0.10 0.10
Uniform Delay d1 52.0 39.6 30.6 55.0 33.0 42.6 45.3 52.5 59.4 61.2 61.5
Delay Factor k 0.11 0.50 0.50 0.50 0.50 0.50 0.50 0.50 0.50 0.50 0.50
Incremental Delay d2 0.5 3.3 0.8 45.0 0.6 1.2 3.5 236.5 18.3 38.1 144.0 PF Factor 1.000 1.375 1.375 1.000 0.558 1.000 1.000 1.000 1.000 1.000 1.000 Control Delay 52.5 57.7 42.9 100.0 19.0 43.8 48.8 289.0 77.7 99.3 205.5
Lane Group LOS D E D F B D D F E F F
Approach Delay 55.9 42.9 206.5 127.2
Approach LOS E D F F
Intersection Delay 79.8 Intersection LOS ECopyright © 2005 University of Florida, All Rights Reserved HCS+TM Version 5.21 Generated: 7/9/2010 9:45 AM
Page 1 of 1Short Report
7/9/2010file://C:\Documents and Settings\JMasinick\Local Settings\Temp\s2k2222.tmp
D-109

SHORT REPORT General Information Site Information
Analyst ZH Agency or Co. Baker Date Performed 03/01/2010 Time Period AM Peak Hour
Intersection #6 Germanna Hy & Carl DSilver
Area Type All other areas Jurisdiction Analysis Year 2035 Build Conditions
Volume and Timing InputEB WB NB SB
LT TH RT LT TH RT LT TH RT LT TH RT Number of Lanes 2 4 1 1 4 1 0 1 1 2 1 1 Lane Group L T R L TR R LT R L LT R Volume (vph) 140 2910 20 30 1000 610 10 10 30 270 10 40 % Heavy Vehicles 0 1 5 2 4 2 0 0 10 2 0 0 PHF 0.86 0.88 0.80 0.80 0.92 0.85 0.80 0.80 0.80 0.89 0.80 0.80 Pretimed/Actuated (P/A) A A A A A A P P P P P P Startup Lost Time 2.0 2.0 2.0 2.0 2.0 2.0 2.0 2.0 2.0 2.0 2.0 Extension of Effective Green 3.5 4.5 4.5 4.5 4.5 4.5 4.0 4.0 4.5 4.5 4.5 Arrival Type 2 4 2 3 3 3 3 3 3 3 3 Unit Extension 3.0 3.0 3.0 3.0 3.0 3.0 3.0 3.0 3.0 3.0 3.0 Ped/Bike/RTOR Volume 0 0 2 0 0 0 0 0 3 0 0 8 Lane Width 12.0 12.0 12.0 12.0 12.0 12.0 12.0 12.0 12.0 12.0 12.0 Parking/Grade/Parking N 0 N N 0 N N 0 N N 0 N Parking/Hour Bus Stops/Hour 0 0 0 0 0 0 0 0 0 0 0 Minimum Pedestrian Time 3.2 3.2 3.2 3.2 Phasing WB Only Thru & RT EB Only 04 SB Only NB Only 07 08
Timing G = 5.0 G = 49.8 G = 6.7 G = 0.0 G = 11.5 G = 5.0 G = 0.0 G = 0.0 Y = 6.5 Y = 6.5 Y = 6.5 Y = 0 Y = 6.5 Y = 6 Y = 0 Y = 0
Duration of Analysis (hrs) = 0.25 Cycle Length C = 110.0 Lane Group Capacity, Control Delay, and LOS Determination
EB WB NB SB
Adjusted Flow Rate 163 3307 22 37 1159 646 24 34 212 103 40
Lane Group Capacity 261 4068 916 121 3818 918 118 93 437 228 206
v/c Ratio 0.62 0.81 0.02 0.31 0.30 0.70 0.20 0.37 0.49 0.45 0.19
Green Ratio 0.07 0.60 0.60 0.07 0.58 0.58 0.06 0.06 0.13 0.13 0.13
Uniform Delay d1 49.4 17.4 9.1 48.8 11.8 16.4 48.9 49.4 44.6 44.4 43.0
Delay Factor k 0.21 0.35 0.11 0.11 0.11 0.27 0.50 0.50 0.50 0.50 0.50
Incremental Delay d2 2.3 0.7 0.0 1.4 0.0 2.5 3.9 10.7 3.8 6.3 2.1 PF Factor 1.000 0.586 1.386 1.000 1.000 1.000 1.000 1.000 1.000 1.000 1.000 Control Delay 51.7 10.9 12.7 50.2 11.8 18.9 52.7 60.1 48.5 50.8 45.0
Lane Group LOS D B B D B B D E D D D
Approach Delay 12.8 15.1 57.1 48.8
Approach LOS B B E D
Intersection Delay 16.2 Intersection LOS BCopyright © 2005 University of Florida, All Rights Reserved HCS+TM Version 5.21 Generated: 7/6/2010 1:41 PM
Page 1 of 1Short Report
7/6/2010file://C:\Documents and Settings\JMasinick\Local Settings\Temp\s2k1532.tmp
D-110

SHORT REPORT General Information Site Information
Analyst ZH Agency or Co. Baker Date Performed 03/01/2010 Time Period PM Peak Hour
Intersection #6 Germanna Hy & Carl D Silver
Area Type All other areas Jurisdiction Analysis Year 2035 Build Conditions
Volume and Timing InputEB WB NB SB
LT TH RT LT TH RT LT TH RT LT TH RT Number of Lanes 2 4 1 1 4 1 0 1 1 2 1 1 Lane Group L T R L TR R LT R L LT R Volume (vph) 220 1760 20 50 2230 1220 30 10 40 1060 20 200 % Heavy Vehicles 0 2 0 5 1 0 0 4 2 0 0 0 PHF 0.80 0.96 0.80 0.80 0.96 0.94 0.80 0.80 0.80 0.85 0.80 0.84 Pretimed/Actuated (P/A) A P P A P P P P P P P P Startup Lost Time 2.0 2.0 2.0 2.0 2.0 2.0 2.0 2.0 2.0 2.0 2.0 Extension of Effective Green 3.5 4.5 4.5 4.5 4.5 4.5 4.0 4.0 4.5 4.5 4.5 Arrival Type 2 5 5 3 3 3 3 3 3 3 3 Unit Extension 3.0 3.0 3.0 3.0 3.0 3.0 3.0 3.0 3.0 3.0 3.0 Ped/Bike/RTOR Volume 0 0 2 0 0 60 0 0 4 0 0 20 Lane Width 12.0 12.0 12.0 12.0 12.0 12.0 12.0 12.0 12.0 12.0 12.0 Parking/Grade/Parking N 0 N N 0 N N 0 N N 0 N Parking/Hour Bus Stops/Hour 0 0 0 0 0 0 0 0 0 0 0 Minimum Pedestrian Time 3.2 3.2 3.2 3.2 Phasing WB Only Thru & RT EB Only 04 NB Only SB Only 07 08
Timing G = 7.1 G = 52.6 G = 9.0 G = G = 5.0 G = 31.3 G = G = Y = 6.5 Y = 6.5 Y = 5.5 Y = Y = 6 Y = 6.5 Y = Y =
Duration of Analysis (hrs) = 0.25 Cycle Length C = 136.0 Lane Group Capacity, Control Delay, and LOS Determination
EB WB NB SB
Adjusted Flow Rate 275 1833 22 62 2446 1111 49 45 873 399 214
Lane Group Capacity 271 3512 838 121 3427 816 93 81 871 451 401
v/c Ratio 1.01 0.52 0.03 0.51 0.71 1.36 0.53 0.56 1.00 0.88 0.53
Green Ratio 0.08 0.52 0.52 0.07 0.51 0.51 0.05 0.05 0.25 0.25 0.25
Uniform Delay d1 62.8 21.6 15.9 60.9 26.0 33.7 62.9 63.0 51.1 49.2 44.3
Delay Factor k 0.50 0.50 0.50 0.12 0.50 0.50 0.50 0.50 0.50 0.50 0.50
Incremental Delay d2 49.2 0.4 0.0 3.7 1.3 170.6 19.7 24.7 31.1 21.6 5.0 PF Factor 1.000 0.280 0.280 1.000 1.000 1.000 1.000 1.000 1.000 1.000 1.000 Control Delay 111.9 6.4 4.5 64.6 27.3 204.3 82.6 87.7 82.2 70.8 49.3
Lane Group LOS F A A E C F F F F E D
Approach Delay 20.0 82.3 85.0 74.4
Approach LOS C F F E
Intersection Delay 62.6 Intersection LOS ECopyright © 2005 University of Florida, All Rights Reserved HCS+TM Version 5.21 Generated: 7/6/2010 1:41 PM
Page 1 of 1Short Report
7/6/2010file://C:\Documents and Settings\JMasinick\Local Settings\Temp\s2k1545.tmp
D-111

SHORT REPORT General Information Site Information
Analyst ZH Agency or Co. Baker Date Performed 03/01/2010 Time Period AM Peak Hour
Intersection #7 Plank Rd & Gateway Dr Area Type All other areas Jurisdiction Analysis Year 2035 Build Conditions
Volume and Timing InputEB WB NB SB
LT TH RT LT TH RT LT TH RT LT TH RT Number of Lanes 1 3 1 2 3 1 1 1 1 1 1 0 Lane Group L T R L T R L LT R L TR Volume (vph) 40 1970 430 140 1940 10 310 10 140 10 5 30 % Heavy Vehicles 0 3 5 5 3 8 1 0 5 7 0 0 PHF 0.80 0.92 0.89 0.80 0.94 0.80 0.97 0.80 0.80 0.80 0.80 0.80 Pretimed/Actuated (P/A) A P P A A A A A A A A A Startup Lost Time 2.0 2.0 2.0 2.0 2.0 2.0 2.0 2.0 2.0 2.0 2.0 Extension of Effective Green 3.5 5.5 5.5 3.5 5.5 5.5 3.5 3.5 3.5 3.5 3.5 Arrival Type 3 3 3 4 6 6 3 3 3 3 3 Unit Extension 3.0 3.0 3.0 3.0 3.0 3.0 3.0 3.0 3.0 3.0 3.0 Ped/Bike/RTOR Volume 0 0 43 0 0 1 0 0 14 0 0 0 Lane Width 12.0 12.0 12.0 12.0 12.0 12.0 12.0 12.0 12.0 12.0 12.0 Parking/Grade/Parking N 0 N N 0 N N 0 N N 0 N Parking/Hour Bus Stops/Hour 0 0 0 0 0 0 0 0 0 0 0 Minimum Pedestrian Time 3.2 3.2 3.2 3.2 Phasing EB Only Thru & RT WB Only 04 NB Only SB Only 07 08
Timing G = 4.0 G = 38.5 G = 3.5 G = G = 16.5 G = 16.0 G = G = Y = 5.5 Y = 7.5 Y = 7.5 Y = Y = 5.5 Y = 5.5 Y = Y =
Duration of Analysis (hrs) = 0.25 Cycle Length C = 110.0 Lane Group Capacity, Control Delay, and LOS Determination
EB WB NB SB
Adjusted Flow Rate 50 2141 435 175 2064 11 224 108 157 12 43
Lane Group Capacity 90 2353 720 152 2421 720 292 295 252 268 263
v/c Ratio 0.56 0.91 0.60 1.15 0.85 0.02 0.77 0.37 0.62 0.04 0.16
Green Ratio 0.05 0.47 0.47 0.05 0.48 0.48 0.16 0.16 0.16 0.16 0.16
Uniform Delay d1 51.1 27.1 21.7 52.5 25.1 14.9 44.0 40.9 42.8 39.2 39.9
Delay Factor k 0.15 0.50 0.50 0.50 0.38 0.11 0.32 0.11 0.21 0.11 0.11
Incremental Delay d2 7.4 6.6 3.7 109.2 2.3 0.0 11.6 0.8 4.7 0.1 0.3 PF Factor 1.000 1.000 1.000 1.000 0.096 0.096 1.000 1.000 1.000 1.000 1.000 Control Delay 58.4 33.7 25.4 161.7 4.8 1.4 55.6 41.7 47.6 39.2 40.2
Lane Group LOS E C C F A A E D D D D
Approach Delay 32.8 16.9 50.0 40.0
Approach LOS C B D D
Intersection Delay 27.9 Intersection LOS CCopyright © 2005 University of Florida, All Rights Reserved HCS+TM Version 5.21 Generated: 7/6/2010 1:43 PM
Page 1 of 1Short Report
7/6/2010file://C:\Documents and Settings\JMasinick\Local Settings\Temp\s2k1558.tmp
D-112

SHORT REPORT General Information Site Information
Analyst ZH Agency or Co. Baker Date Performed 03/01/2010 Time Period PM Peak Hour
Intersection #7 Plank Rd & Gateway Dr Area Type All other areas Jurisdiction Analysis Year 2035 Build Conditions
Volume and Timing InputEB WB NB SB
LT TH RT LT TH RT LT TH RT LT TH RT Number of Lanes 1 3 1 2 3 1 1 1 1 1 1 0 Lane Group L T R L T R L LT R L TR Volume (vph) 40 2200 600 290 2080 0 400 5 280 10 5 5 % Heavy Vehicles 0 0 0 0 0 0 0 0 0 0 0 0 PHF 0.80 0.97 0.89 0.80 0.89 0.80 0.83 0.80 0.80 0.80 0.80 0.80 Pretimed/Actuated (P/A) A P P A A A A A A A A A Startup Lost Time 2.0 2.0 2.0 2.0 2.0 2.0 2.0 2.0 2.0 2.0 2.0 Extension of Effective Green 3.5 5.5 5.5 3.5 5.5 5.5 3.5 3.5 3.5 3.5 3.5 Arrival Type 3 3 3 4 5 3 3 3 3 3 3 Unit Extension 3.0 3.0 3.0 3.0 3.0 3.0 3.0 3.0 3.0 3.0 3.0 Ped/Bike/RTOR Volume 0 0 60 0 0 0 0 0 28 0 0 0 Lane Width 12.0 12.0 12.0 12.0 12.0 12.0 12.0 12.0 12.0 12.0 12.0 Parking/Grade/Parking N 0 N N 0 N N 0 N N 0 N Parking/Hour Bus Stops/Hour 1 3 1 1 1 4 2 0 1 0 0 Minimum Pedestrian Time 3.2 3.2 3.2 3.2 Phasing EB Only Thru & RT WB Only 04 NB Only SB Only 07 08
Timing G = 4.7 G = 53.8 G = 10.5 G = G = 19.5 G = 16.0 G = G = Y = 5.5 Y = 7.5 Y = 7.5 Y = Y = 5.5 Y = 5.5 Y = Y =
Duration of Analysis (hrs) = 0.25 Cycle Length C = 136.0 Lane Group Capacity, Control Delay, and LOS Determination
EB WB NB SB
Adjusted Flow Rate 50 2268 607 362 2337 0 337 151 315 12 12
Lane Group Capacity 82 2559 799 309 2862 880 277 280 248 232 226
v/c Ratio 0.61 0.89 0.76 1.17 0.82 0.00 1.22 0.54 1.27 0.05 0.05
Green Ratio 0.05 0.50 0.50 0.09 0.55 0.55 0.15 0.15 0.15 0.13 0.13
Uniform Delay d1 63.7 30.8 27.7 62.0 24.7 13.5 57.5 53.0 57.5 52.0 52.0
Delay Factor k 0.20 0.50 0.50 0.50 0.36 0.11 0.50 0.14 0.50 0.11 0.11
Incremental Delay d2 12.5 5.0 6.7 102.2 1.6 0.0 125.8 2.1 149.3 0.1 0.1
PF Factor 1.000 1.000 1.000 1.000 0.173 1.000 1.000 1.000 1.000 1.000 1.000 Control Delay 76.2 35.8 34.4 164.2 5.9 13.5 183.3 55.1 206.8 52.1 52.1
Lane Group LOS E D C F A B F E F D D
Approach Delay 36.2 27.1 168.4 52.1
Approach LOS D C F D
Intersection Delay 48.9 Intersection LOS DCopyright © 2005 University of Florida, All Rights Reserved HCS+TM Version 5.21 Generated: 7/6/2010 1:44 PM
Page 1 of 1Short Report
7/6/2010file://C:\Documents and Settings\JMasinick\Local Settings\Temp\s2k156B.tmp
D-113

SHORT REPORT General Information Site Information
Analyst ZH Agency or Co. Baker Date Performed 03/01/2010 Time Period AM Peak Hour
Intersection #8 Plank Rd & Mahone St Area Type All other areas Jurisdiction Analysis Year 2035 Build Conditions
Volume and Timing InputEB WB NB SB
LT TH RT LT TH RT LT TH RT LT TH RT Number of Lanes 1 3 1 1 2 1 1 1 1 0 1 0 Lane Group L T R L T R L LT R LTR Volume (vph) 40 2250 20 40 1700 20 50 10 40 70 5 20 % Heavy Vehicles 2 6 4 4 6 0 1 0 0 0 0 0 PHF 0.80 0.84 0.80 0.80 0.98 0.80 0.86 0.80 0.80 0.80 0.80 0.80 Pretimed/Actuated (P/A) A P P A A A A A A A A A Startup Lost Time 2.0 2.0 2.0 2.0 2.0 2.0 2.0 2.0 2.0 2.0 Extension of Effective Green 3.5 5.5 5.5 3.5 5.5 5.5 3.5 3.5 3.5 3.5 Arrival Type 5 6 6 3 3 3 3 3 3 3 Unit Extension 3.0 3.0 3.0 3.0 3.0 3.0 3.0 3.0 3.0 3.0 Ped/Bike/RTOR Volume 0 0 2 0 0 2 0 0 4 0 0 0 Lane Width 12.0 12.0 12.0 12.0 12.0 12.0 12.0 12.0 12.0 12.0 Parking/Grade/Parking N 0 N N 0 N N 0 N N 0 N Parking/Hour Bus Stops/Hour 0 0 0 0 0 0 0 0 0 0 Minimum Pedestrian Time 3.2 3.2 3.2 3.2 Phasing EW Perm Excl. Left 03 04 NB Only SB Only 07 08
Timing G = 58.0 G = 4.0 G = G = G = 12.0 G = 12.0 G = G = Y = 7.5 Y = 5.5 Y = Y = Y = 5.5 Y = 5.5 Y = Y =
Duration of Analysis (hrs) = 0.25 Cycle Length C = 110.0 Lane Group Capacity, Control Delay, and LOS Determination
EB WB NB SB
Adjusted Flow Rate 50 2679 22 50 1735 22 41 29 45 118
Lane Group Capacity 309 2730 868 304 1908 903 219 225 198 218
v/c Ratio 0.16 0.98 0.03 0.16 0.91 0.02 0.19 0.13 0.23 0.54
Green Ratio 0.70 0.56 0.56 0.70 0.56 0.56 0.12 0.12 0.12 0.12
Uniform Delay d1 31.9 23.7 10.8 8.8 21.7 10.8 43.3 43.0 43.5 45.3
Delay Factor k 0.11 0.50 0.50 0.11 0.43 0.11 0.11 0.11 0.11 0.14
Incremental Delay d2 0.2 12.1 0.0 0.3 6.9 0.0 0.4 0.3 0.6 2.7 PF Factor 0.942 0.113 0.113 1.000 1.000 1.000 1.000 1.000 1.000 1.000 Control Delay 30.3 14.8 1.3 9.1 28.7 10.9 43.7 43.3 44.1 48.1
Lane Group LOS C B A A C B D D D D
Approach Delay 14.9 27.9 43.8 48.1
Approach LOS B C D D
Intersection Delay 21.4 Intersection LOS CCopyright © 2005 University of Florida, All Rights Reserved HCS+TM Version 5.21 Generated: 7/9/2010 9:48 AM
Page 1 of 1Short Report
7/9/2010file://C:\Documents and Settings\JMasinick\Local Settings\Temp\s2k2235.tmp
D-114

SHORT REPORT General Information Site Information
Analyst ZH Agency or Co. Baker Date Performed 10/29/2009 Time Period PM Peak Hour
Intersection #8 Plank Rd & Mahone St Area Type All other areas Jurisdiction Analysis Year 2035 Build Conditions
Volume and Timing InputEB WB NB SB
LT TH RT LT TH RT LT TH RT LT TH RT Number of Lanes 1 3 1 1 2 1 1 1 1 0 1 0 Lane Group L T R L T R L LT R LTR Volume (vph) 80 2330 50 40 2440 30 100 10 40 50 10 20 % Heavy Vehicles 0 3 0 0 3 0 0 0 3 0 0 5 PHF 0.83 0.96 0.80 0.80 0.90 0.80 0.80 0.80 0.80 0.80 0.80 0.80 Pretimed/Actuated (P/A) A P P A A A A A A A A A Startup Lost Time 2.0 2.0 2.0 2.0 2.0 2.0 2.0 2.0 2.0 2.0 Extension of Effective Green 3.5 5.5 5.5 3.5 5.5 5.5 3.5 3.5 3.5 3.5 Arrival Type 1 6 6 3 3 3 3 3 3 3 Unit Extension 3.0 3.0 3.0 3.0 3.0 3.0 3.0 3.0 3.0 3.0 Ped/Bike/RTOR Volume 0 0 5 0 0 3 0 0 4 0 0 0 Lane Width 12.0 12.0 12.0 12.0 12.0 12.0 12.0 12.0 12.0 12.0 Parking/Grade/Parking N 0 N N 0 N N 0 N N 0 N Parking/Hour Bus Stops/Hour 0 0 0 0 0 0 0 0 0 0 Minimum Pedestrian Time 3.2 3.2 3.2 3.2 Phasing EW Perm Excl. Left 03 04 NB Only SB Only 07 08
Timing G = 83.5 G = 4.5 G = G = G = 12.0 G = 12.0 G = G = Y = 7.5 Y = 5.5 Y = Y = Y = 5.5 Y = 5.5 Y = Y =
Duration of Analysis (hrs) = 0.25 Cycle Length C = 136.0 Lane Group Capacity, Control Delay, and LOS Determination
EB WB NB SB
Adjusted Flow Rate 96 2427 56 50 2711 34 88 49 45 99
Lane Group Capacity 262 3215 1033 278 2247 1033 179 182 156 174
v/c Ratio 0.37 0.75 0.05 0.18 1.21 0.03 0.49 0.27 0.29 0.57
Green Ratio 0.75 0.64 0.64 0.75 0.64 0.64 0.10 0.10 0.10 0.10
Uniform Delay d1 52.6 17.1 9.1 7.5 24.5 9.0 58.0 56.7 56.8 58.5
Delay Factor k 0.11 0.50 0.50 0.11 0.50 0.11 0.11 0.11 0.11 0.16
Incremental Delay d2 0.8 1.5 0.1 0.3 97.4 0.0 2.1 0.8 1.0 4.4 PF Factor 1.086 0.139 0.139 1.000 1.000 1.000 1.000 1.000 1.000 1.000 Control Delay 57.9 3.9 1.4 7.8 121.9 9.0 60.1 57.5 57.8 62.8
Lane Group LOS E A A A F A E E E E
Approach Delay 5.8 118.5 58.8 62.8
Approach LOS A F E E
Intersection Delay 64.2 Intersection LOS ECopyright © 2005 University of Florida, All Rights Reserved HCS+TM Version 5.21 Generated: 7/9/2010 9:49 AM
Page 1 of 1Short Report
7/9/2010file://C:\Documents and Settings\JMasinick\Local Settings\Temp\s2k2249.tmp
D-115

SHORT REPORT General Information Site Information
Analyst ZH Agency or Co. Baker Date Performed 03/01/2010 Time Period AM Peak Hour
Intersection #9 Warrenton Rd & Falls Run Dr
Area Type All other areas Jurisdiction Analysis Year 2035 Build Conditions
Volume and Timing InputEB WB NB SB
LT TH RT LT TH RT LT TH RT LT TH RT Number of Lanes 0 1 2 1 1 1 2 3 1 1 3 1 Lane Group LT R L LT R L T R L T R Volume (vph) 0 0 90 100 10 60 170 3260 360 80 2840 80 % Heavy Vehicles 4 4 4 4 4 4 4 4 4 4 4 4 PHF 0.80 0.80 0.80 0.80 0.80 0.80 0.80 0.91 0.80 0.80 0.96 0.80 Pretimed/Actuated (P/A) A A A A A A A P P A P P Startup Lost Time 2.0 2.0 2.0 2.0 2.0 2.0 2.0 2.0 2.0 2.0 2.0 Extension of Effective Green 4.0 4.0 4.5 4.5 4.5 3.5 4.5 4.5 3.5 4.5 4.5 Arrival Type 3 3 3 3 3 3 3 3 3 3 3 Unit Extension 3.0 3.0 3.0 3.0 3.0 3.0 5.0 5.0 3.0 5.0 5.0 Ped/Bike/RTOR Volume 0 0 9 0 0 6 0 0 36 0 0 8 Lane Width 12.0 12.0 12.0 12.0 12.0 12.0 12.0 12.0 12.0 12.0 12.0 Parking/Grade/Parking N 0 N N 0 N N 0 N N 0 N Parking/Hour Bus Stops/Hour 0 0 0 0 0 0 0 0 0 0 0 Minimum Pedestrian Time 3.2 3.2 3.2 3.2 Phasing WB Only EB Only 03 04 Excl. Left NB Only Thru & RT 08
Timing G = 16.0 G = 16.0 G = G = G = 6.4 G = 1.5 G = 95.6 G = Y = 6.5 Y = 6 Y = Y = Y = 5.5 Y = Y = 6.5 Y =
Duration of Analysis (hrs) = 0.25 Cycle Length C = 160.0 Lane Group Capacity, Control Delay, and LOS Determination
EB WB NB SB
Adjusted Flow Rate 0 101 88 49 67 212 3582 405 100 2958 90
Lane Group Capacity 206 309 201 204 180 314 3098 1185 86 3052 1132
v/c Ratio 0.00 0.33 0.44 0.24 0.37 0.68 1.16 0.34 1.16 0.97 0.08
Green Ratio 0.11 0.11 0.12 0.12 0.12 0.09 0.62 0.76 0.05 0.61 0.73
Uniform Delay d1 63.0 65.4 65.9 64.4 65.4 70.2 30.2 6.1 76.1 29.5 6.2
Delay Factor k 0.11 0.11 0.11 0.11 0.11 0.25 0.50 0.23 0.50 0.50 0.23
Incremental Delay d2 0.0 0.6 1.5 0.6 1.3 5.7 74.4 0.4 147.5 10.5 0.1 PF Factor 1.000 1.000 1.000 1.000 1.000 1.000 1.000 1.000 1.000 1.000 1.000
Control Delay 63.0 66.0 67.4 65.0 66.7 75.9 104.6 6.4 223.6 40.1 6.3
Lane Group LOS E E E E E E F A F D A
Approach Delay 66.0 66.6 93.7 44.9
Approach LOS E E F D
Intersection Delay 72.5 Intersection LOS ECopyright © 2005 University of Florida, All Rights Reserved HCS+TM Version 5.21 Generated: 7/6/2010 1:58 PM
Page 1 of 1Short Report
7/6/2010file://C:\Documents and Settings\JMasinick\Local Settings\Temp\s2k15A4.tmp
D-116

SHORT REPORT General Information Site Information
Analyst ZH Agency or Co. Baker Date Performed 03/01/2010 Time Period PM Peak Hour
Intersection #9 Warrenton Rd & Falls Run Dr
Area Type All other areas Jurisdiction Analysis Year 2035 Build Conditions
Volume and Timing InputEB WB NB SB
LT TH RT LT TH RT LT TH RT LT TH RT Number of Lanes 0 1 2 1 1 1 2 3 1 1 3 1 Lane Group LT R L LT R L T R L T R Volume (vph) 280 0 530 440 5 100 110 3160 140 60 3380 10 % Heavy Vehicles 4 4 4 4 4 4 4 4 4 4 4 4 PHF 0.80 0.80 0.80 0.92 0.80 0.80 0.80 0.89 0.80 0.80 0.95 0.80 Pretimed/Actuated (P/A) A A A A A A A P P A P P Startup Lost Time 2.0 2.0 2.0 2.0 2.0 2.0 2.0 2.0 2.0 2.0 2.0 Extension of Effective Green 4.0 4.0 4.5 4.5 4.5 3.5 4.5 4.5 3.5 4.5 4.5 Arrival Type 3 3 3 3 3 3 3 3 3 3 3 Unit Extension 3.0 3.0 3.0 3.0 3.0 3.0 5.0 5.0 3.0 5.0 5.0 Ped/Bike/RTOR Volume 0 0 53 0 0 10 0 0 14 0 0 1 Lane Width 12.0 12.0 12.0 12.0 12.0 12.0 12.0 12.0 12.0 12.0 12.0 Parking/Grade/Parking N 0 N N 0 N N 0 N N 0 N Parking/Hour Bus Stops/Hour 0 0 0 0 0 0 0 0 0 0 0 Minimum Pedestrian Time 3.2 3.2 3.2 3.2 Phasing EB Only WB Only 03 04 Excl. Left Thru & RT 07 08
Timing G = 21.0 G = 17.5 G = G = G = 5.0 G = 92.0 G = G = Y = 6 Y = 6.5 Y = Y = Y = 5.5 Y = 6.5 Y = Y =
Duration of Analysis (hrs) = 0.25 Cycle Length C = 160.0 Lane Group Capacity, Control Delay, and LOS Determination
EB WB NB SB
Adjusted Flow Rate 350 596 335 149 112 137 3551 157 75 3558 11
Lane Group Capacity 250 395 217 218 194 137 2940 1111 71 2940 1184
v/c Ratio 1.40 1.51 1.54 0.68 0.58 1.00 1.21 0.14 1.06 1.21 0.01
Green Ratio 0.14 0.14 0.13 0.13 0.13 0.04 0.59 0.72 0.04 0.59 0.76
Uniform Delay d1 68.5 68.5 70.0 67.0 66.0 76.8 32.8 7.2 76.8 32.8 4.5
Delay Factor k 0.50 0.50 0.50 0.25 0.17 0.50 0.50 0.23 0.50 0.50 0.23
Incremental Delay d2 202.4 241.8 266.3 8.5 4.2 76.9 97.0 0.1 123.2 98.0 0.0 PF Factor 1.000 1.000 1.000 1.000 1.000 1.000 1.000 1.000 1.000 1.000 1.000
Control Delay 270.9 310.3 336.3 75.5 70.2 153.6 129.7 7.3 199.9 130.7 4.6
Lane Group LOS F F F E E F F A F F A
Approach Delay 295.7 221.1 125.6 131.8
Approach LOS F F F F
Intersection Delay 152.2 Intersection LOS FCopyright © 2005 University of Florida, All Rights Reserved HCS+TM Version 5.21 Generated: 7/6/2010 1:58 PM
Page 1 of 1Short Report
7/6/2010file://C:\Documents and Settings\JMasinick\Local Settings\Temp\s2k15B7.tmp
D-117
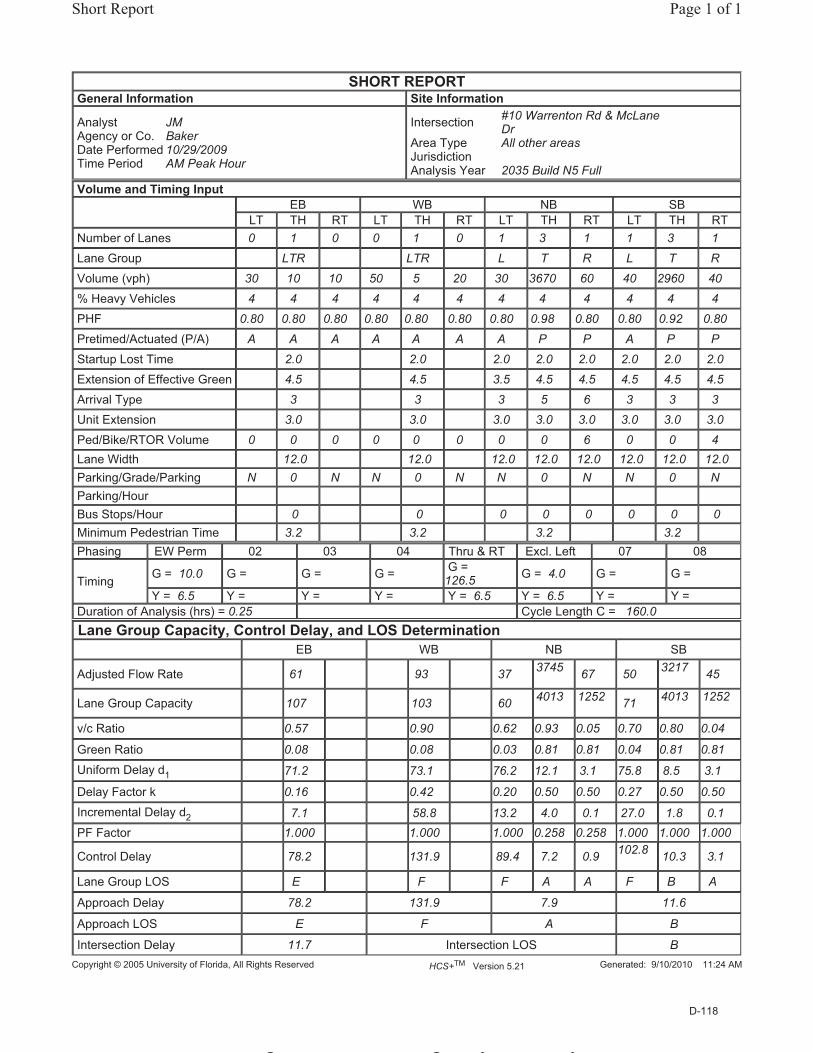
SHORT REPORT General Information Site Information
Analyst JM Agency or Co. Baker Date Performed 10/29/2009 Time Period AM Peak Hour
Intersection #10 Warrenton Rd & McLane Dr
Area Type All other areas Jurisdiction Analysis Year 2035 Build N5 Full
Volume and Timing InputEB WB NB SB
LT TH RT LT TH RT LT TH RT LT TH RT Number of Lanes 0 1 0 0 1 0 1 3 1 1 3 1 Lane Group LTR LTR L T R L T R Volume (vph) 30 10 10 50 5 20 30 3670 60 40 2960 40 % Heavy Vehicles 4 4 4 4 4 4 4 4 4 4 4 4 PHF 0.80 0.80 0.80 0.80 0.80 0.80 0.80 0.98 0.80 0.80 0.92 0.80 Pretimed/Actuated (P/A) A A A A A A A P P A P P Startup Lost Time 2.0 2.0 2.0 2.0 2.0 2.0 2.0 2.0 Extension of Effective Green 4.5 4.5 3.5 4.5 4.5 4.5 4.5 4.5 Arrival Type 3 3 3 5 6 3 3 3 Unit Extension 3.0 3.0 3.0 3.0 3.0 3.0 3.0 3.0 Ped/Bike/RTOR Volume 0 0 0 0 0 0 0 0 6 0 0 4 Lane Width 12.0 12.0 12.0 12.0 12.0 12.0 12.0 12.0 Parking/Grade/Parking N 0 N N 0 N N 0 N N 0 N Parking/Hour Bus Stops/Hour 0 0 0 0 0 0 0 0 Minimum Pedestrian Time 3.2 3.2 3.2 3.2 Phasing EW Perm 02 03 04 Thru & RT Excl. Left 07 08
Timing G = 10.0 G = G = G = G = 126.5 G = 4.0 G = G =
Y = 6.5 Y = Y = Y = Y = 6.5 Y = 6.5 Y = Y = Duration of Analysis (hrs) = 0.25 Cycle Length C = 160.0 Lane Group Capacity, Control Delay, and LOS Determination
EB WB NB SB
Adjusted Flow Rate 61 93 37 3745 67 50 3217 45
Lane Group Capacity 107 103 60 4013 1252 71 4013 1252
v/c Ratio 0.57 0.90 0.62 0.93 0.05 0.70 0.80 0.04
Green Ratio 0.08 0.08 0.03 0.81 0.81 0.04 0.81 0.81
Uniform Delay d1 71.2 73.1 76.2 12.1 3.1 75.8 8.5 3.1
Delay Factor k 0.16 0.42 0.20 0.50 0.50 0.27 0.50 0.50
Incremental Delay d2 7.1 58.8 13.2 4.0 0.1 27.0 1.8 0.1 PF Factor 1.000 1.000 1.000 0.258 0.258 1.000 1.000 1.000
Control Delay 78.2 131.9 89.4 7.2 0.9 102.8 10.3 3.1
Lane Group LOS E F F A A F B A
Approach Delay 78.2 131.9 7.9 11.6
Approach LOS E F A B
Intersection Delay 11.7 Intersection LOS BCopyright © 2005 University of Florida, All Rights Reserved HCS+TM Version 5.21 Generated: 9/10/2010 11:24 AM
Page 1 of 1Short Report
9/10/2010file://C:\Documents and Settings\JMasinick\Local Settings\Temp\s2k1B62.tmp
D-118

SHORT REPORT General Information Site Information
Analyst JM Agency or Co. Baker Date Performed 10/29/2009 Time Period PM Peak Hour
Intersection #10 Warrenton Rd & McLane Dr
Area Type All other areas Jurisdiction Analysis Year 2035 Build N5 Full
Volume and Timing InputEB WB NB SB
LT TH RT LT TH RT LT TH RT LT TH RT Number of Lanes 0 1 0 0 1 0 1 3 1 1 3 1 Lane Group LTR LTR L T R L T R Volume (vph) 20 5 10 60 10 30 20 3700 30 20 3890 30 % Heavy Vehicles 4 4 4 4 4 4 4 4 4 4 4 4 PHF 0.80 0.80 0.80 0.80 0.80 0.80 0.80 0.95 0.80 0.80 0.86 0.80 Pretimed/Actuated (P/A) A A A A A A A P P A P P Startup Lost Time 2.0 2.0 2.0 2.0 2.0 2.0 2.0 2.0 Extension of Effective Green 4.5 4.5 3.5 4.5 4.5 4.5 4.5 4.5 Arrival Type 3 3 3 3 3 3 3 3 Unit Extension 3.0 3.0 3.0 3.0 3.0 3.0 3.0 3.0 Ped/Bike/RTOR Volume 0 0 0 0 0 0 0 0 3 0 0 3 Lane Width 12.0 12.0 12.0 12.0 12.0 12.0 12.0 12.0 Parking/Grade/Parking N 0 N N 0 N N 0 N N 0 N Parking/Hour Bus Stops/Hour 0 0 0 0 0 0 0 0 Minimum Pedestrian Time 3.2 3.2 3.2 3.2 Phasing EW Perm 02 03 04 Excl. Left Thru & RT 07 08
Timing G = 10.5 G = G = G = G = 11.5 G = 118.5 G = G = Y = 6.5 Y = Y = Y = Y = 6.5 Y = 6.5 Y = Y =
Duration of Analysis (hrs) = 0.25 Cycle Length C = 160.0 Lane Group Capacity, Control Delay, and LOS Determination
EB WB NB SB
Adjusted Flow Rate 43 124 25 3895 34 25 4523 34
Lane Group Capacity 104 114 141 3764 1174 152 3764 1174
v/c Ratio 0.41 1.09 0.18 1.03 0.03 0.16 1.20 0.03
Green Ratio 0.08 0.08 0.08 0.76 0.76 0.09 0.76 0.76
Uniform Delay d1 69.9 73.5 68.5 19.5 4.9 67.6 19.5 4.9
Delay Factor k 0.11 0.50 0.11 0.50 0.50 0.11 0.50 0.50
Incremental Delay d2 2.7 109.8 0.6 24.7 0.0 0.5 93.5 0.0 PF Factor 1.000 1.000 1.000 1.000 1.000 1.000 1.000 1.000 Control Delay 72.5 183.3 69.1 44.2 4.9 68.1 113.0 4.9
Lane Group LOS E F E D A E F A
Approach Delay 72.5 183.3 44.0 112.0
Approach LOS E F D F
Intersection Delay 81.9 Intersection LOS FCopyright © 2005 University of Florida, All Rights Reserved HCS+TM Version 5.21 Generated: 9/10/2010 11:24 AM
Page 1 of 1Short Report
9/10/2010file://C:\Documents and Settings\JMasinick\Local Settings\Temp\s2k1B76.tmp
D-119
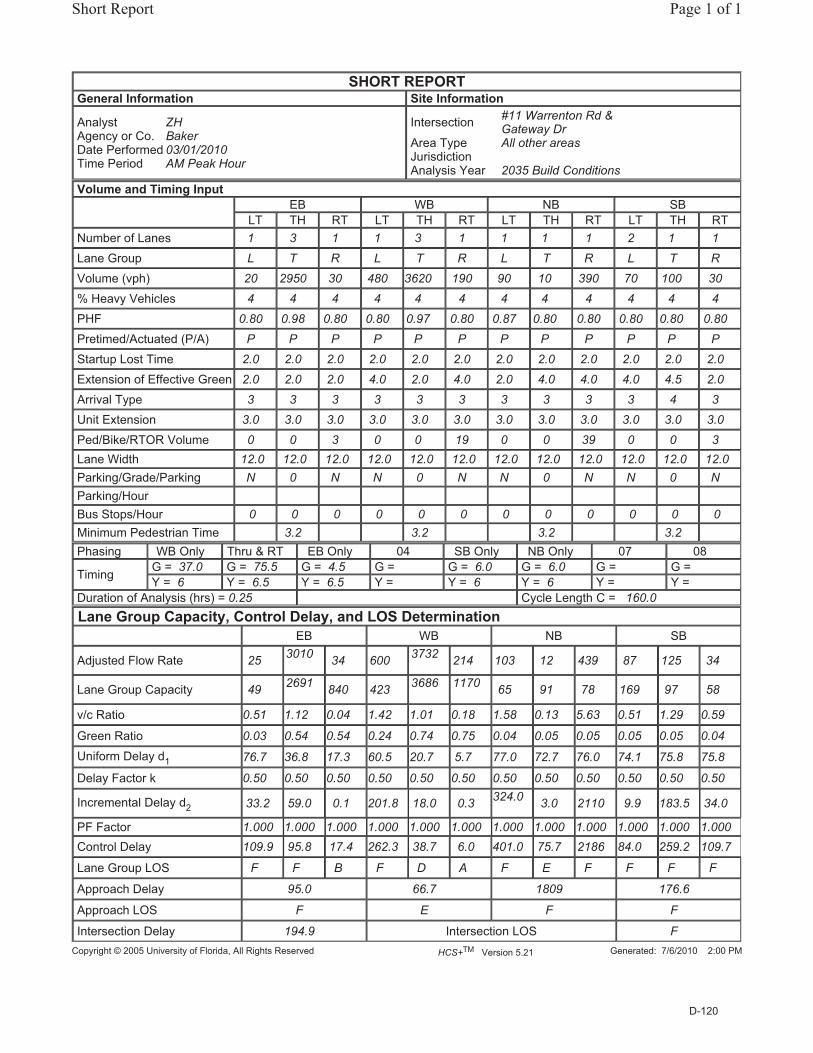
SHORT REPORT General Information Site Information
Analyst ZH Agency or Co. Baker Date Performed 03/01/2010 Time Period AM Peak Hour
Intersection #11 Warrenton Rd & Gateway Dr
Area Type All other areas Jurisdiction Analysis Year 2035 Build Conditions
Volume and Timing InputEB WB NB SB
LT TH RT LT TH RT LT TH RT LT TH RT Number of Lanes 1 3 1 1 3 1 1 1 1 2 1 1 Lane Group L T R L T R L T R L T R Volume (vph) 20 2950 30 480 3620 190 90 10 390 70 100 30 % Heavy Vehicles 4 4 4 4 4 4 4 4 4 4 4 4 PHF 0.80 0.98 0.80 0.80 0.97 0.80 0.87 0.80 0.80 0.80 0.80 0.80 Pretimed/Actuated (P/A) P P P P P P P P P P P P Startup Lost Time 2.0 2.0 2.0 2.0 2.0 2.0 2.0 2.0 2.0 2.0 2.0 2.0 Extension of Effective Green 2.0 2.0 2.0 4.0 2.0 4.0 2.0 4.0 4.0 4.0 4.5 2.0 Arrival Type 3 3 3 3 3 3 3 3 3 3 4 3 Unit Extension 3.0 3.0 3.0 3.0 3.0 3.0 3.0 3.0 3.0 3.0 3.0 3.0 Ped/Bike/RTOR Volume 0 0 3 0 0 19 0 0 39 0 0 3 Lane Width 12.0 12.0 12.0 12.0 12.0 12.0 12.0 12.0 12.0 12.0 12.0 12.0 Parking/Grade/Parking N 0 N N 0 N N 0 N N 0 N Parking/Hour Bus Stops/Hour 0 0 0 0 0 0 0 0 0 0 0 0 Minimum Pedestrian Time 3.2 3.2 3.2 3.2 Phasing WB Only Thru & RT EB Only 04 SB Only NB Only 07 08
Timing G = 37.0 G = 75.5 G = 4.5 G = G = 6.0 G = 6.0 G = G = Y = 6 Y = 6.5 Y = 6.5 Y = Y = 6 Y = 6 Y = Y =
Duration of Analysis (hrs) = 0.25 Cycle Length C = 160.0 Lane Group Capacity, Control Delay, and LOS Determination
EB WB NB SB
Adjusted Flow Rate 25 3010 34 600 3732 214 103 12 439 87 125 34
Lane Group Capacity 49 2691 840 423 3686 1170 65 91 78 169 97 58
v/c Ratio 0.51 1.12 0.04 1.42 1.01 0.18 1.58 0.13 5.63 0.51 1.29 0.59
Green Ratio 0.03 0.54 0.54 0.24 0.74 0.75 0.04 0.05 0.05 0.05 0.05 0.04
Uniform Delay d1 76.7 36.8 17.3 60.5 20.7 5.7 77.0 72.7 76.0 74.1 75.8 75.8
Delay Factor k 0.50 0.50 0.50 0.50 0.50 0.50 0.50 0.50 0.50 0.50 0.50 0.50
Incremental Delay d2 33.2 59.0 0.1 201.8 18.0 0.3 324.0 3.0 2110 9.9 183.5 34.0
PF Factor 1.000 1.000 1.000 1.000 1.000 1.000 1.000 1.000 1.000 1.000 1.000 1.000 Control Delay 109.9 95.8 17.4 262.3 38.7 6.0 401.0 75.7 2186 84.0 259.2 109.7
Lane Group LOS F F B F D A F E F F F F
Approach Delay 95.0 66.7 1809 176.6
Approach LOS F E F F
Intersection Delay 194.9 Intersection LOS FCopyright © 2005 University of Florida, All Rights Reserved HCS+TM Version 5.21 Generated: 7/6/2010 2:00 PM
Page 1 of 1Short Report
7/6/2010file://C:\Documents and Settings\JMasinick\Local Settings\Temp\s2k15F0.tmp
D-120

SHORT REPORT General Information Site Information
Analyst ZH Agency or Co. Baker Date Performed 03/01/2010 Time Period PM Peak Hour
Intersection #11 Warrenton Rd & Gateway Dr
Area Type All other areas Jurisdiction Analysis Year 2035 Build Conditions
Volume and Timing InputEB WB NB SB
LT TH RT LT TH RT LT TH RT LT TH RT Number of Lanes 1 3 1 1 3 1 1 1 1 2 1 1 Lane Group L T R L T R L T R L T R Volume (vph) 10 3660 70 530 2960 140 50 10 1350 110 30 10 % Heavy Vehicles 4 4 4 4 4 4 4 4 4 4 4 4 PHF 0.80 0.93 0.80 0.80 0.98 0.80 0.80 0.80 0.80 0.80 0.80 0.80 Pretimed/Actuated (P/A) P P P P P P P P P P P P Startup Lost Time 2.0 2.0 2.0 2.0 2.0 2.0 2.0 2.0 2.0 2.0 2.0 2.0 Extension of Effective Green 2.0 2.0 2.0 4.0 2.0 4.0 2.0 4.0 4.0 4.0 4.5 2.0 Arrival Type 3 3 3 3 3 3 3 3 3 3 4 3 Unit Extension 3.0 3.0 3.0 3.0 3.0 3.0 3.0 3.0 3.0 3.0 3.0 3.0 Ped/Bike/RTOR Volume 0 0 7 0 0 14 0 0 135 0 0 1 Lane Width 12.0 12.0 12.0 12.0 12.0 12.0 12.0 12.0 12.0 12.0 12.0 12.0 Parking/Grade/Parking N 0 N N 0 N N 0 N N 0 N Parking/Hour Bus Stops/Hour 0 0 0 0 0 0 0 0 0 0 0 0 Minimum Pedestrian Time 3.2 3.2 3.2 3.2 Phasing WB Only Thru & RT EB Only 04 SB Only NB Only 07 08
Timing G = 24.0 G = 50.5 G = 4.5 G = G = 6.0 G = 44.0 G = G = Y = 6 Y = 6.5 Y = 6.5 Y = Y = 6 Y = 6 Y = Y =
Duration of Analysis (hrs) = 0.25 Cycle Length C = 160.0 Lane Group Capacity, Control Delay, and LOS Determination
EB WB NB SB
Adjusted Flow Rate 12 3935 79 662 3020 157 62 12 1519 137 37 11
Lane Group Capacity 49 1913 597 282 2504 801 477 525 446 169 97 58
v/c Ratio 0.24 2.06 0.13 2.35 1.21 0.20 0.13 0.02 3.41 0.81 0.38 0.19
Green Ratio 0.03 0.38 0.38 0.16 0.50 0.52 0.28 0.29 0.29 0.05 0.05 0.04
Uniform Delay d1 76.1 49.3 31.9 67.0 39.8 20.9 43.6 40.9 57.0 75.3 73.2 74.6
Delay Factor k 0.50 0.50 0.50 0.50 0.50 0.50 0.50 0.50 0.50 0.50 0.50 0.50
Incremental Delay d2 11.5 477.5 0.5 617.3 96.8 0.5 0.6 0.1 1088 28.9 9.4 6.1 PF Factor 1.000 1.000 1.000 1.000 1.000 1.000 1.000 1.000 1.000 1.000 1.000 1.000
Control Delay 87.6 526.7 32.4 684.3 136.5 21.4 44.2 41.0 1145 104.2 82.6 80.7
Lane Group LOS F F C F F C D D F F F F
Approach Delay 515.7 226.3 1094 98.5
Approach LOS F F F F
Intersection Delay 488.0 Intersection LOS FCopyright © 2005 University of Florida, All Rights Reserved HCS+TM Version 5.21 Generated: 7/6/2010 2:00 PM
Page 1 of 1Short Report
7/6/2010file://C:\Documents and Settings\JMasinick\Local Settings\Temp\s2k1603.tmp
D-121

SHORT REPORT General Information Site Information
Analyst ZH Agency or Co. Baker Date Performed 03/01/2010 Time Period AM Peak Hour
Intersection #12 Warrenton Rd & Short St
Area Type All other areas Jurisdiction Analysis Year 2035 Build Conditions
Volume and Timing InputEB WB NB SB
LT TH RT LT TH RT LT TH RT LT TH RT Number of Lanes 0 2 1 1 2 0 0 1 1 0 1 0 Lane Group LT R L TR LT R LTR Volume (vph) 10 1470 70 20 1530 50 130 0 20 5 0 20 % Heavy Vehicles 18 3 2 0 2 0 3 0 3 0 0 19 PHF 0.80 0.85 0.80 0.80 0.93 0.80 0.88 0.80 0.80 0.80 0.80 0.80 Pretimed/Actuated (P/A) P P P A P P P P P P P P Startup Lost Time 2.0 2.0 2.0 2.0 2.0 2.0 2.0 Extension of Effective Green 4.5 4.5 3.5 4.5 4.0 4.0 4.0 Arrival Type 3 3 3 3 3 3 3 Unit Extension 5.0 5.0 3.0 5.0 3.0 3.0 3.0 Ped/Bike/RTOR Volume 0 0 7 0 0 0 0 0 2 0 0 0 Lane Width 12.0 12.0 12.0 12.0 12.0 12.0 12.0 Parking/Grade/Parking N 0 N N 0 N N 0 N N 0 N Parking/Hour Bus Stops/Hour 0 0 0 0 0 0 0 Minimum Pedestrian Time 3.2 3.2 3.2 3.2 Phasing WB Only EW Perm 03 04 NB Only SB Only 07 08
Timing G = 5.0 G = 56.0 G = G = G = 10.0 G = 5.0 G = G = Y = 5.5 Y = 6.5 Y = Y = Y = 6 Y = 6 Y = Y =
Duration of Analysis (hrs) = 0.25 Cycle Length C = 100.0 Lane Group Capacity, Control Delay, and LOS Determination
EB WB NB SB
Adjusted Flow Rate 1741 79 25 1707 148 22 31
Lane Group Capacity 1915 926 193 2436 211 188 102
v/c Ratio 0.91 0.09 0.13 0.70 0.70 0.12 0.30
Green Ratio 0.58 0.58 0.69 0.69 0.12 0.12 0.07
Uniform Delay d1 18.4 9.1 14.7 9.3 42.3 39.3 44.2
Delay Factor k 0.50 0.50 0.11 0.50 0.50 0.50 0.50
Incremental Delay d2 7.9 0.2 0.3 1.7 17.7 1.3 7.5 PF Factor 1.000 1.000 1.000 1.000 1.000 1.000 1.000 Control Delay 26.3 9.2 15.0 11.0 60.0 40.5 51.7
Lane Group LOS C A B B E D D
Approach Delay 25.5 11.1 57.5 51.7
Approach LOS C B E D
Intersection Delay 20.5 Intersection LOS CCopyright © 2005 University of Florida, All Rights Reserved HCS+TM Version 5.21 Generated: 7/6/2010 2:00 PM
Page 1 of 1Short Report
7/6/2010file://C:\Documents and Settings\JMasinick\Local Settings\Temp\s2k1617.tmp
D-122

SHORT REPORT General Information Site Information
Analyst ZH Agency or Co. Baker Date Performed 03/01/2010 Time Period PM Peak Hour
Intersection #12 Warrenton Rd & Short St
Area Type All other areas Jurisdiction Analysis Year 2035 Build Conditions
Volume and Timing InputEB WB NB SB
LT TH RT LT TH RT LT TH RT LT TH RT Number of Lanes 0 2 1 1 2 0 0 1 1 0 1 0 Lane Group LT R L TR LT R LTR Volume (vph) 10 2520 120 20 1380 5 110 5 40 5 5 10 % Heavy Vehicles 0 2 3 3 2 0 2 0 0 0 0 0 PHF 0.80 0.93 0.80 0.80 0.89 0.80 0.80 0.80 0.80 0.80 0.80 0.80 Pretimed/Actuated (P/A) P P P A P P P P P P P P Startup Lost Time 2.0 2.0 2.0 2.0 2.0 2.0 2.0 Extension of Effective Green 4.5 4.5 3.5 4.5 4.0 4.0 4.0 Arrival Type 3 3 3 3 3 3 3 Unit Extension 5.0 5.0 3.0 5.0 3.0 3.0 3.0 Ped/Bike/RTOR Volume 0 0 12 0 0 0 0 0 4 0 0 0 Lane Width 12.0 12.0 12.0 12.0 12.0 12.0 12.0 Parking/Grade/Parking N 0 N N 0 N N 0 N N 0 N Parking/Hour Bus Stops/Hour 0 0 0 0 0 0 0 Minimum Pedestrian Time 3.2 3.2 3.2 3.2 Phasing WB Only EW Perm 03 04 NB Only SB Only 07 08
Timing G = 5.0 G = 71.0 G = G = G = 5.0 G = 5.0 G = G = Y = 5.5 Y = 6.5 Y = Y = Y = 6 Y = 6 Y = Y =
Duration of Analysis (hrs) = 0.25 Cycle Length C = 110.0 Lane Group Capacity, Control Delay, and LOS Determination
EB WB NB SB
Adjusted Flow Rate 2722 135 25 1557 143 45 24
Lane Group Capacity 2234 1048 171 2707 113 103 111
v/c Ratio 1.22 0.13 0.15 0.58 1.27 0.44 0.22
Green Ratio 0.67 0.67 0.76 0.76 0.06 0.06 0.06
Uniform Delay d1 18.2 6.6 28.0 5.5 51.5 49.6 48.9
Delay Factor k 0.50 0.50 0.11 0.50 0.50 0.50 0.50
Incremental Delay d2 102.6 0.3 0.4 0.9 172.2 12.9 4.4 PF Factor 1.000 1.000 1.000 1.000 1.000 1.000 1.000 Control Delay 120.9 6.9 28.4 6.4 223.7 62.5 53.3
Lane Group LOS F A C A F E D
Approach Delay 115.5 6.7 185.1 53.3
Approach LOS F A F D
Intersection Delay 81.0 Intersection LOS FCopyright © 2005 University of Florida, All Rights Reserved HCS+TM Version 5.21 Generated: 7/6/2010 2:01 PM
Page 1 of 1Short Report
7/6/2010file://C:\Documents and Settings\JMasinick\Local Settings\Temp\s2k162A.tmp
D-123

SHORT REPORT General Information Site Information
Analyst ZH Agency or Co. Baker Date Performed 03/01/2010 Time Period AM Peak Hour
Intersection #13 Warrenton Rd & I-95 Ramp
Area Type All other areas Jurisdiction Analysis Year 2035 Build Conditions
Volume and Timing InputEB WB NB SB
LT TH RT LT TH RT LT TH RT LT TH RT Number of Lanes 2 3 3 1 Lane Group L T TR R Volume (vph) 210 1700 1980 1430 % Heavy Vehicles 4 4 4 4 PHF 0.90 0.97 0.98 0.98 Pretimed/Actuated (P/A) A A A A Startup Lost Time 2.0 2.0 2.0 2.0 Extension of Effective Green 2.0 4.0 4.5 2.0 Arrival Type 3 3 4 3 Unit Extension 3.0 3.0 3.0 3.0 Ped/Bike/RTOR Volume 0 0 0 0 3 Lane Width 12.0 12.0 12.0 12.0 Parking/Grade/Parking N 0 N N 0 N Parking/Hour Bus Stops/Hour 0 0 0 0 Minimum Pedestrian Time 3.2 3.2 Phasing 01 02 03 04 Thru & RT NB Only 07 08
Timing G = G = G = G = G = 98.0 G = 38.0 G = G = Y = Y = Y = Y = Y = 7 Y = 7 Y = Y =
Duration of Analysis (hrs) = 0.25 Cycle Length C = 150.0 Lane Group Capacity, Control Delay, and LOS Determination
EB WB NB SB
Adjusted Flow Rate 233 1753 2602 874
Lane Group Capacity 854 4811 3222 1015
v/c Ratio 0.27 0.36 0.81 0.86
Green Ratio 0.25 0.97 0.67 0.65
Uniform Delay d1 44.9 0.1 17.8 20.6
Delay Factor k 0.11 0.11 0.35 0.39
Incremental Delay d2 0.2 0.0 1.5 7.1 PF Factor 1.000 1.500 0.372 1.000 Control Delay 45.1 0.2 8.1 27.7
Lane Group LOS D A A C
Approach Delay 5.5 13.0
Approach LOS A B
Intersection Delay 10.3 Intersection LOS BCopyright © 2005 University of Florida, All Rights Reserved HCS+TM Version 5.21 Generated: 7/9/2010 9:49 AM
Page 1 of 1Short Report
7/9/2010file://C:\Documents and Settings\JMasinick\Local Settings\Temp\s2k226C.tmp
D-124

SHORT REPORT General Information Site Information
Analyst ZH Agency or Co. Baker Date Performed 03/01/2010 Time Period PM Peak Hour
Intersection #13 Warrenton Rd & I-95 Ramp
Area Type All other areas Jurisdiction Analysis Year 2035 Build Conditions
Volume and Timing InputEB WB NB SB
LT TH RT LT TH RT LT TH RT LT TH RT Number of Lanes 2 3 3 1 Lane Group L T TR R Volume (vph) 280 1640 2380 2740 % Heavy Vehicles 4 4 4 4 PHF 0.97 0.97 0.98 0.98 Pretimed/Actuated (P/A) A A A A Startup Lost Time 2.0 2.0 2.0 2.0 Extension of Effective Green 2.0 4.0 4.5 2.0 Arrival Type 3 3 4 4 Unit Extension 3.0 3.0 3.0 3.0 Ped/Bike/RTOR Volume 0 0 0 0 3 Lane Width 12.0 12.0 12.0 12.0 Parking/Grade/Parking N 0 N N 0 N Parking/Hour Bus Stops/Hour 0 0 0 0 Minimum Pedestrian Time 3.2 3.2 Phasing 01 02 03 04 Thru & RT NB Only 07 08
Timing G = G = G = G = G = 120.0 G = 16.0 G = G =
Y = Y = Y = Y = Y = 7 Y = 7 Y = Y = Duration of Analysis (hrs) = 0.25 Cycle Length C = 150.0 Lane Group Capacity, Control Delay, and LOS Determination
EB WB NB SB
Adjusted Flow Rate 289 1691 3965 1257
Lane Group Capacity 359 4811 3828 1242
v/c Ratio 0.81 0.35 1.04 1.01
Green Ratio 0.11 0.97 0.82 0.80
Uniform Delay d1 65.5 0.1 13.8 15.0
Delay Factor k 0.35 0.11 0.50 0.50
Incremental Delay d2 12.6 0.0 24.3 27.4 PF Factor 1.000 1.500 0.520 0.351 Control Delay 78.1 0.2 31.5 32.7
Lane Group LOS E A C C
Approach Delay 11.6 31.8
Approach LOS B C
Intersection Delay 26.2 Intersection LOS CCopyright © 2005 University of Florida, All Rights Reserved HCS+TM Version 5.21 Generated: 7/9/2010 9:49 AM
Page 1 of 1Short Report
7/9/2010file://C:\Documents and Settings\JMasinick\Local Settings\Temp\s2k227E.tmp
D-125

Connector Road
- Connector Rd Freeway Operations
- Ramp Junctions@ Celebrate VA
- Ramp Termini Intersections
D-126


BASIC FREEWAY SEGMENTS WORKSHEET
General Information Site Information Analyst ZPH Highway/Direction of Travel EB Connector Rd Agency or Company Michael Baker Jr, Inc From/To Celebrate VA to 95 Date Performed 3/5/2010 JurisdictionAnalysis Time Period AM Analysis Year 2035 Full Interchange Project Description ROUTE 3 INTERCHANGE ANALYSIS
Oper.(LOS)������ Des.(N)����� Planning Data �����
Flow InputsVolume, V 2540 veh/h Peak-Hour Factor, PHF 0.90 AADT veh/day %Trucks and Buses, PT 13 Peak-Hr Prop. of AADT, K %RVs, PR 0Peak-Hr Direction Prop, D General Terrain: Rolling DDHV = AADT x K x D veh/h Grade % Length mi Driver type adjustment 1.00 Up/Down %Calculate Flow Adjustments fp 1.00 ER 2.0
ET 2.5 fHV = 1/[1+PT(ET - 1) + PR(ER - 1)] 0.837
Speed Inputs Calc Speed Adj and FFSLane Width 12.0 ftRt-Shoulder Lat. Clearance 6.0 ftInterchange Density 0.50 I/mi Number of Lanes, N 3FFS (measured) 55.0 mi/h Base free-flow Speed, BFFS mi/h
fLW mi/h fLC mi/h fID mi/h
fN mi/h
FFS 55.0 mi/h
LOS and Performance Measures Design (N)
Operational (LOS)vp = (V or DDHV) / (PHF x N x fHV x fp)
1124 pc/h/ln
S 55.0 mi/h D = vp / S 20.4 pc/mi/ln LOS C
Design (N) Design LOSvp = (V or DDHV) / (PHF x N x fHV x fp)
pc/h
S mi/h D = vp / S pc/mi/ln Required Number of Lanes, N
Glossary Factor LocationN - Number of lanes S - SpeedV - Hourly volume D - Densityvp - Flow rate FFS - Free-flow speedLOS - Level of service BFFS - Base free-flow speedDDHV - Directional design hour volume
ER - Exhibits23-8, 23-10 fLW - Exhibit 23-4ET - Exhibits 23-8, 23-10, 23-11 fLC - Exhibit 23-5fp - Page 23-12 fN - Exhibit 23-6LOS, S, FFS, vp - Exhibits 23-2, 23-3 fID - Exhibit 23-7
Copyright © 2005 University of Florida, All Rights Reserved HCS+TM Version 5.21 Generated: 7/9/2010 10:02 AM
Page 1 of 1BASIC FREEWAY WORKSHEET
7/9/2010file://C:\Documents and Settings\JMasinick\Local Settings\Temp\f2k22DF.tmp
D-127

BASIC FREEWAY SEGMENTS WORKSHEET
General Information Site Information Analyst ZPH Highway/Direction of Travel EB Connector Rd Agency or Company Michael Baker Jr, Inc From/To Celebrate VA to 95 Date Performed 3/5/2010 JurisdictionAnalysis Time Period AM Analysis Year 2035 Full Interchange Project Description ROUTE 3 INTERCHANGE ANALYSIS
Oper.(LOS)������ Des.(N)����� Planning Data �����
Flow InputsVolume, V 3040 veh/h Peak-Hour Factor, PHF 0.90 AADT veh/day %Trucks and Buses, PT 13 Peak-Hr Prop. of AADT, K %RVs, PR 0Peak-Hr Direction Prop, D General Terrain: Rolling DDHV = AADT x K x D veh/h Grade % Length mi Driver type adjustment 1.00 Up/Down %Calculate Flow Adjustments fp 1.00 ER 2.0
ET 2.5 fHV = 1/[1+PT(ET - 1) + PR(ER - 1)] 0.837
Speed Inputs Calc Speed Adj and FFSLane Width 12.0 ftRt-Shoulder Lat. Clearance 6.0 ftInterchange Density 0.50 I/mi Number of Lanes, N 3FFS (measured) 55.0 mi/h Base free-flow Speed, BFFS mi/h
fLW mi/h fLC mi/h fID mi/h
fN mi/h
FFS 55.0 mi/h
LOS and Performance Measures Design (N)
Operational (LOS)vp = (V or DDHV) / (PHF x N x fHV x fp)
1345 pc/h/ln
S 55.0 mi/h D = vp / S 24.5 pc/mi/ln LOS C
Design (N) Design LOSvp = (V or DDHV) / (PHF x N x fHV x fp)
pc/h
S mi/h D = vp / S pc/mi/ln Required Number of Lanes, N
Glossary Factor LocationN - Number of lanes S - SpeedV - Hourly volume D - Densityvp - Flow rate FFS - Free-flow speedLOS - Level of service BFFS - Base free-flow speedDDHV - Directional design hour volume
ER - Exhibits23-8, 23-10 fLW - Exhibit 23-4ET - Exhibits 23-8, 23-10, 23-11 fLC - Exhibit 23-5fp - Page 23-12 fN - Exhibit 23-6LOS, S, FFS, vp - Exhibits 23-2, 23-3 fID - Exhibit 23-7
Copyright © 2005 University of Florida, All Rights Reserved HCS+TM Version 5.21 Generated: 7/28/2010 3:53 PM
Page 1 of 1BASIC FREEWAY WORKSHEET
7/28/2010file://C:\Documents and Settings\JMasinick\Local Settings\Temp\f2k2BE.tmp
D-128

BASIC FREEWAY SEGMENTS WORKSHEET
General Information Site Information Analyst ZPH Highway/Direction of Travel EB Connector Rd Agency or Company Michael Baker Jr, Inc From/To Rt 3 to Celebrate VA Date Performed 3/5/2010 JurisdictionAnalysis Time Period AM Analysis Year 2035 Full Interchange Project Description ROUTE 3 INTERCHANGE ANALYSIS
Oper.(LOS)������ Des.(N)����� Planning Data �����
Flow InputsVolume, V 2020 veh/h Peak-Hour Factor, PHF 0.90 AADT veh/day %Trucks and Buses, PT 4Peak-Hr Prop. of AADT, K %RVs, PR 0Peak-Hr Direction Prop, D General Terrain: Rolling DDHV = AADT x K x D veh/h Grade % Length mi Driver type adjustment 1.00 Up/Down %Calculate Flow Adjustments fp 1.00 ER 2.0
ET 2.5 fHV = 1/[1+PT(ET - 1) + PR(ER - 1)] 0.943
Speed Inputs Calc Speed Adj and FFSLane Width 12.0 ftRt-Shoulder Lat. Clearance 6.0 ftInterchange Density 0.50 I/mi Number of Lanes, N 2FFS (measured) 55.0 mi/h Base free-flow Speed, BFFS mi/h
fLW mi/h fLC mi/h fID mi/h
fN mi/h
FFS 55.0 mi/h
LOS and Performance Measures Design (N)
Operational (LOS)vp = (V or DDHV) / (PHF x N x fHV x fp)
1190 pc/h/ln
S 55.0 mi/h D = vp / S 21.6 pc/mi/ln LOS C
Design (N) Design LOSvp = (V or DDHV) / (PHF x N x fHV x fp)
pc/h
S mi/h D = vp / S pc/mi/ln Required Number of Lanes, N
Glossary Factor LocationN - Number of lanes S - SpeedV - Hourly volume D - Densityvp - Flow rate FFS - Free-flow speedLOS - Level of service BFFS - Base free-flow speedDDHV - Directional design hour volume
ER - Exhibits23-8, 23-10 fLW - Exhibit 23-4ET - Exhibits 23-8, 23-10, 23-11 fLC - Exhibit 23-5fp - Page 23-12 fN - Exhibit 23-6LOS, S, FFS, vp - Exhibits 23-2, 23-3 fID - Exhibit 23-7
Copyright © 2005 University of Florida, All Rights Reserved HCS+TM Version 5.21 Generated: 7/9/2010 10:03 AM
Page 1 of 1BASIC FREEWAY WORKSHEET
7/9/2010file://C:\Documents and Settings\JMasinick\Local Settings\Temp\f2k22EB.tmp
D-129

BASIC FREEWAY SEGMENTS WORKSHEET
General Information Site Information Analyst ZPH Highway/Direction of Travel EB Connector Rd Agency or Company Michael Baker Jr, Inc From/To Rt 3 to Celebrate VA Date Performed 3/5/2010 JurisdictionAnalysis Time Period PM Analysis Year 2035 North Facing Interchange Project Description ROUTE 3 INTERCHANGE ANALYSIS
Oper.(LOS)������ Des.(N)����� Planning Data �����
Flow InputsVolume, V 1510 veh/h Peak-Hour Factor, PHF 0.90 AADT veh/day %Trucks and Buses, PT 4Peak-Hr Prop. of AADT, K %RVs, PR 0Peak-Hr Direction Prop, D General Terrain: Rolling DDHV = AADT x K x D veh/h Grade % Length mi Driver type adjustment 1.00 Up/Down %Calculate Flow Adjustments fp 1.00 ER 2.0
ET 2.5 fHV = 1/[1+PT(ET - 1) + PR(ER - 1)] 0.943
Speed Inputs Calc Speed Adj and FFSLane Width 12.0 ftRt-Shoulder Lat. Clearance 6.0 ftInterchange Density 0.50 I/mi Number of Lanes, N 2FFS (measured) 55.0 mi/h Base free-flow Speed, BFFS mi/h
fLW mi/h fLC mi/h fID mi/h
fN mi/h
FFS 55.0 mi/h
LOS and Performance Measures Design (N)
Operational (LOS)vp = (V or DDHV) / (PHF x N x fHV x fp)
889 pc/h/ln
S 55.0 mi/h D = vp / S 16.2 pc/mi/ln LOS B
Design (N) Design LOSvp = (V or DDHV) / (PHF x N x fHV x fp)
pc/h
S mi/h D = vp / S pc/mi/ln Required Number of Lanes, N
Glossary Factor LocationN - Number of lanes S - SpeedV - Hourly volume D - Densityvp - Flow rate FFS - Free-flow speedLOS - Level of service BFFS - Base free-flow speedDDHV - Directional design hour volume
ER - Exhibits23-8, 23-10 fLW - Exhibit 23-4ET - Exhibits 23-8, 23-10, 23-11 fLC - Exhibit 23-5fp - Page 23-12 fN - Exhibit 23-6LOS, S, FFS, vp - Exhibits 23-2, 23-3 fID - Exhibit 23-7
Copyright © 2005 University of Florida, All Rights Reserved HCS+TM Version 5.21 Generated: 7/9/2010 10:03 AM
Page 1 of 1BASIC FREEWAY WORKSHEET
7/9/2010file://C:\Documents and Settings\JMasinick\Local Settings\Temp\f2k22F1.tmp
D-130

BASIC FREEWAY SEGMENTS WORKSHEET
General Information Site Information Analyst ZPH Highway/Direction of Travel WB Connector Rd Agency or Company Michael Baker Jr, Inc From/To I-95 to Celebrate VA Date Performed 3/5/2010 JurisdictionAnalysis Time Period AM Analysis Year 2035 Full Interchange Project Description ROUTE 3 INTERCHANGE ANALYSIS
Oper.(LOS)������ Des.(N)����� Planning Data �����
Flow InputsVolume, V 1110 veh/h Peak-Hour Factor, PHF 0.90 AADT veh/day %Trucks and Buses, PT 18 Peak-Hr Prop. of AADT, K %RVs, PR 0Peak-Hr Direction Prop, D General Terrain: Rolling DDHV = AADT x K x D veh/h Grade % Length mi Driver type adjustment 1.00 Up/Down %Calculate Flow Adjustments fp 1.00 ER 2.0
ET 2.5 fHV = 1/[1+PT(ET - 1) + PR(ER - 1)] 0.787
Speed Inputs Calc Speed Adj and FFSLane Width 12.0 ftRt-Shoulder Lat. Clearance 6.0 ftInterchange Density 0.50 I/mi Number of Lanes, N 3FFS (measured) 55.0 mi/h Base free-flow Speed, BFFS mi/h
fLW mi/h fLC mi/h fID mi/h
fN mi/h
FFS 55.0 mi/h
LOS and Performance Measures Design (N)
Operational (LOS)vp = (V or DDHV) / (PHF x N x fHV x fp)
522 pc/h/ln
S 55.0 mi/h D = vp / S 9.5 pc/mi/ln LOS A
Design (N) Design LOSvp = (V or DDHV) / (PHF x N x fHV x fp)
pc/h
S mi/h D = vp / S pc/mi/ln Required Number of Lanes, N
Glossary Factor LocationN - Number of lanes S - SpeedV - Hourly volume D - Densityvp - Flow rate FFS - Free-flow speedLOS - Level of service BFFS - Base free-flow speedDDHV - Directional design hour volume
ER - Exhibits23-8, 23-10 fLW - Exhibit 23-4ET - Exhibits 23-8, 23-10, 23-11 fLC - Exhibit 23-5fp - Page 23-12 fN - Exhibit 23-6LOS, S, FFS, vp - Exhibits 23-2, 23-3 fID - Exhibit 23-7
Copyright © 2005 University of Florida, All Rights Reserved HCS+TM Version 5.21 Generated: 7/9/2010 10:04 AM
Page 1 of 1BASIC FREEWAY WORKSHEET
7/9/2010file://C:\Documents and Settings\JMasinick\Local Settings\Temp\f2k22F7.tmp
D-131

BASIC FREEWAY SEGMENTS WORKSHEET
General Information Site Information Analyst ZPH Highway/Direction of Travel WB Connector Rd Agency or Company Michael Baker Jr, Inc From/To I-95 to Celebrate VA Date Performed 3/5/2010 JurisdictionAnalysis Time Period PM Analysis Year 2035 Full Interchange Project Description ROUTE 3 INTERCHANGE ANALYSIS
Oper.(LOS)������ Des.(N)����� Planning Data �����
Flow InputsVolume, V 3730 veh/h Peak-Hour Factor, PHF 0.90 AADT veh/day %Trucks and Buses, PT 13 Peak-Hr Prop. of AADT, K %RVs, PR 0Peak-Hr Direction Prop, D General Terrain: Rolling DDHV = AADT x K x D veh/h Grade % Length mi Driver type adjustment 1.00 Up/Down %Calculate Flow Adjustments fp 1.00 ER 2.0
ET 2.5 fHV = 1/[1+PT(ET - 1) + PR(ER - 1)] 0.837
Speed Inputs Calc Speed Adj and FFSLane Width 12.0 ftRt-Shoulder Lat. Clearance 6.0 ftInterchange Density 0.50 I/mi Number of Lanes, N 3FFS (measured) 55.0 mi/h Base free-flow Speed, BFFS mi/h
fLW mi/h fLC mi/h fID mi/h
fN mi/h
FFS 55.0 mi/h
LOS and Performance Measures Design (N)
Operational (LOS)vp = (V or DDHV) / (PHF x N x fHV x fp)
1651 pc/h/ln
S 55.0 mi/h D = vp / S 30.0 pc/mi/ln LOS D
Design (N) Design LOSvp = (V or DDHV) / (PHF x N x fHV x fp)
pc/h
S mi/h D = vp / S pc/mi/ln Required Number of Lanes, N
Glossary Factor LocationN - Number of lanes S - SpeedV - Hourly volume D - Densityvp - Flow rate FFS - Free-flow speedLOS - Level of service BFFS - Base free-flow speedDDHV - Directional design hour volume
ER - Exhibits23-8, 23-10 fLW - Exhibit 23-4ET - Exhibits 23-8, 23-10, 23-11 fLC - Exhibit 23-5fp - Page 23-12 fN - Exhibit 23-6LOS, S, FFS, vp - Exhibits 23-2, 23-3 fID - Exhibit 23-7
Copyright © 2005 University of Florida, All Rights Reserved HCS+TM Version 5.21 Generated: 7/9/2010 10:04 AM
Page 1 of 1BASIC FREEWAY WORKSHEET
7/9/2010file://C:\Documents and Settings\JMasinick\Local Settings\Temp\f2k22FD.tmp
D-132

BASIC FREEWAY SEGMENTS WORKSHEET
General Information Site Information Analyst ZPH Highway/Direction of Travel WB Connector Rd Agency or Company Michael Baker Jr, Inc From/To Celebrate VA to Rt 3 Date Performed 3/5/2010 JurisdictionAnalysis Time Period AM Analysis Year 2035 Full Interchange Project Description ROUTE 3 INTERCHANGE ANALYSIS
Oper.(LOS)������ Des.(N)����� Planning Data �����
Flow InputsVolume, V 980 veh/h Peak-Hour Factor, PHF 0.90 AADT veh/day %Trucks and Buses, PT 4Peak-Hr Prop. of AADT, K %RVs, PR 0Peak-Hr Direction Prop, D General Terrain: Rolling DDHV = AADT x K x D veh/h Grade % Length mi Driver type adjustment 1.00 Up/Down %Calculate Flow Adjustments fp 1.00 ER 2.0
ET 2.5 fHV = 1/[1+PT(ET - 1) + PR(ER - 1)] 0.943
Speed Inputs Calc Speed Adj and FFSLane Width 12.0 ftRt-Shoulder Lat. Clearance 6.0 ftInterchange Density 0.50 I/mi Number of Lanes, N 2FFS (measured) 55.0 mi/h Base free-flow Speed, BFFS mi/h
fLW mi/h fLC mi/h fID mi/h
fN mi/h
FFS 55.0 mi/h
LOS and Performance Measures Design (N)
Operational (LOS)vp = (V or DDHV) / (PHF x N x fHV x fp)
577 pc/h/ln
S 55.0 mi/h D = vp / S 10.5 pc/mi/ln LOS A
Design (N) Design LOSvp = (V or DDHV) / (PHF x N x fHV x fp)
pc/h
S mi/h D = vp / S pc/mi/ln Required Number of Lanes, N
Glossary Factor LocationN - Number of lanes S - SpeedV - Hourly volume D - Densityvp - Flow rate FFS - Free-flow speedLOS - Level of service BFFS - Base free-flow speedDDHV - Directional design hour volume
ER - Exhibits23-8, 23-10 fLW - Exhibit 23-4ET - Exhibits 23-8, 23-10, 23-11 fLC - Exhibit 23-5fp - Page 23-12 fN - Exhibit 23-6LOS, S, FFS, vp - Exhibits 23-2, 23-3 fID - Exhibit 23-7
Copyright © 2005 University of Florida, All Rights Reserved HCS+TM Version 5.21 Generated: 7/9/2010 10:04 AM
Page 1 of 1BASIC FREEWAY WORKSHEET
7/9/2010file://C:\Documents and Settings\JMasinick\Local Settings\Temp\f2k2303.tmp
D-133

BASIC FREEWAY SEGMENTS WORKSHEET
General Information Site Information Analyst ZPH Highway/Direction of Travel WB Connector Rd Agency or Company Michael Baker Jr, Inc From/To Celebrate VA to Rt 3 Date Performed 3/5/2010 JurisdictionAnalysis Time Period PM Analysis Year 2035 Full Interchange Project Description ROUTE 3 INTERCHANGE ANALYSIS
Oper.(LOS)������ Des.(N)����� Planning Data �����
Flow InputsVolume, V 3290 veh/h Peak-Hour Factor, PHF 0.90 AADT veh/day %Trucks and Buses, PT 4Peak-Hr Prop. of AADT, K %RVs, PR 0Peak-Hr Direction Prop, D General Terrain: Rolling DDHV = AADT x K x D veh/h Grade % Length mi Driver type adjustment 1.00 Up/Down %Calculate Flow Adjustments fp 1.00 ER 2.0
ET 2.5 fHV = 1/[1+PT(ET - 1) + PR(ER - 1)] 0.943
Speed Inputs Calc Speed Adj and FFSLane Width 12.0 ftRt-Shoulder Lat. Clearance 6.0 ftInterchange Density 0.50 I/mi Number of Lanes, N 2FFS (measured) 56.0 mi/h Base free-flow Speed, BFFS mi/h
fLW mi/h fLC mi/h fID mi/h
fN mi/h
FFS 56.0 mi/h
LOS and Performance Measures Design (N)
Operational (LOS)vp = (V or DDHV) / (PHF x N x fHV x fp)
1937 pc/h/ln
S 55.5 mi/h D = vp / S 34.9 pc/mi/ln LOS D
Design (N) Design LOSvp = (V or DDHV) / (PHF x N x fHV x fp)
pc/h
S mi/h D = vp / S pc/mi/ln Required Number of Lanes, N
Glossary Factor LocationN - Number of lanes S - SpeedV - Hourly volume D - Densityvp - Flow rate FFS - Free-flow speedLOS - Level of service BFFS - Base free-flow speedDDHV - Directional design hour volume
ER - Exhibits23-8, 23-10 fLW - Exhibit 23-4ET - Exhibits 23-8, 23-10, 23-11 fLC - Exhibit 23-5fp - Page 23-12 fN - Exhibit 23-6LOS, S, FFS, vp - Exhibits 23-2, 23-3 fID - Exhibit 23-7
Copyright © 2005 University of Florida, All Rights Reserved HCS+TM Version 5.21 Generated: 7/9/2010 10:04 AM
Page 1 of 1BASIC FREEWAY WORKSHEET
7/9/2010file://C:\Documents and Settings\JMasinick\Local Settings\Temp\f2k2309.tmp
D-134

RAMPS AND RAMP JUNCTIONS WORKSHEETGeneral Information Site Information Analyst ZPH Freeway/Dir of Travel Connector Rd/ArterialAgency or Company Michael Baker Jr., Inc Junction EB DivergeDate Performed 3/5/2010 JurisdictionAnalysis Time Period AM Peak Analysis Year 2035 Full InterchangeProject Description ROUTE 3 INTERCHANGE ANALYSIS InputsUpstream Adj Ramp
Yes����� On�����
No������ Off�����
Lup = ft
Vu = veh/h
Terrain: Rolling Downstream Adj Ramp
Yes������ On������
No����� Off�����
Ldown = 2000 ft
VD = 1290 veh/h S FF = 55.0 mph SFR = 35.0 mph
Sketch ( show lanes, LA, LD,VR,Vf)
Conversion to pc/h Under Base Conditions (pc/h) V
(Veh/hr) PHF Terrain %Truck %Rv fHV fp v = V/PHF x fHV x fp
Freeway 2020 0.90 Rolling 4 0 0.943 1.00 2379 Ramp 290 0.90 Rolling 4 0 0.943 1.00 342 UpStream DownStream 1290 0.90 Rolling 13 0 0.837 1.00 1713
Merge Areas Diverge AreasEstimation of v12 Estimation of v12
V12 = VF ( PFM )LEQ = (Equation 25-2 or 25-3)PFM = using Equation (Exhibit 25-5) V12 = pc/h V3 or Vav34 pc/h (Equation 25-4 or 25-5) Is V3 or Vav34 > 2,700 pc/h? Yes No����� �����
Is V3 or Vav34 > 1.5 * V12/2 Yes No����� �����
If Yes,V12a = pc/h (Equation 25-8)
V12 = VR + (VF - VR)PFDLEQ = (Equation 25-8 or 25-9) PFD = 1.000 using Equation (Exhibit 25-12) V12 = 2379 pc/h V3 or Vav34 0 pc/h (Equation 25-15 or 25-16) Is V3 or Vav34 > 2,700 pc/h? Yes No����� ������
Is V3 or Vav34 > 1.5 * V12/2 Yes No����� ������
If Yes,V12a = pc/h (Equation 25-18)
Capacity Checks Capacity ChecksActual Capacity LOS F? Actual Capacity LOS F?
VFO Exhibit 25-7
VF 2379 Exhibit 25-14 4500 NoVFO = VF - VR 2037 Exhibit 25-14 4500 No
VR 342 Exhibit 25-3 2000 No
Flow Entering Merge Influence Area Flow Entering Merge Influence AreaActual Max Desirable Violation? Actual Max Desirable Violation?
VR12 Exhibit 25-7 V12 2379 Exhibit 25-14 4400:All NoLevel of Service Determination (if not F) Level of Service Determination (if not F)
DR = 5.475 + 0.00734 v R + 0.0078 V12 - 0.00627 LA
DR = (pc/mi/ln)LOS = (Exhibit 25-4)
DR = 4.252 + 0.0086 V12 - 0.0009 LD
DR = 15.7 (pc/mi/ln)LOS = B (Exhibit 25-4)
Speed Determination Speed DeterminationMS = (Exibit 25-19) SR= mph (Exhibit 25-19) S0= mph (Exhibit 25-19) S = mph (Exhibit 25-14)
Ds = 0.459 (Exhibit 25-19) SR= 49.0 mph (Exhibit 25-19) S0= N/A mph (Exhibit 25-19) S = 49.0 mph (Exhibit 25-15)
Copyright © 2005 University of Florida, All Rights Reserved HCS+TM Version 5.21 Generated: 9/10/2010 3:39 PM
Page 1 of 1RAMPS AND RAMP JUNCTIONS WORKSHEET
9/10/2010file://C:\Documents and Settings\JMasinick\Local Settings\Temp\r2k1C62.tmp
D-135

RAMPS AND RAMP JUNCTIONS WORKSHEETGeneral Information Site Information Analyst ZPH Freeway/Dir of Travel Connector Rd/ArterialAgency or Company Michael Baker Jr., Inc Junction EB DivergeDate Performed 3/5/2010 JurisdictionAnalysis Time Period PM Peak Analysis Year 2035 Full InterchangeProject Description ROUTE 3 INTERCHANGE ANALYSIS InputsUpstream Adj Ramp
Yes����� On�����
No������ Off�����
Lup = ft
Vu = veh/h
Terrain: Rolling Downstream Adj Ramp
Yes������ On������
No����� Off�����
Ldown = 2000 ft
VD = 670 veh/h S FF = 55.0 mph SFR = 35.0 mph
Sketch ( show lanes, LA, LD,VR,Vf)
Conversion to pc/h Under Base Conditions (pc/h) V
(Veh/hr) PHF Terrain %Truck %Rv fHV fp v = V/PHF x fHV x fp
Freeway 1510 0.90 Rolling 4 0 0.943 1.00 1778 Ramp 480 0.90 Rolling 4 0 0.943 1.00 565 UpStream DownStream 670 0.90 Rolling 13 0 0.837 1.00 890
Merge Areas Diverge AreasEstimation of v12 Estimation of v12
V12 = VF ( PFM )LEQ = (Equation 25-2 or 25-3)PFM = using Equation (Exhibit 25-5) V12 = pc/h V3 or Vav34 pc/h (Equation 25-4 or 25-5) Is V3 or Vav34 > 2,700 pc/h? Yes No����� �����
Is V3 or Vav34 > 1.5 * V12/2 Yes No����� �����
If Yes,V12a = pc/h (Equation 25-8)
V12 = VR + (VF - VR)PFDLEQ = (Equation 25-8 or 25-9) PFD = 1.000 using Equation (Exhibit 25-12) V12 = 1778 pc/h V3 or Vav34 0 pc/h (Equation 25-15 or 25-16) Is V3 or Vav34 > 2,700 pc/h? Yes No����� ������
Is V3 or Vav34 > 1.5 * V12/2 Yes No����� ������
If Yes,V12a = pc/h (Equation 25-18)
Capacity Checks Capacity ChecksActual Capacity LOS F? Actual Capacity LOS F?
VFO Exhibit 25-7
VF 1778 Exhibit 25-14 4500 NoVFO = VF - VR 1213 Exhibit 25-14 4500 No
VR 565 Exhibit 25-3 2000 No
Flow Entering Merge Influence Area Flow Entering Merge Influence AreaActual Max Desirable Violation? Actual Max Desirable Violation?
VR12 Exhibit 25-7 V12 1778 Exhibit 25-14 4400:All NoLevel of Service Determination (if not F) Level of Service Determination (if not F)
DR = 5.475 + 0.00734 v R + 0.0078 V12 - 0.00627 LA
DR = (pc/mi/ln)LOS = (Exhibit 25-4)
DR = 4.252 + 0.0086 V12 - 0.0009 LD
DR = 10.5 (pc/mi/ln)LOS = B (Exhibit 25-4)
Speed Determination Speed DeterminationMS = (Exibit 25-19) SR= mph (Exhibit 25-19) S0= mph (Exhibit 25-19) S = mph (Exhibit 25-14)
Ds = 0.479 (Exhibit 25-19) SR= 48.8 mph (Exhibit 25-19) S0= N/A mph (Exhibit 25-19) S = 48.8 mph (Exhibit 25-15)
Copyright © 2005 University of Florida, All Rights Reserved HCS+TM Version 5.21 Generated: 7/9/2010 10:05 AM
Page 1 of 1RAMPS AND RAMP JUNCTIONS WORKSHEET
7/9/2010file://C:\Documents and Settings\JMasinick\Local Settings\Temp\r2k2315.tmp
D-136

RAMPS AND RAMP JUNCTIONS WORKSHEETGeneral Information Site Information Analyst Michael Baker Jr, Inc Freeway/Dir of Travel Connector Rd/ArterialAgency or Company Michael Baker Jr, Inc Junction EB MergeDate Performed 3/5/2010 JurisdictionAnalysis Time Period AM Analysis Year 2035 North Facing RampsProject Description ROUTE 3 INTERCHANGE ANALYSIS InputsUpstream Adj Ramp
Yes������ On�����
No����� Off������
Lup = 2000 ft
Vu = 290 veh/h
Terrain: Rolling Downstream Adj Ramp
Yes����� On�����
No������ Off�����
Ldown = ft
VD = veh/h S FF = 55.0 mph SFR = 35.0 mph
Sketch ( show lanes, LA, LD,VR,Vf)
Conversion to pc/h Under Base Conditions (pc/h) V
(Veh/hr) PHF Terrain %Truck %Rv fHV fp v = V/PHF x fHV x fp
Freeway 1730 0.90 Rolling 13 0 0.837 1.00 2297 Ramp 1290 0.90 Rolling 13 0 0.837 1.00 1713 UpStream 290 0.90 Rolling 4 0 0.943 1.00 342 DownStream
Merge Areas Diverge AreasEstimation of v12 Estimation of v12
V12 = VF ( PFM )LEQ = (Equation 25-2 or 25-3)PFM = 1.000 using Equation (Exhibit 25-5) V12 = 2297 pc/h V3 or Vav34 0 pc/h (Equation 25-4 or 25-5) Is V3 or Vav34 > 2,700 pc/h? Yes No����� ������
Is V3 or Vav34 > 1.5 * V12/2 Yes No����� ������
If Yes,V12a = pc/h (Equation 25-8)
V12 = VR + (VF - VR)PFDLEQ = (Equation 25-8 or 25-9) PFD = using Equation (Exhibit 25-12) V12 = pc/h V3 or Vav34 pc/h (Equation 25-15 or 25-16) Is V3 or Vav34 > 2,700 pc/h? Yes No����� �����
Is V3 or Vav34 > 1.5 * V12/2 Yes No����� �����
If Yes,V12a = pc/h (Equation 25-18)
Capacity Checks Capacity ChecksActual Capacity LOS F? Actual Capacity LOS F?
VFO 4010 Exhibit 25-7 No
VF Exhibit 25-14VFO = VF - VR Exhibit 25-14
VR Exhibit 25-3
Flow Entering Merge Influence Area Flow Entering Merge Influence AreaActual Max Desirable Violation? Actual Max Desirable Violation?
VR12 4010 Exhibit 25-7 4600:All No V12 Exhibit 25-14Level of Service Determination (if not F) Level of Service Determination (if not F)
DR = 5.475 + 0.00734 v R + 0.0078 V12 - 0.00627 LADR = 26.6 (pc/mi/ln) LOS = C (Exhibit 25-4)
DR = 4.252 + 0.0086 V12 - 0.0009 LD
DR = (pc/mi/ln)LOS = (Exhibit 25-4)
Speed Determination Speed DeterminationMS = 0.431 (Exibit 25-19) SR= 49.4 mph (Exhibit 25-19) S0= N/A mph (Exhibit 25-19) S = 49.4 mph (Exhibit 25-14)
Ds = (Exhibit 25-19) SR= mph (Exhibit 25-19) S0= mph (Exhibit 25-19) S = mph (Exhibit 25-15)
Copyright © 2005 University of Florida, All Rights Reserved HCS+TM Version 5.21 Generated: 9/10/2010 3:41 PM
Page 1 of 1RAMPS AND RAMP JUNCTIONS WORKSHEET
9/10/2010file://C:\Documents and Settings\JMasinick\Local Settings\Temp\r2k1C69.tmp
D-137

RAMPS AND RAMP JUNCTIONS WORKSHEETGeneral Information Site Information Analyst Michael Baker Jr, Inc Freeway/Dir of Travel Connector Rd/ArterialAgency or Company Michael Baker Jr, Inc Junction EB MergeDate Performed 3/5/2010 JurisdictionAnalysis Time Period PM Analysis Year 2035 Full InterchangeProject Description ROUTE 3 INTERCHANGE ANALYSIS InputsUpstream Adj Ramp
Yes������ On�����
No����� Off������
Lup = 2000 ft
Vu = 480 veh/h
Terrain: Rolling Downstream Adj Ramp
Yes����� On�����
No������ Off�����
Ldown = ft
VD = veh/h S FF = 55.0 mph SFR = 35.0 mph
Sketch ( show lanes, LA, LD,VR,Vf)
Conversion to pc/h Under Base Conditions (pc/h) V
(Veh/hr) PHF Terrain %Truck %Rv fHV fp v = V/PHF x fHV x fp
Freeway 1030 0.90 Rolling 13 0 0.837 1.00 1368 Ramp 670 0.90 Rolling 13 0 0.837 1.00 890 UpStream 480 0.90 Rolling 4 0 0.943 1.00 565 DownStream
Merge Areas Diverge AreasEstimation of v12 Estimation of v12
V12 = VF ( PFM )LEQ = (Equation 25-2 or 25-3)PFM = 1.000 using Equation (Exhibit 25-5) V12 = 1368 pc/h V3 or Vav34 0 pc/h (Equation 25-4 or 25-5) Is V3 or Vav34 > 2,700 pc/h? Yes No����� ������
Is V3 or Vav34 > 1.5 * V12/2 Yes No����� ������
If Yes,V12a = pc/h (Equation 25-8)
V12 = VR + (VF - VR)PFDLEQ = (Equation 25-8 or 25-9) PFD = using Equation (Exhibit 25-12) V12 = pc/h V3 or Vav34 pc/h (Equation 25-15 or 25-16) Is V3 or Vav34 > 2,700 pc/h? Yes No����� �����
Is V3 or Vav34 > 1.5 * V12/2 Yes No����� �����
If Yes,V12a = pc/h (Equation 25-18)
Capacity Checks Capacity ChecksActual Capacity LOS F? Actual Capacity LOS F?
VFO 2258 Exhibit 25-7 No
VF Exhibit 25-14VFO = VF - VR Exhibit 25-14
VR Exhibit 25-3
Flow Entering Merge Influence Area Flow Entering Merge Influence AreaActual Max Desirable Violation? Actual Max Desirable Violation?
VR12 2258 Exhibit 25-7 4600:All No V12 Exhibit 25-14Level of Service Determination (if not F) Level of Service Determination (if not F)
DR = 5.475 + 0.00734 v R + 0.0078 V12 - 0.00627 LADR = 16.4 (pc/mi/ln) LOS = B (Exhibit 25-4)
DR = 4.252 + 0.0086 V12 - 0.0009 LD
DR = (pc/mi/ln)LOS = (Exhibit 25-4)
Speed Determination Speed DeterminationMS = 0.288 (Exibit 25-19) SR= 51.3 mph (Exhibit 25-19) S0= N/A mph (Exhibit 25-19) S = 51.3 mph (Exhibit 25-14)
Ds = (Exhibit 25-19) SR= mph (Exhibit 25-19) S0= mph (Exhibit 25-19) S = mph (Exhibit 25-15)
Copyright © 2005 University of Florida, All Rights Reserved HCS+TM Version 5.21 Generated: 7/9/2010 10:06 AM
Page 1 of 1RAMPS AND RAMP JUNCTIONS WORKSHEET
7/9/2010file://C:\Documents and Settings\JMasinick\Local Settings\Temp\r2k2321.tmp
D-138
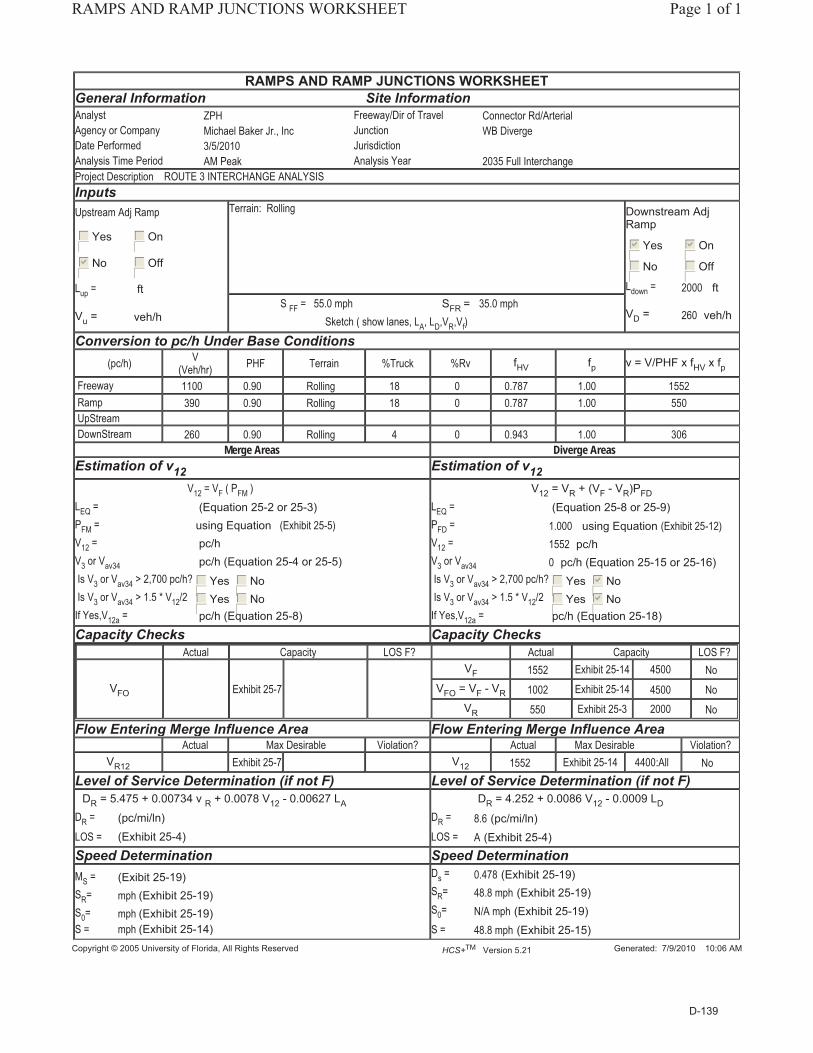
RAMPS AND RAMP JUNCTIONS WORKSHEETGeneral Information Site Information Analyst ZPH Freeway/Dir of Travel Connector Rd/ArterialAgency or Company Michael Baker Jr., Inc Junction WB DivergeDate Performed 3/5/2010 JurisdictionAnalysis Time Period AM Peak Analysis Year 2035 Full InterchangeProject Description ROUTE 3 INTERCHANGE ANALYSIS InputsUpstream Adj Ramp
Yes����� On�����
No������ Off�����
Lup = ft
Vu = veh/h
Terrain: Rolling Downstream Adj Ramp
Yes������ On������
No����� Off�����
Ldown = 2000 ft
VD = 260 veh/h S FF = 55.0 mph SFR = 35.0 mph
Sketch ( show lanes, LA, LD,VR,Vf)
Conversion to pc/h Under Base Conditions (pc/h) V
(Veh/hr) PHF Terrain %Truck %Rv fHV fp v = V/PHF x fHV x fp
Freeway 1100 0.90 Rolling 18 0 0.787 1.00 1552 Ramp 390 0.90 Rolling 18 0 0.787 1.00 550 UpStream DownStream 260 0.90 Rolling 4 0 0.943 1.00 306
Merge Areas Diverge AreasEstimation of v12 Estimation of v12
V12 = VF ( PFM )LEQ = (Equation 25-2 or 25-3)PFM = using Equation (Exhibit 25-5) V12 = pc/h V3 or Vav34 pc/h (Equation 25-4 or 25-5) Is V3 or Vav34 > 2,700 pc/h? Yes No����� �����
Is V3 or Vav34 > 1.5 * V12/2 Yes No����� �����
If Yes,V12a = pc/h (Equation 25-8)
V12 = VR + (VF - VR)PFDLEQ = (Equation 25-8 or 25-9) PFD = 1.000 using Equation (Exhibit 25-12) V12 = 1552 pc/h V3 or Vav34 0 pc/h (Equation 25-15 or 25-16) Is V3 or Vav34 > 2,700 pc/h? Yes No����� ������
Is V3 or Vav34 > 1.5 * V12/2 Yes No����� ������
If Yes,V12a = pc/h (Equation 25-18)
Capacity Checks Capacity ChecksActual Capacity LOS F? Actual Capacity LOS F?
VFO Exhibit 25-7
VF 1552 Exhibit 25-14 4500 NoVFO = VF - VR 1002 Exhibit 25-14 4500 No
VR 550 Exhibit 25-3 2000 No
Flow Entering Merge Influence Area Flow Entering Merge Influence AreaActual Max Desirable Violation? Actual Max Desirable Violation?
VR12 Exhibit 25-7 V12 1552 Exhibit 25-14 4400:All NoLevel of Service Determination (if not F) Level of Service Determination (if not F)
DR = 5.475 + 0.00734 v R + 0.0078 V12 - 0.00627 LA
DR = (pc/mi/ln)LOS = (Exhibit 25-4)
DR = 4.252 + 0.0086 V12 - 0.0009 LD
DR = 8.6 (pc/mi/ln)LOS = A (Exhibit 25-4)
Speed Determination Speed DeterminationMS = (Exibit 25-19) SR= mph (Exhibit 25-19) S0= mph (Exhibit 25-19) S = mph (Exhibit 25-14)
Ds = 0.478 (Exhibit 25-19) SR= 48.8 mph (Exhibit 25-19) S0= N/A mph (Exhibit 25-19) S = 48.8 mph (Exhibit 25-15)
Copyright © 2005 University of Florida, All Rights Reserved HCS+TM Version 5.21 Generated: 7/9/2010 10:06 AM
Page 1 of 1RAMPS AND RAMP JUNCTIONS WORKSHEET
7/9/2010file://C:\Documents and Settings\JMasinick\Local Settings\Temp\r2k2327.tmp
D-139
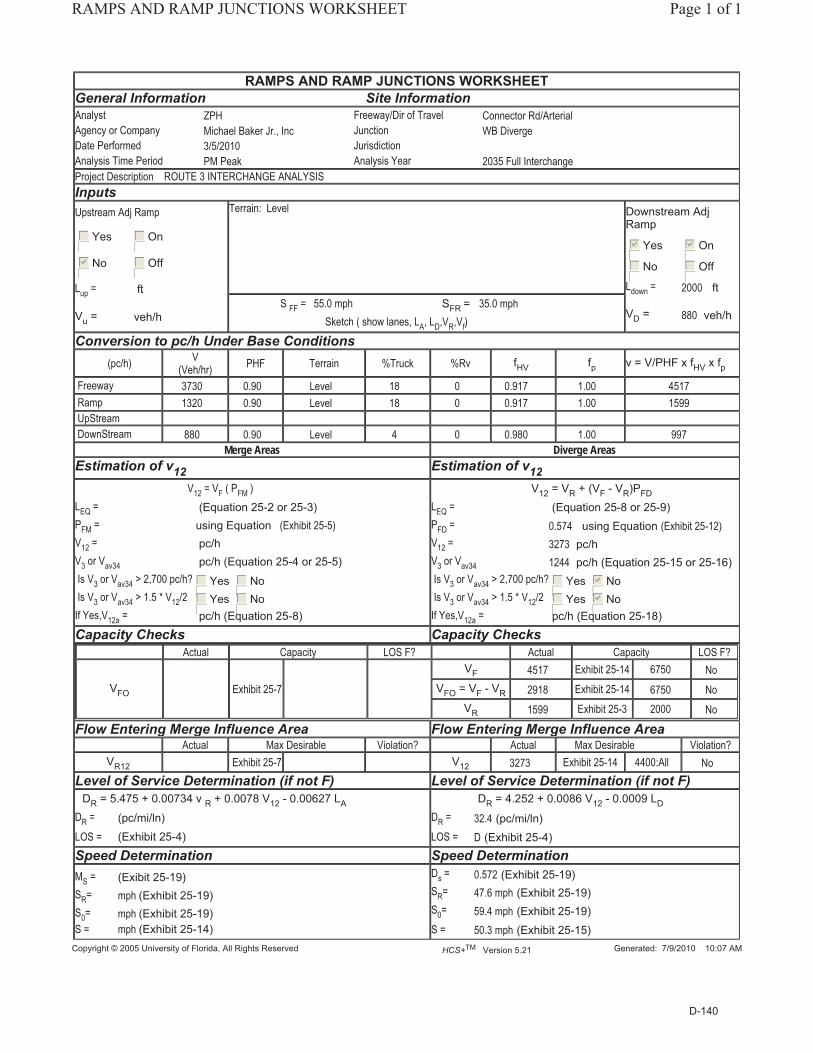
RAMPS AND RAMP JUNCTIONS WORKSHEETGeneral Information Site Information Analyst ZPH Freeway/Dir of Travel Connector Rd/ArterialAgency or Company Michael Baker Jr., Inc Junction WB DivergeDate Performed 3/5/2010 JurisdictionAnalysis Time Period PM Peak Analysis Year 2035 Full InterchangeProject Description ROUTE 3 INTERCHANGE ANALYSIS InputsUpstream Adj Ramp
Yes����� On�����
No������ Off�����
Lup = ft
Vu = veh/h
Terrain: Level Downstream Adj Ramp
Yes������ On������
No����� Off�����
Ldown = 2000 ft
VD = 880 veh/h S FF = 55.0 mph SFR = 35.0 mph
Sketch ( show lanes, LA, LD,VR,Vf)
Conversion to pc/h Under Base Conditions (pc/h) V
(Veh/hr) PHF Terrain %Truck %Rv fHV fp v = V/PHF x fHV x fp
Freeway 3730 0.90 Level 18 0 0.917 1.00 4517 Ramp 1320 0.90 Level 18 0 0.917 1.00 1599 UpStream DownStream 880 0.90 Level 4 0 0.980 1.00 997
Merge Areas Diverge AreasEstimation of v12 Estimation of v12
V12 = VF ( PFM )LEQ = (Equation 25-2 or 25-3)PFM = using Equation (Exhibit 25-5) V12 = pc/h V3 or Vav34 pc/h (Equation 25-4 or 25-5) Is V3 or Vav34 > 2,700 pc/h? Yes No����� �����
Is V3 or Vav34 > 1.5 * V12/2 Yes No����� �����
If Yes,V12a = pc/h (Equation 25-8)
V12 = VR + (VF - VR)PFDLEQ = (Equation 25-8 or 25-9) PFD = 0.574 using Equation (Exhibit 25-12) V12 = 3273 pc/h V3 or Vav34 1244 pc/h (Equation 25-15 or 25-16) Is V3 or Vav34 > 2,700 pc/h? Yes No����� ������
Is V3 or Vav34 > 1.5 * V12/2 Yes No����� ������
If Yes,V12a = pc/h (Equation 25-18)
Capacity Checks Capacity ChecksActual Capacity LOS F? Actual Capacity LOS F?
VFO Exhibit 25-7
VF 4517 Exhibit 25-14 6750 NoVFO = VF - VR 2918 Exhibit 25-14 6750 No
VR 1599 Exhibit 25-3 2000 No
Flow Entering Merge Influence Area Flow Entering Merge Influence AreaActual Max Desirable Violation? Actual Max Desirable Violation?
VR12 Exhibit 25-7 V12 3273 Exhibit 25-14 4400:All NoLevel of Service Determination (if not F) Level of Service Determination (if not F)
DR = 5.475 + 0.00734 v R + 0.0078 V12 - 0.00627 LA
DR = (pc/mi/ln)LOS = (Exhibit 25-4)
DR = 4.252 + 0.0086 V12 - 0.0009 LD
DR = 32.4 (pc/mi/ln)LOS = D (Exhibit 25-4)
Speed Determination Speed DeterminationMS = (Exibit 25-19) SR= mph (Exhibit 25-19) S0= mph (Exhibit 25-19) S = mph (Exhibit 25-14)
Ds = 0.572 (Exhibit 25-19) SR= 47.6 mph (Exhibit 25-19) S0= 59.4 mph (Exhibit 25-19) S = 50.3 mph (Exhibit 25-15)
Copyright © 2005 University of Florida, All Rights Reserved HCS+TM Version 5.21 Generated: 7/9/2010 10:07 AM
Page 1 of 1RAMPS AND RAMP JUNCTIONS WORKSHEET
7/9/2010file://C:\Documents and Settings\JMasinick\Local Settings\Temp\r2k232D.tmp
D-140

RAMPS AND RAMP JUNCTIONS WORKSHEETGeneral Information Site Information Analyst Freeway/Dir of Travel Connector Rd/ArterialAgency or Company Michael Baker Jr, Inc Junction WB MergeDate Performed 3/5/2010 JurisdictionAnalysis Time Period AM Analysis Year 2035 Full InterchangeProject Description ROUTE 3 INTERCHANGE ANALYSIS InputsUpstream Adj Ramp
Yes������ On�����
No����� Off������
Lup = 2000 ft
Vu = 390 veh/h
Terrain: Rolling Downstream Adj Ramp
Yes����� On�����
No������ Off�����
Ldown = ft
VD = veh/h S FF = 55.0 mph SFR = 35.0 mph
Sketch ( show lanes, LA, LD,VR,Vf)
Conversion to pc/h Under Base Conditions (pc/h) V
(Veh/hr) PHF Terrain %Truck %Rv fHV fp v = V/PHF x fHV x fp
Freeway 720 0.90 Rolling 4 0 0.943 1.00 848 Ramp 260 0.90 Rolling 4 0 0.943 1.00 306 UpStream 390 0.90 Rolling 18 0 0.787 1.00 550 DownStream
Merge Areas Diverge AreasEstimation of v12 Estimation of v12
V12 = VF ( PFM )LEQ = (Equation 25-2 or 25-3)PFM = 1.000 using Equation (Exhibit 25-5) V12 = 848 pc/h V3 or Vav34 0 pc/h (Equation 25-4 or 25-5) Is V3 or Vav34 > 2,700 pc/h? Yes No����� ������
Is V3 or Vav34 > 1.5 * V12/2 Yes No����� ������
If Yes,V12a = pc/h (Equation 25-8)
V12 = VR + (VF - VR)PFDLEQ = (Equation 25-8 or 25-9) PFD = using Equation (Exhibit 25-12) V12 = pc/h V3 or Vav34 pc/h (Equation 25-15 or 25-16) Is V3 or Vav34 > 2,700 pc/h? Yes No����� �����
Is V3 or Vav34 > 1.5 * V12/2 Yes No����� �����
If Yes,V12a = pc/h (Equation 25-18)
Capacity Checks Capacity ChecksActual Capacity LOS F? Actual Capacity LOS F?
VFO 1154 Exhibit 25-7 No
VF Exhibit 25-14VFO = VF - VR Exhibit 25-14
VR Exhibit 25-3
Flow Entering Merge Influence Area Flow Entering Merge Influence AreaActual Max Desirable Violation? Actual Max Desirable Violation?
VR12 1154 Exhibit 25-7 4600:All No V12 Exhibit 25-14Level of Service Determination (if not F) Level of Service Determination (if not F)
DR = 5.475 + 0.00734 v R + 0.0078 V12 - 0.00627 LADR = 8.1 (pc/mi/ln) LOS = A (Exhibit 25-4)
DR = 4.252 + 0.0086 V12 - 0.0009 LD
DR = (pc/mi/ln)LOS = (Exhibit 25-4)
Speed Determination Speed DeterminationMS = 0.263 (Exibit 25-19) SR= 51.6 mph (Exhibit 25-19) S0= N/A mph (Exhibit 25-19) S = 51.6 mph (Exhibit 25-14)
Ds = (Exhibit 25-19) SR= mph (Exhibit 25-19) S0= mph (Exhibit 25-19) S = mph (Exhibit 25-15)
Copyright © 2005 University of Florida, All Rights Reserved HCS+TM Version 5.21 Generated: 7/9/2010 10:07 AM
Page 1 of 1RAMPS AND RAMP JUNCTIONS WORKSHEET
7/9/2010file://C:\Documents and Settings\JMasinick\Local Settings\Temp\r2k2333.tmp
D-141

RAMPS AND RAMP JUNCTIONS WORKSHEETGeneral Information Site Information Analyst Freeway/Dir of Travel Connector Rd/ArterialAgency or Company Michael Baker Jr, Inc Junction WB MergeDate Performed 3/5/2010 JurisdictionAnalysis Time Period PM Analysis Year 2035 Full InterchangeProject Description ROUTE 3 INTERCHANGE ANALYSIS InputsUpstream Adj Ramp
Yes������ On�����
No����� Off������
Lup = 2000 ft
Vu = 1320 veh/h
Terrain: Rolling Downstream Adj Ramp
Yes����� On�����
No������ Off�����
Ldown = ft
VD = veh/h S FF = 55.0 mph SFR = 35.0 mph
Sketch ( show lanes, LA, LD,VR,Vf)
Conversion to pc/h Under Base Conditions (pc/h) V
(Veh/hr) PHF Terrain %Truck %Rv fHV fp v = V/PHF x fHV x fp
Freeway 2410 0.90 Rolling 4 0 0.943 1.00 2838 Ramp 880 0.90 Rolling 4 0 0.943 1.00 1036 UpStream 1320 0.90 Rolling 18 0 0.787 1.00 1863 DownStream
Merge Areas Diverge AreasEstimation of v12 Estimation of v12
V12 = VF ( PFM )LEQ = (Equation 25-2 or 25-3)PFM = 1.000 using Equation (Exhibit 25-5) V12 = 2838 pc/h V3 or Vav34 0 pc/h (Equation 25-4 or 25-5) Is V3 or Vav34 > 2,700 pc/h? Yes No����� ������
Is V3 or Vav34 > 1.5 * V12/2 Yes No����� ������
If Yes,V12a = pc/h (Equation 25-8)
V12 = VR + (VF - VR)PFDLEQ = (Equation 25-8 or 25-9) PFD = using Equation (Exhibit 25-12) V12 = pc/h V3 or Vav34 pc/h (Equation 25-15 or 25-16) Is V3 or Vav34 > 2,700 pc/h? Yes No����� �����
Is V3 or Vav34 > 1.5 * V12/2 Yes No����� �����
If Yes,V12a = pc/h (Equation 25-18)
Capacity Checks Capacity ChecksActual Capacity LOS F? Actual Capacity LOS F?
VFO 3874 Exhibit 25-7 No
VF Exhibit 25-14VFO = VF - VR Exhibit 25-14
VR Exhibit 25-3
Flow Entering Merge Influence Area Flow Entering Merge Influence AreaActual Max Desirable Violation? Actual Max Desirable Violation?
VR12 3874 Exhibit 25-7 4600:All No V12 Exhibit 25-14Level of Service Determination (if not F) Level of Service Determination (if not F)
DR = 5.475 + 0.00734 v R + 0.0078 V12 - 0.00627 LADR = 28.9 (pc/mi/ln) LOS = D (Exhibit 25-4)
DR = 4.252 + 0.0086 V12 - 0.0009 LD
DR = (pc/mi/ln)LOS = (Exhibit 25-4)
Speed Determination Speed DeterminationMS = 0.439 (Exibit 25-19) SR= 49.3 mph (Exhibit 25-19) S0= N/A mph (Exhibit 25-19) S = 49.3 mph (Exhibit 25-14)
Ds = (Exhibit 25-19) SR= mph (Exhibit 25-19) S0= mph (Exhibit 25-19) S = mph (Exhibit 25-15)
Copyright © 2005 University of Florida, All Rights Reserved HCS+TM Version 5.21 Generated: 7/9/2010 10:07 AM
Page 1 of 1RAMPS AND RAMP JUNCTIONS WORKSHEET
7/9/2010file://C:\Documents and Settings\JMasinick\Local Settings\Temp\r2k2339.tmp
D-142
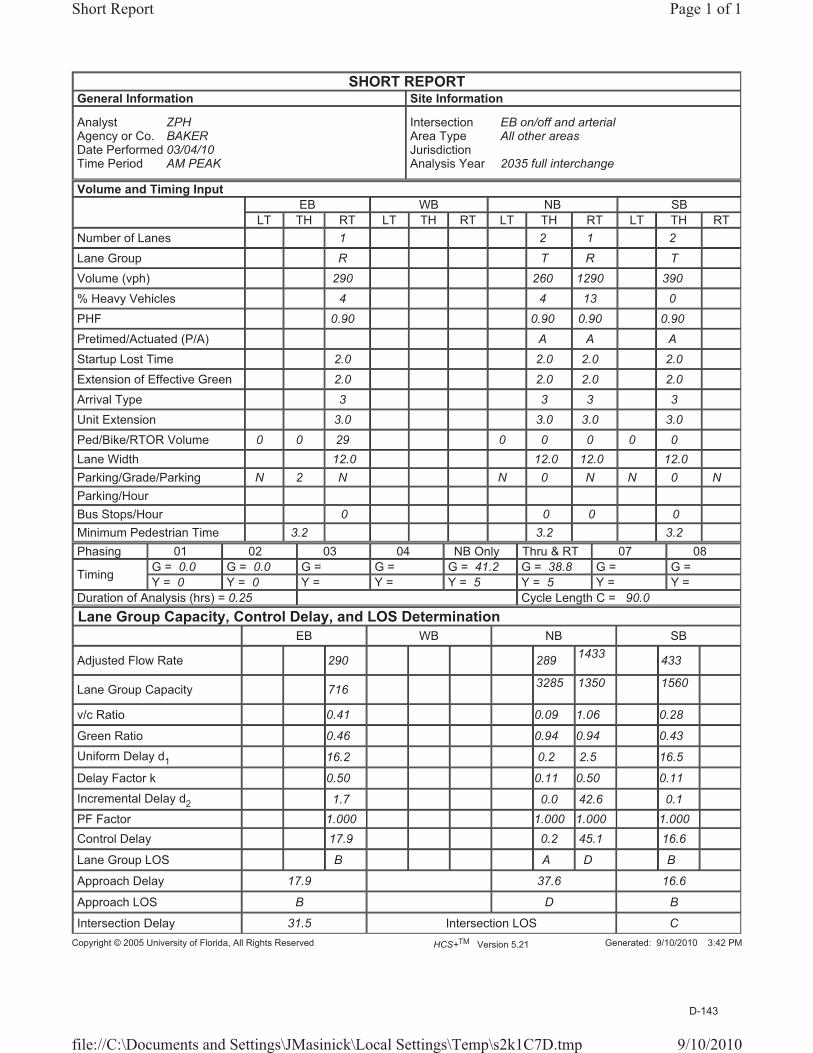
SHORT REPORT General Information Site Information
Analyst ZPH Agency or Co. BAKER Date Performed 03/04/10 Time Period AM PEAK
Intersection EB on/off and arterial Area Type All other areas Jurisdiction Analysis Year 2035 full interchange
Volume and Timing InputEB WB NB SB
LT TH RT LT TH RT LT TH RT LT TH RT Number of Lanes 1 2 1 2 Lane Group R T R T Volume (vph) 290 260 1290 390 % Heavy Vehicles 4 4 13 0 PHF 0.90 0.90 0.90 0.90 Pretimed/Actuated (P/A) A A A Startup Lost Time 2.0 2.0 2.0 2.0 Extension of Effective Green 2.0 2.0 2.0 2.0 Arrival Type 3 3 3 3 Unit Extension 3.0 3.0 3.0 3.0 Ped/Bike/RTOR Volume 0 0 29 0 0 0 0 0 Lane Width 12.0 12.0 12.0 12.0 Parking/Grade/Parking N 2 N N 0 N N 0 N Parking/Hour Bus Stops/Hour 0 0 0 0 Minimum Pedestrian Time 3.2 3.2 3.2 Phasing 01 02 03 04 NB Only Thru & RT 07 08
Timing G = 0.0 G = 0.0 G = G = G = 41.2 G = 38.8 G = G = Y = 0 Y = 0 Y = Y = Y = 5 Y = 5 Y = Y =
Duration of Analysis (hrs) = 0.25 Cycle Length C = 90.0 Lane Group Capacity, Control Delay, and LOS Determination
EB WB NB SB
Adjusted Flow Rate 290 289 1433 433
Lane Group Capacity 716 3285 1350 1560
v/c Ratio 0.41 0.09 1.06 0.28
Green Ratio 0.46 0.94 0.94 0.43
Uniform Delay d1 16.2 0.2 2.5 16.5
Delay Factor k 0.50 0.11 0.50 0.11
Incremental Delay d2 1.7 0.0 42.6 0.1 PF Factor 1.000 1.000 1.000 1.000 Control Delay 17.9 0.2 45.1 16.6
Lane Group LOS B A D B
Approach Delay 17.9 37.6 16.6
Approach LOS B D B
Intersection Delay 31.5 Intersection LOS CCopyright © 2005 University of Florida, All Rights Reserved HCS+TM Version 5.21 Generated: 9/10/2010 3:42 PM
Page 1 of 1Short Report
9/10/2010file://C:\Documents and Settings\JMasinick\Local Settings\Temp\s2k1C7D.tmp
D-143

SHORT REPORT General Information Site Information
Analyst ZPH Agency or Co. BAKER Date Performed 03/04/10 Time Period PM PEAK
Intersection EB on/off and arterial Area Type All other areas Jurisdiction Analysis Year 2035 full interchange
Volume and Timing InputEB WB NB SB
LT TH RT LT TH RT LT TH RT LT TH RT Number of Lanes 1 2 1 2 Lane Group R T R T Volume (vph) 480 880 670 1320 % Heavy Vehicles 4 4 13 0 PHF 0.90 0.90 0.90 0.90 Pretimed/Actuated (P/A) A A A Startup Lost Time 2.0 2.0 2.0 2.0 Extension of Effective Green 2.0 2.0 2.0 2.0 Arrival Type 3 3 3 3 Unit Extension 3.0 3.0 3.0 3.0 Ped/Bike/RTOR Volume 0 0 29 0 0 0 0 0 Lane Width 12.0 12.0 12.0 12.0 Parking/Grade/Parking N 2 N N 0 N N 0 N Parking/Hour Bus Stops/Hour 0 0 0 0 Minimum Pedestrian Time 3.2 3.2 3.2 Phasing 01 02 03 04 NB Only Thru & RT 07 08
Timing G = 0.0 G = 0.0 G = G = G = 40.0 G = 42.0 G = G = Y = 0 Y = 0 Y = Y = Y = 5 Y = 5 Y = Y =
Duration of Analysis (hrs) = 0.25 Cycle Length C = 92.0 Lane Group Capacity, Control Delay, and LOS Determination
EB WB NB SB
Adjusted Flow Rate 501 978 744 1467
Lane Group Capacity 680 3289 1351 1652
v/c Ratio 0.74 0.30 0.55 0.89
Green Ratio 0.43 0.95 0.95 0.46
Uniform Delay d1 21.6 0.2 0.3 22.9
Delay Factor k 0.50 0.11 0.15 0.41
Incremental Delay d2 7.0 0.1 0.5 6.3 PF Factor 1.000 1.000 1.000 1.000 Control Delay 28.6 0.2 0.8 29.2
Lane Group LOS C A A C
Approach Delay 28.6 0.5 29.2
Approach LOS C A C
Intersection Delay 15.7 Intersection LOS BCopyright © 2005 University of Florida, All Rights Reserved HCS+TM Version 5.21 Generated: 7/6/2010 2:09 PM
Page 1 of 1Short Report
7/6/2010file://C:\Documents and Settings\JMasinick\Local Settings\Temp\s2k1651.tmp
D-144

SHORT REPORT General Information Site Information
Analyst ZPH Agency or Co. BAKER Date Performed 03/04/10 Time Period AM PEAK
Intersection WB on/off and arterial Area Type All other areas Jurisdiction Analysis Year 2035 full interchange
Volume and Timing InputEB WB NB SB
LT TH RT LT TH RT LT TH RT LT TH RT Number of Lanes 2 2 Lane Group L L Volume (vph) 390 260 % Heavy Vehicles 18 4 PHF 0.90 0.90 Pretimed/Actuated (P/A) P A Startup Lost Time 2.0 2.0 Extension of Effective Green 2.0 2.0 Arrival Type 3 3 Unit Extension 3.0 3.0 Ped/Bike/RTOR Volume 0 0 0 0 Lane Width 12.0 12.0 Parking/Grade/Parking N 2 N N 0 N Parking/Hour Bus Stops/Hour 0 0 Minimum Pedestrian Time 3.2 3.2 Phasing WB Only 02 03 04 NB Only 06 07 08
Timing G = 54.9 G = 0.0 G = 0.0 G = G = 25.1 G = 0.0 G = G = Y = 5 Y = 0 Y = 0 Y = Y = 5 Y = 0 Y = Y =
Duration of Analysis (hrs) = 0.25 Cycle Length C = 90.0 Lane Group Capacity, Control Delay, and LOS Determination
EB WB NB SB Adjusted Flow Rate 433 289
Lane Group Capacity 1794 940
v/c Ratio 0.24 0.31
Green Ratio 0.61 0.28
Uniform Delay d1 8.0 25.6
Delay Factor k 0.50 0.11
Incremental Delay d2 0.3 0.2 PF Factor 1.000 1.000 Control Delay 8.3 25.8
Lane Group LOS A C
Approach Delay 8.3 25.8
Approach LOS A C
Intersection Delay 15.3 Intersection LOS BCopyright © 2005 University of Florida, All Rights Reserved HCS+TM Version 5.21 Generated: 7/6/2010 2:10 PM
Page 1 of 1Short Report
7/6/2010file://C:\Documents and Settings\JMasinick\Local Settings\Temp\s2k1663.tmp
D-145

SHORT REPORT General Information Site Information
Analyst ZPH Agency or Co. BAKER Date Performed 03/04/10 Time Period PM PEAK
Intersection WB on/off and arterial Area Type All other areas Jurisdiction Analysis Year 2035 full interchange
Volume and Timing InputEB WB NB SB
LT TH RT LT TH RT LT TH RT LT TH RT Number of Lanes 2 2 Lane Group L L Volume (vph) 1320 880 % Heavy Vehicles 18 4 PHF 0.90 0.90 Pretimed/Actuated (P/A) P A Startup Lost Time 2.0 2.0 Extension of Effective Green 2.0 2.0 Arrival Type 3 3 Unit Extension 3.0 3.0 Ped/Bike/RTOR Volume 0 0 0 0 Lane Width 12.0 12.0 Parking/Grade/Parking N 2 N N 0 N Parking/Hour Bus Stops/Hour 0 0 Minimum Pedestrian Time 3.2 3.2 Phasing WB Only 02 03 04 NB Only 06 07 08
Timing G = 48.6 G = 0.0 G = 0.0 G = G = 31.4 G = 0.0 G = G = Y = 5 Y = 0 Y = 0 Y = Y = 5 Y = 0 Y = Y =
Duration of Analysis (hrs) = 0.25 Cycle Length C = 90.0 Lane Group Capacity, Control Delay, and LOS Determination
EB WB NB SB
Adjusted Flow Rate 1467 978
Lane Group Capacity 1588 1176
v/c Ratio 0.92 0.83
Green Ratio 0.54 0.35
Uniform Delay d1 19.0 26.9
Delay Factor k 0.50 0.37
Incremental Delay d2 10.5 5.2 PF Factor 1.000 1.000 Control Delay 29.5 32.1
Lane Group LOS C C
Approach Delay 29.5 32.1
Approach LOS C C
Intersection Delay 30.5 Intersection LOS CCopyright © 2005 University of Florida, All Rights Reserved HCS+TM Version 5.21 Generated: 7/6/2010 2:14 PM
Page 1 of 1Short Report
7/6/2010file://C:\Documents and Settings\JMasinick\Local Settings\Temp\s2k1675.tmp
D-146

Route 3 / Connector Road Interchange Operations
D-147


SHORT REPORT General Information Site Information
Analyst ZPH Agency or Co. BAKER Date Performed 03/04/10 Time Period AM PEAK
Intersection RTE 3 / GORDON INT Area Type All other areas Jurisdiction Analysis Year 2035
Volume and Timing InputEB WB NB SB
LT TH RT LT TH RT LT TH RT LT TH RT Number of Lanes 1 1 1 0 1 1 1 3 0 1 2 1 Lane Group L LT R LT R L TR L T R Volume (vph) 50 20 140 10 10 30 50 1280 20 20 290 40 % Heavy Vehicles 4 4 4 4 4 4 4 4 4 4 4 4 PHF 0.90 0.90 0.90 0.90 0.90 0.90 0.90 0.90 0.90 0.90 0.90 0.90 Pretimed/Actuated (P/A) A A A A A A A P P A P P Startup Lost Time 2.0 2.0 2.0 2.0 2.0 2.0 2.0 2.0 2.0 2.0 Extension of Effective Green 2.0 2.0 2.0 2.0 2.0 2.0 2.0 2.0 2.0 2.0 Arrival Type 3 3 3 3 3 3 3 3 3 3 Unit Extension 3.0 3.0 3.0 3.0 3.0 3.0 3.0 3.0 3.0 3.0 Ped/Bike/RTOR Volume 0 0 44 0 0 3 0 0 0 0 0 20 Lane Width 12.0 12.0 12.0 12.0 12.0 12.0 12.0 12.0 12.0 12.0 Parking/Grade/Parking N 0 N N 0 N N 0 N N 0 N Parking/Hour Bus Stops/Hour 0 0 0 0 0 0 0 0 0 0 Minimum Pedestrian Time 3.2 3.2 3.2 3.2 Phasing EB Only WB Only 03 04 Excl. Left Thru & RT 07 08
Timing G = 28.9 G = 8.0 G = 0.0 G = 0.0 G = 10.0 G = 53.1 G = 0.0 G = 0.0 Y = 5 Y = 5 Y = 0 Y = 0 Y = 5 Y = 5 Y = 0 Y = 0
Duration of Analysis (hrs) = 0.25 Cycle Length C = 120.0 Lane Group Capacity, Control Delay, and LOS Determination
EB WB NB SB
Adjusted Flow Rate 56 22 107 22 30 56 1444 22 322 22
Lane Group Capacity 418 440 374 119 104 145 2197 145 1539 687
v/c Ratio 0.13 0.05 0.29 0.18 0.29 0.39 0.66 0.15 0.21 0.03
Green Ratio 0.24 0.24 0.24 0.07 0.07 0.08 0.44 0.08 0.44 0.44
Uniform Delay d1 35.7 35.0 37.1 52.9 53.3 52.1 26.3 51.1 20.6 18.9
Delay Factor k 0.11 0.11 0.11 0.11 0.11 0.11 0.50 0.11 0.50 0.50
Incremental Delay d2 0.1 0.0 0.4 0.8 1.5 1.7 1.6 0.5 0.3 0.1 PF Factor 1.000 1.000 1.000 1.000 1.000 1.000 1.000 1.000 1.000 1.000 Control Delay 35.9 35.0 37.6 53.7 54.8 53.8 27.9 51.6 20.9 19.0
Lane Group LOS D D D D D D C D C B
Approach Delay 36.8 54.3 28.8 22.6
Approach LOS D D C C
Intersection Delay 29.1 Intersection LOS CCopyright © 2005 University of Florida, All Rights Reserved HCS+TM Version 5.21 Generated: 7/6/2010 3:07 PM
Page 1 of 1Short Report
7/6/2010file://C:\Documents and Settings\JMasinick\Local Settings\Temp\s2k16EA.tmp
D-148

SHORT REPORT General Information Site Information
Analyst ZPH Agency or Co. BAKER Date Performed 03/04/10 Time Period PM PEAK
Intersection RTE 3 / GORDON INT Area Type All other areas Jurisdiction Analysis Year 2035
Volume and Timing InputEB WB NB SB
LT TH RT LT TH RT LT TH RT LT TH RT Number of Lanes 1 1 1 0 1 1 1 3 0 1 2 1 Lane Group L LT R LT R L TR L T R Volume (vph) 50 20 420 10 10 30 50 590 20 20 1300 200 % Heavy Vehicles 4 4 4 4 4 4 4 4 4 4 4 4 PHF 0.90 0.90 0.90 0.90 0.90 0.90 0.90 0.90 0.90 0.90 0.90 0.90 Pretimed/Actuated (P/A) A A A A A A A P P A P P Startup Lost Time 2.0 2.0 2.0 2.0 2.0 2.0 2.0 2.0 2.0 2.0 Extension of Effective Green 2.0 2.0 2.0 2.0 2.0 2.0 2.0 2.0 2.0 2.0 Arrival Type 3 3 3 3 3 3 3 3 3 3 Unit Extension 3.0 3.0 3.0 3.0 3.0 3.0 3.0 3.0 3.0 3.0 Ped/Bike/RTOR Volume 0 0 0 0 0 0 0 0 0 0 0 0 Lane Width 12.0 12.0 12.0 12.0 12.0 12.0 12.0 12.0 12.0 12.0 Parking/Grade/Parking N 0 N N 0 N N 0 N N 0 N Parking/Hour Bus Stops/Hour 0 0 0 0 0 0 0 0 0 0 Minimum Pedestrian Time 3.2 3.2 3.2 3.2 Phasing EB Only WB Only 03 04 Excl. Left Thru & RT 07 08
Timing G = 31.0 G = 7.0 G = 0.0 G = 0.0 G = 8.0 G = 54.0 G = 0.0 G = 0.0 Y = 5 Y = 5 Y = 0 Y = 0 Y = 5 Y = 5 Y = 0 Y = 0
Duration of Analysis (hrs) = 0.25 Cycle Length C = 120.0 Lane Group Capacity, Control Delay, and LOS Determination
EB WB NB SB
Adjusted Flow Rate 56 22 467 22 33 56 678 22 1444 222
Lane Group Capacity 448 472 401 104 91 116 2228 116 1565 699
v/c Ratio 0.13 0.05 1.16 0.21 0.36 0.48 0.30 0.19 0.92 0.32
Green Ratio 0.26 0.26 0.26 0.06 0.06 0.07 0.45 0.07 0.45 0.45
Uniform Delay d1 34.1 33.4 44.5 53.9 54.4 54.0 21.0 52.9 31.0 21.2
Delay Factor k 0.11 0.11 0.50 0.11 0.11 0.11 0.50 0.11 0.50 0.50
Incremental Delay d2 0.1 0.0 98.1 1.0 2.5 3.1 0.4 0.8 10.5 1.2 PF Factor 1.000 1.000 1.000 1.000 1.000 1.000 1.000 1.000 1.000 1.000 Control Delay 34.2 33.4 142.6 54.9 56.8 57.1 21.4 53.7 41.6 22.4
Lane Group LOS C C F D E E C D D C
Approach Delay 127.0 56.0 24.1 39.2
Approach LOS F E C D
Intersection Delay 51.7 Intersection LOS DCopyright © 2005 University of Florida, All Rights Reserved HCS+TM Version 5.21 Generated: 7/6/2010 3:09 PM
Page 1 of 1Short Report
7/6/2010file://C:\Documents and Settings\JMasinick\Local Settings\Temp\s2k1721.tmp
D-149
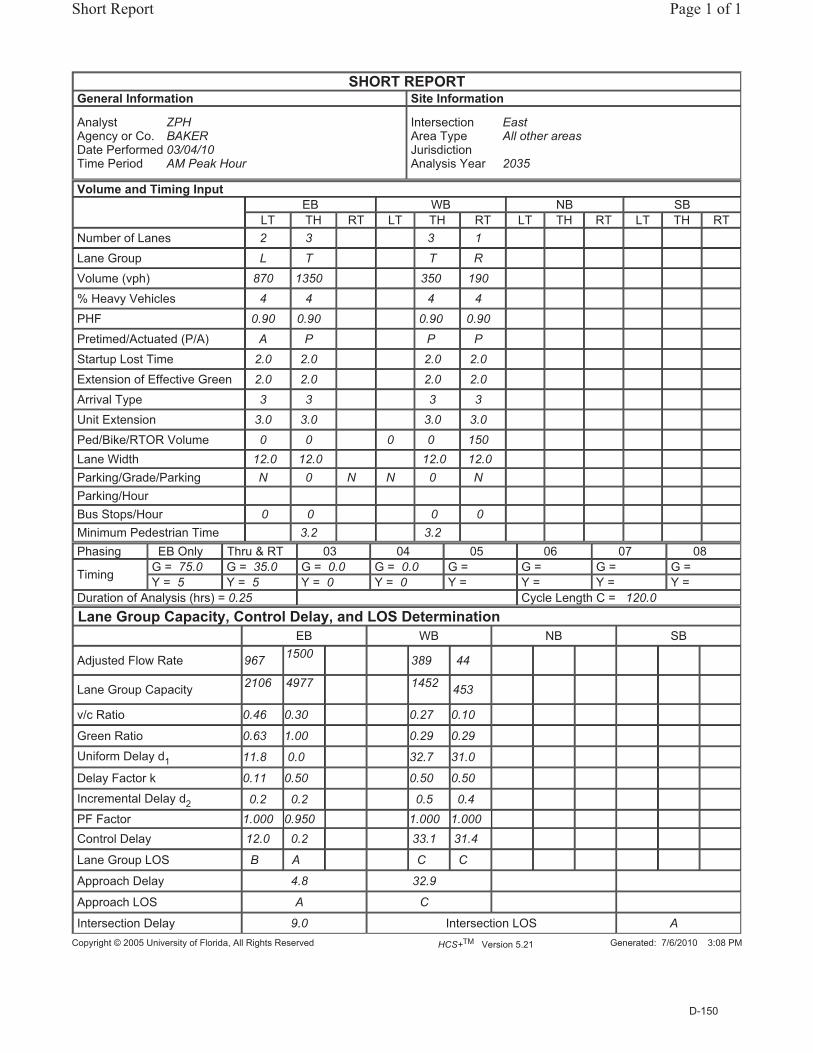
SHORT REPORT General Information Site Information
Analyst ZPH Agency or Co. BAKER Date Performed 03/04/10 Time Period AM Peak Hour
Intersection East Area Type All other areas Jurisdiction Analysis Year 2035
Volume and Timing InputEB WB NB SB
LT TH RT LT TH RT LT TH RT LT TH RT Number of Lanes 2 3 3 1 Lane Group L T T R Volume (vph) 870 1350 350 190 % Heavy Vehicles 4 4 4 4 PHF 0.90 0.90 0.90 0.90 Pretimed/Actuated (P/A) A P P P Startup Lost Time 2.0 2.0 2.0 2.0 Extension of Effective Green 2.0 2.0 2.0 2.0 Arrival Type 3 3 3 3 Unit Extension 3.0 3.0 3.0 3.0 Ped/Bike/RTOR Volume 0 0 0 0 150 Lane Width 12.0 12.0 12.0 12.0 Parking/Grade/Parking N 0 N N 0 N Parking/Hour Bus Stops/Hour 0 0 0 0 Minimum Pedestrian Time 3.2 3.2 Phasing EB Only Thru & RT 03 04 05 06 07 08
Timing G = 75.0 G = 35.0 G = 0.0 G = 0.0 G = G = G = G = Y = 5 Y = 5 Y = 0 Y = 0 Y = Y = Y = Y =
Duration of Analysis (hrs) = 0.25 Cycle Length C = 120.0 Lane Group Capacity, Control Delay, and LOS Determination
EB WB NB SB
Adjusted Flow Rate 967 1500 389 44
Lane Group Capacity 2106 4977 1452 453
v/c Ratio 0.46 0.30 0.27 0.10
Green Ratio 0.63 1.00 0.29 0.29
Uniform Delay d1 11.8 0.0 32.7 31.0
Delay Factor k 0.11 0.50 0.50 0.50
Incremental Delay d2 0.2 0.2 0.5 0.4 PF Factor 1.000 0.950 1.000 1.000 Control Delay 12.0 0.2 33.1 31.4
Lane Group LOS B A C C
Approach Delay 4.8 32.9
Approach LOS A C
Intersection Delay 9.0 Intersection LOS ACopyright © 2005 University of Florida, All Rights Reserved HCS+TM Version 5.21 Generated: 7/6/2010 3:08 PM
Page 1 of 1Short Report
7/6/2010file://C:\Documents and Settings\JMasinick\Local Settings\Temp\s2k16FD.tmp
D-150

SHORT REPORT General Information Site Information
Analyst ZPH Agency or Co. BAKER Date Performed 03/04/10 Time Period PM Peak Hour
Intersection East Area Type All other areas Jurisdiction Analysis Year 2035
Volume and Timing InputEB WB NB SB
LT TH RT LT TH RT LT TH RT LT TH RT Number of Lanes 2 3 3 1 Lane Group L T T R Volume (vph) 790 720 1140 210 % Heavy Vehicles 4 4 4 4 PHF 0.90 0.90 0.90 0.90 Pretimed/Actuated (P/A) A P P P Startup Lost Time 2.0 2.0 2.0 2.0 Extension of Effective Green 2.0 2.0 2.0 2.0 Arrival Type 3 3 3 3 Unit Extension 3.0 3.0 3.0 3.0 Ped/Bike/RTOR Volume 0 0 0 0 180 Lane Width 12.0 12.0 12.0 12.0 Parking/Grade/Parking N 0 N N 0 N Parking/Hour Bus Stops/Hour 0 0 0 0 Minimum Pedestrian Time 3.2 3.2 Phasing EB Only Thru & RT 03 04 05 06 07 08
Timing G = 50.0 G = 60.0 G = 0.0 G = 0.0 G = G = G = G = Y = 5 Y = 5 Y = 0 Y = 0 Y = Y = Y = Y =
Duration of Analysis (hrs) = 0.25 Cycle Length C = 120.0 Lane Group Capacity, Control Delay, and LOS Determination
EB WB NB SB
Adjusted Flow Rate 878 800 1267 33
Lane Group Capacity 1404 4977 2489 777
v/c Ratio 0.63 0.16 0.51 0.04
Green Ratio 0.42 1.00 0.50 0.50
Uniform Delay d1 27.6 0.0 20.1 15.3
Delay Factor k 0.21 0.50 0.50 0.50
Incremental Delay d2 0.9 0.1 0.7 0.1 PF Factor 1.000 0.950 1.000 1.000 Control Delay 28.5 0.1 20.9 15.4
Lane Group LOS C A C B
Approach Delay 14.9 20.7
Approach LOS B C
Intersection Delay 17.5 Intersection LOS BCopyright © 2005 University of Florida, All Rights Reserved HCS+TM Version 5.21 Generated: 7/6/2010 3:09 PM
Page 1 of 1Short Report
7/6/2010file://C:\Documents and Settings\JMasinick\Local Settings\Temp\s2k1733.tmp
D-151

SHORT REPORT General Information Site Information
Analyst ZPH Agency or Co. BAKER Date Performed 03/04/10 Time Period AM Peak
Intersection West Area Type All other areas Jurisdiction Analysis Year 2035
Volume and Timing InputEB WB NB SB
LT TH RT LT TH RT LT TH RT LT TH RT Number of Lanes 3 1 1 4 1 Lane Group T R L T R Volume (vph) 2180 100 60 920 40 % Heavy Vehicles 4 4 4 4 4 PHF 0.90 0.90 0.90 0.90 0.90 Pretimed/Actuated (P/A) P P A P Startup Lost Time 2.0 2.0 2.0 2.0 2.0 Extension of Effective Green 2.0 2.0 2.0 2.0 2.0 Arrival Type 3 3 3 3 3 Unit Extension 3.0 3.0 3.0 3.0 3.0 Ped/Bike/RTOR Volume 0 0 0 0 0 0 0 30 Lane Width 12.0 12.0 12.0 12.0 12.0 Parking/Grade/Parking N 0 N N 0 N N 0 N Parking/Hour Bus Stops/Hour 0 0 0 0 0 Minimum Pedestrian Time 3.2 3.2 3.2 Phasing WB Only Thru & RT 03 04 05 06 07 08
Timing G = 10.0 G = 100.0 G = 0.0 G = 0.0 G = G = G = G =
Y = 5 Y = 5 Y = 0 Y = 0 Y = Y = Y = Y = Duration of Analysis (hrs) = 0.25 Cycle Length C = 120.0 Lane Group Capacity, Control Delay, and LOS Determination
EB WB NB SB
Adjusted Flow Rate 2422 111 67 1022 11
Lane Group Capacity 4147 1294 145 6635 132
v/c Ratio 0.58 0.09 0.46 0.15 0.08
Green Ratio 0.83 0.83 0.08 1.00 0.08
Uniform Delay d1 3.2 1.8 52.4 0.0 50.8
Delay Factor k 0.50 0.50 0.11 0.50 0.11
Incremental Delay d2 0.6 0.1 2.3 0.0 0.3 PF Factor 1.000 1.000 1.000 0.950 1.000 Control Delay 3.9 1.9 54.8 0.0 51.0
Lane Group LOS A A D A D
Approach Delay 3.8 3.4 51.0
Approach LOS A A D
Intersection Delay 3.8 Intersection LOS ACopyright © 2005 University of Florida, All Rights Reserved HCS+TM Version 5.21 Generated: 7/6/2010 3:08 PM
Page 1 of 1Short Report
7/6/2010file://C:\Documents and Settings\JMasinick\Local Settings\Temp\s2k170F.tmp
D-152

SHORT REPORT General Information Site Information
Analyst ZPH Agency or Co. BAKER Date Performed 03/04/10 Time Period PM Peak
Intersection West Area Type All other areas Jurisdiction Analysis Year 2035
Volume and Timing InputEB WB NB SB
LT TH RT LT TH RT LT TH RT LT TH RT Number of Lanes 3 1 1 4 1 Lane Group T R L T R Volume (vph) 1310 110 330 2600 200 % Heavy Vehicles 4 4 4 4 4 PHF 0.90 0.90 0.90 0.90 0.90 Pretimed/Actuated (P/A) P P A P Startup Lost Time 2.0 2.0 2.0 2.0 2.0 Extension of Effective Green 2.0 2.0 2.0 2.0 2.0 Arrival Type 3 3 3 3 3 Unit Extension 3.0 3.0 3.0 3.0 3.0 Ped/Bike/RTOR Volume 0 0 11 0 0 0 0 150 Lane Width 12.0 12.0 12.0 12.0 12.0 Parking/Grade/Parking N 0 N N 0 N N 0 N Parking/Hour Bus Stops/Hour 0 0 0 0 0 Minimum Pedestrian Time 3.2 3.2 3.2 Phasing WB Only Thru & RT 03 04 05 06 07 08
Timing G = 31.8 G = 78.2 G = 0.0 G = 0.0 G = G = G = G = Y = 5 Y = 5 Y = 0 Y = 0 Y = Y = Y = Y =
Duration of Analysis (hrs) = 0.25 Cycle Length C = 120.0 Lane Group Capacity, Control Delay, and LOS Determination
EB WB NB SB
Adjusted Flow Rate 1456 110 367 2889 56
Lane Group Capacity 3243 1012 460 6635 419
v/c Ratio 0.45 0.11 0.80 0.44 0.13
Green Ratio 0.65 0.65 0.26 1.00 0.26
Uniform Delay d1 10.3 7.8 41.1 0.0 33.6
Delay Factor k 0.50 0.50 0.34 0.50 0.11
Incremental Delay d2 0.5 0.2 9.6 0.2 0.1 PF Factor 1.000 1.000 1.000 0.950 1.000 Control Delay 10.7 8.1 50.7 0.2 33.7
Lane Group LOS B A D A C
Approach Delay 10.6 5.9 33.7
Approach LOS B A C
Intersection Delay 7.7 Intersection LOS ACopyright © 2005 University of Florida, All Rights Reserved HCS+TM Version 5.21 Generated: 7/6/2010 3:09 PM
Page 1 of 1Short Report
7/6/2010file://C:\Documents and Settings\JMasinick\Local Settings\Temp\s2k1745.tmp
D-153