Embed Size (px)
Citation preview
prepared forprepared for
Massachusetts Executive Office of Public Massachusetts Executive Office of Public Safety and SecuritySafety and Security
Office of Grants and Research, Highway Safety Office of Grants and Research, Highway Safety DivisionDivision
Presented byPresented by
Cindy Campbell, Highway Safety DivisionCindy Campbell, Highway Safety Division
January 11, 2011January 11, 2011
Traffic Safety in MassachusettsState of the State

2
Agenda
State of the State – Update of Preliminary 2009 Data
The Many Uses of Traffic Safety Data
HSD Program Areas
Note: All 2009 data presented is preliminary.

3
Massachusetts Fatalities10 Year Trend
414433
477459 462 476
441 429 434
364347
0
50
100
150
200
250
300
350
400
450
500
1999 2000 2001 2002 2003 2004 2005 2006 2007 2008 2009
Fatalities
FatalitiesSource: FARS.

4
Massachusetts Serious Injuries5 Year Trend
5033 50524579
4182 3983
3193
0
1000
2000
3000
4000
5000
6000
2004 2005 2006 2007 2008 2009
Fatalities
FatalitiesSource: CDS.

5
Massachusetts Traffic Safety Trends
2009 fatality rate per 100 million vehicle miles traveled (VMT) 0.79
• Lowest fatality rate in U.S.
0.0
0.2
0.4
0.6
0.8
1.0
1.2
1.4
1.6
1.8
1996
1997
1998
1999
2000
2001
2002
2003
2004
2005
2006
2007
2008
2009
Fatality Rate per 100M VMT
MA Fatality Rate U.S. Fatality Rate
Source: CDS, Traffic Safety Facts, NHTSA.

6
Fatal Crashes by Month As Percent of Total2009
0.0%
2.0%
4.0%
6.0%
8.0%
10.0%
12.0%
14.0%
16.0%
Jan
Feb Mar Apr
May
June
Jul
AugSep
tO
ctNov Dec
% of FatalitiesSource: CDS.

7
Fatal Crashes by Day-of-Week as Percent of Total - 2009
0.0%
5.0%
10.0%
15.0%
20.0%
25.0%
Sun Mon Tues Wed Thurs Fri Sat
% of FatalitiesSource: CDS.

8
Fatal Crashes by Time-of-Day as Percent of Total - 2009
0.0%
2.0%
4.0%
6.0%
8.0%
10.0%
12.0%
14.0%
16.0%
12-2
:59A
M
3-5:
59AM
6-8:
59AM
9-11
:59A
M
12-2
:59P
M
3-5:
59PM
6-8:
59PM
9-11
:59P
M
% of FatalitiesSource: CDS.

9
Massachusetts Fatal Crashes2007 – to be updated
Source: CDS.
10
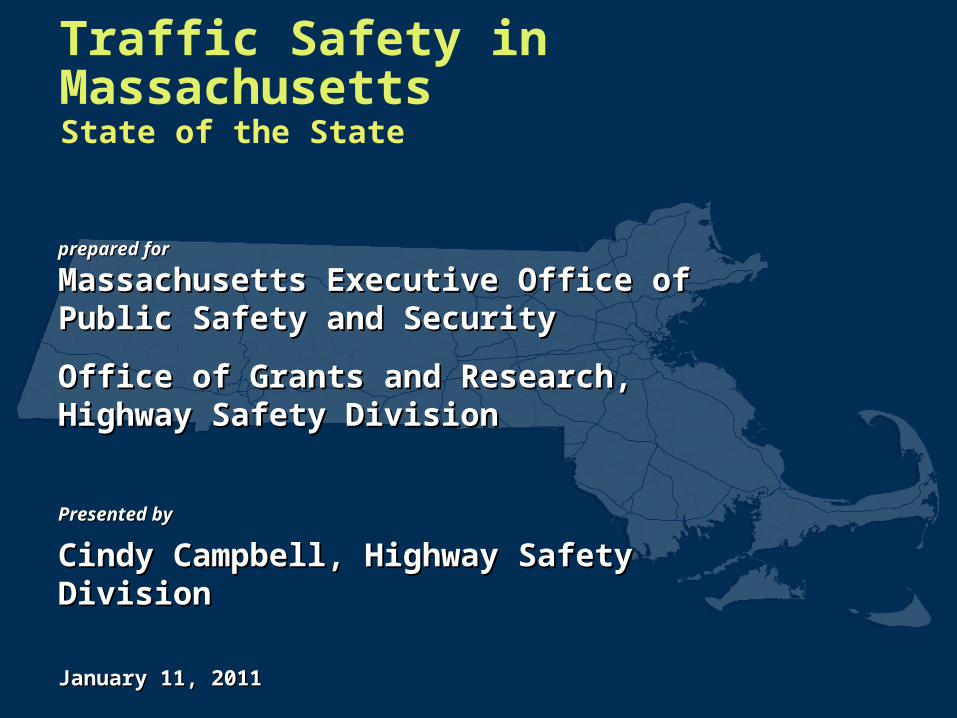
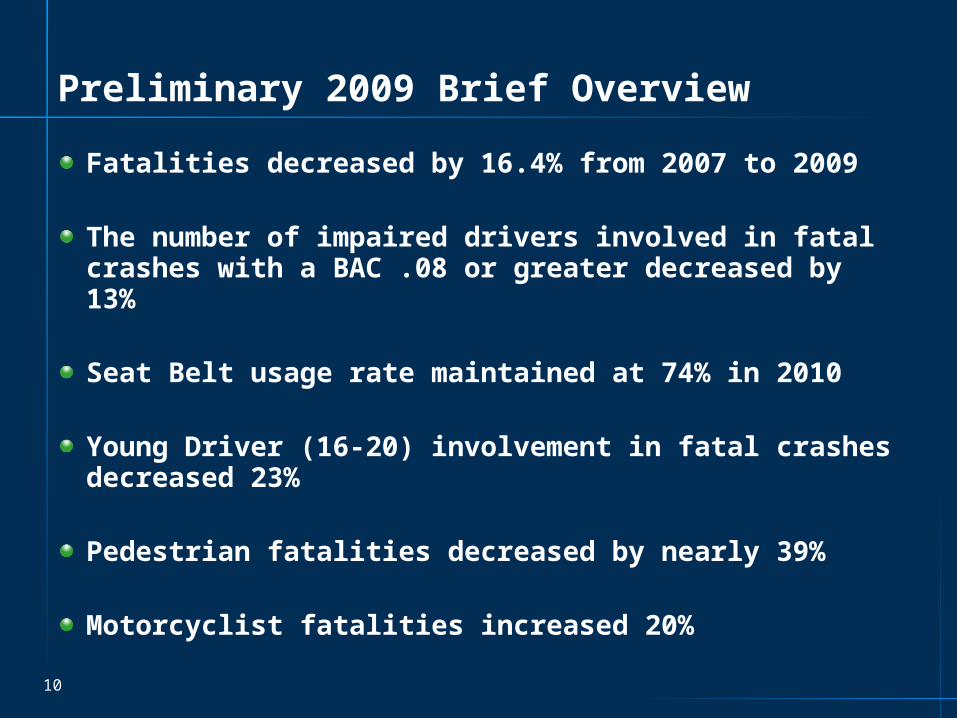
Preliminary 2009 Brief Overview
Fatalities decreased by 16.4% from 2007 to 2009
The number of impaired drivers involved in fatal crashes with a BAC .08 or greater decreased by 13%
Seat Belt usage rate maintained at 74% in 2010
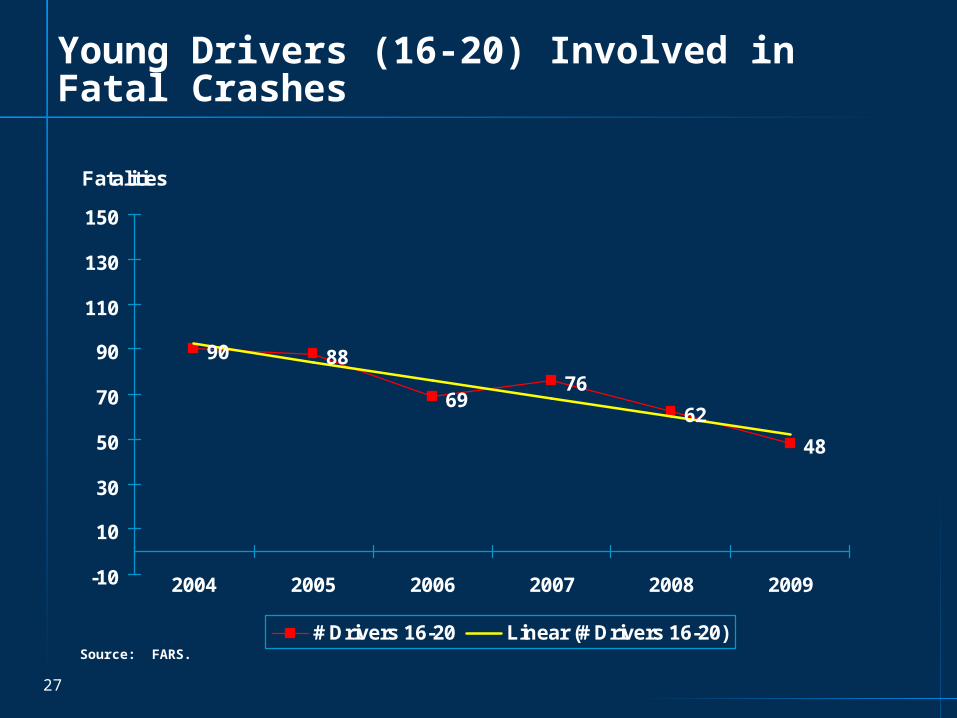
Young Driver (16-20) involvement in fatal crashes decreased 23%
Pedestrian fatalities decreased by nearly 39%
Motorcyclist fatalities increased 20%
The Many Uses of Traffic Safety Data

12
Data Types and Sources
Data TypeData Type Data SetData Set Source/OwnerSource/Owner
FatalityFatality Fatality Analysis Reporting System (FARS)
National Highway Traffic Safety Administration (NHTSA)
Crash and InjuryCrash and Injury Crash Data System (CDS) Registry of Motor Vehicles
ViolationViolation Citation Database Merit Rating Board
Hospital Hospital DischargeDischarge
Inpatient Discharge Department of Health Care Finance and Policy/Department of Public Health
Licensed Drivers, Licensed Drivers, Motor Vehicle Motor Vehicle RegistrationsRegistrations
ALARS Registry of Motor Vehicles
RoadwayRoadway Road Inventory File Massachusetts DOT
Safety Belt UseSafety Belt Use Survey Data EOPSS – HSD
Enforcement DataEnforcement Data Mobilization Results EOPSS – HSD
13
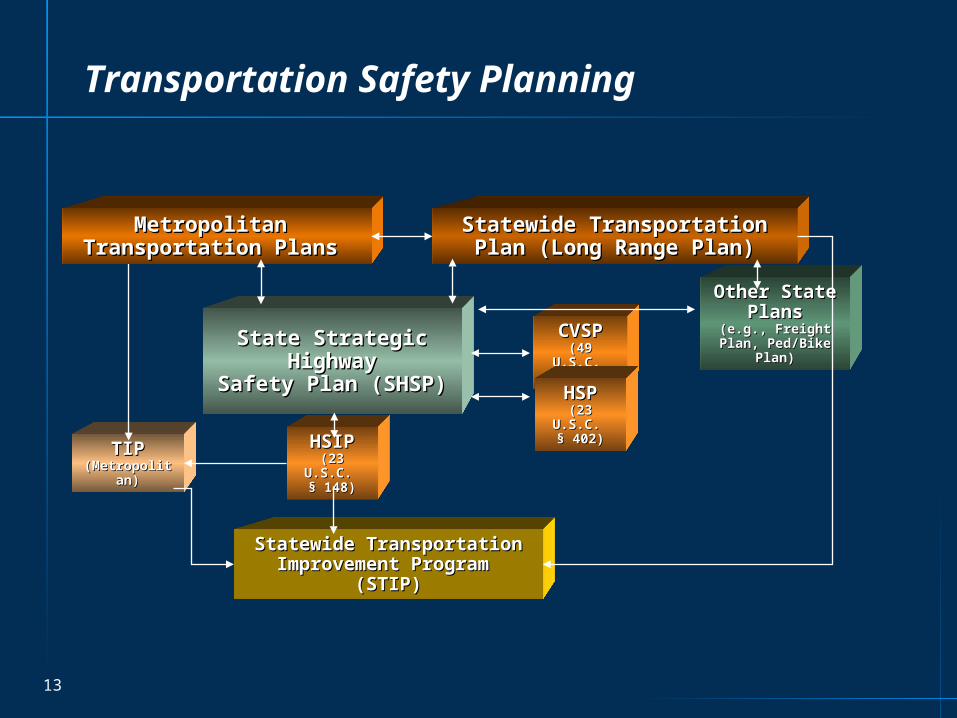
Transportation Safety Planning
TIPTIP(Metropolitan)(Metropolitan)
Statewide Transportation Plan Statewide Transportation Plan (Long Range Plan)(Long Range Plan)
Metropolitan Metropolitan Transportation Plans Transportation Plans
State Strategic State Strategic HighwayHighway
Safety Plan (SHSP)Safety Plan (SHSP)
HSIPHSIP(23 U.S.C. (23 U.S.C.
§ 148)§ 148)
CVSPCVSP(49 U.S.C. (49 U.S.C. § 31102)§ 31102)
HSPHSP(23 U.S.C. (23 U.S.C.
§ 402)§ 402)
Statewide Transportation Statewide Transportation Improvement Program Improvement Program
(STIP)(STIP)
Other State Other State PlansPlans
(e.g., Freight Plan, (e.g., Freight Plan, Ped/Bike Plan)Ped/Bike Plan)

14
engineers
transportationplanners
educators
emergencyresponders
highway safetypractitioners
datacollectors &
analysts
lawenforcement
datamanagers
judiciary
advocacygroups
private sectororganizations
Road SafetyStakeholders

15
Multiple Agencies Use Traffic Safety Data
Data-driven Decision Making - Accountability
Problem Identification
Resource Allocation
• Roadway Improvements
• Equipment
• Staffing
Countermeasure Selection and Evaluation
Program Evaluation - Is what we’re doing working?
Traffic Safety Is Public Safety

How HSD Uses Traffic Safety Data for Programming

17
Highway Safety Division (HSD) Partnerships
Executive Leadership and Steering Committees of the Strategic Highway Safety Plan (SHSP)
Massachusetts Bicycle and Pedestrian Advisory Board
Safe Routes to School Task Force
Preventing Injuries Now! Network (PINN)
Partners in Passenger Safety (PPS)
Traffic Records Coordinating Committee (TRCC)
And many others. . .

18
HSD Program Areas
Traffic Records
Occupant Protection
Impaired Driving
Speeding and Distracted Driving
Paid and Earned Media
Higher Risk Transportation System Users
• Young Drivers
• Older Drivers
• Pedestrians
• Bicyclists
• Motorcyclists
19
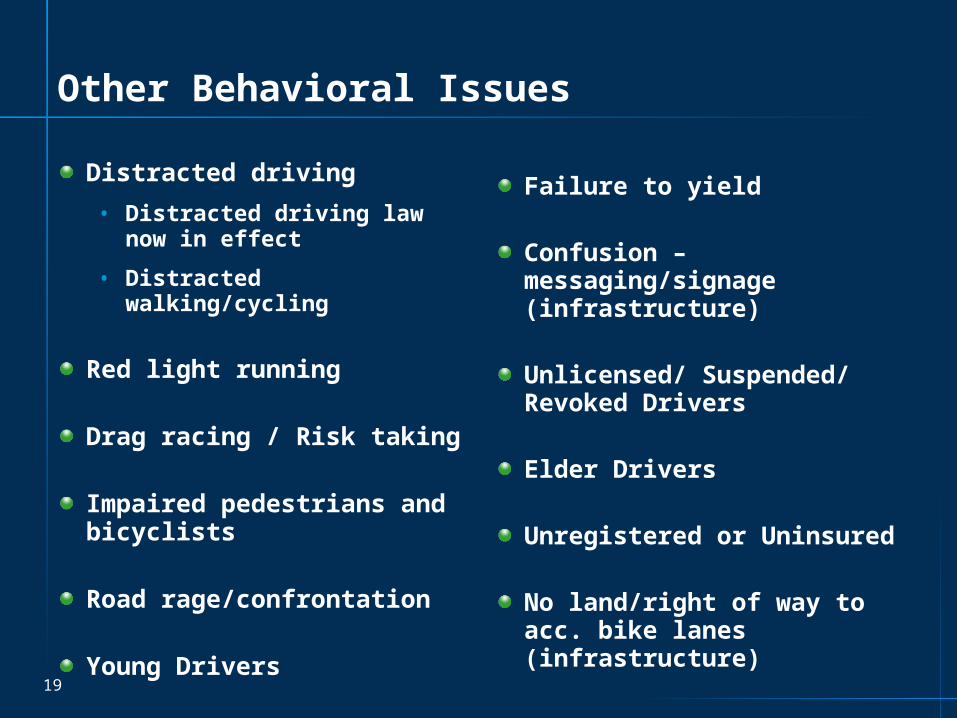
Other Behavioral Issues
Distracted driving
• Distracted driving law now in effect
• Distracted walking/cycling
Red light running
Drag racing / Risk taking
Impaired pedestrians and bicyclists
Road rage/confrontation
Young Drivers
Failure to yield
Confusion – messaging/signage (infrastructure)
Unlicensed/ Suspended/ Revoked Drivers
Elder Drivers
Unregistered or Uninsured
No land/right of way to acc. bike lanes (infrastructure)

20
Traffic Record Information System Challenges
Data Quality
• Electronic capture of data
• Electronic reporting to RMV
Timeliness of Reporting to RMV
• Chapter 90, Section 29
• requires the chief officer of the police department supervising the accident investigation to notify the Registrar within 15 days
System Integration

21
Occupant Protection
74% usage rate in 2010
• Highest rate recorded in MA
• Increase from 67% in 2007
• National average in secondary enforcement states – 77%
Source: 2010 Massachusetts Safety Belt Usage Observation Survey.
0
20
40
60
80
100
2003 2004 2005 2006 2007 2008 2009 2010
Year
Percentage
MA National

22
2009 vs. 2010 Usage RatesVehicle Type
VehicleVehicle 2009 Rate2009 Rate 2010 Rate2010 Rate
Pickup TruckPickup Truck 61%61% 58%58%
Commercial VehicleCommercial Vehicle 50%50% 51%51%
SUVSUV 77%77% 78%78%
VanVan 80%80% 80%80%
Passenger VehiclePassenger Vehicle 76%76% 77%77%
Source: 2009 and 2010 Massachusetts Safety Belt Usage Observation Surveys.

23
2009 vs. 2010 Usage RatesOccupant Description
Source: 2009 and 2010 Massachusetts Safety Belt Usage Observation Surveys.
OccupantOccupant 2009 Rate2009 Rate 2010 Rate2010 Rate
TeensTeens 67%67% 72%72%
AdultsAdults 73%73% 72%72%
Older (65+)Older (65+) 82%82% 83%83%
ChildrenChildren 88%88% 90%90%
MalesMales 68%68% 67%67%
FemalesFemales 79%79% 81%81%
Drivers AloneDrivers Alone 72%72% 73%73%
Driver with PassengerDriver with Passenger 77%77% 75%75%
PassengersPassengers 75%75% 74%74%

24
2010 Click It Or Ticket Mobilization Results
State Police Local Police
Enforcement (hours) 5,463 21,940
OUI Arrests 16 59
Speeding and Other Moving Violations Issued
4,821 9,469
Safety Belt Violations Issued 2,932 10,516
Child Safety Seat Violations Issued
219 344

25
Enacting a Primary Belt Law
Massachusetts could save (annually)
• 27 lives
• 1,032 serious injuries
• $260 million
Increase seat belt usage by approximately 13 percentage points
SAFETEA-LU Incentive Grant
• In 2009 and 2010, MA missed out on $13.6 Million in additional highway safety funds

26
Young Drivers (16-24) as Percent of MA Population, Licensed Drivers, and Drivers in Fatal Crashes
0
5
10
15
20
25
30
35
2002 2003 2004 2005 2006 2007 2008
Year
Percentage
Percent of MA Population (Estimated) Percent of MA Licensed Drivers
Percent of MA Drivers in Fatal Crashes
Source: FHWA, CDS.Source: FHWA, CDS.
27
Young Drivers (16-20) Involved in Fatal Crashes
90 88
6976
62
48
-10
10
30
50
70
90
110
130
150
2004 2005 2006 2007 2008 2009
Fatalities
# Drivers 16-20 Linear (# Drivers 16-20)Source: FARS.
28
Impaired Driving
Nationally
• Impaired driving is the most frequently committed crime in the U.S.
• About every 30 minutes, someone is killed in the U.S. in an alcohol-related crash
Costs of alcohol-related fatalities in MA
• Average alcohol-related fatality in MA costs $7 Million − $2.3 M in monetary costs and $4.7 M in quality of life losses
• Alcohol-related crashes accounted for 18% of the MA auto insurance payments
Source: NHTSA

29
2010 DDOLUA Mobilization Results
State Police Local Police
Enforcement (hours) 3,284 13,197
Traffic Stops – 32,596
OUI Arrests 163 161
Speeding and Other Moving Violations Issued
923 4,670
Safety Belt Violations Issued 425 3,291
Child Safety Seat Violations Issued
64 207

30
MA Alcohol-Related Citations Written
20062006 20072007 20082008 20092009
Impaired Driving Violations 18,79118,791 14,95514,955 22,28522,285 21,08221,082
Underage Drinking Violations
2,4492,449 2,2862,286 2,2822,282 1,8651,865
Source: Merit Rating Board.

31
Speed-Related Fatalities
Source: FARS.
20062006 20072007 20082008 20092009
Speed-Related FatalitiesSpeed-Related Fatalities 148148 140140 9797 116116
Percent of All FatalitiesPercent of All Fatalities 34%34% 34%34% 27%27% 33%33%
U.S. AverageU.S. Average 32%32% 32%32% 31%31% N/AN/A

32
Contact Information:
Sheila Burgess, Director
Highway Safety Division
Executive Office of Public Safety and Security
617-725-3301
www.mass.gov/highwaysafety