Embed Size (px)
Citation preview
PREPARED FOR: MR. BILL FRAMPTON OLOWALU TOWN LLC
2073 Wells Street, Suite 201 Wailuku, Hawaii 96793
EFFECTIVE DATE: May 1, 2011
A MARKET STUDY OF THE PROPOSED OLOWALU TOWN MASTER PLAN DEVELOPMENT OLOWALU, ISLAND OF MAUI, HAWAII
A Real Estate Appraisal, Research & Advisory Group
2073 Wells Street, Suite 100 Wailuku, Maui, HI 96793 Telephone: (808) 242-6481 Fax: (808) 242-1852
May 20, 2011 10-9106-DS Mr. Bill Frampton OLOWALU TOWN LLC 2073 Wells Street, Suite 101 Wailuku, Hawaii 96793 Re: Market Analysis for the proposed Olowalu Town Master Plan in Olowalu, Island and County
of Maui Dear Mr. Frampton: In accordance with your request, we have inspected the above-referenced property in order to provide a defined scope market study and economic impact study of the proposed Olowlalu Town Master Plan Development in Olowalu, Island and County of Maui. This counseling report, and the conclusions herein, are based on the on-site inspection of the property, a study of current political and economic conditions, and a historical review of the real estate market in Central Maui and on Maui overall. The effective date of this report is May 1, 2011. The subject consists of approximately 635 acres of land and is currently zoned State Agricultural District. The proposed project is identified as Olowalu Town and will be located along Honoapiilani Highway between Maalaea and Lahaina. Olowalu Town will be a community comprised of residential uses, commercial and civic uses, parks and recreation sites, agricultural uses, and a cultural preserve. At full build-out, Olowalu Town is expected to be comprised of approximately 1,500 living units, including single-family, multi-family and live-work units, together with up to 300,000 square feet of commercial and civic space. Within the 1,500 living units, on-site affordable housing units will also be included in compliance with the County of Maui’s Residential Workforce Housing Policy. The assignment will include the following:
Market Analysis - The Consultant agrees to provide a market analysis for this proposed project by (1) defining and delineating the market area; (2) identifying and analyzing the current supply and demand conditions that comprise the specific real estate market segment; and (3) identifying, measuring and forecasting the effect of anticipated developments or other changes on future supply in each market segment.
The following report presents a narrative review of the market study and our analysis of data along with other pertinent materials on which this report is predicated. It contains data and exhibits
Mr. Bill Frampton May 20, 2011 Page 2
gathered in our investigations, and will include a description of the analytical process and our conclusions. Thank you for allowing us the opportunity to work on this interesting assignment. Respectfully submitted, ACM Consultants, Inc. __________________________ __________________________ Glenn K. Kunihisa, MAI, CRE Dominic J. Suguitan Certified General Appraiser, Certified General Appraiser State of Hawaii, CGA-039 State of Hawaii, CGA-576 Expiration: December 31, 2011 Expiration: December 31, 2011
ACM Consultants, Inc. Olowalu Town
i
TABLE OF CONTENTS Page
PART I – INTRODUCTION .............................................................................................................................. ii
A. EXECUTIVE SUMMARY ........................................................................................................................ ii B. PURPOSE OF THE REPORT................................................................................................................vii C. INTENDED USE OF THE REPORT .....................................................................................................vii D. SCOPE OF THE REPORT.....................................................................................................................vii E. STATEMENT OF COMPETENCY ........................................................................................................vii F. EXTRAORDINARY ASSUMPTIONS AND HYPOTHETICAL CONDITIONS ..............................vii G. CONFIDENTIALITY PROVISION .....................................................................................................viii H. CERTIFICATION ....................................................................................................................................ix I. LIMITING AND CONTINGENT CONDITIONS ..................................................................................xi
PART II – FACTUAL DATA ............................................................................................................................ 1 A. REGIONAL DATA - MAUI COUNTY ................................................................................................ 1 B. NEIGHBORHOOD DESCRIPTION ....................................................................................................18 C. PROJECT DATA...................................................................................................................................24
PART III – ANALYSIS AND CONCLUSION ..............................................................................................27 A. RESIDENTIAL MARKET ANALYSIS.................................................................................................27 B. COMMERCIAL AND INDUSTRIAL MARKET ANALYSIS ............................................................58 C. CONCLUSION .......................................................................................................................................71
PART IV - EXHIBITS AND ADDENDA EXHIBITS Exhibit A Marketview Comparison Report, Claritas, Inc. Exhibit B Olowalu Town Conceptual Community Master Plan Map (DRAFT) ADDENDA Definitions Limiting and Contingent Conditions Qualifications of the Consultant TABLES Table 1 – Recommended Long-Term Residential Growth Areas...........................................................29 Table 2 – New Construction Island of Maui ..............................................................................................30 Table 3 – Historical Trend of 30 Year, Fixed Mortgage Rates ............................................................36 Table 4 – Units Absorbed Per Year (Central Maui) ................................................................................45 Table 5 – Units Absorbed Per Year (South Maui)....................................................................................46 Table 6 – Units Absorbed Per Year (West Maui) ....................................................................................47 Table 7 – Units Absorbed Per Year (Upcountry/East Maui)..................................................................48 Table 8 – Total New Project Absorption 1999 to YTD-2010 ...............................................................49 Table 9 – Comparison of Affordable and Market Prices ......................................................................52 Table 10 – Commercial and Industrial Projects on South Maui, Central Maui and West Maui ......58 Table 11 – Population to Land Area in Commercial/Industrial Parks..................................................68
ACM Consultants, Inc. Olowalu Town
ii
PART I – INTRODUCTION A. EXECUTIVE SUMMARY Background The proposed Olowalu Town Master Plan Development is located on
both sides of Honoapiilani Highway in Olowalu, Island and County of Maui. The subject is primarily zoned State Agricultural District and consists of approximately 635 acres of land. The project, which is still in its preliminary planning stage, will consist of approximately 1,500 residential units, including single-family, multi-family and live-work units; passive parks and open space, such as cultural preserves, neighborhood parks, and archaeological sites; active parks/community services, such as coastal parks, community centers, schools and police/fire facilities; up to 300,000 square feet of commercial space (inclusive of live-work and civic uses); and, an on-site wastewater treatment facility. Potable water for the project will be provided by a private water well. According to the Developer, the proposed land use is as follows:
Proposed Land Use Acreage Urban Residential/Commercial 290 acres Rural Residential 170 acres Agricultural 160 acres Conservation 15 acres Total: ± 635 acres
Preliminary plans call for 565 single-family units, 785 multi-family/apartment units, and 150 live-work units. The Developer has estimated an 8- to 10-year build out for Olowalu Town.
Study Objectives ACM Consultants, Inc. has been retained by Mr. Bill Frampton of
Olowalu Town LLC to analyze each of the specified segments of the real estate market as it relates to this proposed project. In particular, the Consultants studied economic trends and demographics, and supply and demand factors for residential and commercial properties. Residential properties included single-family residences, single-family house lots, and condominium/apartment units. Commercial properties included vacant developable lots as well as improved properties. In the process, they gathered as much information as possible on real estate activity on Maui while focusing on the West Maui, Central Maui, and the South Maui market.
The objectives of the market analysis were as follows: (1) to define and delineate the market area; (2) to identify and analyze the current supply and demand conditions specific to the subject’s market; and (3) identify, measure and forecast the effect of anticipated developments or other factors on future supply.
ACM Consultants, Inc. Olowalu Town
iii
Summary of Conclusions Residential Component
Maui in general has seen growth in its population, tourism and economy over the past two decades. Similar to many real estate markets on the mainland, Maui’s real estate market had seen significant increases from 2000. During that period, median prices attained record highs in 2005. As a result, the county administration placed the affordable housing issue among its top priorities, from as early as 2004.
The real estate climate has since reversed course, due to economic woes and more stringent lending practices. Through 2009, residential sales statistics showed lower median prices, less sales volume and longer marketing times. However, 2010 is showing some evidence of stability, based on year-to-date sales price medians. There are numerous ongoing residential projects that should provide the immediate supply throughout Maui for the next few years. The Maui Lani and Kehalani Project Districts continue to build their already entitled units in Central Maui. In addition, there are a few other projects in Central Maui that may add inventory to the market in coming years but are still in the process of gaining governmental approvals. Other on-going projects are located in South Maui and West Maui. However, after five years, it becomes more difficult to determine which future projects will actually be brought to the market. The recommended Directed Growth Areas, as shown in the Draft Maui Island Plan for Maui, are estimated to provide additional supply of 11,623 housing units by 2030, without the subject included. However, some of these potential projects will likely meet with governmental or community resistance, leading to long delays; meanwhile, others may never be completed for various financial reasons. The economic downturn being witnessed across the nation has significantly affected Maui, through a drop in visitor counts and the drastic slowdown of construction. These industries are two of the primary employment forces on the island and their decline has had an adverse impact on the local economy. Unemployment rose steadily from 2006 to 2009 to levels not seen since 1992, with many that are still employed indicating concern over job security. Meanwhile, the heavy losses witnessed in the financial sector since the fourth quarter of 2008 have surely diminished the investment capital for other potential buyers. Combined with a more stringent lending environment, it has become increasingly difficult to purchase real estate, regardless of current market conditions.
ACM Consultants, Inc. Olowalu Town
iv
At the height of the market, the primary obstacle for buyers was the high asking prices for residential products. Many buyers who did not own a home found it difficult to even come up with enough money for a down payment. Meanwhile, homeowners saw their property values increase to a point where they were able to use their equity appreciation to upgrade to larger, more elaborate accommodations. For many, this option is no longer possible, as the retreat of home prices has caused a significant loss of equity. Currently, the ability of qualified buyers to purchase housing may be more difficult than a few years ago; however, it is fairly safe to assume that as economic conditions improve, housing units within the workforce market segment will continue to be the most sought after. Local economists have varied opinions as to the timing of the economic recovery, but many have pointed to late-2011 or 2012 for this turnaround. If the Olowalu Town Master Plan Development were to come on-line today, it would have likely been facing the same types of sales difficulties that other ongoing projects are witnessing. However, the subject will still need to go through entitlement, design and construction processes before sales can occur. As such, release of the subject’s housing units may be timely with the economic recovery. Once market conditions improve, the project can expect to see heightened interest, due to its location between the visitor resort area of Lahaina, Kaanapali and Kapalua and the island’s primary shipping and transportation venues, government and judiciary facilities, financial institutions, secondary education campus, and retail centers in Central Maui. Most importantly, the Olowalu Town Master Plan will be heavily targeted toward the workforce market segment desiring a small-scale community environment. Statistical evidence has clearly shown that regardless of conditions, this market segment has the most demand. Although the pricing of the project units have not been determined, this development is anticipated to give entry level market participants an opportunity for home ownership. The property owners continue to work diligently with government agencies in an effort to design a master plan community that represents smart-growth for all of Maui. As previously discussed, the proposed project is consistent with many of the goals, objectives, policies and implementing actions set forth in the Countywide Policy Plan, which provides a policy framework for the Maui Island Plan and Community Plans. After consideration of current economic and real estate market conditions; forecasts by Hawaii economists; as well as long-term supply and demand recommendations being deliberated for the 2030 General Plan, it is the Consultant’s opinion that Olowalu Town should be well positioned to capitalize on the recovery of the real estate market and help to provide a long-term solution to the
ACM Consultants, Inc. Olowalu Town
v
housing needs of Maui’s workforce. As such, it is the Consultant’s opinion that the subject’s 1,500 housing units are expected to be absorbed within an 8- to 10-year period.
ACM Consultants, Inc. Olowalu Town
vi
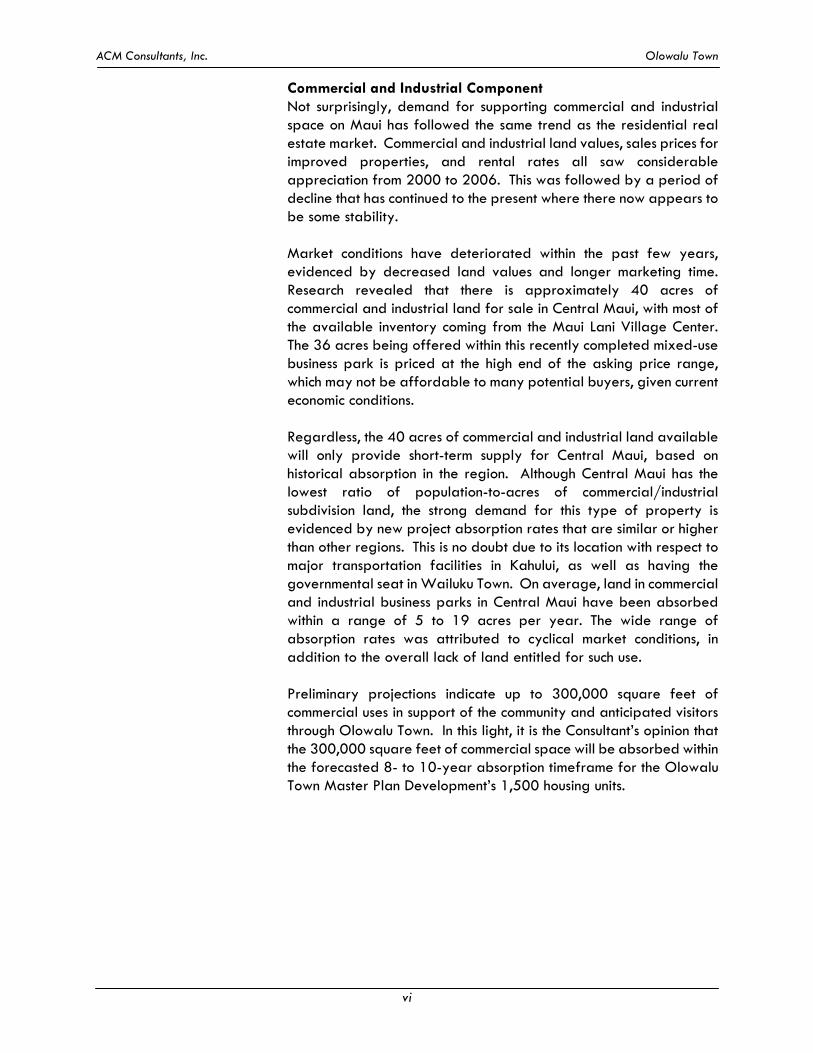
Commercial and Industrial Component Not surprisingly, demand for supporting commercial and industrial space on Maui has followed the same trend as the residential real estate market. Commercial and industrial land values, sales prices for improved properties, and rental rates all saw considerable appreciation from 2000 to 2006. This was followed by a period of decline that has continued to the present where there now appears to be some stability. Market conditions have deteriorated within the past few years, evidenced by decreased land values and longer marketing time. Research revealed that there is approximately 40 acres of commercial and industrial land for sale in Central Maui, with most of the available inventory coming from the Maui Lani Village Center. The 36 acres being offered within this recently completed mixed-use business park is priced at the high end of the asking price range, which may not be affordable to many potential buyers, given current economic conditions. Regardless, the 40 acres of commercial and industrial land available will only provide short-term supply for Central Maui, based on historical absorption in the region. Although Central Maui has the lowest ratio of population-to-acres of commercial/industrial subdivision land, the strong demand for this type of property is evidenced by new project absorption rates that are similar or higher than other regions. This is no doubt due to its location with respect to major transportation facilities in Kahului, as well as having the governmental seat in Wailuku Town. On average, land in commercial and industrial business parks in Central Maui have been absorbed within a range of 5 to 19 acres per year. The wide range of absorption rates was attributed to cyclical market conditions, in addition to the overall lack of land entitled for such use. Preliminary projections indicate up to 300,000 square feet of commercial uses in support of the community and anticipated visitors through Olowalu Town. In this light, it is the Consultant’s opinion that the 300,000 square feet of commercial space will be absorbed within the forecasted 8- to 10-year absorption timeframe for the Olowalu Town Master Plan Development’s 1,500 housing units.
ACM Consultants, Inc. Olowalu Town
vii
B. PURPOSE OF THE REPORT
The purpose of this report, as of May 1, 2011, is to generate a market analysis report with respect to the proposed Olowalu Town Master Plan Development.
C. INTENDED USE OF THE REPORT
The intended use or function of this report is to provide real property information and real estate market date in support of an Environmental Impact Statement, a State Land Use District Boundary Amendment, a Community Plan Amendment, and a Change in Zoning.
D. SCOPE OF THE REPORT
The Consultant has agreed to provide a current market analysis of this project by (1) defining and delineating the market area; (2) identifying and analyzing the current supply and demand conditions that make up the specific real estate market; and (3) identifying, measuring and forecasting the effect of anticipated developments or other changes on future supply. The market analysis will be developed and prepared in conformity with, and subject to, the requirements of the Code of Professional Ethics and the Standards of Appraisal Practice of the Appraisal Institute, and the Uniform Standards of Professional Appraisal Practice.
E. STATEMENT OF COMPETENCY
ACM Consultants, Inc. (formerly ACM, Real Estate Appraisers, Inc.) has been actively involved in the real estate appraisal business since 1982. Our business emphasis has focused mainly on the valuation of residential and commercial properties located within the State of Hawaii. The company considers itself competent to conduct a market study for a proposed master plan project in Olowalu, Island and County of Maui.
F. EXTRAORDINARY ASSUMPTIONS AND HYPOTHETICAL CONDITIONS
1. As of May 2011, the subject was still in the preliminary stages of planning. A land use map from the Developer provided a visual indication of the proposed layout of the project district. The Consultant is not liable for any changes in the project plan past this date, nor for information that has not been released or communicated to the Consultant.
2. The Consultant has no control over economic conditions and
other international events that could have an affect upon
ACM Consultants, Inc. Olowalu Town
viii
Hawaii’s economy and the Maui real estate market. As a result, this report has not made any assumptions regarding potential conflicts with other nations, or external factors affecting economic conditions here.
3. The counseling report is also subject to standard "Limiting and
Contingent Conditions" located in the pages following. G. CONFIDENTIALITY PROVISION
The contents of this market study are confidential. Release of this counseling report by ACM Consultants, Inc. is limited to you and for your preparation of an Environmental Impact Statement for the proposed Olowalu Town Plan Development. The intended users of this report include Olowalu Town LLC and the appropriate government agencies to which this report will be submitted. Any further release of this report, or portions herein, is strictly prohibited and you shall accept the risk and liability for any such release without the previous written consent of ACM Consultants, Inc. Further, you shall indemnify and defend ACM Consultants, Inc., and its individual consultants/appraisers, from any claims arising out of any such unauthorized disclosure.
ACM Consultants, Inc. Olowalu Town
ix
H. CERTIFICATION
The undersigned does hereby certify that except as otherwise noted in this appraisal report:
1. The Consultants’ compensation is not contingent upon the
reporting of a predetermined value or direction in value that favors the cause of the client, the amount of the value estimate, the attainment of a stipulated result, or the occurrence of a subsequent event.
2. The Consultants’ have no present or prospective interest in the
property that is the subject of this report, and no personal interest or bias with respect to the parties involved. The "Estimate of Market Value" in the appraisal report is not based in whole or in part upon the race, color, or national origin of the prospective owners or occupants of the properties in the vicinity of the property appraised.
3. The Consultants have personally inspected the property, and are
signatories of this Certification.
4. To the best of the Consultants’ knowledge and belief, all statements of fact and information in this report are true and correct, and the Consultants’ have not knowingly withheld any significant information.
5. No other person provided significant professional assistance to
the persons signing this report.
6. The reported analyses, opinions and conclusions are limited only by the reported assumptions and limiting conditions, and are the Consultants’ personal unbiased professional analyses, opinions and conclusions.
7. All analyses, opinions and conclusions were developed, and this
report has been prepared, in conformity with the Uniform Standards of Appraisal Practice.
8. This counseling report is subject to and in conformance with the
Code of Professional Ethics and Standards of Professional Conduct of the Appraisal Institute. The analyses, opinions and conclusions of this counseling report have been made in conformity with, and subject to, the requirements of Title XI of the Federal Financial Institutions Reform, Recovery, and Enforcement Act of 1989.
ACM Consultants, Inc. Olowalu Town
x
9. This counseling report is to be used only in its entirety and no part is to be used without the whole report. All conclusions and opinions concerning the real estate are set forth in the counseling report were prepared by the Consultant(s) whose signature(s) appears on the counseling report. No change of any item in the counseling report shall be made by anyone other than the Consultant, and the Consultant shall have no responsibility for any such unauthorized change.
10. The Appraisal Institute, of which this Consultant is a member, has
a legal right to review this report.
11. The qualifications of this Consultant, including completed educational requirements of his/her candidacy are located in the Addendum to this report. Any member signing the report has completed the requirements of the Appraisal Institute's continuing education program.
ACM Consultants, Inc.
__________________________ Glenn K. Kunihisa, MAI, CRE Certified General Appraiser, State of Hawaii, CGA-039 Expiration: December 31, 2011 __________________________ Dominic J. Suguitan Certified General Appraiser, State of Hawaii, CGA-576 Expiration: December 31, 2011
ACM Consultants, Inc. Olowalu Town
xi
I. LIMITING AND CONTINGENT CONDITIONS
1) This is a Counseling Report which is intended to comply with the reporting requirements set forth under Standards Rule 5 of the Uniform Standards of Professional Appraisal Practice for a Counseling Report. The information contained in this report is specific to the needs of the client and for the intended use stated in this report. The Consultant is not responsible for unauthorized use of this report. This report has not been prepared for federally-related mortgage financing purposes, and has not been prepared in compliance with the requirements of Title XI of the Federal Financial Institutions Reform, Recovery, and Enforcement Act of 1989. 2) No responsibility is assumed for legal or title considerations. Title to the property is assumed to be good and marketable unless otherwise stated in this report. 3) The property analyzed is free and clear of any or all lines and encumbrances unless otherwise stated in this report. 4) Responsible ownership and competent property management are assumed unless otherwise stated in this report. 5) The information furnished by others is believed to be reliable. However, no warranty is given for its accuracy. 6) All engineering is assumed to be correct. Any plot plans and illustrative material in this report are included only to assist the reader in visualizing the property. 7) It is assumed that there are no hidden or unapparent conditions of the property, subsoil, or structures that render it more or less valuable. No responsibility is assumed for such conditions or for arranging for engineering studies that may be required to discover them. 8) It is assumed that there is full compliance with all applicable federal, state, and local environmental regulations and laws unless otherwise stated in this report. 9) It is assumed that all applicable zoning and use regulations and restrictions have been complied with, unless a non-conformity has been stated, defined, and considered in this counseling report. 10) It is assumed that all required licenses, certificates of occupancy or other legislative or administrative authority from any local, state, or national governmental or private entity or organization
ACM Consultants, Inc. Olowalu Town
xii
have been or can be obtained or renewed for any use on which the value estimates contained in this report are based. 11) Any sketch in this report may show approximate dimensions and is included to assist the reader in visualizing the property. Maps and exhibits found in this report are provided for reader reference purposes only. No guarantee as to accuracy is expressed or implied unless otherwise stated in this report. No survey has been made for the purpose of this report. 12) It is assumed that the utilization of the land and improvements is within the boundaries or property lines of the property described and that there is no encroachment or trespass unless otherwise stated in this report. 13) The Consultant is not qualified to detect hazardous waste and/or toxic materials. Any comment by the Consultant that might suggest the possibility of the presence of such substances should not be taken as confirmation of the presence of hazardous waste and/or toxic materials. Such determination would require investigation by a qualified expert in the field of environmental assessment. The presence of substances such as asbestos, urea-formaldehyde foam insulation, or other potentially hazardous materials may affect the value of the property. The Consultant's value estimate is predicated on the assumption that there is no such material on or in the property that would cause a loss in value unless otherwise stated in this report. No responsibility is assumed for any environmental conditions, or for any expertise or engineering knowledge required to discover them. The Consultant's descriptions and resulting comments are the result of the routine observations made during the analysis process. 14) Unless otherwise stated in this report, the subject property is evaluated without a specific compliance survey having been conducted to determine if the property is or is not in conformance with the requirements of the Americans with Disabilities Act. The presence of architectural and communications barriers that are structural in nature that would restrict access by disabled individuals may adversely affect the property's value, marketability, or utility. 15) Any proposed improvements are assumed to be completed in a good workmanlike manner in accordance with the submitted plans and specification. 16) The distribution, if any, of the total valuation in this report between land and improvements applies only under the stated program of utilization. The separate allocations for land and buildings must not be used in conjunction with any other appraisal and are invalid if so used.
ACM Consultants, Inc. Olowalu Town
xiii
17) Possession of this report, or a copy thereof, does not carry with it the right of publication. It may not be used for any purpose by any person other than the party to whom it is addressed without the written consent of the consultant, and in any event, only with property written qualification and only in its entirety. 18) Neither all nor any part of the contents of this report (especially any conclusions as to value, the identity of the Consultant, or the firm with which the Consultant is connected) shall be disseminated to the public through advertising, public relations, news sales, or other media without prior written consent and approval of the Consultant.
ACM Consultants, Inc. Olowalu Town
Page 1
PART II – FACTUAL DATA A. REGIONAL DATA - MAUI COUNTY
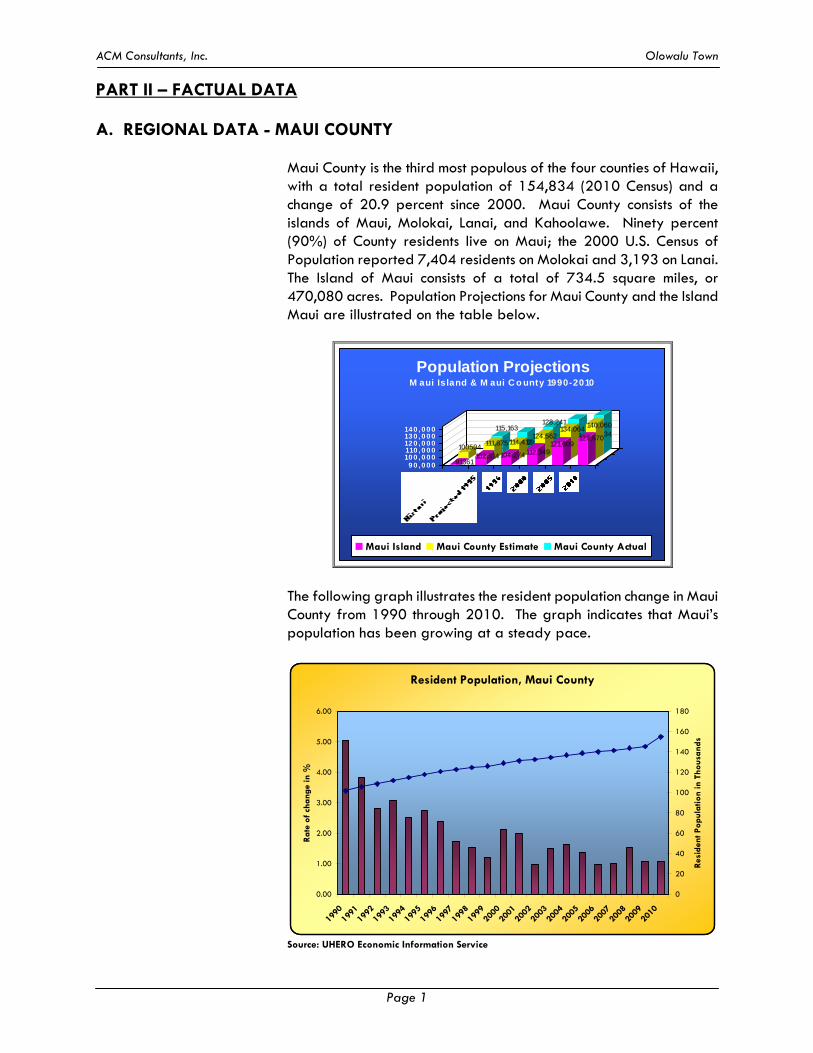
Maui County is the third most populous of the four counties of Hawaii, with a total resident population of 154,834 (2010 Census) and a change of 20.9 percent since 2000. Maui County consists of the islands of Maui, Molokai, Lanai, and Kahoolawe. Ninety percent (90%) of County residents live on Maui; the 2000 U.S. Census of Population reported 7,404 residents on Molokai and 3,193 on Lanai. The Island of Maui consists of a total of 734.5 square miles, or 470,080 acres. Population Projections for Maui County and the Island Maui are illustrated on the table below.
115,163
120,689
128,241
139,131 154,834
100504111,875 114,412
124,562134,064
140,060
91361102,314 104,274 112,349
121,609127,670
9 0 , 0 0 010 0 , 0 0 0110 , 0 0 012 0 , 0 0 013 0 , 0 0 014 0 , 0 0 0
Population ProjectionsM aui Is land & M aui C o unty 1990-2010
Maui Island Maui County Estimate Maui County Actual
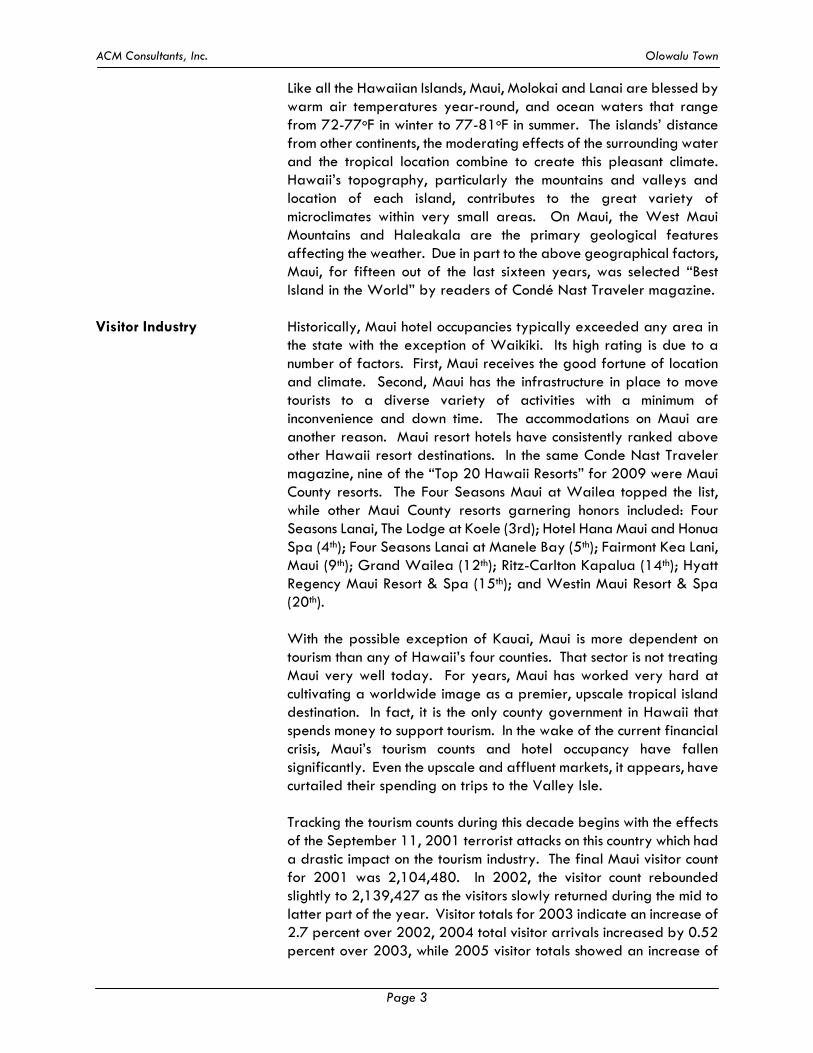
The following graph illustrates the resident population change in Maui County from 1990 through 2010. The graph indicates that Maui’s population has been growing at a steady pace.
Resident Population, Maui County
0.00
1.00
2.00
3.00
4.00
5.00
6.00
1990
1991
1992
1993
1994
1995
1996
1997
1998
1999
2000
2001
2002
2003
2004
2005
2006
2007
2008
2009
2010
Rat
e of
cha
nge
in %
0
20
40
60
80
100
120
140
160
180
Res
iden
t Pop
ulat
ion
in T
hous
ands
Source: UHERO Economic Information Service
ACM Consultants, Inc. Olowalu Town
Page 2
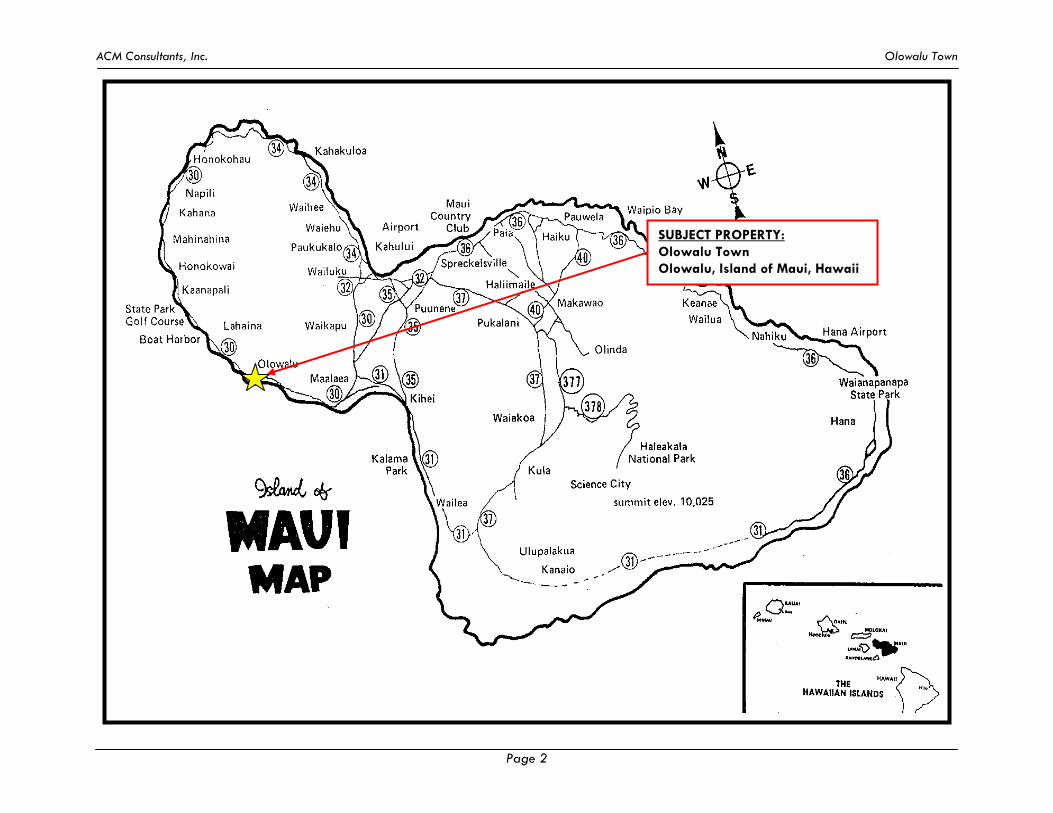
SUBJECT PROPERTY: Olowalu Town Olowalu, Island of Maui, Hawaii
ACM Consultants, Inc. Olowalu Town
Page 3
Like all the Hawaiian Islands, Maui, Molokai and Lanai are blessed by warm air temperatures year-round, and ocean waters that range from 72-77oF in winter to 77-81oF in summer. The islands’ distance from other continents, the moderating effects of the surrounding water and the tropical location combine to create this pleasant climate. Hawaii’s topography, particularly the mountains and valleys and location of each island, contributes to the great variety of microclimates within very small areas. On Maui, the West Maui Mountains and Haleakala are the primary geological features affecting the weather. Due in part to the above geographical factors, Maui, for fifteen out of the last sixteen years, was selected “Best Island in the World” by readers of Condé Nast Traveler magazine.
Visitor Industry Historically, Maui hotel occupancies typically exceeded any area in the state with the exception of Waikiki. Its high rating is due to a number of factors. First, Maui receives the good fortune of location and climate. Second, Maui has the infrastructure in place to move tourists to a diverse variety of activities with a minimum of inconvenience and down time. The accommodations on Maui are another reason. Maui resort hotels have consistently ranked above other Hawaii resort destinations. In the same Conde Nast Traveler magazine, nine of the “Top 20 Hawaii Resorts” for 2009 were Maui County resorts. The Four Seasons Maui at Wailea topped the list, while other Maui County resorts garnering honors included: Four Seasons Lanai, The Lodge at Koele (3rd); Hotel Hana Maui and Honua Spa (4th); Four Seasons Lanai at Manele Bay (5th); Fairmont Kea Lani, Maui (9th); Grand Wailea (12th); Ritz-Carlton Kapalua (14th); Hyatt Regency Maui Resort & Spa (15th); and Westin Maui Resort & Spa (20th). With the possible exception of Kauai, Maui is more dependent on tourism than any of Hawaii’s four counties. That sector is not treating Maui very well today. For years, Maui has worked very hard at cultivating a worldwide image as a premier, upscale tropical island destination. In fact, it is the only county government in Hawaii that spends money to support tourism. In the wake of the current financial crisis, Maui’s tourism counts and hotel occupancy have fallen significantly. Even the upscale and affluent markets, it appears, have curtailed their spending on trips to the Valley Isle. Tracking the tourism counts during this decade begins with the effects of the September 11, 2001 terrorist attacks on this country which had a drastic impact on the tourism industry. The final Maui visitor count for 2001 was 2,104,480. In 2002, the visitor count rebounded slightly to 2,139,427 as the visitors slowly returned during the mid to latter part of the year. Visitor totals for 2003 indicate an increase of 2.7 percent over 2002, 2004 total visitor arrivals increased by 0.52 percent over 2003, while 2005 visitor totals showed an increase of

ACM Consultants, Inc. Olowalu Town
Page 4
6.28 percent, to 2,346,480. There was a rebound in 2006, with a 6.5 percent jump to 2,498,200, followed by another 1.0 percent gain in 2007 to 2,522,000. In 2008, visitor arrivals plummeted 16 percent to 2,129,040, and another 9 percent in 2009 to just 1,923,360 visitor arrivals. According to the University of Hawaii Economic Research Organization (UHERO), total visitor count in 2010 increased 10.38 percent from 2009, and continue to show
Total Visitor Arrivals, Maui County
-1.80
-8.69
1.660.52
6.28 6.47
0.95
-15.58
-9.24
10.38
2.671.86
-20.00
-15.00
-10.00
-5.00
0.00
5.00
10.00
15.00
1999
2000
2001
2002
2003
2004
2005
2006
2007
2008
2009
2010
Rat
e of
cha
nge
in %
0
500
1,000
1,500
2,000
2,500
3,000
Tota
l Vis
itor
Arr
ival
s in
Tho
usan
ds
Source: UHERO Economic Information Service
In addition, for 2010, Maui County had the second lowest occupancy rate of all the Hawaii counties at just 68.20 percent, ahead of the Kauai at 59.23 percent. Meanwhile, Big Island showed occupancy of 56.37 percent and Oahu occupancy topped the list at 78.25 percent.
Hotel Occupancy Rate, Maui County
3.97
-9.06
-2.34
4.31
2.120.57
-10.00
-13.30
15.71
-5.51
4.595.38
-15.00
-10.00
-5.00
0.00
5.00
10.00
15.00
20.00
1999
2000
2001
2002
2003
2004
2005
2006
2007
2008
2009
2010
Rat
e of
cha
nge
in %
0
10
20
30
40
50
60
70
80
90
Hot
el O
ccup
ancy
Rat
e in
%
Source: UHERO Economic Information Service
ACM Consultants, Inc. Olowalu Town
Page 5
Visitor shopping opportunities have increased in recent years with the opening of The Maui Marketplace, a 275,000 square foot shopping complex, modeled after Oahu’s successful Waikele Center. The Maui Marketplace is now home to such retail superstores like Lowe’s Hardware, Pier One Imports, Borders Books and Music, Sports Authority, Starbucks Coffee, and Office Max, as well as many small local retailers and restaurants. Also opening in the same Kahului area were Home Depot, Wal-Mart, Big K and Costco. In addition, the Shops at Wailea opened in December 2000 and added approximately 150,000 square feet of high-end retail space in the Wailea Resort. At about the same time, the 150,000 square foot Piilani Shopping Center opened in Kihei with Safeway as its anchor tenant. The latest entry into the retail sector is the Lahaina Gateway, which opened in 2007. Dubbed a “lifestyle center”, Lahaina Gateway, offers almost 137,000 square feet of gross leasable area. Maui offers more than any other Neighbor Island in the way of proven vacation experiences. It has a larger tourism activities industry relative to the size of its economy than any other county. Such activities include ocean recreation, helicopter tours, biking down Haleakala, and golfing, among numerous other activities. Maui’s well-developed ocean recreation industry ranges from windsurfing to snorkeling, scuba diving and sailing cruises which leave regularly from Lahaina and Maʻalaea Harbors. Maui also has theme destinations, such as the Maui Tropical Plantation. But the premier theme destination on the island is the Maui Ocean Center. This center, featuring the marine environment of the Hawaiian Islands, is modeled after five other aquarium parks developed elsewhere in the world by Coral World International. This ocean center is located just behind the Maalaea Boat Harbor, and is easily accessible from Kahului/Wailuku, and the resort areas of Lahaina/Kaanapali and Kihei/Wailea. The Maui Ocean Center anchors the 18-acre Maalaea Harbor Village, which also includes a retail strip shopping center, restaurants and other services. When the United States and the world in general recover from the current economic crisis, it is hoped that Maui will continue to be a strongly favored destination for Mainland tourists. The island has a large share of condominiums available for families and groups on a budget. The California recovery in the early 2000’s fueled higher demand for condominium rentals and this may possibly happen again in the next decade. Hotels have not been adding much in the way of jobs, in fact, many hotel and other tourism-related industries have cut back their work force. Even when tourism numbers were growing steadily, job creation in the visitor industry was not matching that growth. Today, with
ACM Consultants, Inc. Olowalu Town
Page 6
tourism waning, the work force is noticeably decreasing. While tourism still dominates the labor force, the profitability problems of the large resorts have led managers to refine their operations.
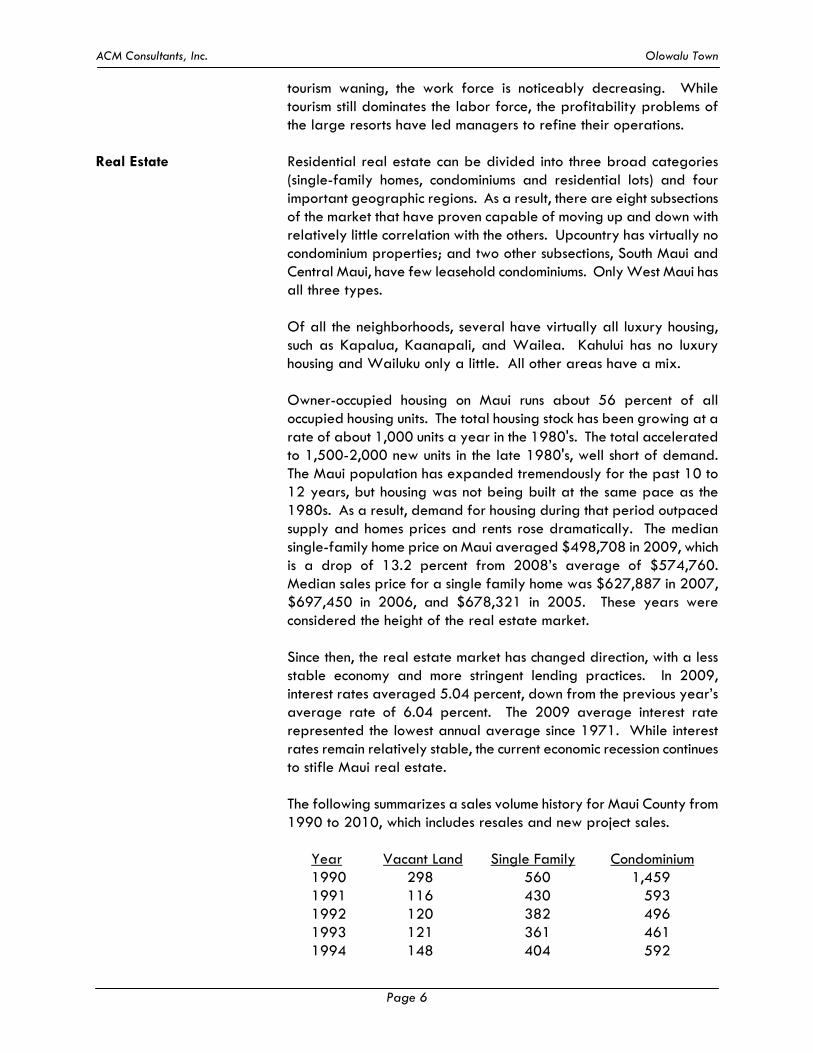
Real Estate Residential real estate can be divided into three broad categories (single-family homes, condominiums and residential lots) and four important geographic regions. As a result, there are eight subsections of the market that have proven capable of moving up and down with relatively little correlation with the others. Upcountry has virtually no condominium properties; and two other subsections, South Maui and Central Maui, have few leasehold condominiums. Only West Maui has all three types. Of all the neighborhoods, several have virtually all luxury housing, such as Kapalua, Kaanapali, and Wailea. Kahului has no luxury housing and Wailuku only a little. All other areas have a mix. Owner-occupied housing on Maui runs about 56 percent of all occupied housing units. The total housing stock has been growing at a rate of about 1,000 units a year in the 1980's. The total accelerated to 1,500-2,000 new units in the late 1980's, well short of demand. The Maui population has expanded tremendously for the past 10 to 12 years, but housing was not being built at the same pace as the 1980s. As a result, demand for housing during that period outpaced supply and homes prices and rents rose dramatically. The median single-family home price on Maui averaged $498,708 in 2009, which is a drop of 13.2 percent from 2008’s average of $574,760. Median sales price for a single family home was $627,887 in 2007, $697,450 in 2006, and $678,321 in 2005. These years were considered the height of the real estate market. Since then, the real estate market has changed direction, with a less stable economy and more stringent lending practices. In 2009, interest rates averaged 5.04 percent, down from the previous year’s average rate of 6.04 percent. The 2009 average interest rate represented the lowest annual average since 1971. While interest rates remain relatively stable, the current economic recession continues to stifle Maui real estate. The following summarizes a sales volume history for Maui County from 1990 to 2010, which includes resales and new project sales. Year Vacant Land Single Family Condominium
1990 298 560 1,459 1991 116 430 593 1992 120 382 496 1993 121 361 461 1994 148 404 592
ACM Consultants, Inc. Olowalu Town
Page 7
1995 118 331 495 1996 126 451 577 1997 182 507 812 1998 276 641 999 1999 408 965 1,348 2000 372 951 1,456 2001 318 938 1,274 2002 402 997 1,578 2003 447 1,420 2,001 2004 477 1,228 1,935 2005 421 1,311 2,041 2006 255 1,066 1,247 2007 226 1,138 1,179 2008 97 907 788 2009 110 693 826 2010 127 814 1,147
Real Estate Sales, Maui County2000 - 2010
-
500
1,000
1,500
2,000
2,500
2000
2001
2002
2003
2004
2005
2006
2007
2008
2009
2010
No.
of
Sale
s
Vacant Land Single Family Condominium
Source: Realtors Association of Maui
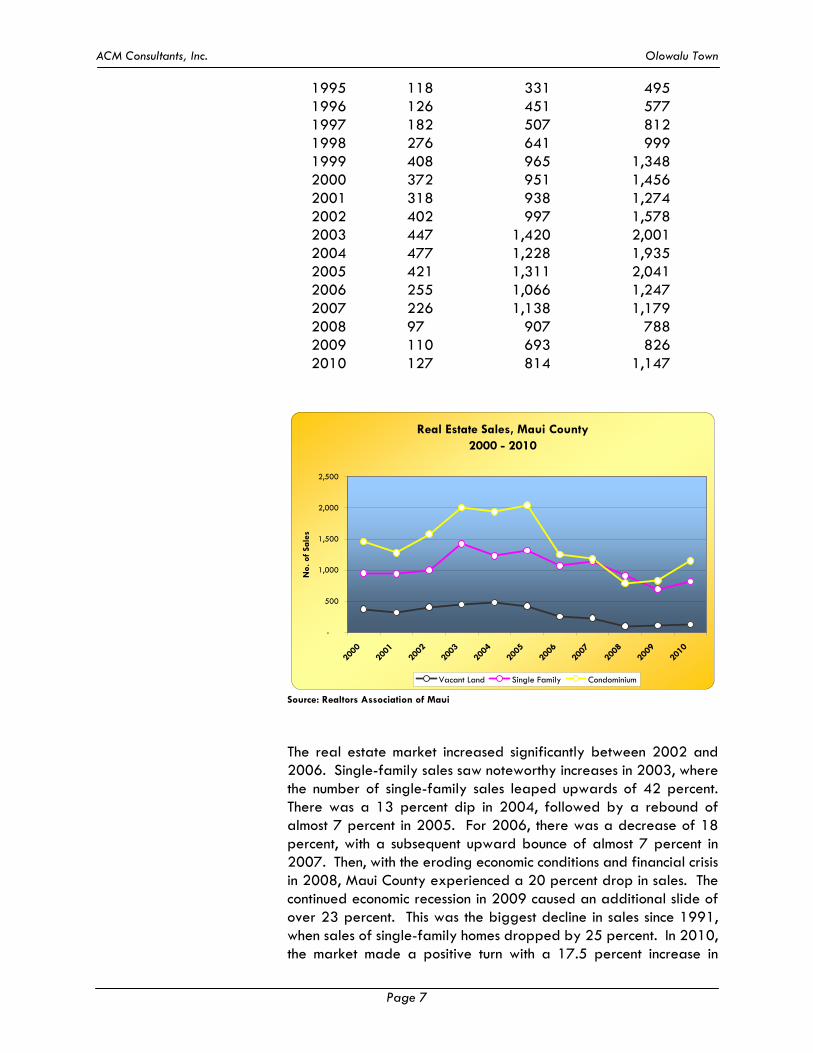
The real estate market increased significantly between 2002 and 2006. Single-family sales saw noteworthy increases in 2003, where the number of single-family sales leaped upwards of 42 percent. There was a 13 percent dip in 2004, followed by a rebound of almost 7 percent in 2005. For 2006, there was a decrease of 18 percent, with a subsequent upward bounce of almost 7 percent in 2007. Then, with the eroding economic conditions and financial crisis in 2008, Maui County experienced a 20 percent drop in sales. The continued economic recession in 2009 caused an additional slide of over 23 percent. This was the biggest decline in sales since 1991, when sales of single-family homes dropped by 25 percent. In 2010, the market made a positive turn with a 17.5 percent increase in
ACM Consultants, Inc. Olowalu Town
Page 8
single-family sales over 2009. However, median prices continued to decline in 2010 by 7.2 percent from 2009. The increase in single-family sales volume and simultaneous drop in average median price in 2007 was partially attributed to the closing of numerous units in Waikapu Gardens. This affordable priced subdivision had over 14 percent of the island’s single-family home closings in 2007, with 164 units, at an average sales price of $356,876. The following graph further illustrates the single-family sales volume history for Maui County from 2000 to 2010.
Single Family Sales, Maui County
-1.37
6.29
42.43
6.76
-18.69
6.75
-20.30-23.59
17.46
-1.45
-13.52
-30.00
-20.00
-10.00
0.00
10.00
20.00
30.00
40.00
50.00
2000
2001
2002
2003
2004
2005
2006
2007
2008
2009
2010
Rat
e of
cha
nge
in %
0
200
400
600
800
1,000
1,200
1,400
1,600
Uni
ts S
old
Source: Realtors Association of Maui
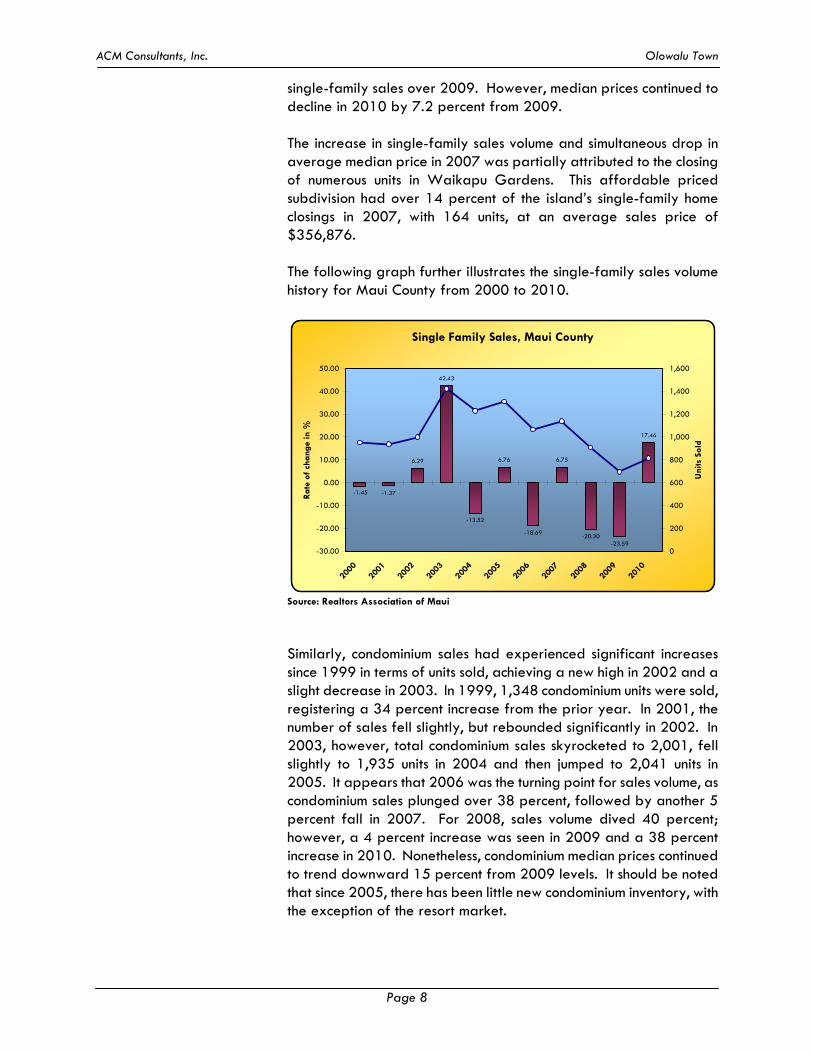
Similarly, condominium sales had experienced significant increases since 1999 in terms of units sold, achieving a new high in 2002 and a slight decrease in 2003. In 1999, 1,348 condominium units were sold, registering a 34 percent increase from the prior year. In 2001, the number of sales fell slightly, but rebounded significantly in 2002. In 2003, however, total condominium sales skyrocketed to 2,001, fell slightly to 1,935 units in 2004 and then jumped to 2,041 units in 2005. It appears that 2006 was the turning point for sales volume, as condominium sales plunged over 38 percent, followed by another 5 percent fall in 2007. For 2008, sales volume dived 40 percent; however, a 4 percent increase was seen in 2009 and a 38 percent increase in 2010. Nonetheless, condominium median prices continued to trend downward 15 percent from 2009 levels. It should be noted that since 2005, there has been little new condominium inventory, with the exception of the resort market.
ACM Consultants, Inc. Olowalu Town
Page 9
Meanwhile the plummet of condominium sales volume in 2006 was deemed to be market stabilization from the spike in new inventory between 2003 and 2005. During this time period, Villas at Kenolio and Hale Kanani (Kihei), Villas at Kahana Ridge (Kahana), and Kehalani Gardens and Iliahi (Wailuku) closed on their units. Since then, there have been few non-resort condominium projects become available. The following graph further illustrates the condominium sales volume history for Maui County from 2000 to 2010.
Condominium Sales, Maui County
-12.50
23.8626.81
5.48
-38.90
-5.45
-33.16
4.82
38.86
8.01
-3.30
-50.00
-40.00
-30.00
-20.00
-10.00
0.00
10.00
20.00
30.00
40.00
50.00
2000
2001
2002
2003
2004
2005
2006
2007
2008
2009
2010
Rat
e of
cha
nge
in %
0
500
1,000
1,500
2,000
2,500
Uni
ts S
old
Source: Realtors Association of Maui
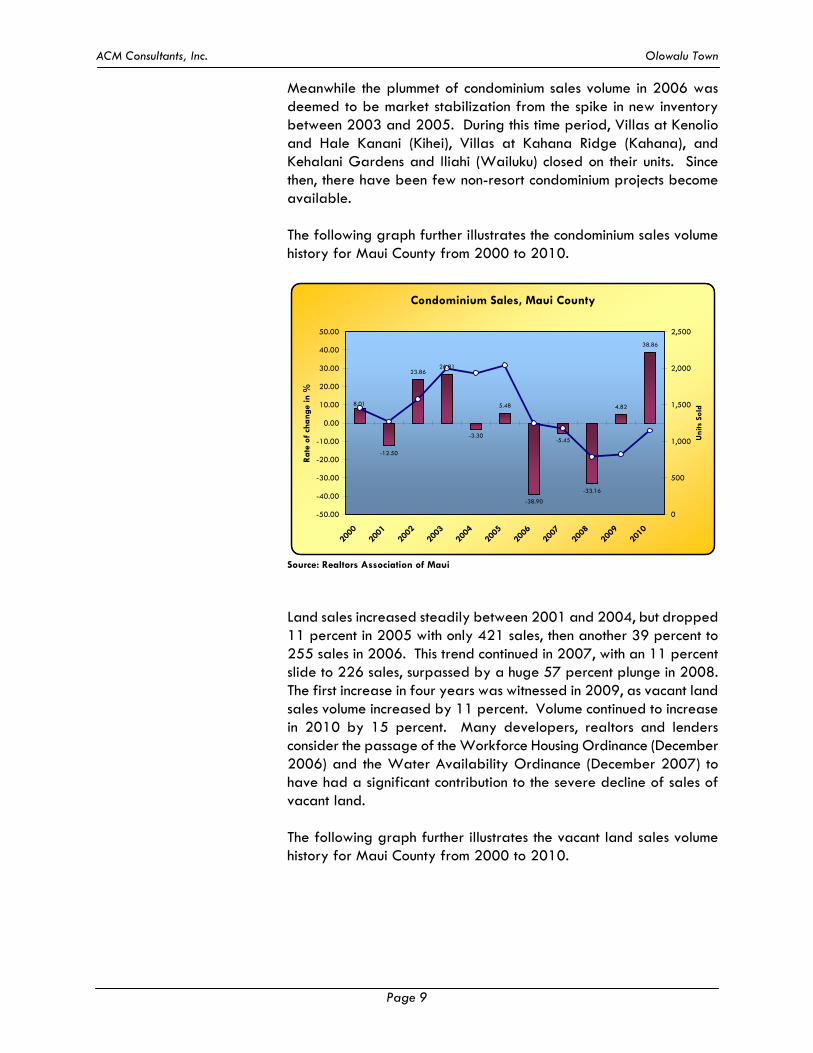
Land sales increased steadily between 2001 and 2004, but dropped 11 percent in 2005 with only 421 sales, then another 39 percent to 255 sales in 2006. This trend continued in 2007, with an 11 percent slide to 226 sales, surpassed by a huge 57 percent plunge in 2008. The first increase in four years was witnessed in 2009, as vacant land sales volume increased by 11 percent. Volume continued to increase in 2010 by 15 percent. Many developers, realtors and lenders consider the passage of the Workforce Housing Ordinance (December 2006) and the Water Availability Ordinance (December 2007) to have had a significant contribution to the severe decline of sales of vacant land. The following graph further illustrates the vacant land sales volume history for Maui County from 2000 to 2010.

ACM Consultants, Inc. Olowalu Town
Page 10
Vacant Land Sales, Maui County
-14.52
26.42
11.19
-11.74
-39.43
-11.37
-56.19
11.1115.45
-8.82
6.71
-70.00
-60.00
-50.00
-40.00
-30.00
-20.00
-10.00
0.00
10.00
20.00
30.00
40.00
2000
2001
2002
2003
2004
2005
2006
2007
2008
2009
2010
Rat
e of
cha
nge
in %
0
100
200
300
400
500
600
Uni
ts S
old
Source: Realtors Association of Maui
Meanwhile, median prices rose continued to rise until 2006 for all categories of real estate. The average monthly median prices in 2006, for land parcels, single-family homes and condominium units, increased 29 percent, 2 percent and 33 percent, respectively. In 2007, average monthly median prices for land and single-family property decreased 19 percent and 10 percent, respectively, while the average median price for a condominium increased 6 percent. For 2008, the average monthly median prices for single-family homes retreated by approximately 8 percent. Vacant land saw a slight gain of about 4 percent over 2007, while condominiums decreased by almost 6 percent. In 2009, vacant land median price increased by 3 percent. For that year, single-family properties decreased by 13 percent and condominiums saw an 11 percent drop.
Construction and Development The construction industry, in the mid part of this decade, benefitted
from a robust economy and building climate. Three new commercial centers were built in 2000. The Wailea Shopping Village had been demolished and was replaced with The Shops at Wailea, which includes 150,000 square feet of upscale retail and restaurant space. Also, the 150,000 square foot Piilani Village shopping center was built at the same time and is anchored by a 55,000 square foot Safeway store, one of the largest Safeway in the state. The Maʻalaea Harbor Village shopping complex, where the premier Maui Ocean Center presently stands, was also built during the same period; however, since then, no other project has been attempted and the majority of the lots in this commercial subdivision sit vacant. As previously discussed, the Lahaina Gateway was completed in 2008 and injected an additional 137,000 square feet of retail space.
ACM Consultants, Inc. Olowalu Town
Page 11
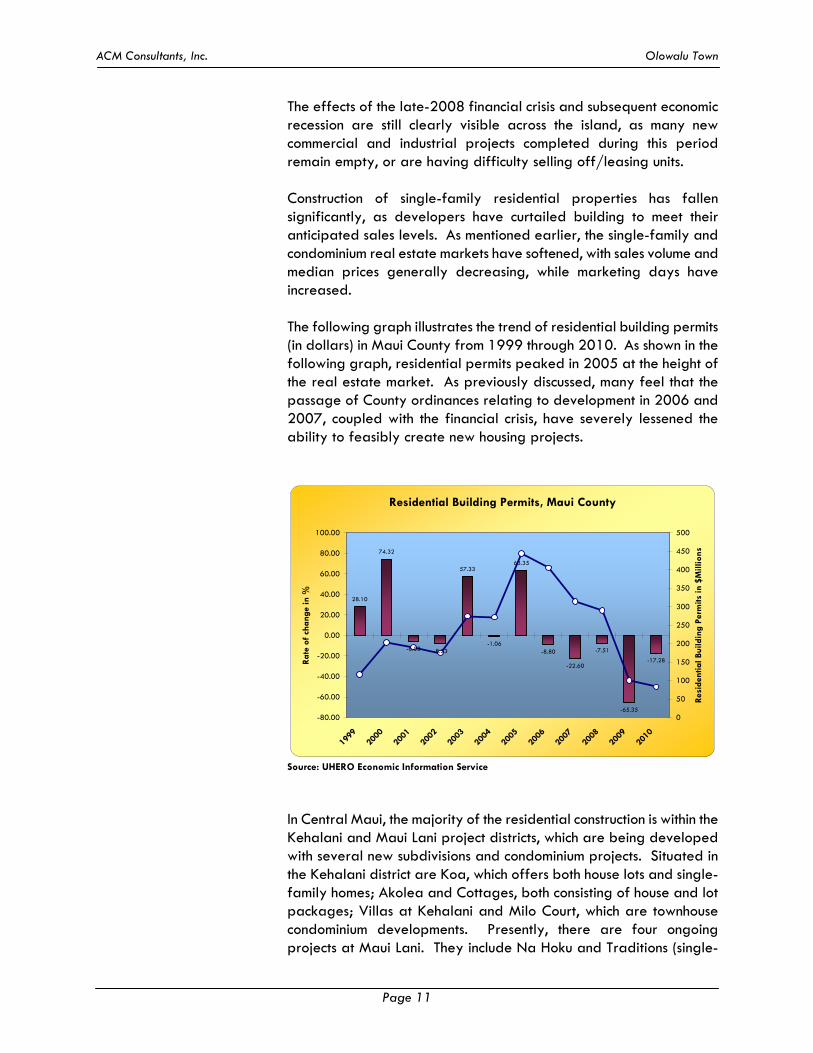
The effects of the late-2008 financial crisis and subsequent economic recession are still clearly visible across the island, as many new commercial and industrial projects completed during this period remain empty, or are having difficulty selling off/leasing units. Construction of single-family residential properties has fallen significantly, as developers have curtailed building to meet their anticipated sales levels. As mentioned earlier, the single-family and condominium real estate markets have softened, with sales volume and median prices generally decreasing, while marketing days have increased. The following graph illustrates the trend of residential building permits (in dollars) in Maui County from 1999 through 2010. As shown in the following graph, residential permits peaked in 2005 at the height of the real estate market. As previously discussed, many feel that the passage of County ordinances relating to development in 2006 and 2007, coupled with the financial crisis, have severely lessened the ability to feasibly create new housing projects.
Residential Building Permits, Maui County
28.10
74.32
-6.03 -8.33
57.33
-1.06
63.35
-8.80
-22.60
-7.51
-65.35
-17.28
-80.00
-60.00
-40.00
-20.00
0.00
20.00
40.00
60.00
80.00
100.00
1999
2000
2001
2002
2003
2004
2005
2006
2007
2008
2009
2010
Rat
e of
cha
nge
in %
0
50
100
150
200
250
300
350
400
450
500
Res
iden
tial B
uild
ing
Perm
its in
$M
illio
ns
Source: UHERO Economic Information Service
In Central Maui, the majority of the residential construction is within the Kehalani and Maui Lani project districts, which are being developed with several new subdivisions and condominium projects. Situated in the Kehalani district are Koa, which offers both house lots and single-family homes; Akolea and Cottages, both consisting of house and lot packages; Villas at Kehalani and Milo Court, which are townhouse condominium developments. Presently, there are four ongoing projects at Maui Lani. They include Na Hoku and Traditions (single-
ACM Consultants, Inc. Olowalu Town
Page 12
family homes), Sand Hills Estates (house lots), and Parkways (both house lots and single-family homes). The demand for housing in the Central Maui area had been extremely strong up to mid-2006, with projects usually sold out prior to completion of construction. Due to the more recent downward trend of the economy and residential real estate market, developers are now finding themselves holding inventory and most new construction has ceased. Meanwhile, Spencer Homes completed construction of a 410-unit affordable project in 2008, called Waikapu Gardens. Approximately half of the houses met County affordable housing pricing requirements. This project was welcomed by the community as “affordable” prices were stated to be below $300,000. This project gained approval by the Maui Nui Affordable Housing Taskforce which was set up in response to the growing need for affordable housing on Maui. The demand for housing in the Central Maui area had been extremely strong up to mid-2006, with projects usually sold out prior to completion of construction. Due to the more recent downward trend of the economy and residential real estate market, developers are now finding themselves holding inventory and most new construction has ceased. Up to 2006, Kihei had also seen an upswing in residential development brought upon by ongoing residential projects including Ke Aliʻi Ocean Villas (townhouse condominiums) and Moana Estates (single-family homes) by Towne Development, Kamaliʻi Alayna (single-family homes) by Betsill Brothers, Inc., and Signature Homes’ Hokulani Golf Villas (residential condominiums). Other current South Maui projects are Kilohana Waena (house lots) and Kai Ani (townhouse condominiums). Similar to Central Maui, the developers of ongoing projects have slowed construction while continuing to market their units; whereas, previous Kihei developments were often sold out prior to construction completion. In Wailea, the Shops at Wailea and Wailea Town Center are the only established commercial developments. Both centers target the high-end residents of this resort community and Wailea’s upscale visitors. Phase I of Wailea Town Center was completed in 2006 while Phase II was completed in 2007. It contains neighborhood services which include retail and office owner-occupants. The second phase included more commercial condominium units and residential units on the second floor. Current condo owners in this project include Coldwell Banker and First Hawaiian Bank. This development was met with high demand as all of the units have already sold and some have even resold. Another commercial retail/office project, Wailea Gateway
ACM Consultants, Inc. Olowalu Town
Page 13
Center, was completed in 2009; however, this development has not yet been able to secure tenants.
Retailing In retail, the most significant addition to Maui is the Lahaina Gateway situated along Honoapiilani Highway across from the Lahaina Cannery Mall. It was dubbed as a “lifestyle center” with specialty retail shops, services and restaurants. Opened in late 2007, this 137,000 square foot center includes anchor tenants such as Office Max, Barnes & Noble, Outback Steakhouse, The Melting Pot, and Lahaina Farms, a supermarket owned by Foodland’s Sullivan family. Prior to Lahaina Gateway, Maui Marketplace on Dairy Road was the last large retail development to be built, at 275,000 square feet. This center contains the likes of Lowe’s Hardware, Office Max, Sports Authority, Borders Books & Music, Pier One Imports, Burger King and Starbucks Coffee. Wal-Mart and Home Depot are also located on Dairy Road, immediately west of the Maui Marketplace. These outlets joined earlier arrivals Costco and Kmart, as well as Alexander & Baldwin’s neighboring Triangle Square, in carving up the Maui retail pie. However, the local malls are answering the challenge with more food and entertainment, and retailers that can compete in their niche. Maui’s largest mall, Maui Land & Pine’s Queen Kaahumanu Center in Kahului, has been challenged by the presence of these large box retailers and vacancies are very noticeable. The most recent and highly publicized closure was that of JC Penney in January 2003. In Kaanapali, Whalers Village has taken a turn toward the luxury market popular with the Japanese. After completing a $3 million renovation and a change in its tenant mix, this oceanfront center now aims for both westbound and eastbound visitors. Japanese visitors are targeted with Duty Free Shoppers, Louis Vuitton, Prada, Loewe and other high-end shops. The 150,000-square foot Shops at Wailea opened in 2000, offering upscale shopping in its high-end retail shops. Tenants include Louis Vuitton, Coach, Bally, Fendi, Tiffany & Co., Banana Republic, and Georgiou. Restaurants in this mall include Ruth Chris Steak House, Tommy Bahama Café and Emporium, and Longhi’s. Other retailers include Crazy Shirts, Hot Topix, Gap, Wolf Camera, and Whalers General Store.
Agriculture Agriculture on Maui is dominated by larger operations like Maui Land and Pine and Alexander & Baldwin’s Hawaii Commercial and Sugar (HC&S). Pineapple now confronts more foreign competition from places like Thailand. In 2007, the company shut down the canning portion of its
ACM Consultants, Inc. Olowalu Town
Page 14
operation to rely solely on the more profitable fresh fruit segment. Downsizing of the plantation occurred in 2008, which resulted in a reduction of over 200 employees. In December 2009, Maui Land and Pine announced that it would be shutting down its agricultural arm, citing continued annual losses. However, a new company, Haliimaile Pineapple Company, was formed the following week and immediately took over pineapple operations. HC&S survives as Hawaii’s only remaining sugar operation because of its economies of scale, its shape (a compact area in the isthmus of the Valley isle rather than being strung out along some coastline, which facilitates cane hauling), and its decisions over the years to reinvest and upgrade plant and equipment. But the last active sugar plantation in the state is facing other hardships, namely water. There had been drought conditions on Maui between 2007 and 2009, contributing to low yields. According to HC&S, future viability is heavily dependent on continued stream diversion; however, those opposed to this practice have become ever-more vocal. HC&S plans to re-evaluate its operation at the end of 2010. Another of Maui’s sugar operation casualties, Pioneer Mill in West Maui, is missed visibly. For years, proponents of maintaining and sustaining Hawaii’s sugar industry argued that growing sugarcane imparted to this economy an important, if underestimated, non-pecuniary benefit; sugar kept the land green and attractive, for tourists and locals alike, even if it lost money. Economists call this situation an "externality," an activity that affects others for better or worse, without those others paying or being compensated for activity. Anyone who doubts that logic now has only to drive the West Maui coast from Olowalu to Kaanapali and look mauka, at an entire mountain side of dry brush and unused fields. As with many cases where sugar plantations have shut down, most diversified agriculture crops are just not land intensive enough to utilize all the vacant land. Coffee and seed corn operations are possibilities, but they make only a small dent. In addition to sugar and pineapple cultivation, Maui also offers rich opportunities for agricultural diversification by small farmers and large agribusinesses. Top among new agricultural products are: papaya, cut flowers, coffee, Kula onions and strawberries, and Chinese cabbage from Kula. Molokai offers its sweet potatoes, Molokai lettuce and alfalfa, as well as taro.
High-Tech Maui’s contribution to Hawaii’s fledgling high-tech industry remains pre-eminent in the state. It also represents genuine diversification of the economy. The Maui Research and Technology Park in Kihei has all of it’s infrastructure in place, and has completed three major building
ACM Consultants, Inc. Olowalu Town
Page 15
projects. Most important, it houses one of the country’s most powerful supercomputers. The park now hosts over 30 companies and over 300 employees on 415 acres. With access to one of the most powerful supercomputers in the world, funded by the U.S. Air Force, the Maui Research and Technology Park is continuing its efforts to diversify the Maui economy into something fundamentally different from what exists in the county or anywhere else in the state. An office building was developed by the Maui Economic Development Board in 2006, and contains approximately 31,500 square feet of rentable area on a 2.8-acre site. Another completed project is Park Plaza, a 15-unit commercial office condominium building developed by Goodfellow Brothers and Betsill Brothers. Both Goodfellow and Betsill plan to occupy just over half of the entire building. Since its completion in 2008, sales have been very sluggish. The park is sticking to its long-run strategic plan to capitalize on its location at the center of the Pacific Basin. Its extensive fiber-optic network to the U.S. Mainland makes it one of the most fiber-rich environments in the world, greater than many facilities actually located on the Mainland.
County Government Maui County is unique in having several inhabited islands in its jurisdiction: Maui, Molokai, as well as Lanai, and the uninhabited island of Kahoolawe. Maui County has an elected Mayor and County Council, and the Board of Water Supply and Liquor Control Commission are semi-autonomous with appointed directors. Although all courts are conducted by the State, the County is responsible for prosecution and the Mayor appoints the prosecutor. The council has nine members, each residing in one of nine districts; however, voters cast ballots for all nine seats. Unlike other states, Hawaii has only two layers of government: State and County. The State is responsible for many functions that elsewhere come under the jurisdiction of municipalities, such as schools, hospitals, and airports. Also, unlike other states, Hawaii has statewide zoning carried out by the State Land Use Commission. The County has zoning authority within the boundaries established by the commission. The County of Maui is encountering a lack of affordable housing. Maui is one of the most expensive counties for single-family home buyers. A record high median price of $780,000 was set in July 2006 for a single-family home. Since then, the median single-family price has continued to fall, with an average monthly median sales price of $498,708 in 2009, down from $574,760 in 2008 and
ACM Consultants, Inc. Olowalu Town
Page 16
$627,137 in 2007. According to the latest State of Hawaii Data Book, 8 percent of the houses are overcrowded on Maui and 41.4 percent of the households pay more than the recommended limit of 30 percent of their income on housing. In fact, 27.1 percent pay more than 40 percent on housing.
This heightened effort by the County resulted in the passage of Ordinance 3418 on December 5, 2006, under which all proposed developments are subject to review if they are to contain five or more units or lots. Under this ordinance, if the average sales price is projected to be less than $600,000, 40 percent of the total units must be priced to meet the various affordable categories. If the average sales price in the project is $600,000 or more, then 50 percent of the units must be affordably priced. An alternative to providing the affordable units is to pay an in-lieu fee equal to 30 percent of the average projected sales price of the market rate units multiplied by the number of affordable units required in the development. Or, the owner may elect to provide land which is equal in value to the in-lieu fee. This ordinance has had a profound effect on residential development since its passage. The subsequent reduction in proposed projects had many in the building and real estate industries questioning whether the ordinance created too much of an obstacle for developers. In an effort to stimulate residential construction, the ordinance was revised by the County Council on February 26, 2010, as Ordinance No. 3719, reducing the amount of required affordable housing units built on site to 25 percent, provided the average sales price of the market units is projected to be less than $600,000. If the average sales price in the project is $600,000 or more, then 50 percent of the units must be affordably priced. The new law also clarified the calculation of required affordable units built off site; based on 50 percent of the total number of on-site market units, regardless of their projected average sales price. Time will tell if this latest version of the ordinance will help to achieve its intended goal. The water availability ordinance is another law that has made an impact on the development community. On December 14, 2007, the County of Maui passed into law Ordinance 3502. As a result, the Department of Water Supply (DWS) is presently restricting the issuance of meters for all uses in the central and south Maui service areas and this bill restricts issuance of any building permits until the DWS can issue a meter consistent with the provisions of the bill. In order to do so, the DWS director needs to provide verifiable, long-term supply of water to the property. Landowners and professionals in the development community have been openly critical of the ordinance, some calling it a de facto moratorium on housing. Not
ACM Consultants, Inc. Olowalu Town
Page 17
surprisingly, sales of vacant development lands have been very scarce.
ACM Consultants, Inc. Olowalu Town
Page 18
B. NEIGHBORHOOD DESCRIPTION
Since real estate is fixed in location, its marketability and rentability are strongly influenced by economic and social trends in its immediate environment. The continuing attractiveness of this neighborhood environment to potential users and tenants, and its competitive relation to those of substitute properties, must therefore be evaluated and forecast by the appraiser. In particular, perceived neighborhood trends affect both the quality and quantity of the revenues the subject property can reasonably be expected to generate.
A neighborhood of income-producing properties is a geographic area characterized by similarity of uses and/or users, within which any change has a direct and immediate effect on the subject property and its value.
The geographic area surrounding the subject property is defined by physical and man-made boundaries, and encompasses an area known as Lahaina, which is located on the western slopes and coastal plain of west Maui. Its common boundary with the Wailuku Judicial District begins at the southern shore of west Maui, about two miles west of Papawai Point. Beginning at this point, the Lahaina region boundary travels mauka along the centerline of the Manawainui Gulch to the ridgeline of the West Maui Mountains. The boundary then continues in a northerly direction to Eke Crater then due North along Poelua Gulch to the northern shoreline of West Maui. West Maui generally includes the greater Puamana, Lahaina Town, Honokowai, Mahinahina, Napili and Kapalua neighborhoods.
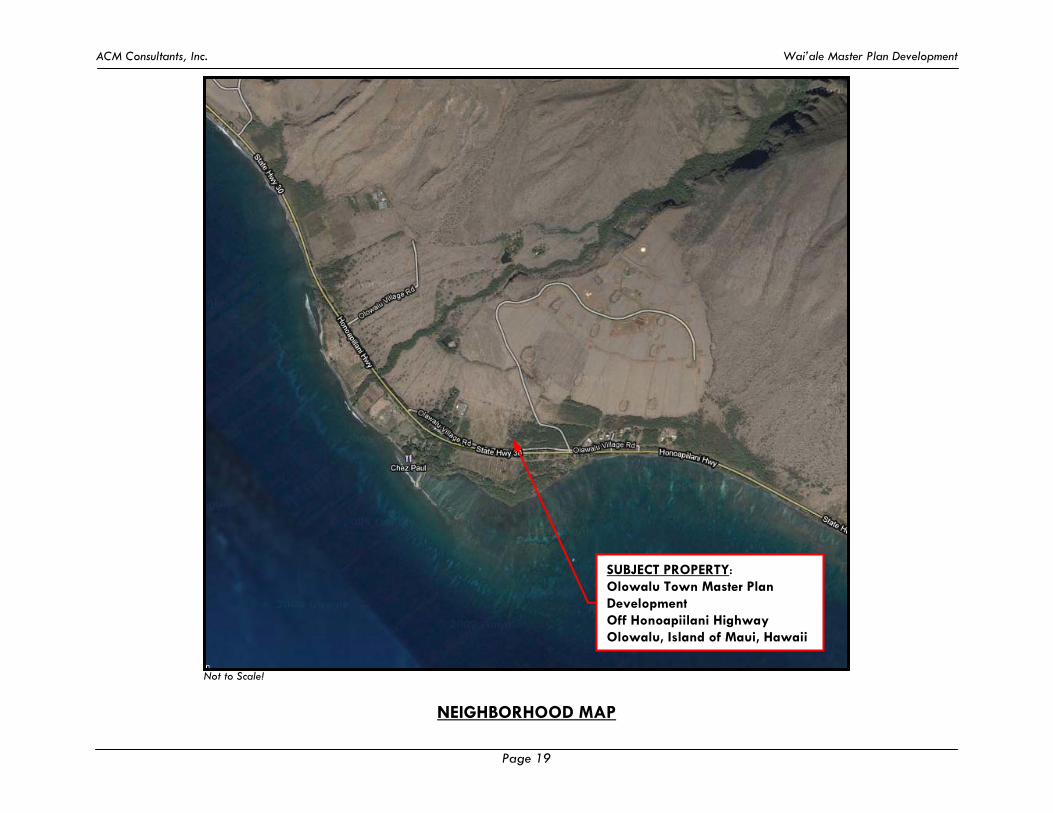
Development also reflects the region's visitor and agricultural industries. Visitor accommodations are located at the shoreline along with necessary support facilities and residential communities. Kapalua and Kaanapali have developed into important visitor destination anchors while the old Lahaina Town with its historic character and charm has developed into the regions visitor, service, commercial and residential center. Small plantation camps and agricultural communities are located further inland. Access to Lahaina from other parts of Maui is via Honoapiilani Highway, a State thoroughfare consisting of two asphalt-paved lanes, which widens to four lanes between Lahaina and Kaanapali. Extending past Launiupoko Park to the south of Honokowai Park is a proposed Lahaina by-pass.
ACM Consultants, Inc. Wai’ale Master Plan Development
Page 19
Not to Scale!
NEIGHBORHOOD MAP
SUBJECT PROPERTY: Olowalu Town Master Plan Development Off Honoapiilani Highway Olowalu, Island of Maui, Hawaii
ACM Consultants, Inc. Olowalu Town
Page 20
In order to fully understand and appreciate the potential for expansion, as well as factors that could limit the growth of this region, a brief summary of recent or proposed developments in this area, along with a few important issues facing future development are in order.
Residential Population and urban settlements in the Lahaina region are located at Olowalu and in a narrow band along the shoreline between the southern end of Lahaina and Kapalua. At Lahaina Town, settlement patterns extend mauka at Wahikuli and along Lahainaluna Road. This development pattern is set in the midst of former sugar cane and pineapple fields, at the base of the West Maui Mountains.
Residential neighborhoods directly in Lahaina Town are generally older, and many of the wood-framed dwellings (over 50 years old) are slowly being replaced with new homes. These properties were subdivided prior to the inception of the Maui County Code; consequently, land sizes of residential properties in Lahaina may vary anywhere from 1,600 to 30,000+ square feet instead of the 6,000 square foot minimum requirement set by the Maui County Code.
Only a handful of new residential subdivisions or condominium projects have been developed within the past few years. The most recent projects include the Mahanalua Nui, Makila and Pu`unoa agricultural subdivisions in the Launiupoko neighborhood, Lanikeha and Kaanapali Coffee Estates in Kaanapali; the Kapua Village Subdivision and Villas at Kahana Ridge in Kahana; and Honolua Ridge in Kapalua. With the continued demand for workforce housing in West Maui, more focus has been made on the development of affordable units. One such contributor was Kapua Village, an employee housing project for Maui Land and Pineapple employees built in 2003. It consists of 46 affordable, single-family residential lots in the Kahana neighborhood of West Maui. The other project to bring affordable housing units to the region was the Villas at Kahana Ridge condominium project which added 117 affordable units to the market in 2005. Both projects were well received and sold out in a short time period. Recently completed condominium projects on the West Side include Opukea in Lahaina, West Maui Breakers in Honokowai, as well as the Honua Kai development on Kaanapali Beach which is the first new oceanfront condominium development in this area in 20 years.
Commercial Lahaina Town, the central hub of the Lahaina area, was once the capital of the State of Hawaii. Since the move of the capital to Honolulu, Lahaina Town has transformed into a major visitor oriented area replete with shopping centers, boutiques, and restaurants. It also contains the central business district of this region, with a number of
ACM Consultants, Inc. Olowalu Town
Page 21
professional office buildings, financial institutions, post office, medical facilities and service businesses. These types of businesses are situated along the interior roadways of Dickenson Street, Wainee Street, Papalaua Street, and Lahainaluna Road.
The 600 to 800 blocks of Front Street, situated along the ocean, are a shopping mecca frequented by hundreds of tourists each day. This popular commercial corridor commands the highest retail rents on Maui. One of the major developments on the 600 block is the Wharf Cinema Center which contains three levels of retail and restaurant space which is a popular stop for tourists and residents. Built in 1978, it reflects a traditional look of old, wooden oceanfront buildings. Also on the 600 block is the redeveloped Six Fathoms building, a retail building which has generated renewed interest in this southern section of the shopping district. At the northern end of the corridor is Lahaina Center, a 150,000 square foot commercial complex with an 800-stall parking lot. It includes such tenants as the Hard Rock Café, Hilo Hatties, and Ruth Chris Steak House and a multi-screen movie theater.
The other major retail area is situated approximately 5 miles northeast of Lahaina Town in the planned development of Kaanapali. The exclusive Kaanapali Resort is home to a number of hotels including the Hyatt Regency, Marriott, Westin, and Sheraton. Besides the luxurious hotels, Kaanapali includes all of the resort-type amenities including condominium developments, championship golf courses, custom single family homes, restaurants, shopping and other recreational facilities. Whalers Village sits on 8.5 acres of prime Kaanapali oceanfront property with close to 60 shops and restaurants, a food court and whale museum. Developments such as the Hyatt Regency, Maui Marriott Hotel, Kapalua Resort, the Lahaina Cannery Shopping Center, along with numerous new businesses geared primarily to the visitor trade, had strengthened the employment center of West Maui. Since late-2008, West Maui has seen a drop in tourism numbers, similar to the rest of the State. This was attributed to the global financial crisis, which stalled economic growth nationwide. This has led to the closure of businesses and created a number of retail vacancies. Even Lahaina Town, which rarely has available commercial space, has seen a significant drop in asking rents. Meanwhile, several ongoing projects were completed, and are expected to have a significant impact in West Maui. The Ritz-Carlton Kapalua completed a 180 million dollar transformation in 2008 and now provides 463 guest rooms, Club level accommodations and the addition of one and two bedroom Residential Suites. The hotel is tiered down a 37-acre hillside and includes a spa, four world-class
ACM Consultants, Inc. Olowalu Town
Page 22
restaurants, fitness center, tri-level swimming pool, and over 150,000 square feet of meeting space.
In 2008, West Maui also saw the opening of Lahaina Gateway. This 145,000-square foot center is perched on an 11-acre site directly across Lahaina Cannery Mall. Dubbed a neighborhood "lifestyle" center, this shopping destination features specialty stores and service providers including Barnes & Noble, Outback Steakhouse, Melting Pot, Office Max, and Lahaina Farms, in addition to many other smaller businesses. Directly across Keawe Street, construction also began on a Burger King, Kentucky Fried Chicken, Panda Express and Walgreens. There are two industrial parks in Lahaina: The Lahaina Business Park and the Wili Ko Industrial Subdivision. The Lahaina Business Park is the newest development with recently completed buildings in both Phases I and II. One of the largest projects within the park is the Emerald Plaza complex which consists of three phases, comprised of Emerald Plaza, Emerald Plaza Center and Emerald Plaza Place. These developments have seen regular sales of their spaces within the past several years. Continued building within both phases of the park is expected to continue through the next few years.
After more than 20 years of discussion, planning and design, the construction of the Lahaina by-pass began in April 2009. Extending past Launiupoko Park to the south of Honokowai Park, the 9-mile corridor should relieve much of Lahaina Town’s traffic congestion when completed.
Conclusion All public utilities including electricity, water, telephone and sewer
service are available to the greater Lahaina area. Police and fire protection are provided by stations directly in Lahaina, as well as ambulance service. Shopping, schools, and other commercial, civic, recreational and religious facilities are located within Lahaina Town. Airline service to the Lahaina area is provided by commuter airlines into the Kapalua-West Maui Airport.
In previous years, the primary source of employment was provided by the Pioneer Mill. Since the mill’s closure, however, the development of hotel resorts had created new job opportunities and the demand for employees had grown substantially. This demand for employees spurred growth in the area and also growth in commercial and other support activities. Inherent with this growth is the strain on the limited infrastructure in West Maui, as well as a keen shortage of available and affordable housing.
Due to the large land holdings of private companies and the State of Hawaii, available land in Lahaina for private, individual ownership is limited and subsequently, land values have risen steadily. The
ACM Consultants, Inc. Olowalu Town
Page 23
availability of affordable residential lots is expected to be in short supply for the foreseeable future.
The continued growth of Lahaina as a large urban area, as well as a major resort destination, is anticipated to be a catalyst for further growth in residential, commercial and various support facilities over the long term.
ACM Consultants, Inc. Olowalu Town
Page 24
C. PROJECT DATA Environs The subject is located on the southwestern foothills of West Maui
Mountains, approximately four (4) miles south of Lahaina Town. Olowalu Town is presently a small residential community with limited services available to residents, including Olowalu General Store. Surrounding the store are plantation-era single-family residences, including a residential cluster located to the south, known as Kapaiki Village, and the former plantation manager’s house, associated residences, and Camp Olowalu (formerly Camp Pacusa) located makai of Honoapiilani Highway.
The lands surrounding Olowalu have been utilized for small farming
operating or have remained fallow. The lands that comprise Olowalu have been subdivided, with a limited number of lots sold to individual purchasers. The majority of the lands surrounding the existing village are retained under ownership by Olowalu Elua Associates, LLC and Olowalu Ekolu, LLC.
Description of the Proposed Project The subject currently consists of twenty-two (22) agricultural parcels
and five (5) roadway lots encompassing approximately 635 acres. The Olowalu Town Master Plan will combine conservation, agricultural, rural and urban land uses to re-establish a small-scale and mixed-use community as a center of employment, housing and recreation. The Master Plan will also be guided by the values and principles of the “Ahupuaa” which will re-establish agricultural uses along Olowalu Stream.
Olowalu Town Master Plan is designed to be a pedestrian-friendly
community which will allow residents to live within walking distance of corner stores, schools, parks, employment centers, gathering areas, beaches/shoreline, and other social and civic resources, ultimately reducing reliance on automobiles. This “mixed-use community” will provide for a wide series of uses, including residential, commercial/business, agricultural, civic, social, parks, and open-space. The land uses will be categorized into a range of zones which will transition from the central neighborhood town centers to rural to agricultural and natural.
The Olowalu community will consist of 1,500 residential dwelling units
to be built concurrent with appropriate infrastructure in phases spread out over a period of approximately 8 to 10 years. The majority of the dwelling units will be located within the urban zones where residents will have easy access to daily goods and services. A variety of single-family and multi-family dwellings are included in the Master Plan, comprised of houses, condominiums, apartments, flex house (live-
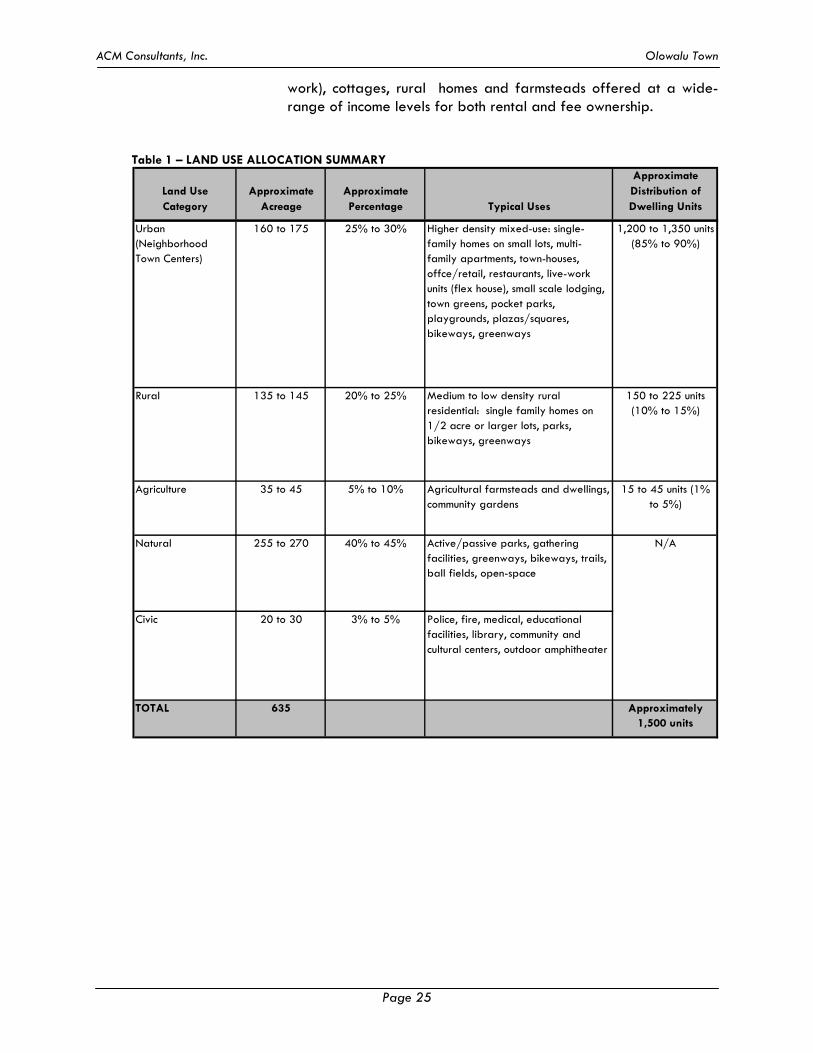
ACM Consultants, Inc. Olowalu Town
Page 25
work), cottages, rural homes and farmsteads offered at a wide-range of income levels for both rental and fee ownership.
Table 1 – LAND USE ALLOCATION SUMMARY Approximate
Land Use Approximate Approximate Distribution ofCategory Acreage Percentage Typical Uses Dwelling Units
Urban (Neighborhood Town Centers)
160 to 175 25% to 30% Higher density mixed-use: single-family homes on small lots, multi-family apartments, town-houses, offce/retail, restaurants, live-work units (flex house), small scale lodging, town greens, pocket parks, playgrounds, plazas/squares, bikeways, greenways
1,200 to 1,350 units (85% to 90%)
Rural 135 to 145 20% to 25% Medium to low density rural residential: single family homes on 1/2 acre or larger lots, parks, bikeways, greenways
150 to 225 units (10% to 15%)
Agriculture 35 to 45 5% to 10% Agricultural farmsteads and dwellings, community gardens
15 to 45 units (1% to 5%)
Natural 255 to 270 40% to 45% Active/passive parks, gathering facilities, greenways, bikeways, trails, ball fields, open-space
N/A
Civic 20 to 30 3% to 5% Police, fire, medical, educational facilities, library, community and cultural centers, outdoor amphitheater
TOTAL 635 Approximately 1,500 units
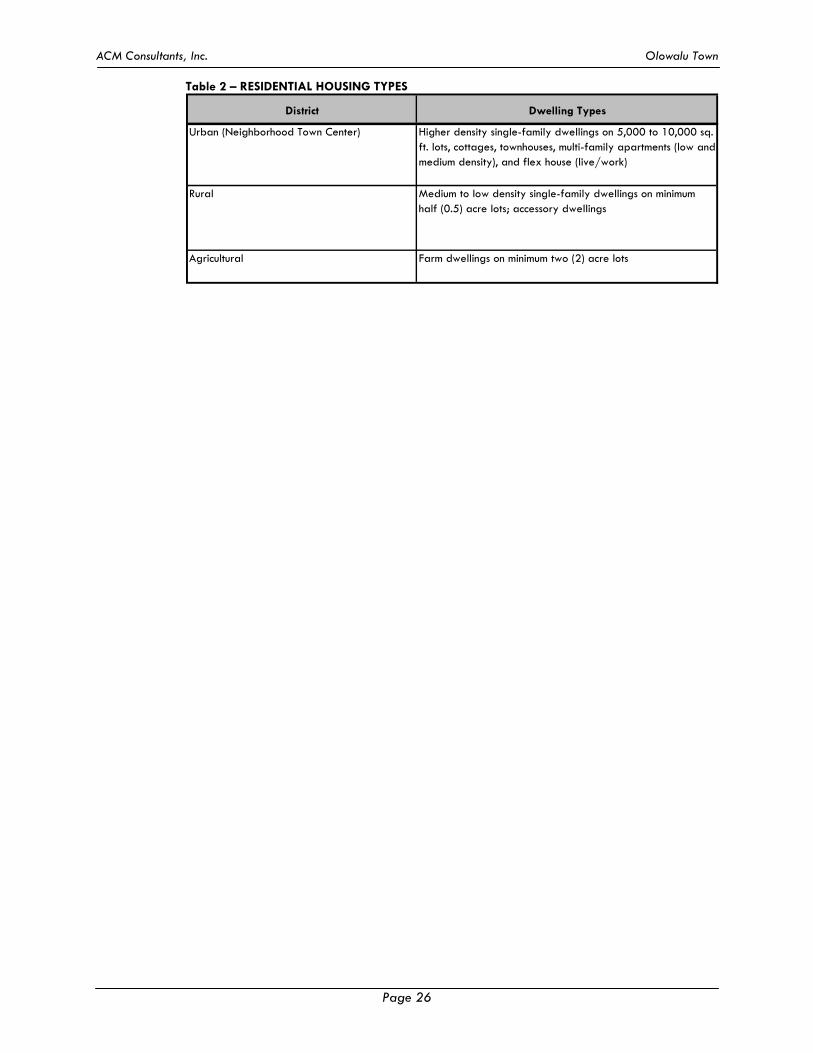
ACM Consultants, Inc. Olowalu Town
Page 26
Table 2 – RESIDENTIAL HOUSING TYPES
District Dwelling Types
Urban (Neighborhood Town Center) Higher density single-family dwellings on 5,000 to 10,000 sq. ft. lots, cottages, townhouses, multi-family apartments (low and medium density), and flex house (live/work)
Rural Medium to low density single-family dwellings on minimum half (0.5) acre lots; accessory dwellings
Agricultural Farm dwellings on minimum two (2) acre lots
ACM Consultants, Inc. Olowalu Town
Page 27
PART III – ANALYSIS AND CONCLUSION
For the purpose of estimating the market response to this planned development, a market study was conducted to determine how supply and demand for residential housing units, as well as commercial and agricultural properties might be affected by the development of the subject's 635 acres.
OVERVIEW When determining an absorption rate for an individual project, such
as a single-family residential subdivision or one multi-family residential development, there are typically two components: First is the design and pricing of the proposed project. Second is the overall market environment at the time of pre-sale and project completion. The latter is obviously more difficult to define because it involves forecasting such variables as interest rates, overall market conditions, and general and specific sector real estate market conditions.
The added complication with most projects is the time frames and time lags involved. Since most subdivisions or condominium projects take several years between conception and completion, market and interest rate conditions can change significantly. Thus, a project may commence in a favorable environment and be completed in an unfavorable one (or vice versa). Furthermore, real estate is a cyclical industry and sales activity tends to move in spurts. It is not unusual for a new project to sell half its units in the first year of marketing and require 2 to 3 years (or longer) to sell the remaining half. However, accurately predicting an absorption rate becomes even more challenging for a large-scale planned development, like the subject, where full build-out may take up to 10 years or longer. Of course, these time periods could expand or contract depending upon market conditions. Thus, the notion of a linear sales rate may be deemed unrealistic for practical purposes, but is a useful and convenient tool for planning. In light of the significant changes currently underway for numerous County of Maui planning policies, such as the Countywide Policy Plan and Maui Island Plan, the Consultant has primarily focused on long-term supply and demand characteristics to give the reader the best perspective of the overall market.
A. RESIDENTIAL MARKET ANALYSIS RESIDENTIAL SUPPLY CHARACTERISTICS Olowalu Town is conveniently located between South Maui and West
Maui, but is categorized as being within the West Maui district. It
ACM Consultants, Inc. Olowalu Town
Page 28
follows that the subject’s primary market area is the West Maui region, while Central Maui, South Maui and Upcountry Maui are expected to be secondary markets. West Maui is a major tourist destination and is home to the famous Front Street retail corridor which allows for pedestrian access to numerous retail establishments within Old Lahaina Town. Further north of Lahaina are the Kaanapali and Kapalua master planned resorts. Central Maui is home to the County and State government offices and is the industrial center of the island with convenient access to the major transportation facilities. South Maui has become a tourist destination with its expansive beaches and retail establishments targeted towards the visitor industry. The resort neighborhoods of Wailea and Makena are also located in South Maui. Upcountry Maui consists primarily of rural residential subdivisions and agricultural farmland.
A survey of the market revealed that there are over 2,300 housing units currently for sale within recent, on-going projects and those developments which are planned for constructed within the next one to two years. Based solely on historical annual absorption rates of other new projects (590 units per year), the short-term market supply would be expected to last approximately 4 years. Of course, a multitude of other factors can influence the capture rate. For instance, the larger percentage of affordable units in the future supply points to a faster-than-normal absorption. Also, the number of buyers from the U.S. mainland and from foreign countries can fluctuate from year to year, and their presence in the market is not as predictable as the demand from local residents. Olowalu Town is being created to help fulfill long-term residential supply on the island; however, it is very difficult to accurately predict future residential supply over the long term. As mentioned earlier, many external factors, such as economic or social factors, could affect the supply and demand for real estate in the future. These factors cannot be controlled by developers who must constantly assess market conditions for their prospective construction and sales periods. Many of these projects are still in the initial planning phases and must still complete governmental requirements before bringing their products to the market. Combine these factors with “internal” events that could affect a developer and predicting which developments will actually make it to market becomes more difficult. The following information was excerpted from a “Directed Growth Areas Listing and Units” table, dated October 1, 2009. This table listed the long-tem future supply recommendations of the Draft Maui Island Plan, for consideration by the Maui County Council. As shown, the estimated supply for Maui, to the year 2030, is 11,623 housing units. Central Maui has the largest share of future housing units on the island, with 4,850 units planned. The largest component of future
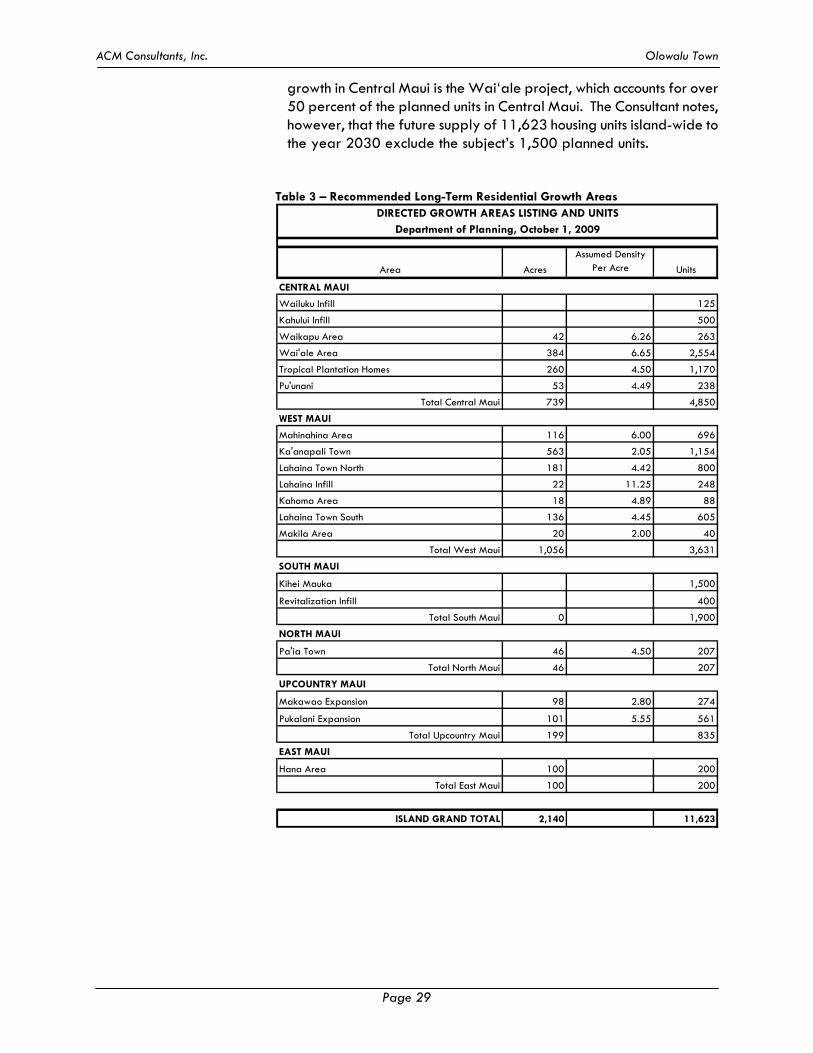
ACM Consultants, Inc. Olowalu Town
Page 29
growth in Central Maui is the Waiʻale project, which accounts for over 50 percent of the planned units in Central Maui. The Consultant notes, however, that the future supply of 11,623 housing units island-wide to the year 2030 exclude the subject’s 1,500 planned units.
Table 3 – Recommended Long-Term Residential Growth Areas DIRECTED GROWTH AREAS LISTING AND UNITS
Department of Planning, October 1, 2009
Area Acres
Assumed Density Per Acre Units
CENTRAL MAUI
Wailuku Infill 125
Kahului Infill 500
Waikapu Area 42 6.26 263
Wai'ale Area 384 6.65 2,554
Tropical Plantation Homes 260 4.50 1,170
Pu'unani 53 4.49 238
Total Central Maui 739 4,850
WEST MAUI
Mahinahina Area 116 6.00 696
Ka'anapali Town 563 2.05 1,154
Lahaina Town North 181 4.42 800
Lahaina Infill 22 11.25 248
Kahoma Area 18 4.89 88
Lahaina Town South 136 4.45 605
Makila Area 20 2.00 40
Total West Maui 1,056 3,631
SOUTH MAUI
Kihei Mauka 1,500
Revitalization Infill 400
Total South Maui 0 1,900
NORTH MAUI
Pa'ia Town 46 4.50 207
Total North Maui 46 207
UPCOUNTRY MAUI
Makawao Expansion 98 2.80 274
Pukalani Expansion 101 5.55 561
Total Upcountry Maui 199 835
EAST MAUI
Hana Area 100 200
Total East Maui 100 200
ISLAND GRAND TOTAL 2,140 11,623
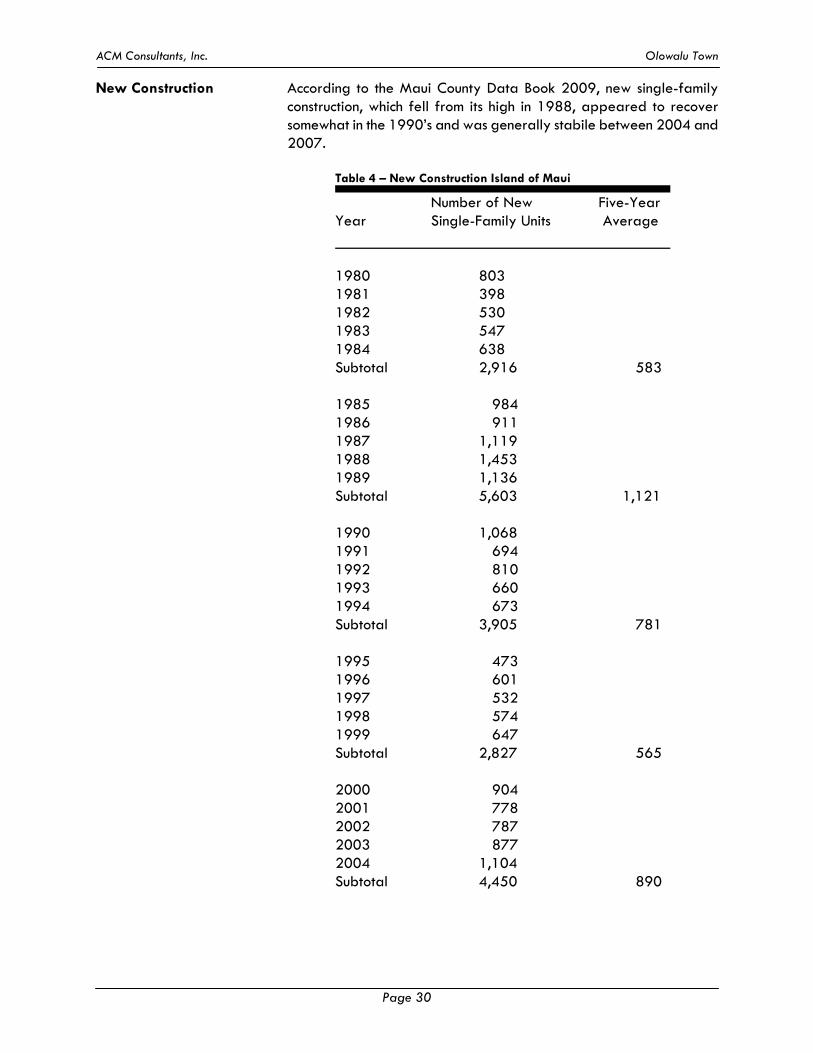
ACM Consultants, Inc. Olowalu Town
Page 30
New Construction According to the Maui County Data Book 2009, new single-family construction, which fell from its high in 1988, appeared to recover somewhat in the 1990’s and was generally stabile between 2004 and 2007.
Table 4 – New Construction Island of Maui
Number of New Five-Year Year Single-Family Units Average
1980 803 1981 398 1982 530 1983 547 1984 638 Subtotal 2,916 583
1985 984 1986 911 1987 1,119 1988 1,453 1989 1,136 Subtotal 5,603 1,121
1990 1,068 1991 694 1992 810 1993 660 1994 673 Subtotal 3,905 781
1995 473 1996 601 1997 532 1998 574 1999 647 Subtotal 2,827 565
2000 904 2001 778 2002 787 2003 877 2004 1,104 Subtotal 4,450 890
ACM Consultants, Inc. Olowalu Town
Page 31
2005 967 2006 1,008 2007 1,050 2008 527 2009 273 Subtotal 3,825 765 Source: Maui County Data Books 2002 through 2010
New single-family construction averaged 583 units during the five years between 1980 and 1984. During the next five years, 1985 to 1989, single-family housing starts increased significantly to an average of 1,121 per year. During 1990, house construction was also good at 1,068 units, but declined significantly following the Persian Gulf War and the economic slowdowns on the U.S. mainland and in Japan. Consequently, between 1990 and 1994, there was an average of 781 new single-family units built per year. From 1995 to 1999, construction of these units declined even more, with an average of only 565 units per year. In 2000, the number increased significantly to 904 units and then declined in 2001 to 778 units. The number of units remained nearly identical in 2002 with 787 units. In 2003 this number increased again to 877 units. Single family building permits in 2004 reached a total of 1,104, which is its highest level since the late 1980’s, prior to declining to 967 in 2005. A small rebound to 1,008 was realized in 2006, followed by an increase to 1,050 in 2007. In 2008, there was a huge drop in permits issued, to only 527, and a further decrease in 2009 to only 273 permits. (Refer to Table 4, starting on Page 30). The average for the past 5 years is 765 units per year.
Currently, revisions to Maui’s urban growth boundary are being considered by the County Council. Land located outside the boundary may have a more difficult time becoming entitled, which would translate into less project starts. Without an adequate supply of new construction projects, the resulting shortage of housing typically causes prices in general to move up. As a result, those at the bottom end of the income scale usually find it most difficult to purchase real estate. Historically, supply has lagged demand and is a significant limiting factor in the affordability of real estate in the Maui market.
Maui County Workforce Housing Ordinance In December 2006, the Maui County Council enacted the Residential
Workforce Housing Ordinance. The purpose of the ordinance is to enhance the public welfare by ensuring that the housing needs of the County are addressed. The intent of the policy is to encourage the provision and maintenance of residential workforce housing units, for both purchase and rental, to meet the needs of income-qualified
ACM Consultants, Inc. Olowalu Town
Page 32
households for the workforce, students, and special housing target groups.
Essentially, all applicable residential development after the passage of this ordinance, including the subdivision of land and/or the construction of single-family dwelling units; two-family dwelling units; multifamily dwelling units; or hotels; shall be subject to the policy upon final subdivision or building permit approval. Applicable residential development includes, in part: five or more dwelling units, excluding farm labor dwellings or a second farm dwelling, not part of a condominium property regime; five or more new lots; a combination of dwelling units and new lots totaling five or more. Prior to final subdivision approval or issuance of a building permit for a development, the developer was to enter into a residential workforce housing agreement that required forty percent of the total number of units and/or lots to be sold or rented to residents within established income-qualified groups, when more than fifty percent of the dwelling units and/or new lots in the development were to be offered for sale for less than $600,000. When fifty percent or more of the dwelling units and/or new lots in the development were to be offered for sale for $600,000 or more, fifty percent of the total number of units and/or lots was to be sold or rented to residents within established income-qualified groups. Landowners who had already received entitlements, or were at least in the approval or permitting process, were granted an exemption from these requirements; and clearly have an advantage over those who began their entitlement process post-passage. One of the initial concerns to developers was the reduction in sales revenue. Coupled with unprecedented increases in construction costs, potential projects could become financially unfeasible. Since the passage of this ordinance, there has been a notable drop in new residential construction project starts. Granted, the downward trend of the real estate market, mixed with declining national and local economic conditions, has also led to less construction. However, many in the building industry are of the opinion that the Workforce Housing Ordinance has had the opposite effect from its original intent. In February 2010, the Maui County Council revisited this ordinance and made several revisions, including reducing the amount of required affordable housing units built on site to 25 percent, provided the average sales price of the market units is projected to be less than $600,000. If the average sales price in the project is $600,000 or more, then 50 percent of the units must be affordably priced. The amended law also clarified the calculation of required affordable
ACM Consultants, Inc. Olowalu Town
Page 33
units built off site; based on 50 percent of the total number of on-site market units, regardless of their projected average sales price. The Olowalu Town Master Plan Development calls for 1,500 residential units. Of this total, the developer will provide 750 homes (single-family and multi-family) to satisfy the County’s workforce housing ordinance.
Maui County Water Availability Ordinance In December 2007, the Maui County Council enacted the “water
availability policy”, identified as Title 14 of the Maui County Code. The purpose of the ordinance is to acknowledge and affirm that water is a natural and cultural resource that must be protected, preserved and managed as a public trust, and requires verification of a long-term, reliable supply of water before subdivisions are approved. This policy applies to all new subdivisions with the exception of family subdivisions and subdivisions that will not be regulated by a public water system. In essence, this policy requires developers who want to build a subdivision or condominiums to first prove to Maui County that they have a long-term source of water. The policy stipulates that no subdivision shall be approved, unless prior to submittal of subdivision construction plans, the director shall provide written verification of a long-term, reliable supply of water. Written verification by the County shall not constitute an assurance, covenant, or warranty by the County of water source from a private, non-County system. Many developers on Maui have been outspoken critics of the ordinance, even calling it a de facto moratorium on housing. Developers have also complained that the ordinance will halt some much-needed new construction. However, proponents of the policy say that the ordinance is a significant step toward getting Maui’s water shortfall under control. Furthermore, it closes a long-standing loophole for developers that held the County responsible for providing water service. For example, a developer could go through the entire process of planning, developing and selling the lots in a subdivision without guaranteeing the home buyers that they would receive a water meter from the County. As of the effective date of this report, the property owner is exploring numerous options regarding water service for Olowalu. These would include creating additional sources in partnership with the County, as well as the development of a private system. Wastewater disposal will likely be accomplished by connection to the County system, however, engineering studies and discussions with the County are ongoing.
ACM Consultants, Inc. Olowalu Town
Page 34
RESIDENTIAL DEMAND CHARACTERISTICS
Demand is analyzed from two perspectives: The first is “demographic” demand, the number of units needed for a given market or employment base. Second is “effective” demand, the financial demand equation which involves looking at the number of buyers who would be qualified and interested in purchasing residential real estate.
Population Population growth on Maui between 1980 and 1990 had been exceptionally high, and had outpaced the County's ability to provide adequate infrastructure and housing for this added number of people. Overall, population growth for the County of Maui during 1980 to 1990 was 41.67 percent. With this growth in population came a surge in real estate prices in the late-1980s. This increase, driven primarily by foreign and domestic investment and speculation, put the price of homes in Maui County well above the reach of many local residents, and affordable housing became a major concern to everyone.
The downturn in the economy between 1991 and 1997 led to the development of lower-priced housing as large land parcels became more affordable to developers. Zero-lot-line zoning was adopted by the County of Maui and the Meadowlands project in Kihei was among the first to be built. Three smaller zero-lot-line subdivisions were developed in West Maui between 1996 and 1998 and were highly successful.
Meanwhile, the population of Maui County continued to grow during the 1990s. Between the 1990 and 2000 censuses the population increased by 28.5 percent, making Maui the fastest growing County in the State of Hawaii. According to Claritas Market Comparison Report (See Exhibit A at the end of this report), leading the growth on Maui was the South Maui (Maalaea-Kihei-Wailea-Makena CDPs) region which reflected growth of 49.0 percent increase over the 10-year period. The Central Maui region of Kahului and Wailuku registered growth of 26.5 percent; while the West Maui region indicated a growth factor of 23.3 percent over the same 10-year period. The growth trend has continued since the end of 2000. The 2010 population estimates have indicated growth rates for South and West Maui in the 18 to 21 percent range, while growth in Central Maui has increased by approximately 14.5 percent over the respective population indicated in the 2000 census. The growth in the number of households between 1990 and 2000 paralleled the population pattern. Household numbers grew in the south, west and central regions at the respective rates of 46.4, 23.9 and 26.4 percent.
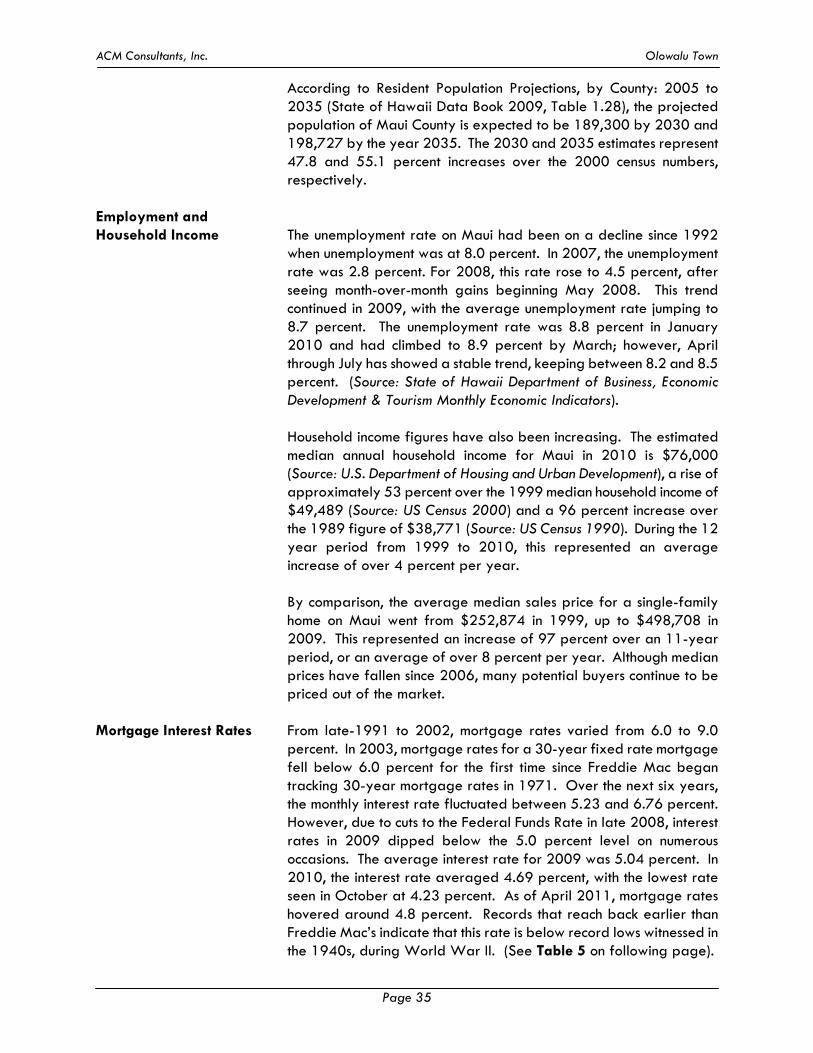
ACM Consultants, Inc. Olowalu Town
Page 35
According to Resident Population Projections, by County: 2005 to 2035 (State of Hawaii Data Book 2009, Table 1.28), the projected population of Maui County is expected to be 189,300 by 2030 and 198,727 by the year 2035. The 2030 and 2035 estimates represent 47.8 and 55.1 percent increases over the 2000 census numbers, respectively.
Employment and Household Income The unemployment rate on Maui had been on a decline since 1992
when unemployment was at 8.0 percent. In 2007, the unemployment rate was 2.8 percent. For 2008, this rate rose to 4.5 percent, after seeing month-over-month gains beginning May 2008. This trend continued in 2009, with the average unemployment rate jumping to 8.7 percent. The unemployment rate was 8.8 percent in January 2010 and had climbed to 8.9 percent by March; however, April through July has showed a stable trend, keeping between 8.2 and 8.5 percent. (Source: State of Hawaii Department of Business, Economic Development & Tourism Monthly Economic Indicators). Household income figures have also been increasing. The estimated median annual household income for Maui in 2010 is $76,000 (Source: U.S. Department of Housing and Urban Development), a rise of approximately 53 percent over the 1999 median household income of $49,489 (Source: US Census 2000) and a 96 percent increase over the 1989 figure of $38,771 (Source: US Census 1990). During the 12 year period from 1999 to 2010, this represented an average increase of over 4 percent per year. By comparison, the average median sales price for a single-family home on Maui went from $252,874 in 1999, up to $498,708 in 2009. This represented an increase of 97 percent over an 11-year period, or an average of over 8 percent per year. Although median prices have fallen since 2006, many potential buyers continue to be priced out of the market.
Mortgage Interest Rates From late-1991 to 2002, mortgage rates varied from 6.0 to 9.0
percent. In 2003, mortgage rates for a 30-year fixed rate mortgage fell below 6.0 percent for the first time since Freddie Mac began tracking 30-year mortgage rates in 1971. Over the next six years, the monthly interest rate fluctuated between 5.23 and 6.76 percent. However, due to cuts to the Federal Funds Rate in late 2008, interest rates in 2009 dipped below the 5.0 percent level on numerous occasions. The average interest rate for 2009 was 5.04 percent. In 2010, the interest rate averaged 4.69 percent, with the lowest rate seen in October at 4.23 percent. As of April 2011, mortgage rates hovered around 4.8 percent. Records that reach back earlier than Freddie Mac’s indicate that this rate is below record lows witnessed in the 1940s, during World War II. (See Table 5 on following page).
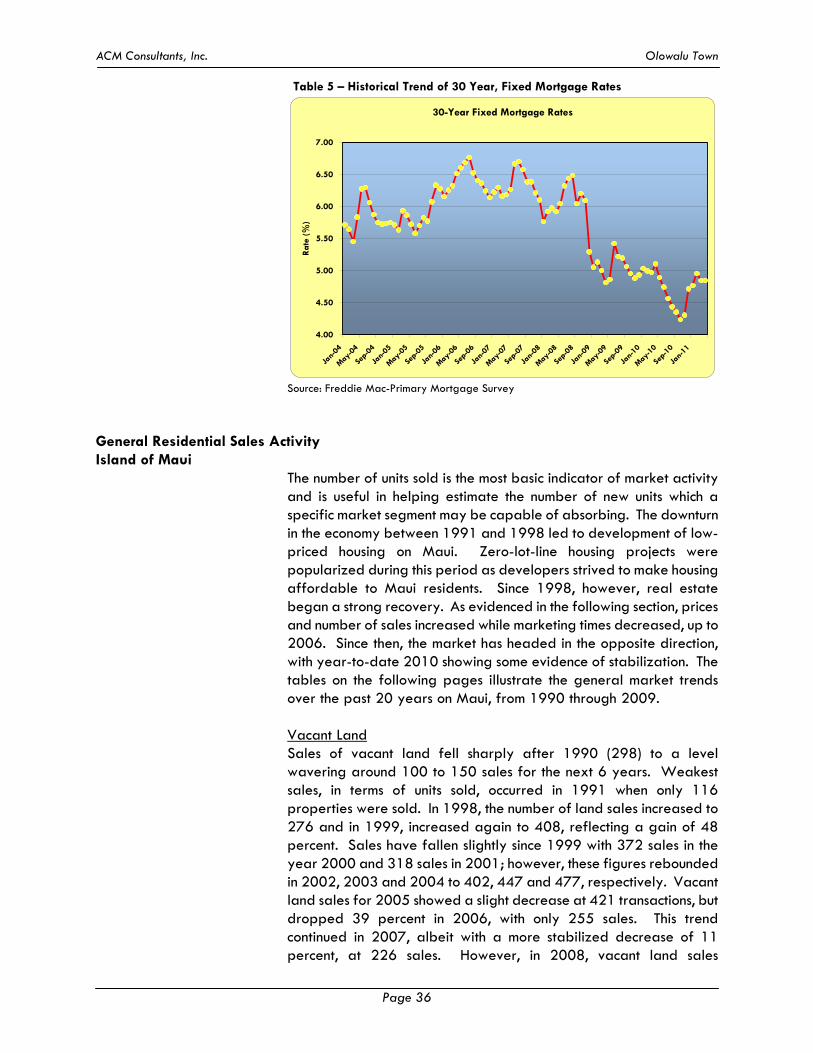
ACM Consultants, Inc. Olowalu Town
Page 36
Table 5 – Historical Trend of 30 Year, Fixed Mortgage Rates
30-Year Fixed Mortgage Rates
4.00
4.50
5.00
5.50
6.00
6.50
7.00
Jan-
04
May
-04
Sep-
04
Jan-
05
May
-05
Sep-
05
Jan-
06
May
-06
Sep-
06
Jan-
07
May
-07
Sep-
07
Jan-
08
May
-08
Sep-
08
Jan-
09
May
-09
Sep-
09
Jan-
10
May
-10
Sep-
10
Jan-
11
Rat
e (%
)
Source: Freddie Mac-Primary Mortgage Survey
General Residential Sales Activity Island of Maui
The number of units sold is the most basic indicator of market activity and is useful in helping estimate the number of new units which a specific market segment may be capable of absorbing. The downturn in the economy between 1991 and 1998 led to development of low-priced housing on Maui. Zero-lot-line housing projects were popularized during this period as developers strived to make housing affordable to Maui residents. Since 1998, however, real estate began a strong recovery. As evidenced in the following section, prices and number of sales increased while marketing times decreased, up to 2006. Since then, the market has headed in the opposite direction, with year-to-date 2010 showing some evidence of stabilization. The tables on the following pages illustrate the general market trends over the past 20 years on Maui, from 1990 through 2009. Vacant Land Sales of vacant land fell sharply after 1990 (298) to a level wavering around 100 to 150 sales for the next 6 years. Weakest sales, in terms of units sold, occurred in 1991 when only 116 properties were sold. In 1998, the number of land sales increased to 276 and in 1999, increased again to 408, reflecting a gain of 48 percent. Sales have fallen slightly since 1999 with 372 sales in the year 2000 and 318 sales in 2001; however, these figures rebounded in 2002, 2003 and 2004 to 402, 447 and 477, respectively. Vacant land sales for 2005 showed a slight decrease at 421 transactions, but dropped 39 percent in 2006, with only 255 sales. This trend continued in 2007, albeit with a more stabilized decrease of 11 percent, at 226 sales. However, in 2008, vacant land sales
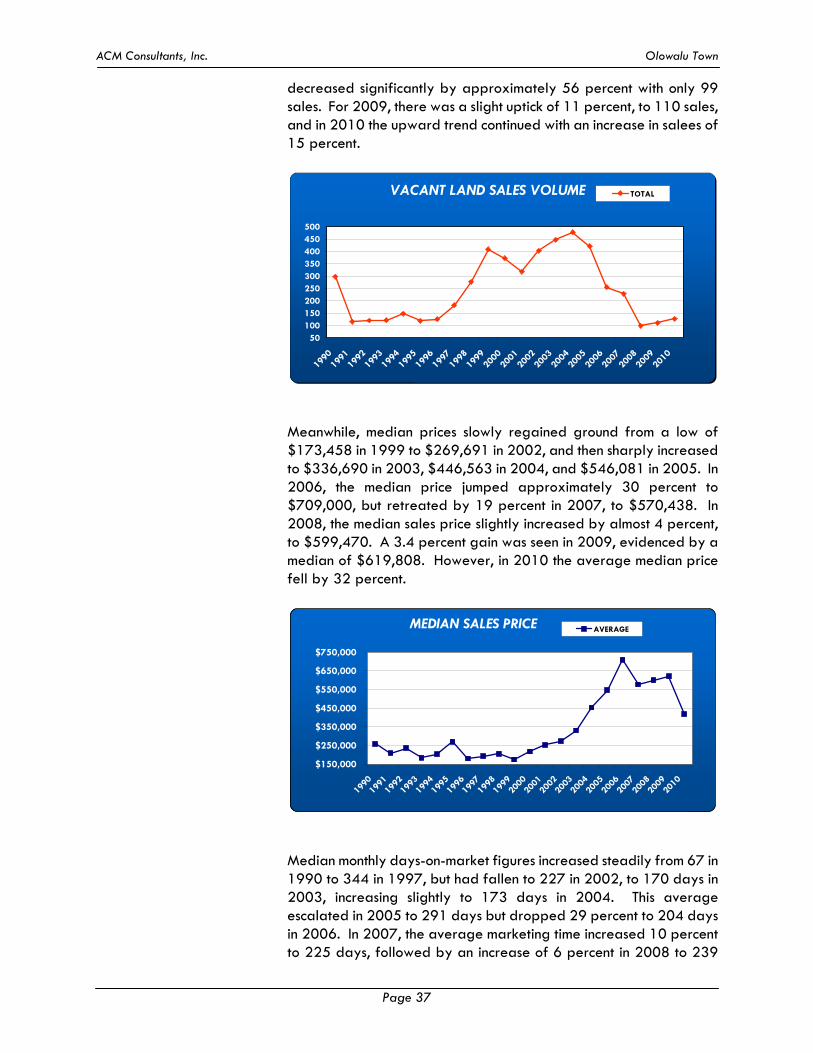
ACM Consultants, Inc. Olowalu Town
Page 37
decreased significantly by approximately 56 percent with only 99 sales. For 2009, there was a slight uptick of 11 percent, to 110 sales, and in 2010 the upward trend continued with an increase in salees of 15 percent.
VACANT LAND SALES VOLUME
50100150200250300350400450500
1990
1991
1992
1993
1994
1995
1996
1997
1998
1999
2000
2001
2002
2003
2004
2005
2006
2007
2008
2009
2010
TOTAL
Meanwhile, median prices slowly regained ground from a low of $173,458 in 1999 to $269,691 in 2002, and then sharply increased to $336,690 in 2003, $446,563 in 2004, and $546,081 in 2005. In 2006, the median price jumped approximately 30 percent to $709,000, but retreated by 19 percent in 2007, to $570,438. In 2008, the median sales price slightly increased by almost 4 percent, to $599,470. A 3.4 percent gain was seen in 2009, evidenced by a median of $619,808. However, in 2010 the average median price fell by 32 percent.
MEDIAN SALES PRICE
$150,000
$250,000
$350,000
$450,000
$550,000
$650,000
$750,000
1990
1991
1992
1993
1994
1995
1996
1997
1998
1999
2000
2001
2002
2003
2004
2005
2006
2007
2008
2009
2010
AVERAGE
Median monthly days-on-market figures increased steadily from 67 in 1990 to 344 in 1997, but had fallen to 227 in 2002, to 170 days in 2003, increasing slightly to 173 days in 2004. This average escalated in 2005 to 291 days but dropped 29 percent to 204 days in 2006. In 2007, the average marketing time increased 10 percent to 225 days, followed by an increase of 6 percent in 2008 to 239
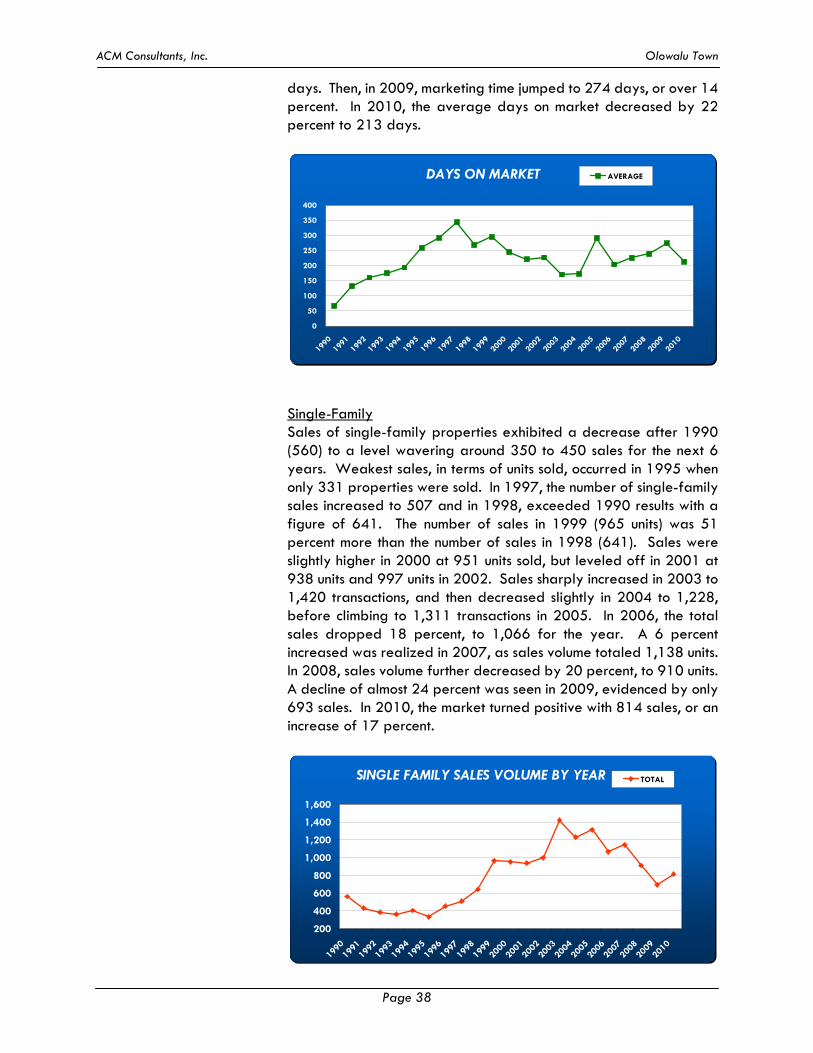
ACM Consultants, Inc. Olowalu Town
Page 38
days. Then, in 2009, marketing time jumped to 274 days, or over 14 percent. In 2010, the average days on market decreased by 22 percent to 213 days.
DAYS ON MARKET
0
50
100
150
200
250
300
350
400
1990
1991
1992
1993
1994
1995
1996
1997
1998
1999
2000
2001
2002
2003
2004
2005
2006
2007
2008
2009
2010
AVERAGE
Single-Family Sales of single-family properties exhibited a decrease after 1990 (560) to a level wavering around 350 to 450 sales for the next 6 years. Weakest sales, in terms of units sold, occurred in 1995 when only 331 properties were sold. In 1997, the number of single-family sales increased to 507 and in 1998, exceeded 1990 results with a figure of 641. The number of sales in 1999 (965 units) was 51 percent more than the number of sales in 1998 (641). Sales were slightly higher in 2000 at 951 units sold, but leveled off in 2001 at 938 units and 997 units in 2002. Sales sharply increased in 2003 to 1,420 transactions, and then decreased slightly in 2004 to 1,228, before climbing to 1,311 transactions in 2005. In 2006, the total sales dropped 18 percent, to 1,066 for the year. A 6 percent increased was realized in 2007, as sales volume totaled 1,138 units. In 2008, sales volume further decreased by 20 percent, to 910 units. A decline of almost 24 percent was seen in 2009, evidenced by only 693 sales. In 2010, the market turned positive with 814 sales, or an increase of 17 percent.
SINGLE FAMILY SALES VOLUME BY YEAR
200
400
600
800
1,000
1,200
1,400
1,600
1990
1991
1992
1993
1994
1995
1996
1997
1998
1999
2000
2001
2002
2003
2004
2005
2006
2007
2008
2009
2010
TOTAL
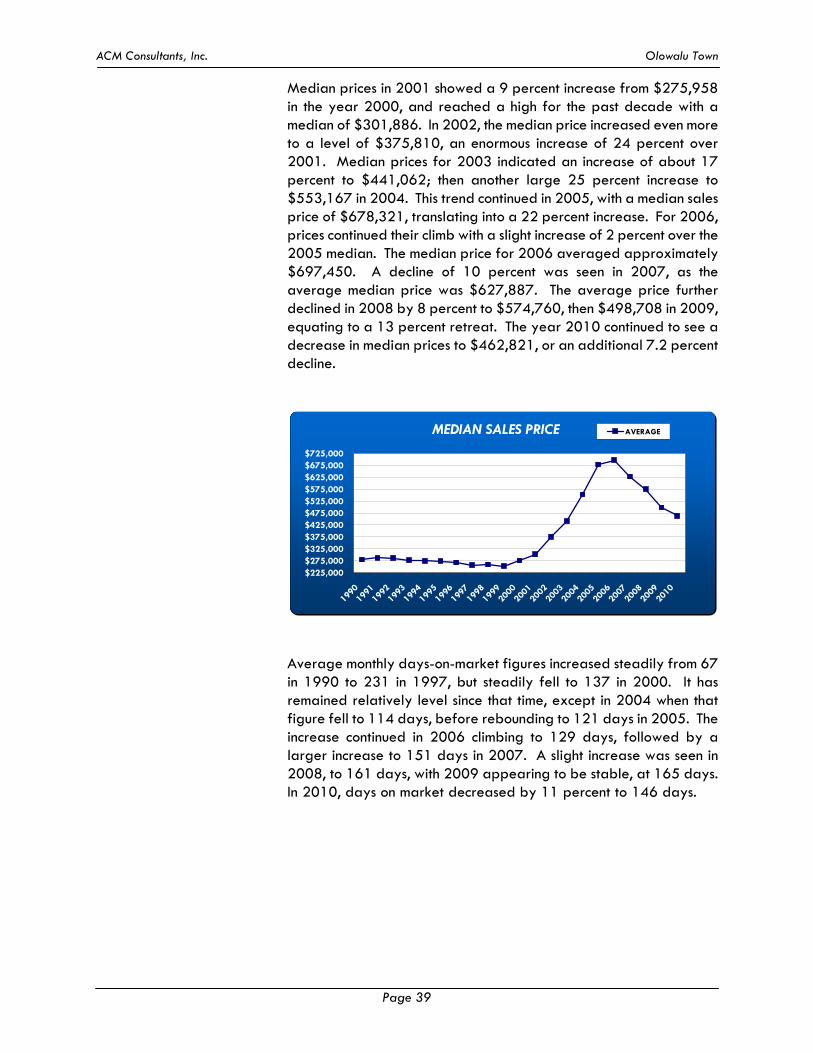
ACM Consultants, Inc. Olowalu Town
Page 39
Median prices in 2001 showed a 9 percent increase from $275,958 in the year 2000, and reached a high for the past decade with a median of $301,886. In 2002, the median price increased even more to a level of $375,810, an enormous increase of 24 percent over 2001. Median prices for 2003 indicated an increase of about 17 percent to $441,062; then another large 25 percent increase to $553,167 in 2004. This trend continued in 2005, with a median sales price of $678,321, translating into a 22 percent increase. For 2006, prices continued their climb with a slight increase of 2 percent over the 2005 median. The median price for 2006 averaged approximately $697,450. A decline of 10 percent was seen in 2007, as the average median price was $627,887. The average price further declined in 2008 by 8 percent to $574,760, then $498,708 in 2009, equating to a 13 percent retreat. The year 2010 continued to see a decrease in median prices to $462,821, or an additional 7.2 percent decline.
MEDIAN SALES PRICE
$225,000$275,000$325,000$375,000$425,000$475,000$525,000$575,000$625,000$675,000$725,000
1990
1991
1992
1993
1994
1995
1996
1997
1998
1999
2000
2001
2002
2003
2004
2005
2006
2007
2008
2009
2010
AVERAGE
Average monthly days-on-market figures increased steadily from 67 in 1990 to 231 in 1997, but steadily fell to 137 in 2000. It has remained relatively level since that time, except in 2004 when that figure fell to 114 days, before rebounding to 121 days in 2005. The increase continued in 2006 climbing to 129 days, followed by a larger increase to 151 days in 2007. A slight increase was seen in 2008, to 161 days, with 2009 appearing to be stable, at 165 days. In 2010, days on market decreased by 11 percent to 146 days.
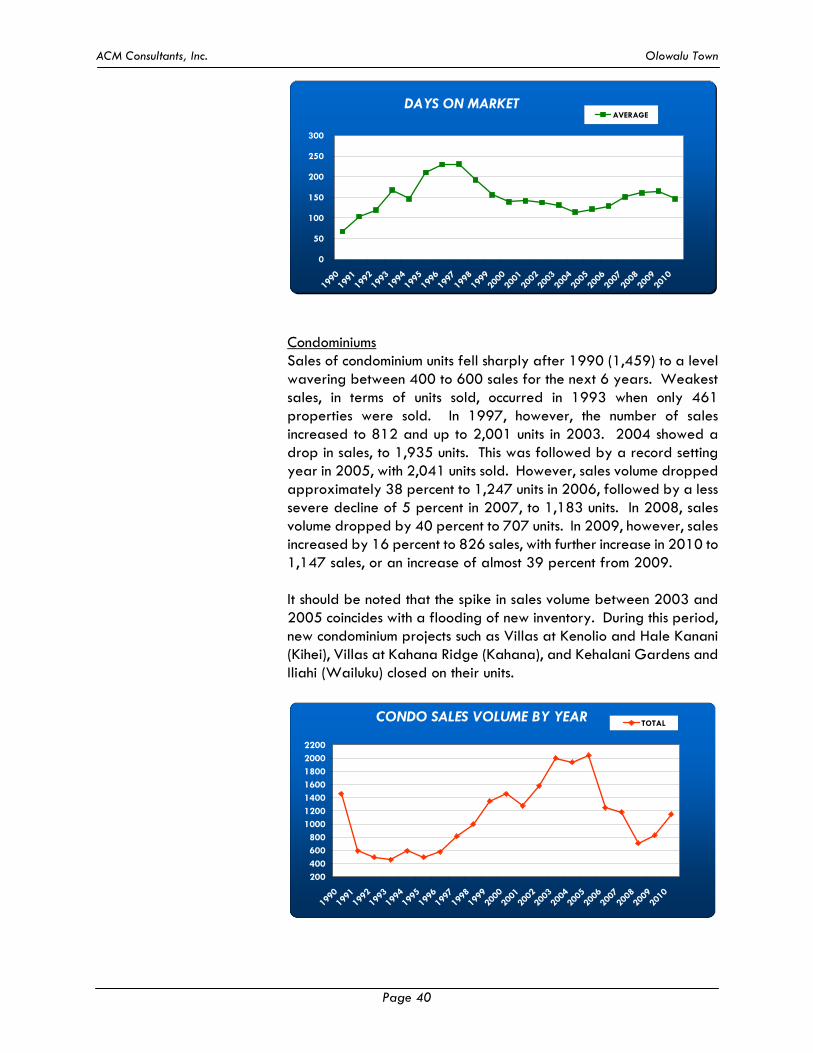
ACM Consultants, Inc. Olowalu Town
Page 40
DAYS ON MARKET
0
50
100
150
200
250
300
1990
1991
1992
1993
1994
1995
1996
1997
1998
1999
2000
2001
2002
2003
2004
2005
2006
2007
2008
2009
2010
AVERAGE
Condominiums Sales of condominium units fell sharply after 1990 (1,459) to a level wavering between 400 to 600 sales for the next 6 years. Weakest sales, in terms of units sold, occurred in 1993 when only 461 properties were sold. In 1997, however, the number of sales increased to 812 and up to 2,001 units in 2003. 2004 showed a drop in sales, to 1,935 units. This was followed by a record setting year in 2005, with 2,041 units sold. However, sales volume dropped approximately 38 percent to 1,247 units in 2006, followed by a less severe decline of 5 percent in 2007, to 1,183 units. In 2008, sales volume dropped by 40 percent to 707 units. In 2009, however, sales increased by 16 percent to 826 sales, with further increase in 2010 to 1,147 sales, or an increase of almost 39 percent from 2009. It should be noted that the spike in sales volume between 2003 and 2005 coincides with a flooding of new inventory. During this period, new condominium projects such as Villas at Kenolio and Hale Kanani (Kihei), Villas at Kahana Ridge (Kahana), and Kehalani Gardens and Iliahi (Wailuku) closed on their units.
CONDO SALES VOLUME BY YEAR
200400600800
1000120014001600180020002200
1990
1991
1992
1993
1994
1995
1996
1997
1998
1999
2000
2001
2002
2003
2004
2005
2006
2007
2008
2009
2010
TOTAL
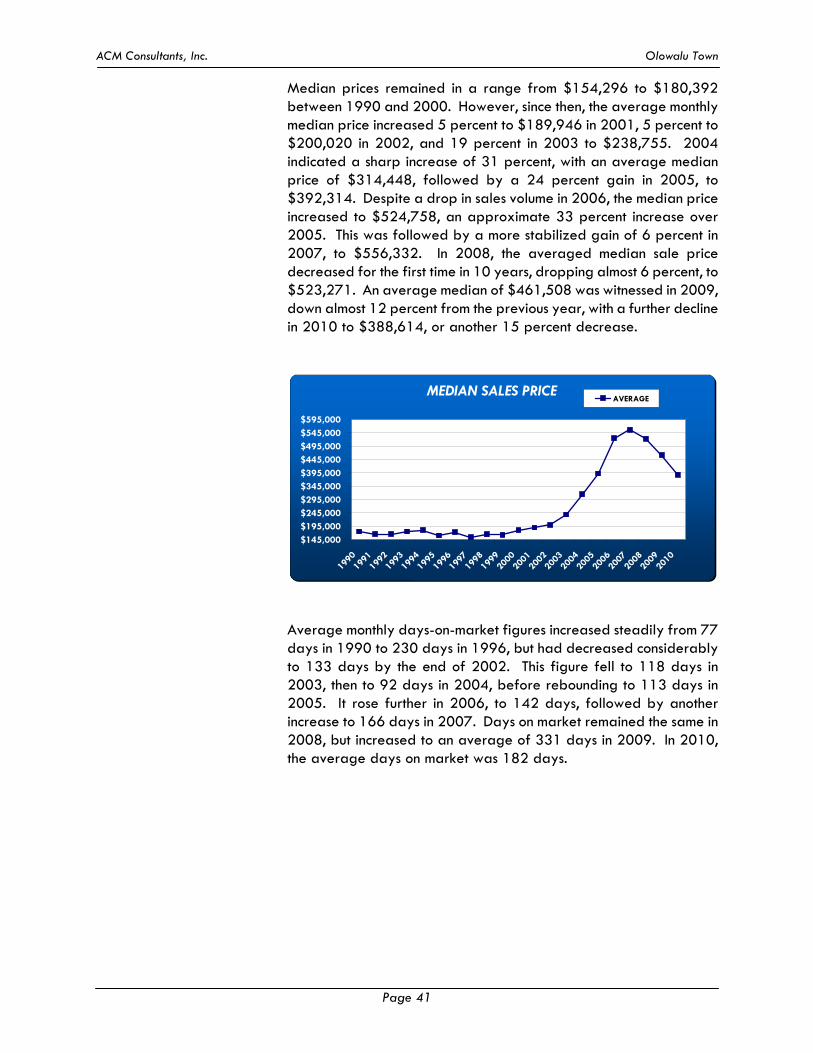
ACM Consultants, Inc. Olowalu Town
Page 41
Median prices remained in a range from $154,296 to $180,392 between 1990 and 2000. However, since then, the average monthly median price increased 5 percent to $189,946 in 2001, 5 percent to $200,020 in 2002, and 19 percent in 2003 to $238,755. 2004 indicated a sharp increase of 31 percent, with an average median price of $314,448, followed by a 24 percent gain in 2005, to $392,314. Despite a drop in sales volume in 2006, the median price increased to $524,758, an approximate 33 percent increase over 2005. This was followed by a more stabilized gain of 6 percent in 2007, to $556,332. In 2008, the averaged median sale price decreased for the first time in 10 years, dropping almost 6 percent, to $523,271. An average median of $461,508 was witnessed in 2009, down almost 12 percent from the previous year, with a further decline in 2010 to $388,614, or another 15 percent decrease.
MEDIAN SALES PRICE
$145,000$195,000$245,000$295,000$345,000$395,000$445,000$495,000$545,000$595,000
1990
1991
1992
1993
1994
1995
1996
1997
1998
1999
2000
2001
2002
2003
2004
2005
2006
2007
2008
2009
2010
AVERAGE
Average monthly days-on-market figures increased steadily from 77 days in 1990 to 230 days in 1996, but had decreased considerably to 133 days by the end of 2002. This figure fell to 118 days in 2003, then to 92 days in 2004, before rebounding to 113 days in 2005. It rose further in 2006, to 142 days, followed by another increase to 166 days in 2007. Days on market remained the same in 2008, but increased to an average of 331 days in 2009. In 2010, the average days on market was 182 days.
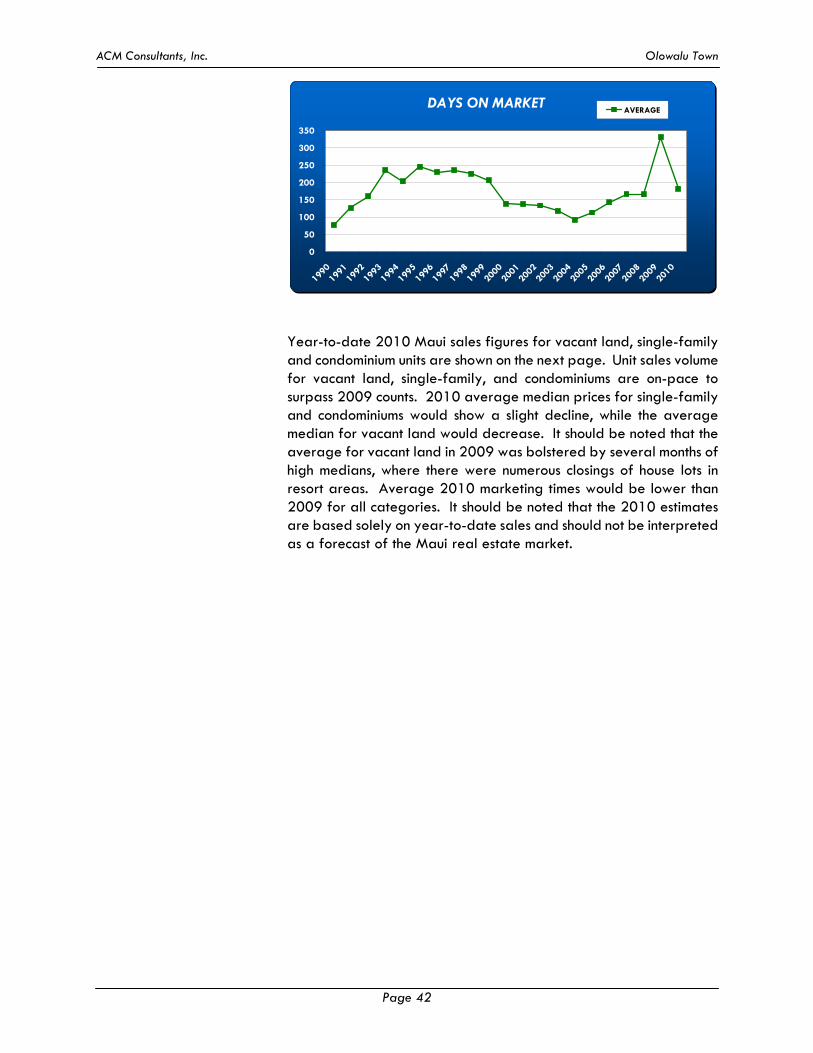
ACM Consultants, Inc. Olowalu Town
Page 42
DAYS ON MARKET
0
50
100
150
200
250
300
350
1990
1991
1992
1993
1994
1995
1996
1997
1998
1999
2000
2001
2002
2003
2004
2005
2006
2007
2008
2009
2010
AVERAGE
Year-to-date 2010 Maui sales figures for vacant land, single-family and condominium units are shown on the next page. Unit sales volume for vacant land, single-family, and condominiums are on-pace to surpass 2009 counts. 2010 average median prices for single-family and condominiums would show a slight decline, while the average median for vacant land would decrease. It should be noted that the average for vacant land in 2009 was bolstered by several months of high medians, where there were numerous closings of house lots in resort areas. Average 2010 marketing times would be lower than 2009 for all categories. It should be noted that the 2010 estimates are based solely on year-to-date sales and should not be interpreted as a forecast of the Maui real estate market.

ACM Consultants, Inc. Olowalu Town
Page 43
SALES VOLUME BY MONTH
2011 Vacant LandSingle-Family Condo
Jan 9 54 87Feb 7 57 98Mar 11 88 124Apr 11 87 119May JunJulAugSepOctNovDec
Sales Volume by Month
0
20
40
60
80
100
120
140
Jan
Feb
Mar
Apr
May
Ju
n
Jul
Aug Sep
Oct
Nov Dec
Vacant LandSingle-FamilyCondo
``
MEDIAN SALES PRICE
2011 Vacant LandSingle-Family Condo
Jan $300,000 $495,415 $295,000Feb $282,500 $440,000 $371,200Mar $500,000 $450,000 $289,000Apr $500,000 $500,000 $340,000May JunJulAugSepOctNovDec
Median Sales Price
$0
$100,000
$200,000
$300,000
$400,000
$500,000
$600,000
Jan
Feb
Mar
Apr
May
Ju
n
Jul
Aug Sep
Oct
Nov Dec
Vacant LandSingle-FamilyCondo
AVERAGE DAYS ON MARKET
2011 Vacant LandSingle-Family Condo
Jan 240 112 180Feb 180 149 192Mar 231 151 180Apr 362 146 141May JunJulAugSepOctNovDec
Average Days on Market
0
50
100
150
200
250
300
350
400
Jan
Feb
Mar Apr
May
Ju
n Jul
Aug Sep
OctNov Dec
Vacant LandSingle-FamilyCondo
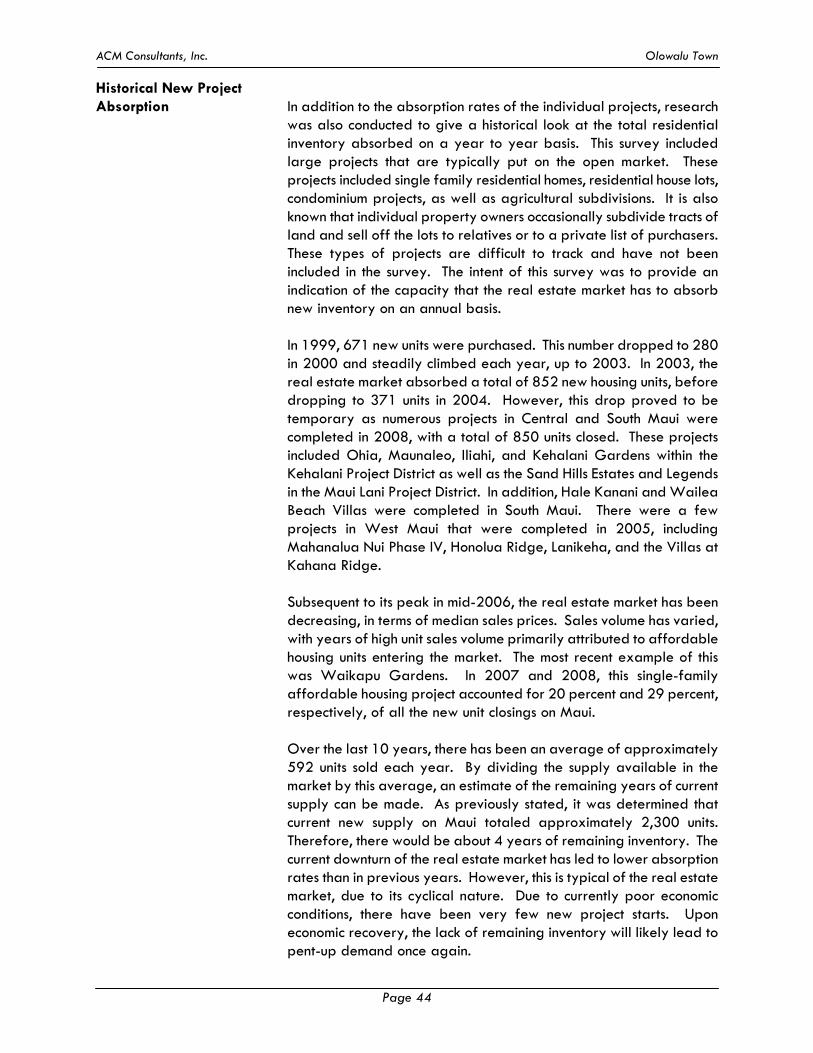
ACM Consultants, Inc. Olowalu Town
Page 44
Historical New Project Absorption In addition to the absorption rates of the individual projects, research
was also conducted to give a historical look at the total residential inventory absorbed on a year to year basis. This survey included large projects that are typically put on the open market. These projects included single family residential homes, residential house lots, condominium projects, as well as agricultural subdivisions. It is also known that individual property owners occasionally subdivide tracts of land and sell off the lots to relatives or to a private list of purchasers. These types of projects are difficult to track and have not been included in the survey. The intent of this survey was to provide an indication of the capacity that the real estate market has to absorb new inventory on an annual basis.
In 1999, 671 new units were purchased. This number dropped to 280 in 2000 and steadily climbed each year, up to 2003. In 2003, the real estate market absorbed a total of 852 new housing units, before dropping to 371 units in 2004. However, this drop proved to be temporary as numerous projects in Central and South Maui were completed in 2008, with a total of 850 units closed. These projects included Ohia, Maunaleo, Iliahi, and Kehalani Gardens within the Kehalani Project District as well as the Sand Hills Estates and Legends in the Maui Lani Project District. In addition, Hale Kanani and Wailea Beach Villas were completed in South Maui. There were a few projects in West Maui that were completed in 2005, including Mahanalua Nui Phase IV, Honolua Ridge, Lanikeha, and the Villas at Kahana Ridge. Subsequent to its peak in mid-2006, the real estate market has been decreasing, in terms of median sales prices. Sales volume has varied, with years of high unit sales volume primarily attributed to affordable housing units entering the market. The most recent example of this was Waikapu Gardens. In 2007 and 2008, this single-family affordable housing project accounted for 20 percent and 29 percent, respectively, of all the new unit closings on Maui. Over the last 10 years, there has been an average of approximately 592 units sold each year. By dividing the supply available in the market by this average, an estimate of the remaining years of current supply can be made. As previously stated, it was determined that current new supply on Maui totaled approximately 2,300 units. Therefore, there would be about 4 years of remaining inventory. The current downturn of the real estate market has led to lower absorption rates than in previous years. However, this is typical of the real estate market, due to its cyclical nature. Due to currently poor economic conditions, there have been very few new project starts. Upon economic recovery, the lack of remaining inventory will likely lead to pent-up demand once again.
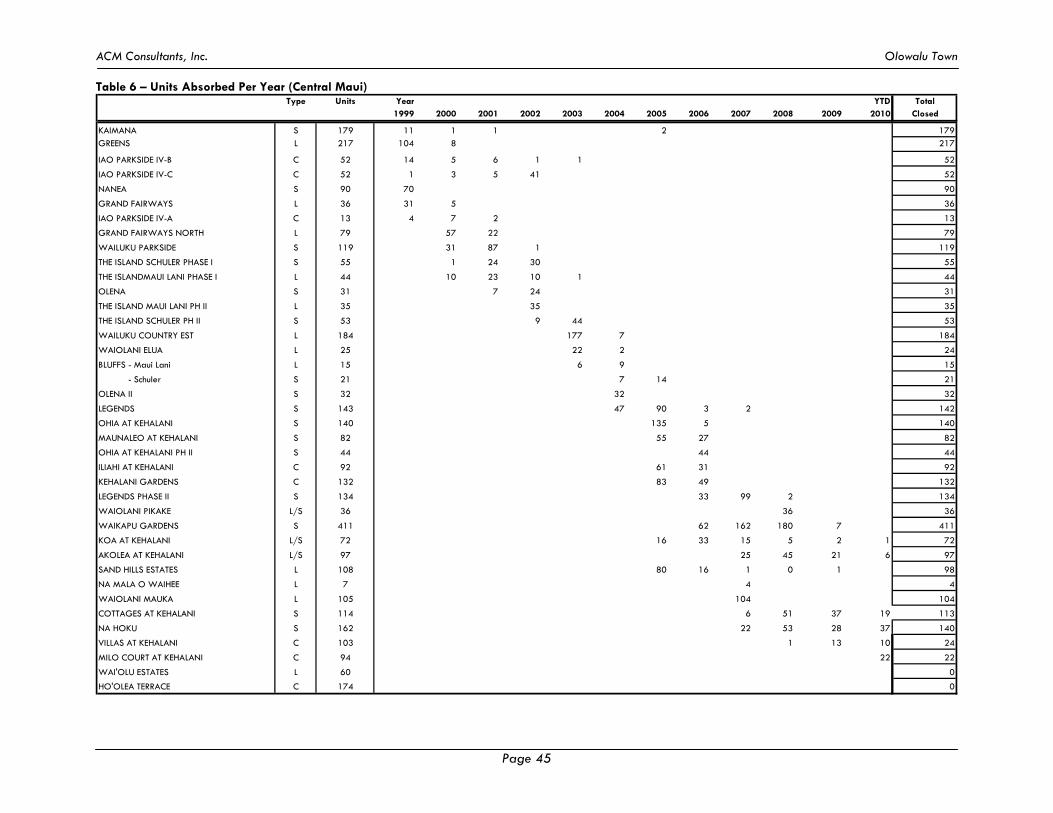
ACM Consultants, Inc. Olowalu Town
Page 45
Table 6 – Units Absorbed Per Year (Central Maui) Type Units Year YTD Total
1999 2000 2001 2002 2003 2004 2005 2006 2007 2008 2009 2010 Closed KAIMANA S 179 11 1 1 2 179GREENS L 217 104 8 217
IAO PARKSIDE IV-B C 52 14 5 6 1 1 52
IAO PARKSIDE IV-C C 52 1 3 5 41 52
NANEA S 90 70 90
GRAND FAIRWAYS L 36 31 5 36
IAO PARKSIDE IV-A C 13 4 7 2 13
GRAND FAIRWAYS NORTH L 79 57 22 79
WAILUKU PARKSIDE S 119 31 87 1 119
THE ISLAND SCHULER PHASE I S 55 1 24 30 55
THE ISLANDMAUI LANI PHASE I L 44 10 23 10 1 44
OLENA S 31 7 24 31
THE ISLAND MAUI LANI PH II L 35 35 35
THE ISLAND SCHULER PH II S 53 9 44 53
WAILUKU COUNTRY EST L 184 177 7 184
WAIOLANI ELUA L 25 22 2 24
BLUFFS - Maui Lani L 15 6 9 15
- Schuler S 21 7 14 21
OLENA II S 32 32 32
LEGENDS S 143 47 90 3 2 142
OHIA AT KEHALANI S 140 135 5 140
MAUNALEO AT KEHALANI S 82 55 27 82
OHIA AT KEHALANI PH II S 44 44 44
ILIAHI AT KEHALANI C 92 61 31 92
KEHALANI GARDENS C 132 83 49 132
LEGENDS PHASE II S 134 33 99 2 134
WAIOLANI PIKAKE L/S 36 36 36
WAIKAPU GARDENS S 411 62 162 180 7 411
KOA AT KEHALANI L/S 72 16 33 15 5 2 1 72
AKOLEA AT KEHALANI L/S 97 25 45 21 6 97
SAND HILLS ESTATES L 108 80 16 1 0 1 98
NA MALA O WAIHEE L 7 4 4
WAIOLANI MAUKA L 105 104 104
COTTAGES AT KEHALANI S 114 6 51 37 19 113
NA HOKU S 162 22 53 28 37 140
VILLAS AT KEHALANI C 103 1 13 10 24
MILO COURT AT KEHALANI C 94 22 22
WAI'OLU ESTATES L 60 0
HO'OLEA TERRACE C 174 0
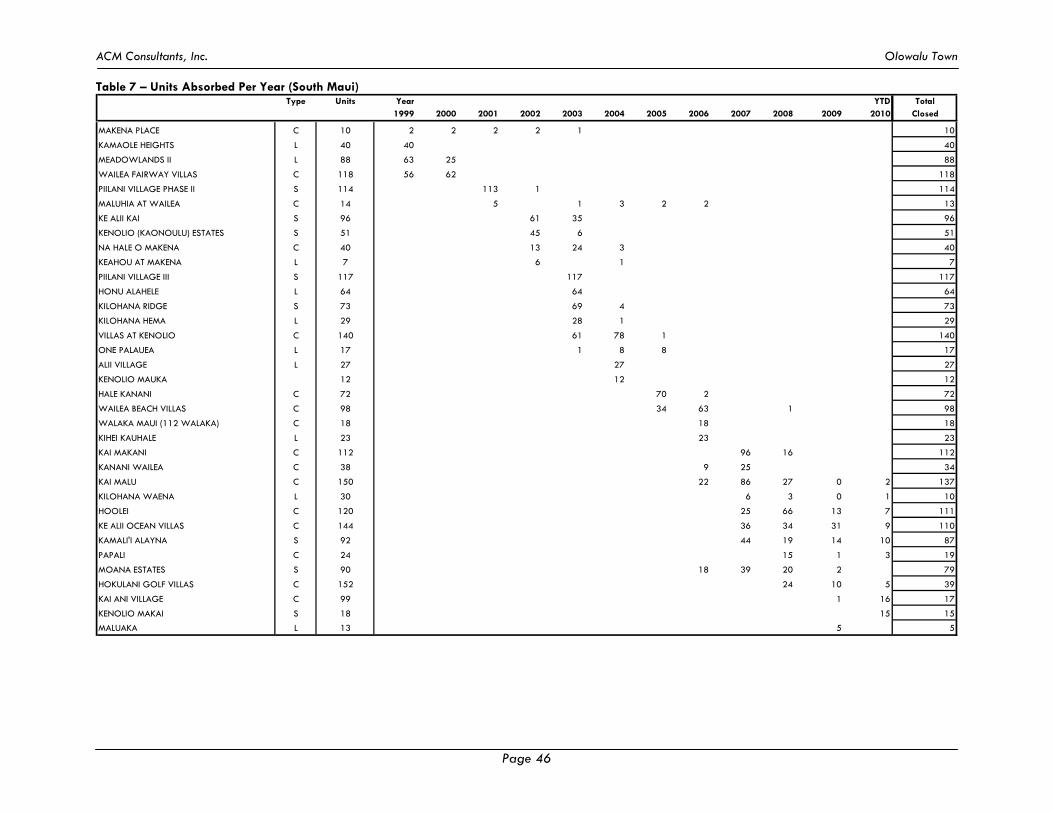
ACM Consultants, Inc. Olowalu Town
Page 46
Table 7 – Units Absorbed Per Year (South Maui) Type Units Year YTD Total
1999 2000 2001 2002 2003 2004 2005 2006 2007 2008 2009 2010 Closed MAKENA PLACE C 10 2 2 2 2 1 10
KAMAOLE HEIGHTS L 40 40 40
MEADOWLANDS II L 88 63 25 88
WAILEA FAIRWAY VILLAS C 118 56 62 118
PIILANI VILLAGE PHASE II S 114 113 1 114
MALUHIA AT WAILEA C 14 5 1 3 2 2 13
KE ALII KAI S 96 61 35 96
KENOLIO (KAONOULU) ESTATES S 51 45 6 51
NA HALE O MAKENA C 40 13 24 3 40
KEAHOU AT MAKENA L 7 6 1 7
PIILANI VILLAGE III S 117 117 117
HONU ALAHELE L 64 64 64
KILOHANA RIDGE S 73 69 4 73
KILOHANA HEMA L 29 28 1 29
VILLAS AT KENOLIO C 140 61 78 1 140
ONE PALAUEA L 17 1 8 8 17
ALII VILLAGE L 27 27 27
KENOLIO MAUKA 12 12 12
HALE KANANI C 72 70 2 72
WAILEA BEACH VILLAS C 98 34 63 1 98
WALAKA MAUI (112 WALAKA) C 18 18 18
KIHEI KAUHALE L 23 23 23
KAI MAKANI C 112 96 16 112
KANANI WAILEA C 38 9 25 34
KAI MALU C 150 22 86 27 0 2 137
KILOHANA WAENA L 30 6 3 0 1 10
HOOLEI C 120 25 66 13 7 111
KE ALII OCEAN VILLAS C 144 36 34 31 9 110
KAMALI'I ALAYNA S 92 44 19 14 10 87
PAPALI C 24 15 1 3 19
MOANA ESTATES S 90 18 39 20 2 79
HOKULANI GOLF VILLAS C 152 24 10 5 39
KAI ANI VILLAGE C 99 1 16 17
KENOLIO MAKAI S 18 15 15
MALUAKA L 13 5 5
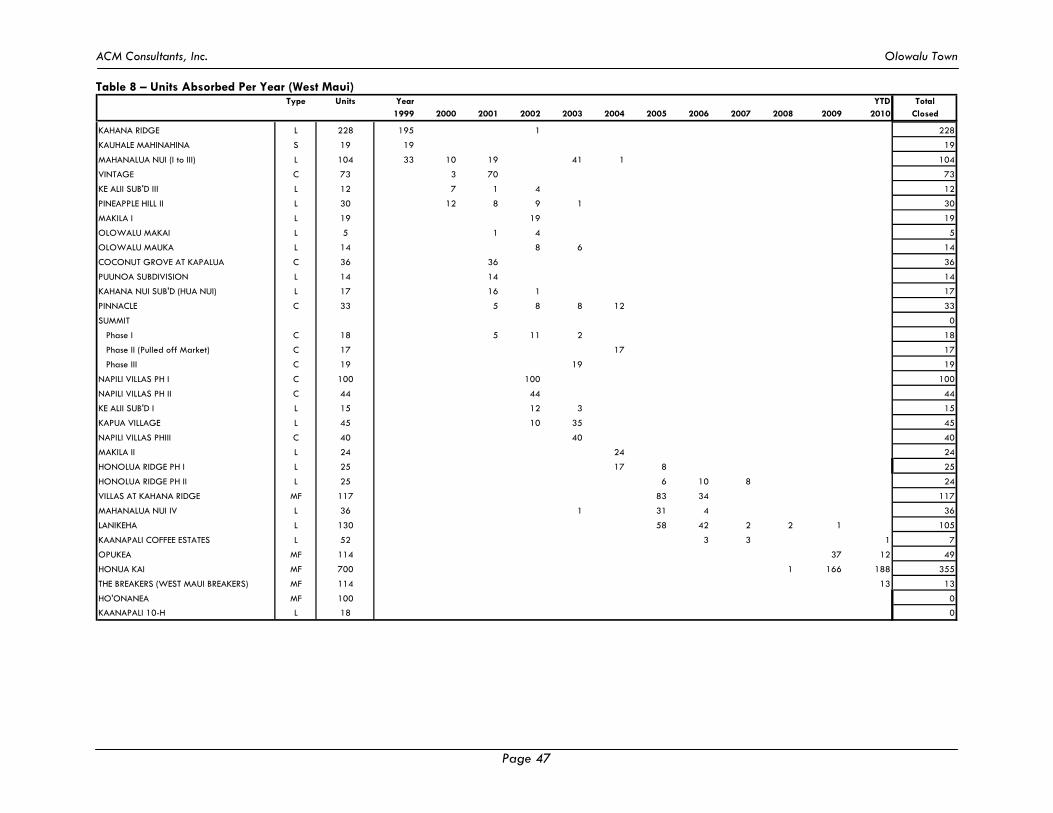
ACM Consultants, Inc. Olowalu Town
Page 47
Table 8 – Units Absorbed Per Year (West Maui) Type Units Year YTD Total
1999 2000 2001 2002 2003 2004 2005 2006 2007 2008 2009 2010 Closed KAHANA RIDGE L 228 195 1 228
KAUHALE MAHINAHINA S 19 19 19
MAHANALUA NUI (I to III) L 104 33 10 19 41 1 104
VINTAGE C 73 3 70 73
KE ALII SUB'D III L 12 7 1 4 12
PINEAPPLE HILL II L 30 12 8 9 1 30
MAKILA I L 19 19 19
OLOWALU MAKAI L 5 1 4 5
OLOWALU MAUKA L 14 8 6 14
COCONUT GROVE AT KAPALUA C 36 36 36
PUUNOA SUBDIVISION L 14 14 14
KAHANA NUI SUB'D (HUA NUI) L 17 16 1 17
PINNACLE C 33 5 8 8 12 33
SUMMIT 0
Phase I C 18 5 11 2 18
Phase II (Pulled off Market) C 17 17 17
Phase III C 19 19 19
NAPILI VILLAS PH I C 100 100 100
NAPILI VILLAS PH II C 44 44 44
KE ALII SUB'D I L 15 12 3 15
KAPUA VILLAGE L 45 10 35 45
NAPILI VILLAS PHIII C 40 40 40
MAKILA II L 24 24 24
HONOLUA RIDGE PH I L 25 17 8 25
HONOLUA RIDGE PH II L 25 6 10 8 24
VILLAS AT KAHANA RIDGE MF 117 83 34 117
MAHANALUA NUI IV L 36 1 31 4 36
LANIKEHA L 130 58 42 2 2 1 105
KAANAPALI COFFEE ESTATES L 52 3 3 1 7
OPUKEA MF 114 37 12 49
HONUA KAI MF 700 1 166 188 355
THE BREAKERS (WEST MAUI BREAKERS) MF 114 13 13
HO'ONANEA MF 100 0
KAANAPALI 10-H L 18 0
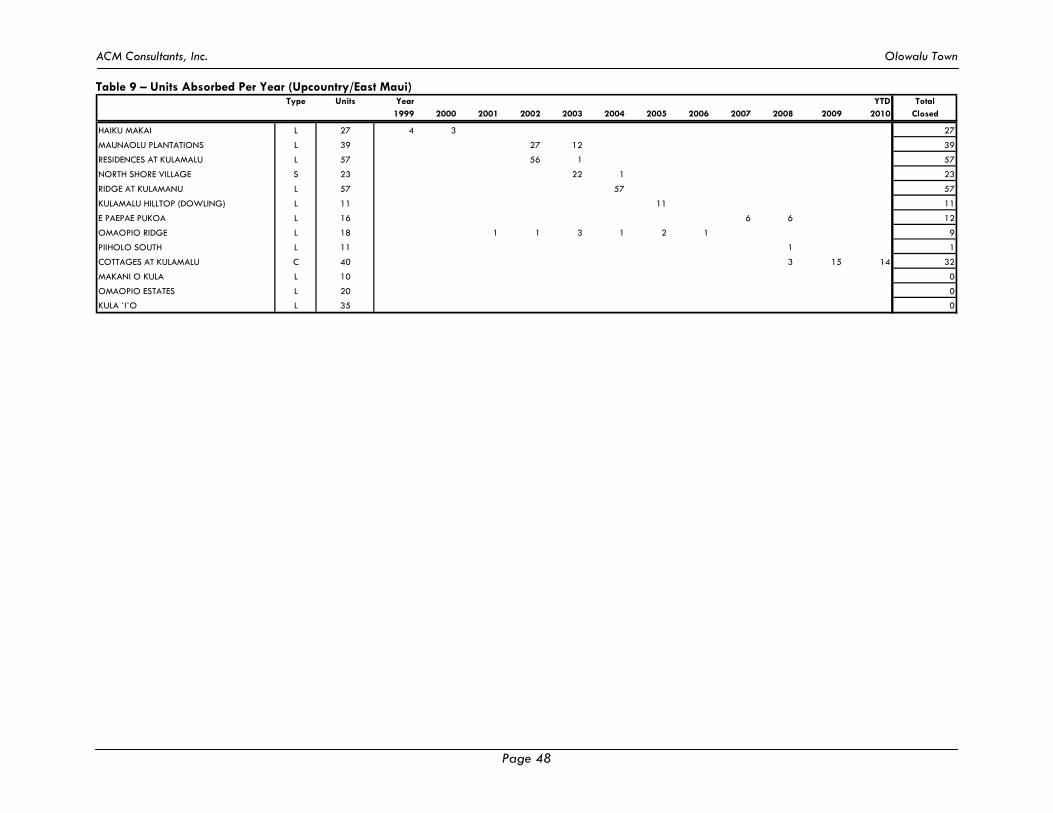
ACM Consultants, Inc. Olowalu Town
Page 48
Table 9 – Units Absorbed Per Year (Upcountry/East Maui) Type Units Year YTD Total
1999 2000 2001 2002 2003 2004 2005 2006 2007 2008 2009 2010 Closed HAIKU MAKAI L 27 4 3 27
MAUNAOLU PLANTATIONS L 39 27 12 39
RESIDENCES AT KULAMALU L 57 56 1 57
NORTH SHORE VILLAGE S 23 22 1 23
RIDGE AT KULAMANU L 57 57 57
KULAMALU HILLTOP (DOWLING) L 11 11 11
E PAEPAE PUKOA L 16 6 6 12
OMAOPIO RIDGE L 18 1 1 3 1 2 1 9
PIIHOLO SOUTH L 11 1 1
COTTAGES AT KULAMALU C 40 3 15 14 32
MAKANI O KULA L 10 0
OMAOPIO ESTATES L 20 0
KULA `I`O L 35 0
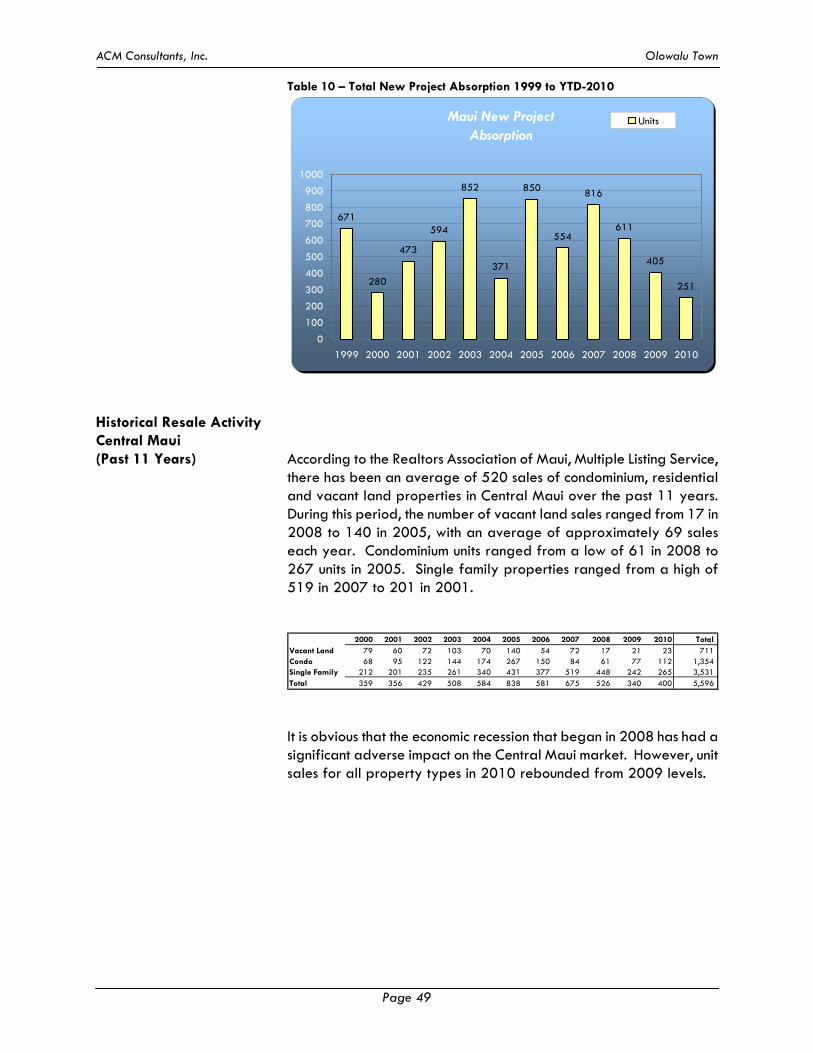
ACM Consultants, Inc. Olowalu Town
Page 49
Table 10 – Total New Project Absorption 1999 to YTD-2010
Maui New ProjectAbsorption
671
280
473
594
852
371
850
554
816
611
405
251
0
100
200
300
400
500
600
700
800
900
1000
1999 2000 2001 2002 2003 2004 2005 2006 2007 2008 2009 2010
Units
Historical Resale Activity Central Maui (Past 11 Years) According to the Realtors Association of Maui, Multiple Listing Service,
there has been an average of 520 sales of condominium, residential and vacant land properties in Central Maui over the past 11 years. During this period, the number of vacant land sales ranged from 17 in 2008 to 140 in 2005, with an average of approximately 69 sales each year. Condominium units ranged from a low of 61 in 2008 to 267 units in 2005. Single family properties ranged from a high of 519 in 2007 to 201 in 2001.
2000 2001 2002 2003 2004 2005 2006 2007 2008 2009 2010 TotalVacant Land 79 60 72 103 70 140 54 72 17 21 23 711 Condo 68 95 122 144 174 267 150 84 61 77 112 1,354 Single Family 212 201 235 261 340 431 377 519 448 242 265 3,531 Total 359 356 429 508 584 838 581 675 526 340 400 5,596
It is obvious that the economic recession that began in 2008 has had a significant adverse impact on the Central Maui market. However, unit sales for all property types in 2010 rebounded from 2009 levels.
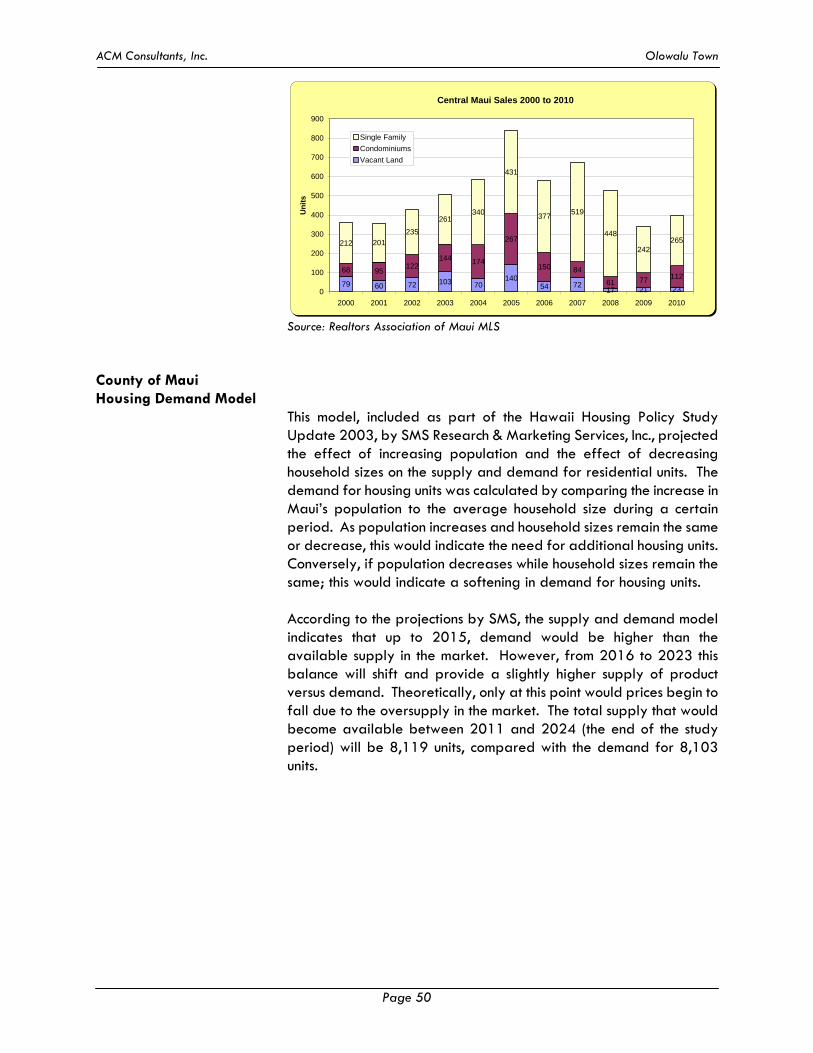
ACM Consultants, Inc. Olowalu Town
Page 50
Central Maui Sales 2000 to 2010
79 60 72 103 70140
54 7217 21 23
68 95122
144 174
267
150 84
61 77 112
212 201
235
261340
431
377519
448
242265
0
100
200
300
400
500
600
700
800
900
2000 2001 2002 2003 2004 2005 2006 2007 2008 2009 2010U
nit
s
Single Family
Condominiums
Vacant Land
Source: Realtors Association of Maui MLS
County of Maui Housing Demand Model
This model, included as part of the Hawaii Housing Policy Study Update 2003, by SMS Research & Marketing Services, Inc., projected the effect of increasing population and the effect of decreasing household sizes on the supply and demand for residential units. The demand for housing units was calculated by comparing the increase in Maui’s population to the average household size during a certain period. As population increases and household sizes remain the same or decrease, this would indicate the need for additional housing units. Conversely, if population decreases while household sizes remain the same; this would indicate a softening in demand for housing units. According to the projections by SMS, the supply and demand model indicates that up to 2015, demand would be higher than the available supply in the market. However, from 2016 to 2023 this balance will shift and provide a slightly higher supply of product versus demand. Theoretically, only at this point would prices begin to fall due to the oversupply in the market. The total supply that would become available between 2011 and 2024 (the end of the study period) will be 8,119 units, compared with the demand for 8,103 units.
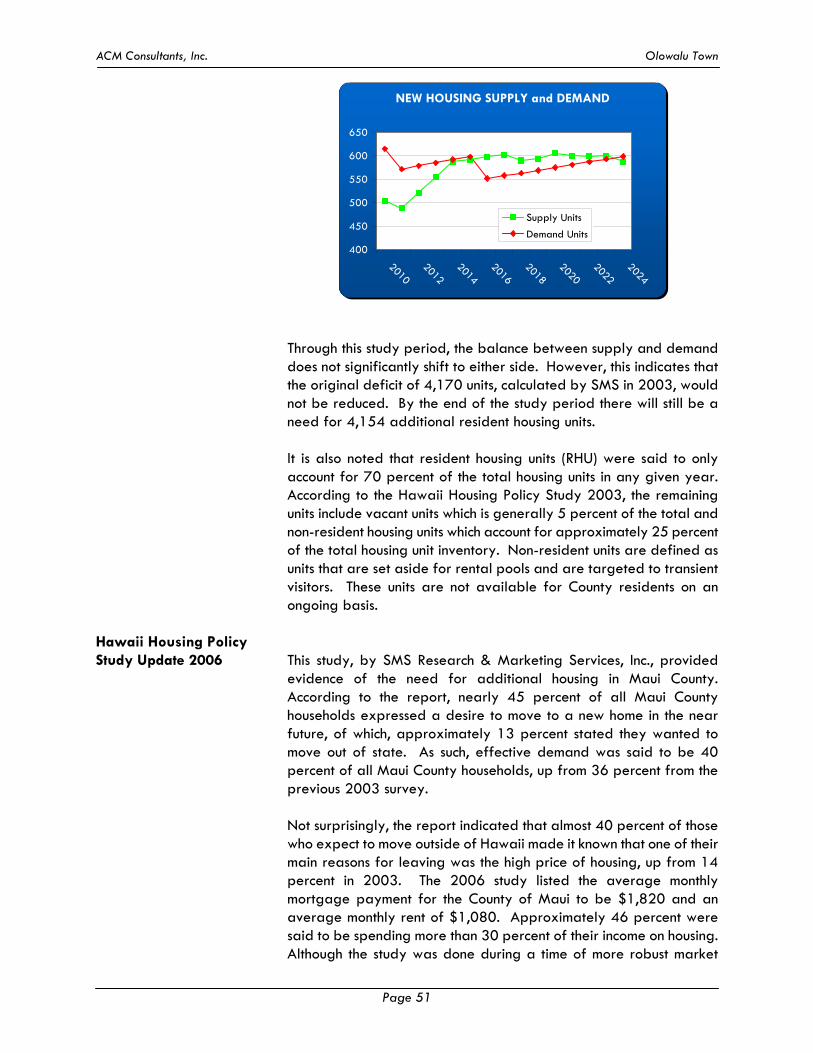
ACM Consultants, Inc. Olowalu Town
Page 51
NEW HOUSING SUPPLY and DEMAND
400
450
500
550
600
650
20102012
20142016
20182020
20222024
Supply Units
Demand Units
Through this study period, the balance between supply and demand does not significantly shift to either side. However, this indicates that the original deficit of 4,170 units, calculated by SMS in 2003, would not be reduced. By the end of the study period there will still be a need for 4,154 additional resident housing units. It is also noted that resident housing units (RHU) were said to only account for 70 percent of the total housing units in any given year. According to the Hawaii Housing Policy Study 2003, the remaining units include vacant units which is generally 5 percent of the total and non-resident housing units which account for approximately 25 percent of the total housing unit inventory. Non-resident units are defined as units that are set aside for rental pools and are targeted to transient visitors. These units are not available for County residents on an ongoing basis.
Hawaii Housing Policy Study Update 2006 This study, by SMS Research & Marketing Services, Inc., provided
evidence of the need for additional housing in Maui County. According to the report, nearly 45 percent of all Maui County households expressed a desire to move to a new home in the near future, of which, approximately 13 percent stated they wanted to move out of state. As such, effective demand was said to be 40 percent of all Maui County households, up from 36 percent from the previous 2003 survey.
Not surprisingly, the report indicated that almost 40 percent of those who expect to move outside of Hawaii made it known that one of their main reasons for leaving was the high price of housing, up from 14 percent in 2003. The 2006 study listed the average monthly mortgage payment for the County of Maui to be $1,820 and an average monthly rent of $1,080. Approximately 46 percent were said to be spending more than 30 percent of their income on housing. Although the study was done during a time of more robust market
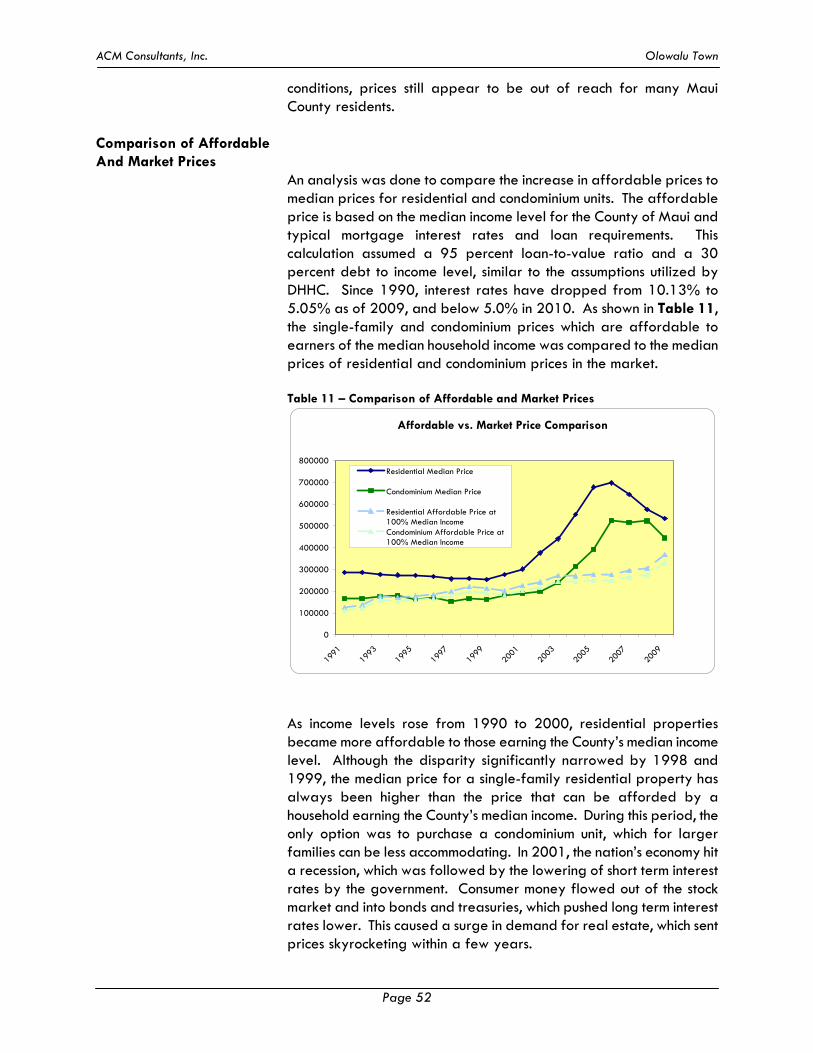
ACM Consultants, Inc. Olowalu Town
Page 52
conditions, prices still appear to be out of reach for many Maui County residents.
Comparison of Affordable And Market Prices
An analysis was done to compare the increase in affordable prices to median prices for residential and condominium units. The affordable price is based on the median income level for the County of Maui and typical mortgage interest rates and loan requirements. This calculation assumed a 95 percent loan-to-value ratio and a 30 percent debt to income level, similar to the assumptions utilized by DHHC. Since 1990, interest rates have dropped from 10.13% to 5.05% as of 2009, and below 5.0% in 2010. As shown in Table 11, the single-family and condominium prices which are affordable to earners of the median household income was compared to the median prices of residential and condominium prices in the market. Table 11 – Comparison of Affordable and Market Prices
Affordable vs. Market Price Comparison
0
100000
200000
300000
400000
500000
600000
700000
800000
1991
1993
1995
1997
1999
2001
2003
2005
2007
2009
Residential Median Price
Condominium Median Price
Residential Affordable Price at100% Median IncomeCondominium Affordable Price at100% Median Income
As income levels rose from 1990 to 2000, residential properties became more affordable to those earning the County’s median income level. Although the disparity significantly narrowed by 1998 and 1999, the median price for a single-family residential property has always been higher than the price that can be afforded by a household earning the County’s median income. During this period, the only option was to purchase a condominium unit, which for larger families can be less accommodating. In 2001, the nation’s economy hit a recession, which was followed by the lowering of short term interest rates by the government. Consumer money flowed out of the stock market and into bonds and treasuries, which pushed long term interest rates lower. This caused a surge in demand for real estate, which sent prices skyrocketing within a few years.
ACM Consultants, Inc. Olowalu Town
Page 53
By 2002, the soaring prices outpaced the County’s median income level despite steadily falling interest rates. At the same time, condominium units were found to be a more feasible alternative and sales in this category started to pick up their pace. By 2004, median sales prices for residential and condominium properties were both higher than what could be afforded by households earning the County’s median income level. In 2006, this situation reached critical levels, as prices for both residential and condominium units reached their peak. It did not help that mortgage rates also trended slightly upwards, which lowered the affordability to buyers needing to finance their purchase. Since 2006, the softening of the real estate market has brought median prices closer to affordable pricing levels; however, as seen in the previous table, there is still a substantial inequality. To help alleviate this situation, more housing units should be brought to the market, especially those geared toward Maui’s workforce.
Maui County General Plan 2030 The County of Maui is currently in the process of updating the General
Plan, which will establish long-term planning guidelines for Maui County to the year 2030. The first step in this process involved the creation of a Countywide Policy Plan, which provides broad goals, objectives, policies and implementing actions used to develop the Maui Island Plan and Community Plans. The current version of the plan was adopted by the Maui County Council on March 24, 2010. Although its design is still preliminary in nature, many of the goals, objectives, and policies set forth in the Countywide Policy Plan are inherent in Olowalu Town. The following list represents some of the pertinent characteristics that are consistent with the Countywide Policy Plan: Protect the Natural Environment Olowalu Town will build innovative infrastructure systems that are based upon sustainable technologies which minimize adverse impacts upon the natural environment. Efficient “green” technologies modeled after natural systems are planned with emphasis on conservation, cleaning, and recycling. Olowalu Town’s residents will utilize walking for many daily needs thus reducing the number of daily car trips, and will provide residents access to beach parks, playgrounds, hiking, and biking from their homes. Preserve Local Cultures and Traditions The Olowalu Master Plan proposes to increase the acreage of the existing Olowalu Cultural Reserve from approximately 75 acres to approximately 110 acres.
ACM Consultants, Inc. Olowalu Town
Page 54
Improve Education, Parks and Public Facilities Approximately 100 acres, or about 17 percent of the project, will be available for active parks, social services, police/fire protection and schools. Schools are planned to be developed within a ¼-mile distance of homes, or within a 5-minute walk. Being located near residential areas and parks affords children the option of walking or bicycling to school. The Olowalu Cultural Reserve (OCR) currently provides educational experiences relating to its archaeological and cultural heritage to school children. Expand Housing Opportunities for Residents Olowalu Town will feature on-site affordable housing units. Affordable housing requirements will be addressed in keeping with market needs and the County of Maui’s Residential Workforce Housing Policy. Under current conceptual plans, Olowalu Town will provide roughly 500 affordable housing units (less than 120 percent of median income); 500 sub-market housing units (below existing average market prices); and, 500 market rate housing units (above average market prices). As designed, this plan would meet or exceed Maui’s existing Workforce Housing Ordinance. Diversify Transportation Options Olowalu Town Master Plan is being designed with a connecting network of pedestrian friendly roadways that will offer residential numerous routes for both pedestrian and drivers that are both safe and attractive. The neighborhood block system design will shorten travel routes and encourage walking and/or biking as an alternative to automobiles. Promote Sustainable Land Use and Growth Management Olowalu Town is situated within the Urban and Rural Growth Boundary being recommended by the General Plan Advisory Committee and the Maui Planning Commission. The Olowalu Town Master Plan is being predicated upon the design principles of Traditional Neighborhood Design (TND). This design principle promotes the development of communities that are pedestrian friendly, offer a wide range of housing opportunities, and allow residents to live within walking distance to corner stores, schools, parks, and community centers. Furthermore, once established, the Urban and Rural Grown Boundaries at Olowalu will help to maintain Olowalu’s small town scale. These boundaries will enhance and preserve the town’s unique sense of place, maintain compact town centers, preserve pedestrian-friendly streets, prevent sprawl, and ensure habitats are preserved and protected.
ACM Consultants, Inc. Olowalu Town
Page 55
Estimated Absorption Rate for Subject On a larger scale, the overall lack of new project starts within the
past few years has some economists foreseeing a potential shortfall in housing upon recovery of the economy. Many real estate analysts are of the opinion that it has become too difficult to feasibly create new housing projects since the passage of ordinances linked to development. Builders and developers have chosen to withdraw from the Maui market, looking for less costly and time consuming opportunities. Tightened lending practices, due to the recent financial reform, have also made it difficult to obtain financing, especially for large developments. Recent housing starts have been about 80 percent less than in the robust years. Due to these factors, there may be less competitive inventory when Olowalu Town Master Plan Development’s housing units become available. The development will be strongly targeted towards the workforce market segment, which has seen consistently high demand. As stated earlier, the Olowalu Town Development is planned to contain at least 750 “affordable” units to comply with the County’s workforce housing ordinance. Central Maui has historically housed the largest percentage of the island’s workforce population. This is attributed to many factors. First, Kahului Airport and Kahului Harbor are Maui’s primary shipping and transportation venues. Furthermore, Kahului has the largest concentration of retail centers, including Kaahumanu Center, Maui Mall, Kahului Shopping Center, and The Maui Marketplace. The University of Hawaii Maui College is also situated in Kahului. Meanwhile, Wailuku is the seat of County government, as well as being home to the State Building and Hoapili Hale, the island’s main judicial building. Not coincidently, most of Hawaii’s major financial institutions all have their primary branch in Central Maui. Due to these factors, there has always been more demand for workforce housing in Central Maui than in other regions. However, the overall lack of affordable housing in Central Maui has created the need for many residents to commute daily from outlying areas, such as Upcountry Maui, South Maui and from West Maui, which are also in short supply of affordable housing. Thus, the Olowalu Town Master Plan Development has the opportunity to offer affordable housing outside of Central Maui. The Olowalu Town Master Plan Development is planned for approximately 635 acres of land. Preliminarily, the development calls for a total of 1,500 housing units. Of this total, at least 750 residential units will be created to fulfill the affordable housing obligation. In addition to single-family residential areas and multi-family residential areas, the master plan development will feature areas of
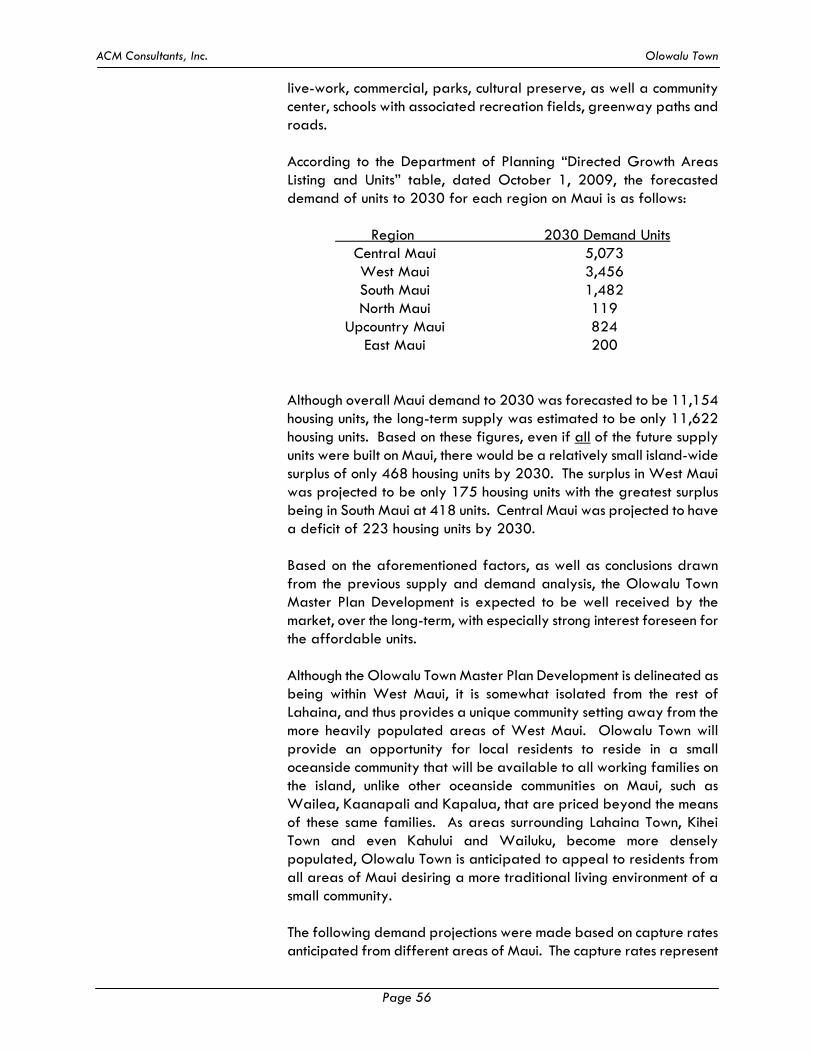
ACM Consultants, Inc. Olowalu Town
Page 56
live-work, commercial, parks, cultural preserve, as well a community center, schools with associated recreation fields, greenway paths and roads. According to the Department of Planning “Directed Growth Areas Listing and Units” table, dated October 1, 2009, the forecasted demand of units to 2030 for each region on Maui is as follows:
Region 2030 Demand Units Central Maui 5,073 West Maui 3,456 South Maui 1,482 North Maui 119 Upcountry Maui 824 East Maui 200
Although overall Maui demand to 2030 was forecasted to be 11,154 housing units, the long-term supply was estimated to be only 11,622 housing units. Based on these figures, even if all of the future supply units were built on Maui, there would be a relatively small island-wide surplus of only 468 housing units by 2030. The surplus in West Maui was projected to be only 175 housing units with the greatest surplus being in South Maui at 418 units. Central Maui was projected to have a deficit of 223 housing units by 2030. Based on the aforementioned factors, as well as conclusions drawn from the previous supply and demand analysis, the Olowalu Town Master Plan Development is expected to be well received by the market, over the long-term, with especially strong interest foreseen for the affordable units. Although the Olowalu Town Master Plan Development is delineated as being within West Maui, it is somewhat isolated from the rest of Lahaina, and thus provides a unique community setting away from the more heavily populated areas of West Maui. Olowalu Town will provide an opportunity for local residents to reside in a small oceanside community that will be available to all working families on the island, unlike other oceanside communities on Maui, such as Wailea, Kaanapali and Kapalua, that are priced beyond the means of these same families. As areas surrounding Lahaina Town, Kihei Town and even Kahului and Wailuku, become more densely populated, Olowalu Town is anticipated to appeal to residents from all areas of Maui desiring a more traditional living environment of a small community. The following demand projections were made based on capture rates anticipated from different areas of Maui. The capture rates represent
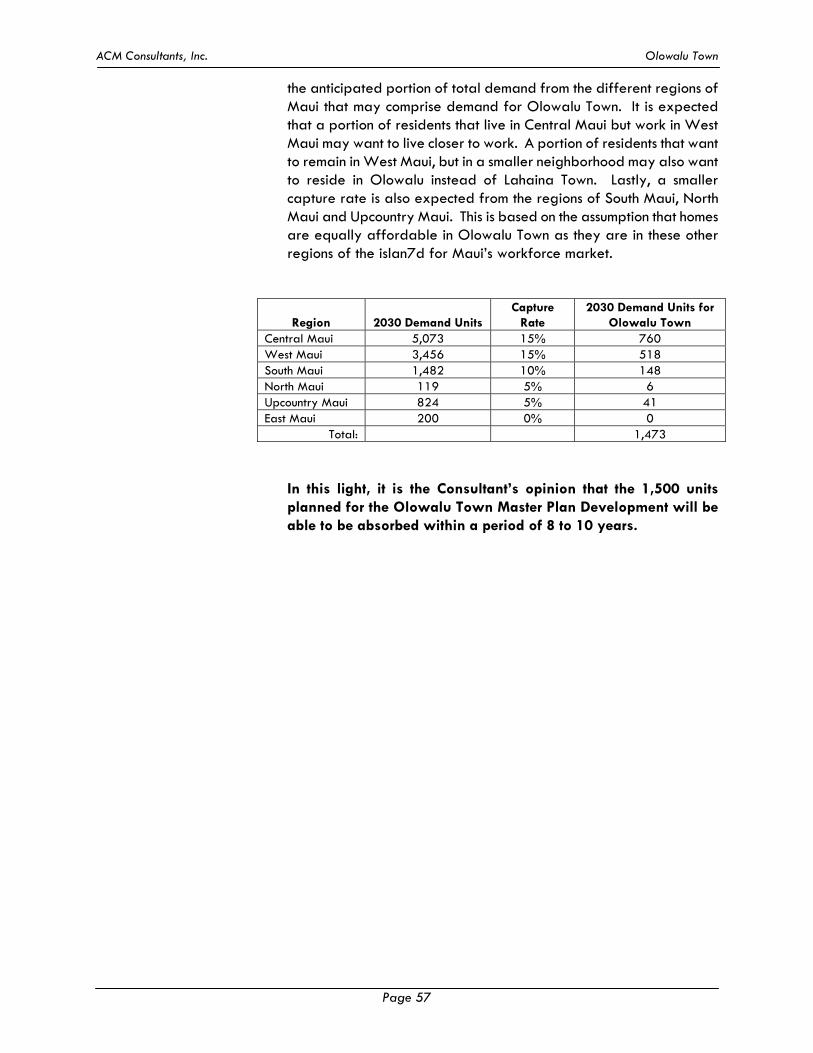
ACM Consultants, Inc. Olowalu Town
Page 57
the anticipated portion of total demand from the different regions of Maui that may comprise demand for Olowalu Town. It is expected that a portion of residents that live in Central Maui but work in West Maui may want to live closer to work. A portion of residents that want to remain in West Maui, but in a smaller neighborhood may also want to reside in Olowalu instead of Lahaina Town. Lastly, a smaller capture rate is also expected from the regions of South Maui, North Maui and Upcountry Maui. This is based on the assumption that homes are equally affordable in Olowalu Town as they are in these other regions of the islan7d for Maui’s workforce market.
Region 2030 Demand Units Capture
Rate 2030 Demand Units for
Olowalu Town Central Maui 5,073 15% 760 West Maui 3,456 15% 518 South Maui 1,482 10% 148 North Maui 119 5% 6 Upcountry Maui 824 5% 41 East Maui 200 0% 0
Total: 1,473
In this light, it is the Consultant’s opinion that the 1,500 units planned for the Olowalu Town Master Plan Development will be able to be absorbed within a period of 8 to 10 years.
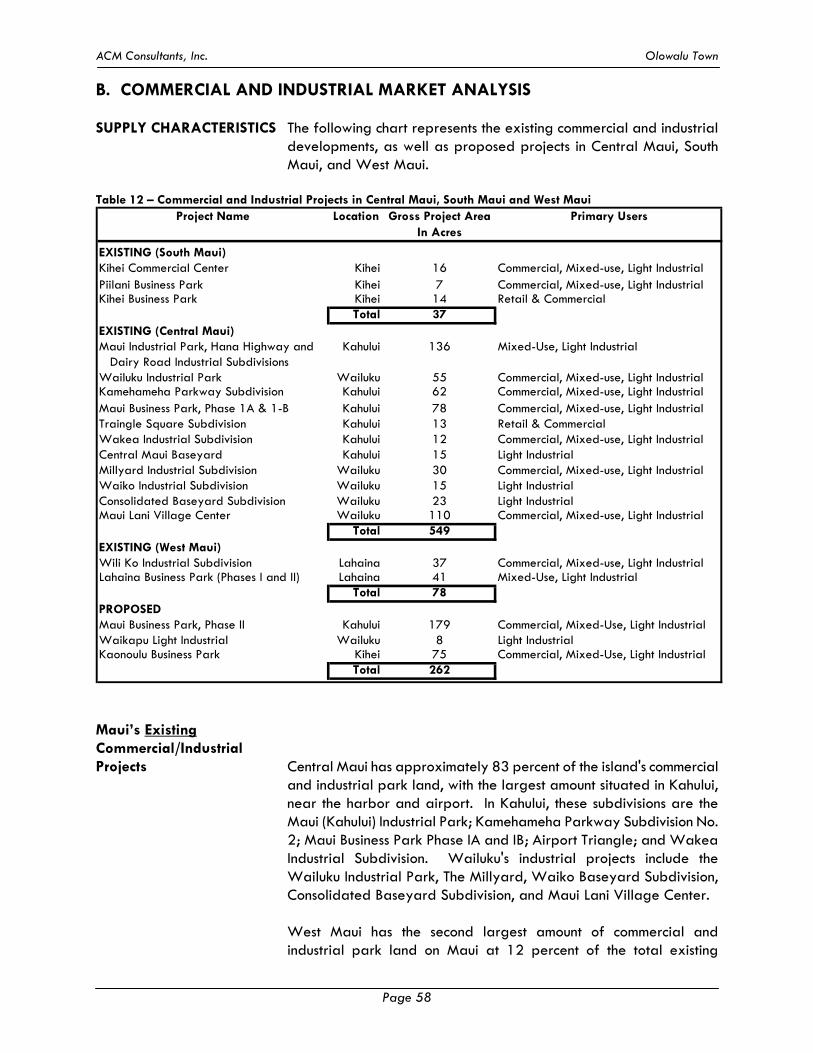
ACM Consultants, Inc. Olowalu Town
Page 58
B. COMMERCIAL AND INDUSTRIAL MARKET ANALYSIS SUPPLY CHARACTERISTICS The following chart represents the existing commercial and industrial
developments, as well as proposed projects in Central Maui, South Maui, and West Maui.
Table 12 – Commercial and Industrial Projects in Central Maui, South Maui and West Maui Project Name Location Gross Project Area Primary Users
In Acres
EXISTING (South Maui)Kihei Commercial Center Kihei 16 Commercial, Mixed-use, Light IndustrialPiilani Business Park Kihei 7 Commercial, Mixed-use, Light IndustrialKihei Business Park Kihei 14 Retail & Commercial
Total 37EXISTING (Central Maui)Maui Industrial Park, Hana Highway and Kahului 136 Mixed-Use, Light Industrial Dairy Road Industrial SubdivisionsWailuku Industrial Park Wailuku 55 Commercial, Mixed-use, Light IndustrialKamehameha Parkway Subdivision Kahului 62 Commercial, Mixed-use, Light IndustrialMaui Business Park, Phase 1A & 1-B Kahului 78 Commercial, Mixed-use, Light IndustrialTraingle Square Subdivision Kahului 13 Retail & CommercialWakea Industrial Subdivision Kahului 12 Commercial, Mixed-use, Light IndustrialCentral Maui Baseyard Kahului 15 Light IndustrialMillyard Industrial Subdivision Wailuku 30 Commercial, Mixed-use, Light IndustrialWaiko Industrial Subdivision Wailuku 15 Light IndustrialConsolidated Baseyard Subdivision Wailuku 23 Light IndustrialMaui Lani Village Center Wailuku 110 Commercial, Mixed-use, Light Industrial
Total 549EXISTING (West Maui)Wili Ko Industrial Subdivision Lahaina 37 Commercial, Mixed-use, Light IndustrialLahaina Business Park (Phases I and II) Lahaina 41 Mixed-Use, Light Industrial
Total 78PROPOSED Maui Business Park, Phase II Kahului 179 Commercial, Mixed-Use, Light IndustrialWaikapu Light Industrial Wailuku 8 Light IndustrialKaonoulu Business Park Kihei 75 Commercial, Mixed-Use, Light Industrial
Total 262
Maui’s Existing Commercial/Industrial Projects Central Maui has approximately 83 percent of the island's commercial
and industrial park land, with the largest amount situated in Kahului, near the harbor and airport. In Kahului, these subdivisions are the Maui (Kahului) Industrial Park; Kamehameha Parkway Subdivision No. 2; Maui Business Park Phase IA and IB; Airport Triangle; and Wakea Industrial Subdivision. Wailuku's industrial projects include the Wailuku Industrial Park, The Millyard, Waiko Baseyard Subdivision, Consolidated Baseyard Subdivision, and Maui Lani Village Center.
West Maui has the second largest amount of commercial and
industrial park land on Maui at 12 percent of the total existing
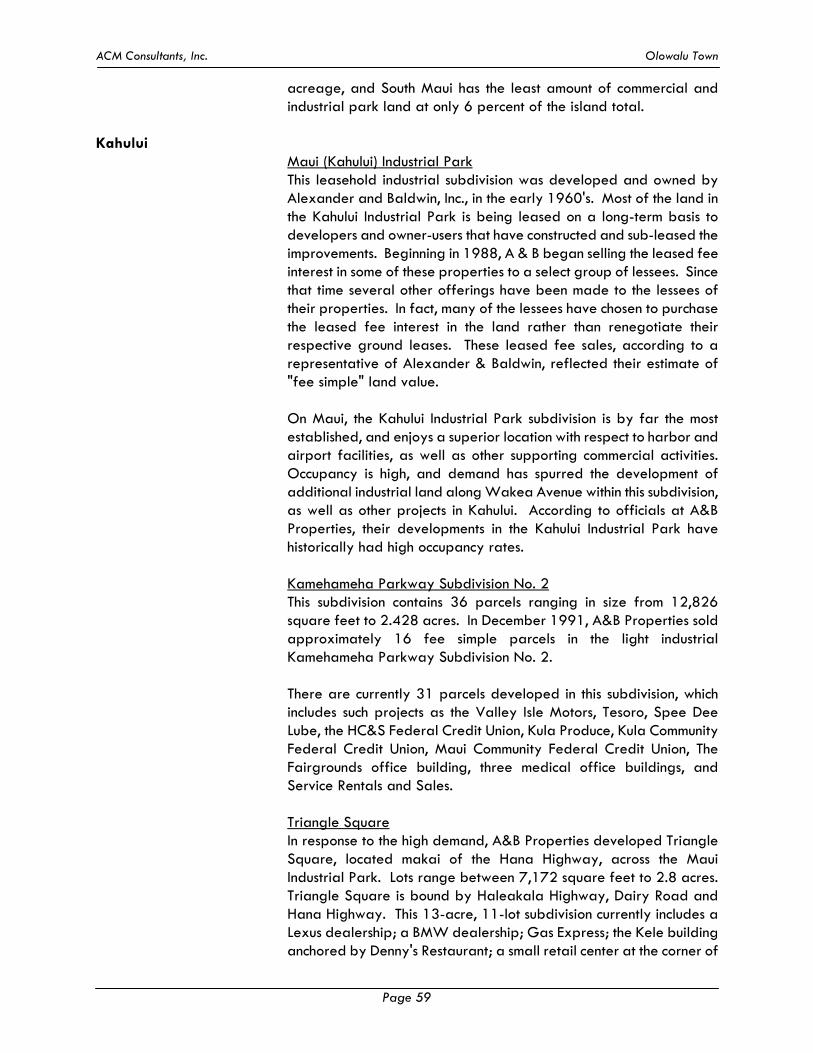
ACM Consultants, Inc. Olowalu Town
Page 59
acreage, and South Maui has the least amount of commercial and industrial park land at only 6 percent of the island total.
Kahului
Maui (Kahului) Industrial Park This leasehold industrial subdivision was developed and owned by Alexander and Baldwin, Inc., in the early 1960's. Most of the land in the Kahului Industrial Park is being leased on a long-term basis to developers and owner-users that have constructed and sub-leased the improvements. Beginning in 1988, A & B began selling the leased fee interest in some of these properties to a select group of lessees. Since that time several other offerings have been made to the lessees of their properties. In fact, many of the lessees have chosen to purchase the leased fee interest in the land rather than renegotiate their respective ground leases. These leased fee sales, according to a representative of Alexander & Baldwin, reflected their estimate of "fee simple" land value. On Maui, the Kahului Industrial Park subdivision is by far the most established, and enjoys a superior location with respect to harbor and airport facilities, as well as other supporting commercial activities. Occupancy is high, and demand has spurred the development of additional industrial land along Wakea Avenue within this subdivision, as well as other projects in Kahului. According to officials at A&B Properties, their developments in the Kahului Industrial Park have historically had high occupancy rates. Kamehameha Parkway Subdivision No. 2 This subdivision contains 36 parcels ranging in size from 12,826 square feet to 2.428 acres. In December 1991, A&B Properties sold approximately 16 fee simple parcels in the light industrial Kamehameha Parkway Subdivision No. 2. There are currently 31 parcels developed in this subdivision, which includes such projects as the Valley Isle Motors, Tesoro, Spee Dee Lube, the HC&S Federal Credit Union, Kula Produce, Kula Community Federal Credit Union, Maui Community Federal Credit Union, The Fairgrounds office building, three medical office buildings, and Service Rentals and Sales. Triangle Square In response to the high demand, A&B Properties developed Triangle Square, located makai of the Hana Highway, across the Maui Industrial Park. Lots range between 7,172 square feet to 2.8 acres. Triangle Square is bound by Haleakala Highway, Dairy Road and Hana Highway. This 13-acre, 11-lot subdivision currently includes a Lexus dealership; a BMW dealership; Gas Express; the Kele building anchored by Denny's Restaurant; a small retail center at the corner of
ACM Consultants, Inc. Olowalu Town
Page 60
Hana Highway and Dairy Road, and the Triangle Square Apex Building. A Krispy Kreme doughnut outlet was constructed at the corner of Dairy Road and Haleakala Highway. Costco and Kmart are located across Dairy Road from Triangle Square. All lots in this subdivision are offered as ground leases or build-to-suit only. Three opportunities are currently being advertised including pad sites of 16,190 square feet, 24,873 square feet and 8,600 square feet. None are available for sale. Maui Business Park Seventy-six (76) acres were developed starting in 1995 as Phases IA and IB of the Maui Business Park. Phase IA includes 32 light industrial zoned lots ranging in size from 16,801 to 35,522 square feet on about 42 acres of land. Lots were initially priced at an average of $30 to $35 per square foot. Nine (9) parcels immediately sold and ranged from $26.00 to $34.38 per square foot. The only parcel to be sold in 2007 was purchased at a price of $43.77 per square foot for 27,188 square feet. An 8,506 square foot subdivided parcel was sold in October 2008 for $41.15 per square foot; however, there were no sales in 2009. In April 2010, a 16,525 square foot lot sold for $41.45 per square foot. Improved properties within this phase include a Harley Davidson and automobile dealership; a McDonald’s restaurant; a dental practice; a mortuary; a large self-storage center; several commercial office properties; and numerous light industrial facilities. The Maui Marketplace, also part of Phase IA, is patterned after Waikele Center in Oahu and was completed in 1997. It includes tenants such as Lowe's Hardware, Borders Books and Music, Office Max, Old Navy, Pier One Imports and Sports Authority. Phase IB consists of about 34 acres of land and includes the large Wal Mart and Home Depot sites which were 14.014 acres and 12.701 acres, respectively. The remaining 10 lots are located along Hookele Street and range in size from 17,990 to 45,869 square feet, with an average of 22,817 square feet. Prices for these lots were initially at $26.00 to $27.00 per square foot. In addition to the Wal Mart and Home Depot, some of these parcels have been improved with a veterinary clinic, two professional office buildings, and a self-storage center. A July 2004 conveyance involved the lot at the corner of Puunene Avenue and Hookele Street, which sold for $33.35 per square foot and is now home to Zippy’s Restaurant. A 44,823 square foot portion of the Wal Mart site, fronting Pakaula Street, was subdivided and sold in December 2005 for $36.25 per square foot. A three-unit retail center was subsequently built on this lot, with current tenants Panda Express, Verizon Wireless, and Game Stop.
ACM Consultants, Inc. Olowalu Town
Page 61
Wailuku The Millyard Developed in 1984, all lots in this fee simple, light industrial subdivision have been sold, and improvements have been constructed on 34 parcels. Of the 53 lots in this development, only eight are more than one-half acre in size. The balance of the sites is between 10,055 and 20,119 square feet in size. Due to the unavailability of vacant light industrial land in the Central Maui region, sales in this Wailuku development have increased during the past three years. Wailuku Industrial Park This light industrial subdivision was developed by C. Brewer in the late-1970s and it consists of 74 fee simple lots off of Lower Main Street in Wailuku. Lots range from 10,106 square feet to a parcel 3.089 acres in size. Approximately 72 percent of the parcels are less than one-half acre in size. Of the 74 light industrial lots, only two are not utilized for a building or as yard space. Waiko Baseyard Subdivision The Waiko Baseyard Subdivision consists of 14.891 acres of land that was subdivided into 19 finished lots in 2005. It is located along Waiko Road in Waikapu Town of Wailuku. The lots range in size from 13,342 to 124,720 square feet. Lot No. 16 was deeded back to Brewer Environmental, Inc. and was not available for sale. Lots No. 17, 18 and 19 were retained by the developer and also not made available for sale. Fourteen (14) lots have sold so far, and only Lot 11 has not sold but is not on the market. It is noted that public records indicate additional sales between $20.00 and $25.00 per square foot; however, according to the developer, these prices were based on an agreement with the prior land owner and considered below-market. The initial sale price in the subdivision was $35.00 per square foot. A July 2008 sale of Lot 1 was at a price of $36.80 per square foot, while the most recent conveyance, in May 2010, was a distress sale of four consolidated lots (Lot 12-A), at $21.25 per square foot. Consolidated Baseyards Subdivision This 35-lot light industrial subdivision was completed in 2007 and is located on Waiko Road in the Waikapu area of Wailuku, encompassing 23.164 acres of land. The lots range in size from 10,375 to 85,502 square feet. Twenty-six (26) lots sold in 2006 with prices ranging from $28.16 to $38.00 per square foot with an average price of $32.87. The lowest prices at about $28.00 to $29.00 per square foot were discounted prices offered only to initial buyers. In 2007, eight (8) more lots sold at prices ranging from $27.61 per square foot for a 53,143 square foot lot to $39.97 per square foot for a 13,811 square foot lot. The average price in 2007 was $33.18 per square foot, while the average price in 2008 was
ACM Consultants, Inc. Olowalu Town
Page 62
$37.45 per square foot. There was one September 2009 sale; however, this was shown to be between related parties. The next most recent sale was in November 2008, at $36.00 per square foot. Maui Lani Village Center Consisting of 78 lots of between 7,545 and 196,185 square feet, Maui Lani Village Center is located off Kuikahi Drive in Wailuku. Completed in 2010, this mixed use subdivision has unique zoning that allows for commercial and residential uses, in addition to industrial uses. There were six closings in late 2009, ranging in price from $50.00 to $55.00 per square foot. There has been one sale in 2010, at $60.00 per square foot. Developer pricing for the remaining inventory is generally between $50 and $60 per square foot.
West Maui Wili Ko Subdivision This light industrial subdivision consists of about 37 acres and is one of only two industrial subdivisions serving the entire West Maui region. It contains 19 lots, of which two are owned by Kaanapali Pacific Railroad, Ltd. The remaining lots are all improved with commercial or light industrial facilities. The lots range in size from 10,000 to 40,457 square feet. The majority of the properties in this subdivision contain multi-tenant facilities. Lahaina Business Park The Lahaina Business Park is the newest industrial subdivision in Lahaina, situated approximately 800 feet mauka of Honoapiilani Highway. This light industrial subdivision contains a total of 62 lots, including one designated as a "roadway lot". This subdivision was developed in two phases. Phase I consists of 28 lots on approximately 16.1 acres, with lots ranging in size from 15,727 to 34,882 square feet. Phase II, on about 21 acres, has 31 marketable lots ranging from 12,299 to 43,939 square feet, with an average lot size of 22,042 square feet. Access is allowed by way of Keawe Street which runs from Honoapiilani Highway, opposite the Lahaina Cannery Mall. There were no land sales within the Lahaina Business Park between 2007 and 2009; strong evidence of West Maui’s lack of land entitled for light industrial use. However, the economic recession that occurred during this period has caused a substantial decline in land values within this subdivision. There have been three conveyances in 2010 to-date. An April 2010 sale, at $26.00 per square foot, involved five adjoining lots totaling 127,430 square feet. A June 2010 foreclosure sale of one lot was at $26.20 per square foot. Two adjacent lots sold in July 2010 for $30.45 per square foot.
ACM Consultants, Inc. Olowalu Town
Page 63
It should be noted that the July 2010 conveyance involved the same two lots in Phase I that had sold for $51.00 per square foot each, in June 2006. This translated into a drop in unit price of about 40 percent over the four-year span.
South Maui Kihei Commercial Center The Kihei Commercial Center is one of only two improved industrial areas within the South Maui region. This subdivision originally consisted of three development lots. The first phase of the project, built on approximately 6.667 acres, consists of four (4) industrial buildings. The second lot, located next to the first phase, consists of 4.101 acres and has been improved with Kihei Commercial Plaza, a four-building office and warehouse condominium project. The other remaining parcel was a 6.128-acre site on Piilani Highway that was further subdivided into six (6) light industrial lots. This subdivision had one sale in each of Years 2004 and 2005. Both sales indicated prices of $27.38 and $28.42 per square foot which were both negotiated in 2004. There were two other sales, in 2006, at $38.14 and $40.57 per square foot, with both lots located along Piilani Highway. The two parcels, Lot 16 and Lot 17, were consolidated into one parcel and were subsequently conveyed as a foreclosure sale in June 2010, at $24.89 per square foot. Lot 15 has been improved with a gas station/convenience store/car wash facility, with additional leasable retail and office spaces. Meanwhile, South Shore Plaza, a three-story commercial retail/office and warehouse complex, was built on Lot 19.
Piilani Business Park The Piilani Business Park is located along Piilani Highway and Ohukai Road in Kihei, adjacent to the Kihei Commercial Center. This park is a 12-lot light industrial subdivision developed by Blackfield Hawaii.
Currently, a Tesoro gas station/service facility is on the 49,960
square foot (Parcel 11) site at the corner of Piilani Highway and Ohukai Road. The other developments include the Kihei Gateway Plaza (Parcel 10), the Kihei Trade Center (Parcel 5), Miyake Concrete (Parcels 2 and 3), Kihei Trade Center II (Parcel 1), the Kihei Gateway Center (Parcel 4), and Aloha Plaza (Parcels 6 & 7).
Commercial/Industrial Listings Research has indicated there is currently about 621 acres of
commercial and industrial land in Central Maui. However, the vast majority is held by the State of Hawaii, and is situated around the Kahului Airport and Kahului Harbor. Furthermore, although not all of the privately owned parcels in Central Maui have been improved, many are being held by their owners for future development. As such,
ACM Consultants, Inc. Olowalu Town
Page 64
only vacant lots listed for sale were deemed to be “available” and considered current supply in Central Maui.
According to the Maui Multiple Listing Service, there are 75 parcels currently available for sale, totaling approximately 40 acres. There are 64 lots for sale, amounting to over 36 acres, within the recently completed Maui Lani Village Center. Wailuku Town has four parcels available, while none of the remaining Central Maui business/industrial parks had more than 2 lots for sale. The 40 acres represents only 6 percent of the overall commercial and industrial land in Central Maui. According to the Maui Multiple Listing Service, West Maui has only five (5) vacant commercial/industrial land parcels listed for sale totaling only 98,974 square feet, or 2.27 acres. South Maui also has five (5) commercial/industrial parcels for sale which totals approximately 7.56 acres. Based on historical absorption, the available acreage is not sufficient to support long-term needs in these regions.
Maui’s Proposed Commercial/Industrial Projects The only proposed light industrial project planned for the Central
Maui region is Phase II of the Maui Business Park, consisting of approximately 179 acres. This project will be located to the southeast of Maui Business Park Phase I. This development was still in the initial design stage, with the timing of subdivision construction unknown. A&B Properties, Inc. intends to redevelop the Kahului Shopping Center and surrounding area into a mixed-use community called the Kahului Town Center. Preliminary plans for the 20 acres call for 442 residential units, 140,000 square feet of retail space and 156,000 square feet of office space. Marketing for Phase I, featuring retail and office condominiums, is currently underway. Preliminary Plans for A&B’s Wai’ale Master Plan Development, which consists of a total of 545 acres, include 23 acres set aside for commercial use and another 16.3 acres for business/light industrial uses. As of current, the developer was still in the process of obtaining entitlements and there was no set timetable for construction of this project.
A 12-acre site at the corner of Maui Lani Parkway and Kaahumanu Avenue is planned for the Maui Lani Shopping Center. This retail project is slated to have a Safeway as its anchor tenant. The project is currently in the entitlement phase, with its environmental assessment having been accepted in August 2010. Maui Lani has other small sites within their project district planned for commercial use; however, the majority has been built as part of their Village Center.
ACM Consultants, Inc. Olowalu Town
Page 65
The Kehalani Project District has 20 acres on the eastern side of Honoapiilani Highway set aside for their commercial component. A Conceptual Land Use Map listed approximately 200,000 to 210,000 square feet of commercial space is to be built; however, there were no known plans for this area. Due to the rapid growth of South Maui and its potential for economic expansion, an additional 88 acres were rezoned from agricultural land in 2005. This proposed light industrial project, preliminarily known as Kaonoulu Business Park, will help accommodate the long-term demand for industrial space in this region. As of current, there were no known design plans or timetable for construction for this subdivision.
DEMAND CHARACTERISTICS Industrial/Commercial Land Pricing Trend Up to the Year 2007, there was significant appreciation for
commercial/industrial vacant land on Maui, as well as the entire island. This rise in prices was attributed primarily to favorable economic conditions, coupled with the lack of entitled land. On Maui, a majority of the lots in existing commercial/industrial subdivisions have been built-out or are being held by their owners for development in the near-term future. In this light, the Consultant looked to more recently developed parks, Waiko Baseyard, Consolidated Baseyards, Maui Business Parks, and Lahaina Business Parks, for trend evidence within the industrial/commercial market.
There have been very few sales of lots within these parks since 2009; however, it is obvious that there has been a downward trend since 2007. When compared to 2007, 2009 and 2010 sales prices and current listings indicate a decrease in land values of between 5 and 20 percent.
Vacancy Rates Most of the industrial development in Central Maui consists of owner-user facilities. Conversations with commercial leasing agents revealed that investment-driven warehouse properties have showed an increase in vacancy, as many businesses have shuttered their operations, or relocated to smaller accommodations.
According to a 2010 Maui Retail Market Report by Colliers Monroe Friedlander, Central Maui was the only submarket on the island to post positive net absorption. South Maui and West Maui, which are both heavily populated by visitors, indicated negative net absorption. West Maui revealed the highest vacancy rate of 15.11 percent, while Central Maui was reported to have the lowest vacancy rate at 4.44 percent. The island average stood at 8.52 percent. This is a testament to the strong demand for retail space in Central Maui. As
ACM Consultants, Inc. Olowalu Town
Page 66
previously indicated, Central Maui is home to the island’s larger retail centers, such as Kaahumanu Shopping Center, Maui Mall, and the Maui Marketplace. West Maui has the second highest inventory of retail space at 914,847 square feet, with the majority of retail space catering to visitors.
Rental Rate Trends The Colliers Monroe Friedlander report stated retail rents in West
Maui stabilized in 2010 and ranged from $3.75 to $5.30 per square foot per month, absolute net. Research of retail center space showed Lahaina Gateway Center had units available between $4.00 and $5.00 per square foot. Lahaina Cannery Mall had space available at negotiable rental rates, and Fairway Shops had spaces available at $3.50 to $4.75 per square foot. Asking retail rents in Central Maui was reported to have fallen 7 percent while South Maui asking retail rents fell more than 10 percent since 2009. Commercial leasing agents indicated that property owners have had to lower expectations and in some cases provide rent reductions, in order to keep their tenants.
Our survey of current listings of competing spaces in the Central Maui
neighborhood indicates that rents are lower than a year to two years ago. Whereas warehouse or storage spaces were being rented for upwards of $1.25 to $1.50 per square foot per month on an absolute net basis, current available spaces are clustered within a general range of $0.75 to $1.00 per square foot per month.
Forecasting Demand for Commercial and Industrial Land on Maui Based on our analysis of the interacting supply and demand factors
for commercial and industrial land in Central Maui, the Consultant has analyzed the potential market acceptance of the subject’s commercial, industrial and village mixed use areas.
Population Comparison According to demographic statistics by Claritas, Central Maui’s population grew by approximately 26 percent from 32,310 people in the 1990 census to 40,867 people in the most recent census in 2000. West Maui’s population grew by approximately 23 percent from 14,392 in the 1990 census to 17,748 in the 2000 census, while South Maui had the largest increase of approximately 49 percent from 15,349 in the 1990 census to 22,874 in the 2000 census. Central Maui has kept to approximately 32 percent of the total population of Maui County during this period and is still at 32 percent, based on 2010 population estimates. The 2010 estimate indicates a population growth rate of approximately 14 percent over the 2000 census numbers. The population of South Maui and West Maui
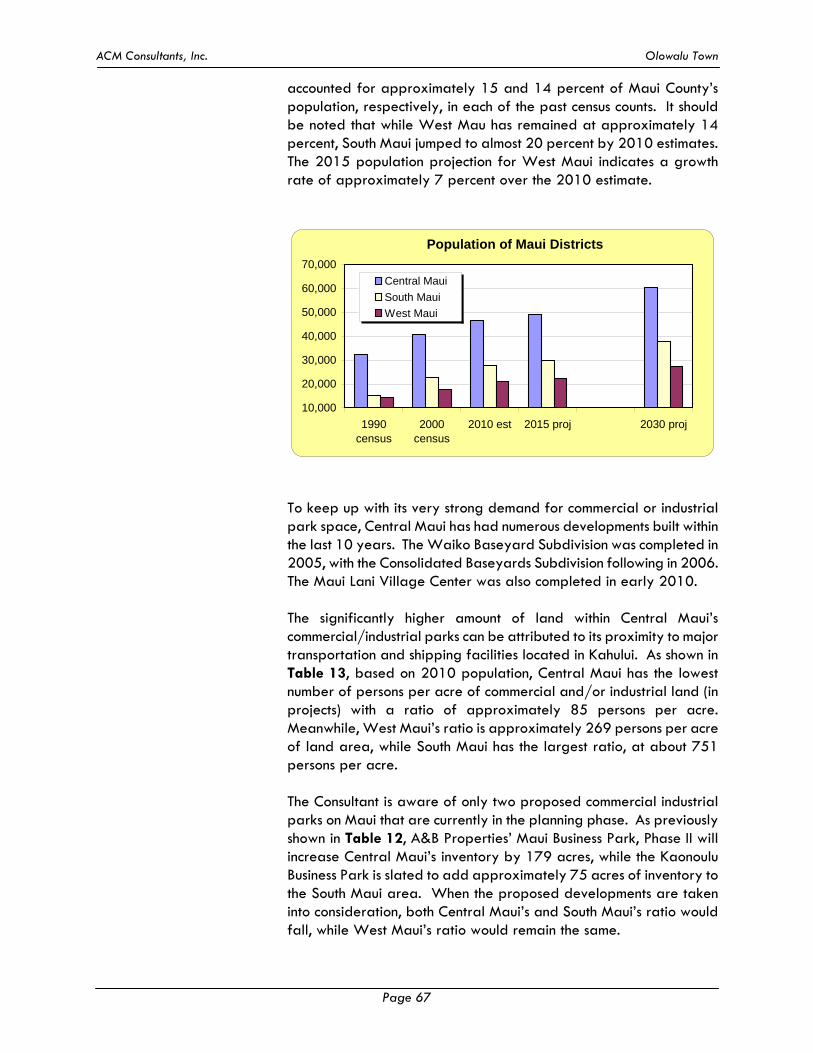
ACM Consultants, Inc. Olowalu Town
Page 67
accounted for approximately 15 and 14 percent of Maui County’s population, respectively, in each of the past census counts. It should be noted that while West Mau has remained at approximately 14 percent, South Maui jumped to almost 20 percent by 2010 estimates. The 2015 population projection for West Maui indicates a growth rate of approximately 7 percent over the 2010 estimate.
Population of Maui Districts
10,000
20,000
30,000
40,000
50,000
60,000
70,000
1990census
2000census
2010 est 2015 proj 2030 proj
Central Maui
South Maui
West Maui
To keep up with its very strong demand for commercial or industrial park space, Central Maui has had numerous developments built within the last 10 years. The Waiko Baseyard Subdivision was completed in 2005, with the Consolidated Baseyards Subdivision following in 2006. The Maui Lani Village Center was also completed in early 2010. The significantly higher amount of land within Central Maui’s commercial/industrial parks can be attributed to its proximity to major transportation and shipping facilities located in Kahului. As shown in Table 13, based on 2010 population, Central Maui has the lowest number of persons per acre of commercial and/or industrial land (in projects) with a ratio of approximately 85 persons per acre. Meanwhile, West Maui’s ratio is approximately 269 persons per acre of land area, while South Maui has the largest ratio, at about 751 persons per acre.
The Consultant is aware of only two proposed commercial industrial parks on Maui that are currently in the planning phase. As previously shown in Table 12, A&B Properties’ Maui Business Park, Phase II will increase Central Maui’s inventory by 179 acres, while the Kaonoulu Business Park is slated to add approximately 75 acres of inventory to the South Maui area. When the proposed developments are taken into consideration, both Central Maui’s and South Maui’s ratio would fall, while West Maui’s ratio would remain the same.
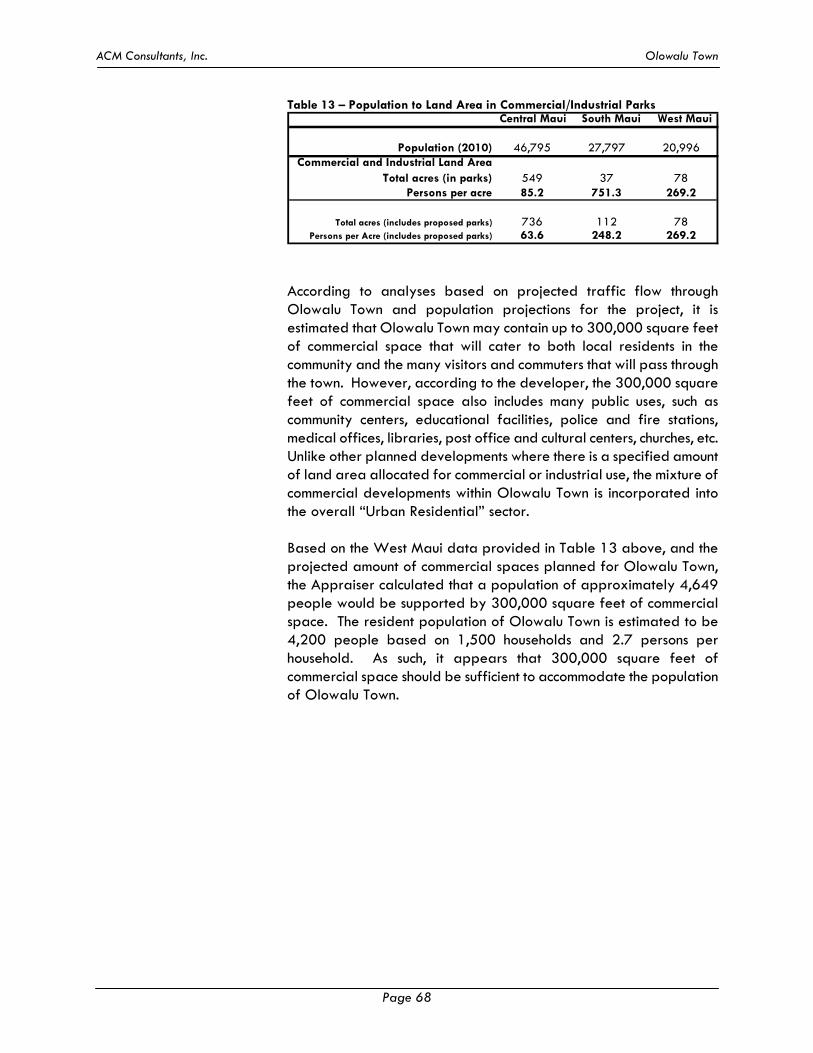
ACM Consultants, Inc. Olowalu Town
Page 68
Table 13 – Population to Land Area in Commercial/Industrial Parks
Central Maui South Maui West Maui
Population (2010) 46,795 27,797 20,996Commercial and Industrial Land Area
Total acres (in parks) 549 37 78Persons per acre 85.2 751.3 269.2
Total acres (includes proposed parks) 736 112 78Persons per Acre (includes proposed parks) 63.6 248.2 269.2
According to analyses based on projected traffic flow through Olowalu Town and population projections for the project, it is estimated that Olowalu Town may contain up to 300,000 square feet of commercial space that will cater to both local residents in the community and the many visitors and commuters that will pass through the town. However, according to the developer, the 300,000 square feet of commercial space also includes many public uses, such as community centers, educational facilities, police and fire stations, medical offices, libraries, post office and cultural centers, churches, etc. Unlike other planned developments where there is a specified amount of land area allocated for commercial or industrial use, the mixture of commercial developments within Olowalu Town is incorporated into the overall “Urban Residential” sector. Based on the West Maui data provided in Table 13 above, and the projected amount of commercial spaces planned for Olowalu Town, the Appraiser calculated that a population of approximately 4,649 people would be supported by 300,000 square feet of commercial space. The resident population of Olowalu Town is estimated to be 4,200 people based on 1,500 households and 2.7 persons per household. As such, it appears that 300,000 square feet of commercial space should be sufficient to accommodate the population of Olowalu Town.
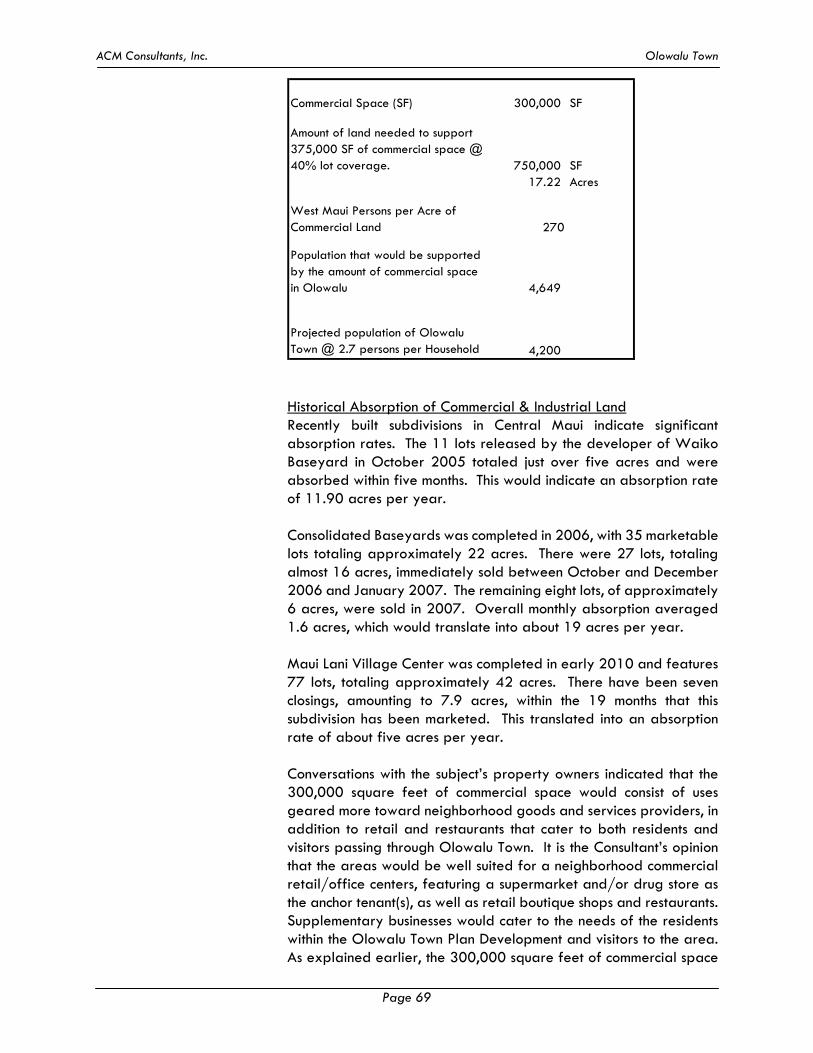
ACM Consultants, Inc. Olowalu Town
Page 69
Commercial Space (SF) 300,000 SF
Amount of land needed to support 375,000 SF of commercial space @ 40% lot coverage. 750,000 SF
17.22 Acres
West Maui Persons per Acre of Commercial Land 270
Population that would be supported by the amount of commercial space in Olowalu 4,649
Projected population of Olowalu Town @ 2.7 persons per Household 4,200 Historical Absorption of Commercial & Industrial Land Recently built subdivisions in Central Maui indicate significant absorption rates. The 11 lots released by the developer of Waiko Baseyard in October 2005 totaled just over five acres and were absorbed within five months. This would indicate an absorption rate of 11.90 acres per year. Consolidated Baseyards was completed in 2006, with 35 marketable lots totaling approximately 22 acres. There were 27 lots, totaling almost 16 acres, immediately sold between October and December 2006 and January 2007. The remaining eight lots, of approximately 6 acres, were sold in 2007. Overall monthly absorption averaged 1.6 acres, which would translate into about 19 acres per year. Maui Lani Village Center was completed in early 2010 and features 77 lots, totaling approximately 42 acres. There have been seven closings, amounting to 7.9 acres, within the 19 months that this subdivision has been marketed. This translated into an absorption rate of about five acres per year. Conversations with the subject’s property owners indicated that the 300,000 square feet of commercial space would consist of uses geared more toward neighborhood goods and services providers, in addition to retail and restaurants that cater to both residents and visitors passing through Olowalu Town. It is the Consultant’s opinion that the areas would be well suited for a neighborhood commercial retail/office centers, featuring a supermarket and/or drug store as the anchor tenant(s), as well as retail boutique shops and restaurants. Supplementary businesses would cater to the needs of the residents within the Olowalu Town Plan Development and visitors to the area. As explained earlier, the 300,000 square feet of commercial space
ACM Consultants, Inc. Olowalu Town
Page 70
also includes many public uses that will serve the Olowalu community as well. Therefore, although market conditions are currently soft for commercial and industrial segments, it is the Consultant’s opinion that there will be stronger demand for the Olowalu Town Master Plan Development’s commercial spaces upon economic recovery. Based on the previously stated supply and demand factors, the 300,000 square feet of commercial space is expected to be absorbed well within the estimated 8- to 10-year absorption of the project’s 1,500 residential units.
ACM Consultants, Inc. Olowalu Town
Page 71
C. CONCLUSION
The following points summarize the supply of real estate in Maui at this time. RESIDENTIAL SUPPLY COMPONENTS
There are approximately 2,300 new housing units (single family residential, condominium and residential house lots) currently available in the market or will become available in the short-term future. Based on historical annual absorption rates of the real estate markets, the current short term supply of units is expected to last approximately 4 years (2,300 units of supply ÷ 590 units of average annual absorption).
Long term supply, as being recommended by the County of
Maui Planning Department, the Maui Planning Commission and the General Plan Advisory Committees, is estimated to be 11,623 housing units. Although this count is based on a 20-year span, it is difficult to gauge the timing of these projects until construction actually begins.
Economic changes, community intervention, market conditions or internal issues with the developers may affect the feasibility of these projects. In reality, some of these projects may never be approved or be built out by 2030. For this reason, the number of units of potential supply that will actually be developed is expected to be lower than the 11,623 units on the list.
COMMERCIAL AND INDUSTRIAL SUPPLY COMPONENTS
Available commercial and industrial land in Central Maui amounted to approximately 40 acres. Most of the availability, about 36 acres, consists of lots within the recently completed Maui Lani Village Center.
There are currently no immediate proposed commercial or
industrial developments planned for West Maui or South Maui. Proposed commercial and industrial developments in the Central Maui region include the Maui Business Park, Phase II (179 acres), Maui Lani Shopping Center (12 acres), and the Kehalani Project District’s commercial component (20 acres). In addition, A&B Properties, Inc. is planning to redevelop the Kahului Shopping Center area into the Kahului Town Center.
The following points summarize the demand for real estate in Maui at this time.

ACM Consultants, Inc. Olowalu Town
Page 72
RESIDENTIAL DEMAND COMPONENTS
Population on Maui between 2000 and 2010 grew by 20.9 percent. Population is expected to increase by almost 58 percent from 2000 to 2035. From 1990 to 2000, Central Maui had a 26.5 percent increase in population, while West Maui and South Maui experienced increases of 23.3 and 49.0 percent, respectively.
In 2010, the interest rate averaged 4.69 percent, with the
lowest rate seen in October at 4.23 percent. As of April 2011, mortgage rates hovered around 4.8 percent. This would typically mean that real estate becomes more affordable to a larger segment of the population. However, the current state of national and local economies, coupled with high unemployment, have prevented many potential market participants from taking advantage of these historically low rates.
Real estate sales activity in land, single-family and
condominium properties dropped considerably in terms of number of sales and median sales price since their peaks in mid-2005. During this same period, marketing times have increased. However, statistics for 2010 appear to show some signs of improvement.
The Hawaii Housing Policy Study Update 2003 shows that
there will be a demand for 8,103 new resident housing units (RHU) from 2011 to 2024.
The Hawaii Housing Policy Study Update 2003 also estimated
a deficit of approximately 3,299 needed resident housing units as of 2010. By the end of the study in 2024, this deficit will increase by approximately 26 percent to 4,154 units.
Demand for Olowalu Town is anticipated to come from all
areas of Maui and not just from West Maui residents. These include the many people that work in West Maui but reside in other regions of the island, as well as those interested in living in an affordable ocean side community.
COMMERCIAL AND INDUSTRIAL DEMAND COMPONENTS
West Maui had a significant increase in population from the 1990 census to the 200 census with a growth rate of 23 percent. Central Maui also had a significant increase in population from the 1990 to the 2000 census, with a growth
ACM Consultants, Inc. Olowalu Town
Page 73
rate of approximately 26 percent. South Maui experienced the greatest increase in population between the 1990 and 2000 census with a growth rate exceeding 40 percent. Increasing population must be followed with the availability of professional services and commercial establishments to support the growth.
Although the lack of sales activity on Maui can partially be
attributed to softened market conditions, there is also a lack of suitable vacant land available for purchase. Therefore it is highly likely that some measure of hidden demand exists. Vacant land prices on Maui overall have decreased. Upon economic recovery, prices are expected to rebound significantly, due to resurgence in demand and limited supply.
Rental rates for commercial and industrial space have
declined since their peaks in 2007. It can be assumed that this trend will reverse course as the economy gains traction.
West Maui appears to have the second highest ratio of
population to acres of finished commercial and industrial land area with South Maui having the highest ratio. This would indicate the continued demand for commercial and industrial land in West Maui and South Maui.
The economic downturn being witnessed across the nation has significantly affected Maui, through a drop in visitor counts and the drastic slowdown of construction. These industries are two of the primary employment forces on the island and their decline has had an adverse impact on the local economy. Unemployment has been on the rise, with many that are still employed stating that job security is a concern. Meanwhile, the heavy losses witnessed in the financial sector since the fourth quarter of 2008 have surely diminished the investment capital for other potential buyers. Combined with a more stringent lending environment, it has become increasingly difficult to purchase and develop real estate, regardless of current market conditions. At the height of the market, the primary obstacle for buyers was the high asking prices for residential products. Many buyers who did not own a home found it difficult to even come up with enough money for a down payment. Meanwhile, homeowners saw their property values increase to a point where they were able to use their equity appreciation to upgrade to larger, more elaborate accommodations. For many, this option is no longer possible, as the retreat of home prices has caused a significant loss of equity. Currently, the ability of qualified buyers to purchase housing may be more difficult than a few years ago; however, it is fairly safe to assume that as economic conditions improve, housing units within the workforce market segment
ACM Consultants, Inc. Olowalu Town
Page 74
will continue to be the most sought after. Local economists have varied opinions as to the timing of the economic recovery, but many have pointed to late-2011 or 2012 for this turnaround. Had the Olowalu Town Master Plan Development come on-line today, it would have likely been facing the same types of sales difficulties that other ongoing projects are witnessing. However, the subject will still need to go through entitlement, design and construction processes before sales can occur. As such, release of the subject’s housing units may be better timed with the economic recovery. Once market conditions improve, the project can expect to see heightened demand, due to its attractive oceanfront community location. Most importantly, the Olowalu Town Master Plan Development will be targeted heavily toward the workforce market segment. Statistical evidence has clearly shown that regardless of conditions, this market segment has the most demand. Although the pricing of the project units have not been determined, this development will give entry level market participants an opportunity for home ownership. The property owners continue to work diligently with government agencies in an effort to design a master plan community that represents smart-growth for Olowalu, a once thriving community. As previously discussed, the proposed project is consistent with many of the goals, objectives, policies and implementing actions set forth in the Countywide Policy Plan, which provides a policy framework for the Maui Island Plan and Community Plans. After consideration of current economic and real estate market conditions; forecasts by Hawaii economists; as well as long-term supply and demand recommendations being deliberated for the 2030 General Plan, it is the Consultant’s opinion that the Olowalu Town Master Plan Development should be well positioned to capitalize on the recovery of the real estate market and play an important role in providing a long-term solution to the housing needs of Maui’s workforce.

EXHIBITS

EXHIBIT A Demographic Reports - Claritas, Inc.

Maui County

West Maui

EXHIBIT B Olowalu Town Conceptual Community Master Plan
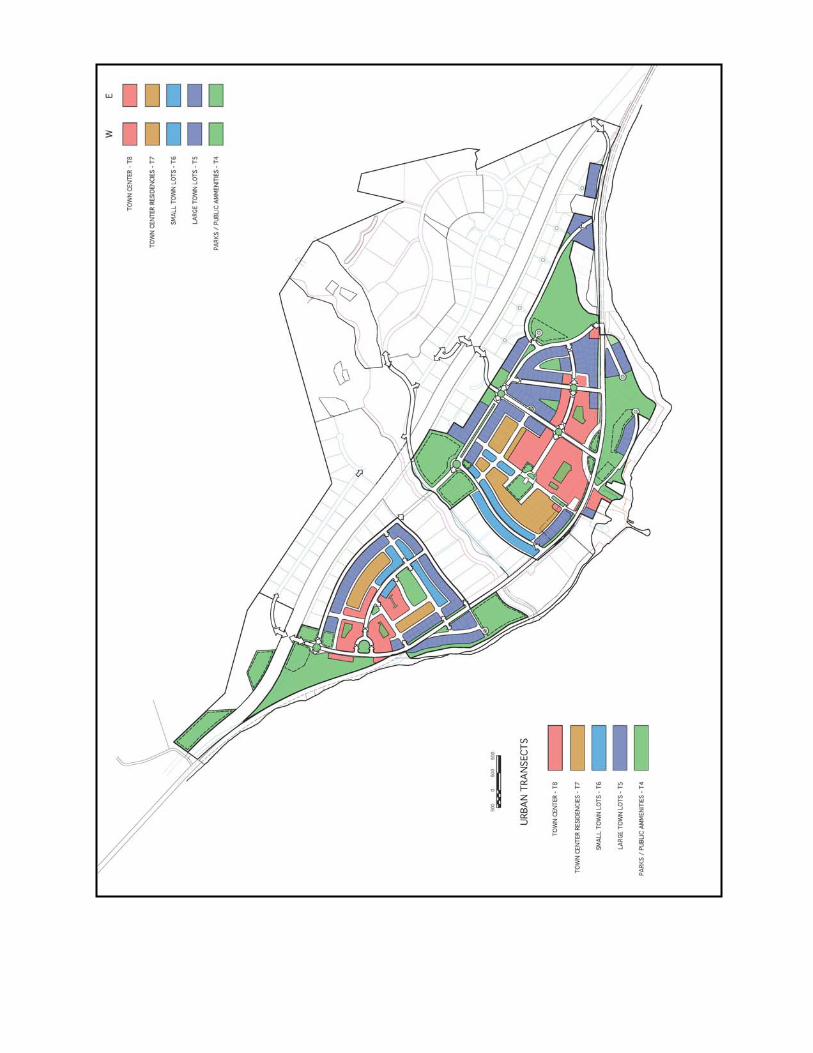

ADDENDA
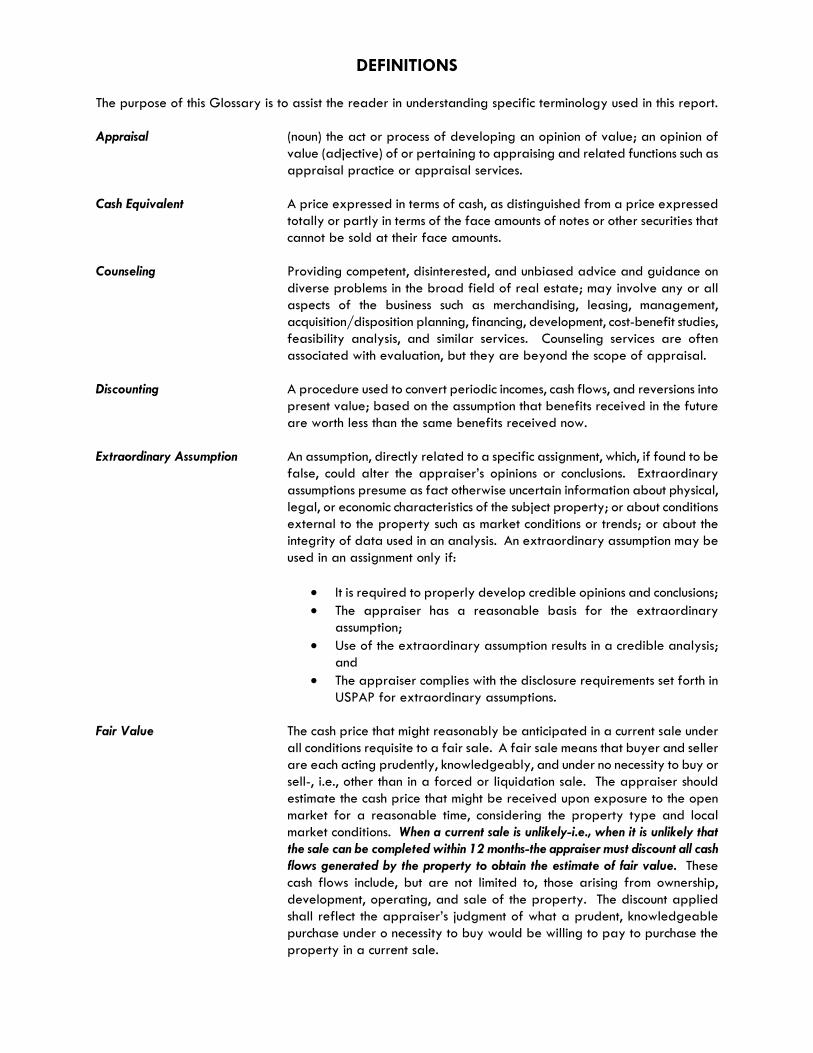
DEFINITIONS The purpose of this Glossary is to assist the reader in understanding specific terminology used in this report. Appraisal (noun) the act or process of developing an opinion of value; an opinion of
value (adjective) of or pertaining to appraising and related functions such as appraisal practice or appraisal services.
Cash Equivalent A price expressed in terms of cash, as distinguished from a price expressed
totally or partly in terms of the face amounts of notes or other securities that cannot be sold at their face amounts.
Counseling Providing competent, disinterested, and unbiased advice and guidance on
diverse problems in the broad field of real estate; may involve any or all aspects of the business such as merchandising, leasing, management, acquisition/disposition planning, financing, development, cost-benefit studies, feasibility analysis, and similar services. Counseling services are often associated with evaluation, but they are beyond the scope of appraisal.
Discounting A procedure used to convert periodic incomes, cash flows, and reversions into
present value; based on the assumption that benefits received in the future are worth less than the same benefits received now.
Extraordinary Assumption An assumption, directly related to a specific assignment, which, if found to be
false, could alter the appraiser’s opinions or conclusions. Extraordinary assumptions presume as fact otherwise uncertain information about physical, legal, or economic characteristics of the subject property; or about conditions external to the property such as market conditions or trends; or about the integrity of data used in an analysis. An extraordinary assumption may be used in an assignment only if:
It is required to properly develop credible opinions and conclusions; The appraiser has a reasonable basis for the extraordinary
assumption; Use of the extraordinary assumption results in a credible analysis;
and The appraiser complies with the disclosure requirements set forth in
USPAP for extraordinary assumptions. Fair Value The cash price that might reasonably be anticipated in a current sale under
all conditions requisite to a fair sale. A fair sale means that buyer and seller are each acting prudently, knowledgeably, and under no necessity to buy or sell-, i.e., other than in a forced or liquidation sale. The appraiser should estimate the cash price that might be received upon exposure to the open market for a reasonable time, considering the property type and local market conditions. When a current sale is unlikely-i.e., when it is unlikely that the sale can be completed within 12 months-the appraiser must discount all cash flows generated by the property to obtain the estimate of fair value. These cash flows include, but are not limited to, those arising from ownership, development, operating, and sale of the property. The discount applied shall reflect the appraiser’s judgment of what a prudent, knowledgeable purchase under o necessity to buy would be willing to pay to purchase the property in a current sale.
Fee Simple Estate Absolute ownership encumbered by any other interest or estate, subject only to the limitations imposed by the governmental powers of taxation, eminent domain, police power, and escheat.
Hawaiian Terms The Hawaiian words "mauka" and "makai" are commonly used in the islands
as indicators of direction. The word "mauka" means toward the mountain, and "makai" means toward the ocean.
Highest and Best Use The reasonably probable and legal use of vacant land or an improved
property, which is physically possible, appropriately supported, financially feasible, and that results in the highest value. The four criteria the highest and best use must meet are legal permissibility, physical possibility, financial feasibility, and maximum profitability.
Highest and Best Use of Land or a Site as Though Vacant Among all reasonable, alternative uses, the use that yields the highest
present land value, after payments are made for labor, capital, and coordination. The use of a property based on the assumption that the parcel of land is vacant or can be made vacant by demolishing any improvements.
Highest and Best Use of Property as Improved The use that should be made of a property as it exists. An existing
improvement should be renovated or retained as is so long as it continues to contribute to the total market value of the property, or until the return from a new improvement would more than offset the cost of demolishing the existing building and constructing a new one.
Hypothetical Condition That which is contrary to what exists, but is supposed for the purpose of
analysis. Hypothetical conditions assume conditions contrary to known facts about physical, legal, or economic characteristics of the subject property; or about conditions external to the property, such as market conditions or trends; or about the integrity of data used in an analysis. A hypothetical condition may be used in an assignment only if:
Use of the hypothetical condition is clearly required for legal
purposes, for purposes of reasonable analysis, or for purposes of comparison;
Use of the hypothetical condition results in a credible analysis; and The appraiser complies with the disclosure requirements set forth in
USPAP for hypothetical conditions Leased Fee Interest An ownership interest held by a landlord with the rights of use and
occupancy conveyed by lease to others. The rights of the lessor (the leased fee owner) and the lessee are specified by contract terms contained within the lease.
Leasehold Interest The interest held by the lessee (the tenant or renter) through a lease
transferring the rights of use and occupancy for a stated term under certain conditions.
Market Rent The most probable rent that a property should bring in a competitive and
open market reflecting all conditions and restrictions of the specified lease agreement including term, rental adjustment and revaluation, permitted uses, use restrictions, and expense obligations; the lessee and lessor each acting
prudently and knowledgeably, and assuming consummation of a lease contract as of a specified date and the passing of the leasehold from lessor to lessee under conditions whereby:
Lessee and lessor are typically motivated. Both parties are well informed or well advised, and acting in
what they consider their best interests. A reasonable time is allowed for exposure in the open market. The rent payment is made in terms of cash in United States
dollars, and is expressed as an amount per time period consistent with the payment schedule of the lease contract.
The rental amount represents the normal consideration for the property leased unaffected by special fees or concessions granted by anyone associated with the transaction.
Market Value The major focus of most real property appraisal assignments. Both economic
and legal definitions of market value have been developed and refined. Continual refinement is essential to the growth of the appraisal profession.
The most widely accepted components of market value are incorporated in the following definition: “The most probable price, as of a specified date, in cash, or in terms equivalent to cash, or in other precisely revealed terms, for which the specified property rights should sell after reasonable exposure in a competitive market under all conditions requisite to a fair sale, with the buyer and seller each acting prudently, knowledgeably, and for self-interest, and assuming that neither is under undue duress.”
Market value is defined in the Uniform Standards of Professional Appraisal Practice (USPAP) as follows:
“A type of value, stated as an opinion, that presumes the transfer of a property (i.e., a right of ownership or a bundle of such rights), as of a certain date, under specific conditions set forth in the definition of the term identified by the appraiser as applicable in an appraisal.”
The following definition of market value is used by agencies that regulate federally insured financial institutions in the United States:
“The most probable price which a property should bring in a competitive and open market under all conditions requisite to a fair sale, the buyer and seller each acting prudently and knowledgeably, and assuming the price is not affected by undue stimulus. Implicit in this definition is the consummation of a sale as of a specified date and the passing of title from seller to buyer under conditions whereby:”
Buyer and seller are typically motivated; Both parties are well informed or well advised, and acting in
what they consider their best interests; A reasonable time is allowed for exposure in the open market; Payment is made in terms of cash in U.S. dollars or in terms of
financial arrangements comparable thereto; and
The price represents the normal consideration for the property sold unaffected by special or creative financing or sales concessions granted by anyone associated with the sale.
Prospective Market Value Upon Completion of Construction The prospective future value of a property on the date that construction is
completed, based upon market conditions forecast to exist as of the completion date.
Prospective Value Opinion A forecast of the value expected at a specified future date. A prospective
value opinion is most frequently sought in connection with real estate projects that are proposed, under construction, or under conversion to a new use, or those that have not achieved sellout or a stabilized level of long-term occupancy at the time the appraisal report is written.
Report Any communication, written or oral, of an appraisal, appraisal review, or
appraisal consulting service that is transmitted to the client upon completion of an assignment. The types of written reports listed below apply to real property appraisals:
Self-Contained Appraisal Report: A written appraisal report prepared under Standards Rule 2-2(a) of the Uniform Standards of Professional Appraisal Practice. A self-contained appraisal report sets forth the data considered, the appraisal procedures followed, and the reasoning employed in the appraisal, addressing each item in the depth and detail required by its significance to the appraisal and providing sufficient information so that the client and the users of the report will understand the appraisal and not be misled or confused.
Summary Appraisal Report: A written report prepared under Standards Rule 2-2(b) or 8-2(b). A summary appraisal report contains a summary of all information significant to the solution of the appraisal problem. The essential difference between a self-contained appraisal report and a summary appraisal report is the level of detail of presentation. Restricted Appraisal Report: A written report prepared under Standards Rule 2-2(c), 8-2(c), or 10-2(b). A restricted use appraisal report is for client use only. The restricted use appraisal report should contain a brief statement of information significant to the solution of the appraisal problem.
Uniform Standards of Professional Appraisal Practice Current standards of the appraisal profession, developed for appraisers
and the users of appraisal services by the Appraisal Standards Board of The Appraisal Foundation. The Uniform Standards set forth the procedures to be followed in developing an appraisal, analysis, or opinion and the manner in which an appraisal, analysis, or opinion is communicated. They are endorsed by the Appraisal Institute and by other professional appraisal organizations.
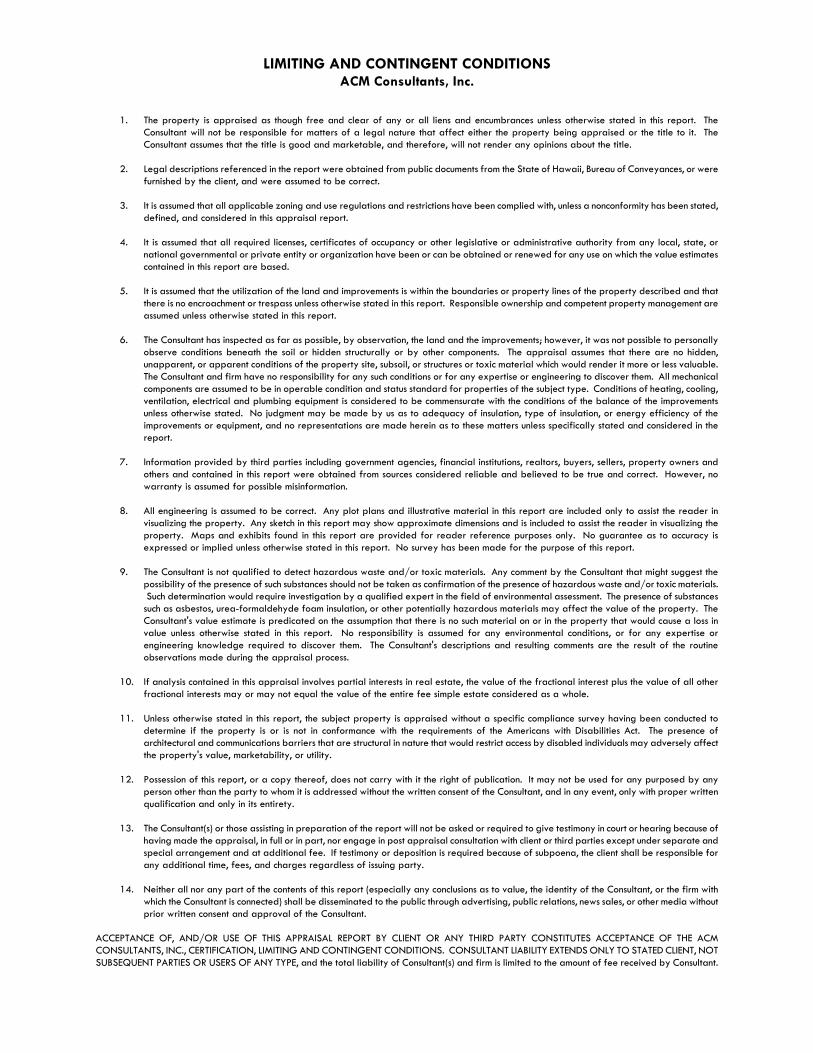
LIMITING AND CONTINGENT CONDITIONS
ACM Consultants, Inc.
1. The property is appraised as though free and clear of any or all liens and encumbrances unless otherwise stated in this report. The Consultant will not be responsible for matters of a legal nature that affect either the property being appraised or the title to it. The Consultant assumes that the title is good and marketable, and therefore, will not render any opinions about the title.
2. Legal descriptions referenced in the report were obtained from public documents from the State of Hawaii, Bureau of Conveyances, or were
furnished by the client, and were assumed to be correct.
3. It is assumed that all applicable zoning and use regulations and restrictions have been complied with, unless a nonconformity has been stated, defined, and considered in this appraisal report.
4. It is assumed that all required licenses, certificates of occupancy or other legislative or administrative authority from any local, state, or
national governmental or private entity or organization have been or can be obtained or renewed for any use on which the value estimates contained in this report are based.
5. It is assumed that the utilization of the land and improvements is within the boundaries or property lines of the property described and that
there is no encroachment or trespass unless otherwise stated in this report. Responsible ownership and competent property management are assumed unless otherwise stated in this report.
6. The Consultant has inspected as far as possible, by observation, the land and the improvements; however, it was not possible to personally
observe conditions beneath the soil or hidden structurally or by other components. The appraisal assumes that there are no hidden, unapparent, or apparent conditions of the property site, subsoil, or structures or toxic material which would render it more or less valuable. The Consultant and firm have no responsibility for any such conditions or for any expertise or engineering to discover them. All mechanical components are assumed to be in operable condition and status standard for properties of the subject type. Conditions of heating, cooling, ventilation, electrical and plumbing equipment is considered to be commensurate with the conditions of the balance of the improvements unless otherwise stated. No judgment may be made by us as to adequacy of insulation, type of insulation, or energy efficiency of the improvements or equipment, and no representations are made herein as to these matters unless specifically stated and considered in the report.
7. Information provided by third parties including government agencies, financial institutions, realtors, buyers, sellers, property owners and
others and contained in this report were obtained from sources considered reliable and believed to be true and correct. However, no warranty is assumed for possible misinformation.
8. All engineering is assumed to be correct. Any plot plans and illustrative material in this report are included only to assist the reader in
visualizing the property. Any sketch in this report may show approximate dimensions and is included to assist the reader in visualizing the property. Maps and exhibits found in this report are provided for reader reference purposes only. No guarantee as to accuracy is expressed or implied unless otherwise stated in this report. No survey has been made for the purpose of this report.
9. The Consultant is not qualified to detect hazardous waste and/or toxic materials. Any comment by the Consultant that might suggest the
possibility of the presence of such substances should not be taken as confirmation of the presence of hazardous waste and/or toxic materials. Such determination would require investigation by a qualified expert in the field of environmental assessment. The presence of substances such as asbestos, urea-formaldehyde foam insulation, or other potentially hazardous materials may affect the value of the property. The Consultant's value estimate is predicated on the assumption that there is no such material on or in the property that would cause a loss in value unless otherwise stated in this report. No responsibility is assumed for any environmental conditions, or for any expertise or engineering knowledge required to discover them. The Consultant's descriptions and resulting comments are the result of the routine observations made during the appraisal process.
10. If analysis contained in this appraisal involves partial interests in real estate, the value of the fractional interest plus the value of all other
fractional interests may or may not equal the value of the entire fee simple estate considered as a whole.
11. Unless otherwise stated in this report, the subject property is appraised without a specific compliance survey having been conducted to determine if the property is or is not in conformance with the requirements of the Americans with Disabilities Act. The presence of architectural and communications barriers that are structural in nature that would restrict access by disabled individuals may adversely affect the property's value, marketability, or utility.
12. Possession of this report, or a copy thereof, does not carry with it the right of publication. It may not be used for any purposed by any
person other than the party to whom it is addressed without the written consent of the Consultant, and in any event, only with proper written qualification and only in its entirety.
13. The Consultant(s) or those assisting in preparation of the report will not be asked or required to give testimony in court or hearing because of
having made the appraisal, in full or in part, nor engage in post appraisal consultation with client or third parties except under separate and special arrangement and at additional fee. If testimony or deposition is required because of subpoena, the client shall be responsible for any additional time, fees, and charges regardless of issuing party.
14. Neither all nor any part of the contents of this report (especially any conclusions as to value, the identity of the Consultant, or the firm with
which the Consultant is connected) shall be disseminated to the public through advertising, public relations, news sales, or other media without prior written consent and approval of the Consultant.
ACCEPTANCE OF, AND/OR USE OF THIS APPRAISAL REPORT BY CLIENT OR ANY THIRD PARTY CONSTITUTES ACCEPTANCE OF THE ACM CONSULTANTS, INC., CERTIFICATION, LIMITING AND CONTINGENT CONDITIONS. CONSULTANT LIABILITY EXTENDS ONLY TO STATED CLIENT, NOT SUBSEQUENT PARTIES OR USERS OF ANY TYPE, and the total liability of Consultant(s) and firm is limited to the amount of fee received by Consultant.

PROFESSIONAL QUALIFICATIONS Glenn K. Kunihisa, MAI, CRE
STATE LICENSING
State Certified General Appraiser, State of Hawaii, License No. CGA 39, July 17, 1991 Expiration: December 31, 2011
PROFESSIONAL AFFILIATIONS
Member, Appraisal Institute, MAI Designation, Hawaii Chapter No. 67 Member, The Counselors of Real Estate, CRE Designation, Hawaii Chapter Member, International Right of Way Association Member, National Association of Realtors, Maui Board of Realtors
PROFESSIONAL INVOLVEMENT Past President – Hawaii Chapter of the Appraisal Institute – 2009 Vice Chairperson – Hawaii Chapter of The Counselors of Real Estate - 2010 Education Chairperson – Hawaii Chapter of the Appraisal Institute – 2004 and 2005 Former Multiple Listing Service (MLS) Committee Member – Realtors Association of Maui
COMMUNITY AFFILIATIONS St. Anthony Parish School Board Board Member 1995 to 2008 Board President 1997 and 1998 Alii Community Care, Inc. – A non-profit health care corporation Board Member 2004 to 2006 EMPLOYMENT
President ACM Consultants, Inc. May, 1997 to present
Previously associated with the following:
ACM, Real Estate Appraisers, Inc. - 1986 to 1997 A&B Commercial Company; a division of Alexander & Baldwin, Inc. - 1979 to 1985 Bank of Hawaii - 1976 to 1979
GENERAL EDUCATION
University of Hawaii at Manoa Master of Business Administration (MBA) - Executive MBA Program V, 1988
Bachelor of Business Administration (BBA), 1976 Iolani School, 1971
LEGAL & CONSULTING
Qualified as an expert witness in the Second Circuit Court of the State of Hawaii Qualified as an expert in testimony to the State Land Use Commission Experienced in real estate arbitration assignments in the State of Hawaii
APPRAISAL EDUCATION
Appraisal Institute Seminar Appraisal Curriculum Overview (2-day general) Honolulu, Hawaii – July 2010
Professional Qualifications Page 2
Seminar Online Valuation of Green Residential Properties Chicago, Illinois – July 2010 Seminar Hotel Valuation Honolulu, Hawaii – February 2010 Seminar Online Small Hotel/Motel Valuation
Chicago, Illinois – November 2009 Seminar Business Practices and Ethics
Honolulu, Hawaii – September 2009 Seminar Hawaii Lands, Historical Review
Lihue, Hawaii – August 2009 Seminar Appraisal Challenges: Declining Markets and Sales Concessions Cambria, California – October 2008 Course 7-Hour National USPAP Update Course Honolulu, Hawaii – September 2008 Course Online 7-Hour National USPAP Equivalent Course
Chicago, Illinois – October 2007 Course Valuation of Conservation Easements Denver, Colorado – October 2007 Seminar Uniform Standards for Federal Land Acquisitions (“Yellow Book”)
Practical Applications for Fee Appraisers Honolulu, Hawaii – December 2006
Seminar California Conservation Easements Sacramento, California – November 2005
Course 400 7-Hour National USPAP Update Course Honolulu, Hawaii – October 2005
Seminar Case Studies in Limited Partnership and Partial Interest Valuation Honolulu, Hawaii – May 2005
Seminar Appraisal Consulting: A Solutions Approach for Professionals Honolulu, Hawaii – February 2005
Seminar Real Estate Finance, Value and Investment Performance Honolulu, Hawaii – February 2005
Seminar Fannie Mae Residential Presentation Honolulu, Hawaii - July 2004
Seminar Subdivision Analysis Chicago, Illinois - August 2003
Seminar Supporting Capitalization Rates Chicago, Illinois - August 2003
Seminar The Technology Assisted Appraiser Chicago, Illinois - August 2003
Seminar Scope of Work: Expanding Your Range of Services Chicago, Illinois - August 2003
Course 400 National Uniform Standards of Professional Practice Honolulu, Hawaii - May 2003
Course 420 Business Practices and Ethics Honolulu, Hawaii - May 2003
Seminar The Private Conservation Market Honolulu, Hawaii - July 2002
Seminar Finance Reporting Valuations Parts I and II Honolulu, Hawaii - July 2002
Seminar Future of Appraisal Profession from a Global Perspective Honolulu, Hawaii - July 2002
Professional Qualifications Page 3
Seminar Appraisal Office Management
Honolulu, Hawaii - July 2002 Course 540 Report Writing
Denver, Colorado - December 2000 Seminar Partial Interests: Theory and Case Law
Las Vegas, Nevada - July 2000 Seminar Easement Valuation
Las Vegas, Nevada - July 2000 Seminar Bridging the Gap: Marketability Discounts for Real Estate Interests
Las Vegas, Nevada - July 2000 Course 430 Standards of Professional Practice, Part C
Honolulu, Hawaii - September 1999 Seminar Litigation Skills for the Appraiser: An Overview
Honolulu, Hawaii - May 1998 Seminar Special Purpose Properties
Honolulu, Hawaii - September 1997 Seminar Highest and Best Use Applications
Honolulu, Hawaii - September 1997 Seminar Detrimental Conditions
Honolulu, Hawaii - July 1997 Seminar The Appraiser As Expert Witness
Honolulu, Hawaii - August, 1995 Seminar How to Appraise FHA-Insured Property
Los Angeles, California - January, 1995 Seminar Understanding Limited Appraisals and Reporting Options
Honolulu, Hawaii - August, 1994 Seminar Valuation of Leasehold Interests
Honolulu, Hawaii - May, 1993 Seminar Valuation of Leased Fee Interests
Honolulu, Hawaii - May, 1993 Seminar Valuation Considerations: Appraising Non-Profits
Boston, Massachusetts - July, 1992 Seminar Americans With Disabilities Act
Boston, Massachusetts - July, 1992 Seminar Valuation in Today's Capital and Financing Markets
Honolulu, Hawaii - June 1992 Seminar Arbitration Principles, Procedures and Pitfalls
Honolulu, Hawaii - June, 1992 Seminar Institutional Real Estate in the 1990's
Honolulu, Hawaii - June, 1992 Seminar FIRREA and its Impact on Appraisers
Honolulu, Hawaii - June, 1992 Course Standards of Professional Practice, Parts A & B 410/420 Honolulu, Hawaii - April, 1991
The American Society of Farm Managers and Rural Appraisers, Inc. Seminar Agricultural Lease Valuation Honolulu, Hawaii – March 2006
Professional Qualifications Page 4
Maui Coastal Land Trust
Seminar Understanding the New Tax Incentives: Conservation Easements & Other Charitable Contributions
Wailuku, Hawaii – June 2007
Society of Real Estate Appraisers Course 101 Introduction to Appraising Real Property
Dallas, Texas – 1987 Course 102 Applied Residential Property Valuation
Honolulu, Hawaii - July 1990 Course 201 Principles of Income Property Appraising
Chicago, Illinois, 1987 Course 202 Applied Income Property Valuation
San Diego, California - 1988 Seminar Professional Practice and the Society of Real Estate Appraisers
Honolulu, Hawaii - 1988 Seminar Appraisal Standards Seminar - Federal Home Loan Bank Board Guidelines, Regulations and Policies
Honolulu, Hawaii - April, 1988 Seminar Appraisal Standards Seminar - Federal Home Loan Bank Board Guidelines, Regulations and Policies
Honolulu, Hawaii - April, 1988 American Institute of Real Estate Appraisers
Seminar Rates, Ratios and Reasonableness Honolulu, Hawaii - 1989
Seminar Discounted Cash Flow Analysis Honolulu, Hawaii - 1989
Seminar Highest and Best Use Honolulu, Hawaii - 1989
Seminar Capitalization Overview - Part A Honolulu, Hawaii - 1990
Seminar Capitalization Overview - Part B Honolulu, Hawaii – 1990
Seminar Accrued Depreciation Honolulu, Hawaii - 1990
International Right of Way Association
Course 101 Appraisal Las Vegas, Nevada - October, 1998
Course 101 Negotiation Las Vegas, Nevada - October 1998
National Business Institute, Inc.
Seminar Commercial Real Estate Leasing In Hawaii Honolulu, Hawaii - 1989
American Arbitration Association
Seminar Real Estate Dispute Resolution - Mediation and Arbitration Kahului, Maui, Hawaii - October, 1990
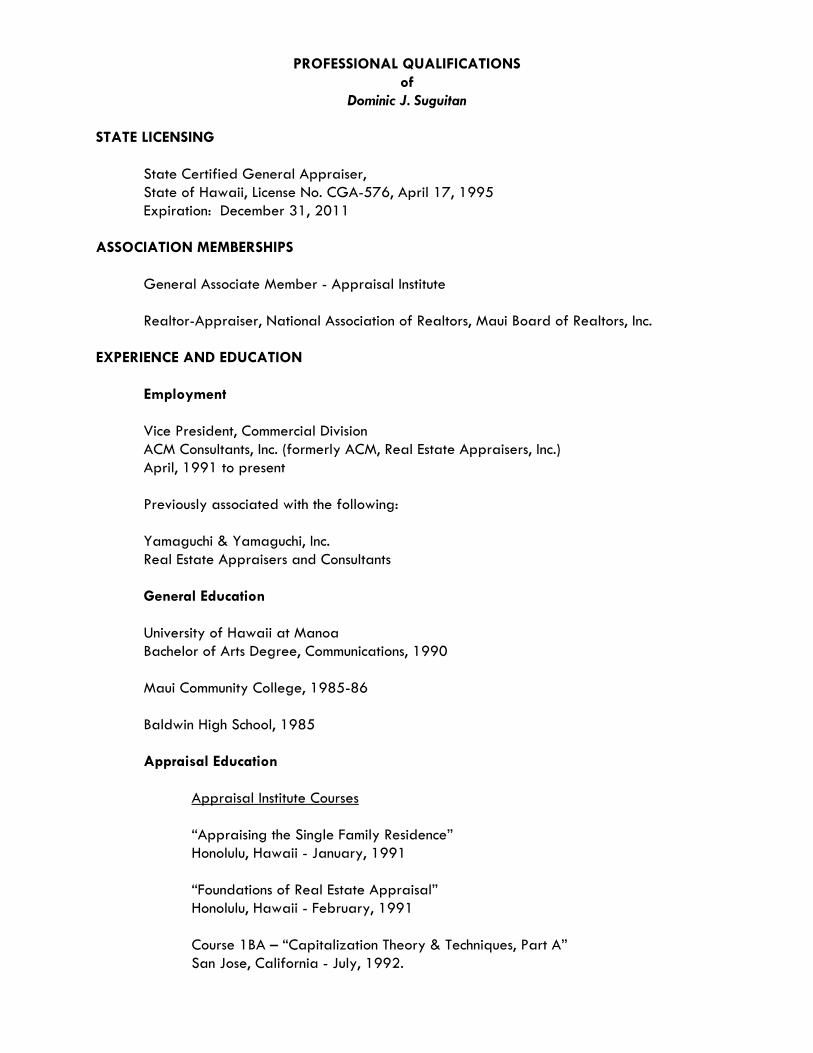
PROFESSIONAL QUALIFICATIONS of
Dominic J. Suguitan STATE LICENSING
State Certified General Appraiser, State of Hawaii, License No. CGA-576, April 17, 1995 Expiration: December 31, 2011
ASSOCIATION MEMBERSHIPS
General Associate Member - Appraisal Institute
Realtor-Appraiser, National Association of Realtors, Maui Board of Realtors, Inc. EXPERIENCE AND EDUCATION
Employment
Vice President, Commercial Division ACM Consultants, Inc. (formerly ACM, Real Estate Appraisers, Inc.) April, 1991 to present
Previously associated with the following:
Yamaguchi & Yamaguchi, Inc. Real Estate Appraisers and Consultants
General Education
University of Hawaii at Manoa Bachelor of Arts Degree, Communications, 1990
Maui Community College, 1985-86
Baldwin High School, 1985
Appraisal Education
Appraisal Institute Courses
“Appraising the Single Family Residence” Honolulu, Hawaii - January, 1991
“Foundations of Real Estate Appraisal” Honolulu, Hawaii - February, 1991
Course 1BA – “Capitalization Theory & Techniques, Part A” San Jose, California - July, 1992.
Appraisal Qualifications Dominic J. Suguitan Page 2
Course 1BB – “Capitalization Theory & Techniques, Part B” San Jose, California - July, 1992. Course I410 – “Standards of Professional Practice, Part A (USPAP)” Honolulu, Hawaii - April, 1993 Course II420 – “Standards of Professional Practice, Part B (USPAP)” Honolulu, Hawaii - April, 1993.
Course II430 – “Standards of Professional Practice, Part C (USPAP)” Honolulu, Hawaii - September, 1999.
Course I400 – “7-Hour National USPAP Update Course” Honolulu, Hawaii - May, 2003.
Course II420 – “Business Practices and Ethics” Honolulu, Hawaii - May, 2003
“Online 7-Hour National USPAP Equivalent Course” – Online Course Chicago, Illinois – November, 2005
Course 520 – “Highest & Best Use and Market Analysis” Seattle, Washington – September 2006
“Online 7-Hour National USPAP Equivalent Course” – Online Course Chicago, Illinois – November, 2007 “Online 7-Hour National USPAP Equivalent Course” – Online Course Chicago, Illinois – September, 2009 “Online Business Practices and Ethics” – Online Course Chicago, Illinois – November, 2009
Appraisal Institute Seminars
“Data Confirmation and Verification Methods” - Seminar Honolulu, Hawaii - October, 1995
“Residential Property Construction and Inspection” - Seminar Honolulu, Hawaii - October, 1995
“Appraisal of Retail Properties” - Seminar Honolulu, Hawaii - May, 1996
“Detrimental Conditions in Hawaii” - Seminar Honolulu, Hawaii - July, 1997
Appraisal Qualifications Dominic J. Suguitan Page 3
“Special Purpose Properties” - Seminar Honolulu, Hawaii - September, 1997
“Highest and Best Use Applications” - Seminar Honolulu, Hawaii - September, 1997
“Appraising From Blueprints and Specs” - Seminar Honolulu, Hawaii - May, 1998 “New Industrial Valuation” - Seminar Honolulu, Hawaii - October, 1998 “Eminent Domain & Condemnation Appraising” - Seminar Honolulu, Hawaii - October, 1998 "Online Analyzing Operating Expenses" – Online Seminar Chicago, Illinois - September, 2001 "Real Estate Disclosure" - Seminar Honolulu, Hawaii - October, 2001 "Online Internet Search Strategies for R.E. Appraisers" – Online Seminar Chicago, Illinois - October, 2001
"Online Valuation of Detrimental Conditions in Real Estate" – Online Seminar Chicago, Illinois - December, 2001 “The Appraisal Institute Commercial Database & AppraiserLoop, Part I” - Seminar Honolulu, Hawaii - July, 2002
“Statistical Analysis Using the Database, Part I” - Seminar Honolulu, Hawaii - July, 2002
“The Aftermath: Our World Post-Sept 11” - Seminar Honolulu, Hawaii - July, 2002
“Statistical Modeling & GIS: Applications for Income Properties” - Seminar Honolulu, Hawaii - July, 2002 “Real Estate Finance, Value and Investment Performance” – Seminar Honolulu, Hawaii – February, 2005 “Introduction to GIS Applications for Real Estate Appraisal” – Online Seminar Chicago, Illinois – August, 2005
Appraisal Qualifications Dominic J. Suguitan Page 4
“Online Small Hotel/Motel Valuation” – Online Seminar Chicago, Illinois – October, 2005 “Hawaii Lands, Historical Review” Kahului, Hawaii – September, 2009 “Online Real Estate Finance Statistics and Valuation Modeling” – Online Seminar Chicago, Illinois – October, 2009
Society of Real Estate Appraisers
Course 101 – “Introduction to Appraising Real Property” Tempe, Arizona - June, 1991