Embed Size (px)
Citation preview
S.A.C.I. FalabellaCorporate Presentation
J a n u a r y 2 0 1 8
CONTENTSTHE COMPANY
INVESTMENT HIGHLIGHTS
CONSOLIDATED STATEMENTS
CORPORATE STRUCTURE
BUSINESS UNIT OVERVIEW

THE COMPANY

US$ 4.4 billion
Revenues
1. Does not include an 982,000 m2 of additional GLA in free standing stores in the region also owned by S.A.C.I. Falabella.Note: Revenues as of September 2017 LTM. Number of stores and sales area as of September 2017. Number of CMR accounts with balance. FX rate as of October 2rd 2017 (637,93 CLP/US$). Home Improvement includes Sodimac Colombia, which the company does not consolidate. Does not include Uruguay revenue, which the company does consolidate. 4
Presence In 7 Countries In Latin America
DEPARTMENT STORES
HOME IMPROVEMENT
SUPERMARKETSFINANCIALSERVICES
REAL ESTATE
45 Stores
318,000 m2
29 Stores
177,000 m2
26 Stores
175,000 m2
11 Stores
58,000 m2
87 Stores
730,000 m2
56 Stores
372,000 m2
38 Stores
367,000 m2
8 Stores
86,000 m2
US$ 5.8
billion
Revenues
63 Stores
210,000 m2
61 Stores
225,000 m2
US$ 2.2 billion
Revenues
2,383,000 active
CMR cards
966,000 active
CMR cards
1,040,000 active
CMR cards
500,000 active
CMR cards
US$ 7.0 billion
Loan Book4,4 million CMR
accounts
26 shopping centers
1,557,000 m2 GLA
14 shopping centers
514,000 m2 GLA
1 shopping center
27,000 m2 GLA
2.1 million m2
of GLA1
20/21
Shopping/ power centers
56 Stores
158,000 m2
3 Stores
25,000 m2
COMING
SOON !
Recently launched
Falabella-Soriana
credit card

3%4%
20%
74%
Note: Revenue and EBITDA percentages exclude Sodimac Colombia, which is not consolidated.
CMR accounts with balance and employees as of September 2017.
Total number of employees includes +130 employees in Asia and Mexico.
5
US$ 13.8
billion
Main Figures
Mix by Country (LTM)
CMR ACCOUNT
S
STORES SHOPPINGCENTERS
LOAN BOOK
TOTAL REVENUES (LTM)
US$ 7.0
billion
2,900,000 m2
sales area
2,100,000 m2
GLA
48341
Total Employees:
3,200
16,000
400
29,700
51,000
5,400
6%
6%
24%
<1
%
62%
2%ARGENTINA
COLOMBIA
PERU
URUGUAY
BRAZIL
CHILE
REVENUE
+ 4,390,000
EBITDA
ARGENTINACOLOMBIA
PERU
CHILE
Key Figures
Total: 105,800
INVESTMENT HIGHLIGHTS

7
Leadership
in Latam
across
formats
Responsible
growth
strategy
Customer
centric strategy
Experienced
management
team
Differentiating
brands
Sustainable business
development
Corporate governance
practices
1.
2.
3.
4.
5.
6.
7.
Strategic Pillars
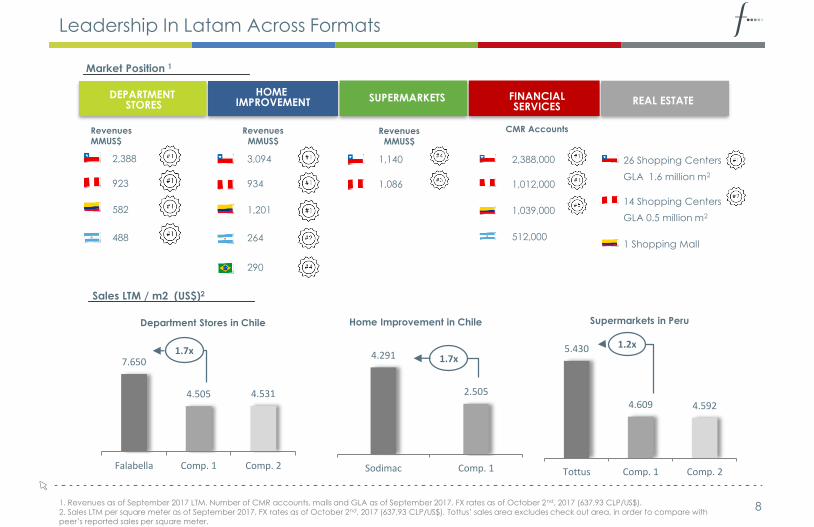
1. Revenues as of September 2017 LTM. Number of CMR accounts, malls and GLA as of September 2017. FX rates as of October 2nd, 2017 (637,93 CLP/US$).
2. Sales LTM per square meter as of September 2017. FX rates as of October 2nd, 2017 (637,93 CLP/US$). Tottus’ sales area excludes check out area, in order to compare with
peer’s reported sales per square meter.
8
DEPARTMENT STORES
HOME IMPROVEMENT SUPERMARKETS FINANCIAL
SERVICESREAL ESTATE
2,388
923
582
488
Revenues
MMUS$
Revenues
MMUS$Revenues
MMUS$
Market Position 1
Sales LTM / m2 (US$)2
Department Stores in Chile Supermarkets in PeruHome Improvement in Chile
3,094
934
1,201
264
290
1,140
1,086
CMR Accounts
2,388,000
1,012,000
1,039,000
512,000
26 Shopping Centers
GLA 1.6 million m2
14 Shopping Centers
GLA 0.5 million m2
1 Shopping Mall
Leadership In Latam Across Formats
7.650
4.505 4.531
Falabella Comp. 1 Comp. 2
1.7x 4.291
2.505
Sodimac Comp. 1
1.7x5.430
4.609 4.592
Tottus Comp. 1 Comp. 2
1.2x
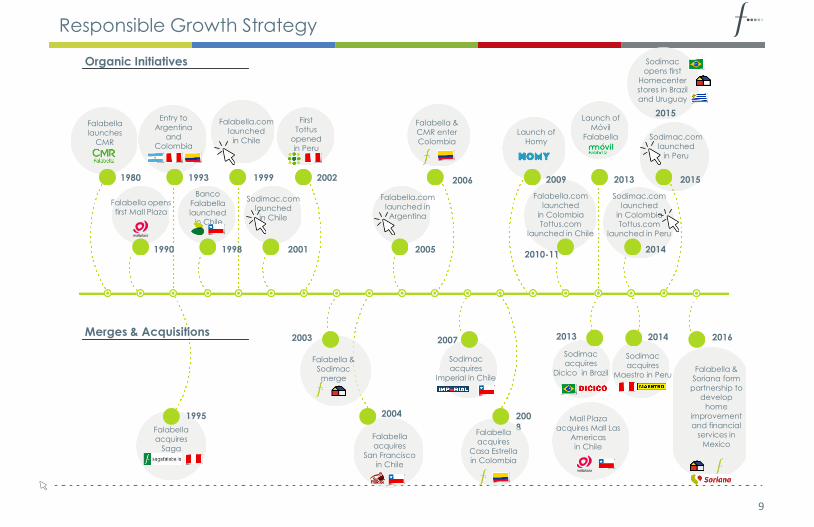
Sodimac
opens first
Homecenter stores in Brazil
and Uruguay
9
1980
Launch of
Móvil
Falabella
First
Tottus
opened in Peru
Falabella &
CMR enter
Colombia
Falabella
launches
CMR
Falabella opens
first Mall Plaza
Entry to
Argentina
and Colombia
Banco
Falabella
launchedin Chile
Falabella.com
launched
in Chile
Falabella.com
launched in
Argentina
Sodimac.com
launched
in Peru
Falabella.com
launched
in Colombia Tottus.com
launched in Chile
Sodimac.com
launched
in Colombia Tottus.com
launched in Peru
Launch of
Homy
Organic Initiatives
1990
1993
1998
1999
2001
2002
2003
2004
2005
2006
2007
200
8
2009
2010-11
2013
2014
2015
2016
Falabella
acquires
San Francisco in Chile
Sodimac
acquires
Dicico in Brazil
Sodimac
acquires
Imperial in Chile
Sodimac
acquires
Maestro in Peru
Falabella
acquires
Casa Estrella in Colombia
Mall Plaza
acquires Mall Las
Americas in Chile
Falabella &
Sodimac
merge
Falabella
acquires
Saga
Falabella &
Soriana form
partnership to develop
home
improvement
and financial services in
Mexico
1995
Sodimac.com
launched
in Chile
2013
2014Merges & Acquisitions
Responsible Growth Strategy
2015

10
Investment Plan 2018-2021As of January 2018
Store and Shopping Centers OpeningsInvestment (US$ million)
US$ 3.9 bnInvestment over the next 4 years
Remodeling and expansion of existing stores & shopping centers
23 28 29 28
3 2 2 1
2 0 1 8 2 0 1 9 2 0 2 0 2 0 2 1
Stores Shopping Centers
Investment Plan 2018 - 2021
984996
975989
2 0 1 8 2 0 1 9 2 0 2 0 2 0 2 1
37%
32%
31%
New stores & shopping centers
IT, logistics & others
108 stores
8 shopping centers
Note: The investment plan includes 100% of expected capex for S.A.C.I. Falabella and subsidiaries, including Sodimac Colombia, Sodimac Mexico, CMR
Mexico, which the Company does not consolidate.

11
Private Labels
Exclusive Brands
Differentiating Brands

12
Customer knowledge through consistent interaction
+319 385 +1.6 497,000
transactions in our retail businesses
visits to our shopping centers in the region
CMR accounts with a balance
bank accounts with Banco Falabella
Passengers travelled usingViajes Falabella
millionmillion
million
→
→
→
→
When does
she purchase
What
does
she like
How
much
does she
spend
Means
of
paymen
t
What
does
she buy
Where
does
she
purchas
e
→
→
Data as of December 2016.
million
Customer Centric Strategy
Commercial
Platform
Self Service
Stations
ATM
Contact
Center
Points of
Sale
Social
Networks
Mobile
Apps
Websites
+4.4
13
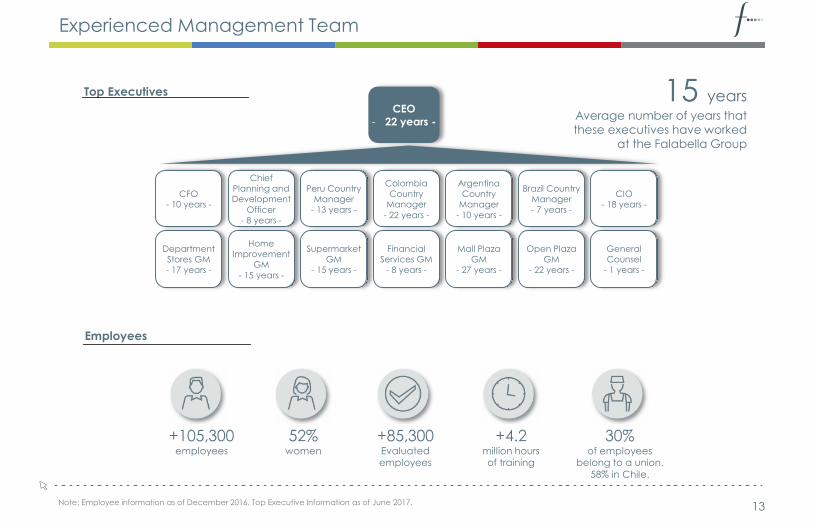
Top Executives
Employees
Note: Employee information as of December 2016. Top Executive Information as of June 2017.
15 yearsAverage number of years that these executives have worked
at the Falabella Group
CEO
- 22 years -
General
Counsel
- 1 years -
Peru Country
Manager
- 13 years -
Colombia
Country
Manager
- 22 years -
Chief
Planning and
Development
Officer
- 8 years -
CFO
- 10 years -
Argentina
Country
Manager
- 10 years -
Brazil Country
Manager
- 7 years -
CIO
- 18 years -
Department
Stores GM
- 17 years -
Home
Improvement
GM
- 15 years -
Supermarket
GM
- 15 years -
Financial
Services GM
- 8 years -
Mall Plaza
GM
- 27 years -
Open Plaza
GM
- 22 years -
+105,300employees
52%women
+85,300Evaluatedemployees
+4.2million hours of training
30%of employees
belong to a union.
58% in Chile.
Experienced Management Team
14
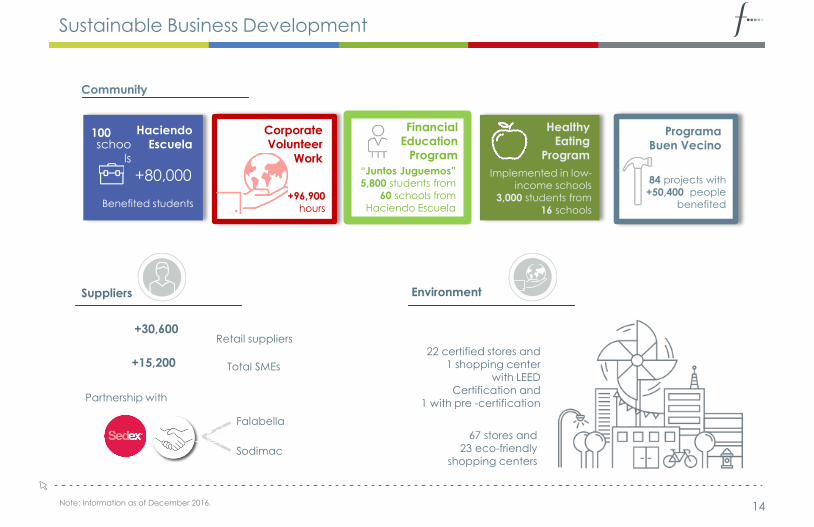
465,000
Community
Suppliers Environment
Note: Information as of December 2016.
“Juntos Juguemos”
5,800 students from
60 schools from
Haciendo Escuela
FinancialEducation
Program
Implemented in low-
income schools
3,000 students from
16 schools
schools
+80,000
Benefited students
HaciendoEscuela
Programa Buen Vecino
HealthyEating
Program
CorporateVolunteer
Work
+96,900
hours
84 projects with
+50,400 people
benefited
Partnership with
22 certified stores and
1 shopping center
with LEED
Certification and
1 with pre -certification
67 stores and
23 eco-friendly
shopping centers
+30,600Retail suppliers
+15,200 Total SMEs
Falabella
Sodimac
Sustainable Business Development
100
15
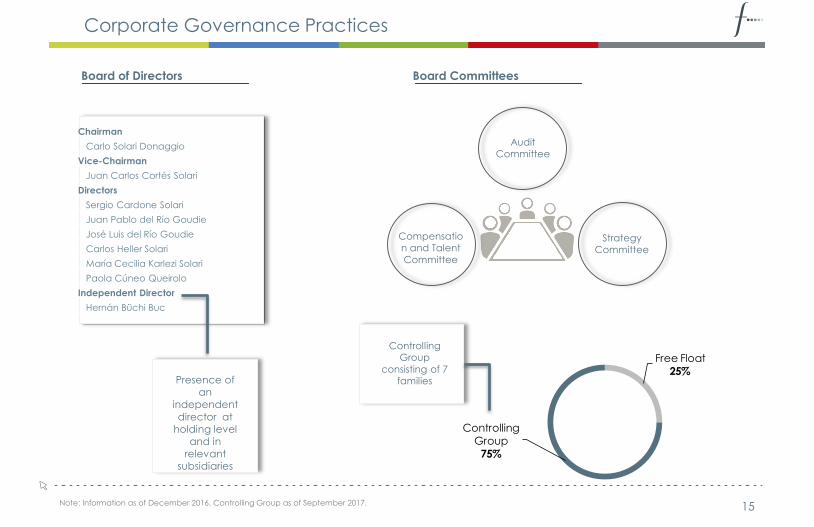
Board of Directors Board Committees
Chairman
Carlo Solari Donaggio
Vice-Chairman
Juan Carlos Cortés Solari
Directors
Sergio Cardone Solari
Juan Pablo del Río Goudie
José Luis del Río Goudie
Carlos Heller Solari
María Cecilia Karlezi Solari
Paola Cúneo Queirolo
Independent Director
Hernán Büchi Buc
Compensation and Talent
Committee
AuditCommittee
Strategy Committee
Controlling Group
consisting of 7 familiesPresence of
an
independent
director at
holding level
and in
relevant
subsidiaries
Corporate Governance Practices
Note: Information as of December 2016. Controlling Group as of September 2017.
Free Float
25%
Controlling
Group
75%

CONSOLIDATED STATEMENTS
17
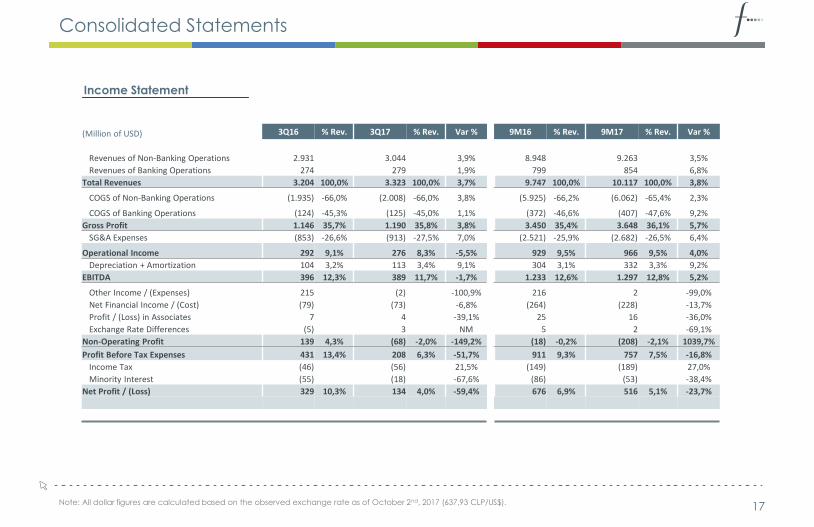
Income Statement
Consolidated Statements
Note: All dollar figures are calculated based on the observed exchange rate as of October 2nd, 2017 (637,93 CLP/US$).
(Million of USD) 3Q16 % Rev. 3Q17 % Rev. Var % 9M16 % Rev. 9M17 % Rev. Var %
Revenues of Non-Banking Operations 2.931 3.044 3,9% 8.948 9.263 3,5%
Revenues of Banking Operations 274 279 1,9% 799 854 6,8%
Total Revenues 3.204 100,0% 3.323 100,0% 3,7% 9.747 100,0% 10.117 100,0% 3,8%
COGS of Non-Banking Operations (1.935) -66,0% (2.008) -66,0% 3,8% (5.925) -66,2% (6.062) -65,4% 2,3%
COGS of Banking Operations (124) -45,3% (125) -45,0% 1,1% (372) -46,6% (407) -47,6% 9,2%
Gross Profit 1.146 35,7% 1.190 35,8% 3,8% 3.450 35,4% 3.648 36,1% 5,7%
SG&A Expenses (853) -26,6% (913) -27,5% 7,0% (2.521) -25,9% (2.682) -26,5% 6,4%
Operational Income 292 9,1% 276 8,3% -5,5% 929 9,5% 966 9,5% 4,0%
Depreciation + Amortization 104 3,2% 113 3,4% 9,1% 304 3,1% 332 3,3% 9,2%
EBITDA 396 12,3% 389 11,7% -1,7% 1.233 12,6% 1.297 12,8% 5,2%
Other Income / (Expenses) 215 (2) -100,9% 216 2 -99,0%
Net Financial Income / (Cost) (79) (73) -6,8% (264) (228) -13,7%
Profit / (Loss) in Associates 7 4 -39,1% 25 16 -36,0%
Exchange Rate Differences (5) 3 NM 5 2 -69,1%
Non-Operating Profit 139 4,3% (68) -2,0% -149,2% (18) -0,2% (208) -2,1% 1039,7%
Profit Before Tax Expenses 431 13,4% 208 6,3% -51,7% 911 9,3% 757 7,5% -16,8%
Income Tax (46) (56) 21,5% (149) (189) 27,0%
Minority Interest (55) (18) -67,6% (86) (53) -38,4%
Net Profit / (Loss) 329 10,3% 134 4,0% -59,4% 676 6,9% 516 5,1% -23,7%

18
Balance Sheet
Consolidated Statements
Note: All dollar figures are calculated based on the observed exchange rate as of October 2nd, 2017 (637,93 CLP/US$).
(Million of USD) Dec 16 Sep 17 (Million of USD) Dec 16 Sep 17
Cash & cash equivalents 316 328 Other current financial liabilities 1.681 1.717
Current trade & other receivables 2.819 2.742 Current trade & other payables 1.642 1.388
Inventories 1.892 1.943 Others 528 455
Others 330 387
Total Non-Banking Current Assets 5.357 5.400 Total Non-Banking Current Liabilities 3.851 3.560
Non-Current trade & other receivables 377 381 Other non-current financial liabilities 4.218 4.340
Goodwill 814 806 Others 1.016 1.034
PP&E & Investment properties 8.344 8.553
Others 1.031 1.100
Total Non-Banking Non-Current Assets 10.567 10.840 Total Non-Banking Non-Current Liab. 5.234 5.374
Total Non-Banking Operations Assets 15.924 16.239 Total Non-Banking Oper. Liabilities 9.085 8.934
Loans & accounts receivable from clients 4.110 3.966 Total Banking Oper. Liabilities 4.855 4.793
Others 1.821 1.887 TOTAL LIABILITIES 13.940 13.727
Total Banking Operations Assets 5.930 5.853 Shareholders' Equity 7.914 8.366
TOTAL ASSETS 21.854 22.093 TOTAL EQUITY & LIABILITIES 21.854 22.093

Debt Profile (US$ million) w/o Banking Operations
Net Financial Debt/Ebitda (times)w/o Banking Operations
19Note: All dollar figures are calculated based on the observed exchange rate as of October 2nd, 2017 (637,93 CLP/US$).
1. Does not include accrued interests
Leverage (times)w/o Banking Operations
Debt By Typew/o Banking Operations
Debt By Maturity w/o Banking Operations
Financial Situation
Financial Debt w/o Banks1:
US$ 5,856 MM
Duration:
4.27 years
3,24 3,40 3,36
sep-16 dec 16 sep-17
1.052829
520 422277
2.755
2017 2018 2019 2020 2021 2022+
49% 51%
Public Bonds
31%
69%
Short Term Long Term
1,021,14 1,07
sep-16 dic 16 sep-17
CORPORATE STRUCTURE

21
465,000
Corporate Structure
SACI Falabella
Chile Peru1 Argentina Colombia
99.8%
Brazil Uruguay
Sodimac 100%
Imperial 60%
Tottus 88%
CMR 100%
Banco Falab.100%
Rentas Falabella
(Open Plaza) 100%
Mall Plaza 59.3%
Falabella 100% Saga Falab. 98.0%
Sodimac 100%
Tottus 100%
Banco Falab.100%
Open Plaza 100%
Falabella 100%
Sodimac 100%
CMR 100%
Falabella 65%
Banco Falab. 65%
Sodimac 49% 3
Maestro 100%
Sodimac 100%Construdecor
Nuevos Desarrollos
77.5%
Mall Plaza Peru 66.7% 2
33.3%
60%
1 Through Falabella Perú S.A.A.
2 New company created following the dissolution of Aventura Plaza JV.
3 Unconsolidated subsidiary
Mall Plaza
100%
BUSINESS UNIT OVERVIEW

23Note: All dollar figures are calculated based on the observed exchange rate as of October 2nd, 2017 (637,93 CLP/US$). Number of stores as of September 2017.1. Sales LTM divided by average m2.
Revenues(US$ million, September 2017 LTM)
Regional Footprint
Department Stores
• Main categories: apparel, home electronics and home accessories /
furniture.
• Diverse portfolio of private brands and exclusive international brands.
• Leading online retailer, with click & collect implemented in all four
countries.
• Operates specialty stores for exclusive and second generation
apparel and footwear brands.
Chile 45 stores
Peru 29 stores
Colombia 26 stores
Argentina 11 stores
TOTAL 111
Total: 4,381
Sales /m2 1
(US$, September 2017 LTM)
2,388
923582 488
Chile Peru Colombia Argentina
7,677
5,2873,552
8,447
Business Overview

4,291
2,525
3,3903,069
1,872
Chile Peru Colombia Argentina Brazil
3,094
9341,201
264 290
Chile Colombia Brazil
24
Revenues(US$ million, September 2017 LTM)
Regional Footprint
Business Overview
Home Improvement
• Main categories: lumber & building materials, hardware, appliances, bath
& kitchen, home accessories, furniture, outdoor & garden, lighting.
• Formats: Sodimac Homecenter, Sodimac Constructor, Sodimac
Homecenter /Constructor, Imperial, Homy, Dicico and Maestro.
• Expertise in selling directly to construction sector players and large
companies, as well as DIY customers and families.
• Strong online sales strategy, click & collect.
Chile 87 stores
Peru 56 stores
Colombia 38 stores
Argentina 8 stores
Brazil 56 stores
Uruguay 3 stores
TOTAL 248
Total: 5,783
Sales /m2 1
(US$, September 2017 LTM)
Note: All dollar figures are calculated based on the observed exchange rate as of October 2nd, 2017 (637,93 CLP/US$). Number of stores as of September 2017.
1. Does not include revenue from Sodimac Uruguay 2. Sales LTM divided by average m2.

Sales /m2 1
(US$, September 2017 LTM)
5,472 5,045
Chile Peru
1,1401,086
Chile Peru
Revenues(US$ million, September 2017 LTM)
Business Overview
25
Regional Footprint
Supermarkets
• Formats: hypermarkets, supermarkets and Hiperbodega Precio
Uno in Peru.
• Started operations in 2002 in Peru under Tottus brand and
entered Chilean market in 2004 with the acquisition of San
Francisco, which was later rebranded as Tottus.
• Increased penetration of private labels (Tottus and Precio Uno).
• E-commerce platform.
Chile 63 stores
Peru 61 stores
TOTAL 124
Total: 2,226
Note: All dollar figures are calculated based on the observed exchange rate as of October 2nd, 2017 637,93 CLP/US$. Number of stores as of September 2017.
1. Sales LTM divided by average m2. Sales area considered for Tottus does not include the check out area in order to be comparable with peer’s sales area.

4.962
1.076 668
261
26
Gross Loan Portfolio(US$ million, September 2017)
Regional Footprint
Business Overview
Financial Services
• Falabella Financiero offers a wide range of integrated financial products
and services.
• Provides customers access to credit, combining the traditional financial
business with the proximity to customers through retail formats.
• Five business units: CMR Falabella (credit card), Banco Falabella (bank),
Seguros Falabella (insurance broker), Viajes Falabella (travel agency)
and Movil Falabella (mobile virtual operator).
• Operates in Chile, Peru, Colombia and Argentina.
Chile 2.4 m CMR ccounts98 bank branches
Peru 1.0 m CMR accounts
78 bank branches
Colombia 1.0 m CMR accounts70 bank branches
Argentina 0.5 m CMR accounts
18 bank branches
Note: All dollar figures are calculated based on the observed exchange rate as of October 2nd, 2017 (637,93 CLP/US$).
1. Per local regulation (not comparable across countries).
Total: 6,966
Loan Loss Provision 1% September 2017
4,6%
11,5%
8,1%
2,4%

27
Integrated Offering 2
Regional Footprint
Business Overview
Real Estate
• Largest operator in Chile and one of the leaders
in Latin America:
• Mallplaza: Operates large shopping malls in Chile,
Peru and Colombia.
• Open Plaza: Operates small shopping centers with
2 or 3 anchor stores, as well as other stores.
+2,761specialty
stores
10public
libraries
+404restaurants
13educational
institutions
38game
areas
134cinema
screens
17gyms
3exhibition
rooms
18medical
centers
Sep-16 Sep-17 Sep-16 Sep-17
Mall Plaza 15 16 1,213 1,328
Open Plaza 10 10 228 229
CHILE 25 26 1,441 1,557
AP/Mall Plaza Peru1 2 3 159 199
Open Plaza 10 11 273 315
PERU 12 14 432 514
Mall Plaza 1 1 26 27
COLOMBIA 1 1 26 27
TOTAL Real State 38 41 1,899 2,098
Free Standing Stores 1,021 982
Total GLA 2,920 3,080
# Shopping Malls '000 GLA
Owned by the company throughout the region.
Information for Mallplaza shopping centers as of September 2017 .

28
Contact Information
Constanza Saver
IR Analyst
www.falabella.com/inversionistas
Phone: +56 (2) 2487-3910
Andrea Jiménez
IR Analyst
Andrea González Bayón
Head of IR

29
Disclaimer
This presentation contains forward-looking statements, including statements regarding the intent,
belief or current expectations of S.A.C.I. Falabella and its management. Investors are cautioned
that any such forward-looking statements are not guarantee of future performance and involve
a number of risks and uncertainties including, but not limited to, the risks detailed in the S.A.C.I.
Falabella’s financial statements, and the fact that actual results could differ materially from those
indicated by such forward-looking statements.

![index [] · comp. 41 index p 02—09 comp. 23 p 10—15 comp. 24 p 16—21 comp. 25 p 22—29 comp. 26 p 30—35 comp. 27 p 36—41 ... Свет подчеркивает структуру](https://img.pdfslide.net/doc/110x75/5f3c529d6f430b30851577ee/index-comp-41-index-p-02a09-comp-23-p-10a15-comp-24-p-16a21-comp-25.jpg)


![index []...p 104—109 comp. 190 p 110—115 comp. 191 p 116—121 comp. 192 p 122—127 comp. 193 p 128—133 comp. 194 p 134—139 comp. 195 p 140—147 comp. 196 p 148—153 comp](https://img.pdfslide.net/doc/110x75/5f95526362174b59db2f2d15/index-p-104a109-comp-190-p-110a115-comp-191-p-116a121-comp-192.jpg)


![Interchangeable Lens Digital Camera ILCE-6500 α6500 · Interchangeable Lens Digital Camera ILCE-6500 α6500 ... Lens Comp.: Shading Comp. [125] Lens Comp.: Chro. Aber. Comp.](https://img.pdfslide.net/doc/110x75/5b4f820b7f8b9a206e8c940f/interchangeable-lens-digital-camera-ilce-6500-6500-interchangeable-lens-digital.jpg)


![index [] · index p 02—09 comp. 175 p 10—19 comp. 176 p 20—25 comp. 177 p 26—31 comp. 178 p 32—37 comp. 179 p 38—43 comp. 180 p 44—49 comp. 181 p 50—55 comp. 182 p](https://img.pdfslide.net/doc/110x75/5c66627e09d3f252168c4378/index-index-p-0209-comp-175-p-1019-comp-176-p-2025-comp-177.jpg)