Embed Size (px)
Citation preview
Presentation of the Norsk Gjenvinning Group Fredrikstad/Øra Miljøpark, September 10, 2015
Disclaimer VV Holding AS is providing the following presentation at its Investor Day in Fredrikstad on September 10th 2015. This presentation is for information purposes only and does not constitute an offer to sell or the solicitation of an offer to buy the company’s Senior Secured Floating Rate Notes due 2019 or any other security. This presentation includes forward-looking statements which are based on our current expectations and projections about future events. All statements other than statements of historical facts included in this notice, including statements regarding our future financial position, risks and uncertainties related to our business, strategy, capital expenditures, projected costs and our plans and objectives for future operations, including our plans for future costs savings and synergies may be deemed to be forward-looking statements. Words such as “believe,” “expect,” “anticipate,” “may,” “assume,” “plan,” “intend,” “will,” “should,” “estimate,” “risk” and similar expressions or the negatives of these expressions are intended to identify forward-looking statements. By their nature, forward-looking statements involve known and unknown risks and uncertainties because they relate to events and depend on circumstances that may or may not occur in the future. Forward-looking statements are not guarantees of future performance. You should not place undue reliance on these forward-looking statements. In addition any forward-looking statements are made only as of the date of this presentation, and we do not intend and do not assume any obligation to update any statements set forth in this presentation. VV Holding AS is a wholly owned subsidiary of POS Holding AS (and is part of the Norsk Gjenvinning-group). The consolidated financial statements of VV Holding AS have been prepared in accordance with International Financial Reporting Standards (IFRS) and IFRS Interpretations Committee (IFRS IC) interpretations applicable to companies reporting under IFRS. For the submitted consolidated financial statements there are no differences between IFRS as adopted by the EU and the IASB. The consolidated financial statements have been prepared under the historical cost convention, as modified by financial assets and financial liabilities (including derivative instruments) at fair value through profit or loss. The preparation of financial statements in conformity with IFRS requires the use of certain critical accounting estimates. It also requires management to exercise its judgement in the process of applying the group’s accounting policies. The areas involving a higher degree of judgement or complexity, or areas where assumptions and estimates are significant to the consolidated financial statements are disclosed in note 3 of VV Holding’s annual report for 2014. The consolidated financial statements have been prepared on a going-concern basis. The consolidated financial statements for 2011 and 2012 have not been audited or subject to a review by the auditors. The interim consolidated financial statements in this report, wherever shown, have been prepared in accordance with IAS 34 Interim Financial Reporting. The interim condensed consolidated financial statements do not include all the information and disclosures required for full annual financial statements and should be read in conjunction with the Annual Reports 2014. The condensed consolidated interim financial statements have not been audited or subject to a review by the auditors. Accounting principles applied in the preparation of these condensed consolidated interim financial statements for the period ended June 30, 2015, are consistent with those applied in the annual consolidated financial statements for 2014. The presentation also includes adjusted EBITDA figures. Adjusted EBITDA figures, when shown, are clearly specified, and represent EBITDA as adjusted for certain non-recurring and/or non-cash costs. Adjusted EBITDA is presented because it may be a relevant measure for assessing underlying performance for a given period. This measure is not a defined financial indicator under IFRS. The adjustments reconciling EBITDA and adjusted EBITDA, shown in the appendix of this presentation, represent an illustration of how underlying operational EBITDA has been affected by, what the company perceives to be one-time items.
2

Presentation agenda
3
Overview of the Norsk Gjenvinning Group (Erik Osmundsen, CEO)
2nd Quarter 2015 results (Dean Zuzic, CFO)
Presentation of key operating divisions (Divisional Directors)
The leading waste management
company in Norway
4
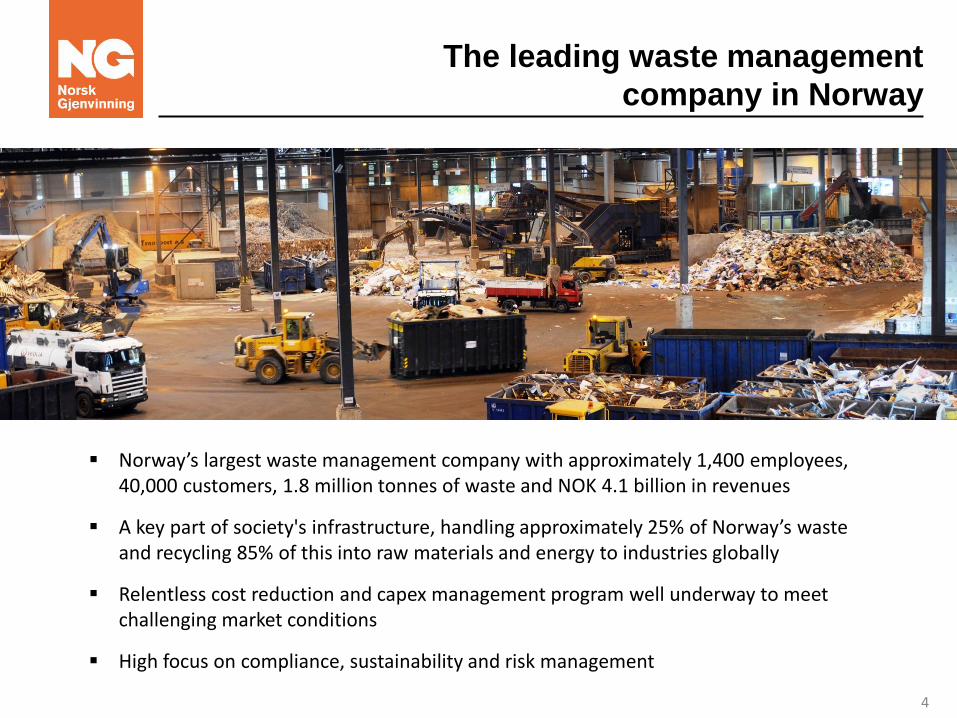
Norway’s largest waste management company with approximately 1,400 employees, 40,000 customers, 1.8 million tonnes of waste and NOK 4.1 billion in revenues
A key part of society's infrastructure, handling approximately 25% of Norway’s waste and recycling 85% of this into raw materials and energy to industries globally
Relentless cost reduction and capex management program well underway to meet challenging market conditions
High focus on compliance, sustainability and risk management
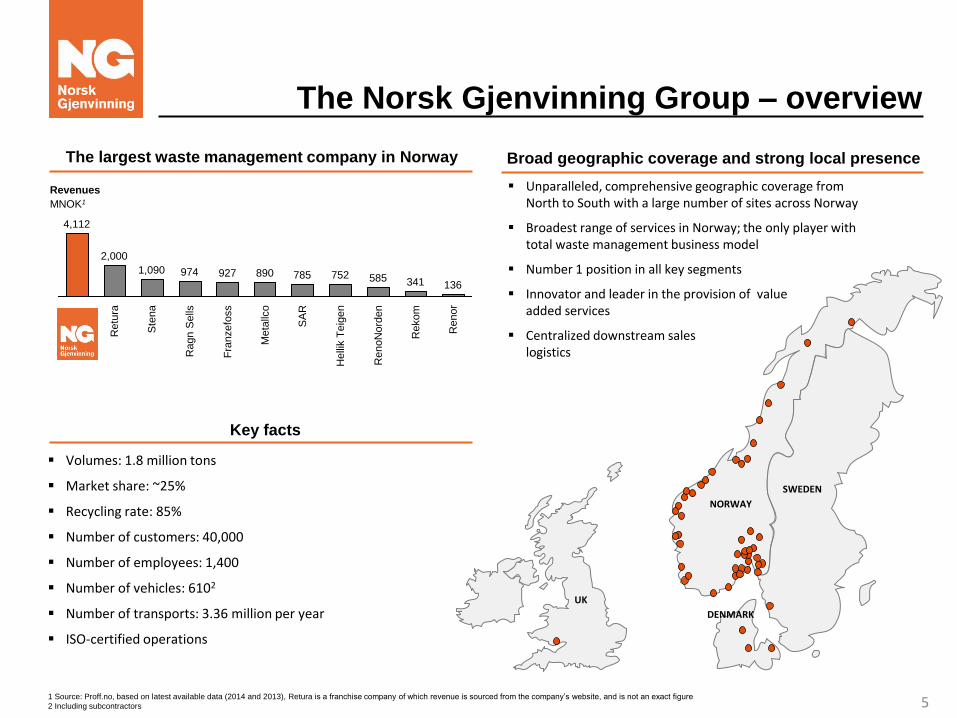
1 Source: Proff.no, based on latest available data (2014 and 2013), Retura is a franchise company of which revenue is sourced from the company’s website, and is not an exact figure
2 Including subcontractors
The Norsk Gjenvinning Group – overview
Unparalleled, comprehensive geographic coverage from North to South with a large number of sites across Norway
Broadest range of services in Norway; the only player with total waste management business model
Number 1 position in all key segments
Innovator and leader in the provision of value added services
Centralized downstream sales and logistics
Broad geographic coverage and strong local presence
5
UK
585 890
2,000
4,112
Helli
k T
eig
en
752
SA
R
785 M
eta
llco
Fra
nzefo
ss
927
Ragn S
ells
974
Ste
na
Retu
ra
1,090
Rekom
Renor
136 341
RenoN
ord
en
Revenues
MNOK1
The largest waste management company in Norway
Key facts
Volumes: 1.8 million tons
Market share: ~25%
Recycling rate: 85%
Number of customers: 40,000
Number of employees: 1,400
Number of vehicles: 6102
Number of transports: 3.36 million per year
ISO-certified operations
SWEDEN
NORWAY
DENMARK
Key business areas
6
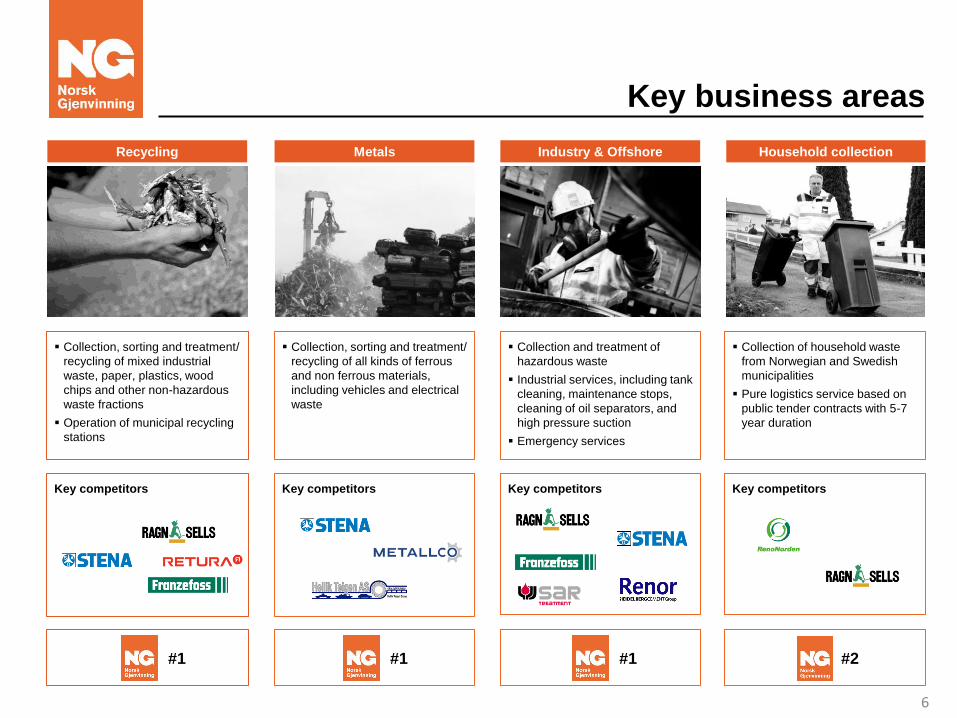
Recycling Metals Industry & Offshore Household collection
Collection, sorting and treatment/
recycling of mixed industrial
waste, paper, plastics, wood
chips and other non-hazardous
waste fractions
Operation of municipal recycling
stations
Collection, sorting and treatment/
recycling of all kinds of ferrous
and non ferrous materials,
including vehicles and electrical
waste
Collection and treatment of
hazardous waste
Industrial services, including tank
cleaning, maintenance stops,
cleaning of oil separators, and
high pressure suction
Emergency services
Collection of household waste
from Norwegian and Swedish
municipalities
Pure logistics service based on
public tender contracts with 5-7
year duration
Key competitors Key competitors Key competitors Key competitors
#1 #1 #1 #2
Overview of financials – key business areas
7
Industry & Offshore
Household collection
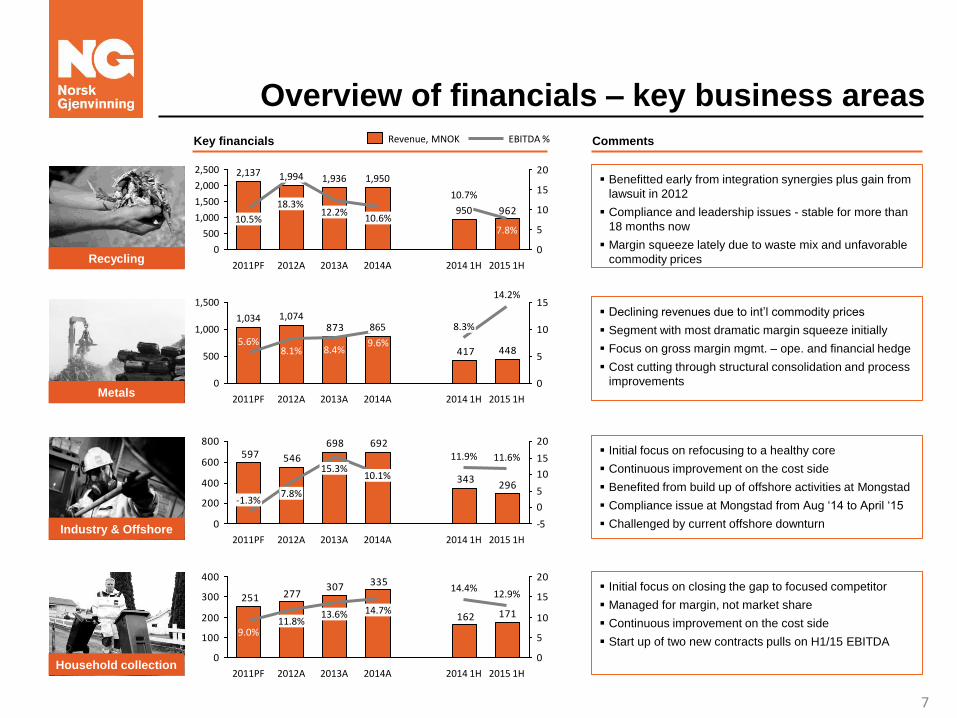
Key financials EBITDA % Revenue, MNOK Comments
Initial focus on refocusing to a healthy core
Continuous improvement on the cost side
Benefited from build up of offshore activities at Mongstad
Compliance issue at Mongstad from Aug ‘14 to April ‘15
Challenged by current offshore downturn
Initial focus on closing the gap to focused competitor
Managed for margin, not market share
Continuous improvement on the cost side
Start up of two new contracts pulls on H1/15 EBITDA
962
0
5
10
15
20
2,000
1,500
500
0
2,500
1,000
2015 1H
7.8%
2014 1H
950
10.7%
2014A
1,950
10.6%
2013A
1,936
12.2%
2012A
1,994
18.3%
2011PF
2,137
10.5%
Benefitted early from integration synergies plus gain from
lawsuit in 2012
Compliance and leadership issues - stable for more than
18 months now
Margin squeeze lately due to waste mix and unfavorable
commodity prices Recycling
448417
873
0
5
10
15
500
1,000
1,500
0
2014 1H
865
2014A
14.2%
8.3%
2015 1H
5.6% 8.1%
2013A
1,074
2012A 2011PF
8.4% 9.6%
1,034
Metals
Declining revenues due to int’l commodity prices
Segment with most dramatic margin squeeze initially
Focus on gross margin mgmt. – ope. and financial hedge
Cost cutting through structural consolidation and process
improvements
296343
692698
546597
0
200
400
600
800
-5
0
5
10
15
20
2015 1H
11.6%
2014 1H
11.9%
2014A
10.1%
2013A
15.3%
2012A
7.8%
2011PF
-1.3%
171162
335307277251
0
100
200
300
400
0
5
10
15
20
2015 1H
12.9%
2014 1H
14.4%
2014A
14.7%
2013A
13.6%
2012A
11.8%
2011PF
9.0%
Overview of financials – group total adjusted*
8
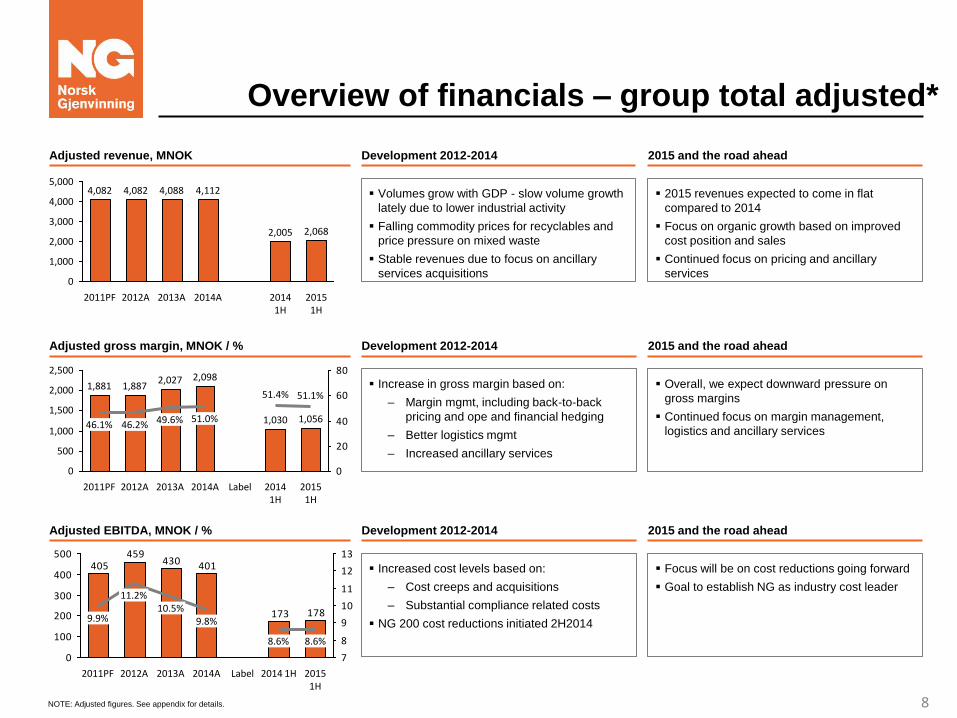
Adjusted revenue, MNOK
5,000
4,000
3,000
1,000
2,000
0
2013A
4,082
2014A 2014 1H
2,068
4,112
2012A 2015 1H
4,088
2,005
4,082
2011PF
Development 2012-2014
Volumes grow with GDP - slow volume growth
lately due to lower industrial activity
Falling commodity prices for recyclables and
price pressure on mixed waste
Stable revenues due to focus on ancillary
services acquisitions
2015 and the road ahead
2015 revenues expected to come in flat
compared to 2014
Focus on organic growth based on improved
cost position and sales
Continued focus on pricing and ancillary
services
Adjusted gross margin, MNOK / % Development 2012-2014
Increase in gross margin based on:
‒ Margin mgmt, including back-to-back
pricing and ope and financial hedging
‒ Better logistics mgmt
‒ Increased ancillary services
2015 and the road ahead
Overall, we expect downward pressure on
gross margins
Continued focus on margin management,
logistics and ancillary services
Adjusted EBITDA, MNOK / % Development 2012-2014
Increased cost levels based on:
‒ Cost creeps and acquisitions
‒ Substantial compliance related costs
NG 200 cost reductions initiated 2H2014
2015 and the road ahead
Focus will be on cost reductions going forward
Goal to establish NG as industry cost leader
0
20
40
60
80
2,000
1,500
500
2,500
0
1,000
51.1% 1,887
2,027
1,056 46.2%
2,098
46.1% 49.6% 1,030
51.4%
51.0%
1,881
2011PF 2014A 2015 1H
2014 1H
Label 2013A 2012A
178173
401430459
405
0
100
200
300
400
500
7
8
9
10
11
12
13
2014 1H
9.8%
Label 2013A
8.6%
2012A 2015 1H
8.6%
2014A
10.5% 11.2%
9.9%
2011PF
NOTE: Adjusted figures. See appendix for details.
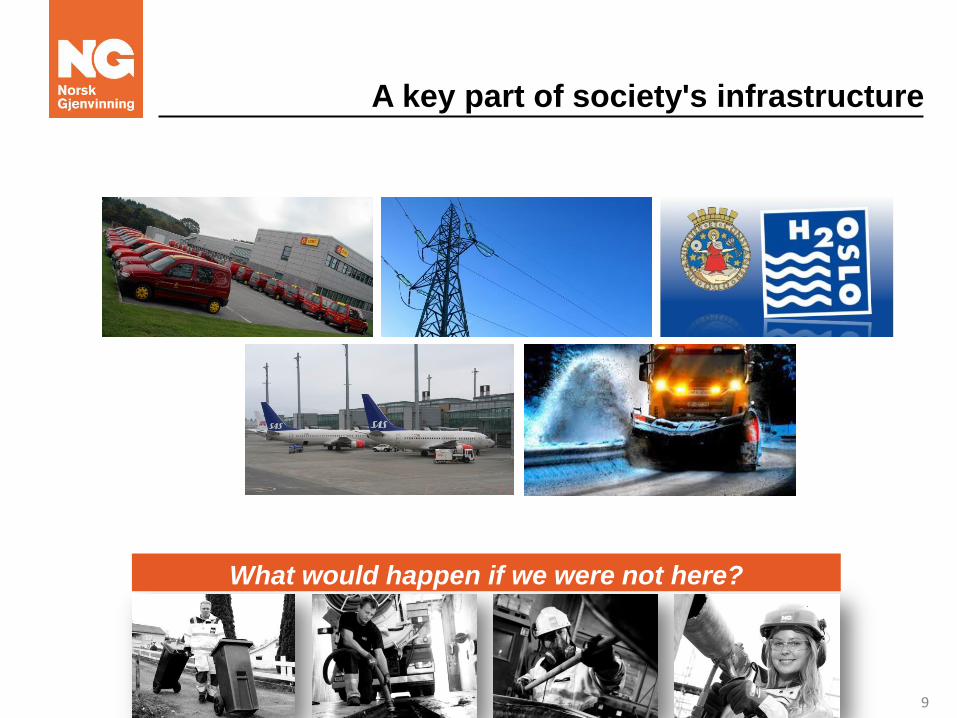
A key part of society's infrastructure
9
What would happen if we were not here?
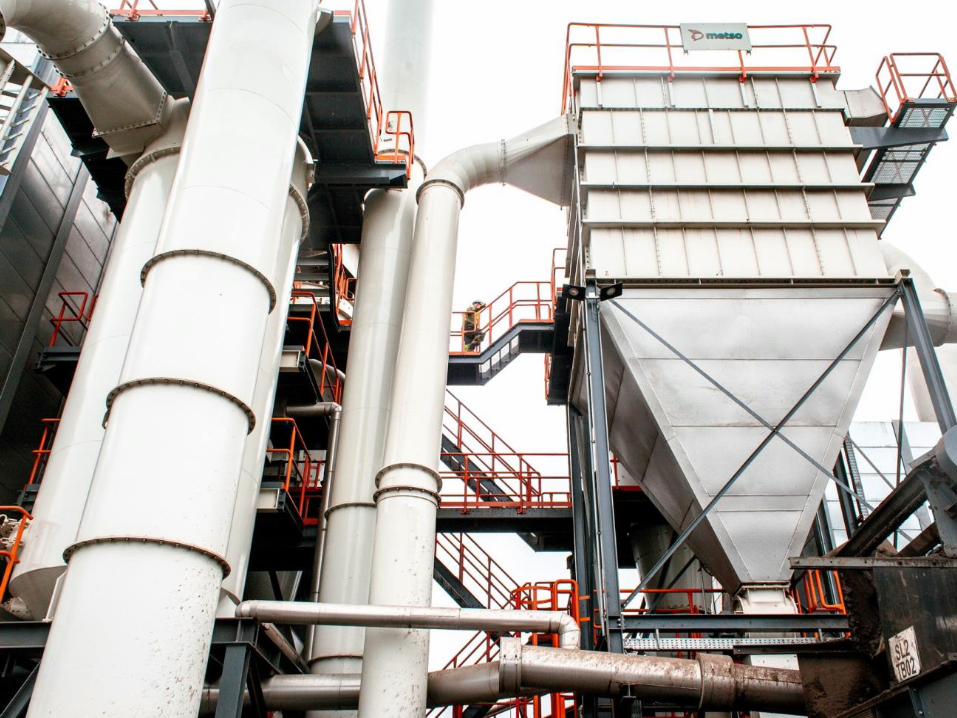
A key part of society's infrastructure
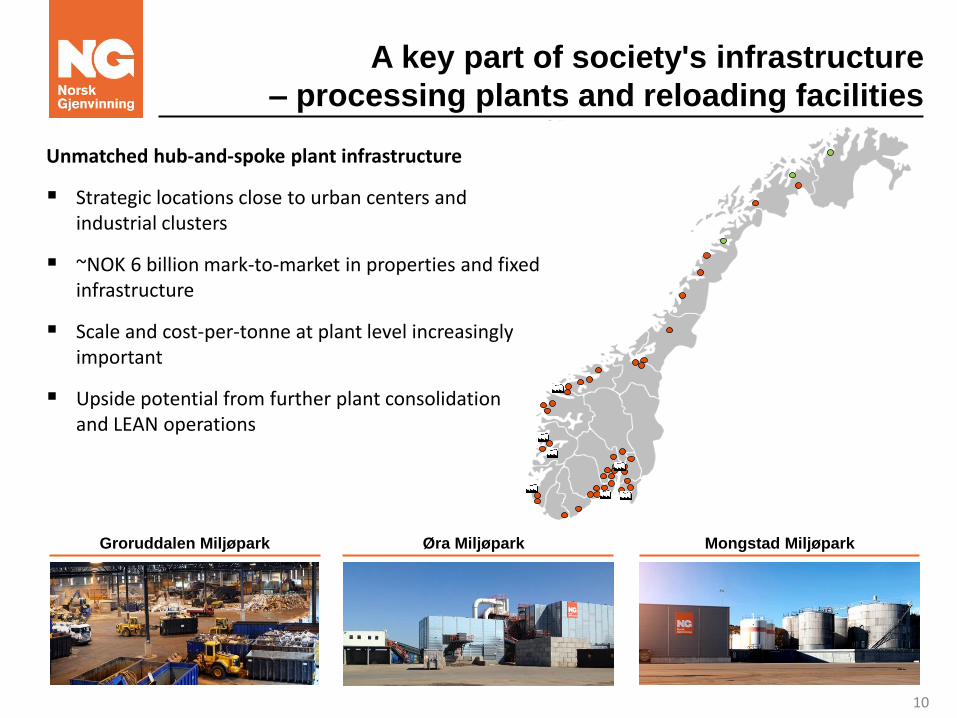
– processing plants and reloading facilities
10
Unmatched hub-and-spoke plant infrastructure
Strategic locations close to urban centers and industrial clusters
~NOK 6 billion mark-to-market in properties and fixed infrastructure
Scale and cost-per-tonne at plant level increasingly important
Upside potential from further plant consolidation and LEAN operations
Øra Miljøpark Groruddalen Miljøpark Mongstad Miljøpark
A key part of society's infrastructure
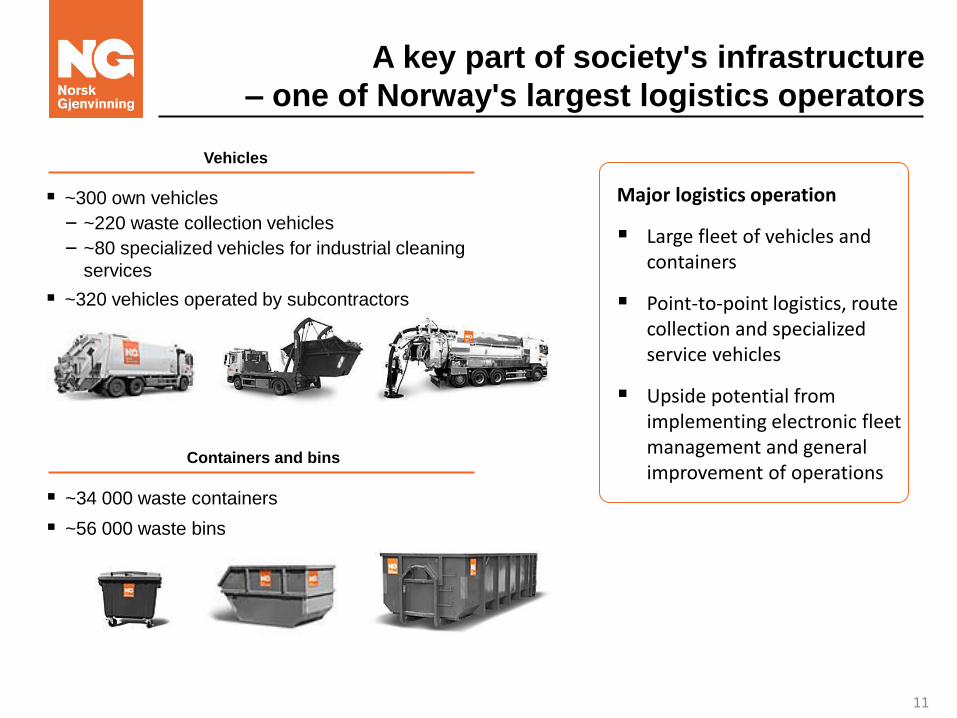
– one of Norway's largest logistics operators
11
~300 own vehicles
‒ ~220 waste collection vehicles
‒ ~80 specialized vehicles for industrial cleaning
services
~320 vehicles operated by subcontractors
Containers and bins
~34 000 waste containers
~56 000 waste bins
Vehicles
Major logistics operation
Large fleet of vehicles and containers
Point-to-point logistics, route collection and specialized service vehicles
Upside potential from implementing electronic fleet management and general improvement of operations
A key part of society's infrastructure
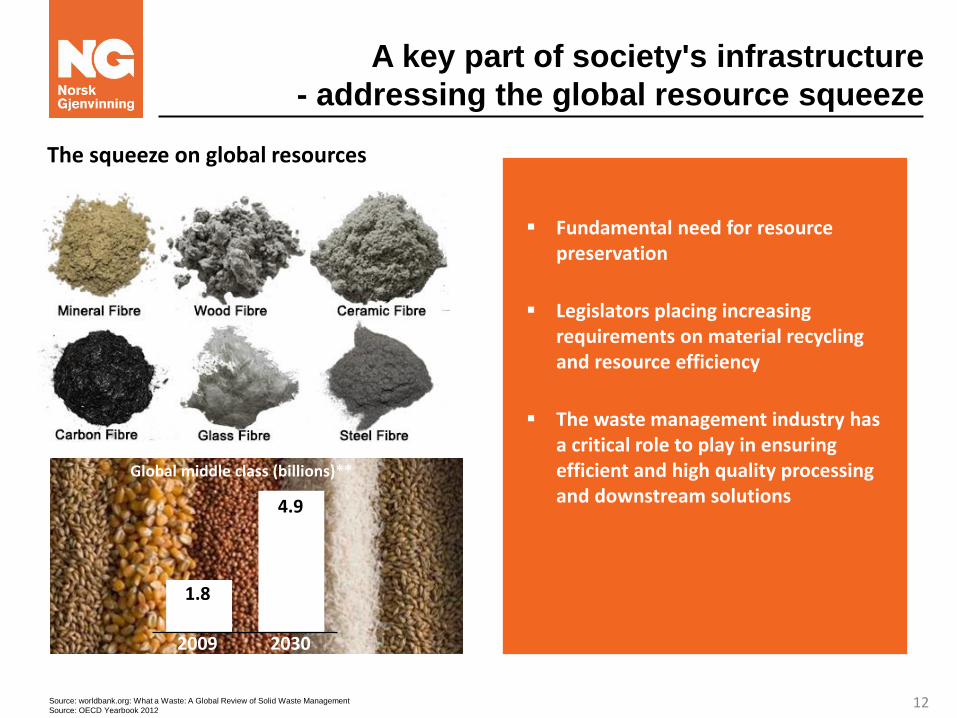
- addressing the global resource squeeze
12 Source: worldbank.org: What a Waste: A Global Review of Solid Waste Management
Source: OECD Yearbook 2012
The squeeze on global resources
2009 2030
1.8
4.9
Global middle class (billions)**
Fundamental need for resource preservation
Legislators placing increasing requirements on material recycling and resource efficiency
The waste management industry has a critical role to play in ensuring efficient and high quality processing and downstream solutions
An industrialized and professional value chain is
a key success factor going forward
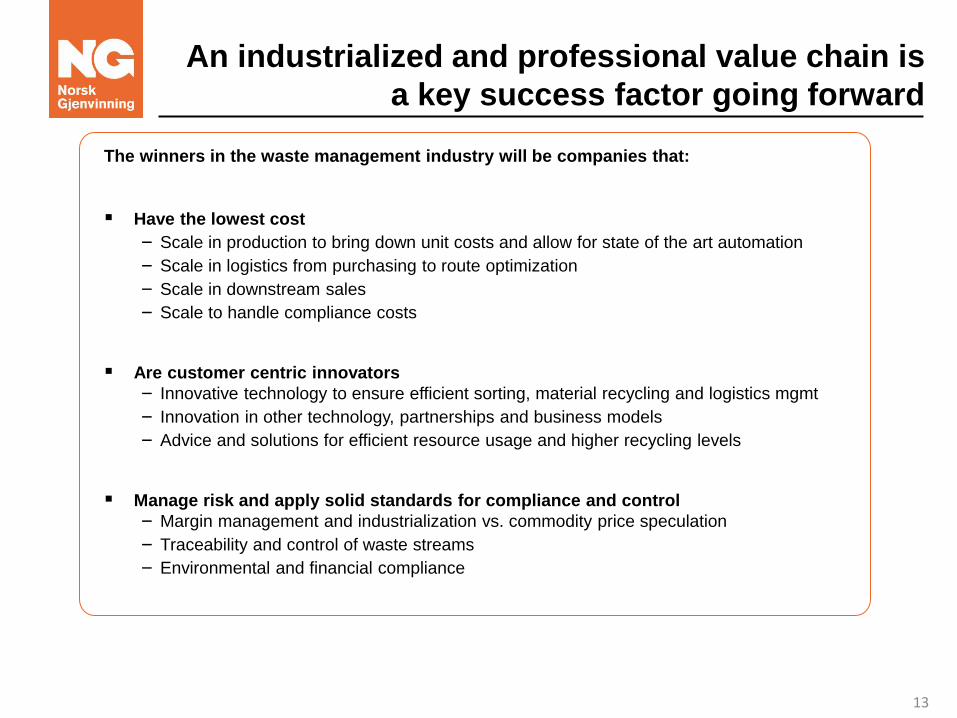
The winners in the waste management industry will be companies that:
Have the lowest cost
‒ Scale in production to bring down unit costs and allow for state of the art automation
‒ Scale in logistics from purchasing to route optimization
‒ Scale in downstream sales
‒ Scale to handle compliance costs
Are customer centric innovators
‒ Innovative technology to ensure efficient sorting, material recycling and logistics mgmt
‒ Innovation in other technology, partnerships and business models
‒ Advice and solutions for efficient resource usage and higher recycling levels
Manage risk and apply solid standards for compliance and control
‒ Margin management and industrialization vs. commodity price speculation
‒ Traceability and control of waste streams
‒ Environmental and financial compliance
13
Cost reduction program NG200
14
50
50
60
200
360
Net cost reduction by 2017
3% cost creep 2015
3% cost creep 2016
Imple- mentation
risk buffer
Total cost saving
initiatives
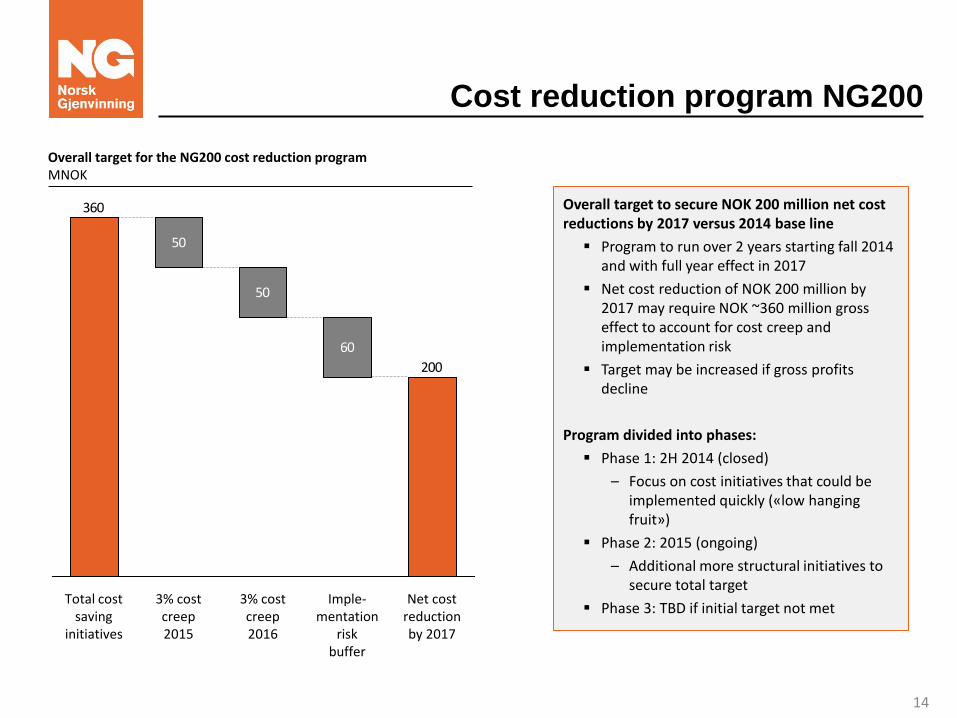
Overall target to secure NOK 200 million net cost reductions by 2017 versus 2014 base line
Program to run over 2 years starting fall 2014 and with full year effect in 2017
Net cost reduction of NOK 200 million by 2017 may require NOK ~360 million gross effect to account for cost creep and implementation risk
Target may be increased if gross profits decline
Program divided into phases:
Phase 1: 2H 2014 (closed)
– Focus on cost initiatives that could be implemented quickly («low hanging fruit»)
Phase 2: 2015 (ongoing)
– Additional more structural initiatives to secure total target
Phase 3: TBD if initial target not met
Overall target for the NG200 cost reduction program MNOK
Status NG200
15
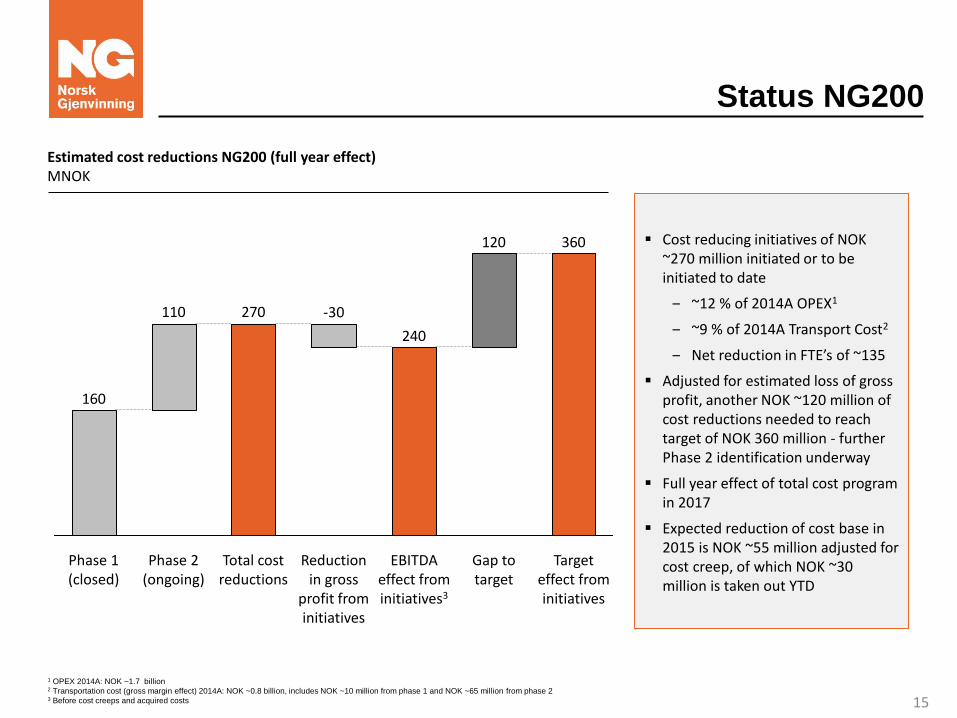
Estimated cost reductions NG200 (full year effect) MNOK
360120
240
270110
160
Target effect from initiatives
EBITDA effect from initiatives3
Reduction in gross
profit from initiatives
Phase 2 (ongoing)
-30
Total cost reductions
Phase 1 (closed)
Gap to target
Cost reducing initiatives of NOK ~270 million initiated or to be initiated to date
‒ ~12 % of 2014A OPEX1
‒ ~9 % of 2014A Transport Cost2
‒ Net reduction in FTE’s of ~135
Adjusted for estimated loss of gross profit, another NOK ~120 million of cost reductions needed to reach target of NOK 360 million - further Phase 2 identification underway
Full year effect of total cost program in 2017
Expected reduction of cost base in 2015 is NOK ~55 million adjusted for cost creep, of which NOK ~30 million is taken out YTD
1 OPEX 2014A: NOK ~1.7 billion 2 Transportation cost (gross margin effect) 2014A: NOK ~0.8 billion, includes NOK ~10 million from phase 1 and NOK ~65 million from phase 2 3 Before cost creeps and acquired costs
Integrated focus on risk management
16
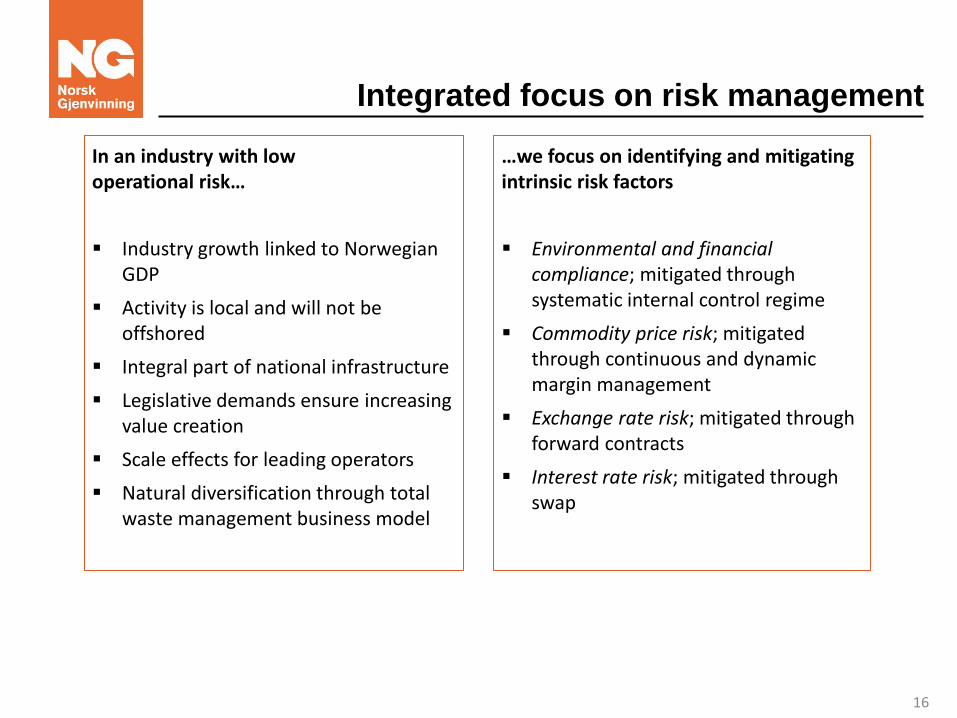
In an industry with low operational risk…
Industry growth linked to Norwegian GDP
Activity is local and will not be offshored
Integral part of national infrastructure
Legislative demands ensure increasing value creation
Scale effects for leading operators
Natural diversification through total waste management business model
…we focus on identifying and mitigating intrinsic risk factors
Environmental and financial compliance; mitigated through systematic internal control regime
Commodity price risk; mitigated through continuous and dynamic margin management
Exchange rate risk; mitigated through forward contracts
Interest rate risk; mitigated through swap
Presentation agenda
17
Overview of the Norsk Gjenvinning Group (Erik Osmundsen, CEO)
2nd Quarter 2015 results (Dean Zuzic, CFO)
Presentation of key operating divisions (Divisional Directors)
Q2 2015
0.9% increase in waste volumes
Operating revenue NOK 1,068.7 million, +2.9% yoy
Increase in gross margins by 1.1 percentage points compared to Q2 2014
EBITDA NOK 109.7 million, up NOK 30 million compared to Q2 2014; up NOK 19.6 million adjusted
NG200 cost initiatives being implemented according to plan
18
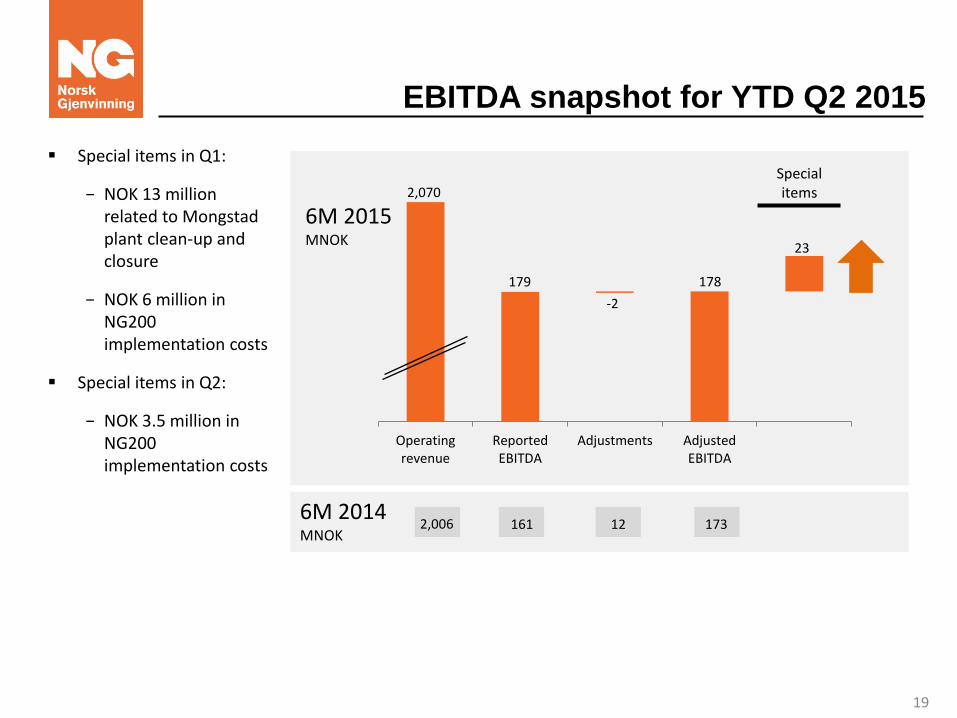
EBITDA snapshot for YTD Q2 2015
Operatingrevenue
ReportedEBITDA
Adjustments AdjustedEBITDA
6M 2015 MNOK
2,070
179 178
6M 2014 MNOK
2,006 161 12 173
Special items in Q1:
− NOK 13 million related to Mongstad plant clean-up and closure
− NOK 6 million in NG200 implementation costs
Special items in Q2:
− NOK 3.5 million in NG200 implementation costs
23
Special items
-2
19
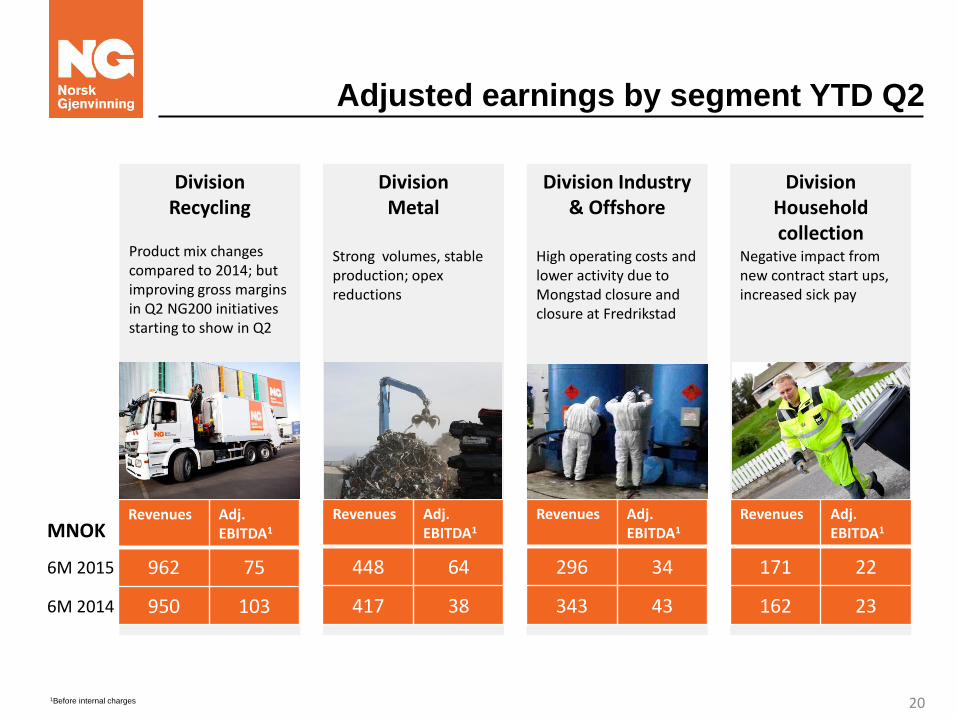
Adjusted earnings by segment YTD Q2
MNOK
6M 2015
6M 2014
Division Recycling
Division Metal
Division Industry & Offshore
Division Household collection
Revenues Adj. EBITDA1
962 75
950 103
Revenues Adj. EBITDA1
448 64
417 38
Revenues Adj. EBITDA1
296 34
343 43
Revenues Adj. EBITDA1
171 22
162 23
1Before internal charges
Product mix changes compared to 2014; but improving gross margins in Q2 NG200 initiatives starting to show in Q2
Strong volumes, stable production; opex reductions
High operating costs and lower activity due to Mongstad closure and closure at Fredrikstad
Negative impact from new contract start ups, increased sick pay
20
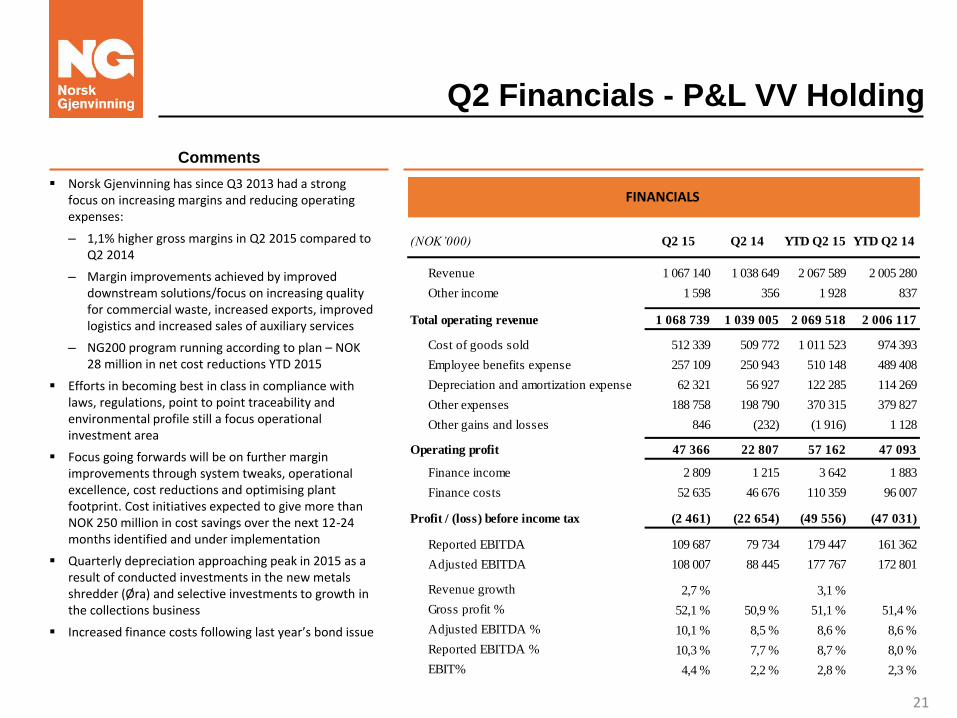
Q2 Financials - P&L VV Holding
Norsk Gjenvinning has since Q3 2013 had a strong focus on increasing margins and reducing operating expenses:
– 1,1% higher gross margins in Q2 2015 compared to Q2 2014
– Margin improvements achieved by improved downstream solutions/focus on increasing quality for commercial waste, increased exports, improved logistics and increased sales of auxiliary services
– NG200 program running according to plan – NOK 28 million in net cost reductions YTD 2015
Efforts in becoming best in class in compliance with laws, regulations, point to point traceability and environmental profile still a focus operational investment area
Focus going forwards will be on further margin improvements through system tweaks, operational excellence, cost reductions and optimising plant footprint. Cost initiatives expected to give more than NOK 250 million in cost savings over the next 12-24 months identified and under implementation
Quarterly depreciation approaching peak in 2015 as a result of conducted investments in the new metals shredder (Øra) and selective investments to growth in the collections business
Increased finance costs following last year’s bond issue
Comments
21
(NOK’000) Q2 15 Q2 14 YTD Q2 15 YTD Q2 14
Revenue 1 067 140 1 038 649 2 067 589 2 005 280
Other income 1 598 356 1 928 837
Total operating revenue 1 068 739 1 039 005 2 069 518 2 006 117
Cost of goods sold 512 339 509 772 1 011 523 974 393
Employee benefits expense 257 109 250 943 510 148 489 408
Depreciation and amortization expense 62 321 56 927 122 285 114 269
Other expenses 188 758 198 790 370 315 379 827
Other gains and losses 846 (232) (1 916) 1 128
Operating profit 47 366 22 807 57 162 47 093 -
Finance income 2 809 1 215 3 642 1 883
Finance costs 52 635 46 676 110 359 96 007
Profit / (loss) before income tax (2 461) (22 654) (49 556) (47 031)
Reported EBITDA 109 687 79 734 179 447 161 362
Adjusted EBITDA 108 007 88 445 177 767 172 801
Revenue growth 2,7 % 3,1 %
Gross profit % 52,1 % 50,9 % 51,1 % 51,4 %
Adjusted EBITDA % 10,1 % 8,5 % 8,6 % 8,6 %
Reported EBITDA % 10,3 % 7,7 % 8,7 % 8,0 %
EBIT% 4,4 % 2,2 % 2,8 % 2,3 %
FINANCIALS
Q2 Financials – Balance sheet VV Holding
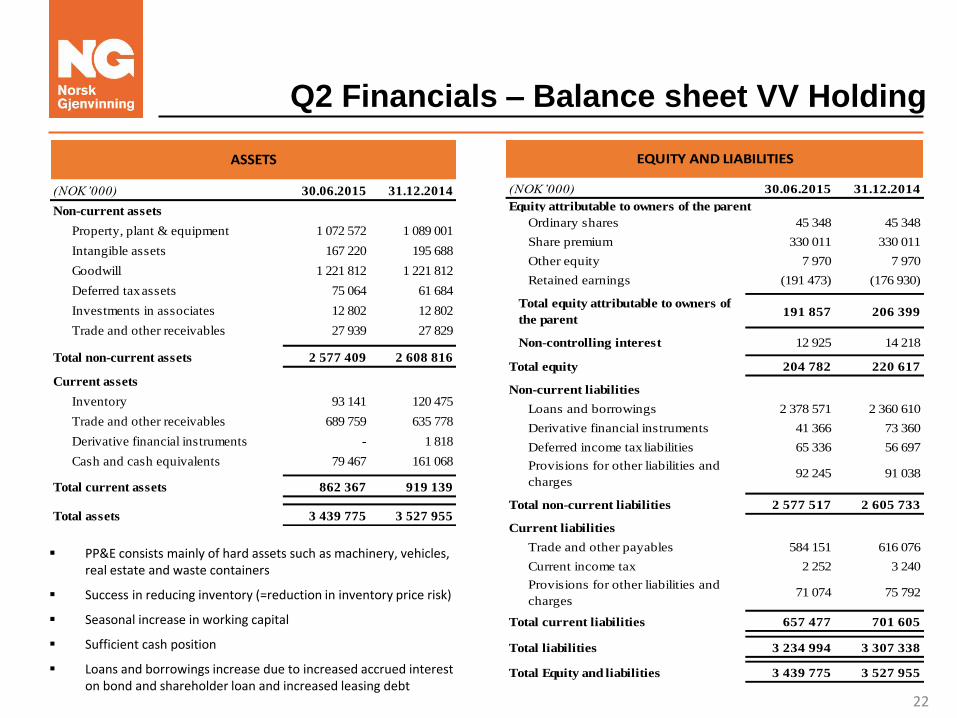
PP&E consists mainly of hard assets such as machinery, vehicles, real estate and waste containers
Success in reducing inventory (=reduction in inventory price risk)
Seasonal increase in working capital
Sufficient cash position
Loans and borrowings increase due to increased accrued interest on bond and shareholder loan and increased leasing debt
22
(NOK’000) 30.06.2015 31.12.2014
Non-current assets
Property, plant & equipment 1 072 572 1 089 001
Intangible assets 167 220 195 688
Goodwill 1 221 812 1 221 812
Deferred tax assets 75 064 61 684
Investments in associates 12 802 12 802
Trade and other receivables 27 939 27 829
Total non-current assets 2 577 409 2 608 816
Current assets
Inventory 93 141 120 475
Trade and other receivables 689 759 635 778
Derivative financial instruments - 1 818
Cash and cash equivalents 79 467 161 068
Total current assets 862 367 919 139
Total assets 3 439 775 3 527 955
ASSETS
(NOK’000) 30.06.2015 31.12.2014
Ordinary shares 45 348 45 348
Share premium 330 011 330 011
Other equity 7 970 7 970
Retained earnings (191 473) (176 930)
Total equity attributable to owners of
the parent 191 857 206 399
Non-controlling interest 12 925 14 218
Total equity 204 782 220 617
Non-current liabilities
Loans and borrowings 2 378 571 2 360 610
Derivative financial instruments 41 366 73 360
Deferred income tax liabilities 65 336 56 697
Provisions for other liabilities and
charges 92 245 91 038
Total non-current liabilities 2 577 517 2 605 733
Current liabilities
Trade and other payables 584 151 616 076
Current income tax 2 252 3 240
Provisions for other liabilities and
charges 71 074 75 792
Total current liabilities 657 477 701 605
Total liabilities 3 234 994 3 307 338
Total Equity and liabilities 3 439 775 3 527 955
EQUITY AND LIABILITIES
Equity attributable to owners of the parent
Financials – Cash Flow VV Holding
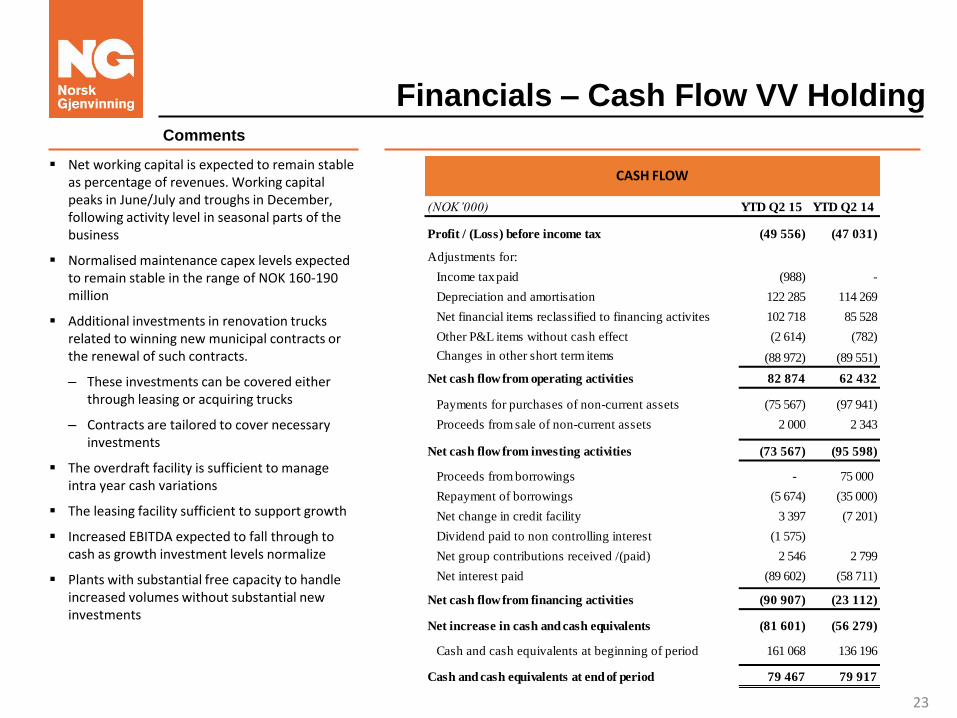
Net working capital is expected to remain stable as percentage of revenues. Working capital peaks in June/July and troughs in December, following activity level in seasonal parts of the business
Normalised maintenance capex levels expected to remain stable in the range of NOK 160-190 million
Additional investments in renovation trucks related to winning new municipal contracts or the renewal of such contracts.
– These investments can be covered either through leasing or acquiring trucks
– Contracts are tailored to cover necessary investments
The overdraft facility is sufficient to manage intra year cash variations
The leasing facility sufficient to support growth
Increased EBITDA expected to fall through to cash as growth investment levels normalize
Plants with substantial free capacity to handle increased volumes without substantial new investments
Comments
23
(NOK’000) YTD Q2 15 YTD Q2 14
Profit / (Loss) before income tax (49 556) (47 031)
Adjustments for:
Income tax paid (988) -
Depreciation and amortisation 122 285 114 269
Net financial items reclassified to financing activites 102 718 85 528
Other P&L items without cash effect (2 614) (782)
Changes in other short term items (88 972) (89 551)
Net cash flow from operating activities 82 874 62 432
Payments for purchases of non-current assets (75 567) (97 941)
Proceeds from sale of non-current assets 2 000 2 343
Net cash flow from investing activities (73 567) (95 598)
Proceeds from borrowings - 75 000
Repayment of borrowings (5 674) (35 000)
Net change in credit facility 3 397 (7 201)
Dividend paid to non controlling interest (1 575)
Net group contributions received /(paid) 2 546 2 799
Net interest paid (89 602) (58 711)
Net cash flow from financing activities (90 907) (23 112)
Net increase in cash and cash equivalents (81 601) (56 279)
Cash and cash equivalents at beginning of period 161 068 136 196
Cash and cash equivalents at end of period 79 467 79 917
CASH FLOW

Presentation agenda
24
Overview of the Norsk Gjenvinning Group (Erik Osmundsen, CEO)
2nd Quarter 2015 results (Dean Zuzic, CFO)
Presentation of key operating divisions (Divisional Directors)
Presentation of Division Recycling
25
Introduction
Key financials
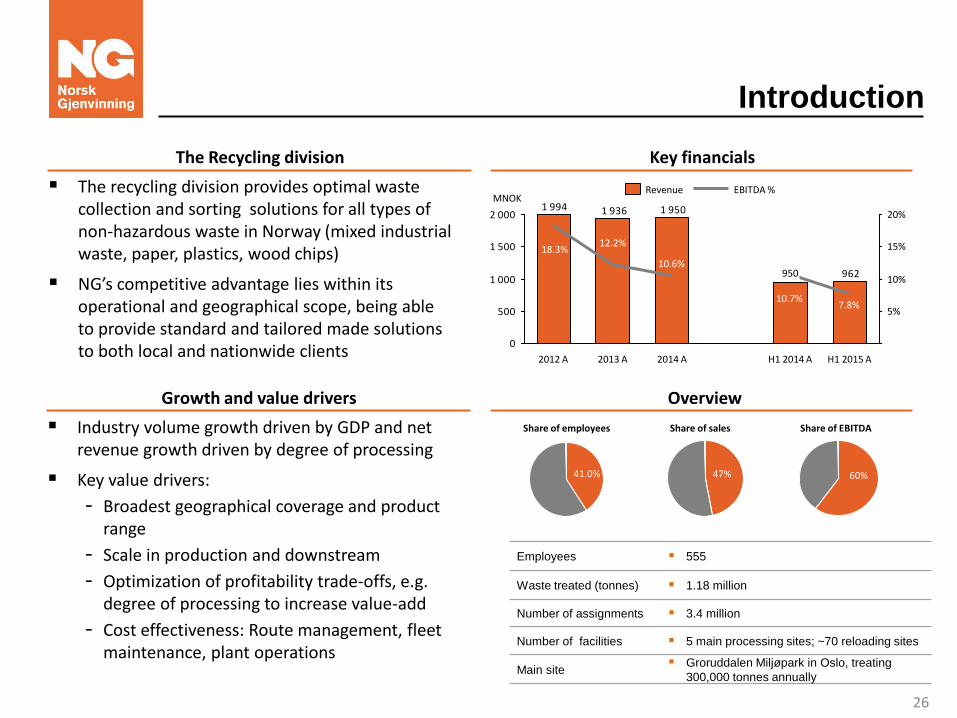
Growth and value drivers
Industry volume growth driven by GDP and net revenue growth driven by degree of processing
Key value drivers:
- Broadest geographical coverage and product range
- Scale in production and downstream
- Optimization of profitability trade-offs, e.g. degree of processing to increase value-add
- Cost effectiveness: Route management, fleet maintenance, plant operations
962
1 9501 9361 994
0
500
1 000
1 500
2 000
15%
5%
20%
10%
10.7%
10.6%
2014 A 2012 A H1 2015 A
950
2013 A
7.8%
18.3% 12.2%
H1 2014 A
Revenue EBITDA %
Overview
41.0%
Share of employees
The recycling division provides optimal waste collection and sorting solutions for all types of non-hazardous waste in Norway (mixed industrial waste, paper, plastics, wood chips)
NG’s competitive advantage lies within its operational and geographical scope, being able to provide standard and tailored made solutions to both local and nationwide clients
47%
Share of sales
The Recycling division
MNOK
Share of EBITDA
60%
Employees 555
Waste treated (tonnes) 1.18 million
Number of assignments 3.4 million
Number of facilities 5 main processing sites; ~70 reloading sites
Main site Groruddalen Miljøpark in Oslo, treating
300,000 tonnes annually
26
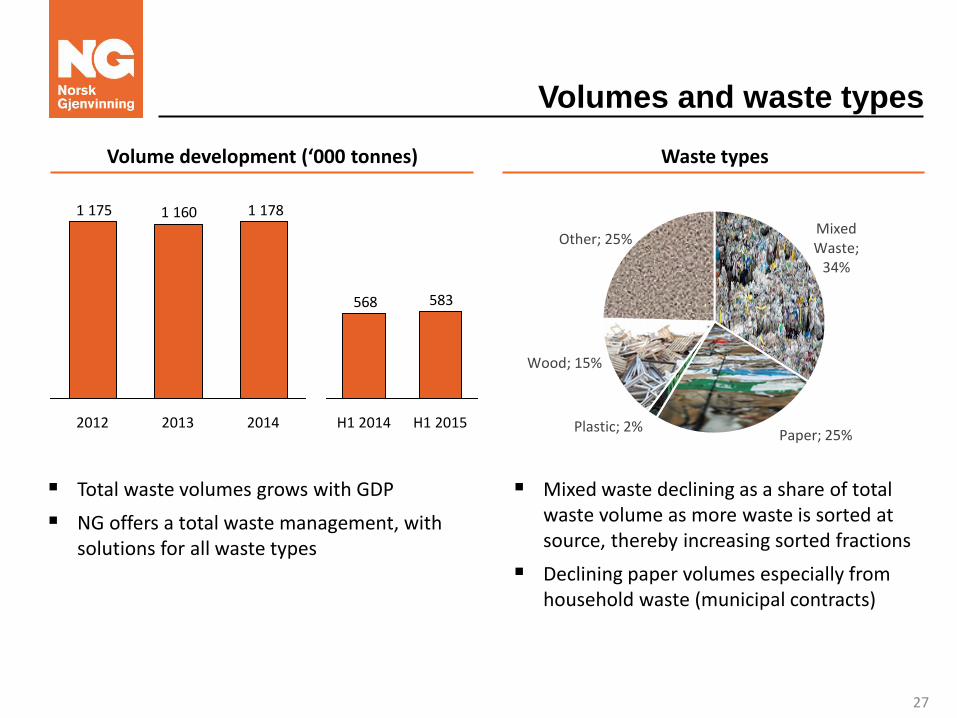
Volumes and waste types
Waste types Volume development (‘000 tonnes)
Total waste volumes grows with GDP
NG offers a total waste management, with solutions for all waste types
Mixed waste declining as a share of total waste volume as more waste is sorted at source, thereby increasing sorted fractions
Declining paper volumes especially from household waste (municipal contracts)
Mixed Waste;
34%
Paper; 25% Plastic; 2%
Wood; 15%
Other; 25%
1 1781 1601 175
2012 2013 2014
583568
H1 2015 H1 2014
27
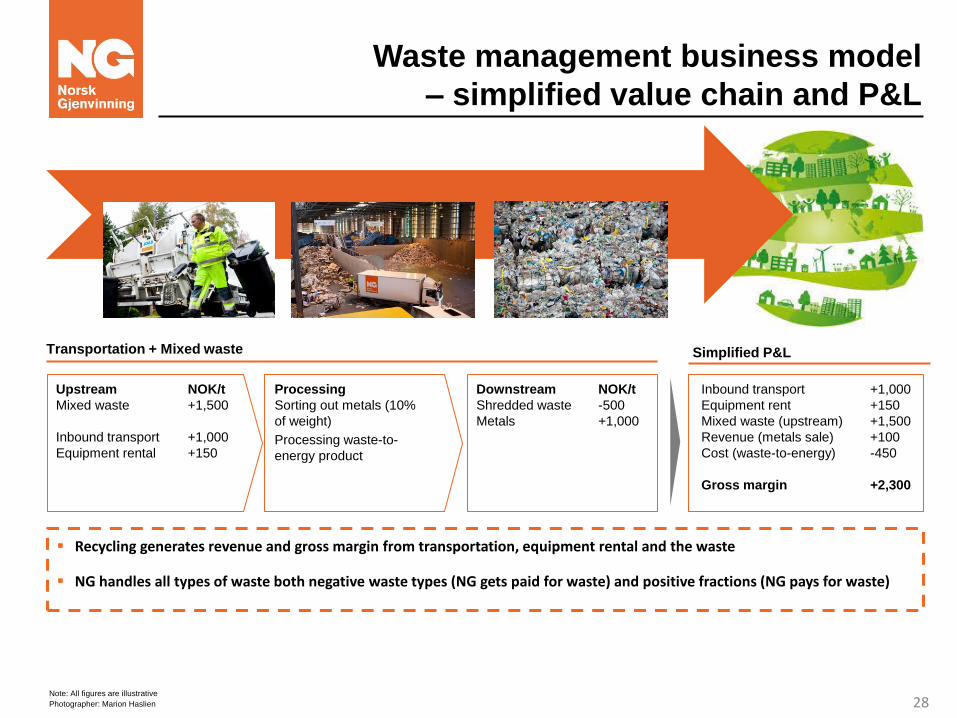
Waste management business model
– simplified value chain and P&L
Transportation + Mixed waste
Upstream NOK/t
Mixed waste +1,500
Inbound transport +1,000
Equipment rental +150
Processing
Sorting out metals (10%
of weight)
Processing waste-to-
energy product
Downstream NOK/t
Shredded waste -500
Metals +1,000
Inbound transport +1,000
Equipment rent +150
Mixed waste (upstream) +1,500
Revenue (metals sale) +100
Cost (waste-to-energy) -450
Gross margin +2,300
Simplified P&L
Recycling generates revenue and gross margin from transportation, equipment rental and the waste
NG handles all types of waste both negative waste types (NG gets paid for waste) and positive fractions (NG pays for waste)
Note: All figures are illustrative
Photographer: Marion Haslien 28
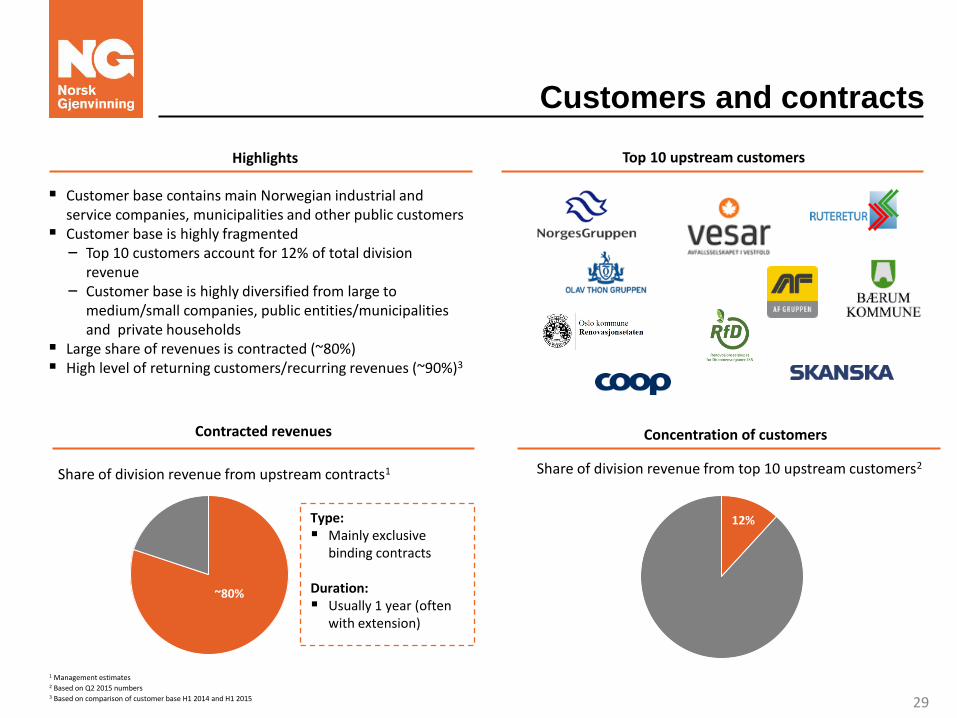
Customers and contracts
Customer base contains main Norwegian industrial and service companies, municipalities and other public customers
Customer base is highly fragmented ‒ Top 10 customers account for 12% of total division
revenue ‒ Customer base is highly diversified from large to
medium/small companies, public entities/municipalities and private households
Large share of revenues is contracted (~80%) High level of returning customers/recurring revenues (~90%)3
12%
~80%
Share of division revenue from top 10 upstream customers2 Share of division revenue from upstream contracts1
Type: Mainly exclusive
binding contracts Duration: Usually 1 year (often
with extension)
Top 10 upstream customers Highlights
Contracted revenues Concentration of customers
1 Management estimates 2 Based on Q2 2015 numbers 3 Based on comparison of customer base H1 2014 and H1 2015 29
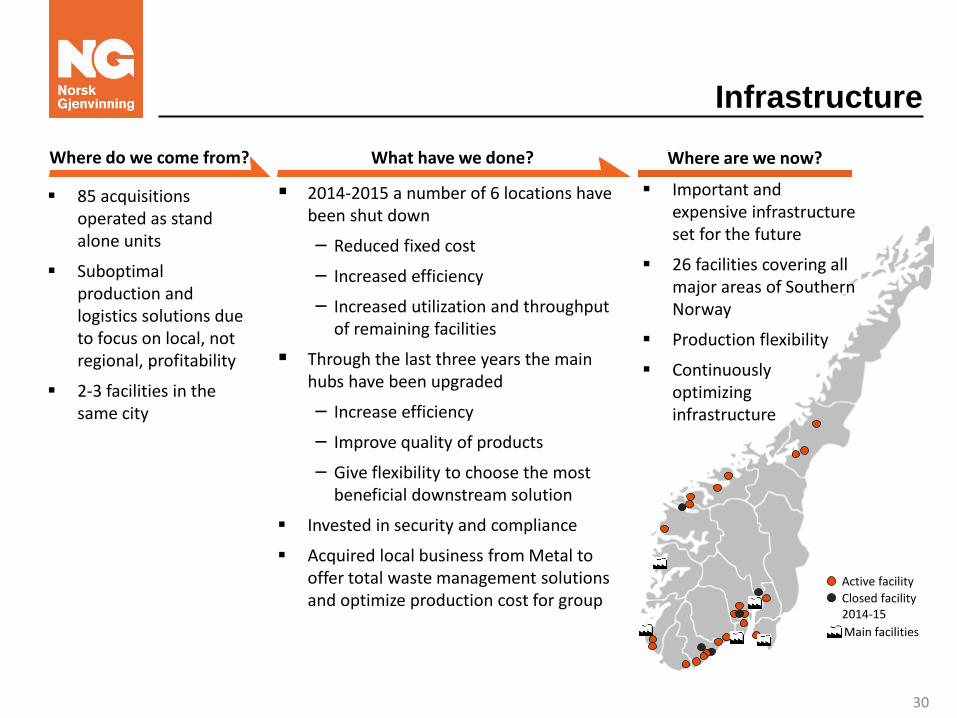
Infrastructure
Active facility
Closed facility 2014-15
Main facilities
Where do we come from?
85 acquisitions operated as stand alone units
Suboptimal production and logistics solutions due to focus on local, not regional, profitability
2-3 facilities in the same city
Where are we now?
Important and expensive infrastructure set for the future
26 facilities covering all major areas of Southern Norway
Production flexibility
Continuously optimizing infrastructure
What have we done?
2014-2015 a number of 6 locations have been shut down
– Reduced fixed cost
– Increased efficiency
– Increased utilization and throughput of remaining facilities
Through the last three years the main hubs have been upgraded
– Increase efficiency
– Improve quality of products
– Give flexibility to choose the most beneficial downstream solution
Invested in security and compliance
Acquired local business from Metal to offer total waste management solutions and optimize production cost for group
30
Logistics
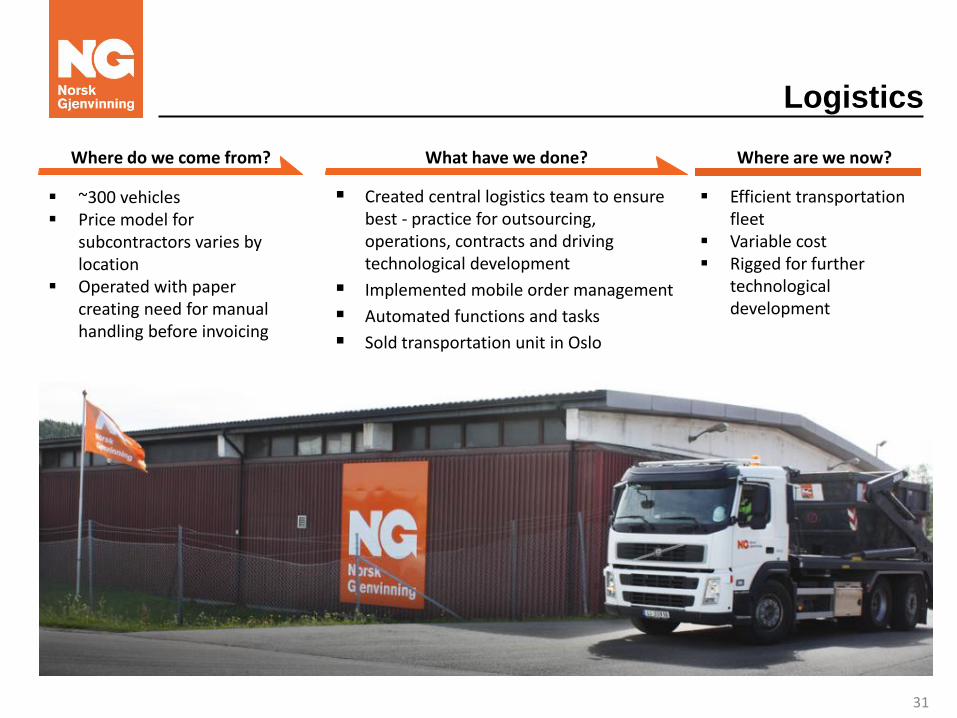
Where are we now?
Efficient transportation fleet
Variable cost Rigged for further
technological development
What have we done?
Created central logistics team to ensure best - practice for outsourcing, operations, contracts and driving technological development
Implemented mobile order management
Automated functions and tasks
Sold transportation unit in Oslo
~300 vehicles Price model for
subcontractors varies by location
Operated with paper creating need for manual handling before invoicing
Where do we come from?
31
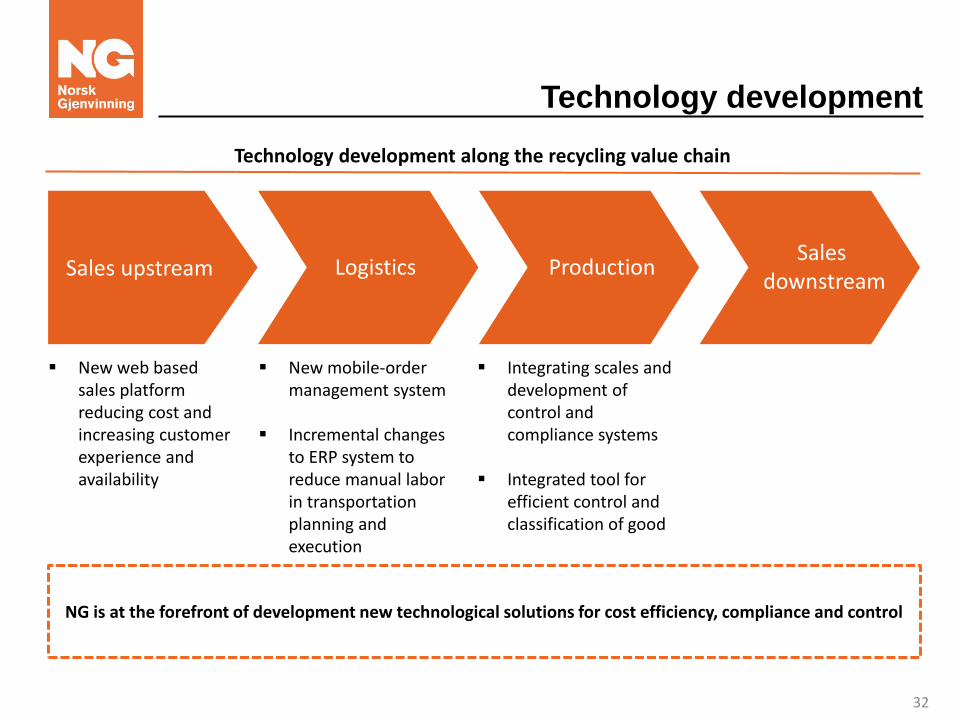
Technology development
Sales upstream Logistikk Logistics Production Sales
downstream
Technology development along the recycling value chain
NG is at the forefront of development new technological solutions for cost efficiency, compliance and control
New mobile-order management system
Incremental changes to ERP system to reduce manual labor in transportation planning and execution
Integrating scales and development of control and compliance systems
Integrated tool for efficient control and classification of good
New web based sales platform reducing cost and increasing customer experience and availability
32
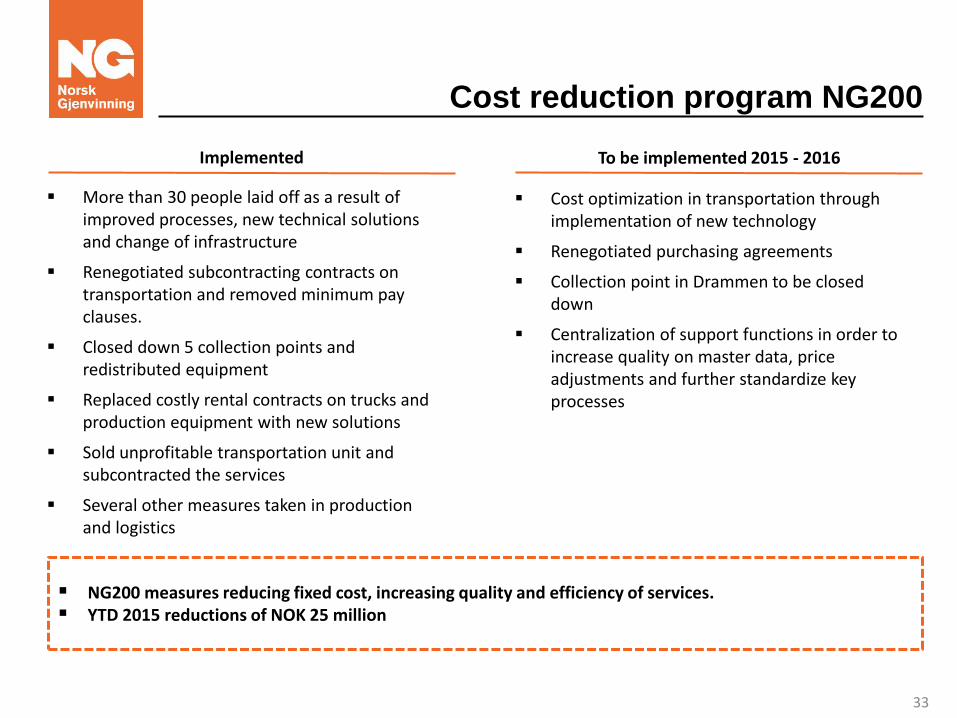
Cost reduction program NG200
More than 30 people laid off as a result of improved processes, new technical solutions and change of infrastructure
Renegotiated subcontracting contracts on transportation and removed minimum pay clauses.
Closed down 5 collection points and redistributed equipment
Replaced costly rental contracts on trucks and production equipment with new solutions
Sold unprofitable transportation unit and subcontracted the services
Several other measures taken in production and logistics
Cost optimization in transportation through implementation of new technology
Renegotiated purchasing agreements
Collection point in Drammen to be closed down
Centralization of support functions in order to increase quality on master data, price adjustments and further standardize key processes
NG200 measures reducing fixed cost, increasing quality and efficiency of services. YTD 2015 reductions of NOK 25 million
Implemented To be implemented 2015 - 2016
33
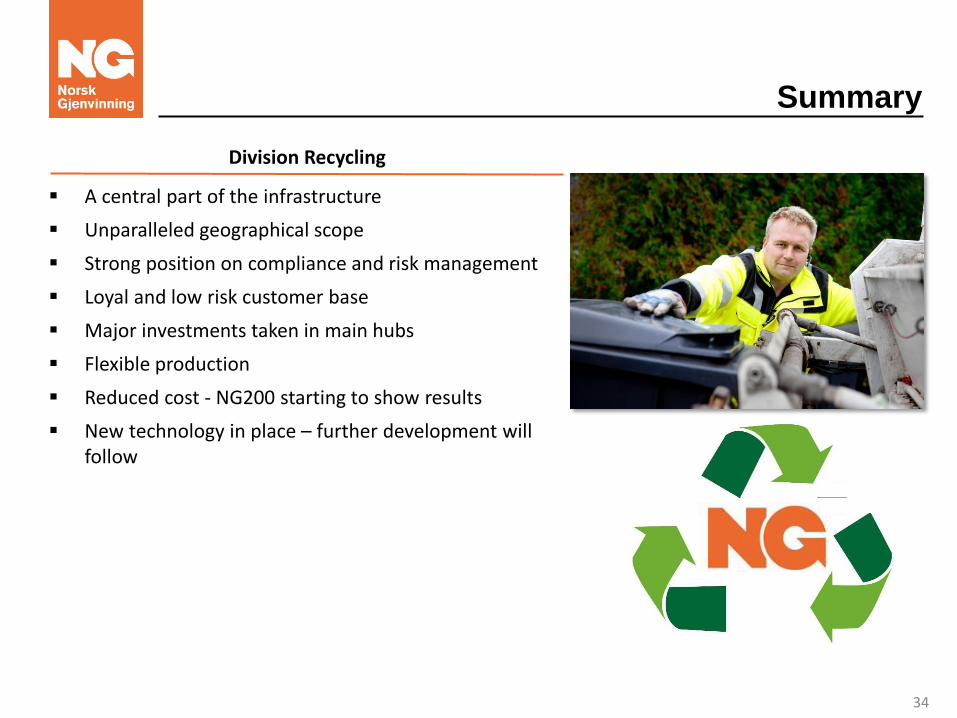
Summary
A central part of the infrastructure
Unparalleled geographical scope
Strong position on compliance and risk management
Loyal and low risk customer base
Major investments taken in main hubs
Flexible production
Reduced cost - NG200 starting to show results
New technology in place – further development will follow
Division Recycling
34

35
Presentation of the Division Metal
36
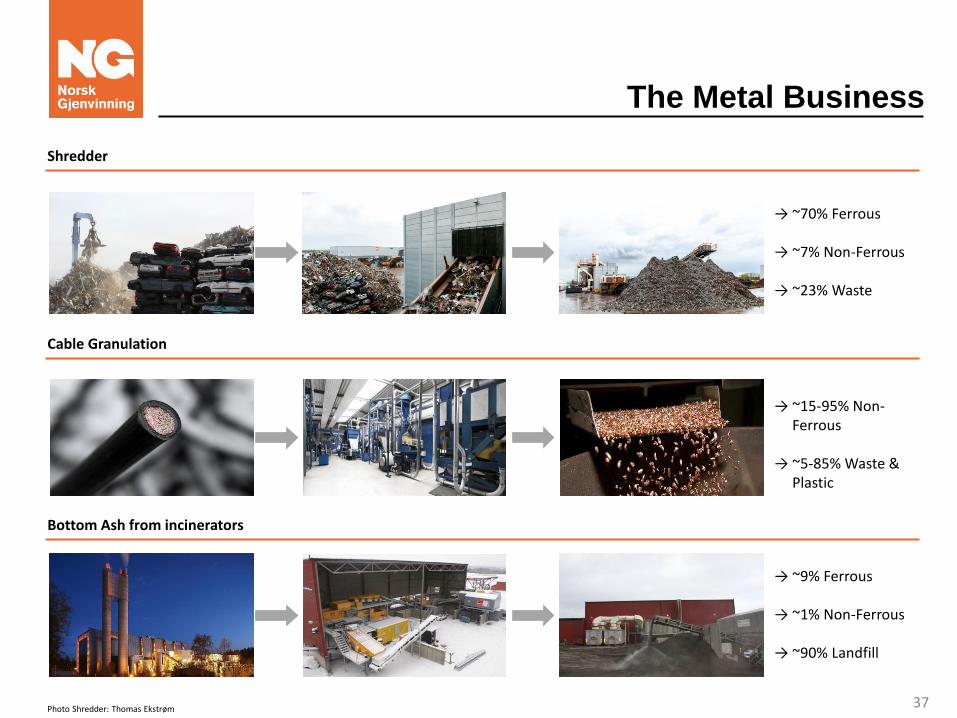
The Metal Business
Shredder
Cable Granulation
Bottom Ash from incinerators
→ ~70% Ferrous
→ ~7% Non-Ferrous
→ ~23% Waste
→ ~15-95% Non-Ferrous
→ ~5-85% Waste & Plastic
→ ~9% Ferrous
→ ~1% Non-Ferrous
→ ~90% Landfill
Photo Shredder: Thomas Ekstrøm 37
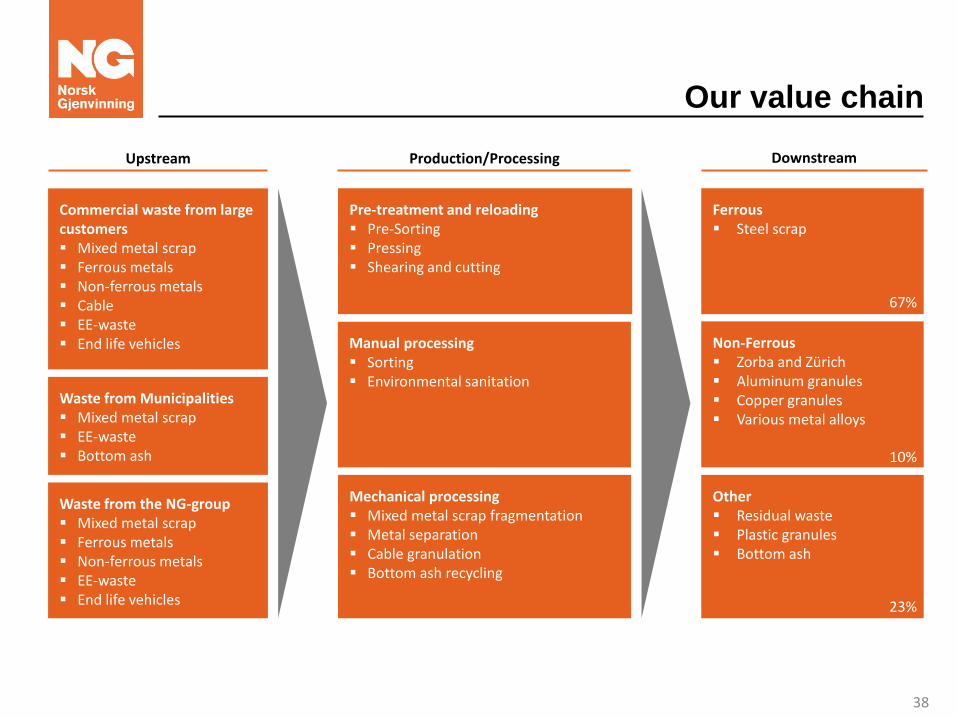
Our value chain
Commercial waste from large customers Mixed metal scrap Ferrous metals Non-ferrous metals Cable EE-waste End life vehicles
Waste from Municipalities Mixed metal scrap EE-waste Bottom ash
Pre-treatment and reloading Pre-Sorting Pressing Shearing and cutting
Mechanical processing Mixed metal scrap fragmentation Metal separation Cable granulation Bottom ash recycling
Ferrous Steel scrap
Other Residual waste Plastic granules Bottom ash
Upstream Production/Processing Downstream
Waste from the NG-group Mixed metal scrap Ferrous metals Non-ferrous metals EE-waste End life vehicles
Manual processing Sorting Environmental sanitation
Non-Ferrous Zorba and Zürich Aluminum granules Copper granules Various metal alloys
67%
10%
23%
38
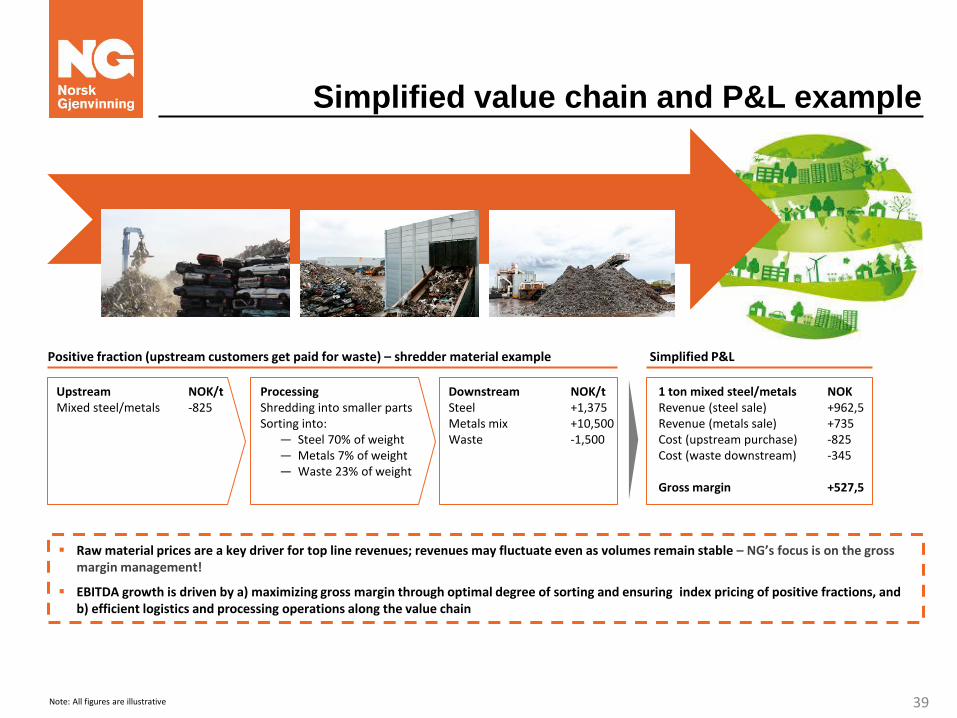
Simplified value chain and P&L example
Note: All figures are illustrative
Positive fraction (upstream customers get paid for waste) – shredder material example
Upstream NOK/t Mixed steel/metals -825
Processing Shredding into smaller parts Sorting into:
— Steel 70% of weight — Metals 7% of weight — Waste 23% of weight
Downstream NOK/t Steel +1,375 Metals mix +10,500 Waste -1,500
1 ton mixed steel/metals NOK Revenue (steel sale) +962,5 Revenue (metals sale) +735 Cost (upstream purchase) -825 Cost (waste downstream) -345 Gross margin +527,5
Simplified P&L
Raw material prices are a key driver for top line revenues; revenues may fluctuate even as volumes remain stable – NG’s focus is on the gross margin management!
EBITDA growth is driven by a) maximizing gross margin through optimal degree of sorting and ensuring index pricing of positive fractions, and b) efficient logistics and processing operations along the value chain
39
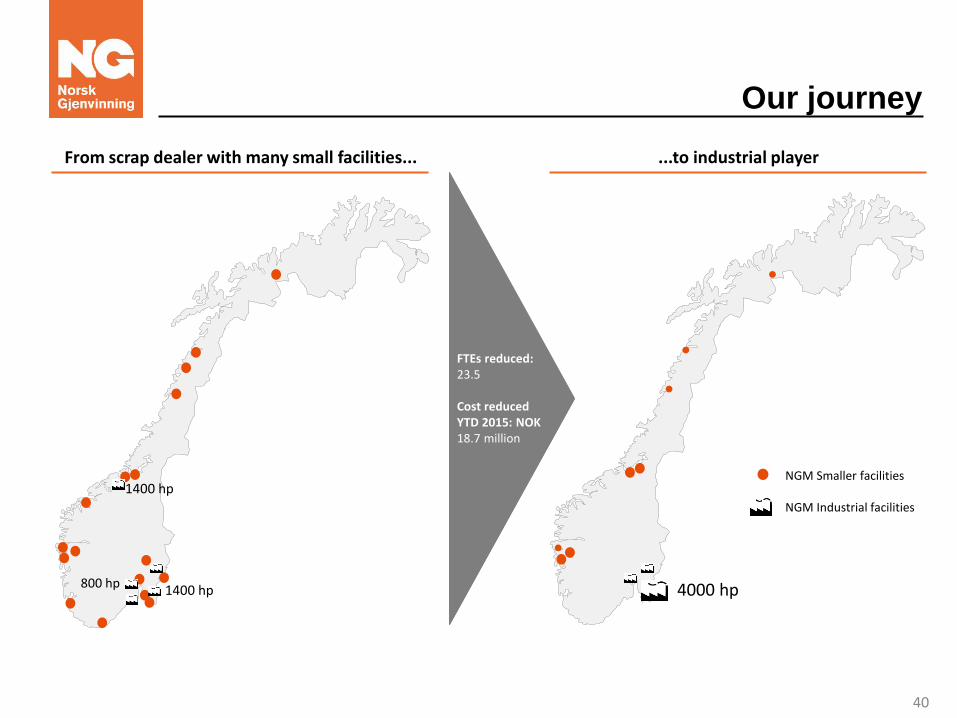
Our journey
...to industrial player From scrap dealer with many small facilities...
72 NGM Smaller facilities
NGM Industrial facilities
FTEs reduced: 23.5 Cost reduced YTD 2015: NOK 18.7 million
1400 hp
800 hp 1400 hp 4000 hp
40
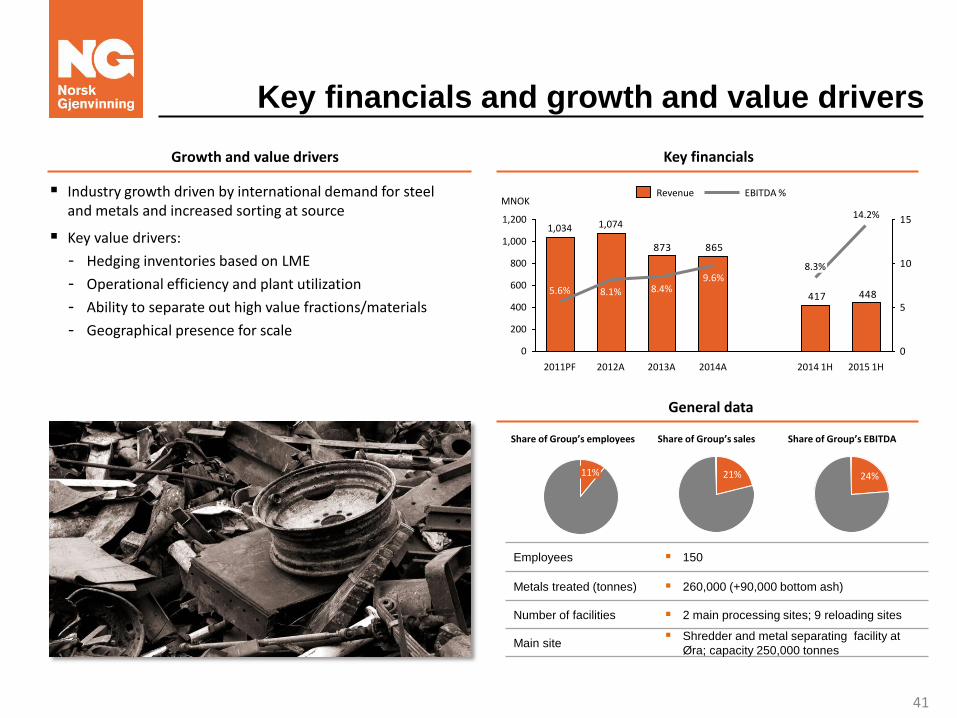
Key financials and growth and value drivers
Key financials Growth and value drivers
General data
Share of Group’s employees Share of Group’s sales
63%
Share of Group’s EBITDA
60%
Employees 150
Metals treated (tonnes) 260,000 (+90,000 bottom ash)
Number of facilities 2 main processing sites; 9 reloading sites
Main site Shredder and metal separating facility at
Øra; capacity 250,000 tonnes
11% 21% 24%
Industry growth driven by international demand for steel and metals and increased sorting at source
Key value drivers:
- Hedging inventories based on LME
- Operational efficiency and plant utilization
- Ability to separate out high value fractions/materials
- Geographical presence for scale
865
448417
873
0
5
10
15
600
1,200
800
400
200
1,000
0
8.1% 5.6%
1,074
2011PF
1,034
2015 1H 2012A 2014 1H 2013A 2014A
8.4% 9.6%
8.3%
14.2%
EBITDA % MNOK
Revenue
41
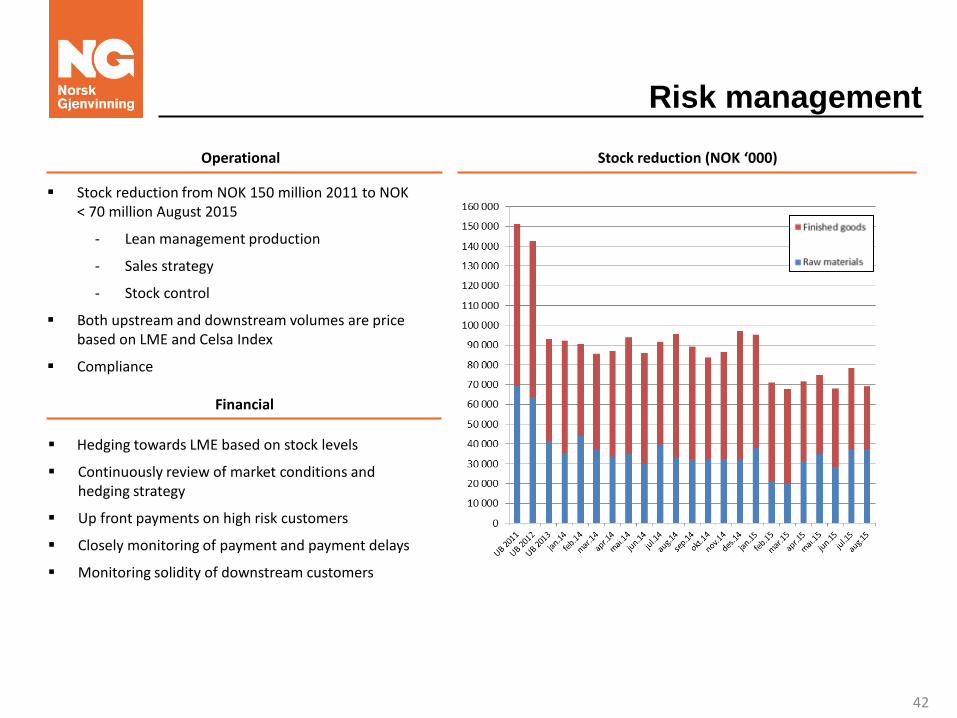
Risk management
Financial
Operational
63%
Stock reduction from NOK 150 million 2011 to NOK < 70 million August 2015
- Lean management production
- Sales strategy
- Stock control
Both upstream and downstream volumes are price based on LME and Celsa Index
Compliance
Hedging towards LME based on stock levels
Continuously review of market conditions and hedging strategy
Up front payments on high risk customers
Closely monitoring of payment and payment delays
Monitoring solidity of downstream customers
Stock reduction (NOK ‘000)
42
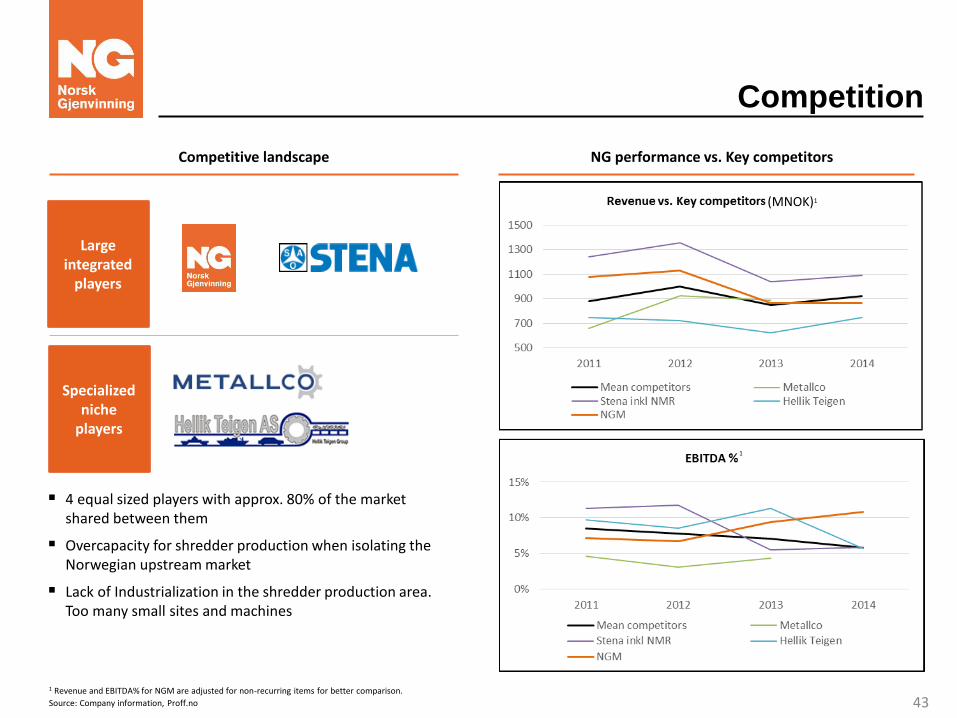
Competition
1 Revenue and EBITDA% for NGM are adjusted for non-recurring items for better comparison.
Source: Company information, Proff.no
Large integrated
players
Specialized niche
players
Competitive landscape NG performance vs. Key competitors
4 equal sized players with approx. 80% of the market shared between them
Overcapacity for shredder production when isolating the Norwegian upstream market
Lack of Industrialization in the shredder production area. Too many small sites and machines
(MNOK)1
43
1
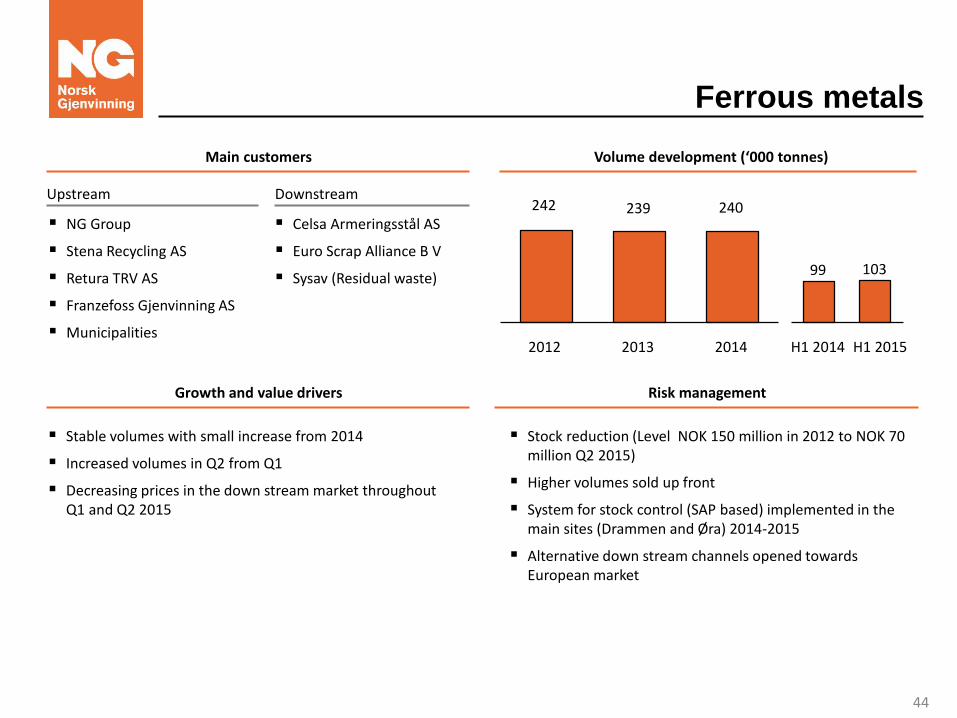
Ferrous metals
Volume development (‘000 tonnes) Main customers
242 239 240
2014 2013 2012
Growth and value drivers Risk management
Stable volumes with small increase from 2014
Increased volumes in Q2 from Q1
Decreasing prices in the down stream market throughout Q1 and Q2 2015
Stock reduction (Level NOK 150 million in 2012 to NOK 70 million Q2 2015)
Higher volumes sold up front
System for stock control (SAP based) implemented in the main sites (Drammen and Øra) 2014-2015
Alternative down stream channels opened towards European market
NG Group
Stena Recycling AS
Retura TRV AS
Franzefoss Gjenvinning AS
Municipalities
Celsa Armeringsstål AS
Euro Scrap Alliance B V
Sysav (Residual waste)
Upstream Downstream
H1 2014 H1 2015
103 99
44
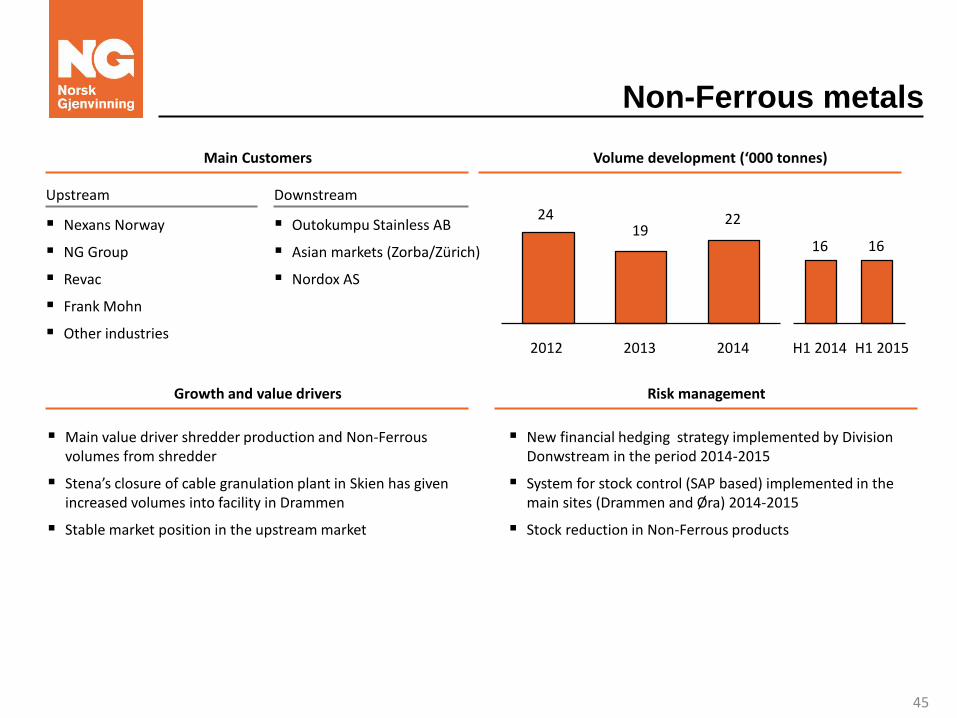
Non-Ferrous metals
Volume development (‘000 tonnes) Main Customers
Growth and value drivers Risk management
Main value driver shredder production and Non-Ferrous volumes from shredder
Stena’s closure of cable granulation plant in Skien has given increased volumes into facility in Drammen
Stable market position in the upstream market
New financial hedging strategy implemented by Division Donwstream in the period 2014-2015
System for stock control (SAP based) implemented in the main sites (Drammen and Øra) 2014-2015
Stock reduction in Non-Ferrous products
Nexans Norway
NG Group
Revac
Frank Mohn
Other industries
Outokumpu Stainless AB
Asian markets (Zorba/Zürich)
Nordox AS
Upstream Downstream 24
19 22
2014 2012 2013 H1 2014 H1 2015
16 16
45
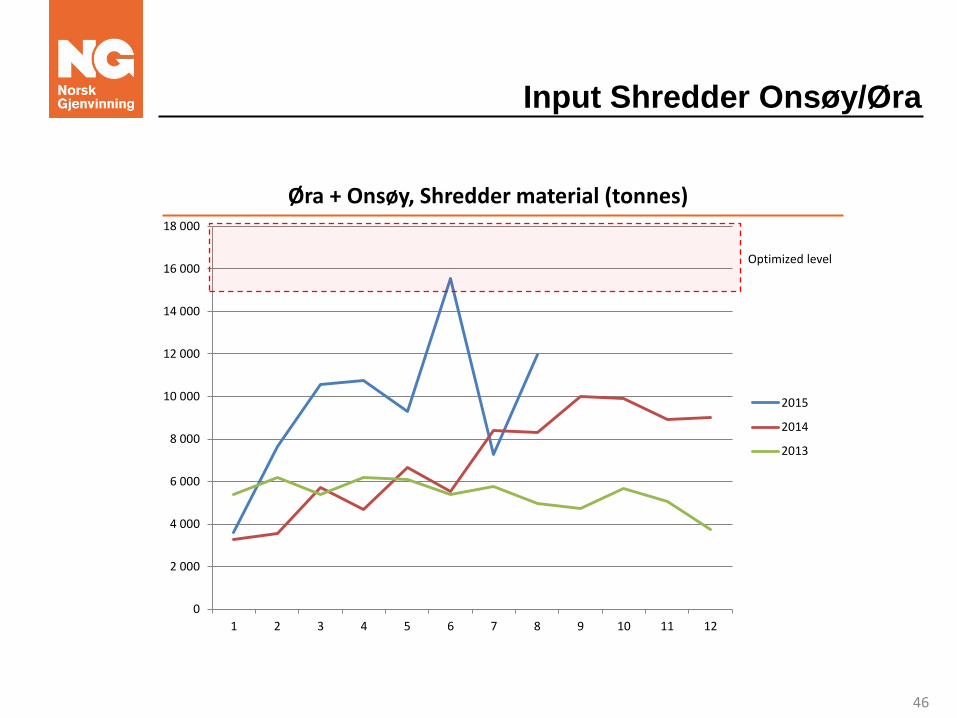
Input Shredder Onsøy/Øra
0
2 000
4 000
6 000
8 000
10 000
12 000
14 000
16 000
18 000
1 2 3 4 5 6 7 8 9 10 11 12
Øra + Onsøy, Shredder material (tonnes)
2015
2014
2013
Optimized level
46
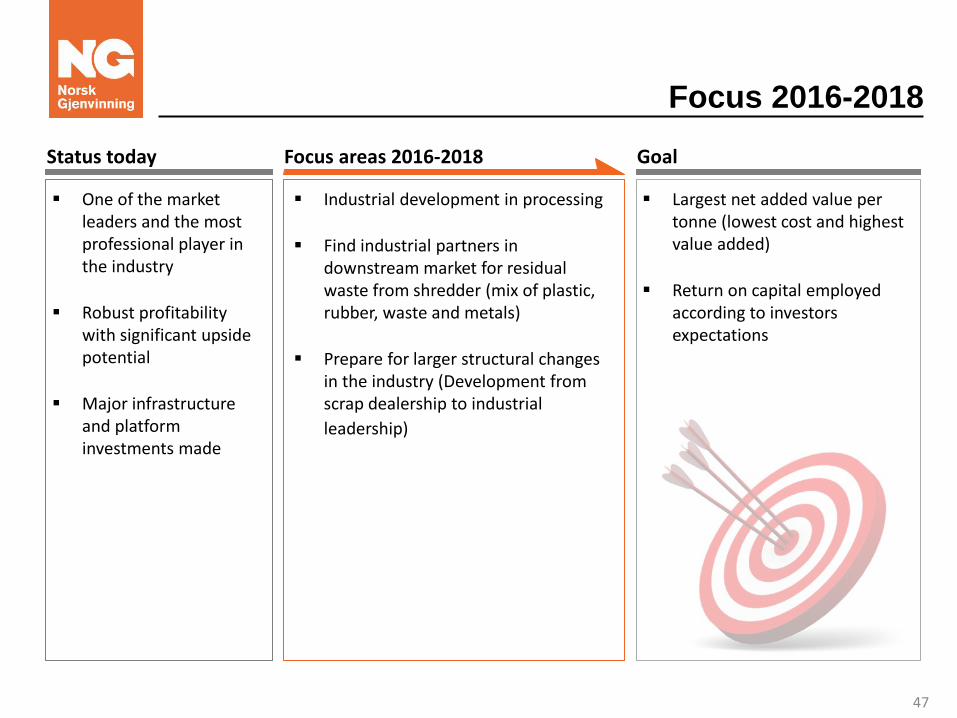
Focus 2016-2018
Goal Status today
One of the market leaders and the most professional player in the industry
Robust profitability with significant upside potential
Major infrastructure and platform investments made
Industrial development in processing
Find industrial partners in downstream market for residual waste from shredder (mix of plastic, rubber, waste and metals)
Prepare for larger structural changes in the industry (Development from scrap dealership to industrial
leadership)
Focus areas 2016-2018
Largest net added value per tonne (lowest cost and highest value added)
Return on capital employed according to investors expectations
47

48
Presentation of Division Industry & Offshore
49
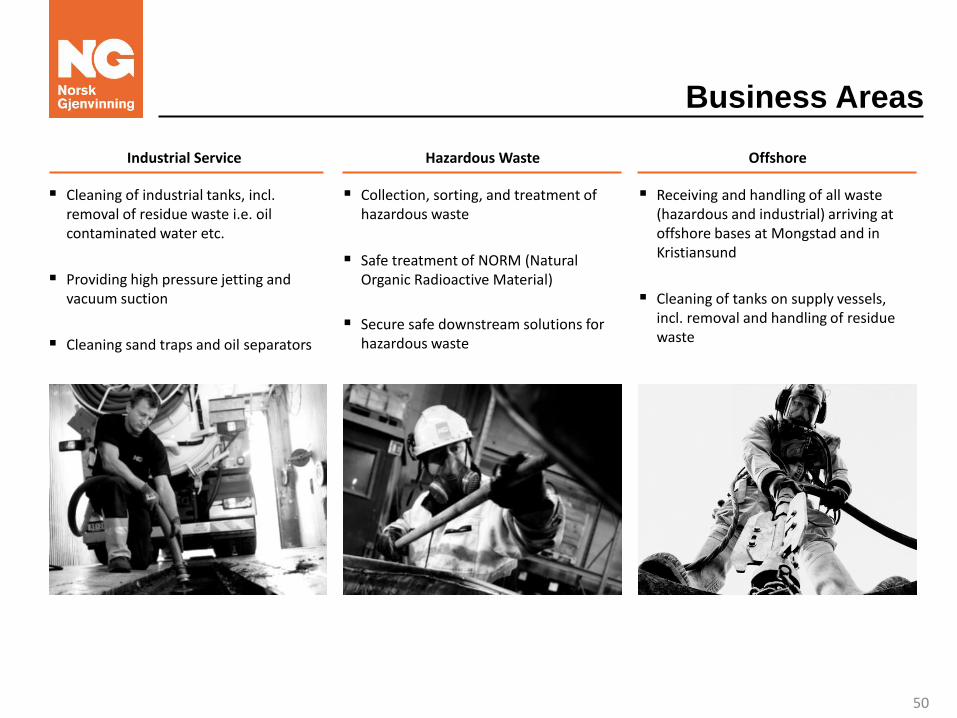
Business Areas
Industrial Service Hazardous Waste Offshore
Cleaning of industrial tanks, incl. removal of residue waste i.e. oil contaminated water etc.
Providing high pressure jetting and vacuum suction
Cleaning sand traps and oil separators
Collection, sorting, and treatment of hazardous waste
Safe treatment of NORM (Natural Organic Radioactive Material)
Secure safe downstream solutions for hazardous waste
Receiving and handling of all waste (hazardous and industrial) arriving at offshore bases at Mongstad and in Kristiansund
Cleaning of tanks on supply vessels, incl. removal and handling of residue waste
50
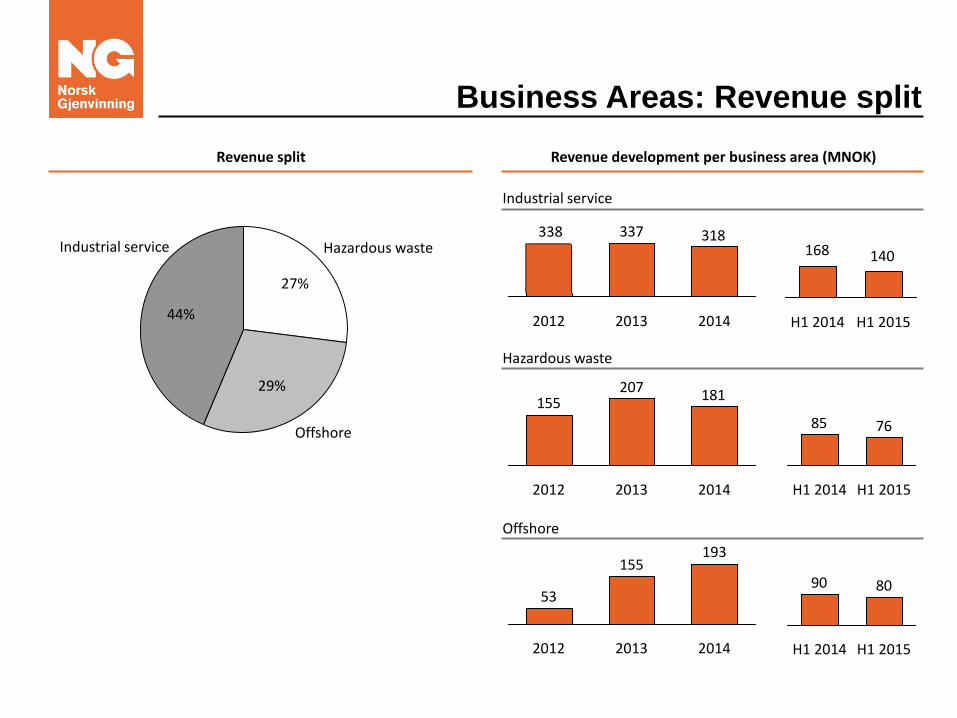
Business Areas: Revenue split
Revenue development per business area (MNOK) Revenue split
Industrial Service Hazardous Waste
Offshore
29%
44%
27%
155
53
193
2014 2012 2013
8090
H1 2015 H1 2014
318337291
2013 2012 2014 H1 2014 H1 2015
172 145
181207155
2014 2013 2012
7685
H1 2015 H1 2014
Offshore
Industrial service
Hazardous waste
Industrial service Hazardous waste 338
168 140
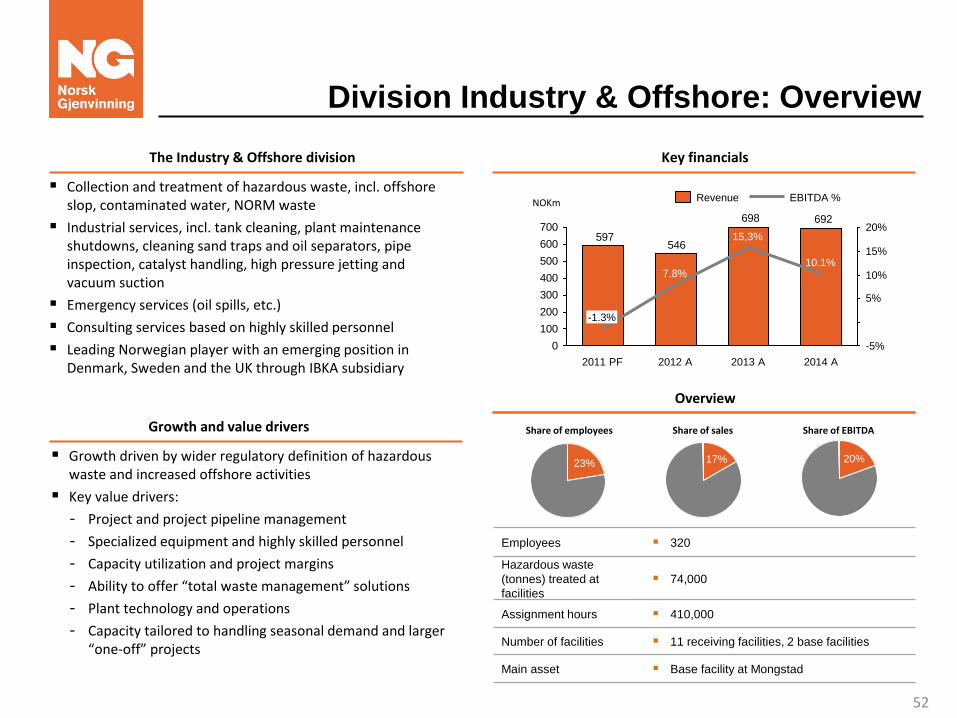
Division Industry & Offshore: Overview
Growth and value drivers
Growth driven by wider regulatory definition of hazardous waste and increased offshore activities
Key value drivers:
- Project and project pipeline management
- Specialized equipment and highly skilled personnel
- Capacity utilization and project margins
- Ability to offer “total waste management” solutions
- Plant technology and operations
- Capacity tailored to handling seasonal demand and larger “one-off” projects
Overview
Collection and treatment of hazardous waste, incl. offshore slop, contaminated water, NORM waste
Industrial services, incl. tank cleaning, plant maintenance shutdowns, cleaning sand traps and oil separators, pipe inspection, catalyst handling, high pressure jetting and vacuum suction
Emergency services (oil spills, etc.)
Consulting services based on highly skilled personnel
Leading Norwegian player with an emerging position in Denmark, Sweden and the UK through IBKA subsidiary
Employees 320
Hazardous waste
(tonnes) treated at
facilities
74,000
Assignment hours 410,000
Number of facilities 11 receiving facilities, 2 base facilities
Main asset Base facility at Mongstad
Key financials The Industry & Offshore division
NOKm
692698
546597
0
100
200
300
400
500
600
700
5%
10%
20%
-5%
15%
2013 A
10.1%
2014 A
15,3%
7.8%
-1.3%
2012 A 2011 PF
Revenue EBITDA %
Share of employees Share of sales Share of EBITDA
23% 17% 20%
52
Focus: Mongstad status and strategy
Business Mongstad 2014 - 2015
– Compliance challenges October 2014 to April 2015
• Now solved - Purification plant upgraded and new management
– 2015 Turnover strongly reduced
Potential new offshore contract
– Contract out for tender – 6+2+2 years
– NG attractively positioned
– Decision latest 13. December 2015
Cost reduction program established for Division Industry & Offshore
– Initiatives in Norway and Sweden
– Cost reductions 2015: NOK 41 million (annual effect)
– Cost reduction goal 2016: NOK 24 million
53
Main facilities
3
4
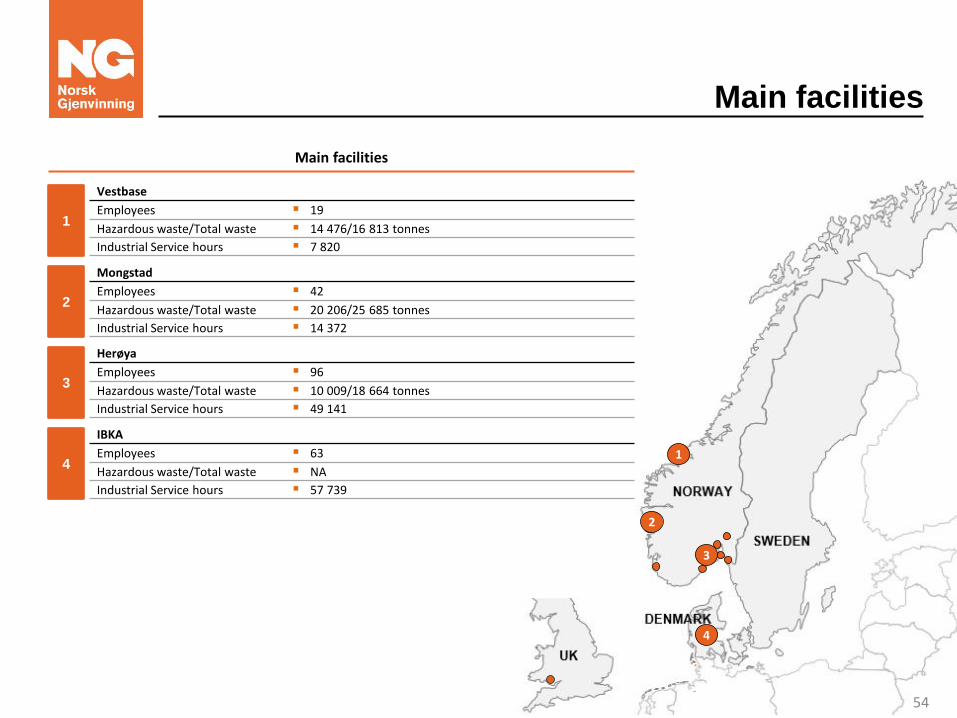
Main facilities
Vestbase
Employees 19
Hazardous waste/Total waste 14 476/16 813 tonnes
Industrial Service hours 7 820
1
Mongstad
Employees 42
Hazardous waste/Total waste 20 206/25 685 tonnes
Industrial Service hours 14 372
2
Herøya
Employees 96
Hazardous waste/Total waste 10 009/18 664 tonnes
Industrial Service hours 49 141
3
IBKA
Employees 63
Hazardous waste/Total waste NA
Industrial Service hours 57 739
4 1
2
3
54
Industry & Offshore: Customers and
contracts
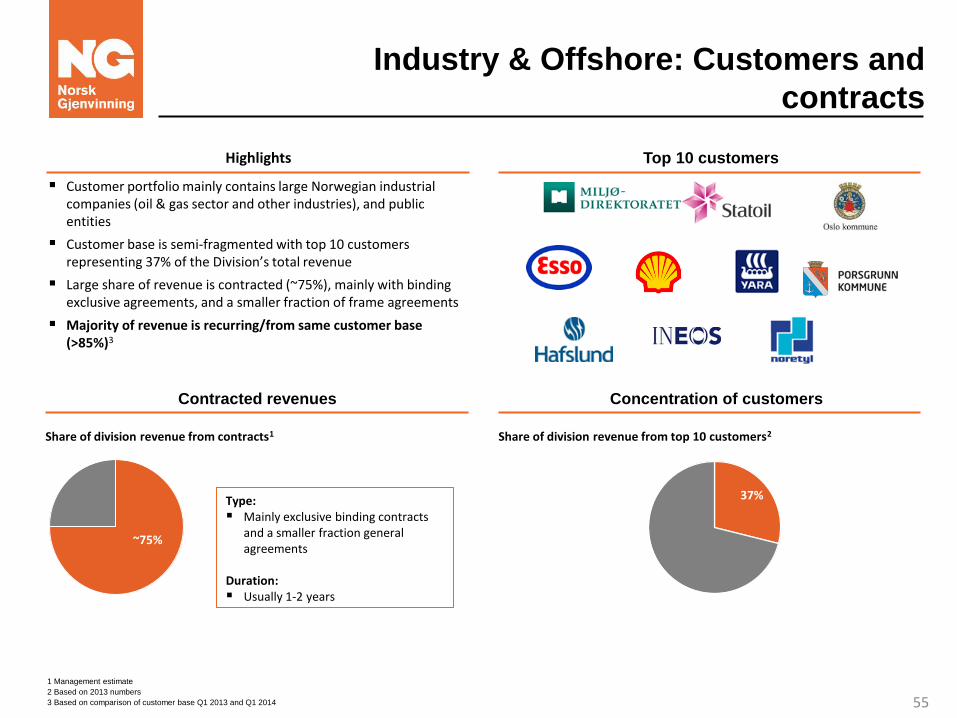
Customer portfolio mainly contains large Norwegian industrial companies (oil & gas sector and other industries), and public entities
Customer base is semi-fragmented with top 10 customers representing 37% of the Division’s total revenue
Large share of revenue is contracted (~75%), mainly with binding exclusive agreements, and a smaller fraction of frame agreements
Majority of revenue is recurring/from same customer base (>85%)3
37%
~75%
Type: Mainly exclusive binding contracts
and a smaller fraction general agreements
Duration: Usually 1-2 years
Highlights Top 10 customers
Contracted revenues Concentration of customers
Share of division revenue from contracts1 Share of division revenue from top 10 customers2
1 Management estimate
2 Based on 2013 numbers
3 Based on comparison of customer base Q1 2013 and Q1 2014 55
Position and opportunities
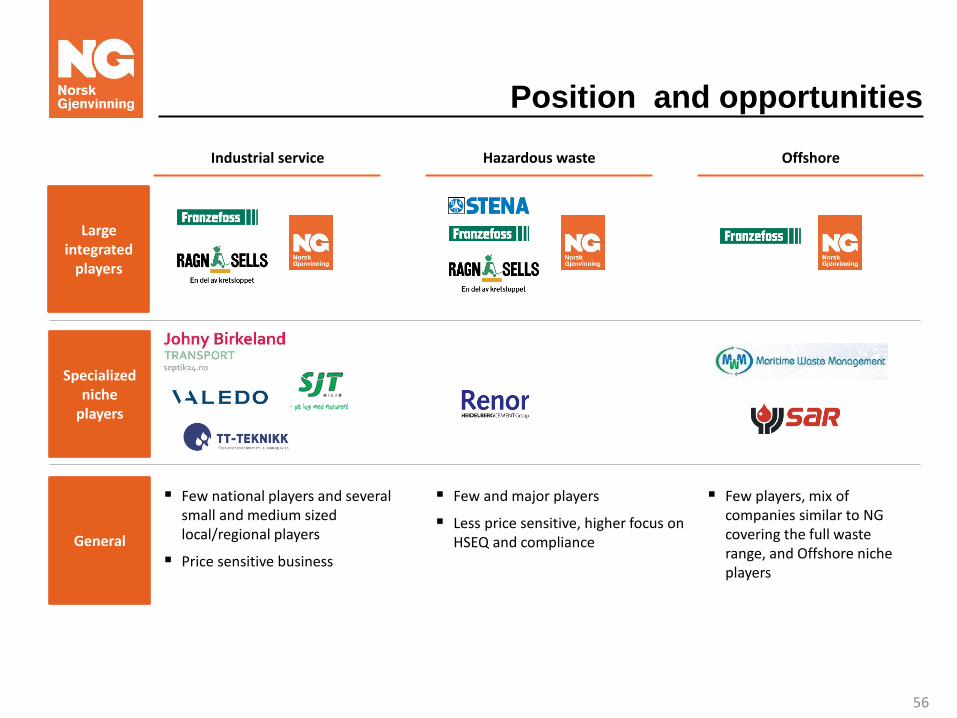
Large integrated
players
Specialized niche
players
Hazardous waste Offshore Industrial service
Few national players and several small and medium sized local/regional players
Price sensitive business
General
Few and major players
Less price sensitive, higher focus on HSEQ and compliance
Few players, mix of companies similar to NG covering the full waste range, and Offshore niche players
56
Focus 2016-2018
Goal Status today
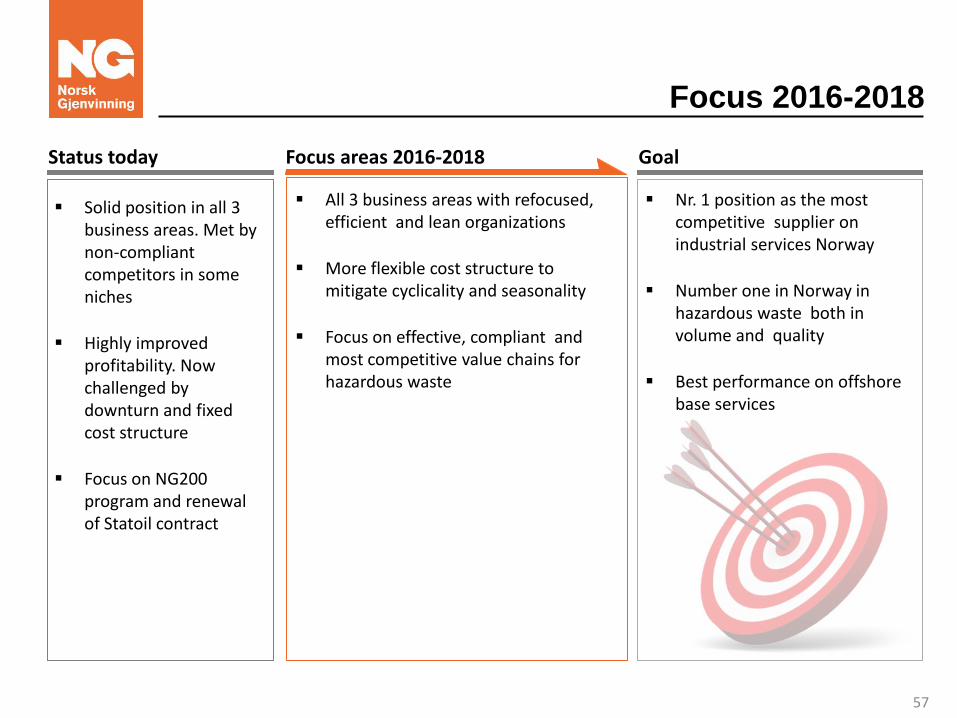
Solid position in all 3 business areas. Met by non-compliant competitors in some niches
Highly improved profitability. Now challenged by downturn and fixed cost structure
Focus on NG200 program and renewal of Statoil contract
All 3 business areas with refocused, efficient and lean organizations
More flexible cost structure to mitigate cyclicality and seasonality
Focus on effective, compliant and most competitive value chains for hazardous waste
Focus areas 2016-2018
Nr. 1 position as the most competitive supplier on industrial services Norway
Number one in Norway in hazardous waste both in volume and quality
Best performance on offshore base services
57

58
Presentation of the Downstream Division
59
Introduction to our market activity
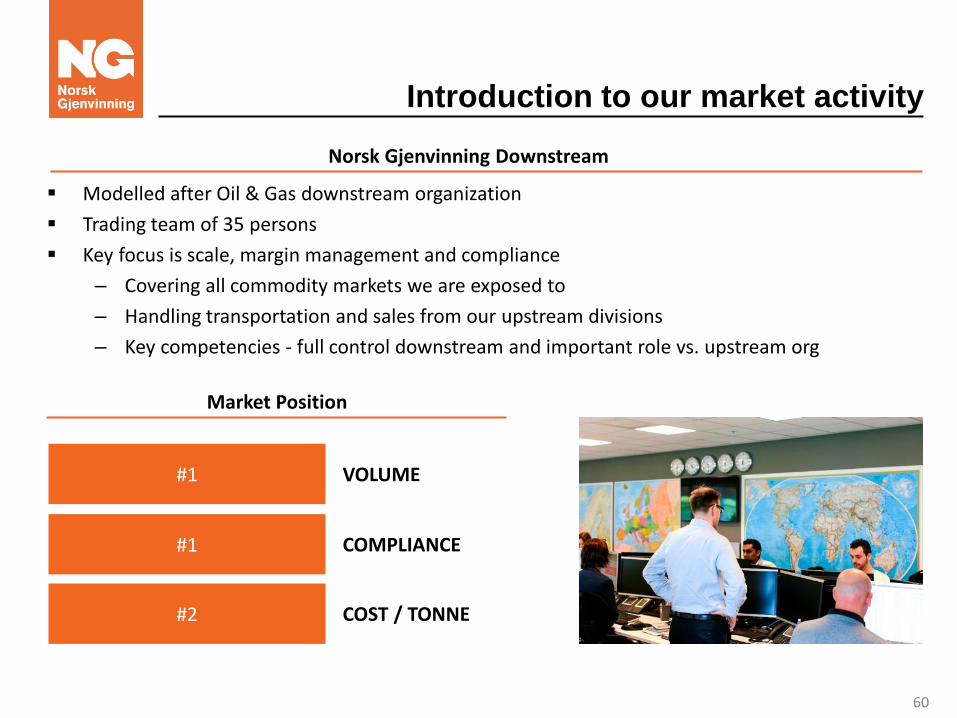
Modelled after Oil & Gas downstream organization
Trading team of 35 persons
Key focus is scale, margin management and compliance
– Covering all commodity markets we are exposed to
– Handling transportation and sales from our upstream divisions
– Key competencies - full control downstream and important role vs. upstream org
Norsk Gjenvinning Downstream
#1
Market Position
#1
#2
VOLUME
COMPLIANCE
COST / TONNE
60
Overview
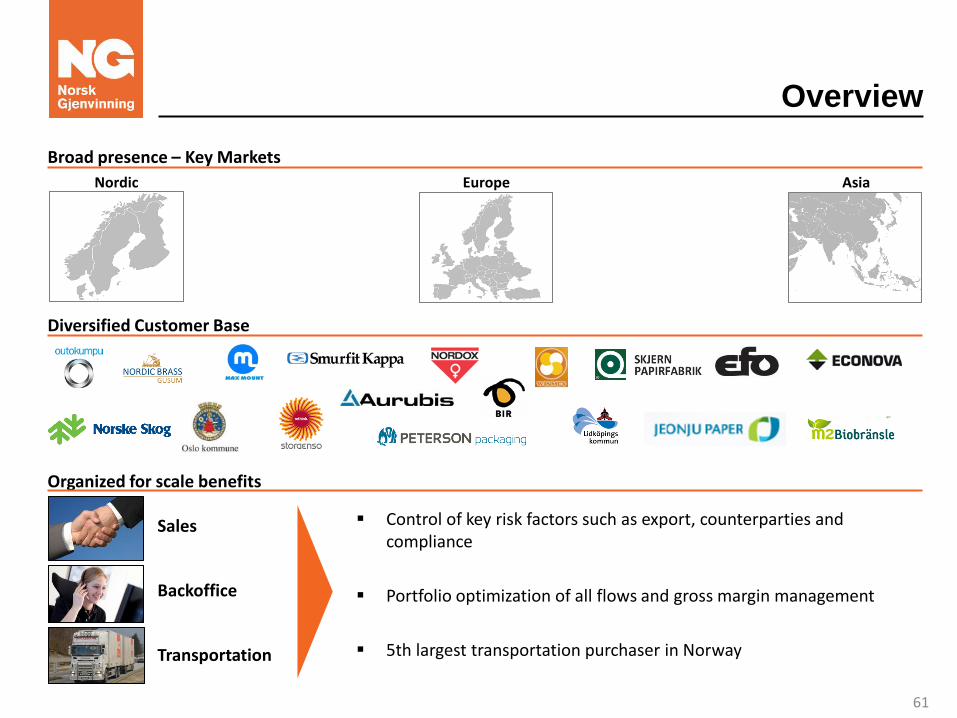
Broad presence – Key Markets
Diversified Customer Base
Nordic Europe Asia
Organized for scale benefits
Control of key risk factors such as export, counterparties and compliance
Portfolio optimization of all flows and gross margin management
5th largest transportation purchaser in Norway
Sales
Backoffice
Transportation
61
Risk Management I: Compliance
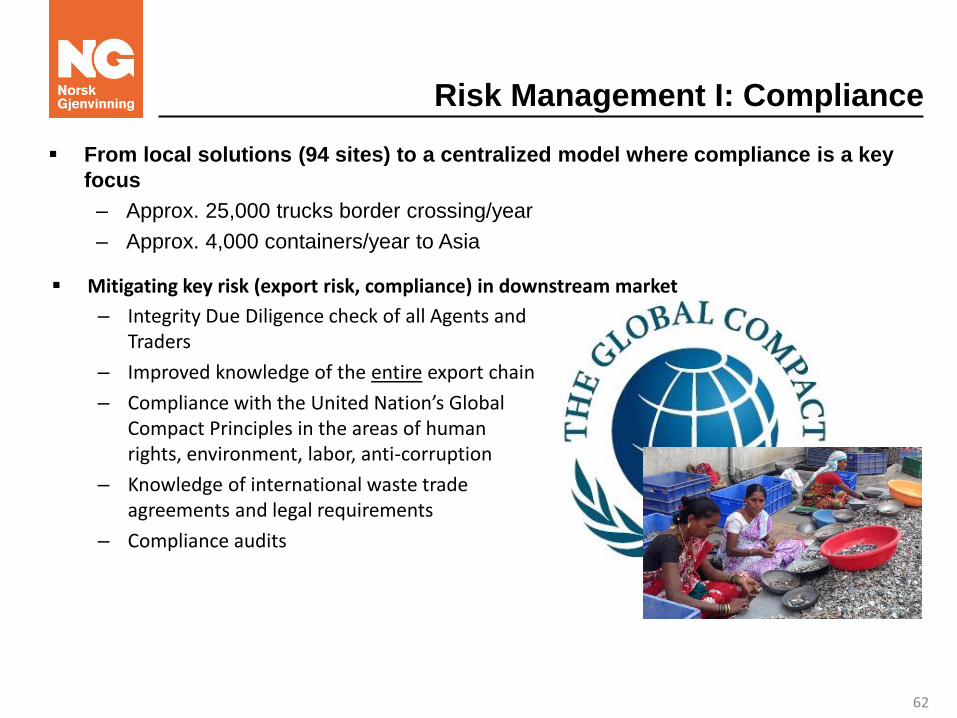
From local solutions (94 sites) to a centralized model where compliance is a key
focus
– Approx. 25,000 trucks border crossing/year
– Approx. 4,000 containers/year to Asia
Mitigating key risk (export risk, compliance) in downstream market
– Integrity Due Diligence check of all Agents and Traders
– Improved knowledge of the entire export chain
– Compliance with the United Nation’s Global Compact Principles in the areas of human rights, environment, labor, anti-corruption
– Knowledge of international waste trade agreements and legal requirements
– Compliance audits
62
Risk Management II: Margins
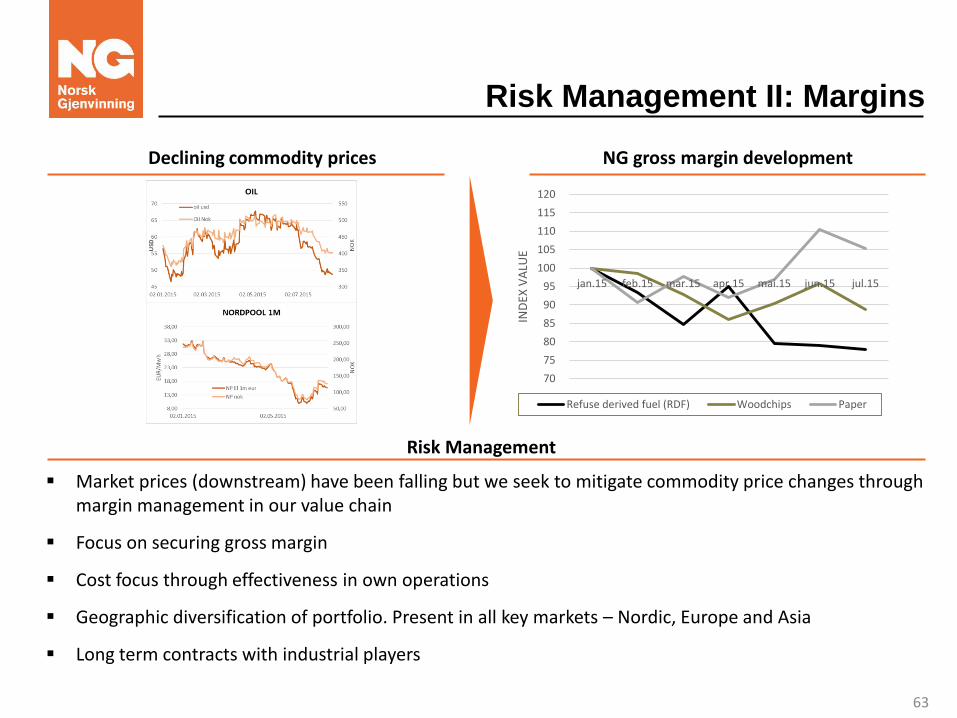
Market prices (downstream) have been falling but we seek to mitigate commodity price changes through margin management in our value chain
Focus on securing gross margin
Cost focus through effectiveness in own operations
Geographic diversification of portfolio. Present in all key markets – Nordic, Europe and Asia
Long term contracts with industrial players
Risk Management
NG gross margin development Declining commodity prices
70
75
80
85
90
95
100
105
110
115
120
jan.15 feb.15 mar.15 apr.15 mai.15 jun.15 jul.15
IND
EX V
ALU
E
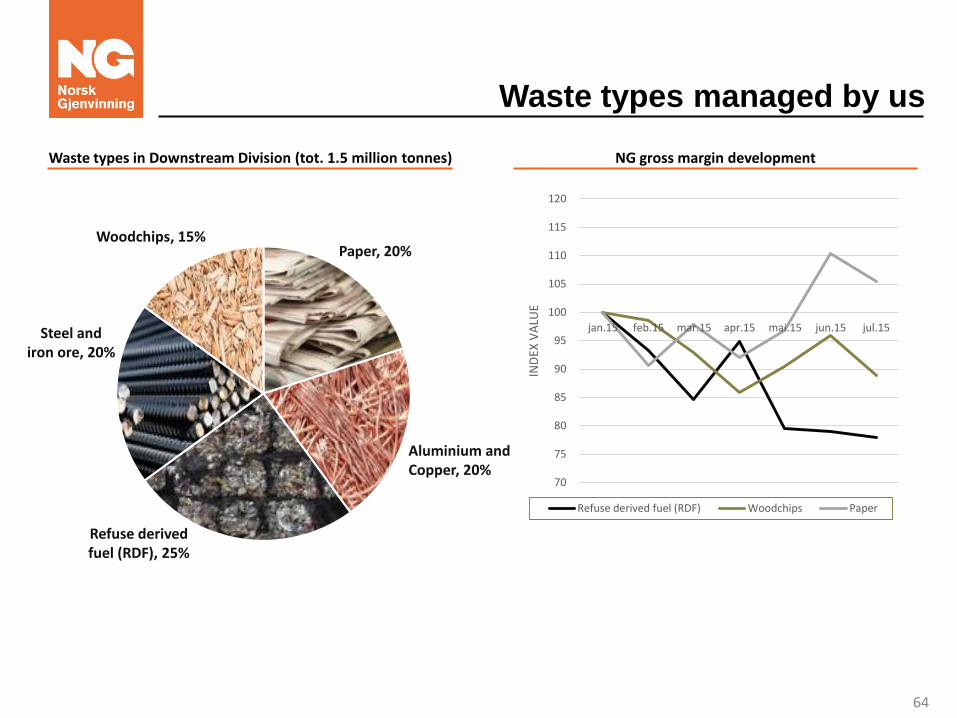
Refuse derived fuel (RDF) Woodchips Paper
63
Waste types managed by us
Waste types in Downstream Division (tot. 1.5 million tonnes) NG gross margin development
70
75
80
85
90
95
100
105
110
115
120
jan.15 feb.15 mar.15 apr.15 mai.15 jun.15 jul.15
IND
EX V
ALU
E
Refuse derived fuel (RDF) Woodchips Paper
Refuse derived fuel (RDF), 25%
Aluminium and Copper, 20%
Paper, 20% Woodchips, 15%
Steel and iron ore, 20%
64
Refuse derived fuel (RDF), challenging market
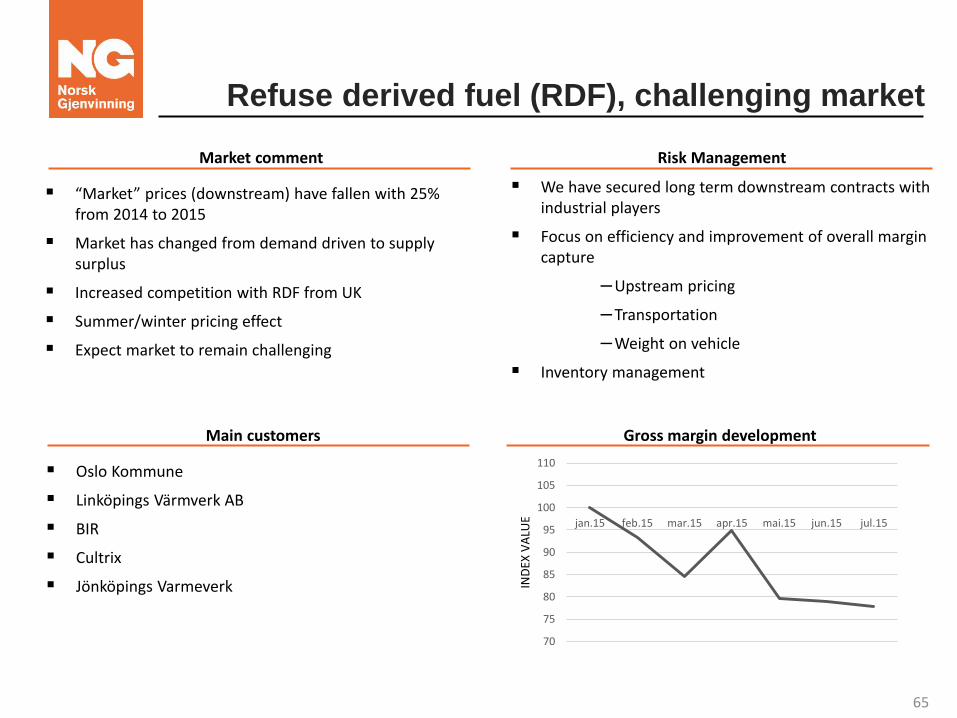
Oslo Kommune
Linköpings Värmverk AB
BIR
Cultrix
Jönköpings Varmeverk
We have secured long term downstream contracts with industrial players
Focus on efficiency and improvement of overall margin capture
–Upstream pricing
–Transportation
–Weight on vehicle
Inventory management
“Market” prices (downstream) have fallen with 25% from 2014 to 2015
Market has changed from demand driven to supply surplus
Increased competition with RDF from UK
Summer/winter pricing effect
Expect market to remain challenging
Market comment
Main customers
Risk Management
Gross margin development
70
75
80
85
90
95
100
105
110
jan.15 feb.15 mar.15 apr.15 mai.15 jun.15 jul.15IN
DEX
VA
LUE
65
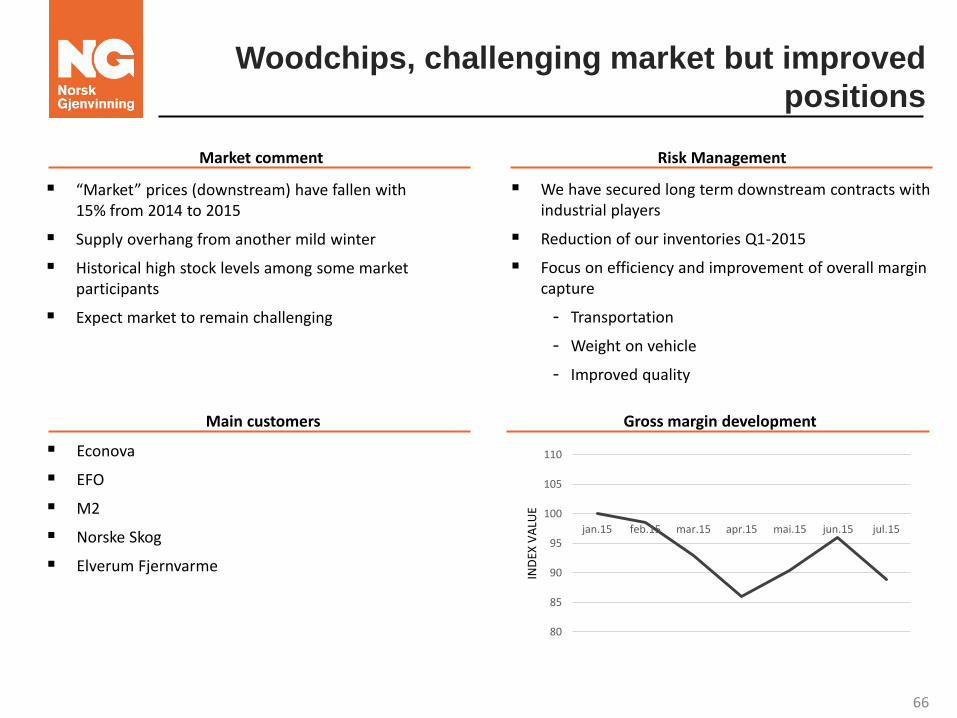
Woodchips, challenging market but improved
positions
Econova
EFO
M2
Norske Skog
Elverum Fjernvarme
We have secured long term downstream contracts with industrial players
Reduction of our inventories Q1-2015
Focus on efficiency and improvement of overall margin capture
- Transportation
- Weight on vehicle
- Improved quality
Market comment
Main customers
Risk Management
Gross margin development
“Market” prices (downstream) have fallen with 15% from 2014 to 2015
Supply overhang from another mild winter
Historical high stock levels among some market participants
Expect market to remain challenging
80
85
90
95
100
105
110
jan.15 feb.15 mar.15 apr.15 mai.15 jun.15 jul.15IN
DEX
VA
LUE
66
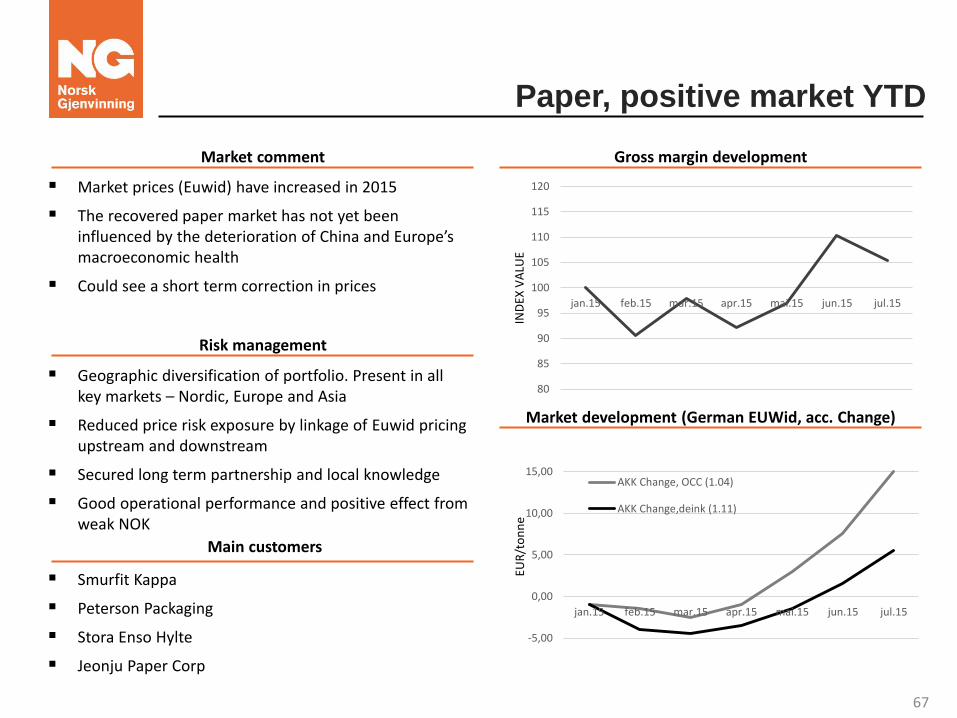
Paper, positive market YTD
Market comment
Main customers
Smurfit Kappa
Peterson Packaging
Stora Enso Hylte
Jeonju Paper Corp
Geographic diversification of portfolio. Present in all key markets – Nordic, Europe and Asia
Reduced price risk exposure by linkage of Euwid pricing upstream and downstream
Secured long term partnership and local knowledge
Good operational performance and positive effect from weak NOK
Market prices (Euwid) have increased in 2015
The recovered paper market has not yet been influenced by the deterioration of China and Europe’s macroeconomic health
Could see a short term correction in prices
Risk management
Gross margin development
Market development (German EUWid, acc. Change)
80
85
90
95
100
105
110
115
120
jan.15 feb.15 mar.15 apr.15 mai.15 jun.15 jul.15
IND
EX V
ALU
E
-5,00
0,00
5,00
10,00
15,00
jan.15 feb.15 mar.15 apr.15 mai.15 jun.15 jul.15
EUR
/to
nn
e
AKK Change, OCC (1.04)
AKK Change,deink (1.11)
67
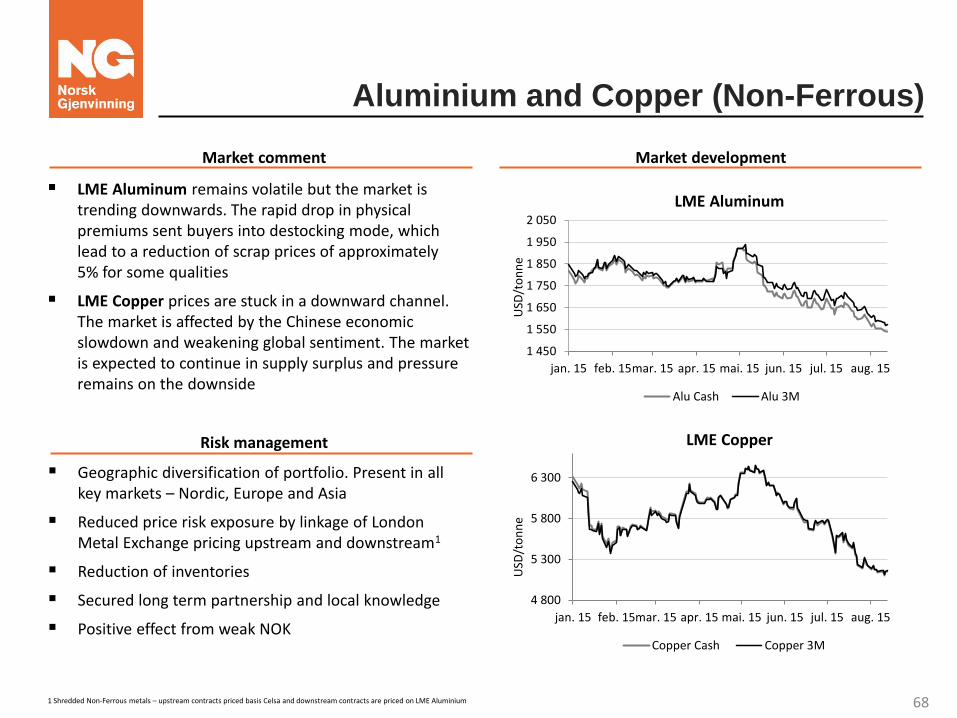
Aluminium and Copper (Non-Ferrous)
Market comment Market development
Risk management
Geographic diversification of portfolio. Present in all key markets – Nordic, Europe and Asia
Reduced price risk exposure by linkage of London Metal Exchange pricing upstream and downstream1
Reduction of inventories
Secured long term partnership and local knowledge
Positive effect from weak NOK
1 450
1 550
1 650
1 750
1 850
1 950
2 050
jan. 15 feb. 15mar. 15 apr. 15 mai. 15 jun. 15 jul. 15 aug. 15
Alu Cash Alu 3M
4 800
5 300
5 800
6 300
jan. 15 feb. 15mar. 15 apr. 15 mai. 15 jun. 15 jul. 15 aug. 15
Copper Cash Copper 3M
LME Aluminum
LME Copper
USD
/to
nn
e U
SD/t
on
ne
1 Shredded Non-Ferrous metals – upstream contracts priced basis Celsa and downstream contracts are priced on LME Aluminium
LME Aluminum remains volatile but the market is trending downwards. The rapid drop in physical premiums sent buyers into destocking mode, which lead to a reduction of scrap prices of approximately 5% for some qualities
LME Copper prices are stuck in a downward channel. The market is affected by the Chinese economic slowdown and weakening global sentiment. The market is expected to continue in supply surplus and pressure remains on the downside
68
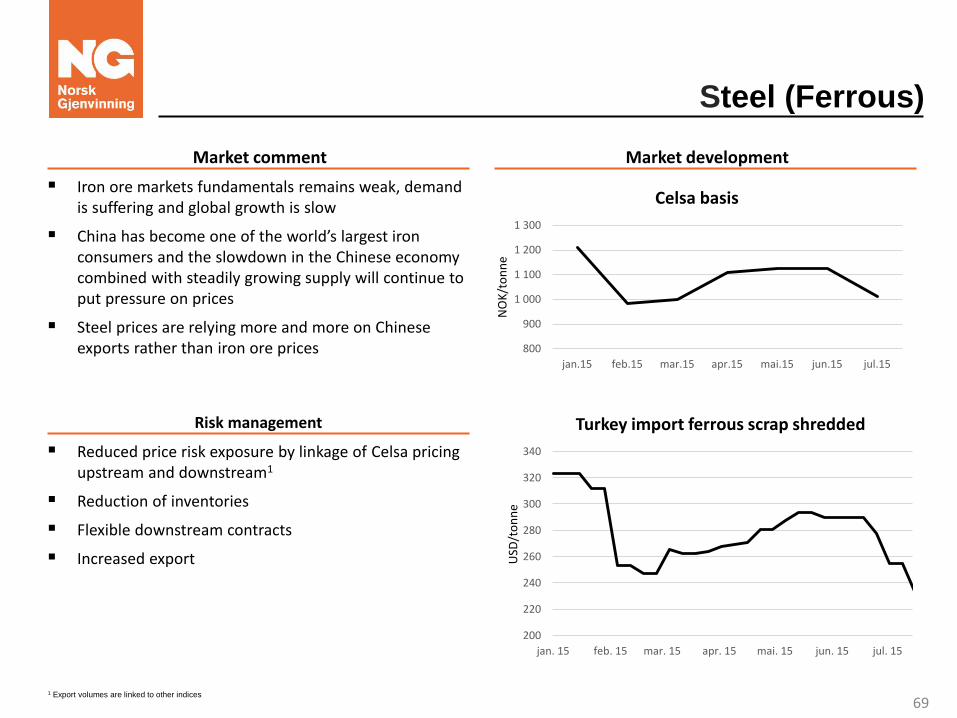
Steel (Ferrous)
Market comment Market development
Risk management
Reduced price risk exposure by linkage of Celsa pricing upstream and downstream1
Reduction of inventories
Flexible downstream contracts
Increased export
800
900
1 000
1 100
1 200
1 300
jan.15 feb.15 mar.15 apr.15 mai.15 jun.15 jul.15
NO
K/t
on
ne
Celsa basis
1 Export volumes are linked to other indices
Iron ore markets fundamentals remains weak, demand is suffering and global growth is slow
China has become one of the world’s largest iron consumers and the slowdown in the Chinese economy combined with steadily growing supply will continue to put pressure on prices
Steel prices are relying more and more on Chinese exports rather than iron ore prices
USD
/to
nn
e
200
220
240
260
280
300
320
340
jan. 15 feb. 15 mar. 15 apr. 15 mai. 15 jun. 15 jul. 15
Turkey import ferrous scrap shredded
69
NG holds a key to a global issue – the
world needs more raw materials
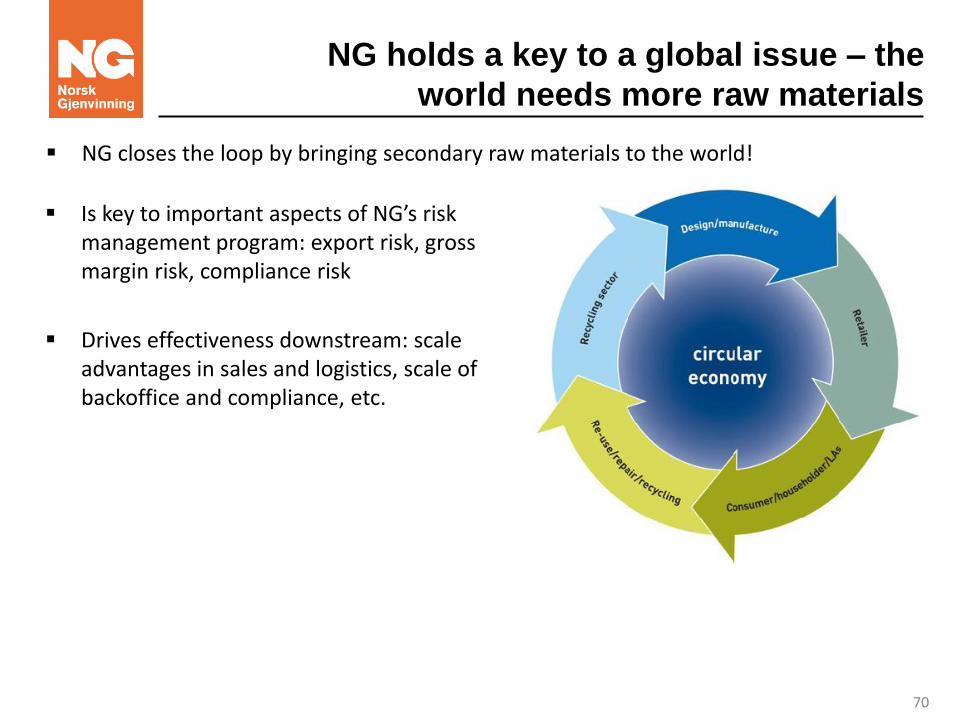
NG closes the loop by bringing secondary raw materials to the world!
Is key to important aspects of NG’s risk management program: export risk, gross margin risk, compliance risk
Drives effectiveness downstream: scale advantages in sales and logistics, scale of backoffice and compliance, etc.
70
71
Appendix
72
Reconciliation of EBITDA to adjusted EBITDA for the
periods indicated in the presentation
2011 2012 2013 2014 2014 2015
Pro forma
Consolidated Consolidated Consolidated Consolidated Consolidated Consolidated
(NOK in millions) unaudited unaudited audited audited unaudited unaudited
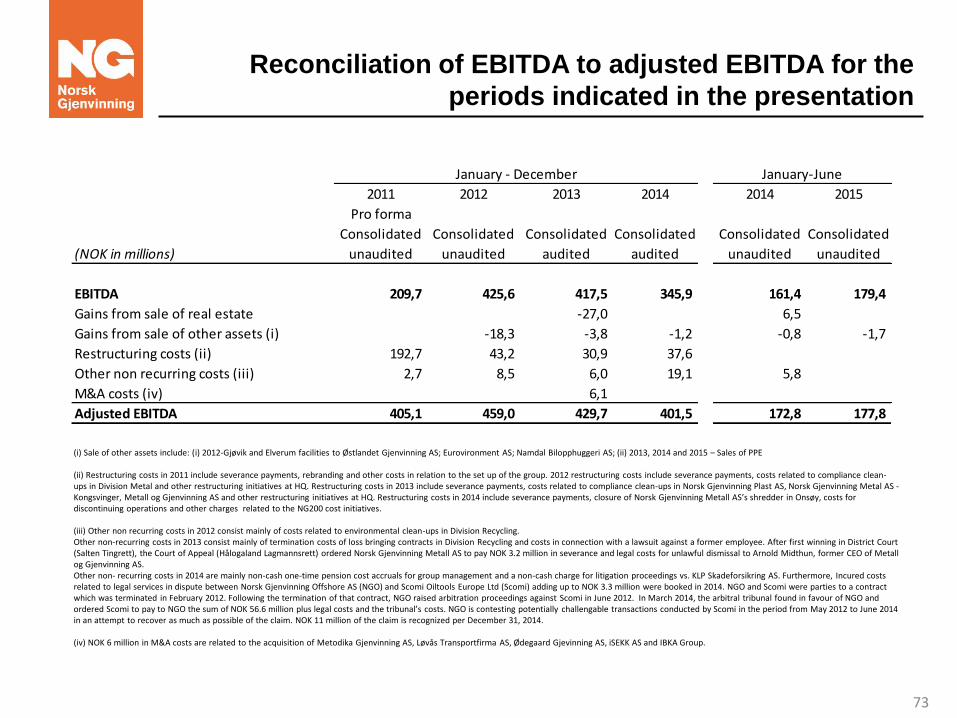
EBITDA 209,7 425,6 417,5 345,9 161,4 179,4
Gains from sale of real estate -27,0 6,5
Gains from sale of other assets (i) -18,3 -3,8 -1,2 -0,8 -1,7
Restructuring costs (ii) 192,7 43,2 30,9 37,6
Other non recurring costs (iii) 2,7 8,5 6,0 19,1 5,8
M&A costs (iv) 6,1
Adjusted EBITDA 405,1 459,0 429,7 401,5 172,8 177,8
January - December January-June
(i) Sale of other assets include: (i) 2012-Gjøvik and Elverum facilities to Østlandet Gjenvinning AS; Eurovironment AS; Namdal Bilopphuggeri AS; (ii) 2013, 2014 and 2015 – Sales of PPE
(ii) Restructuring costs in 2011 include severance payments, rebranding and other costs in relation to the set up of the group. 2012 restructuring costs include severance payments, costs related to compliance clean-ups in Division Metal and other restructuring initiatives at HQ. Restructuring costs in 2013 include severance payments, costs related to compliance clean-ups in Norsk Gjenvinning Plast AS, Norsk Gjenvinning Metal AS - Kongsvinger, Metall og Gjenvinning AS and other restructuring initiatives at HQ. Restructuring costs in 2014 include severance payments, closure of Norsk Gjenvinning Metall AS’s shredder in Onsøy, costs for discontinuing operations and other charges related to the NG200 cost initiatives. (iii) Other non recurring costs in 2012 consist mainly of costs related to environmental clean-ups in Division Recycling. Other non-recurring costs in 2013 consist mainly of termination costs of loss bringing contracts in Division Recycling and costs in connection with a lawsuit against a former employee. After first winning in District Court (Salten Tingrett), the Court of Appeal (Hålogaland Lagmannsrett) ordered Norsk Gjenvinning Metall AS to pay NOK 3.2 million in severance and legal costs for unlawful dismissal to Arnold Midthun, former CEO of Metall og Gjenvinning AS. Other non- recurring costs in 2014 are mainly non-cash one-time pension cost accruals for group management and a non-cash charge for litigation proceedings vs. KLP Skadeforsikring AS. Furthermore, Incured costs related to legal services in dispute between Norsk Gjenvinning Offshore AS (NGO) and Scomi Oiltools Europe Ltd (Scomi) adding up to NOK 3.3 million were booked in 2014. NGO and Scomi were parties to a contract which was terminated in February 2012. Following the termination of that contract, NGO raised arbitration proceedings against Scomi in June 2012. In March 2014, the arbitral tribunal found in favour of NGO and ordered Scomi to pay to NGO the sum of NOK 56.6 million plus legal costs and the tribunal’s costs. NGO is contesting potentially challengable transactions conducted by Scomi in the period from May 2012 to June 2014 in an attempt to recover as much as possible of the claim. NOK 11 million of the claim is recognized per December 31, 2014. (iv) NOK 6 million in M&A costs are related to the acquisition of Metodika Gjenvinning AS, Løvås Transportfirma AS, Ødegaard Gjevinning AS, iSEKK AS and IBKA Group.
73
74


![Survey and Inspection Reports for Stone in Europe[080910-150910]](https://img.pdfslide.net/doc/110x75/551e3c5f497959cf398b46ff/survey-and-inspection-reports-for-stone-in-europe080910-150910.jpg)