Embed Size (px)
DESCRIPTION
Presentation on data centre, IT, Cloud opportunities in the Netherlands highlighting connectivity, security, tax climate and companies already there
Citation preview

Source: NL Agency
The Netherlands:The Digital Gateway to Europe
IOF Dining Club 14 June 2012 GUOMAN Tower Hotel London
‘Connectivity & Security in a Big Data World’
Organised by: Arena InternationalIn association with: Netherlands Foreign Investment Agency

IOF Dining Club 14 June 2012
Introduction: Netherlands Foreign Investment Agency (NFIA) NFIA UK & Ireland: support from A to Z The Netherlands: facts & figures Why the Netherlands: location factors for datacentres
1. The Dutch business environment2. ICT market overview3. Connectivity4. Cyber security5. Energy supply 6. Talent - IT workforce7. Tax - Fiscal climate

NFIA Worldwide
The Hague London Istanbul New York Boston
Tokyo Osaka Seoul Taipei Shanghai Beijing Guangzhou Hong Kong Singapore Kuala Lumpur New Delhi Sao Paolo
Atlanta Chicago San Francisco Dubai Tel Aviv
NFIA services
Netherlands Foreign Investment AgencySupport from A to Z
1. in-person meetings and provide up-to-date, personalized information
2. personal guidance regarding site selection in a customized fact-finding trip
3. contacts with relevant business partners, government authorities, a variety of Dutch networks and service suppliers
4. advocacy towards national and EU governments

The Netherlands
Area: 16,000 sq miles
Population: 16.7 million
Currency: Euro (€)
Capital: Amsterdam
Three major international airports are within a 125 mile radius - Amsterdam Schiphol Airport, Brussels Airport and Airport Dusseldorf International
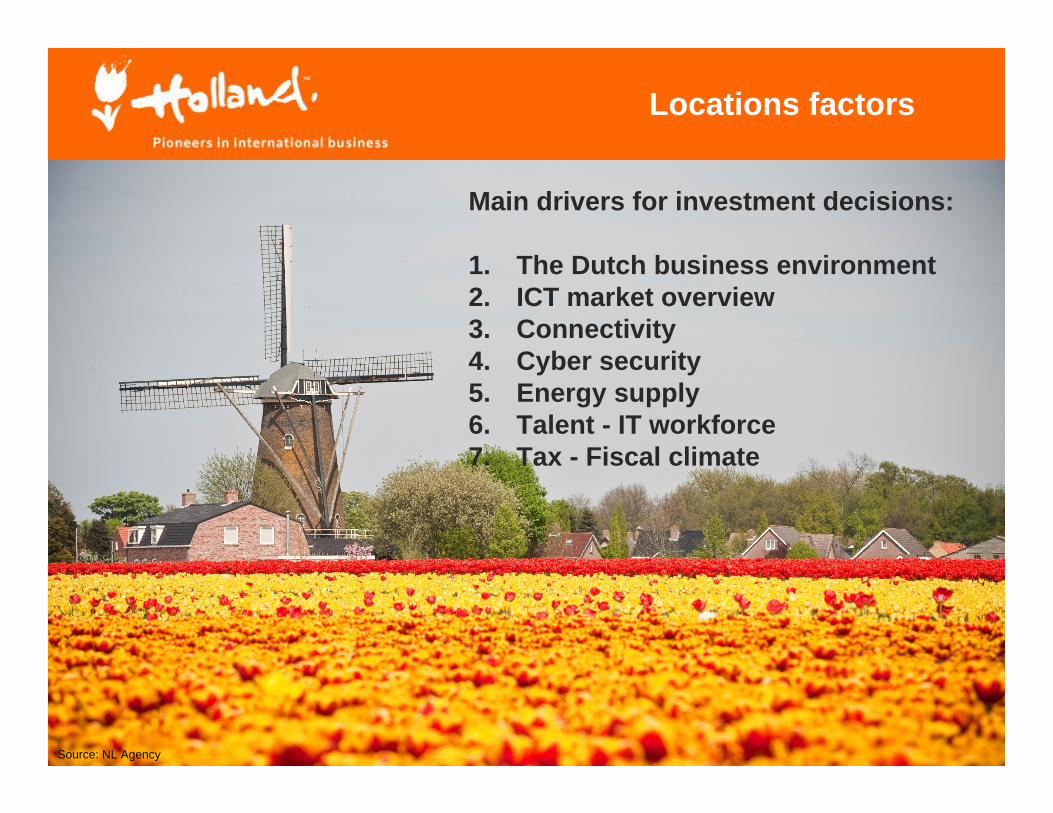
Locations factors
The Dutch business environment
Source: NL Agency
Main drivers for investment decisions:
1. The Dutch business environment2. ICT market overview3. Connectivity4. Cyber security5. Energy supply 6. Talent - IT workforce7. Tax - Fiscal climate

The Dutch business environment
#3 Human Development Report of best countries in which to live in
#4 United Nations World Happiness Report
#11 IMD's World Competitiveness Rankings 2012 (from #14)
#2 Bloomberg: best countries to business in
#6 WEF The Global Information Technology Report 2012
#1 Akamai's ranking of countries with fastest internet connections 2011

ICT Market Overview
ICT industry main driver for Dutch economic growth
Worth €55 billion and will grow with approximately 2.6% each year till 2015
70% of innovation in the Netherlands is ICT related
60% of all Forbes 2000 companies active in ICT have already established an office in the Amsterdam Area, including world players such as Microsoft, Google, Cisco, Tata, IBM, Oracle, Capgemini, Zarafa, Infosys
Cloud industry 15% of Dutch Industry (2012), increase to 19% in 2013
The Netherlands: one of the most advanced ICT markets in the world

The Dutch Digital Environment
Second highest bandwidth speed High number of internet users Broadband internet subscribers Domain name registrations ‘Openness’ of ICT Creative industry Chips ‘Light touch’ telecoms policy Broadband deployment Social Media
Key areas that make up the Dutch Digital Environment

Datacenter market overview
“Numerous big-name international businesses have operations in Amsterdam itself or in the vicinity of the capital.” (2011)
Increasing demand for data center services 33% of the European data centers Large quantity of empty buildings More than 6,300 foreign companies
with almost 9000 operations

Connectivity
Source: NL Agency
“One of the most network-rich countries in the world, the Netherlands has direct access to several submarine communication cable systems delivering low-latency links to other European nations, North America and beyond.”(2012)

Connectivity
Source: Akamai Technologies, 2012
Average Measured Connection Speed Europe
Rank Country Average Mbps (Q3, 2011)1 The
Netherlands8.5
2 Switzerland 7.53 Czech Republic 7.34 Ireland 7.05 Romania 6.66 Denmark 6.37 Norway 6.28 Belgium 6.29 Hungary 5.910 Finland 5.711 Slovakia 5.512 Austria 5.413 Sweden 5.314 Germany 5.315 Portugal 5.116 United Kingdom 5.117 Poland 4.318 Spain 4.019 Italy 4.020 France 3.821 Turkey 2.9
“The presence of AMS-IX, the largest Internet exchange in
Europe, makes Amsterdam an important hub for the networks
serving the continent. We are known as the gateway of
Europe.” (2012)

Regional Datacenter opportunities in the Netherlands
Connectivity
Latency between regional locations and Amsterdam Internet Exchange
The advantages of being in another area other than Amsterdam:
• Lower cost in general (including personnel costs)
• More building space (cheaper to build)• The same connectivity capabilities as
Amsterdam• Relatively low latency as the distances
are minimal

Latency overview to other European countries
Connectivity
Based on the distance traveled, a 4.9 microsecond latency per kilometer (0.62 mile)

Cyber security
0.00
1.00
2.00
3.00
4.00
5.00
6.00
7.00
8.00
9.00
10.00Cyber security is being adequately addressed by corporations
Executive Opinion Survey:10 = strongly agree0 = strongly disagree
Source: IMD Competitiveness Yearbook, 2009
Security awareness in Europe

Energy Supply
Source: Energizing the Future
"The choice was essentially between London and Amsterdam, but London is pretty full and... there is no power; in Amsterdam there is plenty of power. We found it is much more economically beneficial to build in Amsterdam.” (2012)

Energy Supply
National 5 major electricity generating companies ‘Transmission System Operator’ is ‘TenneT,
fully owned by the central government
Regional 30 regional and local energy distribution
companies Regional network operations Distribution
System Operators (such as Liander, Stedinand Enexis) connect customers to the grid and provide the transport of electricity
The Netherlands has one of the most reliable and stable energy grids of Europe
“The average availability of the energy grid over
the last five years accounted to 99,9943%”
(2011)

KyotoCooling Datacenter Infra Solutions Optimair Menerga Air@workWKO
Sustainability
Examples of cooling systems and techniques available in the Netherlands
“At EvoSwitch, we are carbon neutral – not because we have to be but because it pays to be in the Netherlands.” (2012)
“Hitachi’s most energy efficient data center is in The Netherlands. This site is a showcase of technologies for energy efficient data centers throughout Europe, made possible in the Dutch technology environment”(2010)

The Netherlands has one of the lowest energy price in the European Union (Per 100kWh)
Energy Cost
Source: Eurostat, November 2011
€

IT Workforce
Source: ASML Netherlands B.V.

One of the highest productivity rates in the world
IT Workforce
Source: The Conference Board and Groningen Growth and Development Centre, 2012 (GDP per hour in US dollars 2011)

English language proficiency in Europe
Score Country Level
69.09 Norway Very High Proficiency
67.93 The Netherlands Very High Proficiency
66.58 Denmark Very High Proficiency
66.26 Sweden Very High Proficiency
61.25 Finland Very High Proficiency
58.58 Austria High Proficiency
57.23 Belgium High Proficiency
56.64 Germany High Proficiency
54.62 Poland Moderate Proficiency
54.6 Switzerland Moderate Proficiency
53.16 Portugal Moderate Proficiency
53.16 France Moderate Proficiency
49.05 Italy Low Proficiency
49.01 Spain Low Proficiency
IT Workforce
Multilingual and highly educated workforce
Source: EF EPI Ranking, 2011
“The Netherlands offers a number of clear advantages, including a high level of education and in-depth technical knowledge, linguistic aptitude and the multinational trade spirit of the Dutch.” (2011)
Source: Hans Kouwenhoven

Fiscal climate
Source: OECD, 2011
Corporate tax rates in Europe Rank Country Tax rate 20121 Ireland 12.50%2 The Netherlands 20.00% - 25.00%3 Finland 24.50%4 Austria 25.00%5 Denmark 25.00%6 United Kingdom 26.00%7 Sweden 26.30%8 Italy 27.50%9 Norway 28.00%10 Spain 30.00%11 Germany 22.825% - 33.325%12 Belgium 33.00%13 France 33.33%
Advance Tax Ruling (ATR)/ Advance Pricing Agreement (APA)
Extensive tax treaty network
R&D fiscal policy:- WBSO- Innovation Box- RDA
EIA
30% ruling
“The ‘30 percent ruling’ is a powerful recruiting tool that allows the company to pay less for global talent.“(2010)
“The Netherlands is well organized business-wise, especially regarding taxes.” (2008)

Questions?
Thank you!Dank voor uw aandacht!
Desiree [email protected], +44 (0)79 7085 4563
NFIA UK & Ireland - Embassy of the Kingdom of the Netherlands
www.nfia.co.ukwww.nfia.co.uk