Embed Size (px)
Citation preview

Presentation to Presentation to the Canadian Home Builders’ Associationthe Canadian Home Builders’ Association

MethodologyMethodology
Corporate Connection: Twice-yearly syndicated telephone survey of CEOs and senior executives Focuses on current corporate and public affairs issues
Fieldwork: Fall 2007 wave: Oct. 18 to Nov. 23, 2007
Survey of 400 senior business executives Findings accurate to within +/- 5%, 19 times out of 20
Mix of small (50 empl. or less), medium (50-99), and large firms (100+)
Results weighted by size, sector & region to reflect actual distribution of firms across Canada (according to Statistics Canada’s Business Register)

Fall 2007Fall 2007

PositionPosition(unweighted data)
8
3
3
6
7
14
15
45
0 10 20 30 40 50
Other
Manager
CFO/COO
VP (various)
Director
Owner
GeneralManager
President/CEO
Percentage
Phoenix SPI; Corporate Connection - Fall 2007

Number of Full-Time Employees Number of Full-Time Employees (unweighted data)
12
16
14
15
16
18
9
0 10 20 30
Under 5
5-19
20-49
50-99
100-199
200-499
500 and over
Percentage
DK/NR = 1%Phoenix SPI; Corporate Connection - Fall 2007

Sector Sector (unweighted data)
1122
44
55
67
89
1014
15
0 5 10 15 20
OtherReal estate/renting & leasing
Arts, entertainment, recreationConstruction
Prof., scientific, tech.Finance & insurance
Trans. & warehousingAdmin. support/waste mgnt.
Wholesale tradeAccom. & food servicesHealth care/social asst.
RetailMining/oil/gasManufacturing
Percentage
Phoenix SPI; Corporate Connection - Fall 2007
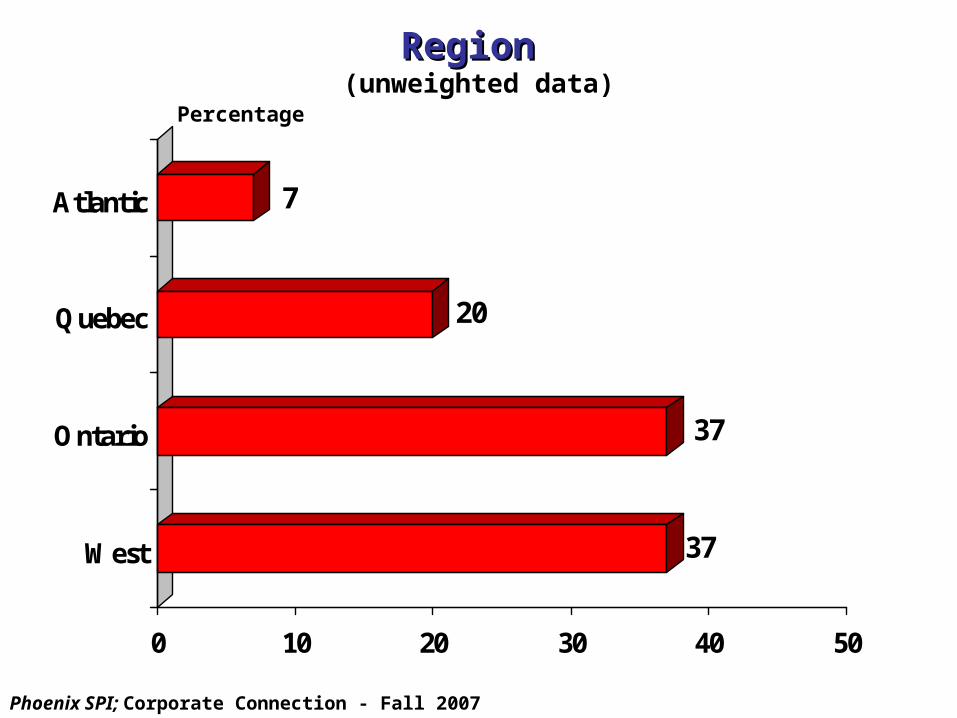
Region Region (unweighted data)
37
37
20
7
0 10 20 30 40 50
West
Ontario
Quebec
Atlantic
Percentage
Phoenix SPI; Corporate Connection - Fall 2007

Most Important Issue Facing CanadaMost Important Issue Facing Canada
25222
233333
4444
77
88
16
0 10 20 30
O therUS Trade disputes
Decline in manufacturing/resource relianceClimate changeGlobal economy
High cost of l ivingTerorism/security
Unemployment/lack of jobsWar in Afghanistan/Iraq
Economic sustainability/developmentGovernment debt/deficits
Labour shortageCdn. competitiveness
Economic issues (not specific)Environmental issues
Health careTaxes
Education/lack of skilled workers Level of Canadian dollar
Percentage
Q: In your view, what is the most important issue or challenge facing the country at this time?
DK/NR= 5% Phoenix SPI; Corporate Connection - Fall 2007

Most Important Issue Facing CanadaMost Important Issue Facing Canada (Over Time) (Over Time)
% choosing issue as most important
32
16
01
6
12
20
13
2
7
12
19
12
2
13
6
10
5 7
14
7
32
8
9
5
00
5
10
15
20
25
Fall '04 Spring '05 Fall '05 Spring '06 Fall '06 Spring '07 Fall '07
Health Care Dollar
Education/skilled workers Environment*
Percentage
*Incl. climate change in fall ‘06, spring ’07, fall ‘07Phoenix SPI; Corporate Connection - Fall 2007
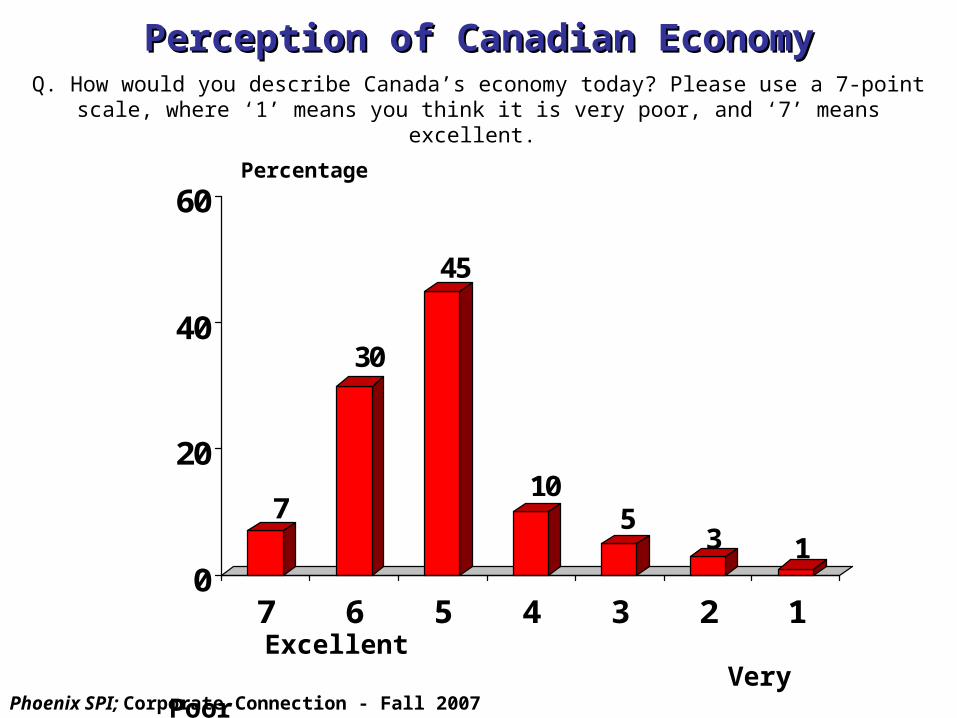
Perception of Canadian EconomyPerception of Canadian Economy
7
30
45
105
3 10
20
40
60
7 6 5 4 3 2 1
Percentage
Excellent Very Poor
Q. How would you describe Canada’s economy today? Please use a 7-point scale, where ‘1’ means you think it is very poor, and ‘7’ means excellent.
Phoenix SPI; Corporate Connection - Fall 2007

Economic OutlookEconomic Outlook
26 30 25 11 6
26 40 22 8 3
41 35 15 5 3
0 20 40 60 80 100
Sector
Economy
Company
7-6 5 4 3 2-1
Percentage
(7-point scale: 7 = excellent, 1 = very poor)
DK/NR= 2% or less
Q. Looking ahead two to three years, how would you describe the outlook for...?
Phoenix SPI; Corporate Connection - Fall 2007
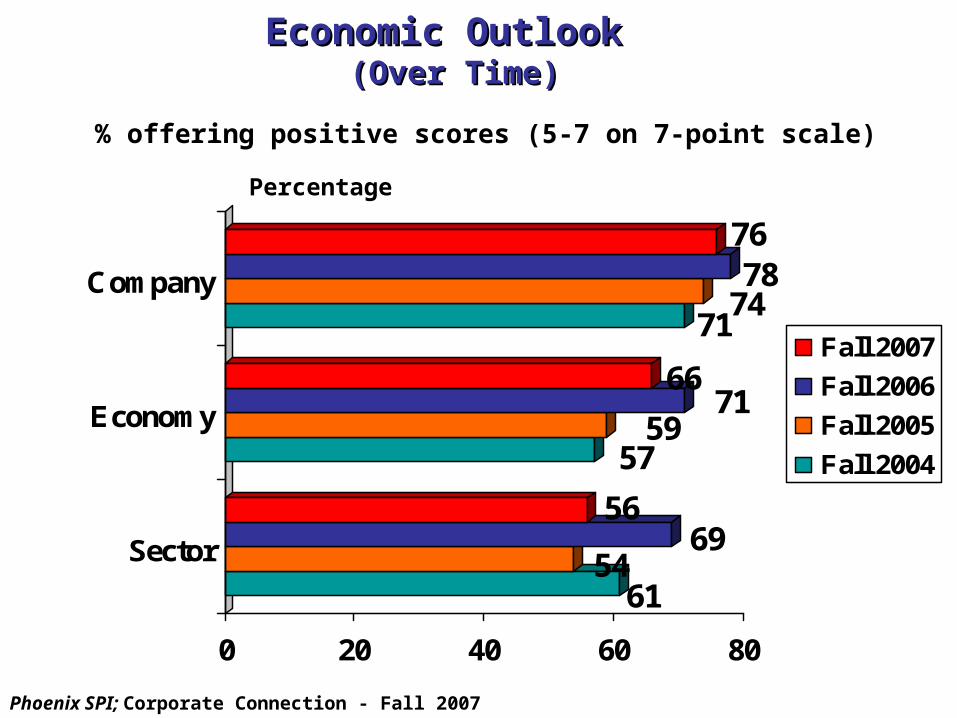
Economic Outlook Economic Outlook (Over Time)(Over Time)
6154
6956
5759
7166
717478
76
0 20 40 60 80
Sector
Economy
Company
Fall 2007
Fall 2006
Fall 2005
Fall 2004
Percentage
% offering positive scores (5-7 on 7-point scale)
Phoenix SPI; Corporate Connection - Fall 2007

Preferred Preferred PrioritiesPriorities of Federal Government of Federal Government
DK/NR = 1% or less
30 24 20 12 14
29 31 12 16 12
44 25 16 6 8
45 26 11 13 5
49 23 15 7 6
47 27 18 6 1
47 27 8 8 950 25 15 6 5
53 22 13 5 6
59 20 10 7 3
59 24 8 6 3
65 20 8 5 1
0 20 40 60 80 100
Foreign takeovers
Unemployment
Reduce govt. debt
Taxation
Science & technology
Cda.'s physical infrastructure
Reduce regs and paper burden
Promote Cdn. productivity
Positive bus. environment
Environment
Manage natural resources
Health care
7-6 5 4 3 2-1
Percentage
Q. What priority do you think the Government of Canada should place on each of the following?
(7-point scale: 7 = Highest, 1 = Lowest)
Phoenix SPI; Corporate Connection - Fall 2007
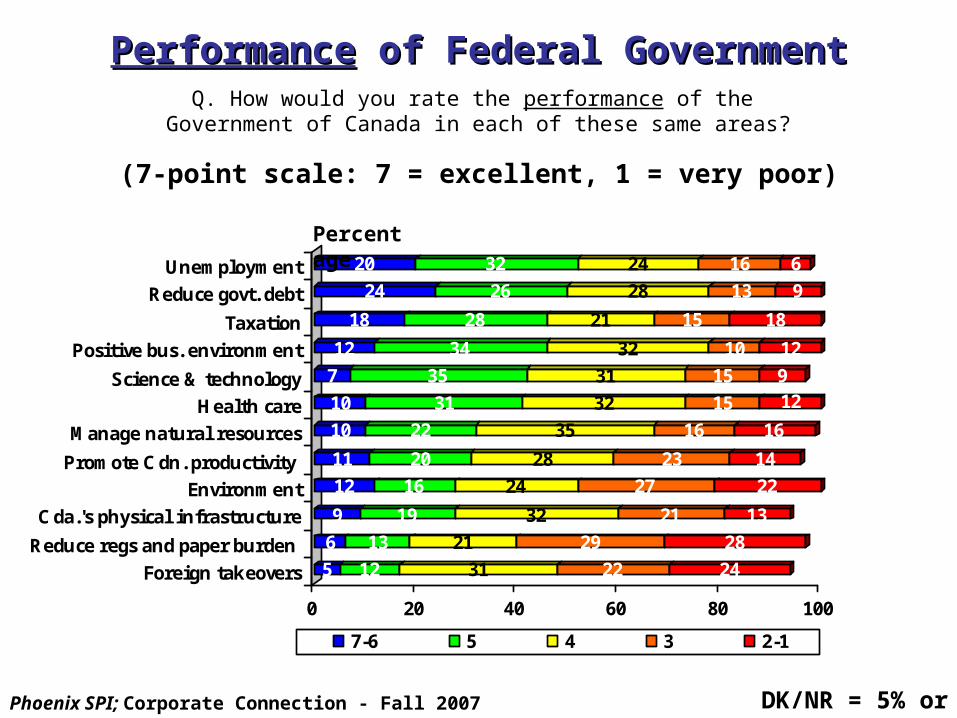
PerformancePerformance of Federal Government of Federal Government
DK/NR = 5% or less
5 12 31 22 24
6 13 21 29 28
9 19 32 21 13
12 16 24 27 22
11 20 28 23 14
10 22 35 16 16
10 31 32 15 127 35 31 15 9
12 34 32 10 12
18 28 21 15 18
24 26 28 13 9
20 32 24 16 6
0 20 40 60 80 100
Foreign takeovers
Reduce regs and paper burden
Cda.'s physical infrastructure
Environment
Promote Cdn. productivity
Manage natural resources
Health care
Science & technology
Positive bus. environment
Taxation
Reduce govt. debt
Unemployment
7-6 5 4 3 2-1
(7-point scale: 7 = excellent, 1 = very poor)
Percentage
Q. How would you rate the performance of the Government of Canada in each of these same areas?
Phoenix SPI; Corporate Connection - Fall 2007

Preferred Priorities vs. Perceived Performance of Federal Govt.Preferred Priorities vs. Perceived Performance of Federal Govt.
Priority%
Performance%
Gap +/-
Reduce regs./paper burden 74 19 -55
Managing natural resources 83 32 -51
Environment 79 28 -51
Cda’s physical infrastructure 74 28 -46
Health care 85 41 -44
Promote business productivity 75 34 -41
Foreign takeovers 54 17 -37
Invest in science/technology 72 42 -30
Positive business environment 75 46 -29
Taxation 71 46 -25
Reduce debt 69 50 -19
Unemployment 60 52 -8Phoenix SPI; Corporate Connection - Fall 2007

Rating of Overall Government PerformanceRating of Overall Government Performance
0
10
28
40
17
41
0
10
20
30
40
50
7 6 5 4 3 2 1
Percentage
Excellent Very Poor
Q: How would you rate the overall performance of the Government of Canada? Once again, please use a 7-point scale where ‘1’ means very poor and ‘7’ means excellent.
Phoenix SPI; Corporate Connection - Fall 2007

Rating of Overall Government PerformanceRating of Overall Government Performance(Over Time)(Over Time)
Percentage
31 21 23
5541 51
3830
5645
2427
2224
010203040506070
Fall'04
Spring'05
Fall'05
Spring'06
Fall'06
Spring'07
Fall'07
Positive (Scores 5-7) Negative (Scores 1-3)
Phoenix SPI; Corporate Connection - Fall 2007
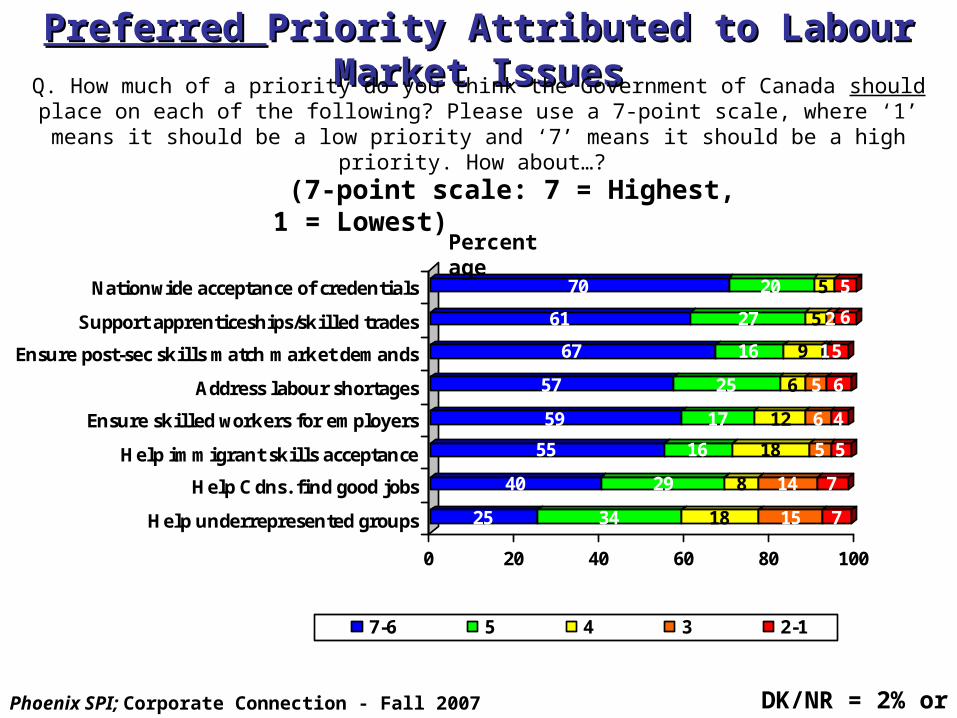
Preferred Preferred Priority Attributed to Labour Market IssuesPriority Attributed to Labour Market Issues
DK/NR = 2% or less
25 34 18 15 7
40 29 8 14 7
55 16 18 5 5
59 17 12 6 4
57 25 6 5 6
67 16 9 1 5
61 27 5 2 6
70 20 5 5
0 20 40 60 80 100
Help underrepresented groups
Help Cdns. find good jobs
Help immigrant skills acceptance
Ensure skilled workers for employers
Address labour shortages
Ensure post-sec skills match market demands
Support apprenticeships/skilled trades
Nationwide acceptance of credentials
7-6 5 4 3 2-1
Percentage
Q. How much of a priority do you think the Government of Canada should place on each of the following? Please use a 7-point scale, where ‘1’ means it should be a low priority and ‘7’ means it
should be a high priority. How about…?
(7-point scale: 7 = Highest, 1 = Lowest)
Phoenix SPI; Corporate Connection - Fall 2007

Perceived Perceived Performance of Government of Canada on Labour Performance of Government of Canada on Labour Market IssuesMarket Issues
DK/NR = 2% or less
5 14 34 16 27
7 12 26 29 25
5 16 20 25 33
10 13 28 22 23
3 22 31 23 18
5 22 24 24 21
7 23 29 28 12
7 25 29 17 17
0 20 40 60 80 100
Ensure skilled workers for employers
Address labour shortages
Help immigrant skills acceptance
Nationwide acceptance of credentials
Help Cdns. find good jobs
Ensure post-sec skills match market demands
Support apprenticeships/skilled trades
Help underrepresented groups
7-6 5 4 3 2-1
Percentage
Q. Now I’d like to ask you how satisfied you are with the performance of the federal government on these same issues. Again, please use a 7-point scale, where ‘1’ means extremely dissatisfied and 7
means extremely satisfied. How about…?
(7-point scale: 7 = Extremely satisfied, 1 = Extremely dissatisfied)
Phoenix SPI; Corporate Connection - Fall 2007

Priority vs. Performance of Government of Canada on Priority vs. Performance of Government of Canada on Labour Market Issues Labour Market Issues
(scores of 5-7)(scores of 5-7)
Priority
%
Satisfied
%
Gap +/-
Nationwide acceptance of credentials 90 23 -67
Address labour shortages 82 19 -63
Support apprenticeships/skilled trades
88 30 -58
Ensure skilled workers for employers
76 19 -57
Ensure post-sec skills match market demands
83 27 -56
Help immigrant skills acceptance 71 21 -50
Help Cdns. find good jobs 69 25 -44
Help underrepresented groups 59 32 -27
Phoenix SPI; Corporate Connection - Fall 2007

Spring 2007Spring 2007

Priority Government Should Place on Labour Issues Priority Government Should Place on Labour Issues Related to Related to Advantage CanadaAdvantage Canada
32 26 20 16 6
59 22 12 5 2
73 19 6 11
0 20 40 60 80 100
Quantity ofworkers
Efficiency/mobilityof labour force
Quality of labourforce
7-6 5 4 3 2-1
Percentage
(7-point scale: 7 = Highest, 1 = Lowest)
DK/NR = 1% or less
Q: The labour market component of Advantage Canada focuses on three areas – labour quantity, labour quality and labour market efficiency. As an employer, what priority would you like to see placed on government action in
each of these three areas?
Phoenix SPI; Corporate Connection - Spring 2007
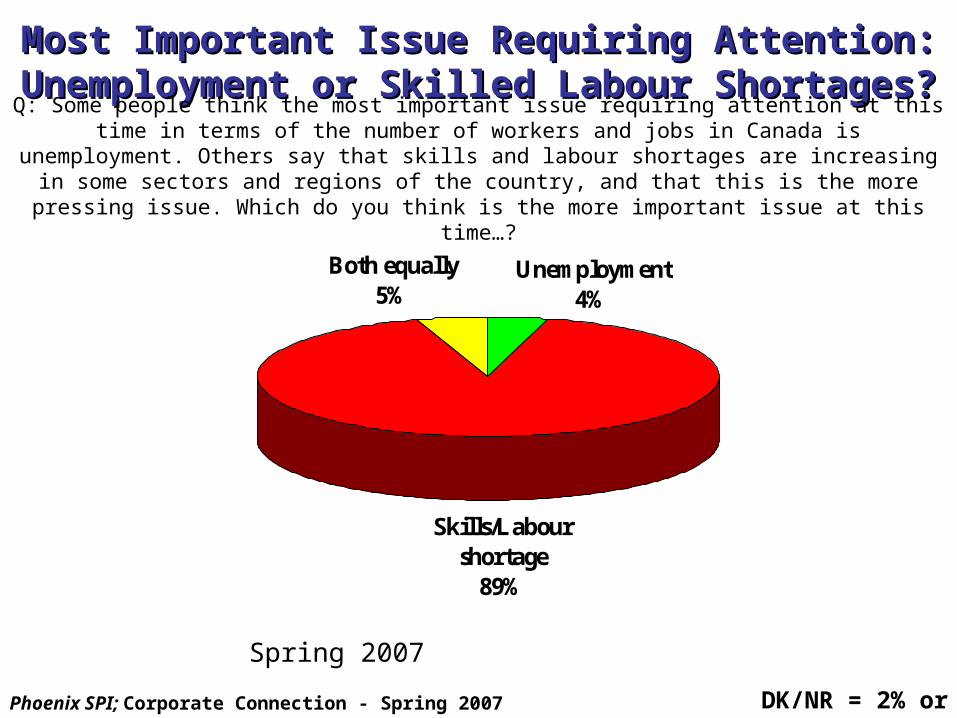
Most Important Issue Requiring Attention: Most Important Issue Requiring Attention: Unemployment or Skilled Labour Shortages?Unemployment or Skilled Labour Shortages?
Skills/Labour shortage
89%
Both equally5%
Unemployment4%
Q: Some people think the most important issue requiring attention at this time in terms of the number of workers and jobs in Canada is unemployment. Others say that skills and labour
shortages are increasing in some sectors and regions of the country, and that this is the more pressing issue. Which do you think is the more important issue at this time…?
DK/NR = 2% or less
Spring 2007
Phoenix SPI; Corporate Connection - Spring 2007
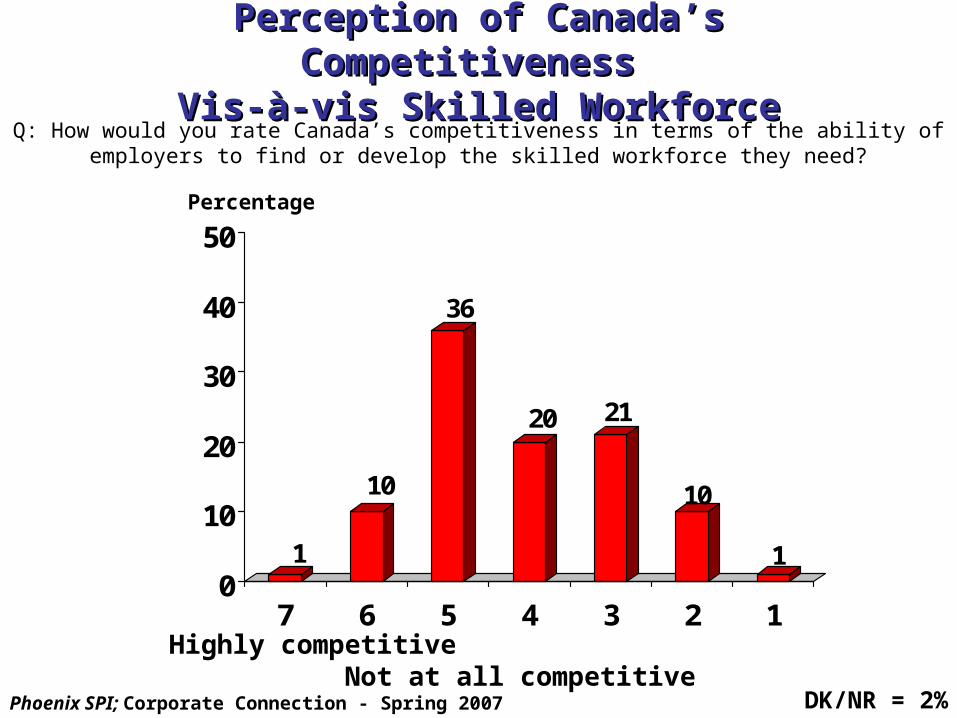
Perception of Canada’s Competitiveness Perception of Canada’s Competitiveness Vis-à-vis Skilled WorkforceVis-à-vis Skilled Workforce
1
10
36
20 21
10
10
10
20
30
40
50
7 6 5 4 3 2 1
Percentage
Highly competitive Not at all competitive
DK/NR = 2%
Q: How would you rate Canada’s competitiveness in terms of the ability of employers to find or develop the skilled workforce they need?
Phoenix SPI; Corporate Connection - Spring 2007

Percentage
Highly competitive Not at all competitive
13
1011
3636
20
15
2122
10 10
1 10
10
20
30
40
7 6 5 4 3 2 1
Spring '07Spring '06
Perception of Canada’s Competitiveness Perception of Canada’s Competitiveness Vis-à-vis Skilled WorkforceVis-à-vis Skilled Workforce
(Over Time)(Over Time)
Phoenix SPI; Corporate Connection - Spring 2007

Is Is YourYour Company Experiencing Labour Shortage? Company Experiencing Labour Shortage?
36
26
20
18
0 10 20 30 40
DK/NR = 1%
Percentage
No shortage
Small shortage
Moderate shortage
Significant shortage
Q: At the present time, would you say your company is experiencing a significant labour shortage, a moderate shortage, a small shortage, or no shortage at all?
Phoenix SPI; Corporate Connection - Spring 2007

Is Is YourYour Company Experiencing Labour Shortage? Company Experiencing Labour Shortage?(Over Time)(Over Time)
2836
2226
2320
2618
0 10 20 30 40
Spring '07
Spring '06
Percentage
No shortage
Small shortage
Moderate shortage
Significant shortage
Phoenix SPI; Corporate Connection - Spring 2007

Concern About Future Impact of Labour ShortagesConcern About Future Impact of Labour Shortages
8
17
37
37
0 10 20 30 40
Very concerned
Moderately
Not very
Not at all
Percentage
Q: Looking ahead 5-10 years or so, are you concerned about the potential impact that labour or skills shortages might have on your business?
Phoenix SPI; Corporate Connection - Spring 2007

Importance of Importance of Advantage CanadaAdvantage Canada Measures to Address Measures to Address Labour Market IssuesLabour Market Issues
47 32 11 7 3
63 18 11 4 4
67 21 8 31
51 39 5 21
0 20 40 60 80 100
Help foreign workers/students educated inCda. become permanent residents
Improve student financial assistance
Strengthen PSE system
Better recognize credentials of immigrants
7-6 5 4 3 2-1
Percentage
DK/NR = 2% or less
Q: Advantage Canada, the federal government’s economic plan, identifies a number of measures to address labour market challenges facing the country. I’m going to read you a list of some of these
measures. For each one, please tell me how important you think it is…
(7-point scale: 7 = Highest, 1 = Lowest)
Phoenix SPI; Corporate Connection - Spring 2007

Importance of Importance of Advantage CanadaAdvantage Canada Measures to Address Measures to Address Labour Market Issues (Cont.)Labour Market Issues (Cont.)
39 29 17 8 6
43 32 11 6 7
53 23 13 8 3
0 20 40 60 80 100
Remove barriers forunder-represented
groups
Work incentives for low-income Cdns
Remove barriers tolabour mobility in
Canada
7-6 5 4 3 2-1
Percentage
DK/NR = 2% or less
Q: Advantage Canada identifies a number of measures to address labour market challenges facing the country. I’m going to read you a list of some of these measures. For each one, please tell me
how important you think it is…
Phoenix SPI; Corporate Connection - Spring 2007

Fall 2006Fall 2006
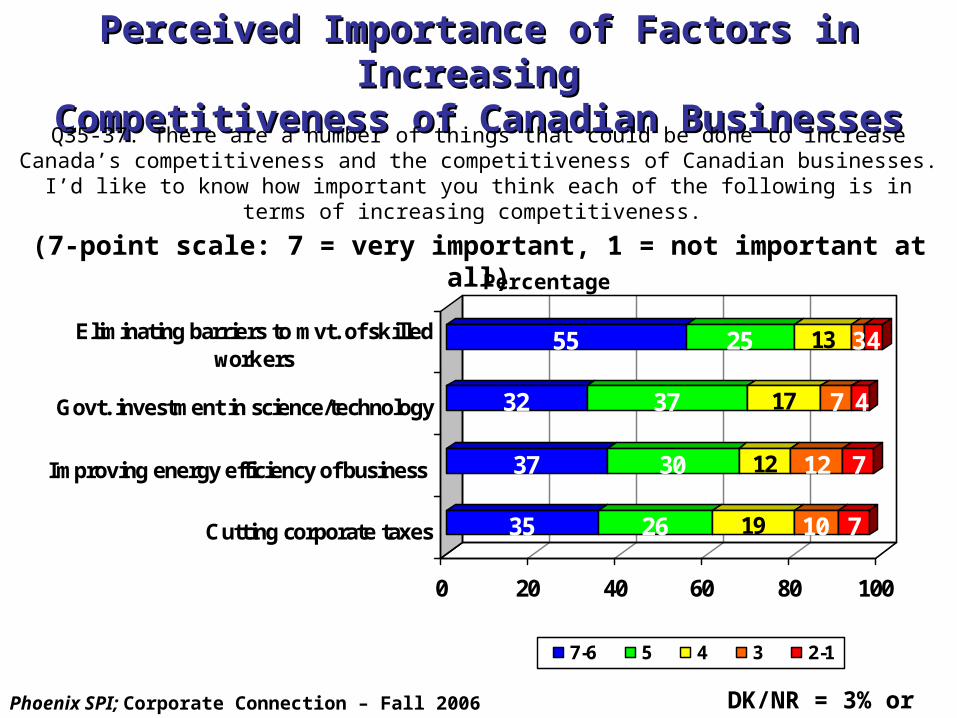
Perceived Importance of Factors in Increasing Perceived Importance of Factors in Increasing Competitiveness of Canadian BusinessesCompetitiveness of Canadian Businesses
DK/NR = 3% or less
35 26 19 10 7
37 30 12 12 7
32 37 17 7 4
55 25 13 34
0 20 40 60 80 100
Cutting corporate taxes
Improving energy efficiency of business
Govt. investment in science/technology
Eliminating barriers to mvt. of skilledworkers
7-6 5 4 3 2-1
(7-point scale: 7 = very important, 1 = not important at all)Percentage
Q35-37. There are a number of things that could be done to increase Canada’s competitiveness and the competitiveness of Canadian businesses. I’d like to know how important you think each of
the following is in terms of increasing competitiveness.
Phoenix SPI; Corporate Connection – Fall 2006

How Important is it that Regulations & Barriers How Important is it that Regulations & Barriers be Removed …?be Removed …?
54 37 53
75 23
0 20 40 60 80 100
Very important Moderately Not very Not important at all
Percentage
DK/NR =Less than 2%
… to enable skilled workers who immigrate to Canada to work in their trade or profession
… to enable skilled workers trained in Canada to work in their profession anywhere in the country
Q39-40. There are regulations and other barriers that prevent some skilled workers who immigrated to Canada from working in their trade or profession in Canada [and others]
that prevent skilled workers trained in one province from working in other provinces. How important do you think it is that such barriers be removed…
Fall 2006Phoenix SPI; Corporate Connection – Fall 2006

Importance of Removing Barriers to Skilled Importance of Removing Barriers to Skilled Workers (over time)Workers (over time)
Percentage
86
91
97
98
0 20 40 60 80 100
Removing barriersto skilled immigrant
workers
Removingprovincial barriersto Canadian skilled
workers
Fall 2006
Fall 2004
% saying that issue is moderately - very important
Fall 2006Phoenix SPI; Corporate Connection – Fall 2006

Perceptions of Employment IssuesPerceptions of Employment Issues
25 44 28
4 26 67
28 27 26 10 8
0 20 40 60 80 100
How big a problem is it?
Is government paying right amountof attention?
What will situation be like in 10years?
Employers’ investments in employees’ training and skills development
Percentage
DK/NR = 4% or less
Too much
Right amount
Not enough
7-6
5
4
2-1
3
Better
Same
Worse
(7 = very big1 = not at all)
Fall 2006Phoenix SPI; Corporate Connection – Fall 2006
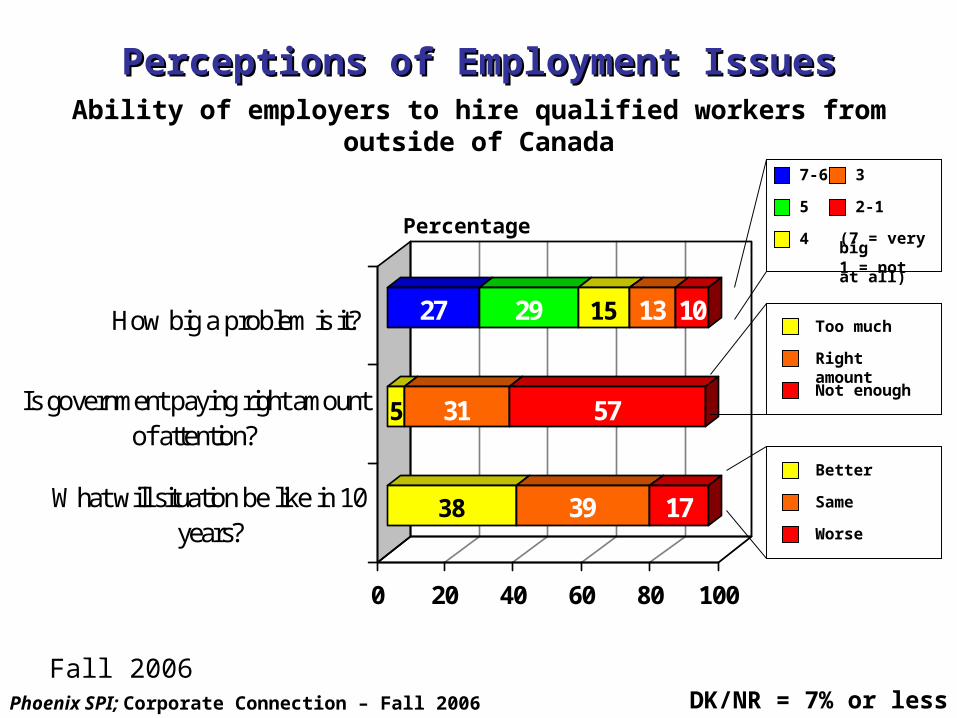
Perceptions of Employment IssuesPerceptions of Employment Issues
38 39 17
5 31 57
27 29 15 13 10
0 20 40 60 80 100
How big a problem is it?
Is government paying right amountof attention?
What will situation be like in 10years?
Ability of employers to hire qualified workers from outside of Canada
Percentage
DK/NR = 7% or less
Too much
Right amount
Not enough
7-6
5
4
2-1
3
Better
Same
Worse
(7 = very big1 = not at all)
Fall 2006Phoenix SPI; Corporate Connection – Fall 2006

Perceptions of Employment IssuesPerceptions of Employment Issues
26 37 31
1 28 67
17 36 20 18 8
0 20 40 60 80 100
How big a problem is it?
Is government paying right amountof attention?
What will situation be like in 10years?
Extent to which post-secondary ed. system meets employers’ needs
Percentage
DK/NR = 7% or less
Too much
Right amount
Not enough
7-6
5
4
2-1
3
Better
Same
Worse
(7 = very big1 = not at all)
Fall 2006Phoenix SPI; Corporate Connection – Fall 2006

Spring 2006Spring 2006

Challenges for Employers Re: Skilled WorkforceChallenges for Employers Re: Skilled Workforce
15333
44
55
799
1213
1529
0 10 20 30 40
OtherBrain drain
Aging populationKeeping employees
Growing need for knowl. workers
Employee work ethicsEconomy/industry state
Lack of skilled workersGovt. regulations/taxes
Restrictive immigration/no recog. credls.Not enough govt. support
Worker shortage
Competetiveness of wagesTraining issues/costs
Skills/education mismatch
Percentage
Multiple responses accepted
DK/NR = 6%Phoenix SPI; Corporate Connection - Spring 2006

Federal Govt. Attention to Skilled Workforce is…?Federal Govt. Attention to Skilled Workforce is…?
Not enough 74%
Too much 2%
The right amount
23%
DK/NR = 2%Phoenix SPI; Corporate Connection - Spring 2006
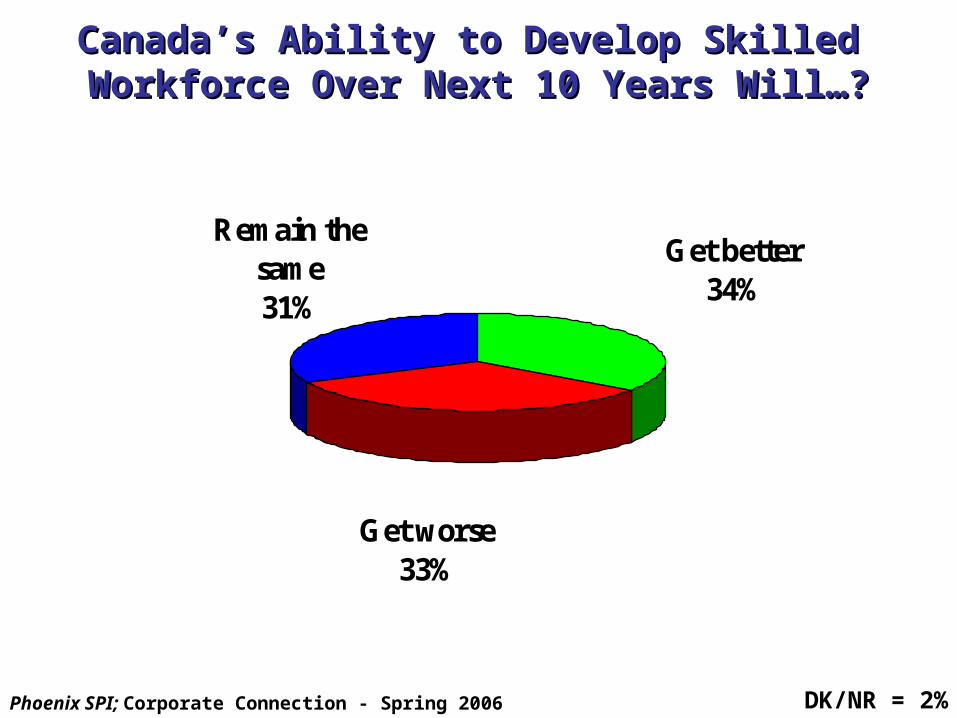
Canada’s Ability to Develop Skilled Canada’s Ability to Develop Skilled Workforce Over Next 10 Years Will…?Workforce Over Next 10 Years Will…?
Get worse 33%
Remain the same 31%
Get better 34%
DK/NR = 2%Phoenix SPI; Corporate Connection - Spring 2006

Sectors Seen as Having Greatest Labour ShortagesSectors Seen as Having Greatest Labour Shortages
17333
51212
1419
2324
28
0 10 20 30 40
Other
Retail
Tourism
Natural resources
Education/teaching
Service industry
Manufacturing
IT
Oil/gas industries
Health-care/life science/pharma.
Construction
Skilled trades
Percentage
DK/NR = 7%; multiple responses acceptedPhoenix SPI; Corporate Connection - Spring 2006