Embed Size (px)
Citation preview
C0 DATE 14/04/2013
POLANDEconomy, banking environment, infrastructure financing
Réception de la promotion de l’IHEDATE
CONTENTSPOLAND AT A GLANCE 3POLAND AT A GLANCE 3
CLIENT’S ENVIRONMENT – CEE & POLAND 6
INFRASTRUCTURE 13EXAMPLE OF INFRASTRUCTURE PROJECT A2 MOTORWAY 16EXAMPLE OF INFRASTRUCTURE PROJECT – A2 MOTORWAY 16POLISH INVESTMENTS PROGRAM 19CONCLUSIONS 29
214/04/2013
POLAND AT A GLANCEPopulation, economy….
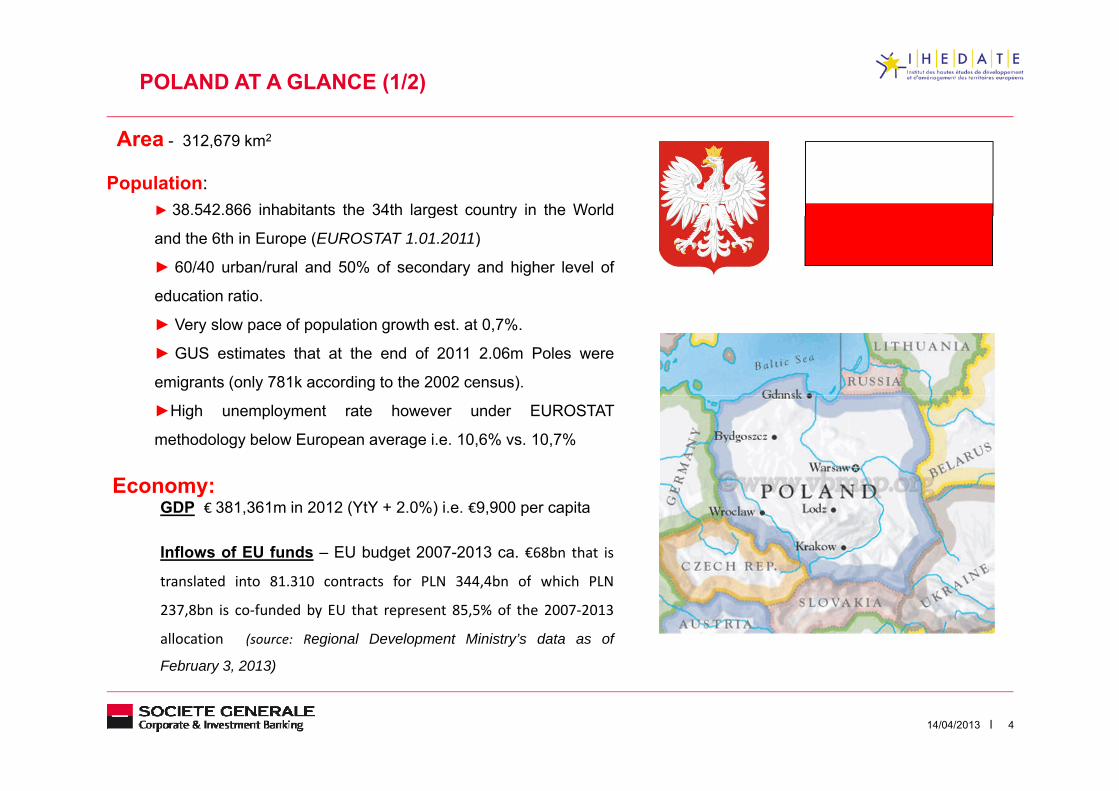
POLAND AT A GLANCE (1/2)
Population:► 38.542.866 inhabitants the 34th largest country in the World
Area - 312,679 km2
g y
and the 6th in Europe (EUROSTAT 1.01.2011)
► 60/40 urban/rural and 50% of secondary and higher level of
education ratio.
► Very slow pace of population growth est. at 0,7%.
► GUS estimates that at the end of 2011 2.06m Poles were
emigrants (only 781k according to the 2002 census).
►High unemployment rate however under EUROSTAT
methodology below European average i.e. 10,6% vs. 10,7%
Economy:Economy:GDP € 381,361m in 2012 (YtY + 2.0%) i.e. €9,900 per capita
Inflows of EU funds – EU budget 2007-2013 ca. €68bn that is
translated into 81.310 contracts for PLN 344,4bn of which PLN
237,8bn is co‐funded by EU that represent 85,5% of the 2007‐2013
allocation (source: Regional Development Ministry’s data as of
February 3 2013)
414/04/2013
February 3, 2013)
POLAND AT A GLANCE (2/2)
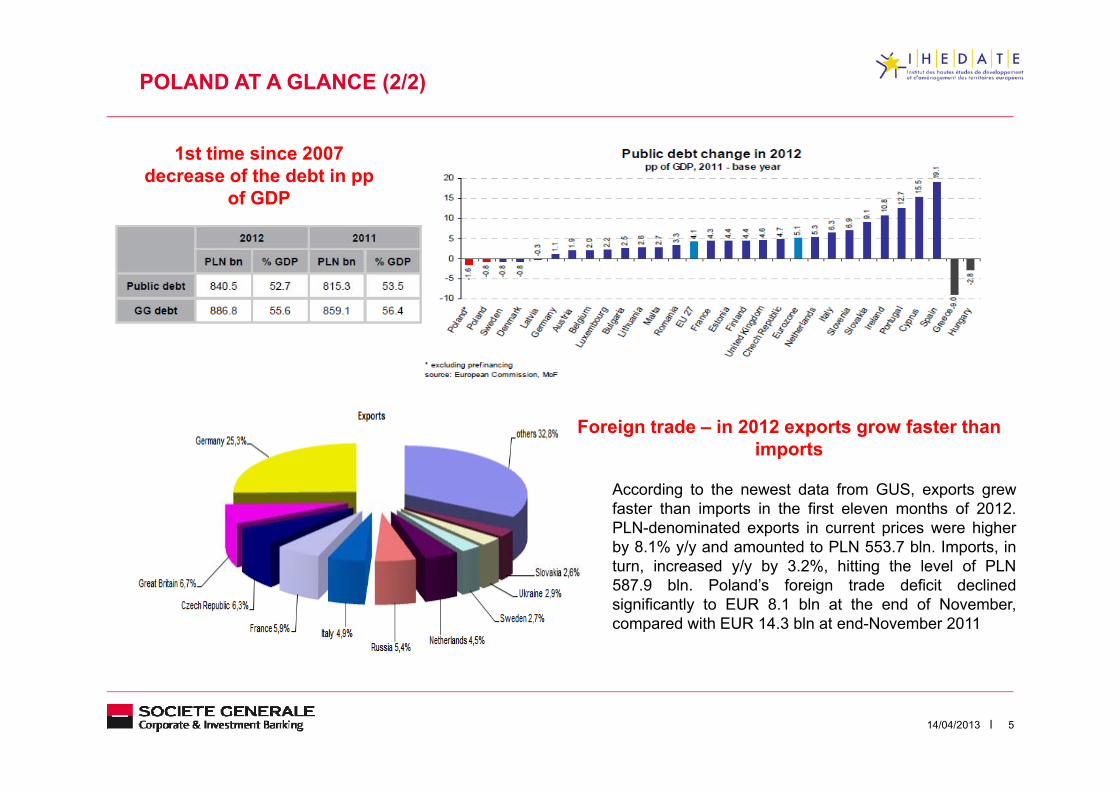
1st time since 2007 decrease of the debt in pp
of GDP
Foreign trade – in 2012 exports grow faster than imports
A di t th t d t f GUS tAccording to the newest data from GUS, exports grewfaster than imports in the first eleven months of 2012.PLN-denominated exports in current prices were higherby 8.1% y/y and amounted to PLN 553.7 bln. Imports, inturn, increased y/y by 3.2%, hitting the level of PLN587.9 bln. Poland’s foreign trade deficit declinedsignificantly to EUR 8.1 bln at the end of November,compared with EUR 14.3 bln at end-November 2011
514/04/2013

CLIENT’S ENVIRONMENTCEE & Poland
CLIENT’S ENVIRONMENT (1/6)Executive Summary
BACK
Poland is by far the largest economy in Central and Eastern Europe, excluding Russia (CEE). With 38M inhabitants, it is the mostpopulated, and 67 out the 208 largest companies in the region are located there*/ (turnover of more than €1bn in 2011, SG CIBcriteria).
Multinationals are very present in the country and represent 35 out of the 67 largest companies : this is both due to privatizations andto the large size of its domestic market which combined with low employment costs and high qualifications has attracted manyK
GROU
to the large size of its domestic market, which combined with low employment costs and high qualifications, has attracted manyinvestors from Western Europe, the USA and Asia.
With only a little bit more than 20 years of market economy, Polish companies are still much smaller than their Western Europeancounterparts (1 Polish company in the Fortune 500 vs. 9 Spanish). In addition, in spite of the restarted privatization most of the largestPolish owned companies are still state owned or controlled (all out of the top 10 are state controlled vs. all 9 Spanish from the Fortune500 are private)
ND
500 are private).
The combination of a large domestic market, lower reliance on exports and large infrastructure investments (EU funds flow of 67 bn €between 2007-2013) have helped sustain the economy. To remember that Poland was the only EU country to show positive growthduring the economic crisis, good prospects for the future in spite of the economic environment and with a budget deficit under control.
The banking market is dominated by international groups (Unicredit/Pekao SA, CitiBank/Handlowy, ING Slaski, Commerzbank/BREand Santander) with most of them active across retail, commercial and investment banking and all market segments (individuals,corporate, SME). Other competitors are: PKO BP (sole large polish bank, the largest financial institution by assets), branches ofInternational banks (SG, RBS/ABN), and Investment Banks (Goldman Sachs, Barclays, JP Morgan, UBS..). Deutsche Bank, BNPPand CA are present through a CIB operations and retail network (respectively Deutsche Bank PBC, Fortis/Dominet for BNPP andLukas for CA) however with a current tendency to merge both It remains fragmented so we do expect a further consolidation (like in
COMP Lukas for CA), however with a current tendency to merge both. It remains fragmented so we do expect a further consolidation (like in
Santander with BZWKB and KB & Raiffeisen with RZB Polska and POLBANK case)
The CIB market remains small by western standards (€129m of fees in 2011 & €112m in 2012 as per the estimates of Dealogic), verycompetitive but not yet “mature”: market is still first and foremost driven by commercial banking, there are far fewer pure “investmentbanking” transactions than in Western Europe, chiefly because of small size of polish companies and high penetration of multinationals(value added transactions done at HO level).
PETIT
A LARGE REGIONAL ECONOMY WHOSE STRUCTURE IS VERY DIFFERENT FROM THOSE OF WESTERN EUROPE;
(value added transactions done at HO level).
From 2010 we see a regain of interest coming from various global players to open dedicated IB branches in Poland (CS, GS, JPM,MS, MLBoA ..). This trend is driven by 2 main factors (i) restarted privatization program & „Polskie Inwestycje” and MoT decision towork only with locally present institutions and (ii) regaining importance of Warsaw as a regional financial centre (biggest number ofIPOs i.e. 203 in 2011 vs. 107 @ LSE and 105 in 2012 vs. 79 @ LSE).
ION
714/04/2013
A LARGE REGIONAL ECONOMY, WHOSE STRUCTURE IS VERY DIFFERENT FROM THOSE OF WESTERN EUROPE; A VERY COMPETITIVE BUT NOT YET MATURE CIB MARKET
*/ Source: Deloitte – 2012 Central Europe Top 500 ranking report.
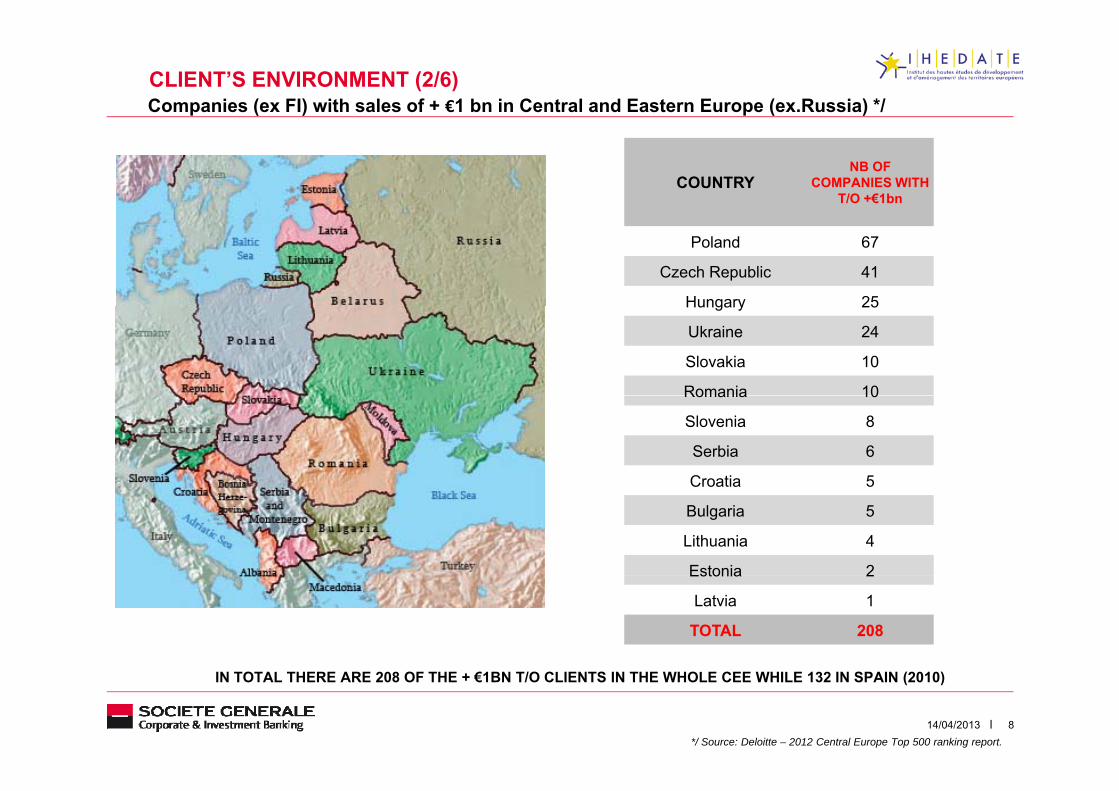
CLIENT’S ENVIRONMENT (2/6)Companies (ex FI) with sales of + €1 bn in Central and Eastern Europe (ex.Russia) */
COUNTRYNB OF
COMPANIES WITH T/O +€1bn
Poland 67
Czech Republic 41
Hungary 25Hungary 25
Ukraine 24
Slovakia 10
Romania 10Romania 10
Slovenia 8
Serbia 6
Croatia 5Croatia 5
Bulgaria 5
Lithuania 4
Estonia 2Estonia 2
Latvia 1
TOTAL 208
814/04/2013*/ Source: Deloitte – 2012 Central Europe Top 500 ranking report.
IN TOTAL THERE ARE 208 OF THE + €1BN T/O CLIENTS IN THE WHOLE CEE WHILE 132 IN SPAIN (2010)
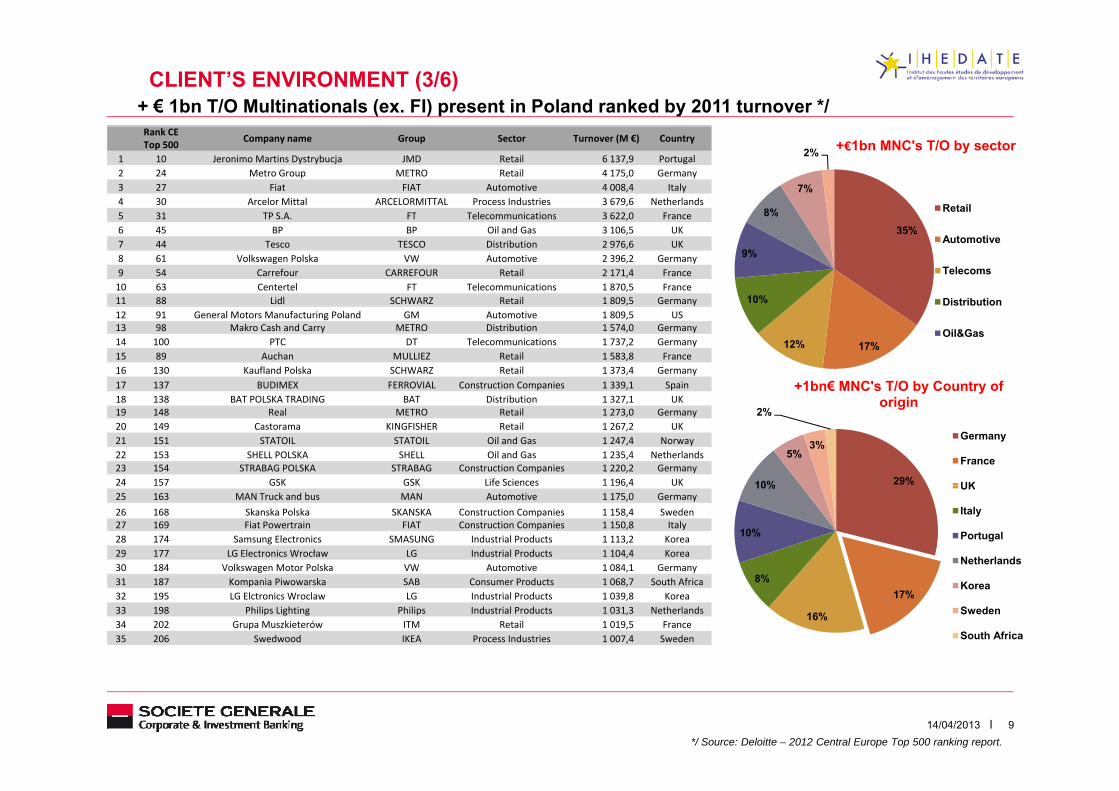
CLIENT’S ENVIRONMENT (3/6)+ € 1bn T/O Multinationals (ex. FI) present in Poland ranked by 2011 turnover */
8%
7%
2% +€1bn MNC's T/O by sector
Retail
Rank CE Top 500 Company name Group Sector Turnover (M €) Country
1 10 Jeronimo Martins Dystrybucja JMD Retail 6 137,9 Portugal2 24 Metro Group METRO Retail 4 175,0 Germany3 27 Fiat FIAT Automotive 4 008,4 Italy4 30 Arcelor Mittal ARCELORMITTAL Process Industries 3 679,6 Netherlands5 31 TP S A FT Telecommunications 3 622 0 France
35%
10%
9%
8%
Automotive
Telecoms
Distribution
5 31 TP S.A. FT Telecommunications 3 622,0 France6 45 BP BP Oil and Gas 3 106,5 UK7 44 Tesco TESCO Distribution 2 976,6 UK8 61 Volkswagen Polska VW Automotive 2 396,2 Germany9 54 Carrefour CARREFOUR Retail 2 171,4 France10 63 Centertel FT Telecommunications 1 870,5 France11 88 Lidl SCHWARZ Retail 1 809,5 Germany
17%12%Oil&Gas
+1bn€ MNC's T/O by Country of
y12 91 General Motors Manufacturing Poland GM Automotive 1 809,5 US13 98 Makro Cash and Carry METRO Distribution 1 574,0 Germany14 100 PTC DT Telecommunications 1 737,2 Germany15 89 Auchan MULLIEZ Retail 1 583,8 France16 130 Kaufland Polska SCHWARZ Retail 1 373,4 Germany17 137 BUDIMEX FERROVIAL Construction Companies 1 339,1 Spain
b
29%10%
5%3%
2%origin
Germany
France
UK
18 138 BAT POLSKA TRADING BAT Distribution 1 327,1 UK19 148 Real METRO Retail 1 273,0 Germany20 149 Castorama KINGFISHER Retail 1 267,2 UK21 151 STATOIL STATOIL Oil and Gas 1 247,4 Norway22 153 SHELL POLSKA SHELL Oil and Gas 1 235,4 Netherlands23 154 STRABAG POLSKA STRABAG Construction Companies 1 220,2 Germany24 157 GSK GSK Life Sciences 1 196,4 UK
8%
10%
10% UK
Italy
Portugal
Netherlands
24 157 GSK GSK Life Sciences 1 196,4 UK25 163 MAN Truck and bus MAN Automotive 1 175,0 Germany26 168 Skanska Polska SKANSKA Construction Companies 1 158,4 Sweden27 169 Fiat Powertrain FIAT Construction Companies 1 150,8 Italy28 174 Samsung Electronics SMASUNG Industrial Products 1 113,2 Korea29 177 LG Electronics Wrocław LG Industrial Products 1 104,4 Korea30 184 Volkswagen Motor Polska VW Automotive 1 084,1 Germany
17%
16%
8% Korea
Sweden
South Africa
31 187 Kompania Piwowarska SAB Consumer Products 1 068,7 South Africa32 195 LG Elctronics Wroclaw LG Industrial Products 1 039,8 Korea33 198 Philips Lighting Philips Industrial Products 1 031,3 Netherlands34 202 Grupa Muszkieterów ITM Retail 1 019,5 France35 206 Swedwood IKEA Process Industries 1 007,4 Sweden
914/04/2013*/ Source: Deloitte – 2012 Central Europe Top 500 ranking report.
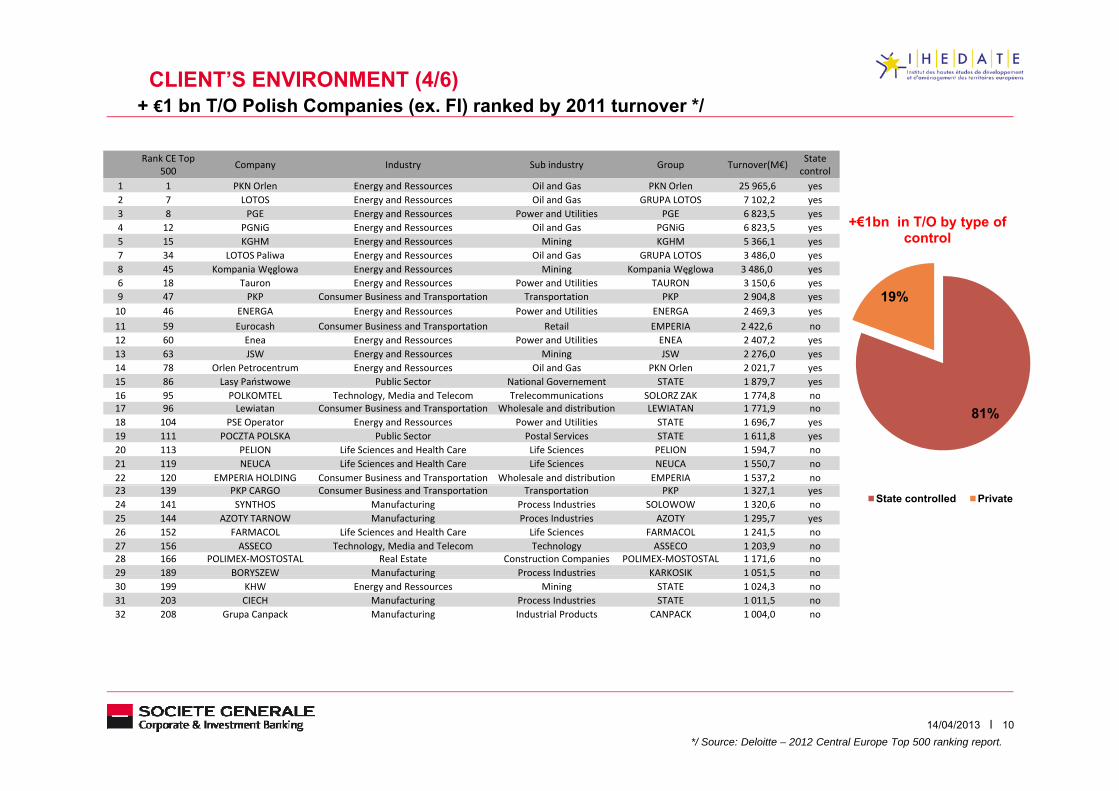
+ €1 bn T/O Polish Companies (ex. FI) ranked by 2011 turnover */CLIENT’S ENVIRONMENT (4/6)
Rank CE Top 500 Company Industry Sub industry Group Turnover(M€) State
control1 1 PKN Orlen Energy and Ressources Oil and Gas PKN Orlen 25 965,6 yes2 7 LOTOS Energy and Ressources Oil and Gas GRUPA LOTOS 7 102,2 yes3 8 PGE Energy and Ressources Power and Utilities PGE 6 823,5 yes3 8 PGE Energy and Ressources Power and Utilities PGE 6 823,5 yes4 12 PGNiG Energy and Ressources Oil and Gas PGNiG 6 823,5 yes5 15 KGHM Energy and Ressources Mining KGHM 5 366,1 yes7 34 LOTOS Paliwa Energy and Ressources Oil and Gas GRUPA LOTOS 3 486,0 yes8 45 Kompania Węglowa Energy and Ressources Mining Kompania Węglowa 3 486,0 yes6 18 Tauron Energy and Ressources Power and Utilities TAURON 3 150,6 yes9 47 PKP Consumer Business and Transportation Transportation PKP 2 904,8 yes 19%
+€1bn in T/O by type of control
10 46 ENERGA Energy and Ressources Power and Utilities ENERGA 2 469,3 yes11 59 Eurocash Consumer Business and Transportation Retail EMPERIA 2 422,6 no12 60 Enea Energy and Ressources Power and Utilities ENEA 2 407,2 yes13 63 JSW Energy and Ressources Mining JSW 2 276,0 yes14 78 Orlen Petrocentrum Energy and Ressources Oil and Gas PKN Orlen 2 021,7 yes15 86 Lasy Państwowe Public Sector National Governement STATE 1 879,7 yes16 95 POLKOMTEL Technology Media and Telecom Trelecommunications SOLORZ ZAK 1 774 8 no16 95 POLKOMTEL Technology, Media and Telecom Trelecommunications SOLORZ ZAK 1 774,8 no17 96 Lewiatan Consumer Business and Transportation Wholesale and distribution LEWIATAN 1 771,9 no18 104 PSE Operator Energy and Ressources Power and Utilities STATE 1 696,7 yes19 111 POCZTA POLSKA Public Sector Postal Services STATE 1 611,8 yes20 113 PELION Life Sciences and Health Care Life Sciences PELION 1 594,7 no21 119 NEUCA Life Sciences and Health Care Life Sciences NEUCA 1 550,7 no22 120 EMPERIA HOLDING Consumer Business and Transportation Wholesale and distribution EMPERIA 1 537,2 no
81%
23 139 PKP CARGO Consumer Business and Transportation Transportation PKP 1 327,1 yes24 141 SYNTHOS Manufacturing Process Industries SOLOWOW 1 320,6 no25 144 AZOTY TARNOW Manufacturing Proces Industries AZOTY 1 295,7 yes26 152 FARMACOL Life Sciences and Health Care Life Sciences FARMACOL 1 241,5 no27 156 ASSECO Technology, Media and Telecom Technology ASSECO 1 203,9 no28 166 POLIMEX‐MOSTOSTAL Real Estate Construction Companies POLIMEX‐MOSTOSTAL 1 171,6 no29 189 BORYSZEW Manufacturing Process Industries KARKOSIK 1 051,5 no
State controlled Private
29 189 BORYSZEW Manufacturing Process Industries KARKOSIK 1 051,5 no30 199 KHW Energy and Ressources Mining STATE 1 024,3 no31 203 CIECH Manufacturing Process Industries STATE 1 011,5 no32 208 Grupa Canpack Manufacturing Industrial Products CANPACK 1 004,0 no
1014/04/2013*/ Source: Deloitte – 2012 Central Europe Top 500 ranking report.
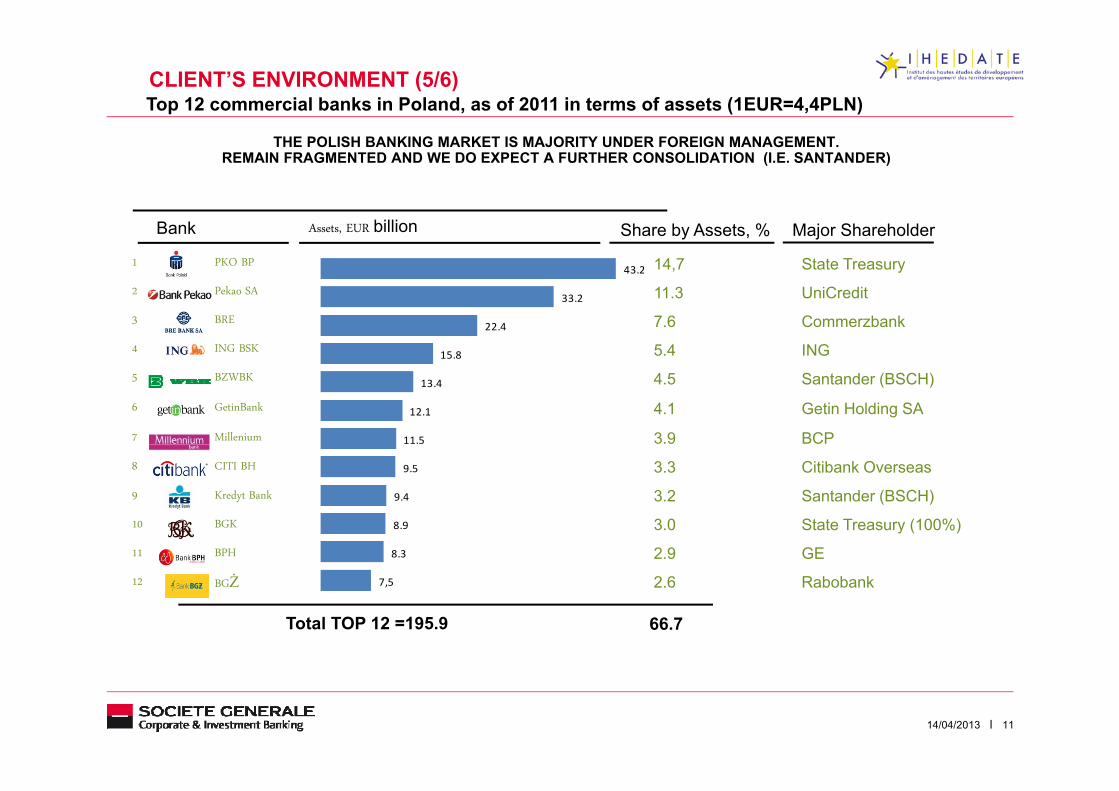
CLIENT’S ENVIRONMENT (5/6)Top 12 commercial banks in Poland, as of 2011 in terms of assets (1EUR=4,4PLN)
THE POLISH BANKING MARKET IS MAJORITY UNDER FOREIGN MANAGEMENT. REMAIN FRAGMENTED AND WE DO EXPECT A FURTHER CONSOLIDATION (I.E. SANTANDER)
Major ShareholderShare by Assets, %
1 PKO BP
2 Pekao SA33.2
43.2
Bank Assets, EUR billion
14,7 State Treasury
11.3 UniCredit3 BRE
4 ING BSK
5 BZWBK 13.4
15.8
22.4 7.6 Commerzbank
5.4 ING
4.5 Santander (BSCH)6 GetinBank
7 Millenium
8 CITI BH 9.5
11.5
12.1 4.1 Getin Holding SA
3.9 BCP
3.3 Citibank Overseas9 Kredyt Bank
10 BGK
11 BPH
Ż
8.3
8.9
9.4 3.2 Santander (BSCH)
3.0 State Treasury (100%)
2.9 GE12 BGŻ 7,5
Total TOP 12 =195.9
2.6 Rabobank
66.7
1114/04/2013
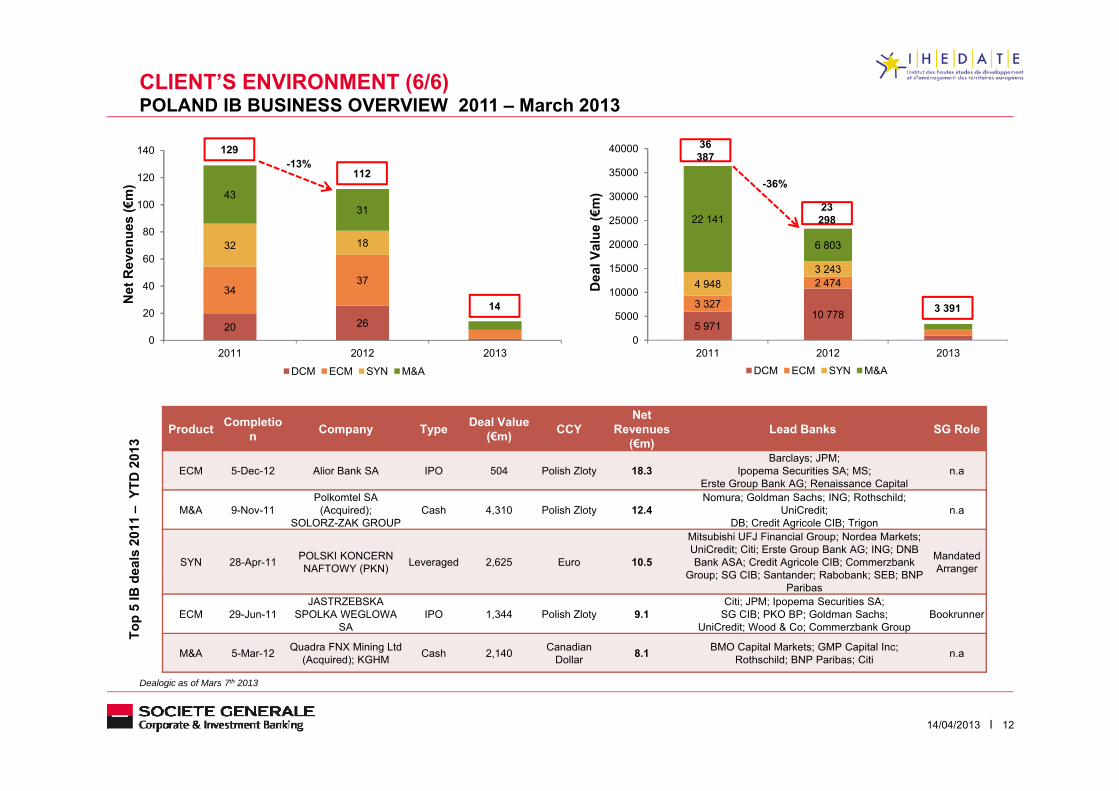
CLIENT’S ENVIRONMENT (6/6)POLAND IB BUSINESS OVERVIEW 2011 – March 2013
4331100
120
140
112
22 141
30000
35000
40000 36 387
23 298
(€m
)
€m)
129-13%
-36%
3437
32 18
40
60
80
14 3 327
2 4744 9483 243
22 141
6 803
10000
15000
20000
25000 298
3 391
Net
Rev
enue
s
Dea
l Val
ue ( €
20 260
20
2011 2012 2013
DCM ECM SYN M&A
14
5 97110 778
3 327
0
5000
2011 2012 2013DCM ECM SYN M&A
3 391
Product Completion Company Type Deal Value
(€m) CCYNet
Revenues(€m)
Lead Banks SG Role
ECM 5-Dec-12 Alior Bank SA IPO 504 Polish Zloty 18.3Barclays; JPM;
Ipopema Securities SA; MS;Erste Group Bank AG; Renaissance Capital
n.a
TD 2
013
Erste Group Bank AG; Renaissance Capital
M&A 9-Nov-11Polkomtel SA
(Acquired);SOLORZ-ZAK GROUP
Cash 4,310 Polish Zloty 12.4Nomura; Goldman Sachs; ING; Rothschild;
UniCredit;DB; Credit Agricole CIB; Trigon
n.a
SYN 28-Apr-11 POLSKI KONCERN NAFTOWY (PKN) Leveraged 2,625 Euro 10.5
Mitsubishi UFJ Financial Group; Nordea Markets;UniCredit; Citi; Erste Group Bank AG; ING; DNB Bank ASA; Credit Agricole CIB; Commerzbank
Group; SG CIB; Santander; Rabobank; SEB; BNP
Mandated Arrangerea
ls 2
011
–YT
Group; SG CIB; Santander; Rabobank; SEB; BNP Paribas
ECM 29-Jun-11JASTRZEBSKA
SPOLKA WEGLOWA SA
IPO 1,344 Polish Zloty 9.1Citi; JPM; Ipopema Securities SA;
SG CIB; PKO BP; Goldman Sachs;UniCredit; Wood & Co; Commerzbank Group
Bookrunner
M&A 5-Mar-12 Quadra FNX Mining Ltd (Acquired); KGHM Cash 2,140 Canadian
Dollar 8.1 BMO Capital Markets; GMP Capital Inc;Rothschild; BNP Paribas; Citi n.a
Top
5 IB
d
1214/04/2013
Dealogic as of Mars 7th 2013
( q )
INFRASTRUCTUREFinancing angle
INFRASTRUCTURE FINANCING
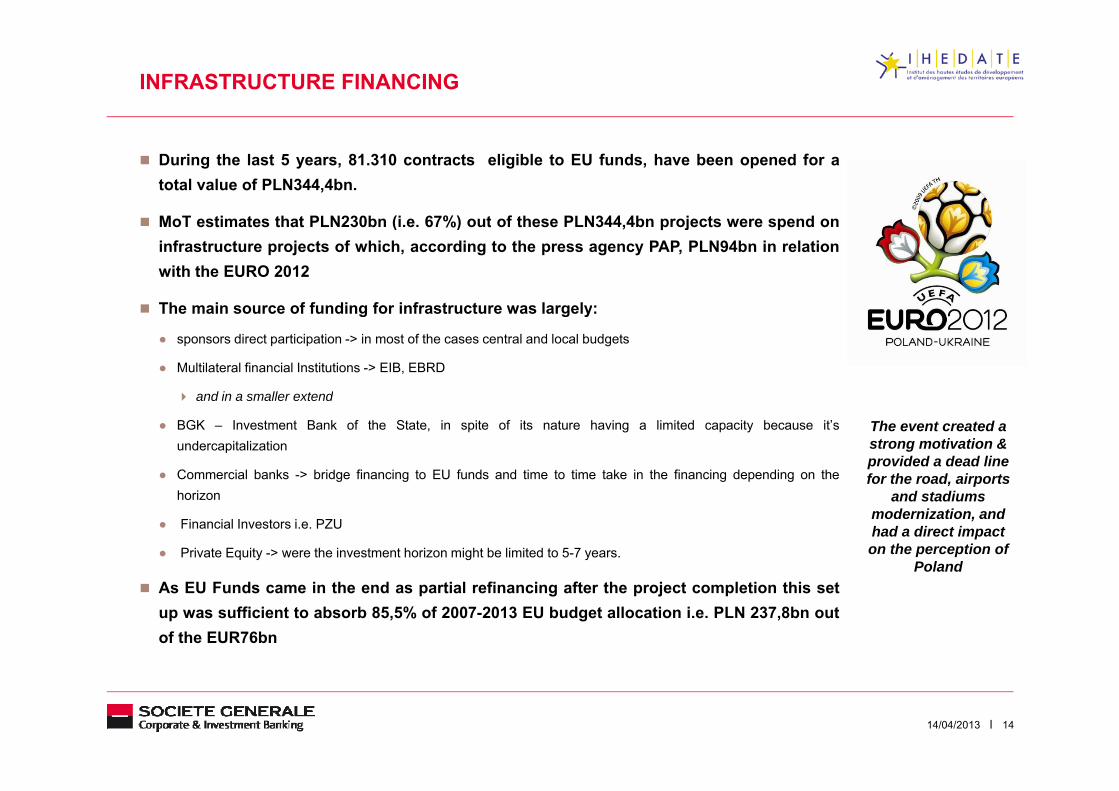
During the last 5 years, 81.310 contracts eligible to EU funds, have been opened for atotal value of PLN344,4bn.
M T ti t th t PLN230b (i 67%) t f th PLN344 4b j t d MoT estimates that PLN230bn (i.e. 67%) out of these PLN344,4bn projects were spend oninfrastructure projects of which, according to the press agency PAP, PLN94bn in relationwith the EURO 2012
The main source of funding for infrastructure was largely: The main source of funding for infrastructure was largely:
● sponsors direct participation -> in most of the cases central and local budgets
● Multilateral financial Institutions -> EIB, EBRD
and in a smaller extend and in a smaller extend
● BGK – Investment Bank of the State, in spite of its nature having a limited capacity because it’sundercapitalization
● Commercial banks -> bridge financing to EU funds and time to time take in the financing depending on the
The event created a strong motivation & provided a dead line for the road, airports
horizon
● Financial Investors i.e. PZU
● Private Equity -> were the investment horizon might be limited to 5-7 years.
, pand stadiums
modernization, and had a direct impact on the perception of
Poland As EU Funds came in the end as partial refinancing after the project completion this set
up was sufficient to absorb 85,5% of 2007-2013 EU budget allocation i.e. PLN 237,8bn outof the EUR76bn
1414/04/2013
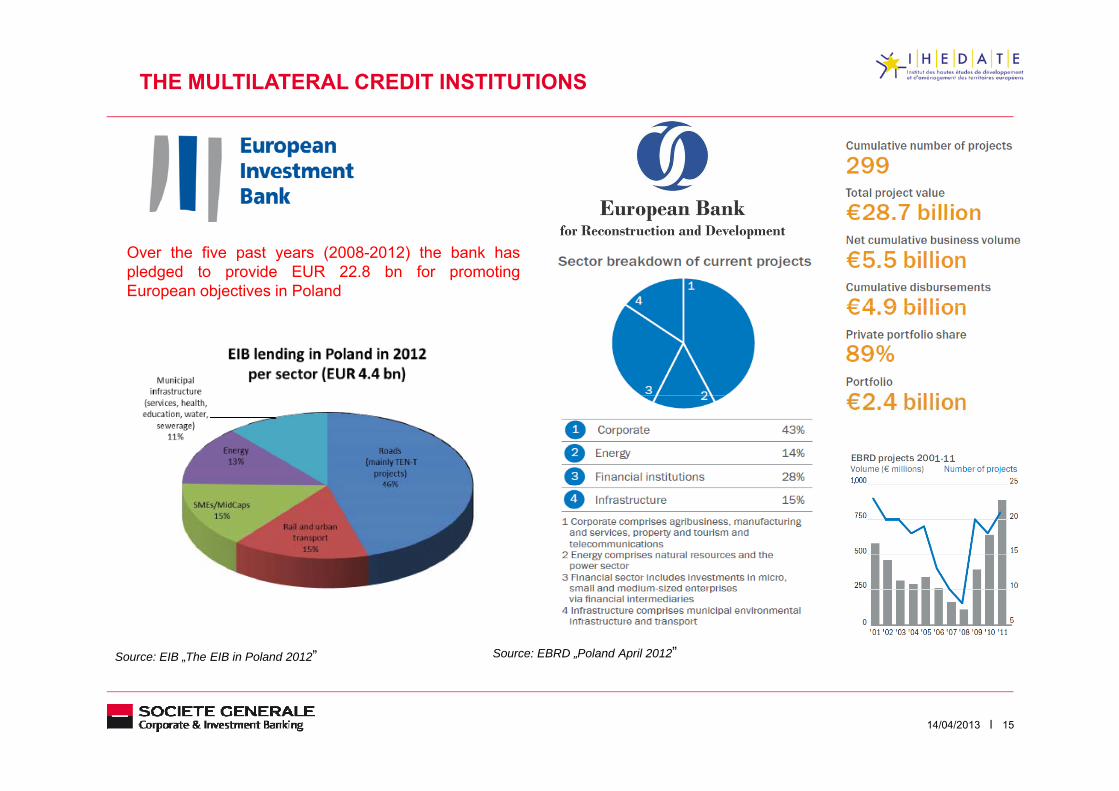
THE MULTILATERAL CREDIT INSTITUTIONS
Over the five past years (2008-2012) the bank haspledged to provide EUR 22.8 bn for promotingEuropean objectives in Poland
Source: EIB „The EIB in Poland 2012” Source: EBRD „Poland April 2012”
1514/04/2013
EXAMPLE OF INFRASTRUCTURE PROJECTA2 – Motorway
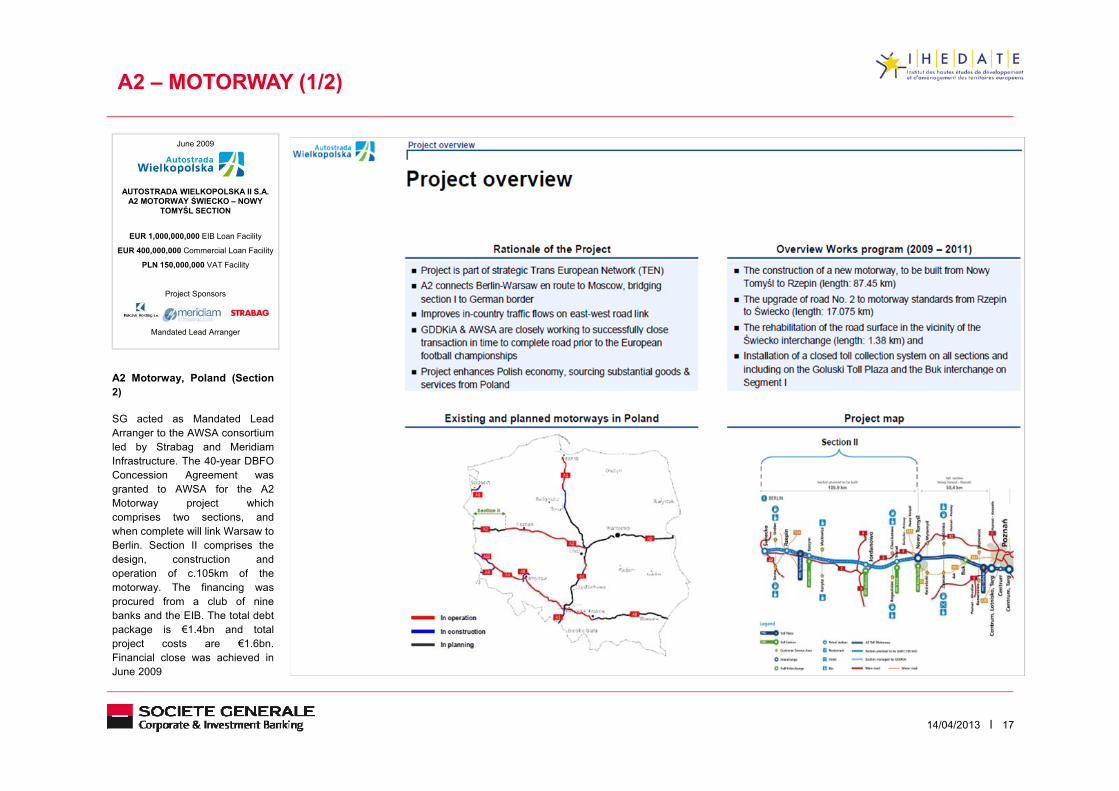
A2 – MOTORWAY (1/2)
June 2009
AUTOSTRADA WIELKOPOLSKA II S.A.A2 MOTORWAY ŚWIECKO – NOWY
TOMYŚL SECTION
EUR 1,000,000,000 EIB Loan Facility
EUR 400,000,000 Commercial Loan Facility
PLN 150,000,000 VAT Facility
Project Sponsors
Mandated Lead Arranger
A2 Motorway, Poland (Section2))
SG acted as Mandated LeadArranger to the AWSA consortiumled by Strabag and MeridiamInfrastructure. The 40-year DBFOConcession Agreement was
t d t AWSA f th A2granted to AWSA for the A2Motorway project whichcomprises two sections, andwhen complete will link Warsaw toBerlin. Section II comprises thedesign, construction andoperation of c 105km of theoperation of c.105km of themotorway. The financing wasprocured from a club of ninebanks and the EIB. The total debtpackage is €1.4bn and totalproject costs are €1.6bn.Financial close was achieved in
1714/04/2013
June 2009
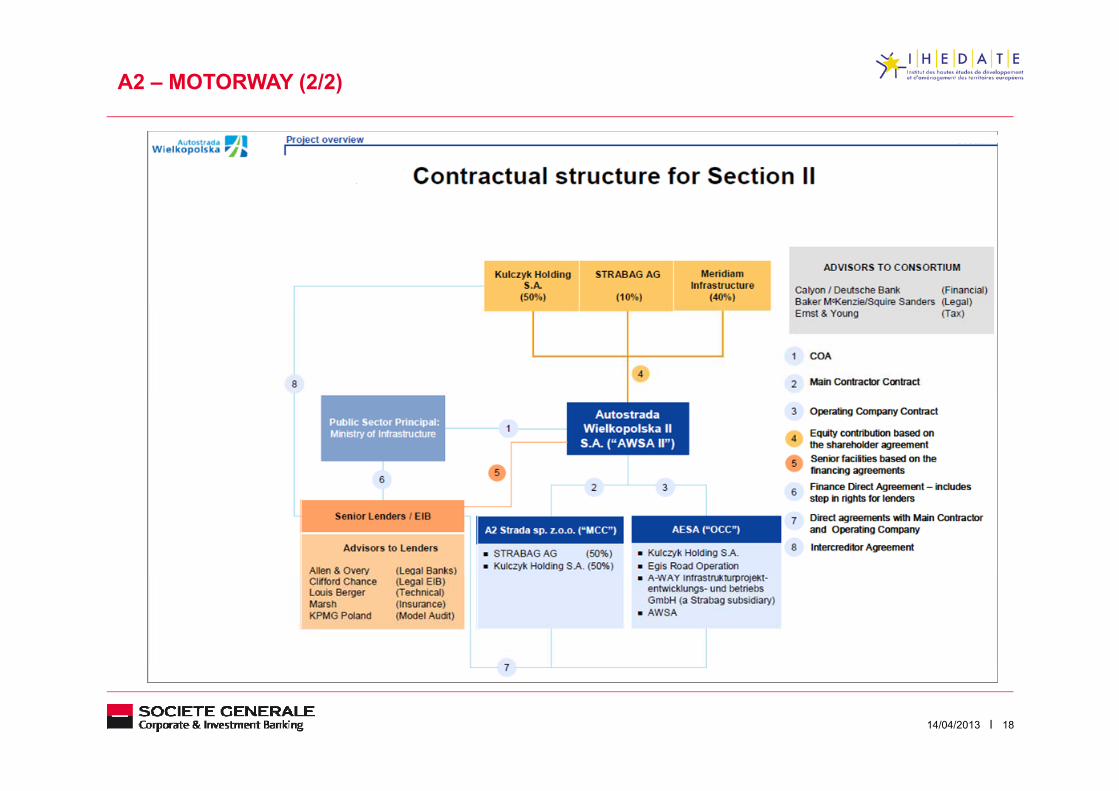
A2 – MOTORWAY (2/2)
1814/04/2013
Source: presentation of the MoT and BGK to banks March 2013
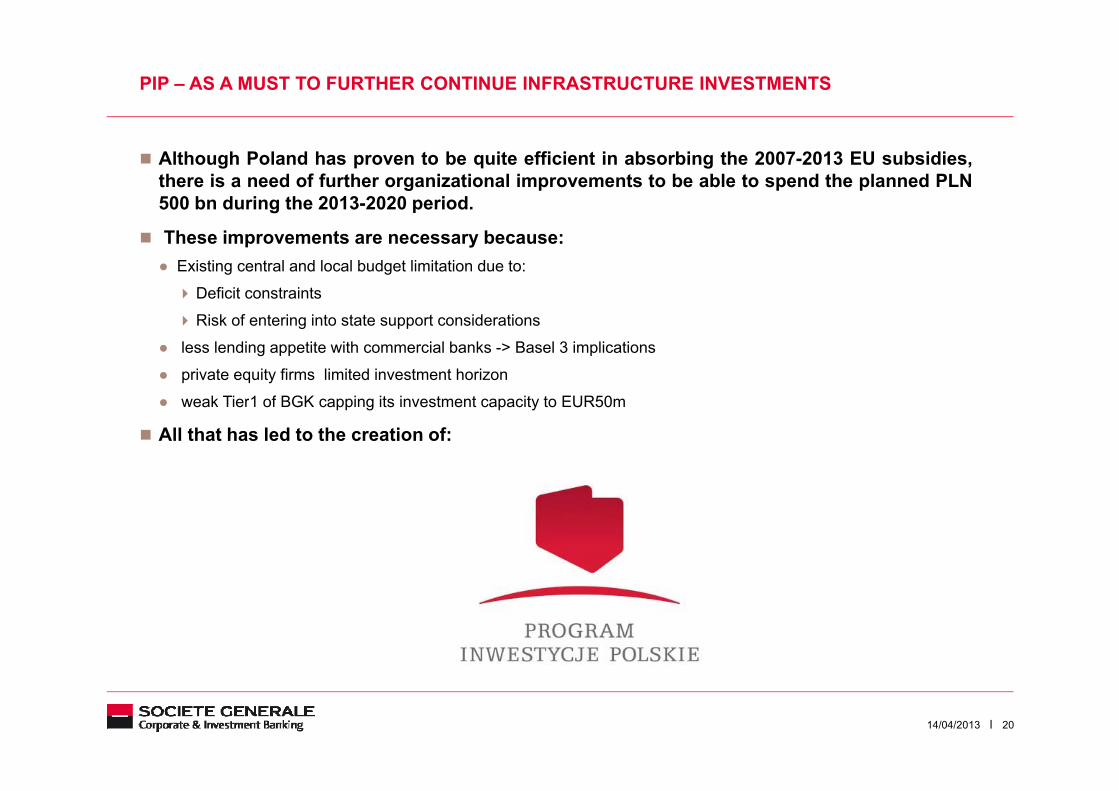
PIP – AS A MUST TO FURTHER CONTINUE INFRASTRUCTURE INVESTMENTS
Although Poland has proven to be quite efficient in absorbing the 2007-2013 EU subsidies,there is a need of further organizational improvements to be able to spend the planned PLN500 bn during the 2013-2020 period.
These improvements are necessary because:● Existing central and local budget limitation due to:
Deficit constraints
Risk of entering into state support considerations
● less lending appetite with commercial banks -> Basel 3 implications
● private equity firms limited investment horizon
k Ti 1 f BGK i i i i EUR 0● weak Tier1 of BGK capping its investment capacity to EUR50m
All that has led to the creation of:
2014/04/2013
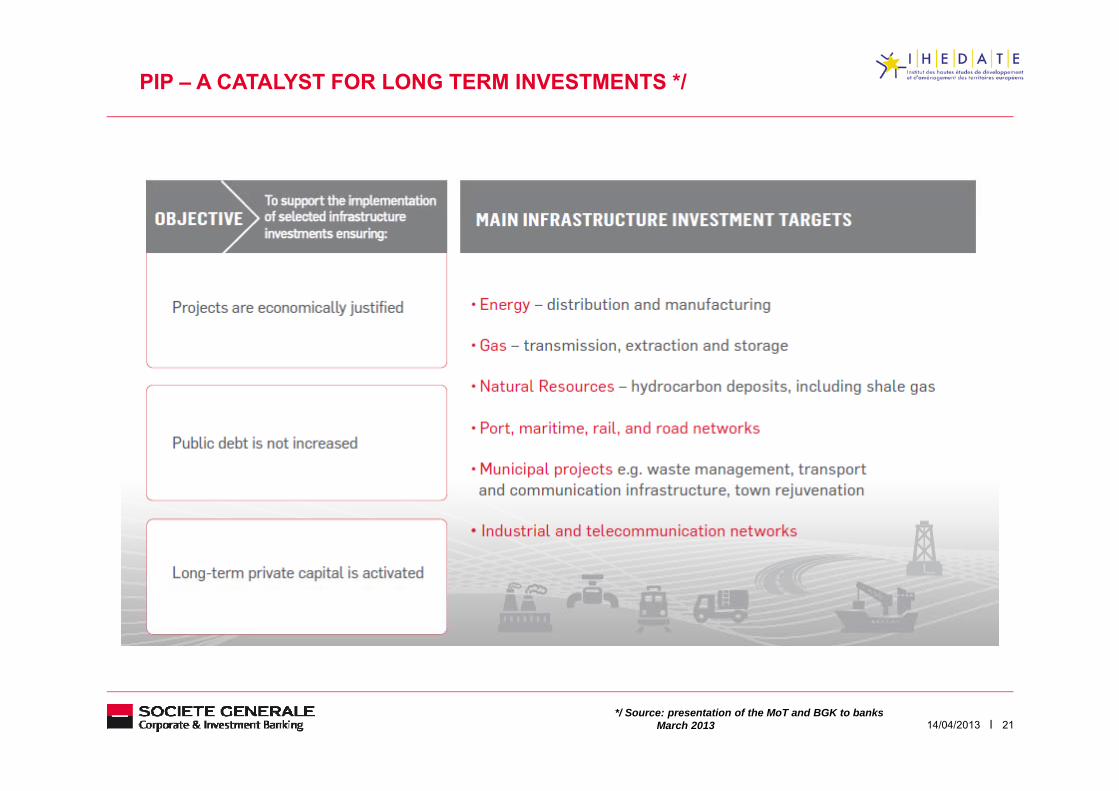
PIP – A CATALYST FOR LONG TERM INVESTMENTS */
2114/04/2013*/ Source: presentation of the MoT and BGK to banks
March 2013
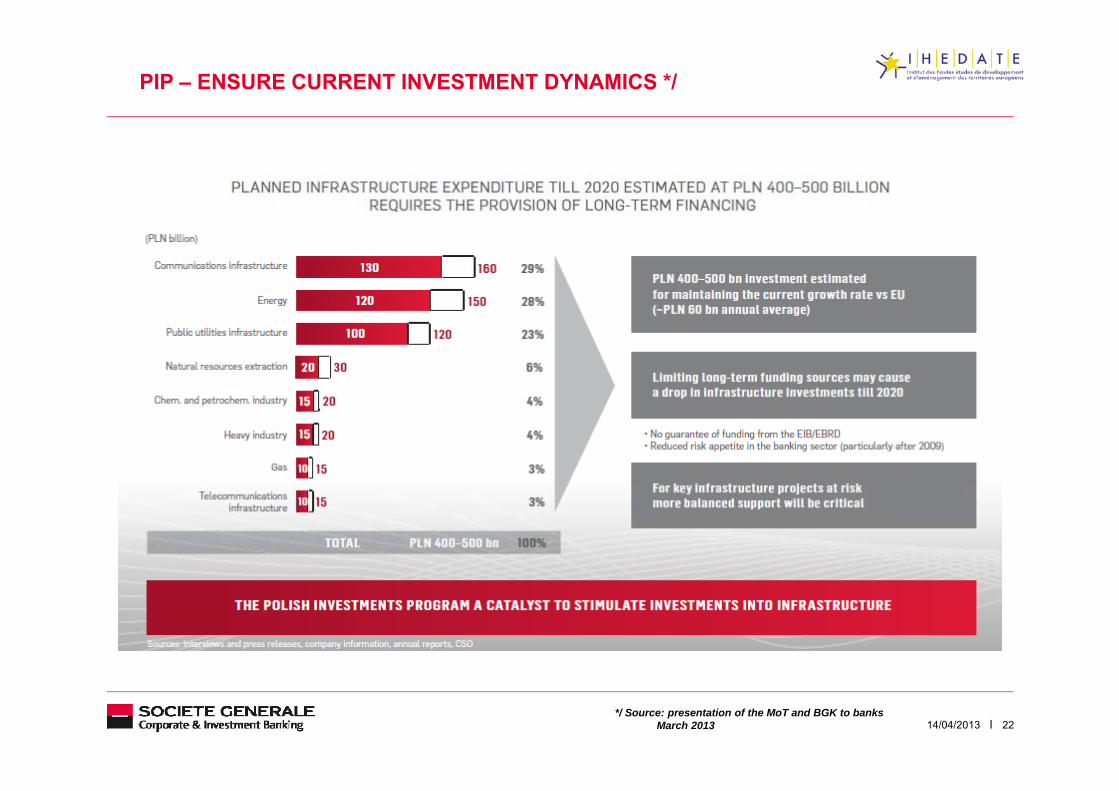
PIP – ENSURE CURRENT INVESTMENT DYNAMICS */
2214/04/2013*/ Source: presentation of the MoT and BGK to banks
March 2013
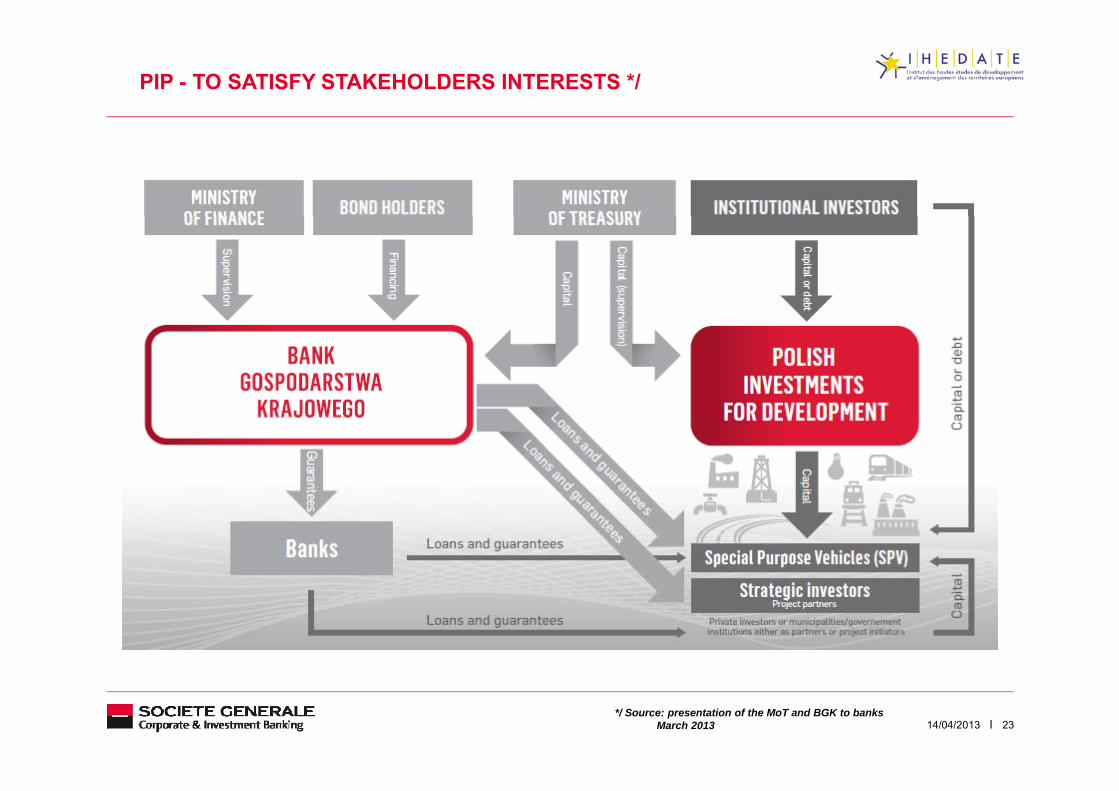
PIP - TO SATISFY STAKEHOLDERS INTERESTS */
2314/04/2013*/ Source: presentation of the MoT and BGK to banks
March 2013
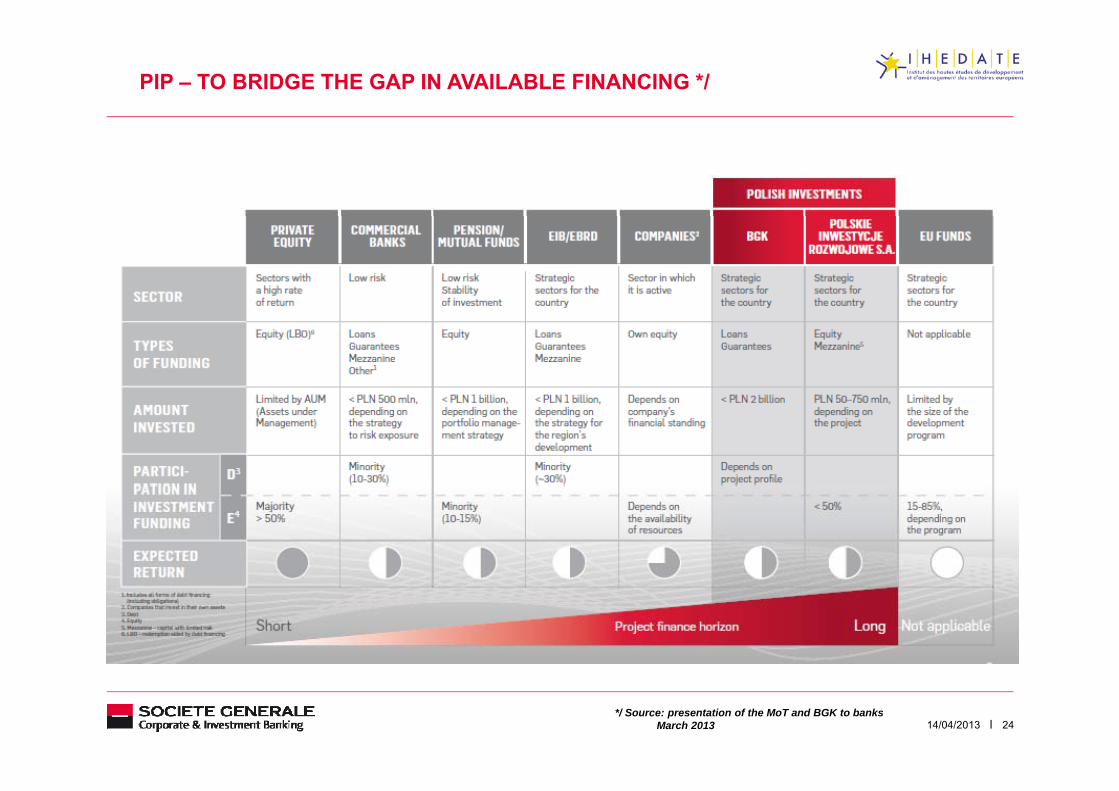
PIP – TO BRIDGE THE GAP IN AVAILABLE FINANCING */
2414/04/2013*/ Source: presentation of the MoT and BGK to banks
March 2013
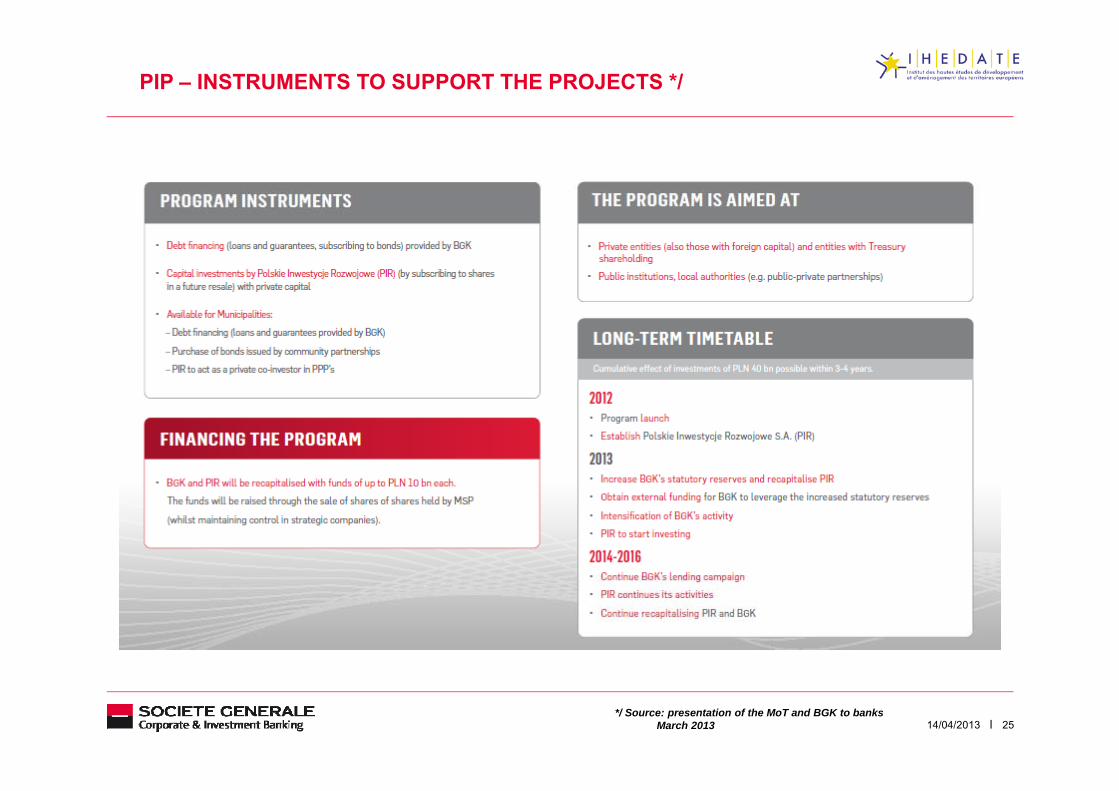
PIP – INSTRUMENTS TO SUPPORT THE PROJECTS */
2514/04/2013*/ Source: presentation of the MoT and BGK to banks
March 2013
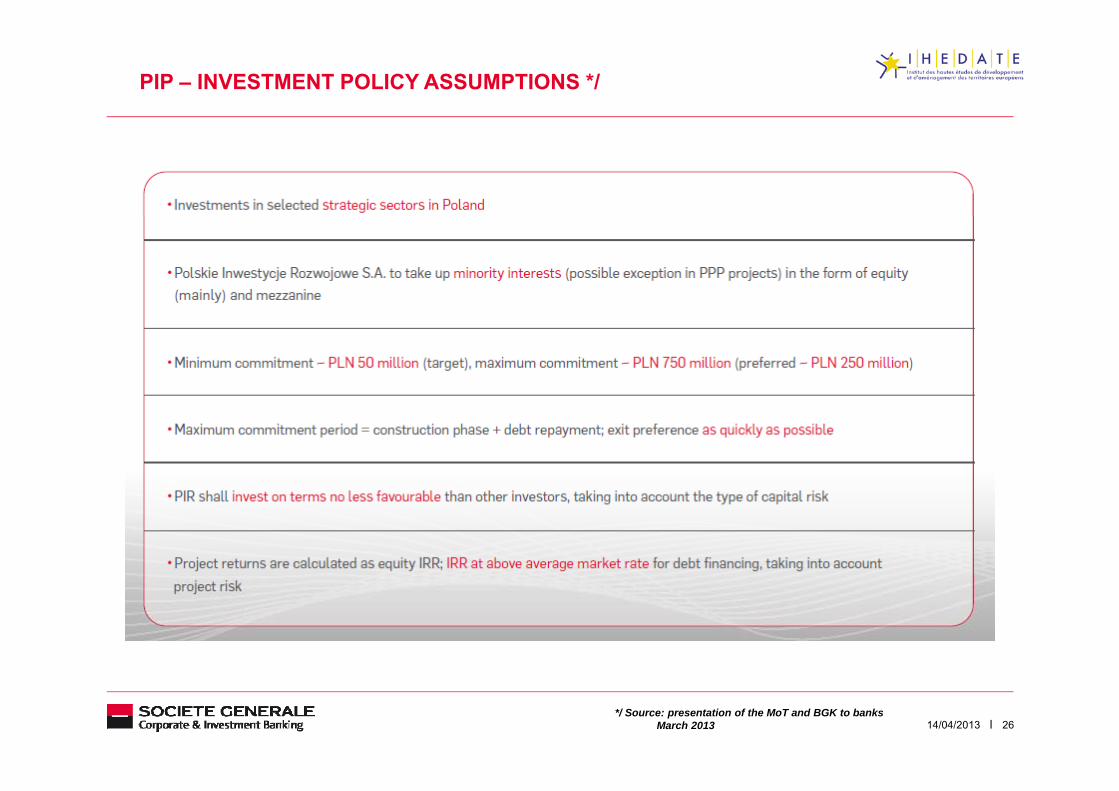
PIP – INVESTMENT POLICY ASSUMPTIONS */
2614/04/2013*/ Source: presentation of the MoT and BGK to banks
March 2013
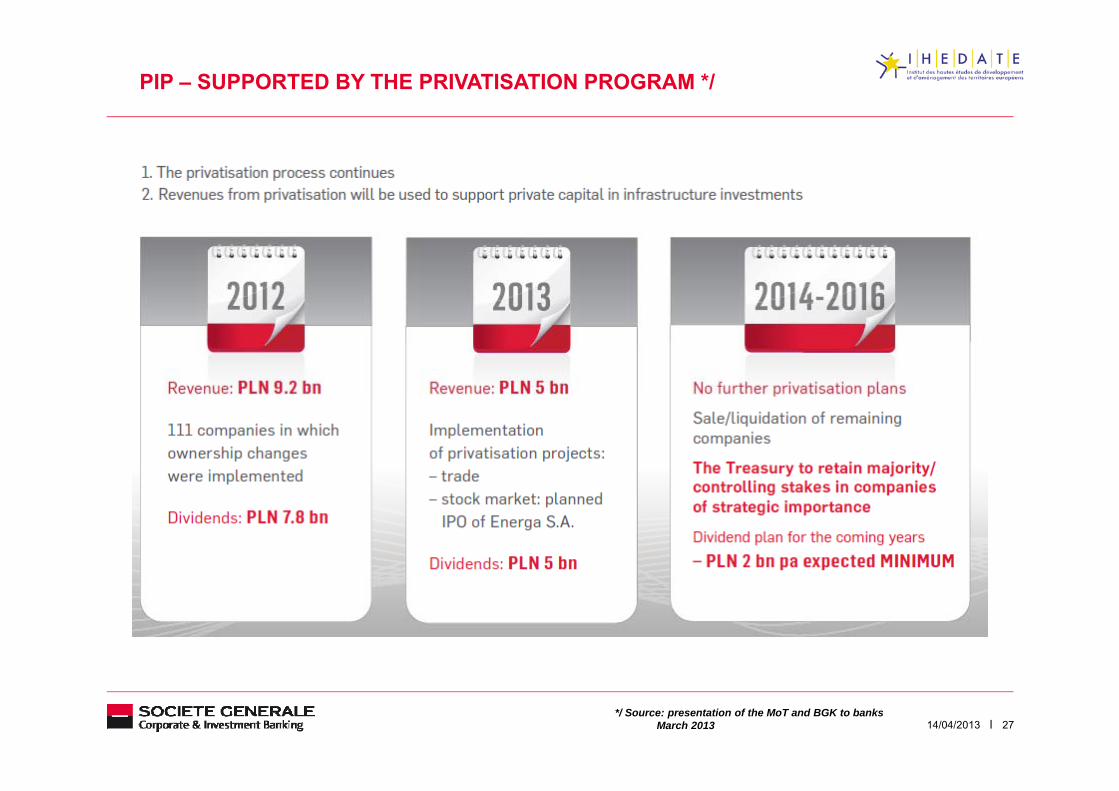
PIP – SUPPORTED BY THE PRIVATISATION PROGRAM */
2714/04/2013*/ Source: presentation of the MoT and BGK to banks
March 2013
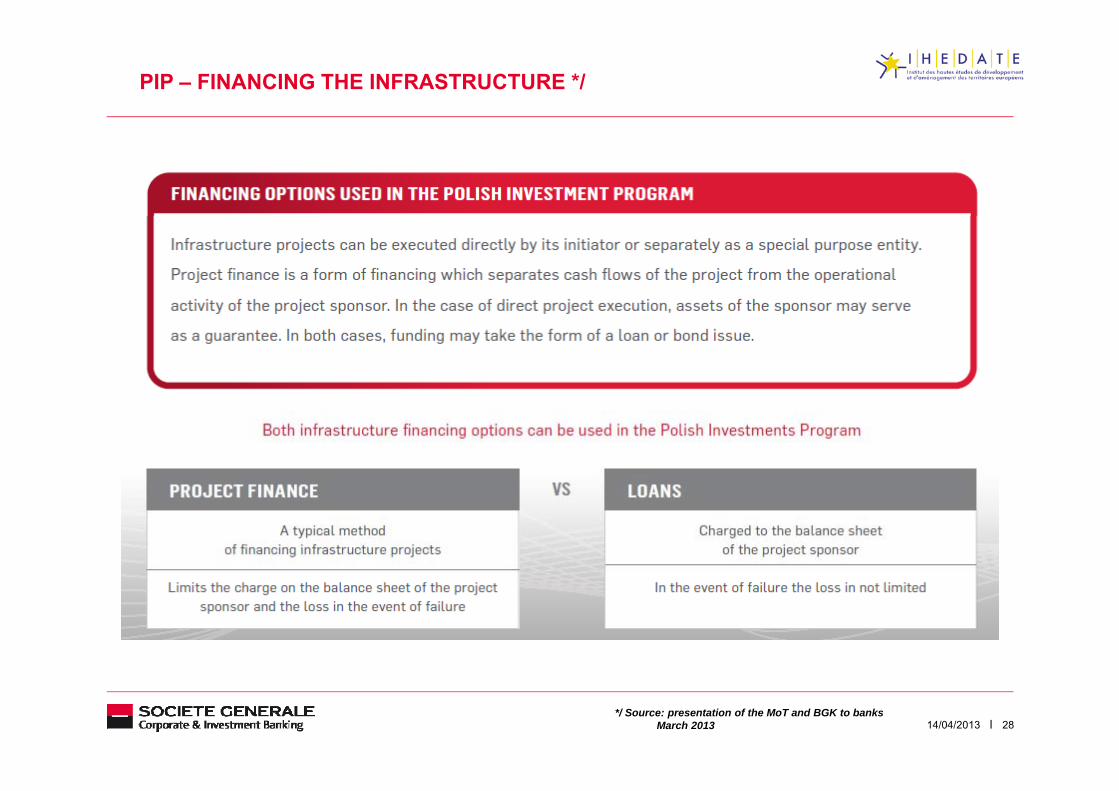
PIP – FINANCING THE INFRASTRUCTURE */
2814/04/2013*/ Source: presentation of the MoT and BGK to banks
March 2013
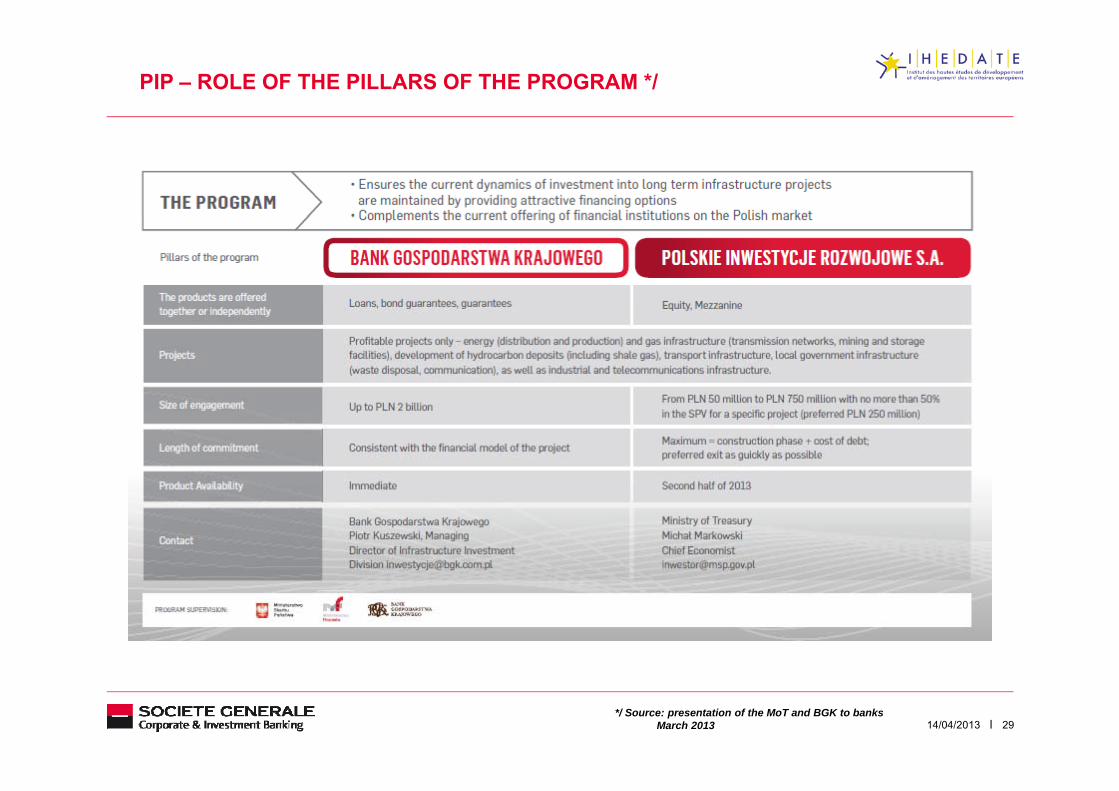
PIP – ROLE OF THE PILLARS OF THE PROGRAM */
2914/04/2013*/ Source: presentation of the MoT and BGK to banks
March 2013

CONCLUSIONS
CONCLUSIONS
■ Since Poland’s accession to EU in 2004 the country has come a long way
■ Nonetheless in spite of the large infrastructure investments, strongly helped by the inflow of EU
structural funds, there is still a lot to do
■ The workload is translated into ab. PLN500bn of projects during 2013-2020
■ It will be still helped by the inflow of EU funds to Poland
■ For the years 2014-2020 the draft of the EU budget sets the EU fund allocation at 105,8bn of
which EUR72,9bn in the Cohesion Policy framework
■ So far Poland has proven to be able to absorb the allocated funds, however it was done with the■ So far Poland has proven to be able to absorb the allocated funds, however it was done with the
help of the central and local budgets
■ Given the existing budget restriction to successfully manage the structural funds some new
schemes need to be implemented
■ PIP might be a solution, but we do believe, that as well, a more PPP approach would be necessary
3114/04/2013

THANK YOU FOR YOUR ATTENTION
Q & A
CONTACT
SG CIB WSG CIB Warsawul. Marszałkowska 11100-102 Warszawa
mail address:mail address:P.O. Box P-54, 00-950 Warszawa 1tel. + 48 (0)22 528 40 00fax + 48 (0)22 528 44 44
SG CIB Gdansk tel. + 48 (0)58 782 08 70SG CIB Katowice tel. + 48 (0)32 253 01 98SG CIB Krakow tel. + 48 (0)12 429 50 00SG CIB Poznan tel. + 48 (0)61 845 45 11SG CIB Wroclaw tel. + 48 (0)71 342 14 63
e-mail: [email protected]
3314/04/2013