Embed Size (px)
Citation preview
[ C L I E N T N A M E ]
Presentation3
179.31.36
106.107.109
8.144.70
40.44.109
144.28.83
243.165.30
218.70.38
14.116.118
1237395-001.pptx
Conference Call First Quarter 2015 Financial Results
May 04, 2015 1

[ C L I E N T N A M E ]
Agenda
2

[ C L I E N T N A M E ]
Presentation3
179.31.36
106.107.109
8.144.70
40.44.109
144.28.83
243.165.30
218.70.38
14.116.118
1237395-001.pptx
Q1 2015 Milestones
Agenda 179.31.36
106.107.109
8.144.70
40.44.109
144.28.83
243.165.30
218.70.38
14.116.118
Opening Remarks
Q1 2015 Highlights
1
2
3
Operating and Financial Review 4
3
Guidance 5
Q&A 6
[ C L I E N T N A M E ]
Presentation3
179.31.36
106.107.109
8.144.70
40.44.109
144.28.83
243.165.30
218.70.38
14.116.118
1237395-001.pptx
Q1 2015 Highlights 179.31.36
106.107.109
8.144.70
40.44.109
144.28.83
243.165.30
218.70.38
14.116.118
2
4
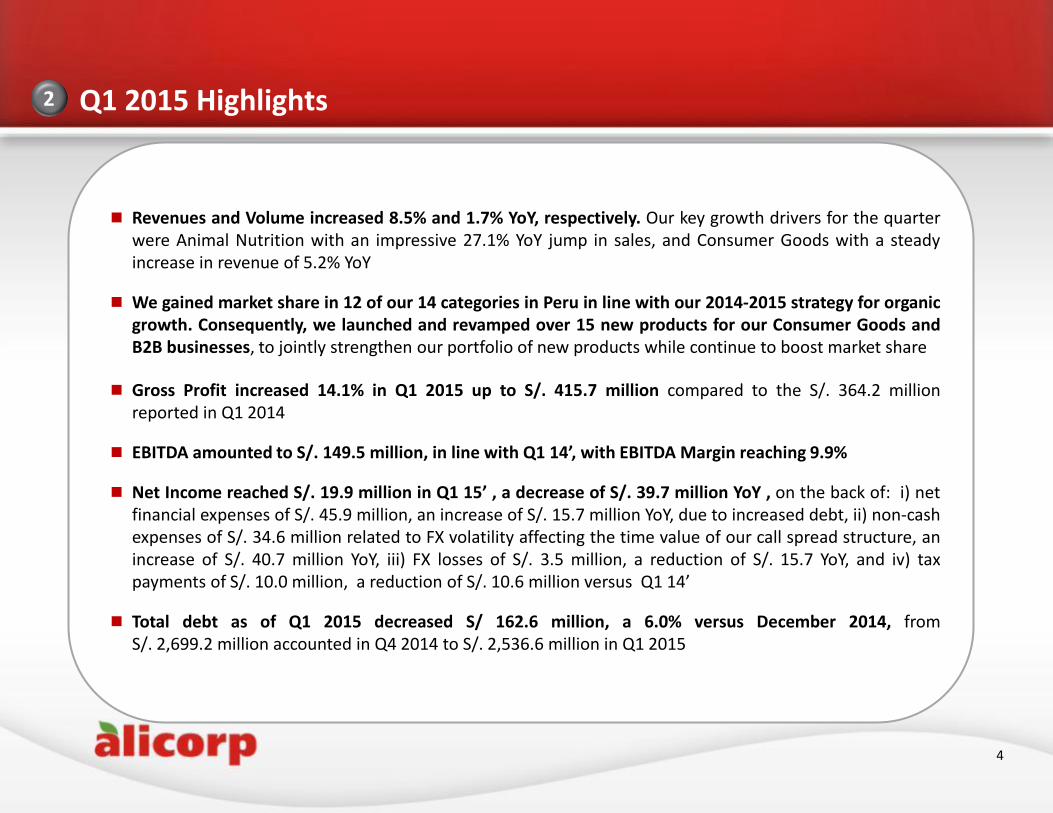
Revenues and Volume increased 8.5% and 1.7% YoY, respectively. Our key growth drivers for the quarter were Animal Nutrition with an impressive 27.1% YoY jump in sales, and Consumer Goods with a steady increase in revenue of 5.2% YoY
We gained market share in 12 of our 14 categories in Peru in line with our 2014-2015 strategy for organic growth. Consequently, we launched and revamped over 15 new products for our Consumer Goods and B2B businesses, to jointly strengthen our portfolio of new products while continue to boost market share
Gross Profit increased 14.1% in Q1 2015 up to S/. 415.7 million compared to the S/. 364.2 million reported in Q1 2014
EBITDA amounted to S/. 149.5 million, in line with Q1 14’, with EBITDA Margin reaching 9.9%
Net Income reached S/. 19.9 million in Q1 15’ , a decrease of S/. 39.7 million YoY , on the back of: i) net financial expenses of S/. 45.9 million, an increase of S/. 15.7 million YoY, due to increased debt, ii) non-cash expenses of S/. 34.6 million related to FX volatility affecting the time value of our call spread structure, an increase of S/. 40.7 million YoY, iii) FX losses of S/._3.5 million, a reduction of S/. 15.7 YoY, and iv) tax payments of S/. 10.0 million, a reduction of S/. 10.6 million versus Q1 14’
Total debt as of Q1 2015 decreased S/ 162.6 million, a 6.0% versus December 2014, from S/. 2,699.2 million accounted in Q4 2014 to S/. 2,536.6 million in Q1 2015
[ C L I E N T N A M E ]
Presentation3
179.31.36
106.107.109
8.144.70
40.44.109
144.28.83
243.165.30
218.70.38
14.116.118
1237395-001.pptx
Q1 2015 Milestones 179.31.36
106.107.109
8.144.70
40.44.109
144.28.83
243.165.30
218.70.38
14.116.118
3
5
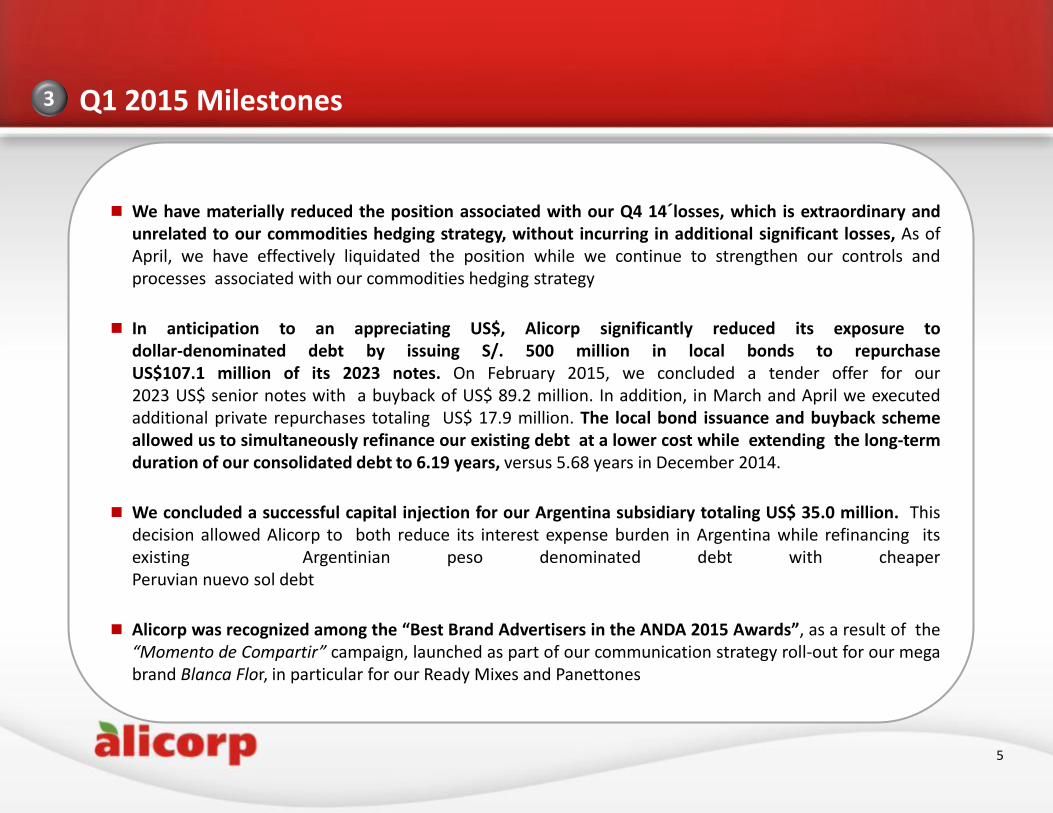
We have materially reduced the position associated with our Q4 14´losses, which is extraordinary and unrelated to our commodities hedging strategy, without incurring in additional significant losses, As of April, we have effectively liquidated the position while we continue to strengthen our controls and processes associated with our commodities hedging strategy
In anticipation to an appreciating US$, Alicorp significantly reduced its exposure to dollar-denominated debt by issuing S/. 500 million in local bonds to repurchase US$107.1 million of its 2023 notes. On February 2015, we concluded a tender offer for our 2023 US$ senior notes with a buyback of US$ 89.2 million. In addition, in March and April we executed additional private repurchases totaling US$ 17.9 million. The local bond issuance and buyback scheme allowed us to simultaneously refinance our existing debt at a lower cost while extending the long-term duration of our consolidated debt to 6.19 years, versus 5.68 years in December 2014.
We concluded a successful capital injection for our Argentina subsidiary totaling US$ 35.0 million. This decision allowed Alicorp to both reduce its interest expense burden in Argentina while refinancing its existing Argentinian peso denominated debt with cheaper Peruvian nuevo sol debt
Alicorp was recognized among the “Best Brand Advertisers in the ANDA 2015 Awards”, as a result of the “Momento de Compartir” campaign, launched as part of our communication strategy roll-out for our mega brand Blanca Flor, in particular for our Ready Mixes and Panettones
[ C L I E N T N A M E ]
Presentation3
179.31.36
106.107.109
8.144.70
40.44.109
144.28.83
243.165.30
218.70.38
14.116.118
1237395-001.pptx
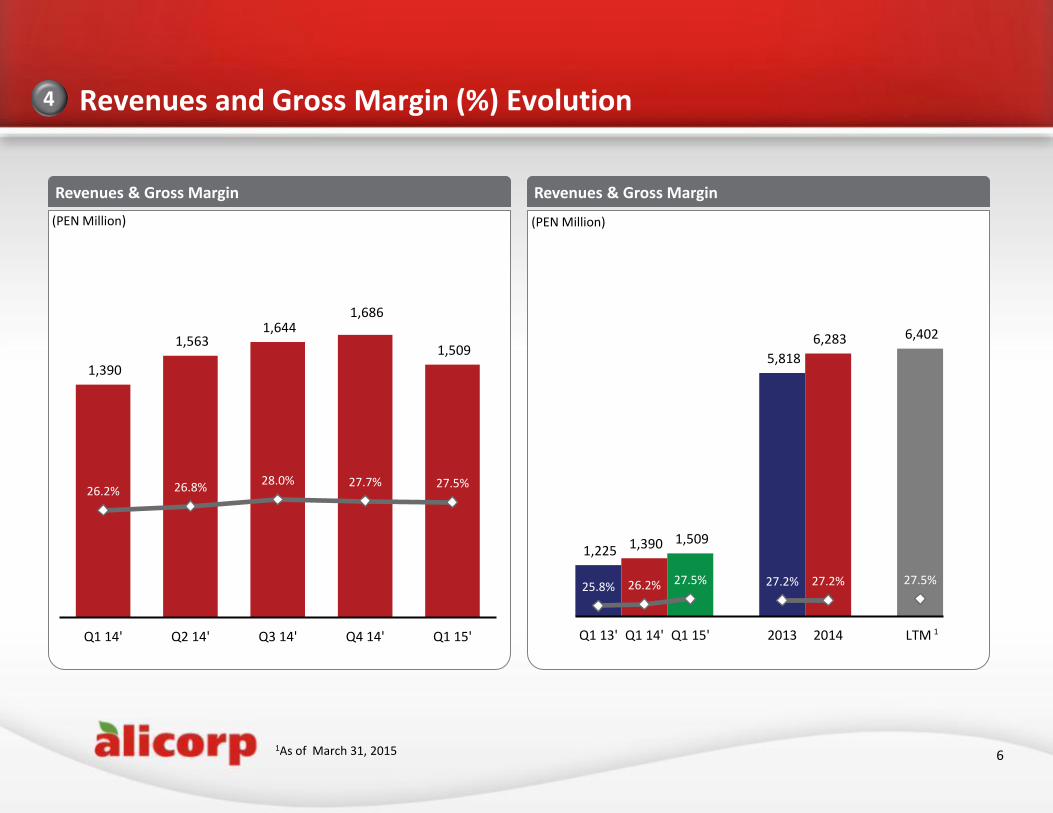
Revenues and Gross Margin (%) Evolution 4
Revenues & Gross Margin Revenues & Gross Margin
(PEN Million) (PEN Million)
6
1,390
1,563 1,644
1,686
1,509
26.2% 26.8% 28.0% 27.7% 27.5%
Q1 14' Q2 14' Q3 14' Q4 14' Q1 15'
1,225 1,390 1,509
5,818
6,283 6,402
25.8% 26.2% 27.5% 27.2% 27.2% 27.5%
Q1 13' Q1 14' Q1 15' 2013 2014 LTM
1As of March 31, 2015
1
[ C L I E N T N A M E ]
Presentation3
179.31.36
106.107.109
8.144.70
40.44.109
144.28.83
243.165.30
218.70.38
14.116.118
1237395-001.pptx
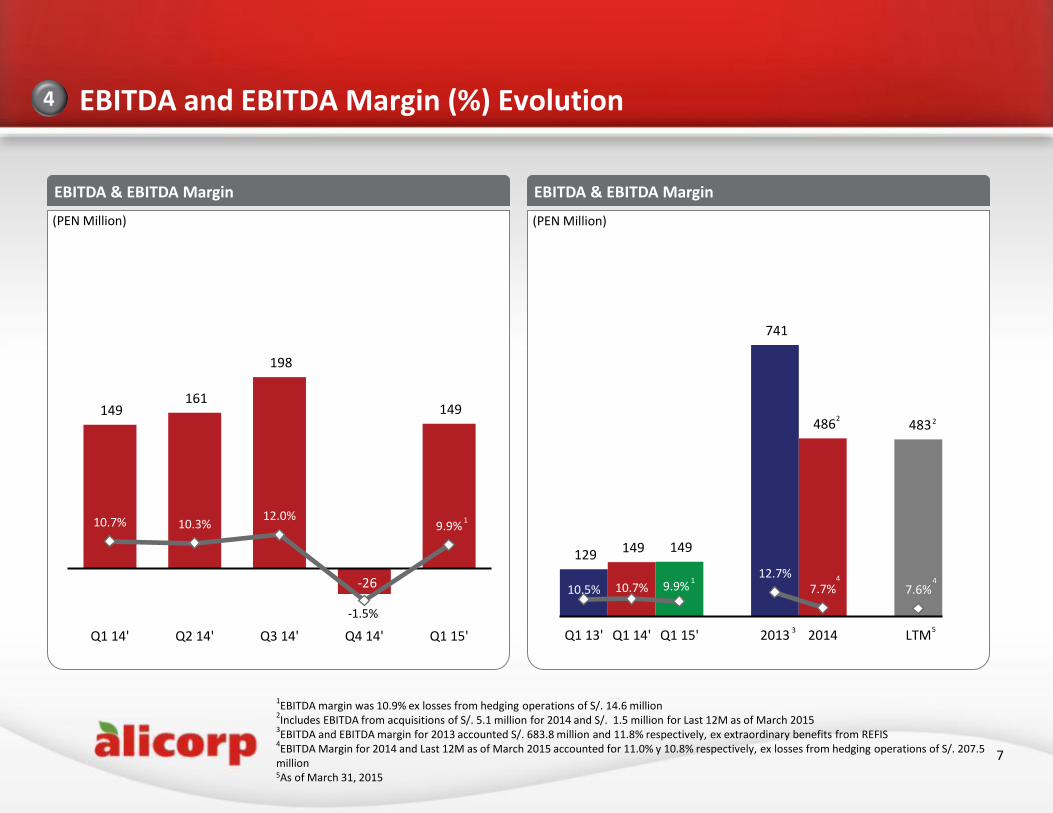
EBITDA and EBITDA Margin (%) Evolution 4
EBITDA & EBITDA Margin EBITDA & EBITDA Margin
(PEN Million) (PEN Million)
7
1EBITDA margin was 10.9% ex losses from hedging operations of S/. 14.6 million
2Includes EBITDA from acquisitions of S/. 5.1 million for 2014 and S/. 1.5 million for Last 12M as of March 2015
3EBITDA and EBITDA margin for 2013 accounted S/. 683.8 million and 11.8% respectively, ex extraordinary benefits from REFIS
4EBITDA Margin for 2014 and Last 12M as of March 2015 accounted for 11.0% y 10.8% respectively, ex losses from hedging operations of S/. 207.5
million 5As of March 31, 2015
149 161
198
-26
149
10.7% 10.3% 12.0%
-1.5%
9.9%
Q1 14' Q2 14' Q3 14' Q4 14' Q1 15'
129 149 149
741
486 483
10.5% 10.7% 9.9% 12.7%
7.7% 7.6%
Q1 13' Q1 14' Q1 15' 2013 2014 LTM3
4
5
2 2
4
1
1
[ C L I E N T N A M E ]
Presentation3
179.31.36
106.107.109
8.144.70
40.44.109
144.28.83
243.165.30
218.70.38
14.116.118
1237395-001.pptx
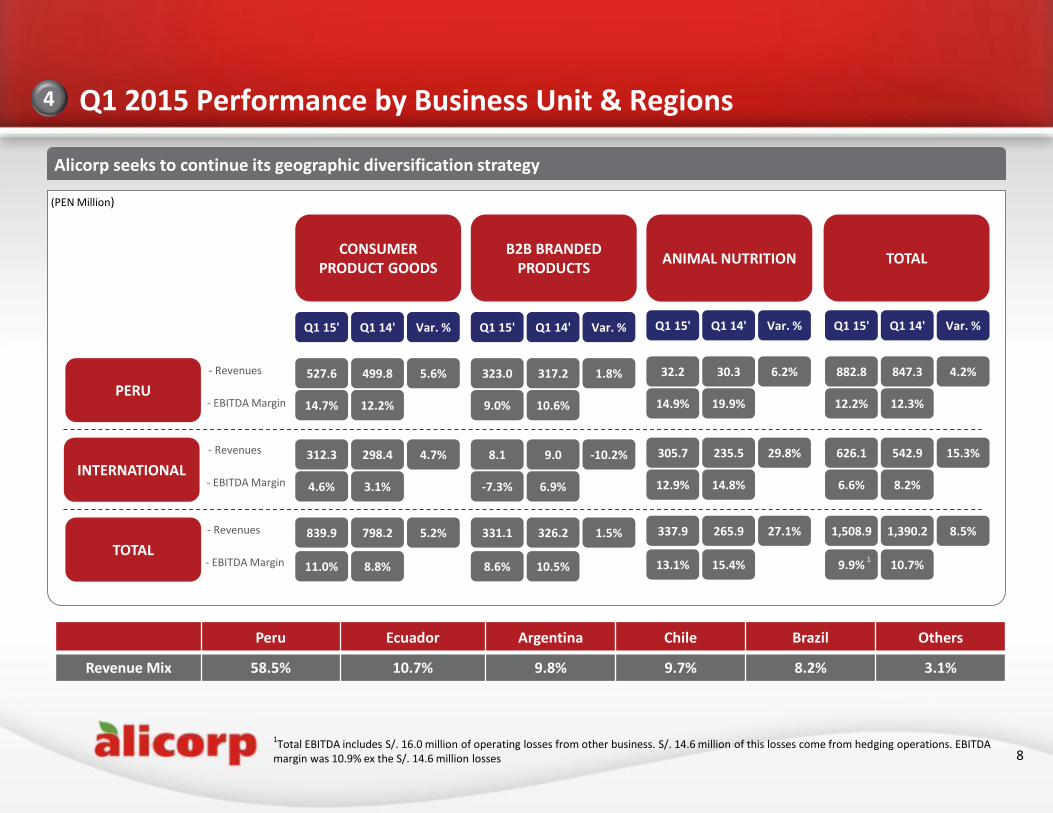
Q1 2015 Performance by Business Unit & Regions 4
Alicorp seeks to continue its geographic diversification strategy
Peru Ecuador Argentina Chile Brazil Others
Revenue Mix 58.5% 10.7% 9.8% 9.7% 8.2% 3.1%
(PEN Million)
8
PERU
INTERNATIONAL
TOTAL
CONSUMER PRODUCT GOODS
B2B BRANDED PRODUCTS
ANIMAL NUTRITION
TOTAL
- Revenues
- EBITDA Margin
- Revenues
- EBITDA Margin
- Revenues
- EBITDA Margin
Q1 14' Q1 15' Var. % Q1 14' Q1 15' Var. % Q1 14' Q1 15' Var. % Q1 14' Q1 15' Var. %
499.8 527.6 5.6%
12.2% 14.7%
298.4 312.3 4.7%
3.1% 4.6%
798.2 839.9 5.2%
8.8% 11.0%
317.2 323.0 1.8%
10.6% 9.0%
9.0 8.1 -10.2%
6.9% -7.3%
326.2 331.1 1.5%
10.5% 8.6%
30.3 32.2 6.2%
19.9% 14.9%
235.5 305.7 29.8%
14.8% 12.9%
265.9 337.9 27.1%
15.4% 13.1%
847.3 882.8 4.2%
12.3% 12.2%
542.9 626.1 15.3%
8.2% 6.6%
1,390.2 1,508.9 8.5%
10.7% 9.9%
1Total EBITDA includes S/. 16.0 million of operating losses from other business. S/. 14.6 million of this losses come from hedging operations. EBITDA
margin was 10.9% ex the S/. 14.6 million losses
1
[ C L I E N T N A M E ]
Presentation3
179.31.36
106.107.109
8.144.70
40.44.109
144.28.83
243.165.30
218.70.38
14.116.118
1237395-001.pptx
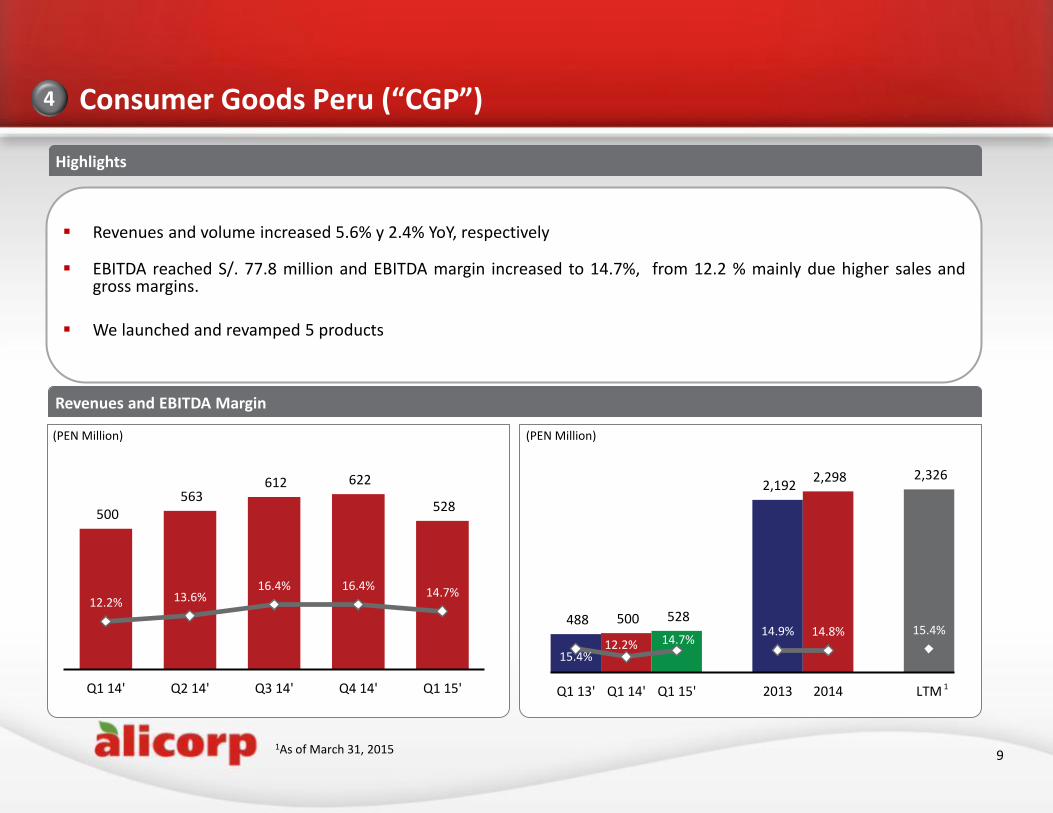
Consumer Goods Peru (“CGP”) 4
Revenues and volume increased 5.6% y 2.4% YoY, respectively
EBITDA reached S/. 77.8 million and EBITDA margin increased to 14.7%, from 12.2 % mainly due higher sales and gross margins.
We launched and revamped 5 products
Revenues and EBITDA Margin
Highlights
(PEN Million) (PEN Million)
9
1
2
500 563
612 622
528
12.2% 13.6% 16.4% 16.4%
14.7%
Q1 14' Q2 14' Q3 14' Q4 14' Q1 15'
488 500 528
2,192 2,298 2,326
15.4% 12.2% 14.7%
14.9% 14.8% 15.4%
Q1 13' Q1 14' Q1 15' 2013 2014 LTM
1As of March 31, 2015
1
[ C L I E N T N A M E ]
Presentation3
179.31.36
106.107.109
8.144.70
40.44.109
144.28.83
243.165.30
218.70.38
14.116.118
1237395-001.pptx
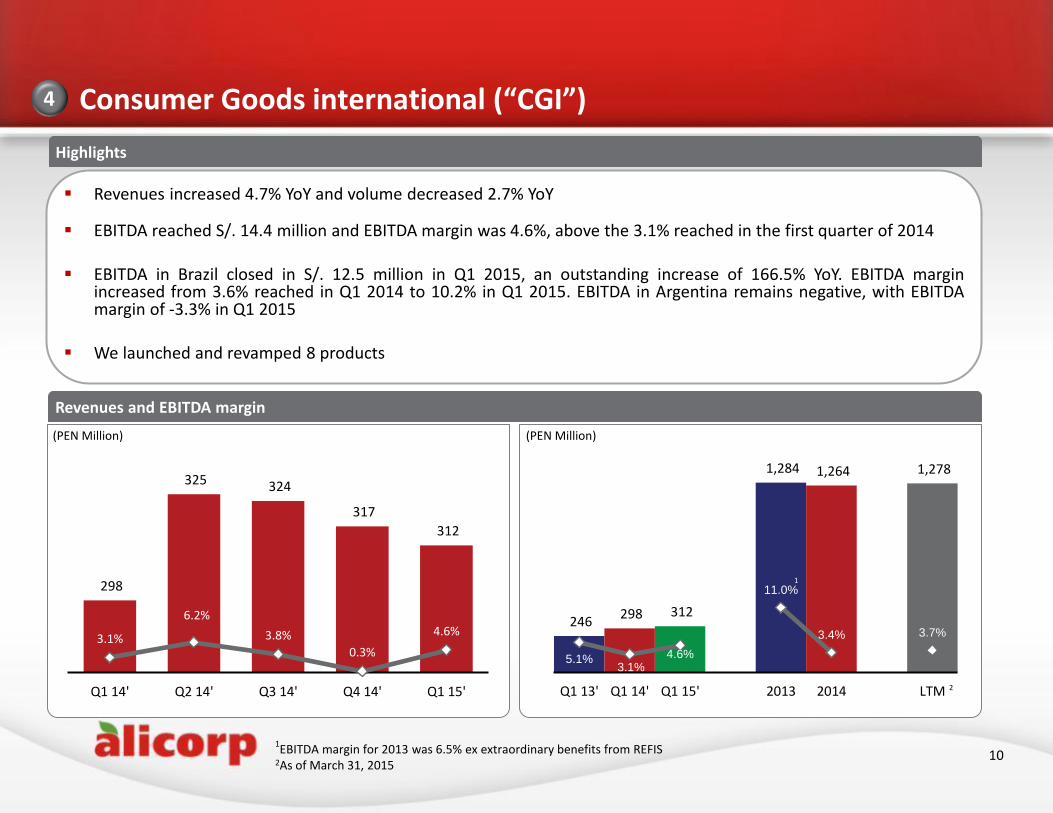
Consumer Goods international (“CGI”) 4
Revenues increased 4.7% YoY and volume decreased 2.7% YoY
EBITDA reached S/. 14.4 million and EBITDA margin was 4.6%, above the 3.1% reached in the first quarter of 2014
EBITDA in Brazil closed in S/. 12.5 million in Q1 2015, an outstanding increase of 166.5% YoY. EBITDA margin increased from 3.6% reached in Q1 2014 to 10.2% in Q1 2015. EBITDA in Argentina remains negative, with EBITDA margin of -3.3% in Q1 2015
We launched and revamped 8 products
Revenues and EBITDA margin
Highlights
(PEN Million) (PEN Million)
10
2
2
298
325 324
317
312
3.1%
6.2%
3.8%
0.3%
4.6%
Q1 14' Q2 14' Q3 14' Q4 14' Q1 15'
246 298 312
1,284 1,264 1,278
5.1% 3.1%
4.6%
11.0%
3.4% 3.7%
Q1 13' Q1 14' Q1 15' 2013 2014 LTM
1EBITDA margin for 2013 was 6.5% ex extraordinary benefits from REFIS
2As of March 31, 2015
1
[ C L I E N T N A M E ]
Presentation3
179.31.36
106.107.109
8.144.70
40.44.109
144.28.83
243.165.30
218.70.38
14.116.118
1237395-001.pptx
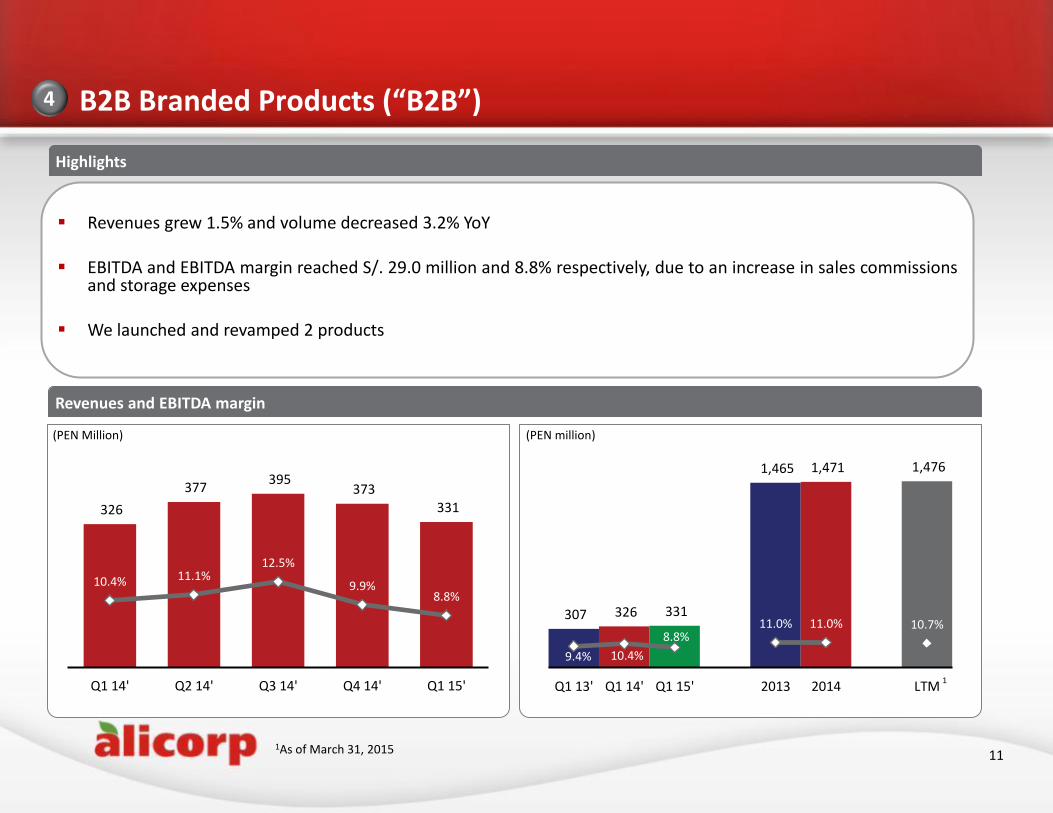
B2B Branded Products (“B2B”) 4
Revenues grew 1.5% and volume decreased 3.2% YoY
EBITDA and EBITDA margin reached S/. 29.0 million and 8.8% respectively, due to an increase in sales commissions and storage expenses
We launched and revamped 2 products
Revenues and EBITDA margin
Highlights
(PEN Million) (PEN million)
11
326
377 395
373 331
10.4% 11.1% 12.5%
9.9% 8.8%
Q1 14' Q2 14' Q3 14' Q4 14' Q1 15'
307 326 331
1,465 1,471 1,476
9.4% 10.4%
8.8% 11.0% 11.0% 10.7%
Q1 13' Q1 14' Q1 15' 2013 2014 LTM1
1As of March 31, 2015
[ C L I E N T N A M E ]
Presentation3
179.31.36
106.107.109
8.144.70
40.44.109
144.28.83
243.165.30
218.70.38
14.116.118
1237395-001.pptx
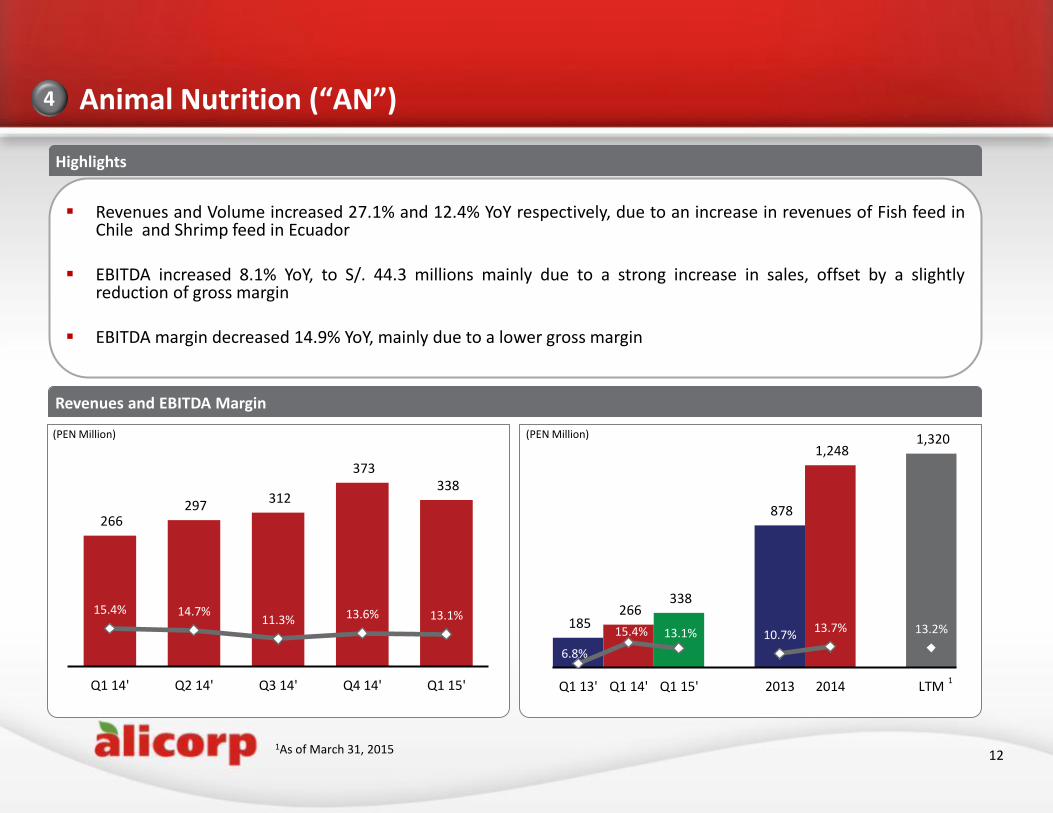
Animal Nutrition (“AN”) 4
Revenues and Volume increased 27.1% and 12.4% YoY respectively, due to an increase in revenues of Fish feed in Chile and Shrimp feed in Ecuador
EBITDA increased 8.1% YoY, to S/. 44.3 millions mainly due to a strong increase in sales, offset by a slightly reduction of gross margin
EBITDA margin decreased 14.9% YoY, mainly due to a lower gross margin
Revenues and EBITDA Margin
Highlights
(PEN Million) (PEN Million)
12
266 297
312
373 338
15.4% 14.7% 11.3% 13.6% 13.1%
Q1 14' Q2 14' Q3 14' Q4 14' Q1 15'
185 266
338
878
1,248 1,320
6.8%
15.4% 13.1% 10.7% 13.7% 13.2%
Q1 13' Q1 14' Q1 15' 2013 2014 LTM1
1As of March 31, 2015
[ C L I E N T N A M E ]
Presentation3
179.31.36
106.107.109
8.144.70
40.44.109
144.28.83
243.165.30
218.70.38
14.116.118
1237395-001.pptx
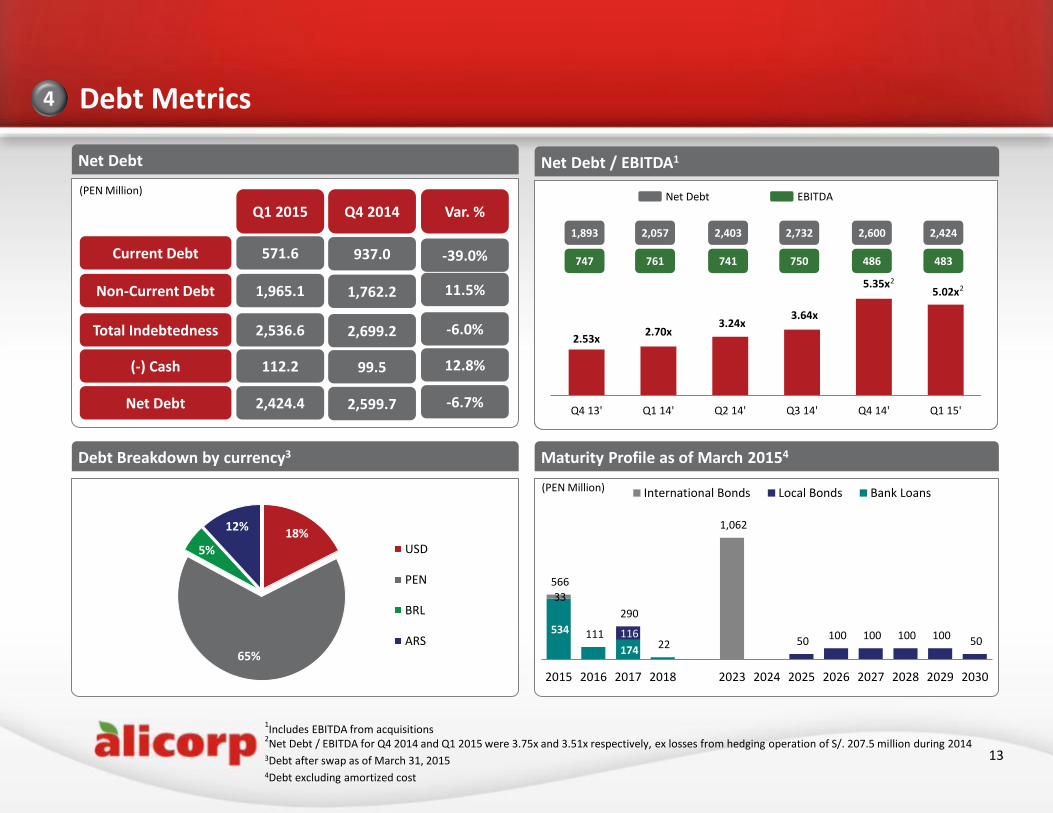
Debt Metrics
Net Debt
Q4 2014 Q1 2015
Current Debt
Non-Current Debt
Var. %
Total Indebtedness
(-) Cash
Net Debt
Debt Breakdown by currency3
1Includes EBITDA from acquisitions
2Net Debt / EBITDA for Q4 2014 and Q1 2015 were 3.75x and 3.51x respectively, ex losses from hedging operation of S/. 207.5 million during 2014
3Debt after swap as of March 31, 2015 4Debt excluding amortized cost
(PEN Million)
13
937.0 571.6 -39.0%
1,762.2 1,965.1 11.5%
2,699.2 2,536.6 -6.0%
99.5 112.2 12.8%
2,599.7 2,424.4 -6.7%
4
18%
65%
5%
12%
USD
PEN
BRL
ARS
Net Debt / EBITDA1
Maturity Profile as of March 20154
534
174
116
33
566
111
290
22
1,062
50 100 100 100 100 50
2015 2016 2017 2018 2023 2024 2025 2026 2027 2028 2029 2030
Mil
lare
s International Bonds Local Bonds Bank Loans(PEN Million)
2.53x 2.70x
3.24x 3.64x
5.35x 5.02x
Q4 13' Q1 14' Q2 14' Q3 14' Q4 14' Q1 15'
2,424
483
1,893
747
2,057
761
2,403
741
2,732
750
2,600
486
Net Debt EBITDA
2 2
[ C L I E N T N A M E ]
Presentation3
179.31.36
106.107.109
8.144.70
40.44.109
144.28.83
243.165.30
218.70.38
14.116.118
1237395-001.pptx
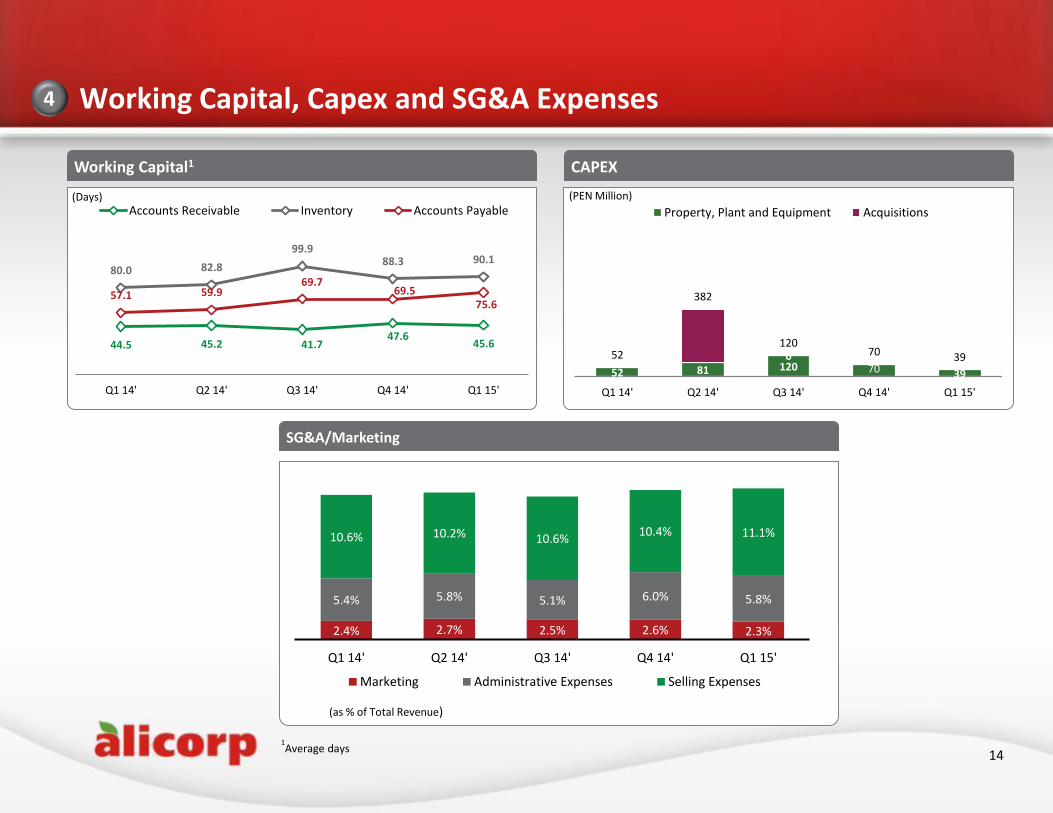
Working Capital, Capex and SG&A Expenses 4
14
Working Capital1
(Days)
CAPEX
(PEN Million)
SG&A/Marketing
44.5 45.2 41.7 47.6
45.6
80.0 82.8
99.9 88.3 90.1
57.1 59.9 69.7
69.5 75.6
Q1 14' Q2 14' Q3 14' Q4 14' Q1 15'
Accounts Receivable Inventory Accounts Payable
2.4% 2.7% 2.5% 2.6% 2.3%
5.4% 5.8% 5.1% 6.0% 5.8%
10.6% 10.2% 10.6% 10.4% 11.1%
Q1 14' Q2 14' Q3 14' Q4 14' Q1 15'
Marketing Administrative Expenses Selling Expenses
52 81 120 70 39
0 52
382
120 70 39
Q1 14' Q2 14' Q3 14' Q4 14' Q1 15'
Mill
ares
Property, Plant and Equipment Acquisitions
(as % of Total Revenue)
1Average days
[ C L I E N T N A M E ]
Presentation3
179.31.36
106.107.109
8.144.70
40.44.109
144.28.83
243.165.30
218.70.38
14.116.118
1237395-001.pptx
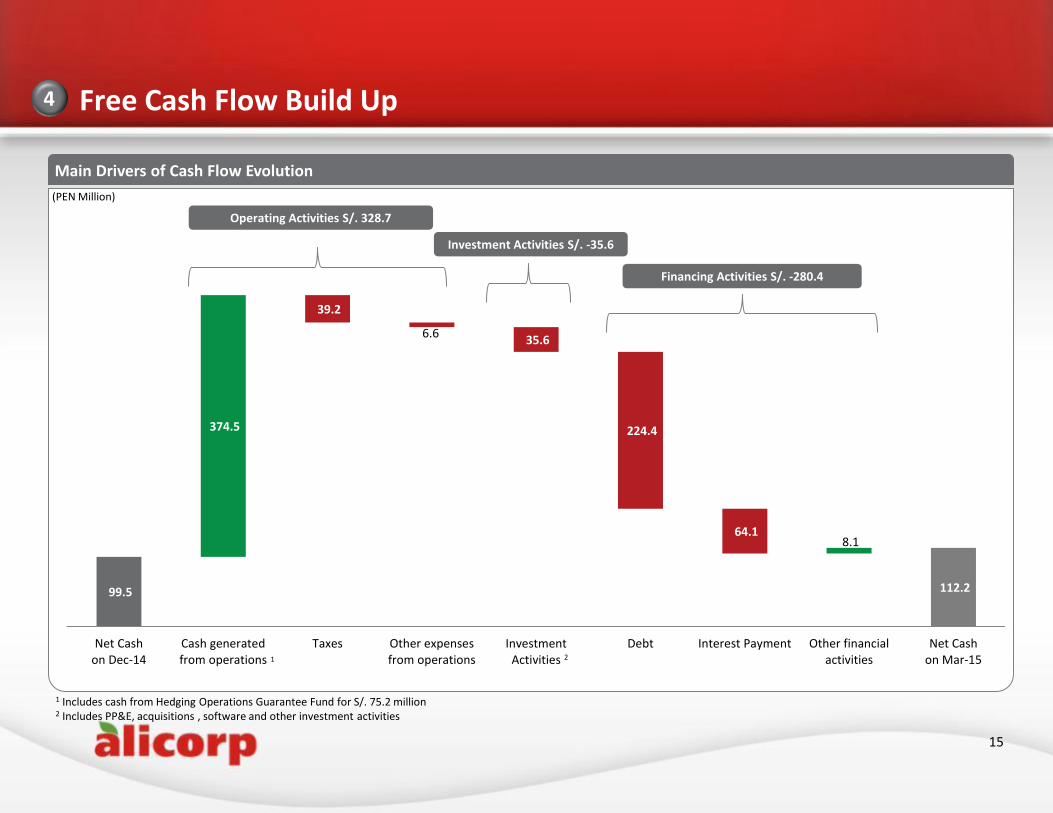
99.5
587.8
112.2
374.5
-
-
- 8.1
39.2
6.6 35.6
224.4
64.1
Net Cashon Dec-14
Cash generatedfrom operations
Taxes Other expensesfrom operations
InvestmentActivities
Debt Interest Payment Other financialactivities
Net Cashon Mar-15
4
15
Main Drivers of Cash Flow Evolution
Free Cash Flow Build Up
(PEN Million)
1 Includes cash from Hedging Operations Guarantee Fund for S/. 75.2 million 2 Includes PP&E, acquisitions , software and other investment activities
Operating Activities S/. 328.7
Financing Activities S/. -280.4
Investment Activities S/. -35.6
1 2
[ C L I E N T N A M E ]
Presentation3
179.31.36
106.107.109
8.144.70
40.44.109
144.28.83
243.165.30
218.70.38
14.116.118
1237395-001.pptx
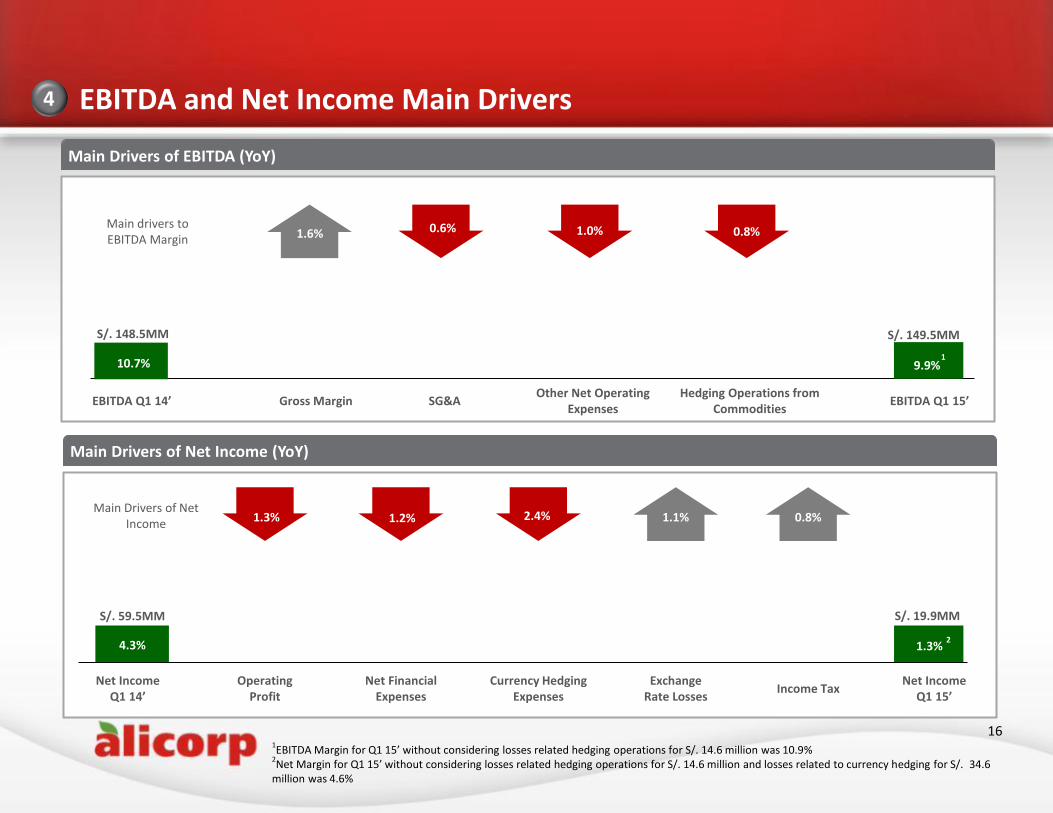
EBITDA and Net Income Main Drivers
Main Drivers of EBITDA (YoY)
16
4
1EBITDA Margin for Q1 15’ without considering losses related hedging operations for S/. 14.6 million was 10.9%
2Net Margin for Q1 15’ without considering losses related hedging operations for S/. 14.6 million and losses related to currency hedging for S/._34.6
million was 4.6%
SG&A Other Net Operating
Expenses Gross Margin
Main drivers to EBITDA Margin
Hedging Operations from Commodities
% 1.6% 0.6% 1.0% 0.8%
EBITDA Q1 14’
10.7%
S/. 148.5MM
EBITDA Q1 15’
S/. 149.5MM
9.9% 1
Main Drivers of Net Income (YoY)
1.3% 1.2%
Net Income Q1 15’
S/. 59.5MM S/. 19.9MM
Net Income Q1 14’
4.3% 1.3%
Operating Profit
Net Financial Expenses
Exchange Rate Losses
Income Tax
1.1% 2.4%
Currency Hedging Expenses
0.8%
2
Main Drivers of Net Income
[ C L I E N T N A M E ]
Presentation3
179.31.36
106.107.109
8.144.70
40.44.109
144.28.83
243.165.30
218.70.38
14.116.118
1237395-001.pptx
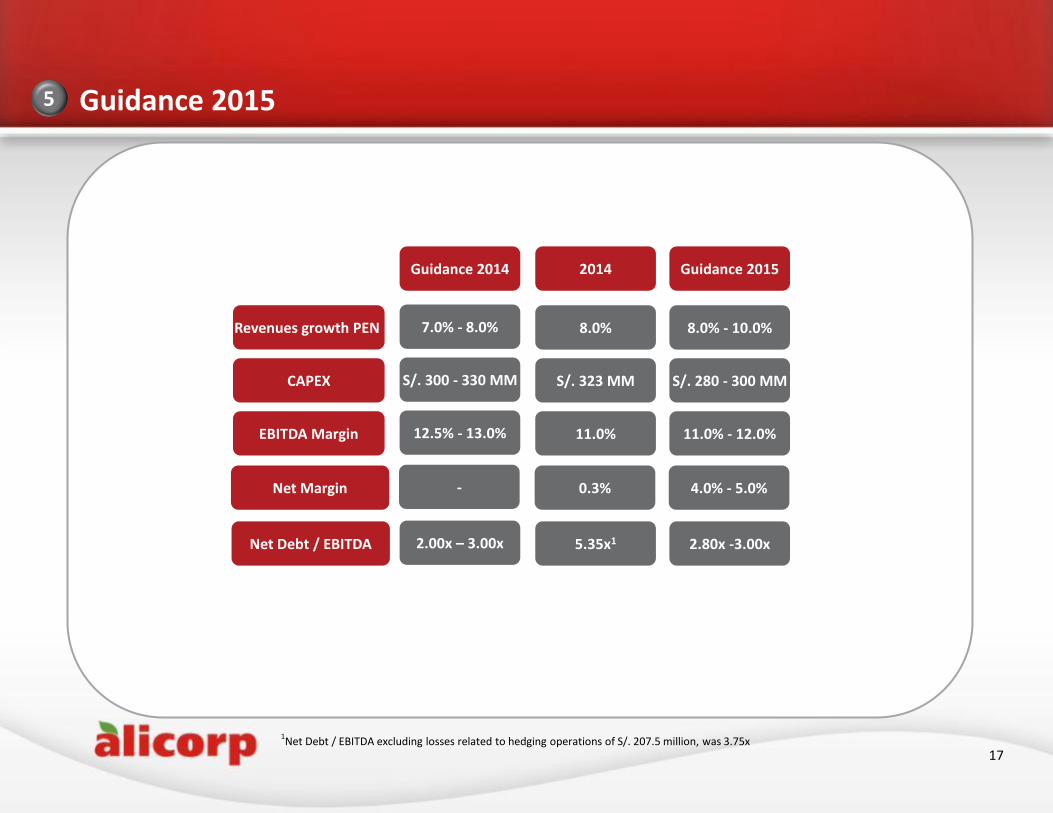
Guidance 2015 179.31.36
106.107.109
8.144.70
40.44.109
144.28.83
243.165.30
218.70.38
14.116.118
5
17
1Net Debt / EBITDA excluding losses related to hedging operations of S/. 207.5 million, was 3.75x
2014 Guidance 2014
8.0% 7.0% - 8.0%
11.0%
12.5% - 13.0%
S/. 323 MM S/. 300 - 330 MM
Revenues growth PEN
EBITDA Margin
CAPEX
5.35x1 2.00x – 3.00x Net Debt / EBITDA
Guidance 2015
8.0% - 10.0%
11.0% - 12.0%
S/. 280 - 300 MM
2.80x -3.00x
0.3% - Net Margin 4.0% - 5.0%

[ C L I E N T N A M E ]
Q&A
18