Embed Size (px)
Citation preview
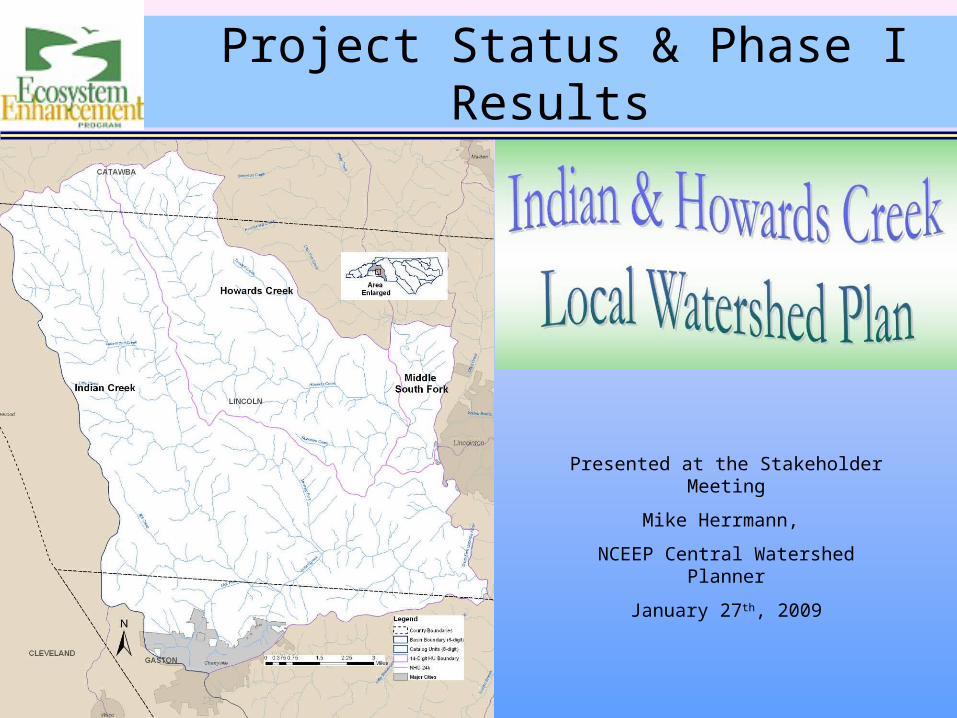
Presented at the Stakeholder Meeting
Mike Herrmann,
NCEEP Central Watershed Planner
January 27th, 2009
Project Status & Phase I Results
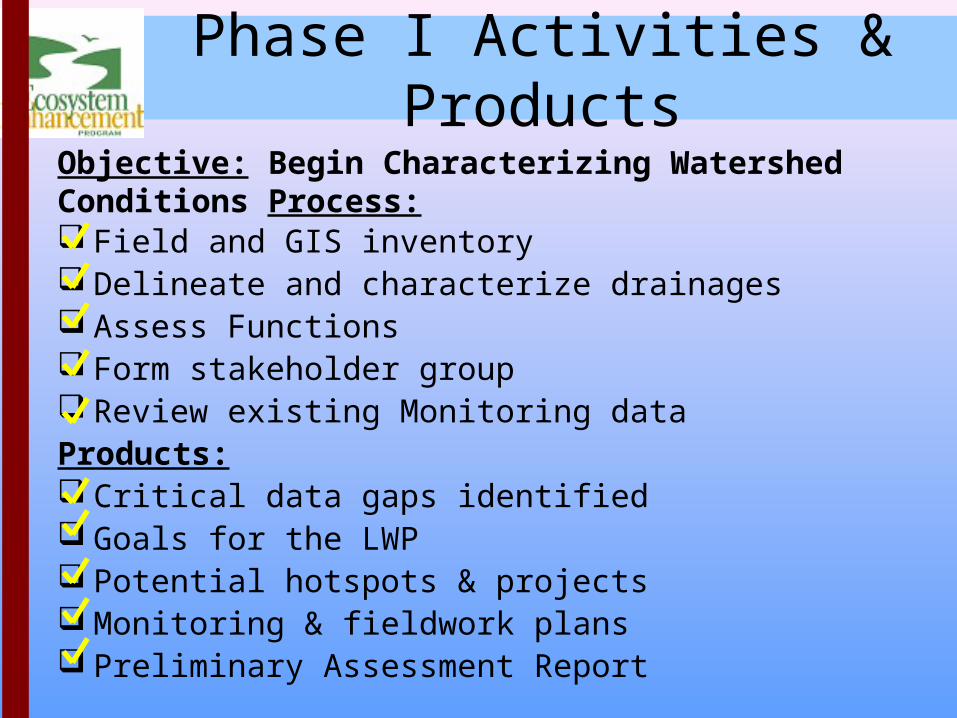
Field and GIS inventory Delineate and characterize drainages Assess Functions Form stakeholder group Review existing Monitoring dataProducts: Critical data gaps identified Goals for the LWP Potential hotspots & projects Monitoring & fieldwork plans Preliminary Assessment Report
Objective: Begin Characterizing Watershed Conditions Process:
Phase I Activities & Products
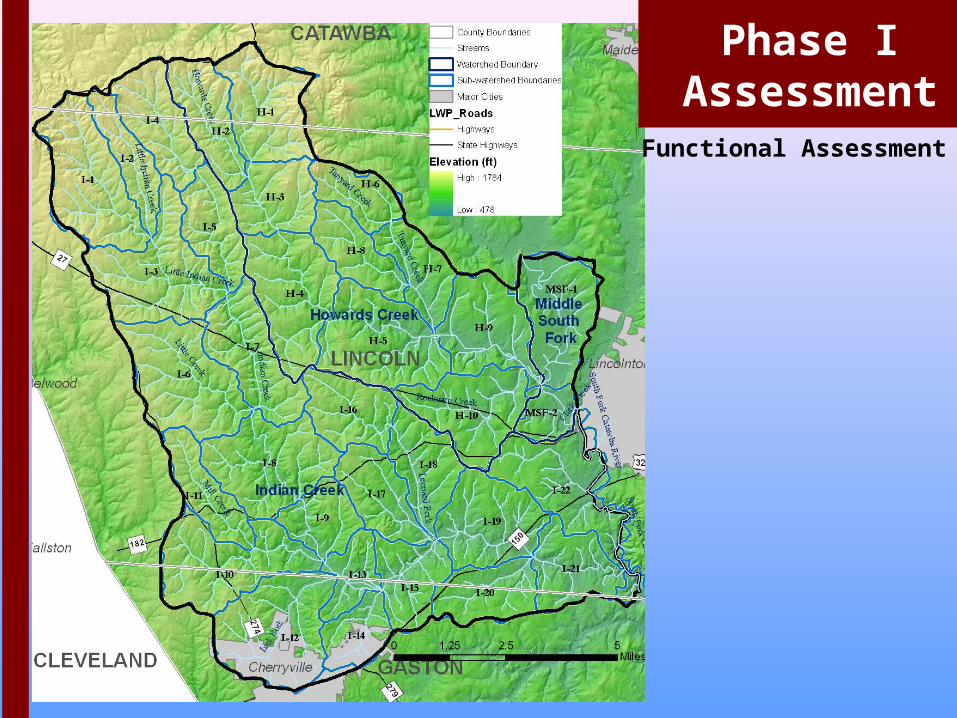
Functional Assessment
Phase I Assessment

o Diverse aquatic & terrestrial communities o Abundant and diverse microhabitat (sticks,
leaf packs, logs, and root masses)o Limited embeddedness (covering of channel
by fine sediment)o Stable streambankso A variety of bottom substrate (sand, gravel,
cobbles and boulders)o Stream canopy covero Terrestrial habitat is abundant and
provides adequate food and sheltero Promotes propagation of native
and/or threatened specieso Minimally fragmented forestso Forested wetlands and corridors
*Bold specifies that the factor was part of the Phase I Assessment
Phase I Assessment
Assessment Factors
Hexastylis naniflora (Dwarf flowered Heartleaf).
Habitat Function
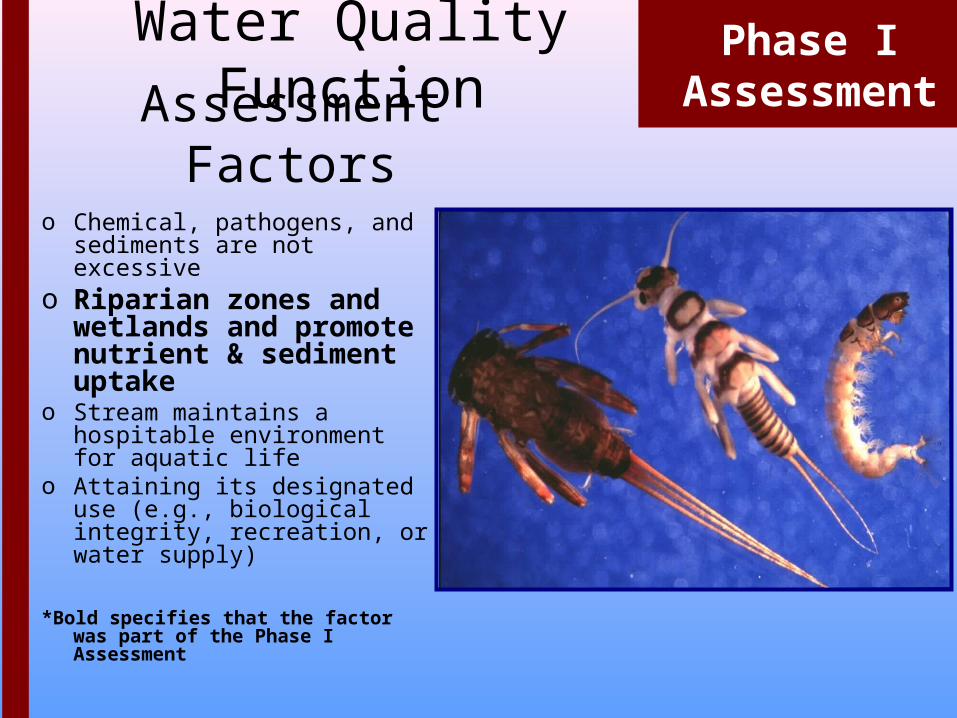
Water Quality Function
o Chemical, pathogens, and sediments are not excessive
o Riparian zones and wetlands and promote nutrient & sediment uptake
o Stream maintains a hospitable environment for aquatic life
o Attaining its designated use (e.g., biological integrity, recreation, or water supply)
*Bold specifies that the factor was part of the Phase I Assessment
Phase I Assessment
Assessment Factors

Hydrology Function Phase I AssessmentAssessment Factors
o Wooded floodplains to slow flood flows, reducing stress on streams
o Upland areas also have higher amounts of forests, wetlands, or other permeable land cover that encourage infiltration
o Effective transport of water and sedimento Low bank-height ratios (vertical stability)o Reasonably stable streambanks (lateral stability) o Higher base flows, and lower peak flows o Promote groundwater recharge while storing floodwater flows and
deposited sediment
*Bold specifies that the factor was part of the Phase I Assessment

Hydrology – Draft Results Phase I AssessmentForested floodplain & riparian area
Watershed
Disturbed Floodplain
Acres
Total Floodplain
Acres% of Area Disturbed
Indian Creek 1,286 6,130 21%
Howard’s Creek 755 2,612 29%
Middle South Fork 560 1,090 51%
LWP Total 2,601 9,832 26%
100-year floodplain
Floodplain Conditions, Middle Indian Creek
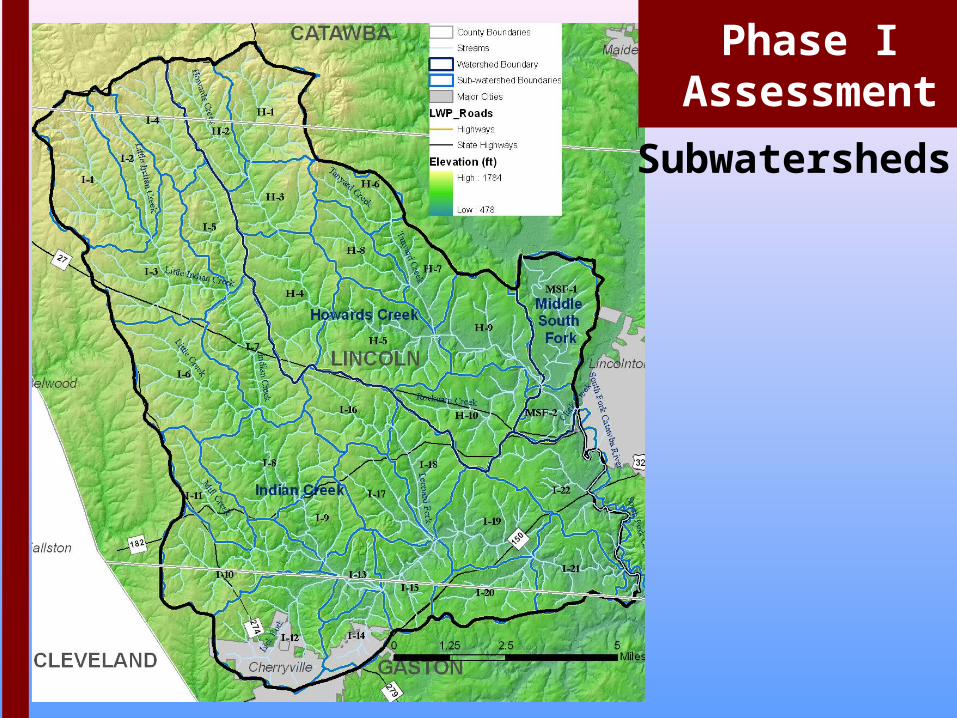
Subwatersheds
Phase I Assessment
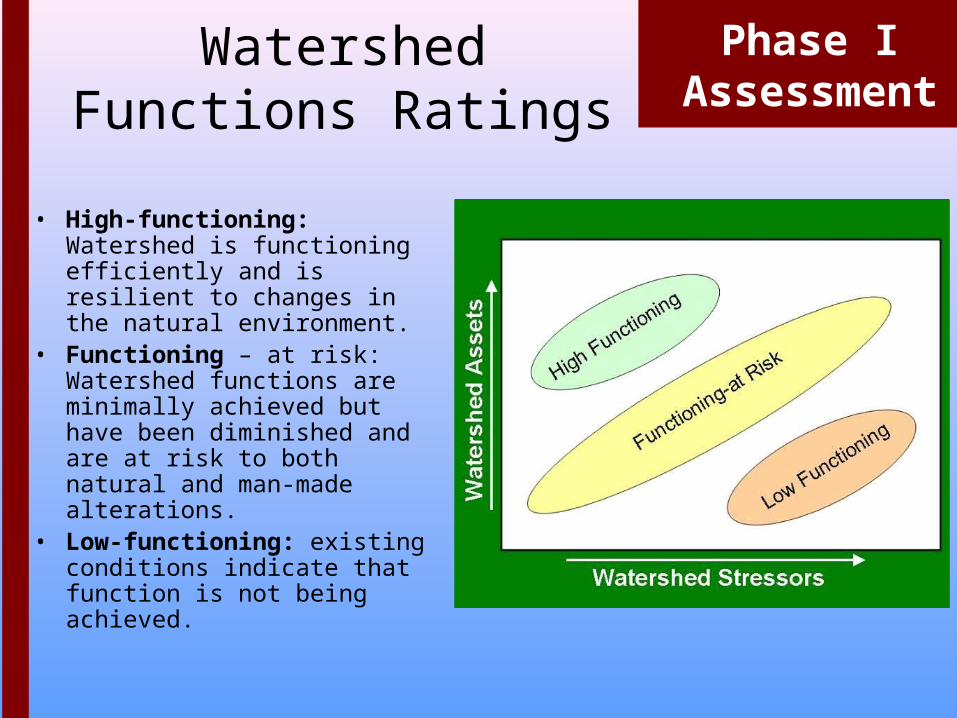
Watershed Functions Ratings
Phase I Assessment
• High-functioning: Watershed is functioning efficiently and is resilient to changes in the natural environment.
• Functioning – at risk: Watershed functions are minimally achieved but have been diminished and are at risk to both natural and man-made alterations.
• Low-functioning: existing conditions indicate that function is not being achieved.
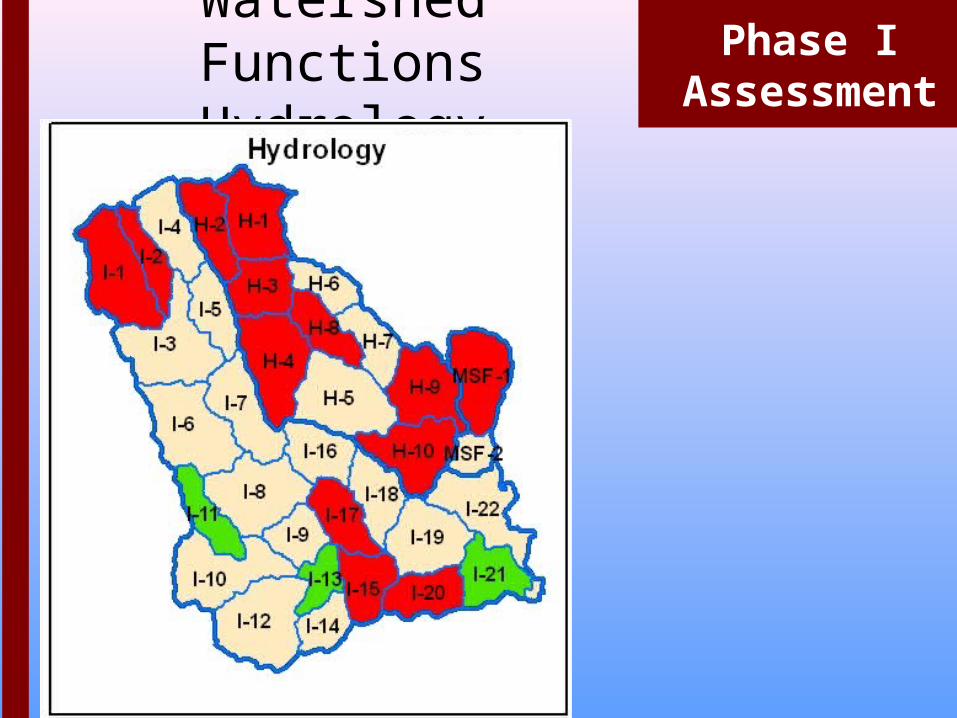
Watershed FunctionsHydrology
Phase I Assessment
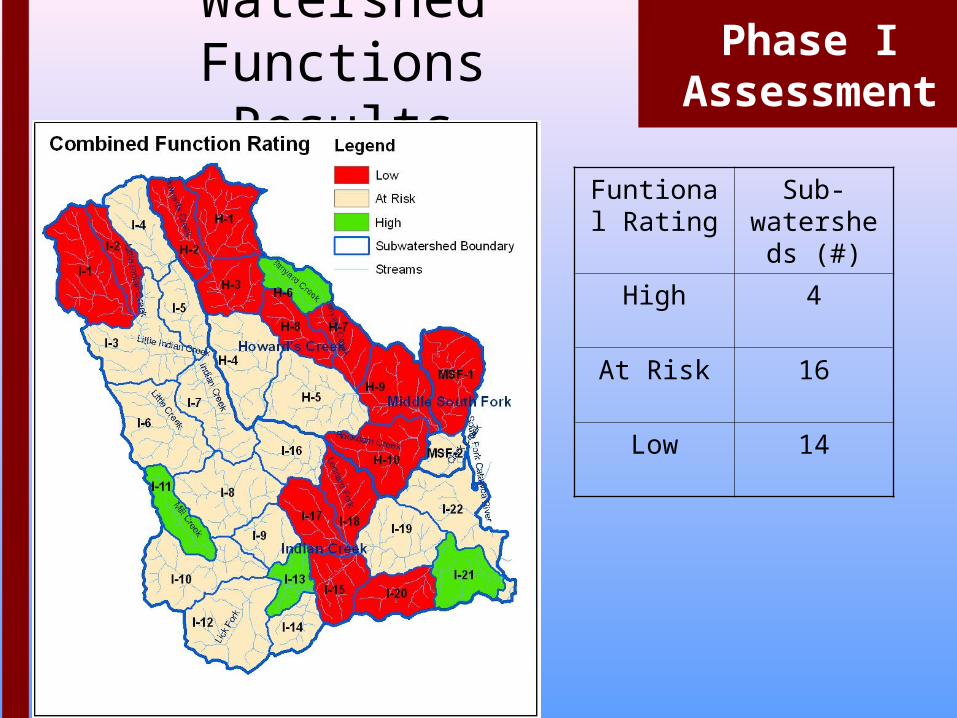
Watershed FunctionsResults
Phase I Assessment
Funtional Rating
Sub-watersheds
(#)
High 4
At Risk 16
Low 14

Phase I Gaps Phase I Assessment
• How do streams compare to regional reference conditions? • How has drought affected aquatic biology?• Are water quality conditions in streams draining urban subwatersheds
comparable to rural subwatersheds?• Are water quality conditions healthy upstream of Cherryville’s drinking
water intake? • What are the stressors for the lower Indian Creek Impairment?
Monitoring

Phase I Gaps Phase I Assessment
o Streambank Stabilityo Low bank-height ratios (vertical stability)o Microhabitat Condition (sticks, leaf packs, logs, and root
masses)o Limited embeddedness (covering of channel by fine
sediment)o A variety of bottom substrate (sand, gravel, cobbles and
boulders)o Identification of Stream and Wetland Stressorso Identification of Natural Resource Assetso Assess Stormwater BMP opportunities in watersheds
draining Cherryville.
Stream and Wetland Conditions
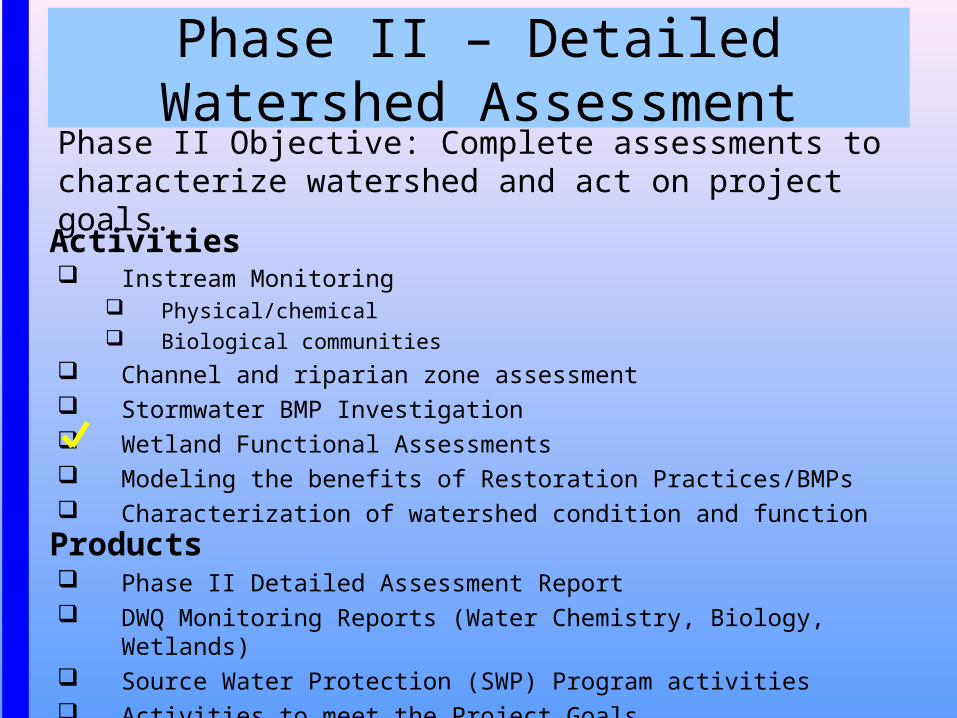
Instream Monitoring Physical/chemical Biological communities
Channel and riparian zone assessment Stormwater BMP Investigation Wetland Functional Assessments Modeling the benefits of Restoration Practices/BMPs Characterization of watershed condition and function
Phase II Detailed Assessment Report DWQ Monitoring Reports (Water Chemistry, Biology, Wetlands) Source Water Protection (SWP) Program activities Activities to meet the Project Goals
Phase II Objective: Complete assessments to characterize watershed and act on project goals.
Phase II – Detailed Watershed Assessment
Activities
Products
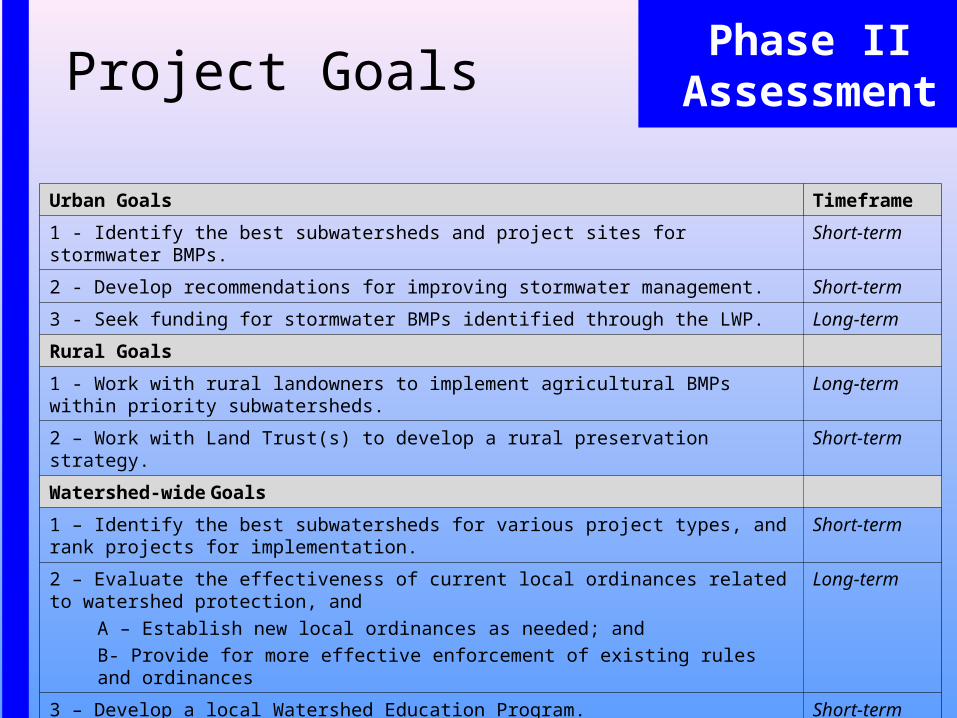
Urban Goals Timeframe
1 - Identify the best subwatersheds and project sites for stormwater BMPs. Short-term
2 - Develop recommendations for improving stormwater management. Short-term
3 - Seek funding for stormwater BMPs identified through the LWP. Long-term
Rural Goals
1 - Work with rural landowners to implement agricultural BMPs within priority subwatersheds. Long-term
2 – Work with Land Trust(s) to develop a rural preservation strategy. Short-term
Watershed-wide Goals
1 – Identify the best subwatersheds for various project types, and rank projects for implementation. Short-term
2 – Evaluate the effectiveness of current local ordinances related to watershed protection, and
A – Establish new local ordinances as needed; and
B- Provide for more effective enforcement of existing rules and ordinances
Long-term
3 – Develop a local Watershed Education Program. Short-term
4 – Develop a Source Water Protection Plan for Cherryville. Short-term
Project GoalsPhase II
Assessment

Phase II Fieldwork Planning Phase II Assessment• Developing Fieldwork Plan
– Entrix under contract to complete the following assessments
Feature Sites Visited Project Report
Impacted Streams 40 (~25 miles) 25 (~15 miles)
Impacted Wetlands 30 (~270ac) 20 (~150 ac)
Stream Preservation
20 Streams (~14 miles)
10 (~10 miles)
Stormwater BMPs Up to 10 stream reaches
3 BMPs
Ag BMPs (modeled BMPs)
0 5
--
--
--
--
--
Winter 2008
Summer 2008
Winter 08/09
Summer 2009
Planning Process Begins
Monitoring Begins
Develop Preliminary FindingsPhase 1 Activities End
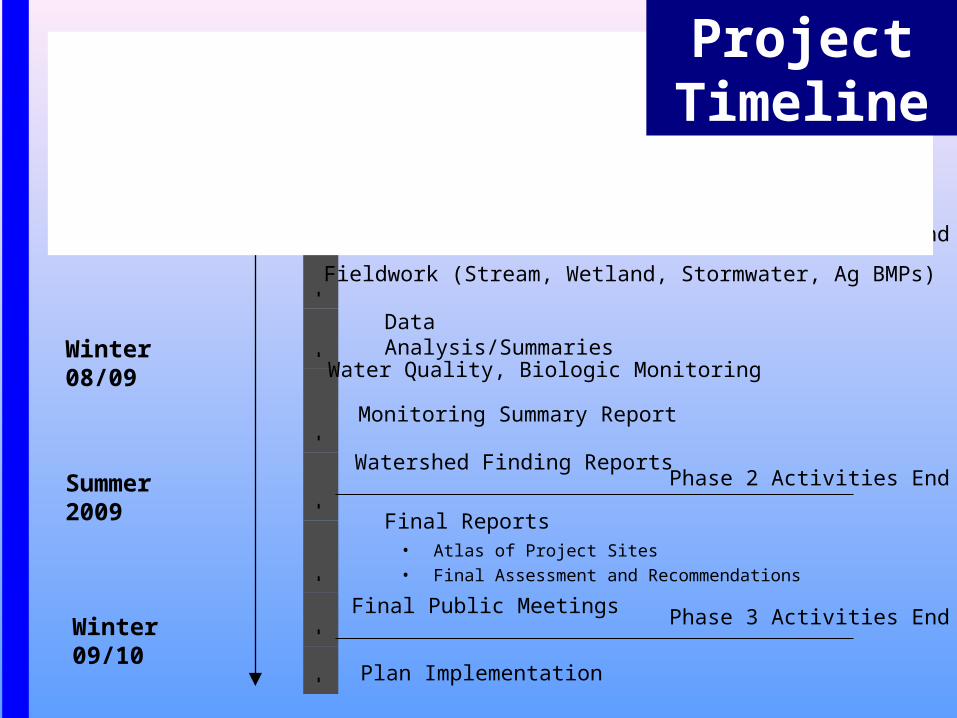
Fieldwork (Stream, Wetland, Stormwater, Ag BMPs)
Data Analysis/Summaries
Water Quality, Biologic Monitoring
Watershed Finding Reports
Final Public Meetings
Final Reports
Phase 2 Activities End
Plan Implementation
Phase 3 Activities EndWinter 09/10
• Atlas of Project Sites
• Final Assessment and Recommendations
Monitoring Summary Report
Form Stakeholder Group
Project Timeline