Embed Size (px)
Citation preview
Best Practices for
Environmental Site Management
Presented to
CLU-InApril 3, 2018
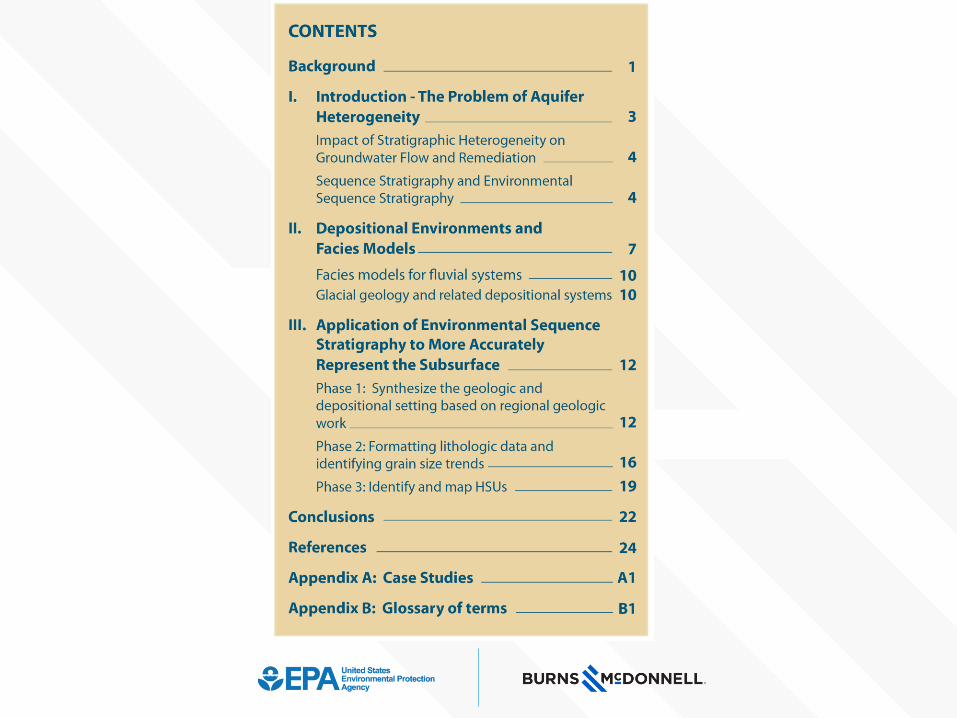
A Practical Guide for Applying
Environmental Sequence Stratigraphy (ESS)
to Improve Conceptual Site Models
US EPA Emphasis on Geologic Based CSMs and Remediation Based Geology
► EPA is committed to applying stratigraphic analysis to our hazardous waste
sites. It is our expectation that stratigraphic analysis utilizing the methods
presented in this new EPA guidance be considered at each site.
► EPA has advocated updating existing conceptual site models when new data
are obtained. This new EPA guidance presents a methodology utilizing
existing data, new data are not necessarily required to perform this analysis.
► Updating existing conceptual site models can occur at any time, from EPA’s
perspective this can occur in the near term.
► Stratigraphic analysis is best conducted by experienced stratigraphers. EPA
will be writing into contracts for conceptual site models developed on our
behalf be prepared in collaboration with a stratigrapher.
► EPA’s expectation is for work products and reports submitted to our agency
also be checked by an knowledgeable and experienced stratigrapher.
► Best Practice series of papers, two completed three in prep
► BEST PRACTICES FOR ENVIRONMENTAL SITE MANAGEMENT,
A Practical Guide for Applying Environmental Sequence Stratigraphy to
Improve Conceptual Site Models
► BEST PRACTICES FOR ENVIRONMENTAL SITE MANAGEMENT,
Contents of a Groundwater Monitoring Report
► BEST PRACTICES FOR ENVIRONMENTAL SITE MANAGEMENT, A
Framework for Characterizing Groundwater/Surface Water Interaction
► BEST PRACTICES FOR ENVIRONMENTAL SITE MANAGEMENT,
Geology Characterization of Hazardous Waste Sites
► BEST PRACTICES FOR ENVIRONMENTAL SITE MANAGEMENT,
Groundwater Sampling Methods
► Stay tuned, publication and training announcements will be made in
EPA’s TechDirect
US EPA Geology Initiative
General Benefits of ESS Approach
► Identify groundwater flow paths and preferential
contaminant migration pathways
► Map and predict contaminant mass transport (high
permeability) zones and matrix diffusion-related storage
(low permeability) zones
► Identify data gaps and determine a focused HRSC program,
if needed
► Optimize groundwater monitoring program
► Improve efficiency and timeliness of remediating
contaminated groundwater
► Reduce cost of remediation
US EPA Geology Initiative
► 90% of mass flux contaminant transport at Superfund
sites has been shown to be through 10% of aquifer
material.
► A site conceptual model that accurately reflects the
geologic plumbing is essential for remedy selection
and implementation.
► Site conceptual models that do not consider
depositional environment tend to incorrectly interpret
the geologic plumbing which leads to faulty remedy
selection/design and unnecessarily lengthy cleanups.

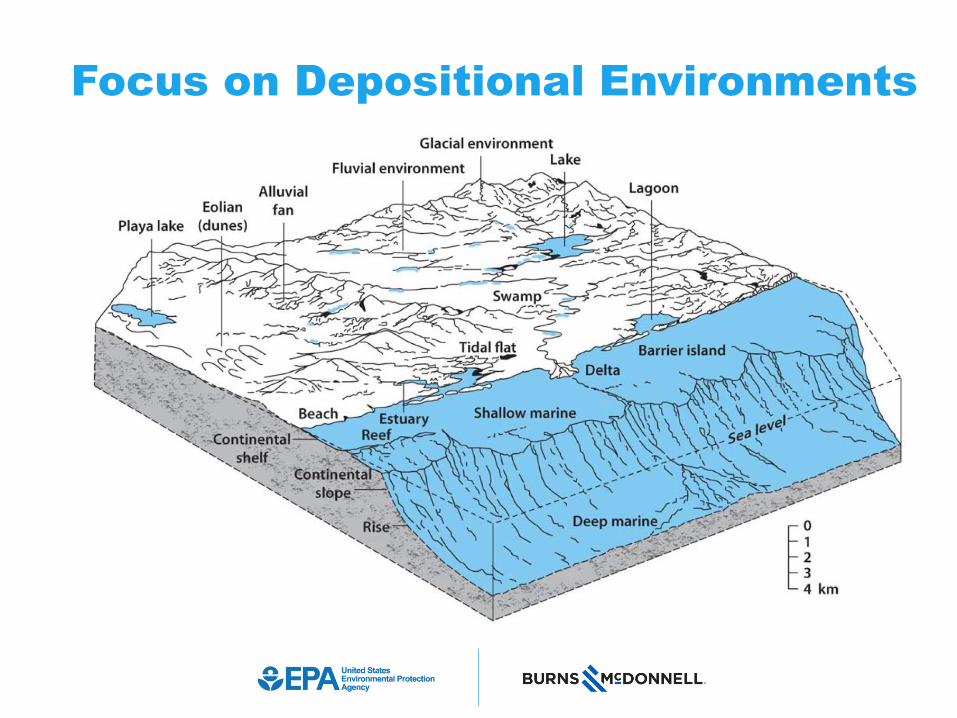
Focus on Depositional Environments
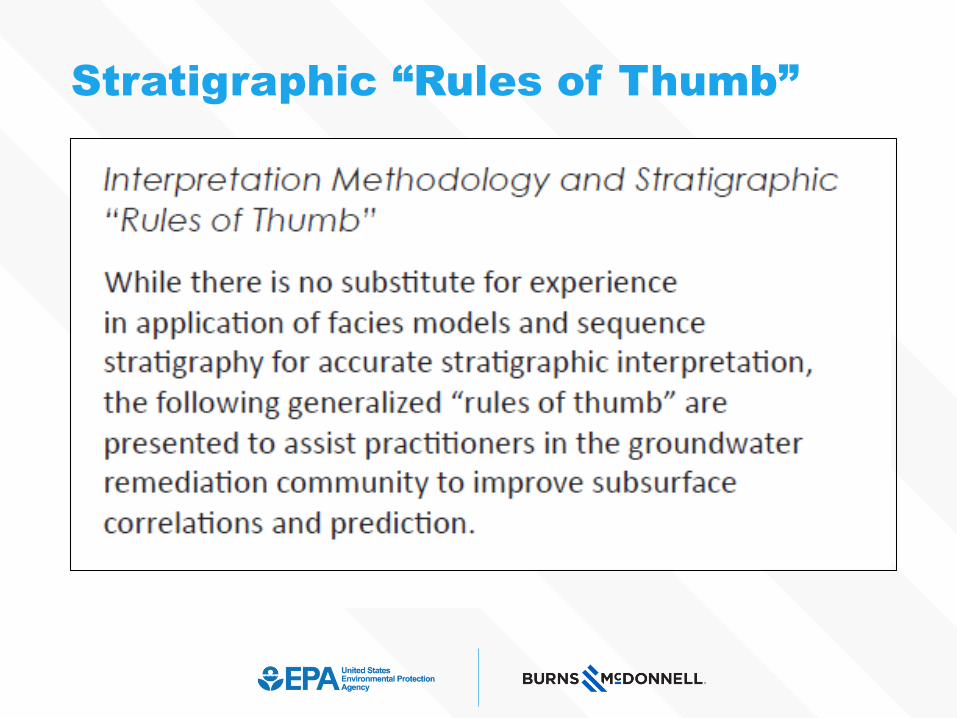
Stratigraphic “Rules of Thumb”
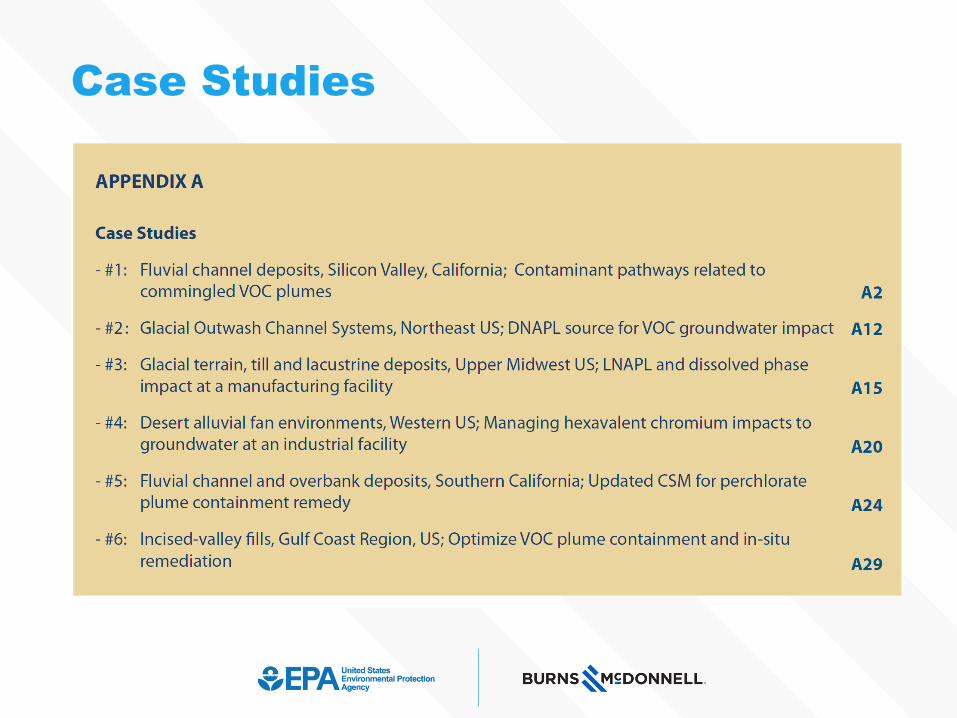
Case Studies
► Paradigm Shift Remediation Geology
► Why Environmental Sequence Stratigraphy (ESS)
(The Challenge of Subsurface Heterogeneity)
► What is ESS?
► Case Studies
► Silicon Valley groundwater remediation project
► Kirtland AFB, Albuquerque NM
Presentation Outline
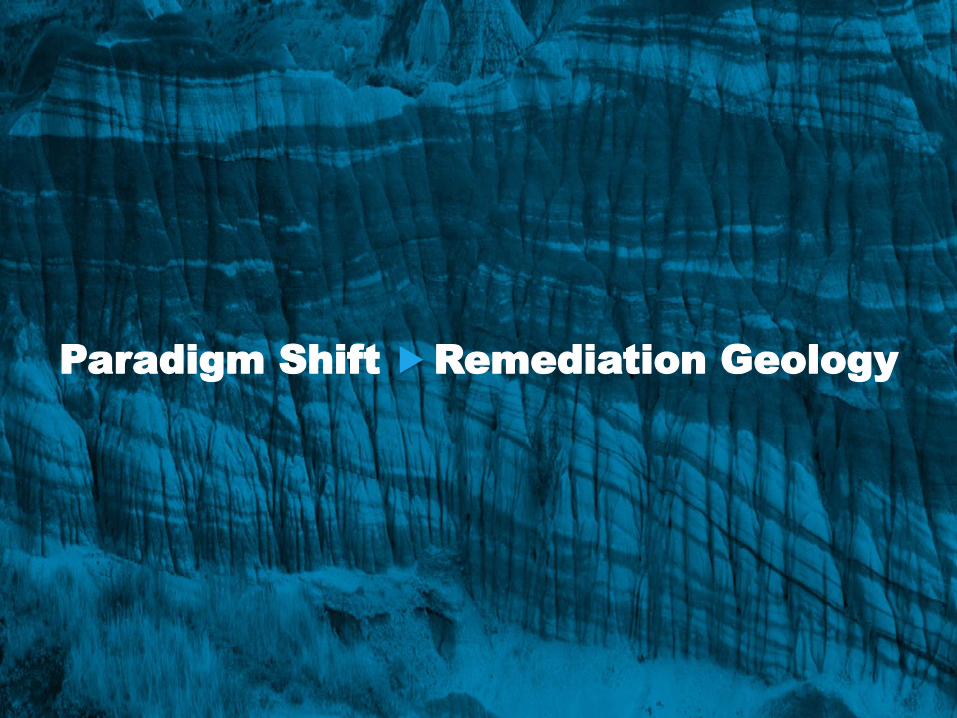
Paradigm Shift Remediation Geology

The science that deals with the earth's physical
structure and substance, its history, and the
processes that act on it.
Geology (stratigraphy) defines the subsurface
“plumbing” that is the primary control of groundwater
flow and contaminant transport.
A Definition of Geology
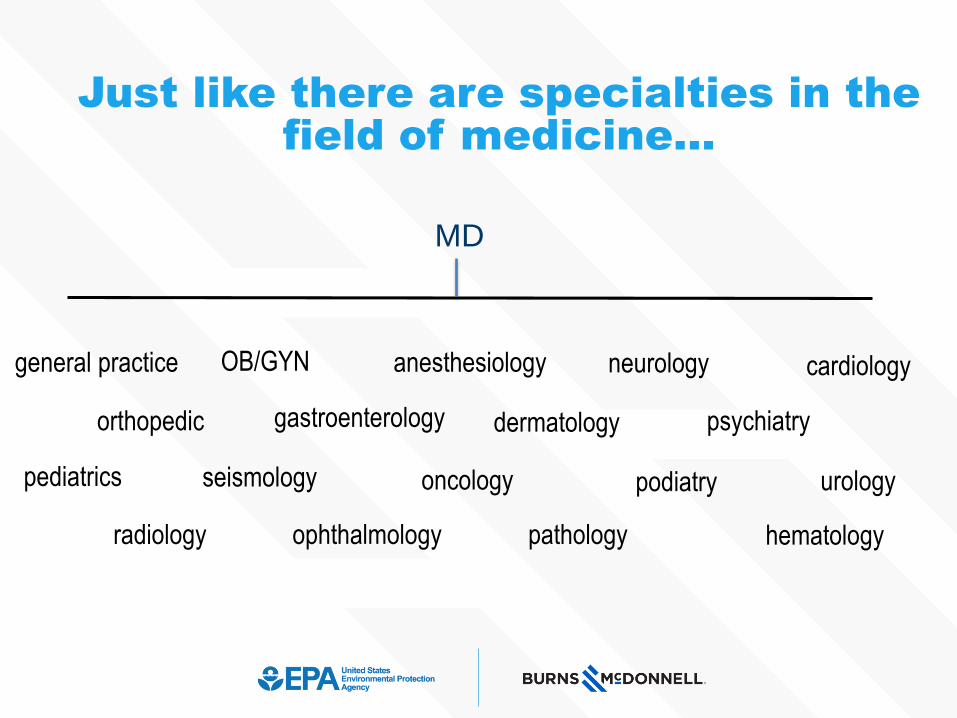
Just like there are specialties in the field of medicine…
MD
general practice anesthesiology cardiology
gastroenterology
OB/GYN
dermatology psychiatry
neurology
seismologypediatrics urologyoncology podiatry
radiology ophthalmology pathology
orthopedic
hematology

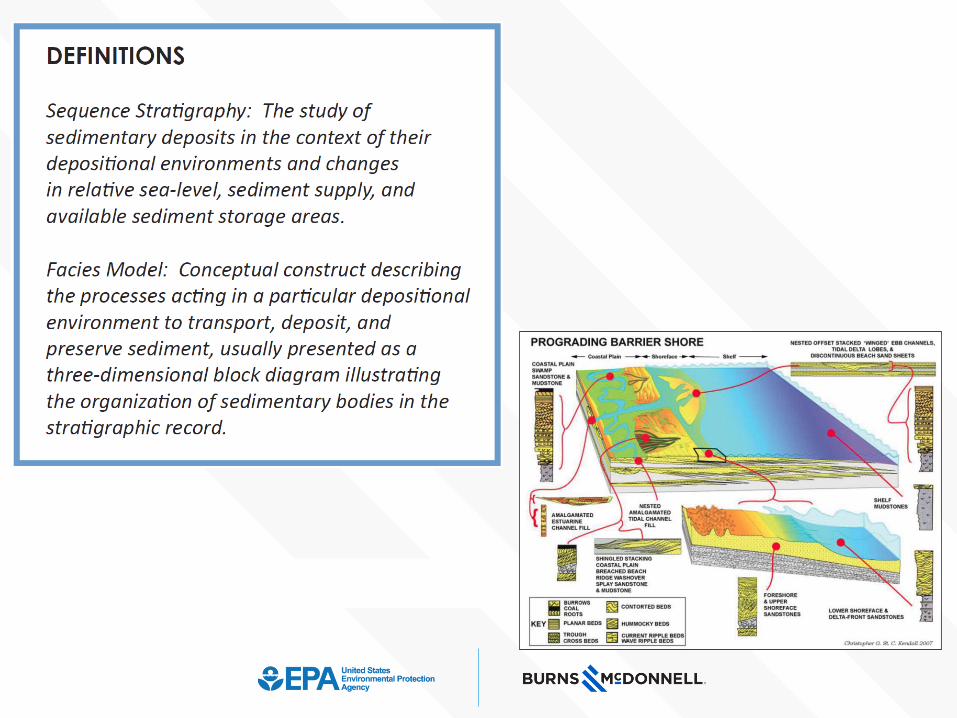
Stratigraphy, Subset of Geology: Interpretation of stratified rocks
Geology
mineralogy geophysics marine geology
geochemistry
economic geology
structural geology sedimentology
stratigraphy
seismologypaleontology tectonicshydrogeology petroleum geology
engineering geology geomorphology igneous petrology
volcanology
metamorphic petrology
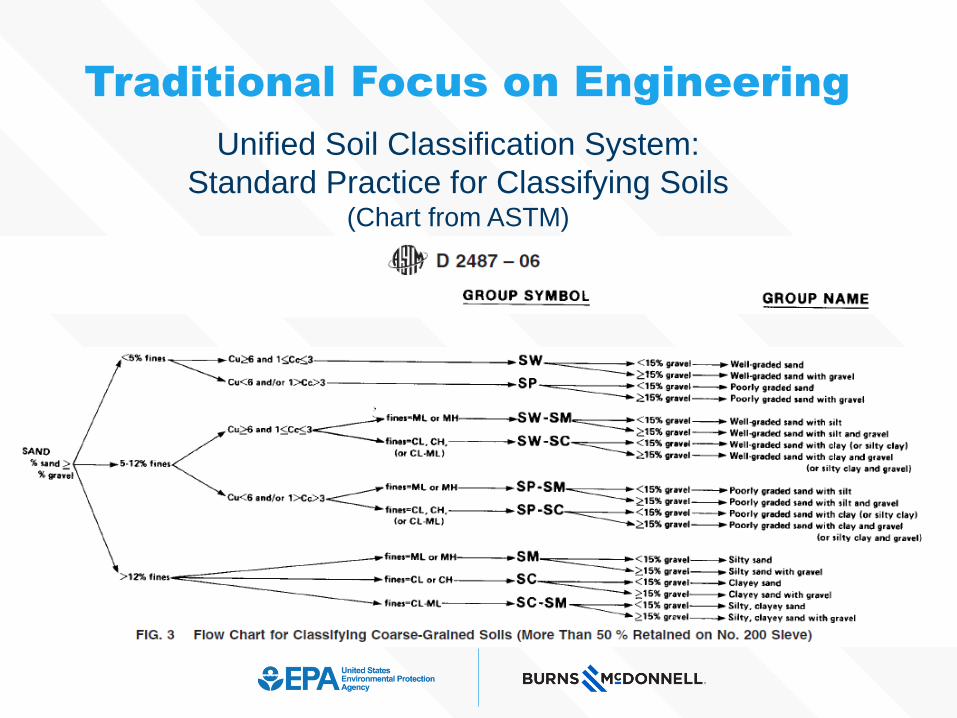
Unified Soil Classification System:
Standard Practice for Classifying Soils(Chart from ASTM)
Traditional Focus on Engineering
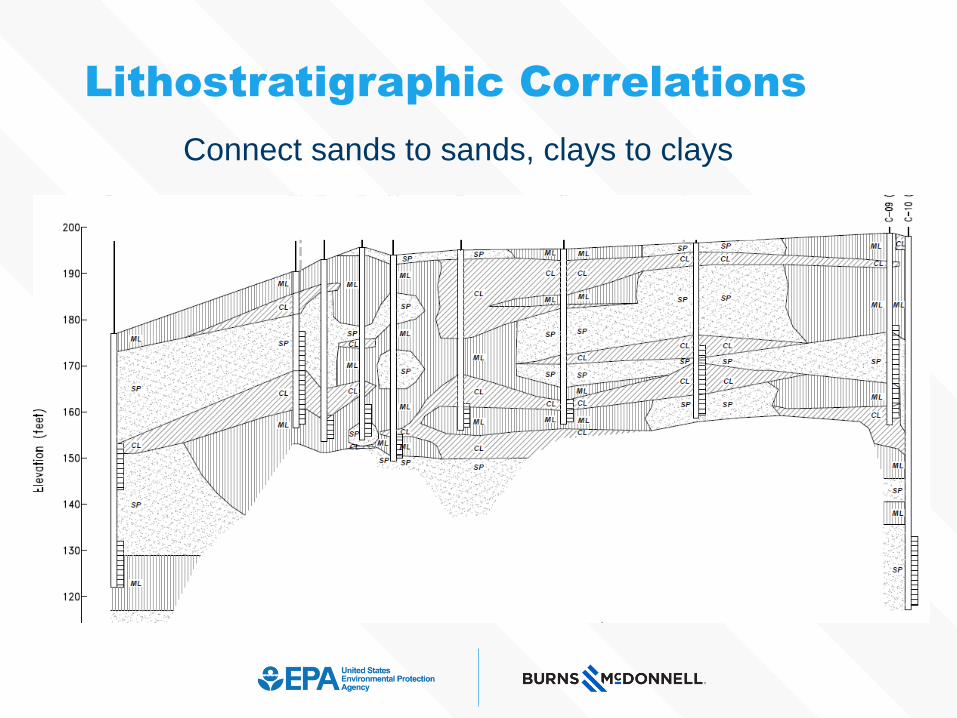
Lithostratigraphic Correlations
Connect sands to sands, clays to clays
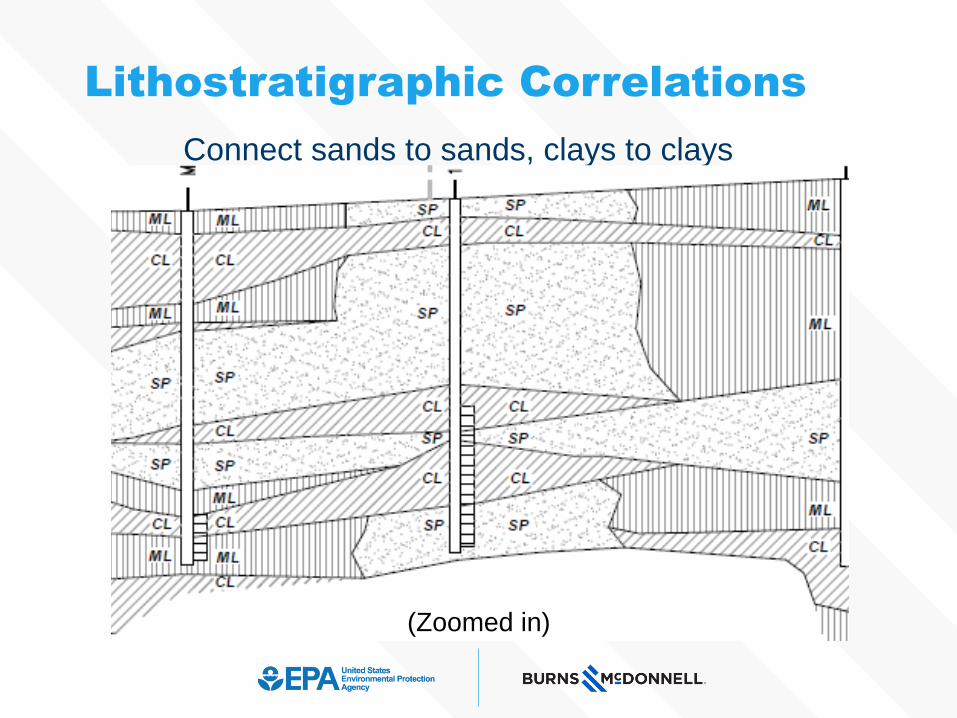
Lithostratigraphic Correlations
Connect sands to sands, clays to clays
(Zoomed in)
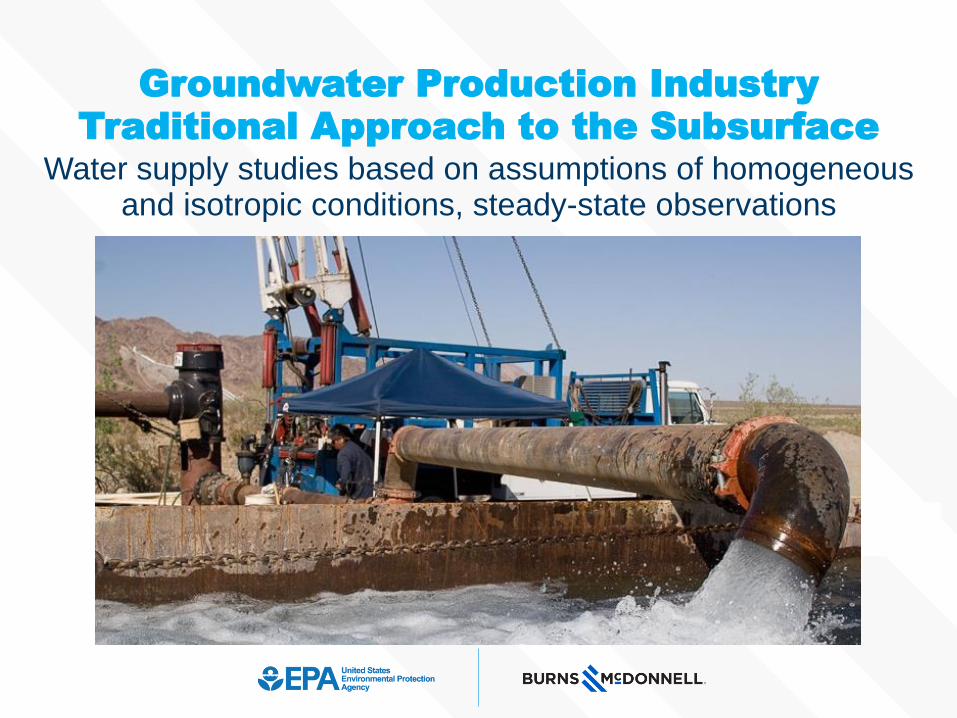
Groundwater Production IndustryTraditional Approach to the Subsurface
Water supply studies based on assumptions of homogeneousand isotropic conditions, steady-state observations
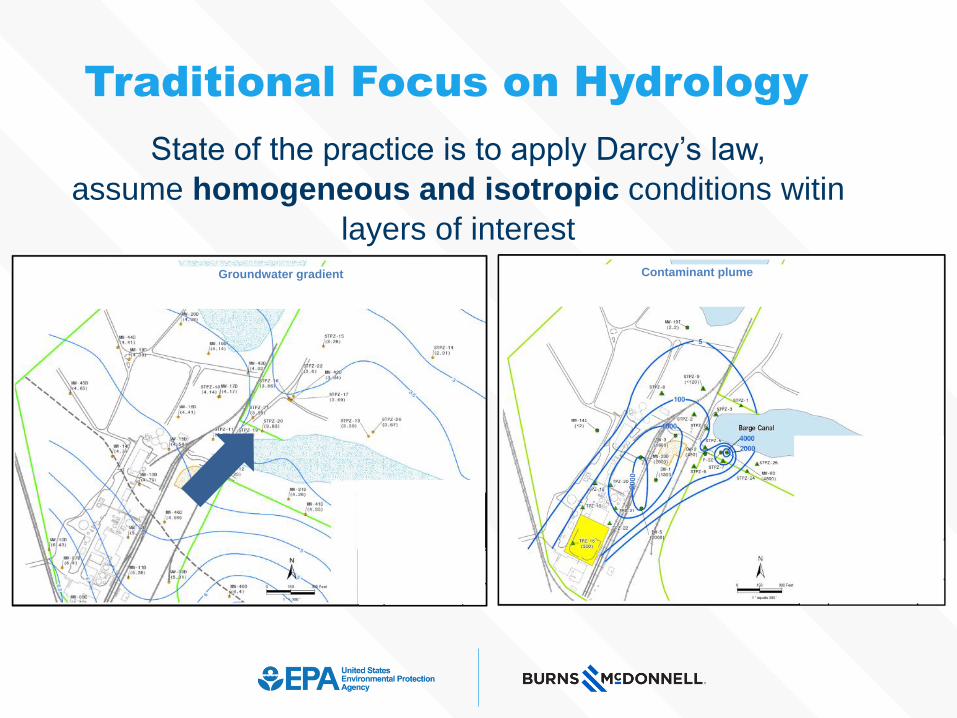
State of the practice is to apply Darcy’s law,
assume homogeneous and isotropic conditions witin
layers of interestContaminant plumeGroundwater gradient
Traditional Focus on Hydrology

Why
Environmental Sequence Stratigraphy
(ESS)?
The Challenge of Subsurface Heterogeneity
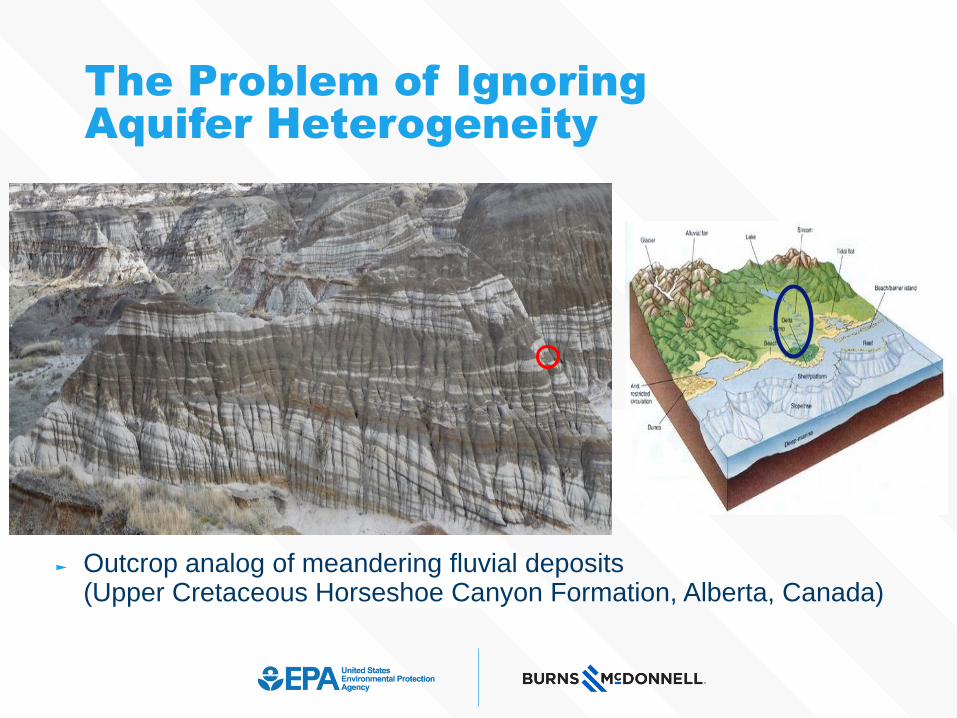
► Outcrop analog of meandering fluvial deposits (Upper Cretaceous Horseshoe Canyon Formation, Alberta, Canada)
The Problem of IgnoringAquifer Heterogeneity
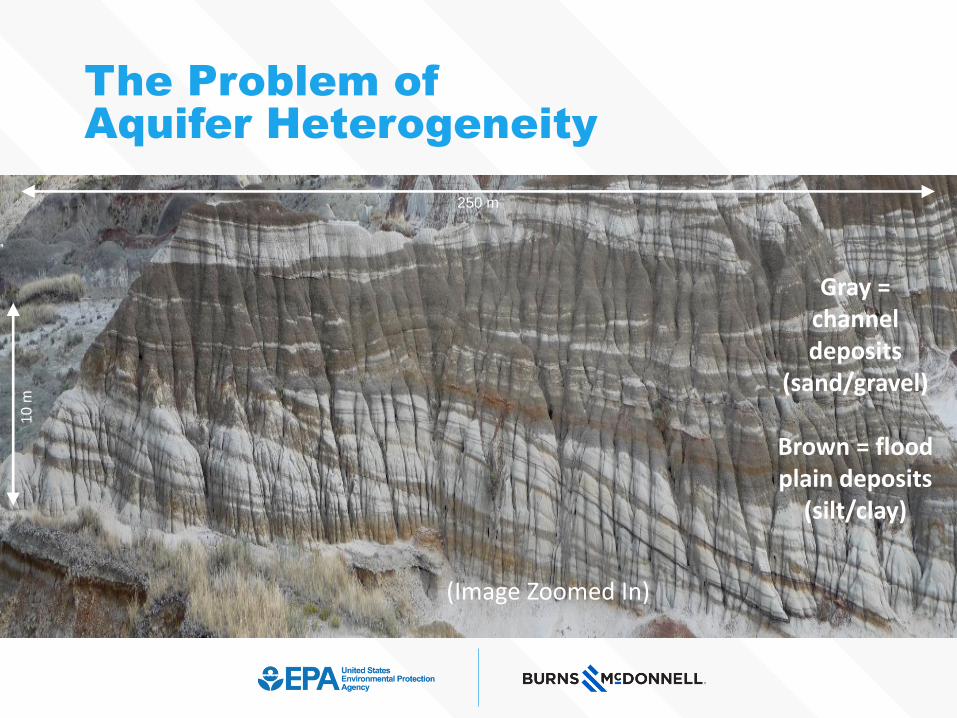
The Problem ofAquifer Heterogeneity
250 m
10
m
(Image Zoomed In)
Gray = channel deposits
(sand/gravel)
Brown = flood plain deposits
(silt/clay)
250 m
10
m
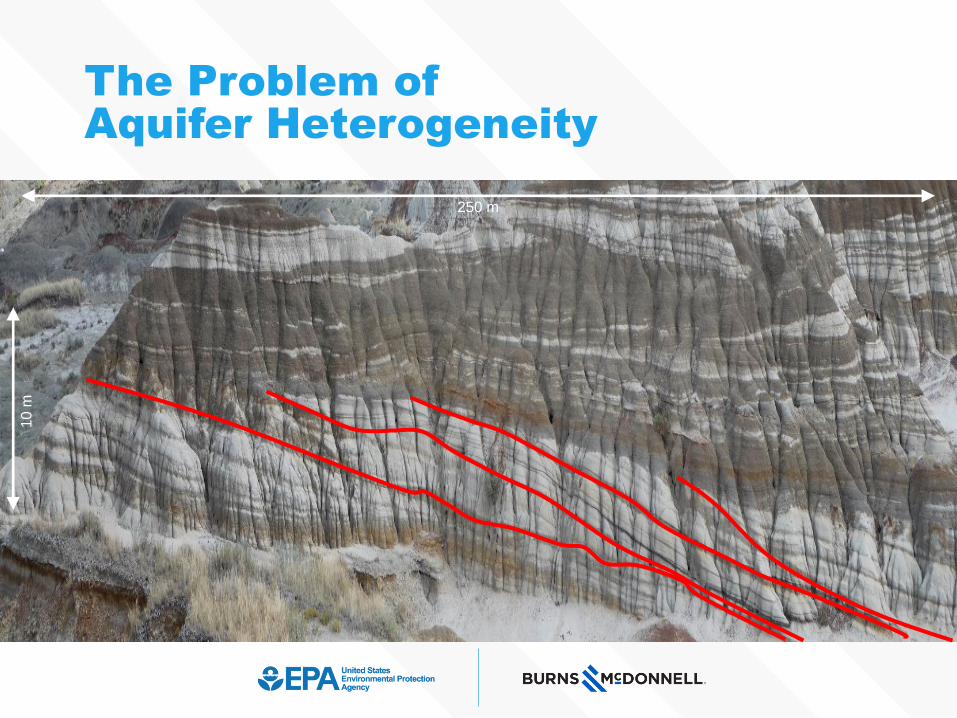
The Problem ofAquifer Heterogeneity
250 m
10
m
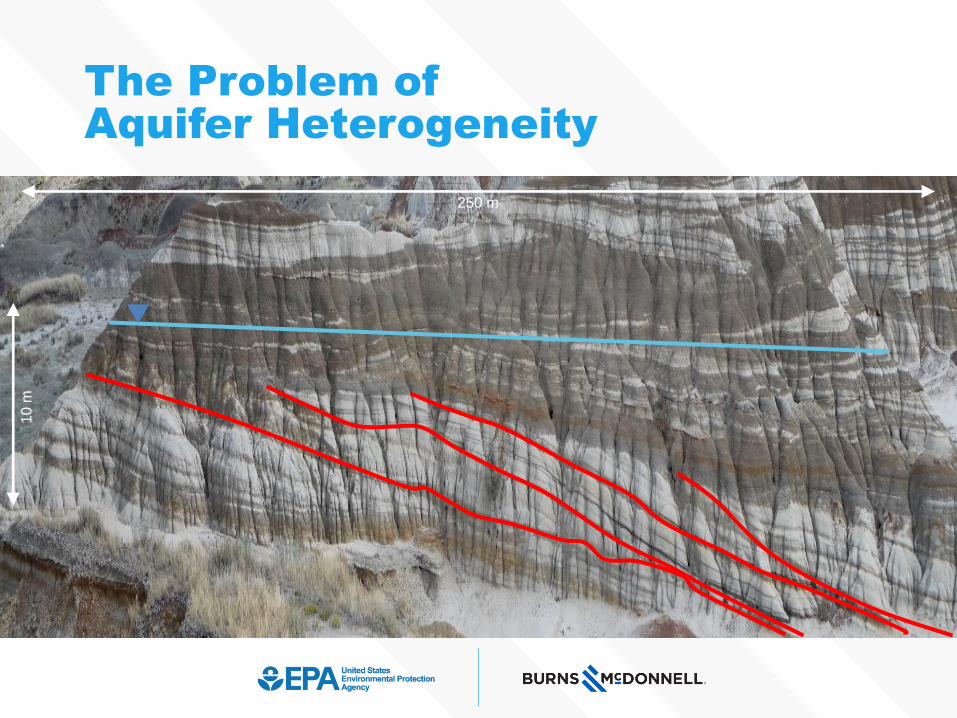
The Problem ofAquifer Heterogeneity

250 m
1 23
10
m
The Problem ofAquifer Heterogeneity

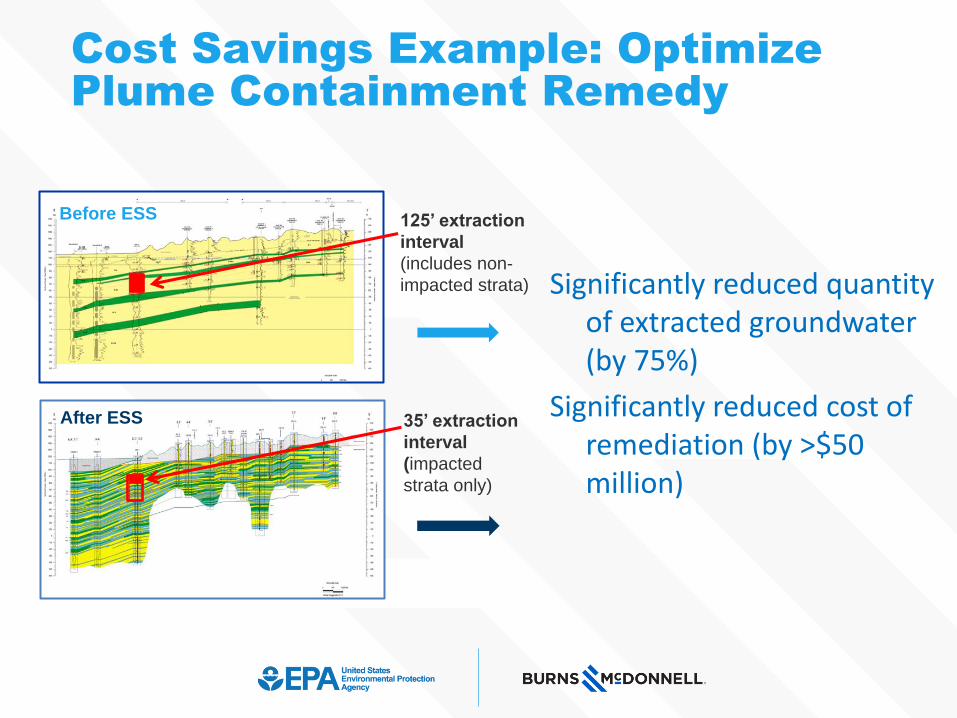
Cost Savings Example: Optimize Plume Containment Remedy
125’ extraction
interval
(includes non-
impacted strata)
Remediation System Design (Before ESS)•12 extraction wells
•~200 gpm per well
•1,261 million gallons per year
Total cost = $82 million
After ESS
Estimated Remediation System Cost (After ESS)•13 extraction wells
•46 gpm per well
•314 million gallons per year
Total cost = $26.5 million
35’ extraction
interval
(impacted
strata only)
Before ESS
Cost Savings Example: Optimize Plume Containment Remedy
125’ extraction
interval
(includes non-
impacted strata)
After ESS 35’ extraction
interval
(impacted
strata only)
Before ESS
Significantly reduced quantity of extracted groundwater (by 75%)
Significantly reduced cost of remediation (by >$50 million)
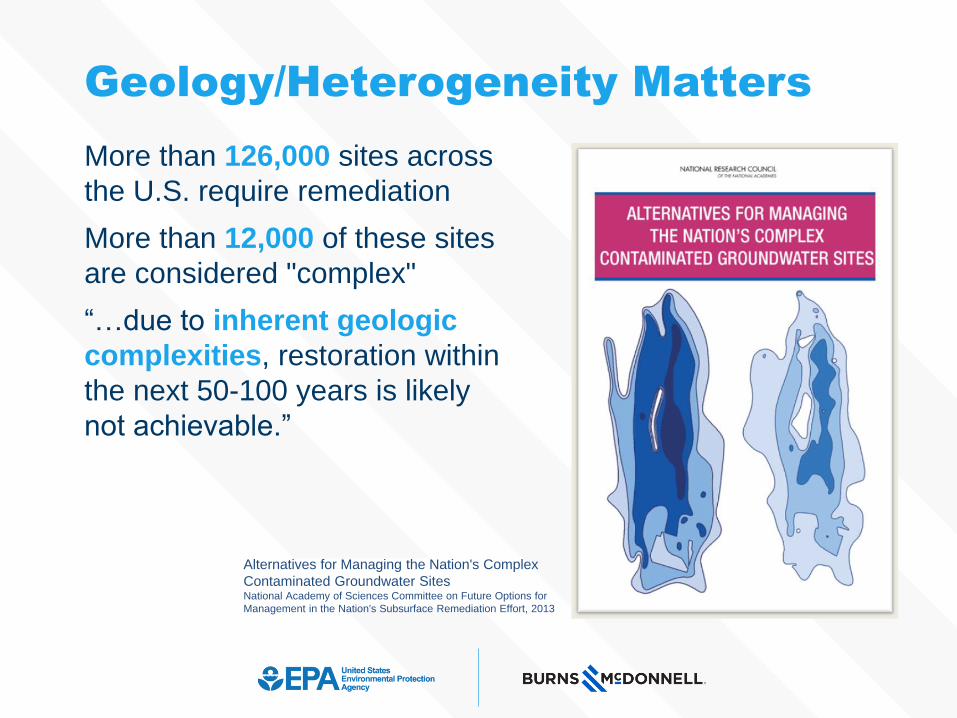
More than 126,000 sites across
the U.S. require remediation
More than 12,000 of these sites
are considered "complex"
“…due to inherent geologic
complexities, restoration within
the next 50-100 years is likely
not achievable.”
Alternatives for Managing the Nation's Complex
Contaminated Groundwater Sites National Academy of Sciences Committee on Future Options for
Management in the Nation's Subsurface Remediation Effort, 2013
Geology/Heterogeneity Matters
What is ESS?
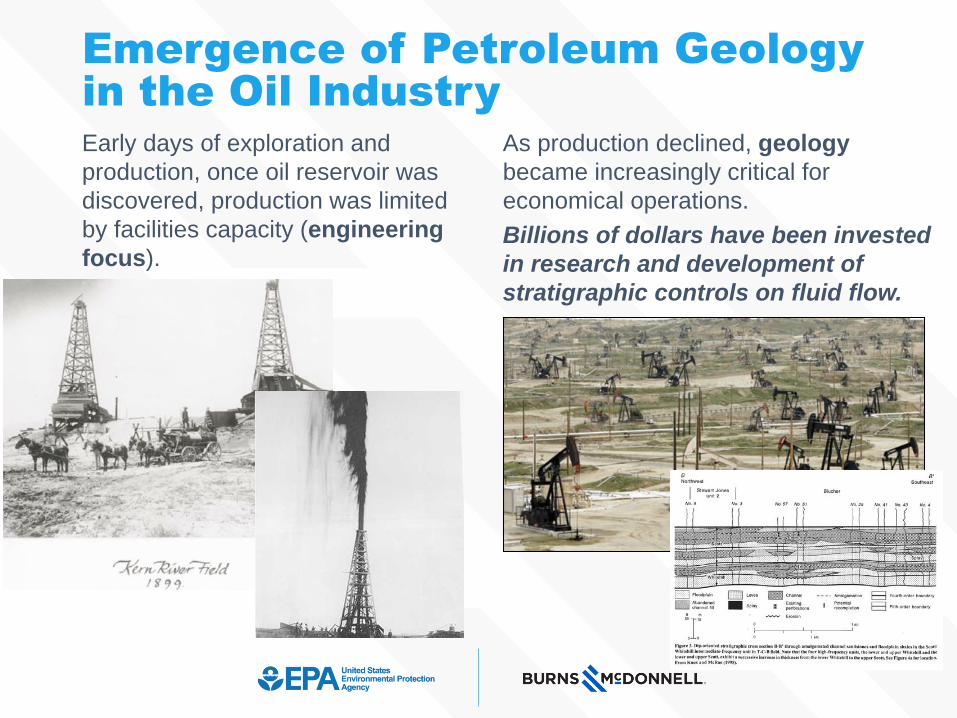
Early days of exploration and
production, once oil reservoir was
discovered, production was limited
by facilities capacity (engineering
focus).
As production declined, geology
became increasingly critical for
economical operations.
Billions of dollars have been invested
in research and development of
stratigraphic controls on fluid flow.
Emergence of Petroleum Geology in the Oil Industry
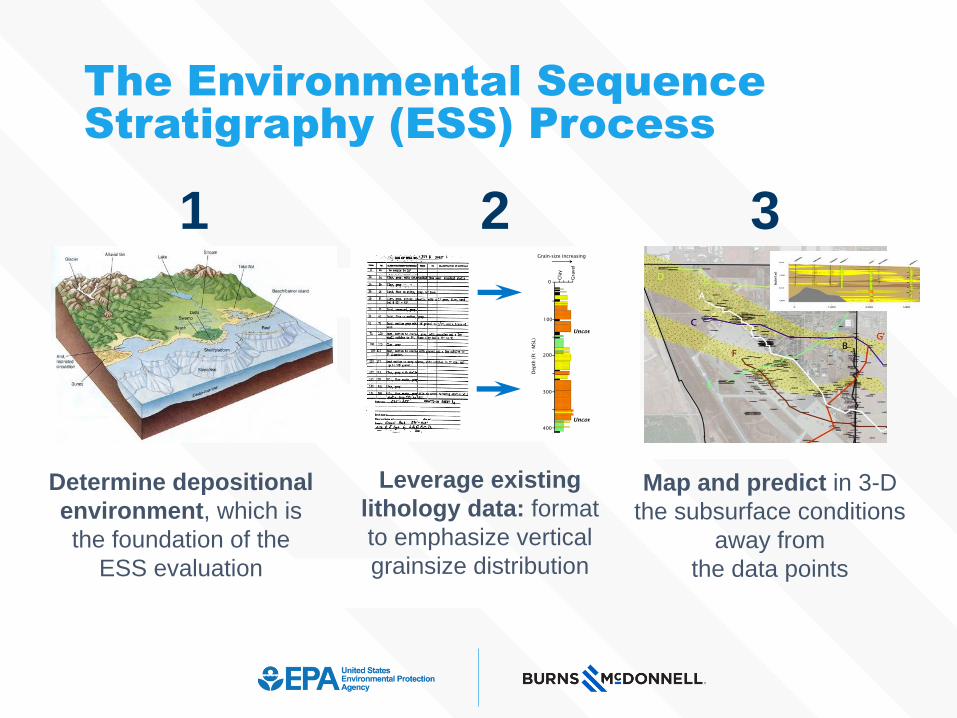
Determine depositional
environment, which is
the foundation of the
ESS evaluation
0
100
200
300
400
Fining up
Fining up
Fining up
Fining up
Coarsening up
Cyclicity
Depth (Ft - M
SL)
Clay
Gravel
Grain-size increasing
Unconformity
Unconformity
1 2 3
Leverage existing
lithology data: format
to emphasize vertical
grainsize distribution
Map and predict in 3-D
the subsurface conditions
away from
the data points
The Environmental Sequence Stratigraphy (ESS) Process

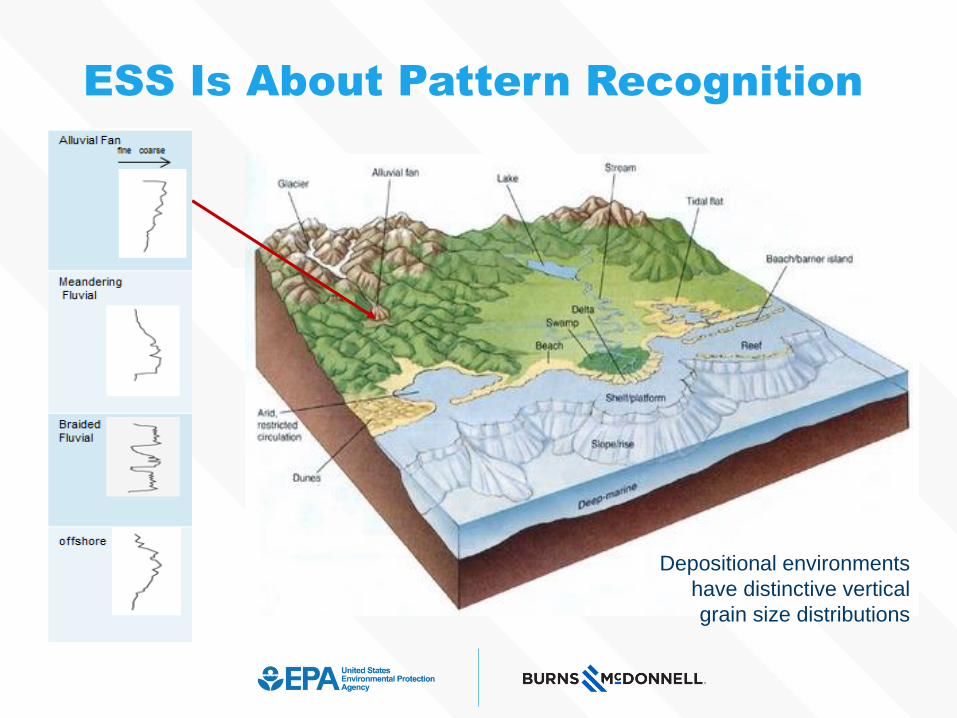
Alluvial fan facies model Meandering river facies model Coastal depositional systems
Glacial depositional systems
ESS Is About Pattern Recognition
ESS Is About Pattern Recognition
Depositional environments
have distinctive vertical
grain size distributions

ESS Is About Pattern Recognition
Depositional environments
have distinctive vertical
grain size distributions

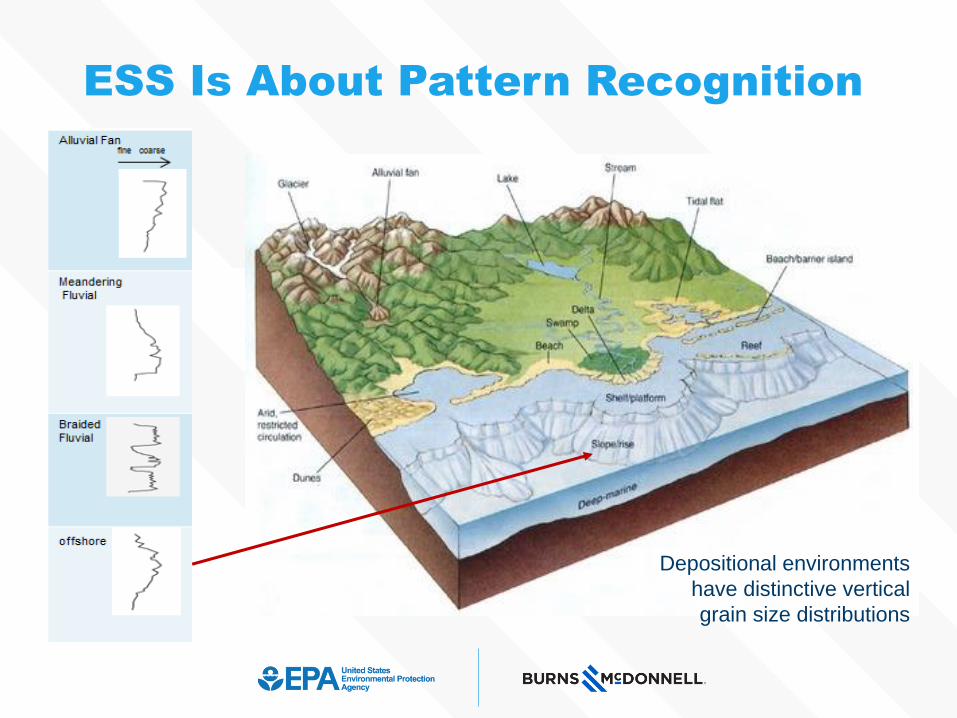
ESS Is About Pattern Recognition
Depositional environments
have distinctive vertical
grain size distributions
ESS Is About Pattern Recognition
Depositional environments
have distinctive vertical
grain size distributions
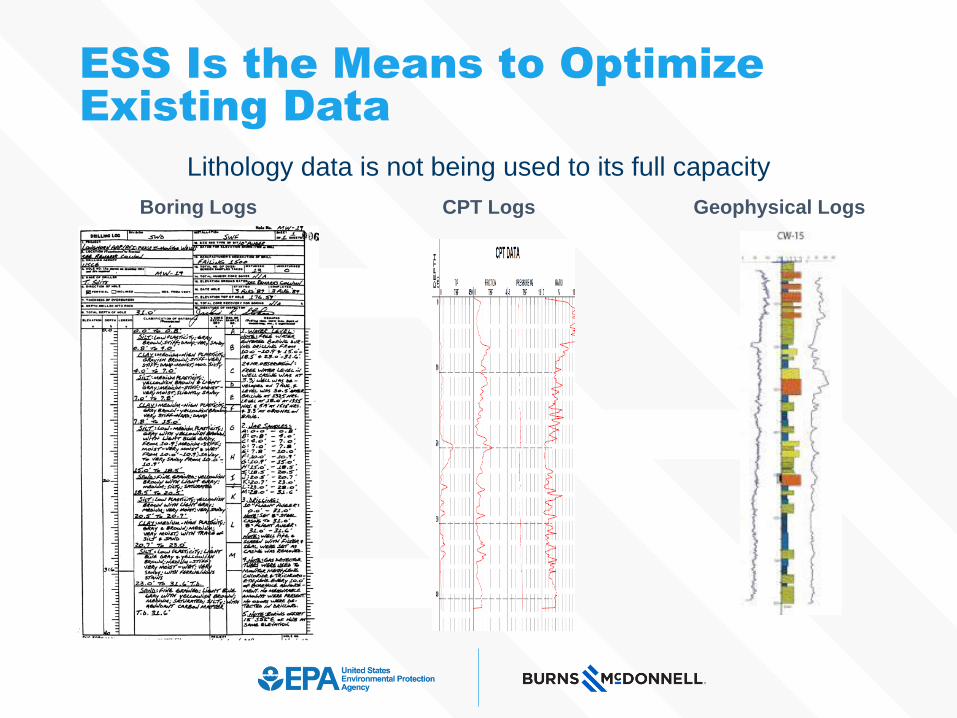
Lithology data is not being used to its full capacity
Boring Logs CPT Logs Geophysical Logs
ESS Is the Means to Optimize Existing Data
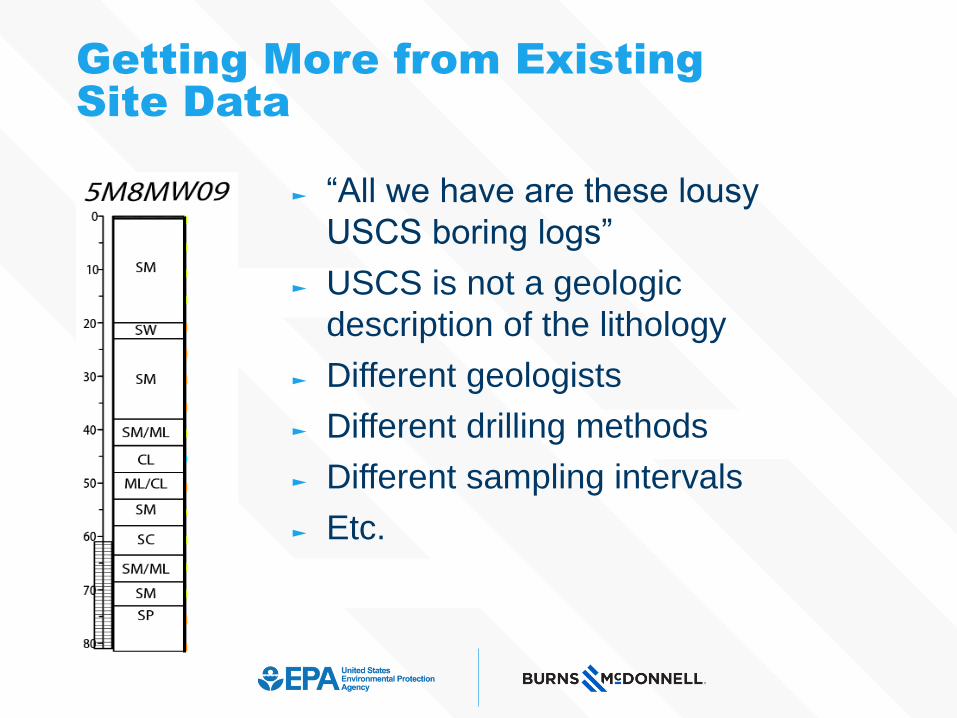
► “All we have are these lousy
USCS boring logs”
► USCS is not a geologic
description of the lithology
► Different geologists
► Different drilling methods
► Different sampling intervals
► Etc.
Getting More from Existing Site Data
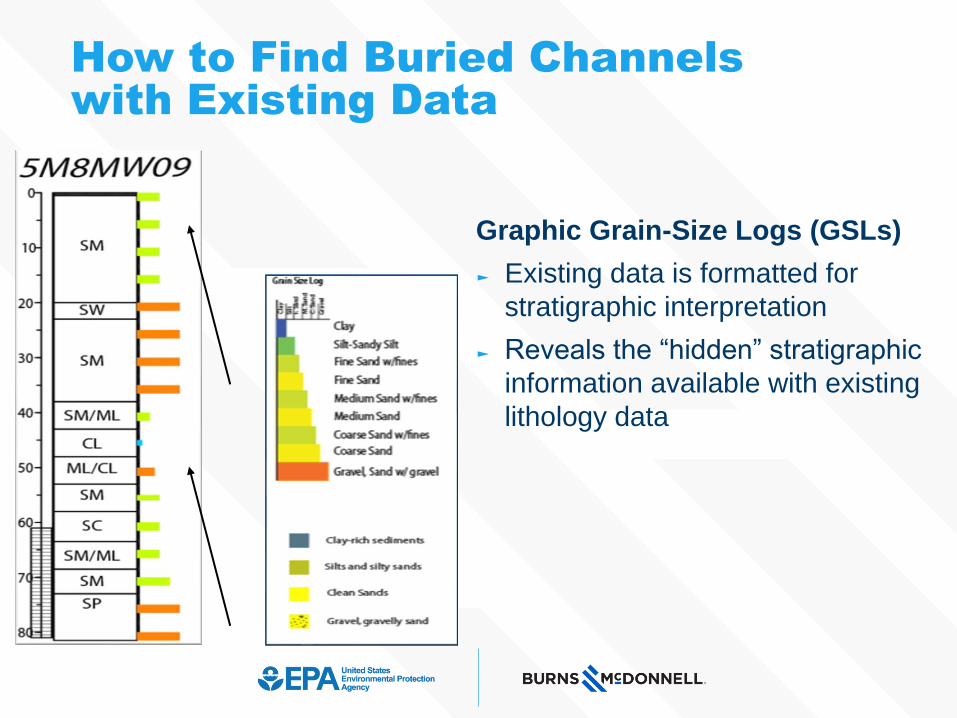
Graphic Grain-Size Logs (GSLs)
► Existing data is formatted for
stratigraphic interpretation
► Reveals the “hidden” stratigraphic
information available with existing
lithology data
How to Find Buried Channelswith Existing Data
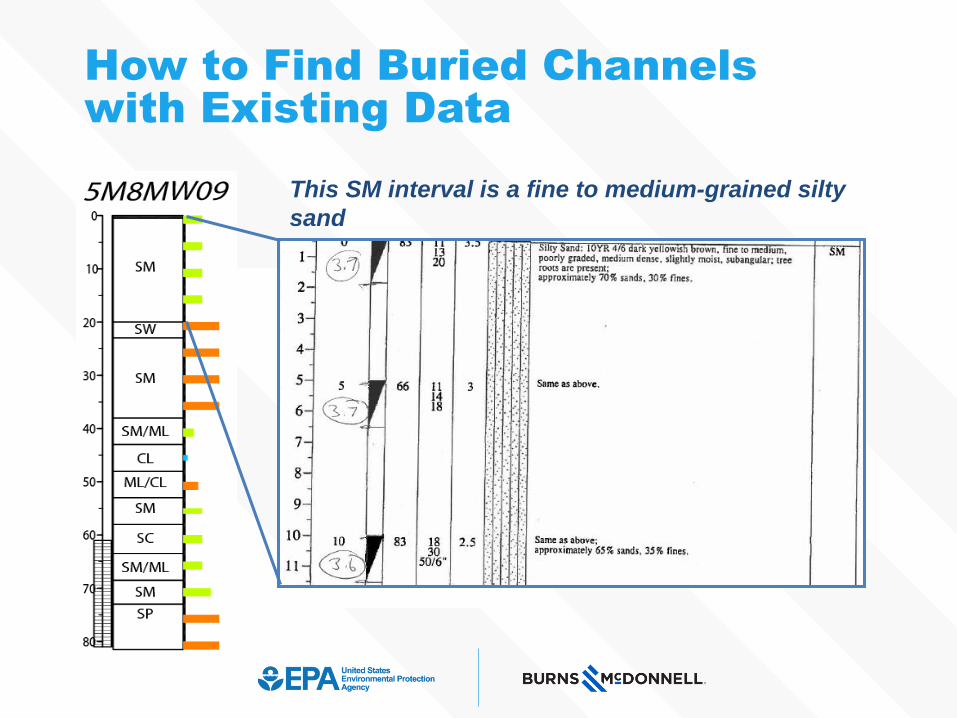
This SM interval is a fine to medium-grained silty
sand
How to Find Buried Channelswith Existing Data
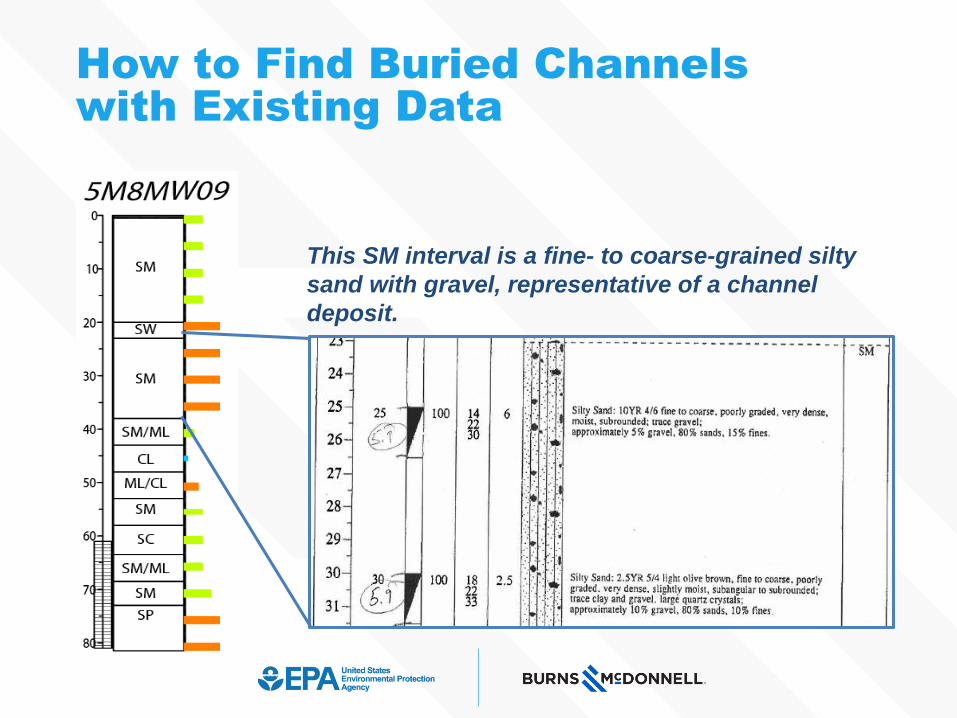
This SM interval is a fine- to coarse-grained silty
sand with gravel, representative of a channel
deposit.
How to Find Buried Channelswith Existing Data
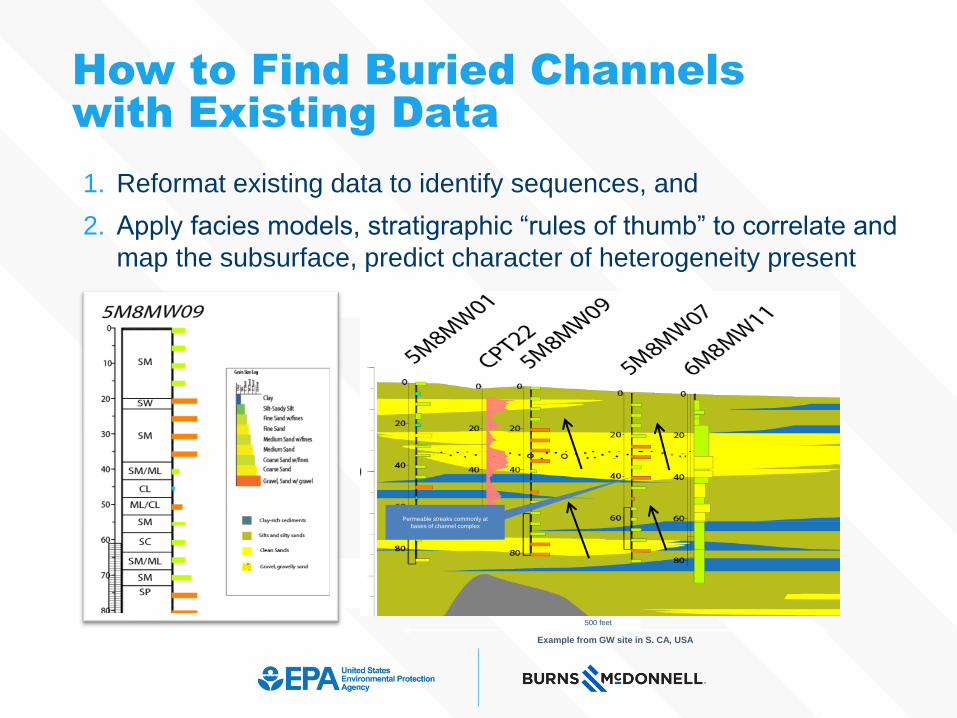
1. Reformat existing data to identify sequences, and
2. Apply facies models, stratigraphic “rules of thumb” to correlate and
map the subsurface, predict character of heterogeneity present
Example from GW site in S. CA, USA
500 feet
Permeable streaks commonly at
bases of channel complex
How to Find Buried Channelswith Existing Data
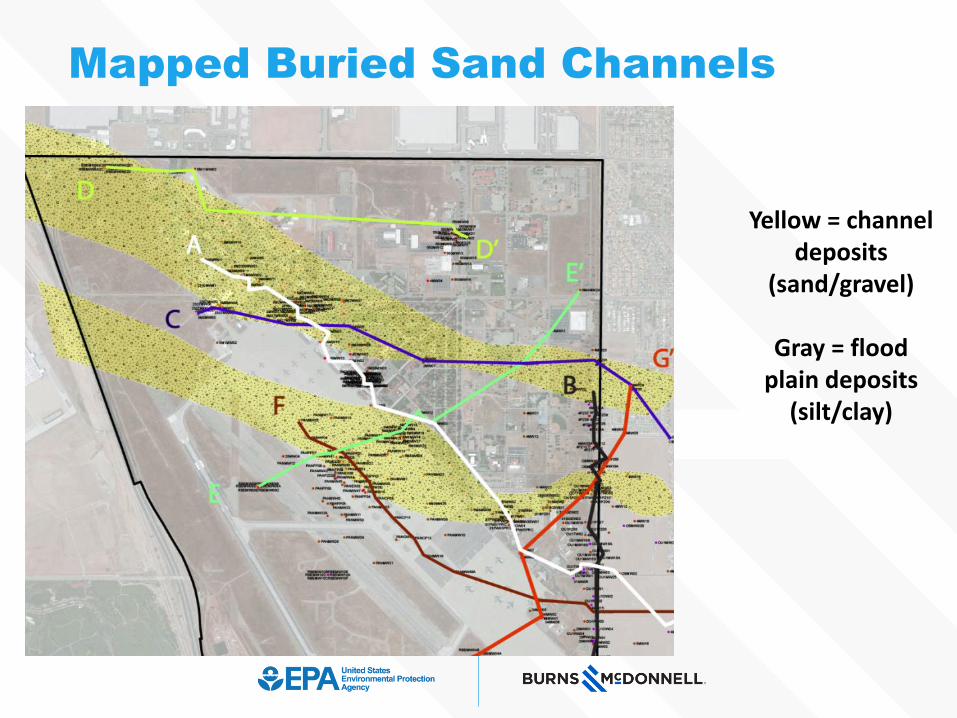
Mapped Buried Sand Channels
Yellow = channel deposits
(sand/gravel)
Gray = flood plain deposits
(silt/clay)
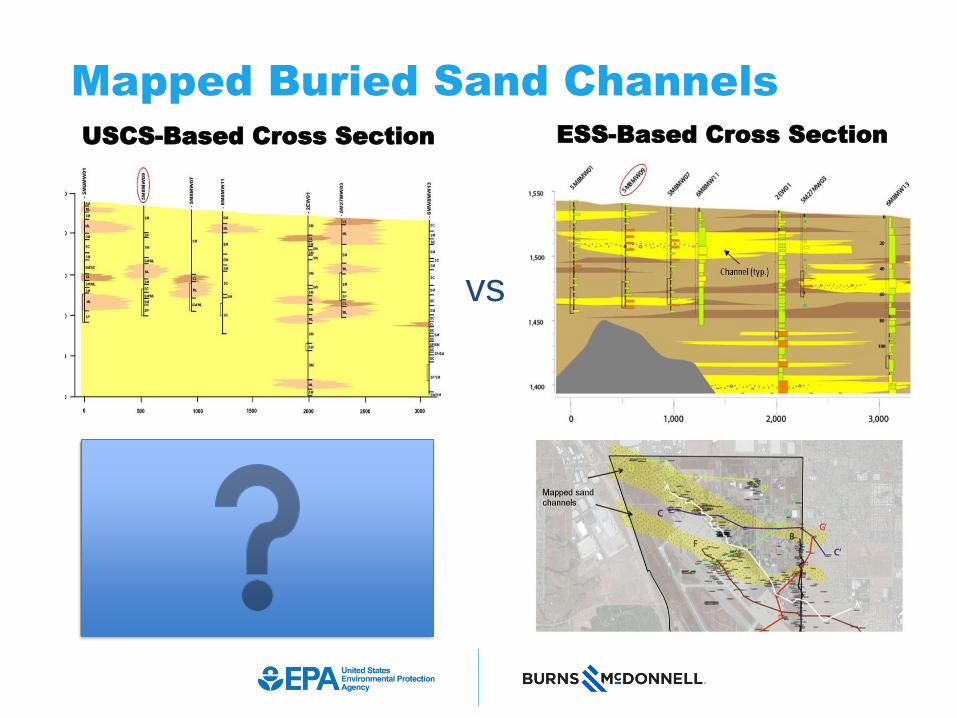
vs
Mapped Buried Sand ChannelsUSCS-Based Cross Section ESS-Based Cross Section
Stratigraphic “Rules of Thumb”
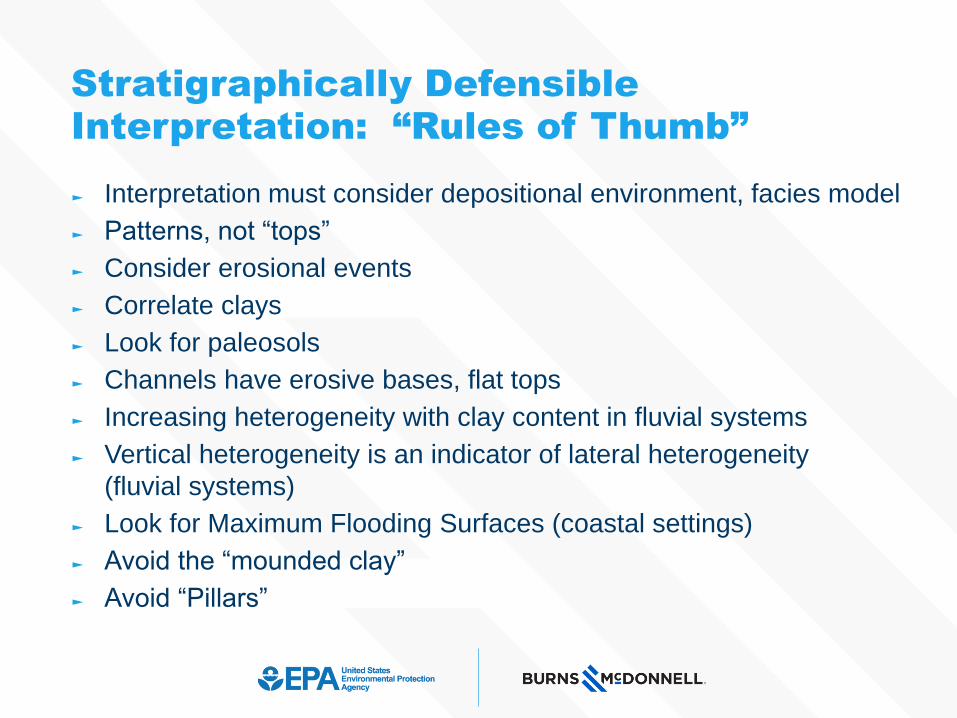
Stratigraphically Defensible Interpretation: “Rules of Thumb”
► Interpretation must consider depositional environment, facies model
► Patterns, not “tops”
► Consider erosional events
► Correlate clays
► Look for paleosols
► Channels have erosive bases, flat tops
► Increasing heterogeneity with clay content in fluvial systems
► Vertical heterogeneity is an indicator of lateral heterogeneity
(fluvial systems)
► Look for Maximum Flooding Surfaces (coastal settings)
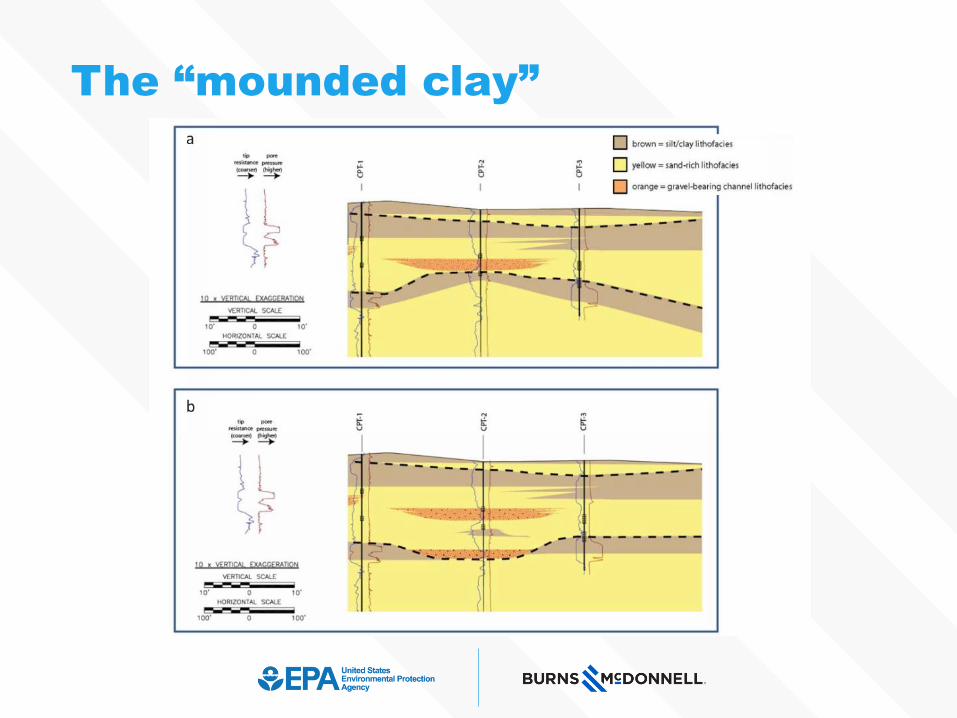
► Avoid the “mounded clay”
► Avoid “Pillars”
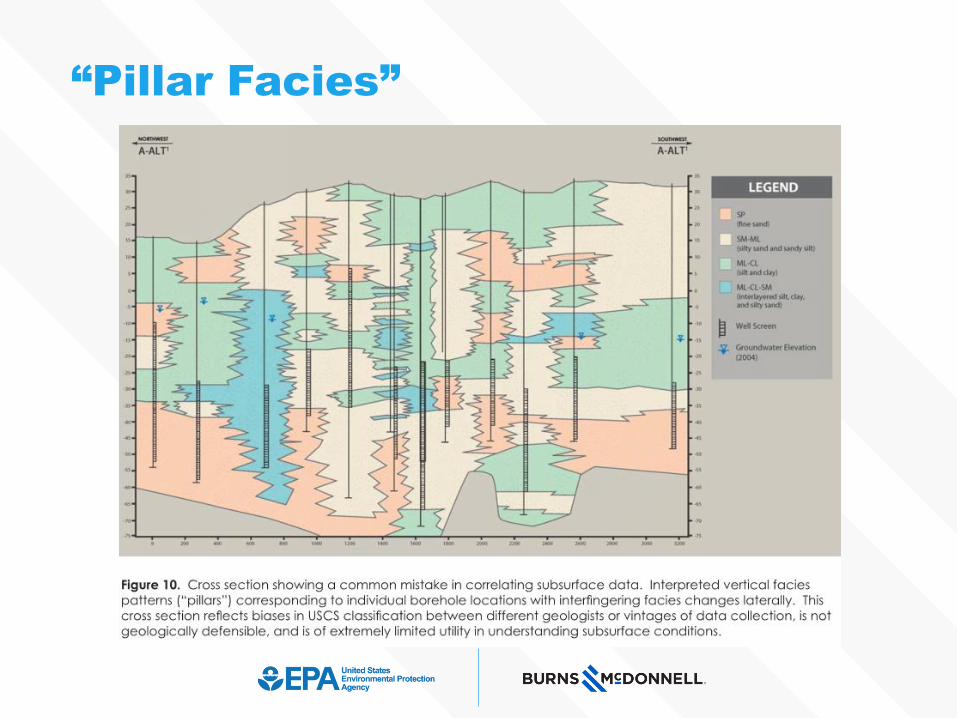
“Pillar Facies”
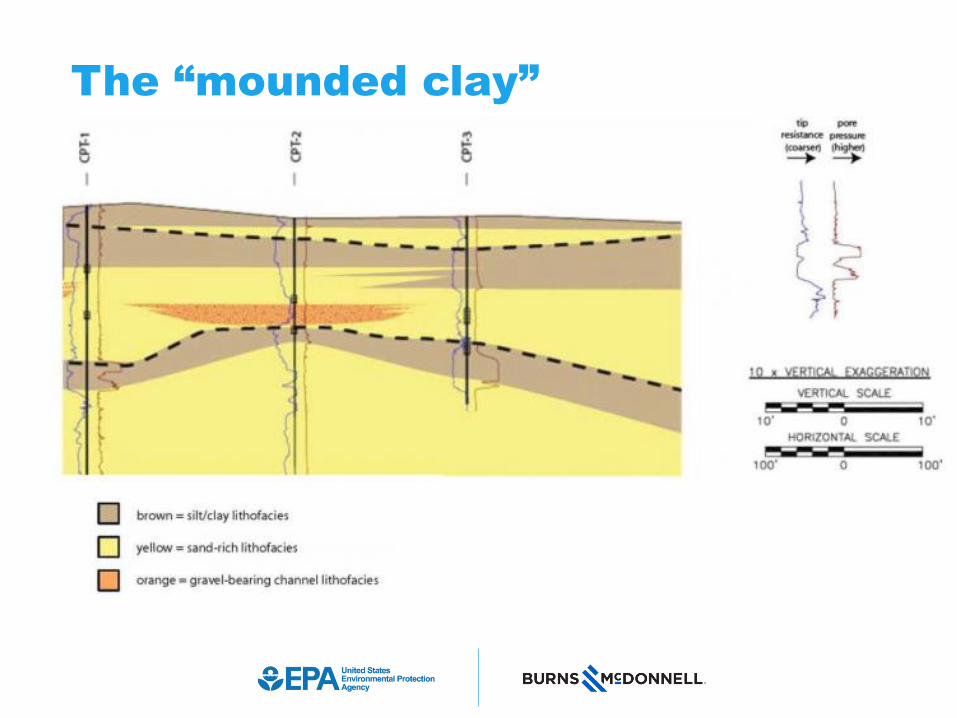
The “mounded clay”
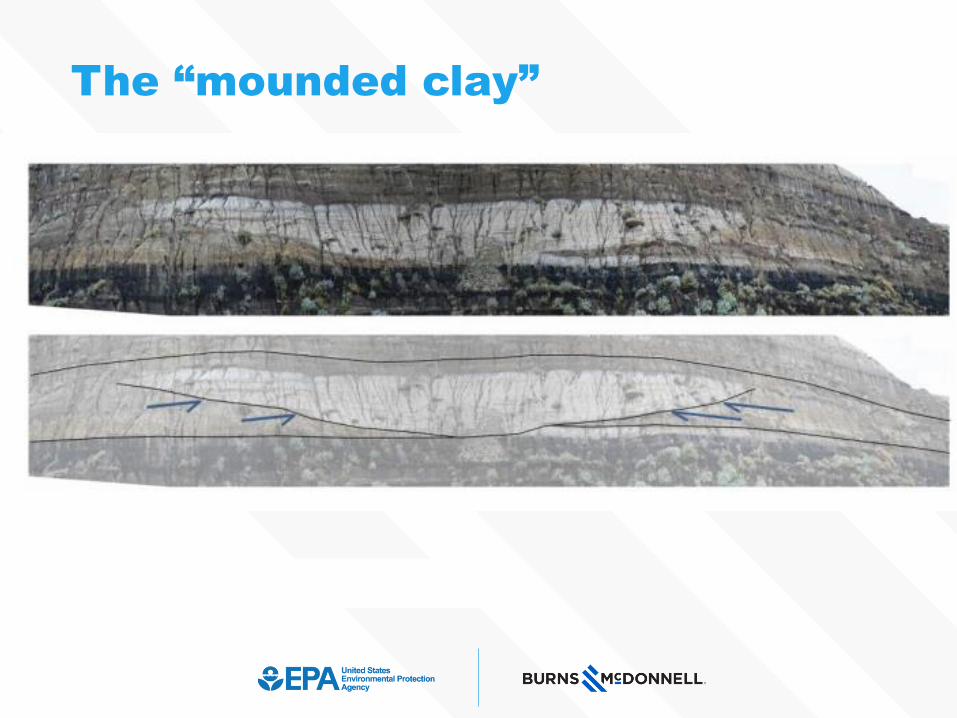
The “mounded clay”
The “mounded clay”
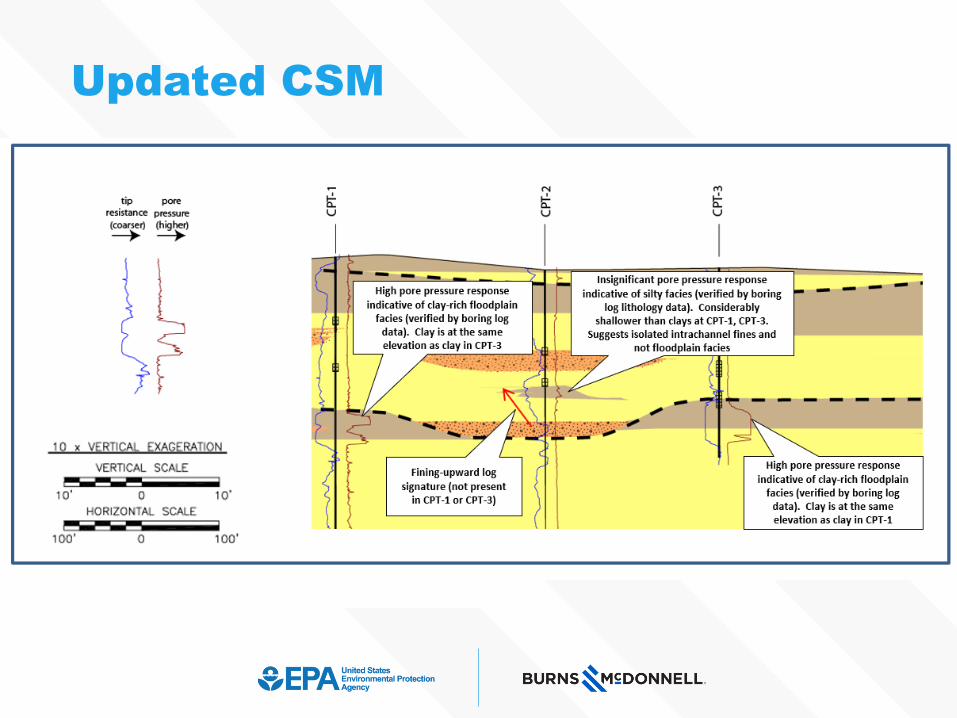
Updated CSM
Q&A Break
Case Studies
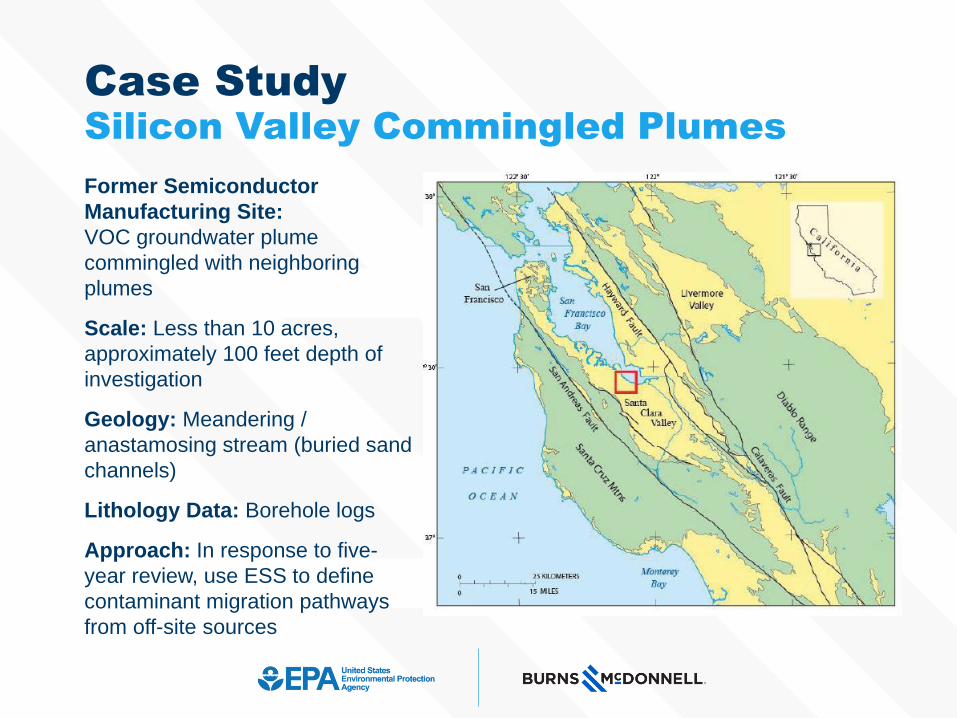
Former Semiconductor
Manufacturing Site:
VOC groundwater plume
commingled with neighboring
plumes
Scale: Less than 10 acres,
approximately 100 feet depth of
investigation
Geology: Meandering /
anastamosing stream (buried sand
channels)
Lithology Data: Borehole logs
Approach: In response to five-
year review, use ESS to define
contaminant migration pathways
from off-site sources
Case StudySilicon Valley Commingled Plumes
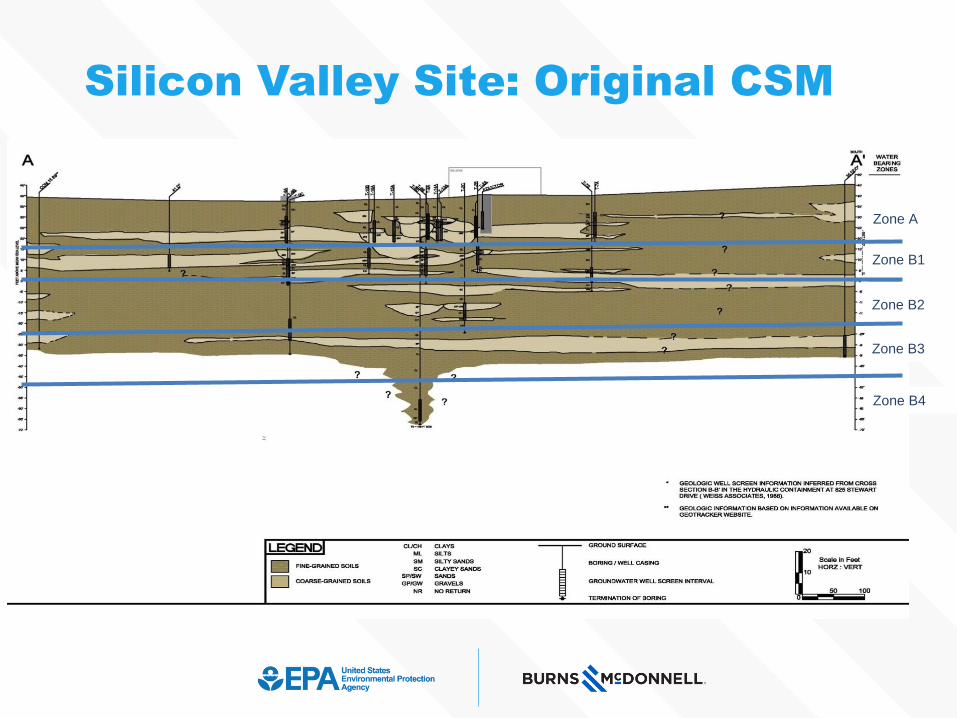
Zone A
Zone B1
Zone B2
Zone B3
Zone B4
Silicon Valley Site: Original CSM
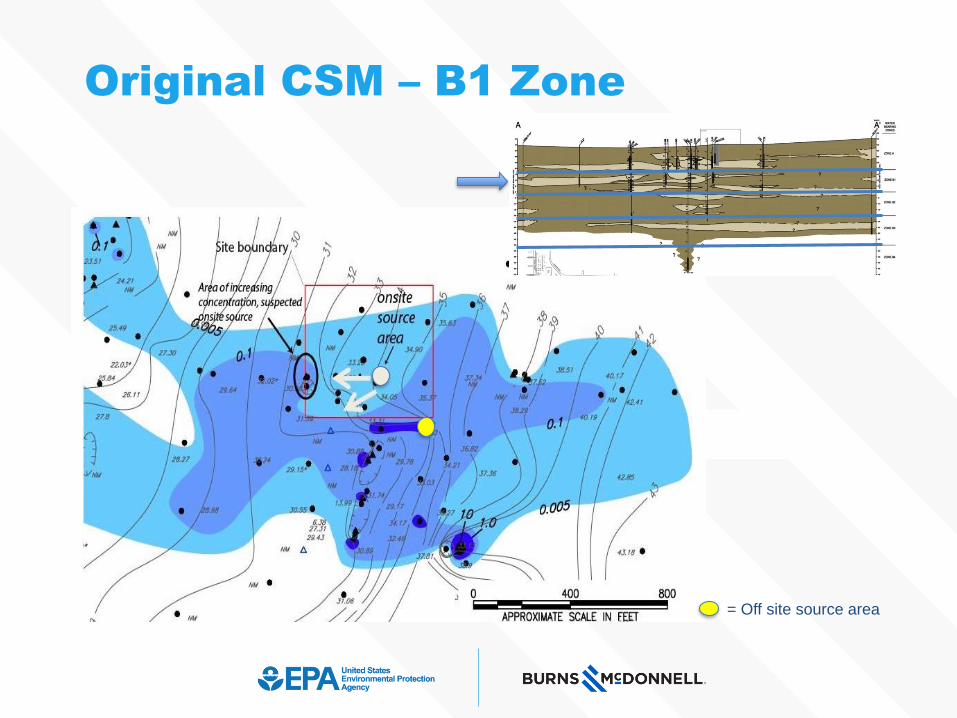
= Off site source area
Original CSM – B1 Zone
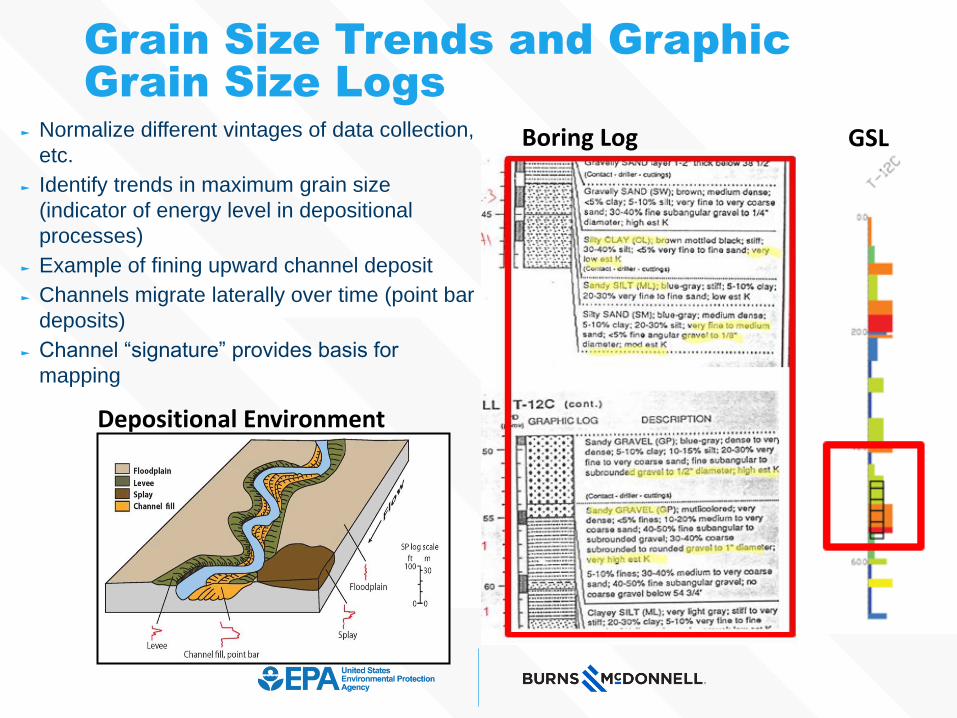
Grain Size Trends and Graphic Grain Size Logs
► Normalize different vintages of data collection,
etc.
► Identify trends in maximum grain size
(indicator of energy level in depositional
processes)
► Example of fining upward channel deposit
► Channels migrate laterally over time (point bar
deposits)
► Channel “signature” provides basis for
mapping
Depositional Environment
Boring Log GSL
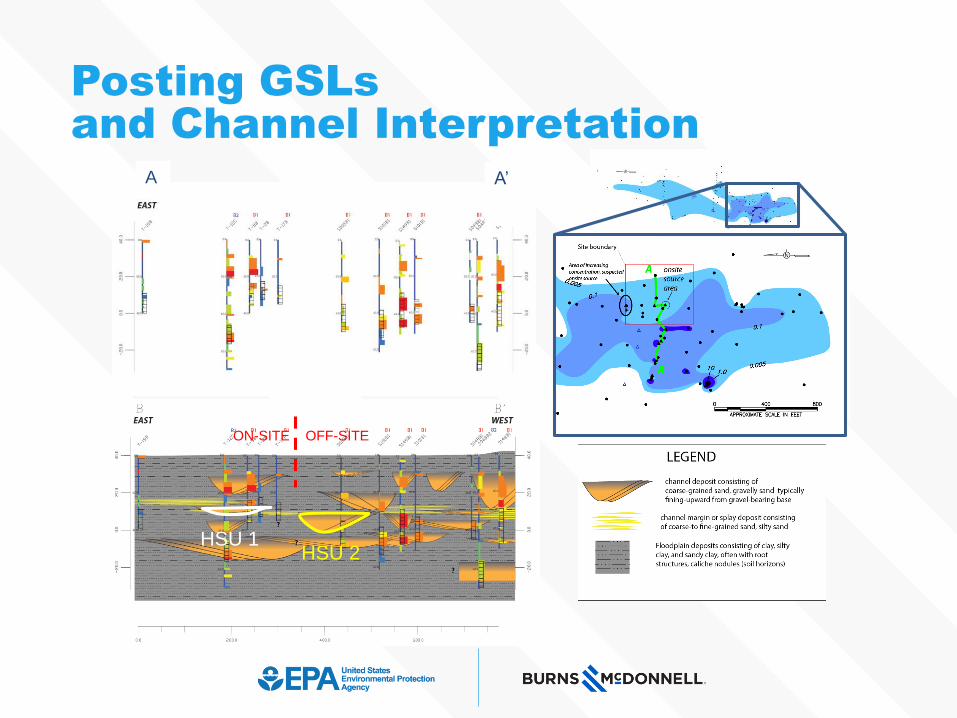
A’A
HSU 1HSU 2
ON-SITE OFF-SITE
Posting GSLsand Channel Interpretation
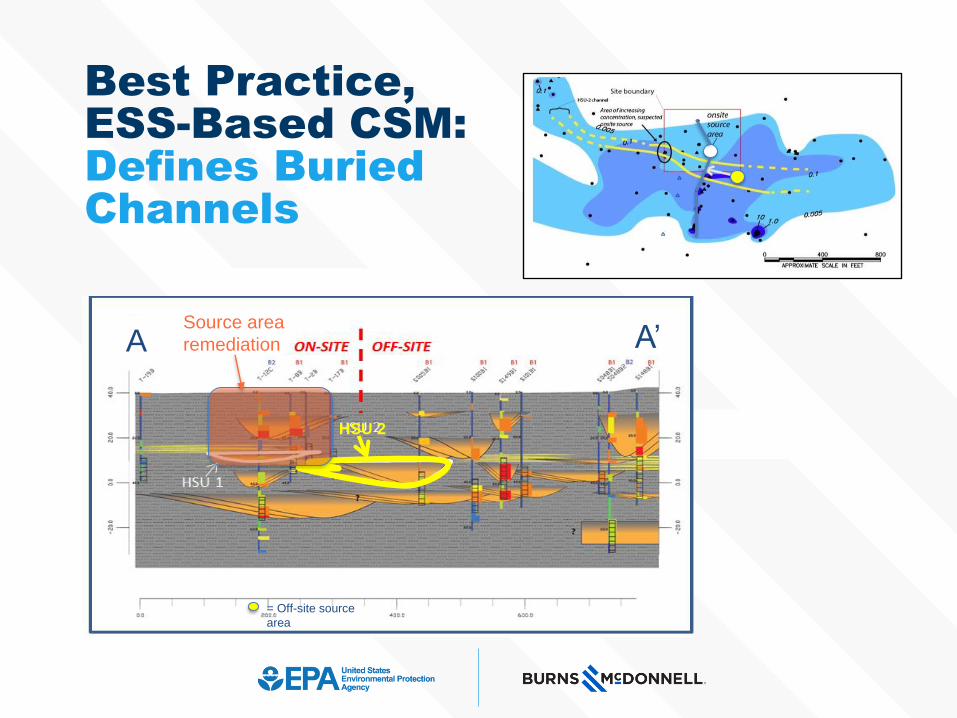
HSU 2
Source area
remediation
= Off-site source
area
A A’
A
A’
Best Practice, ESS-Based CSM:Defines Buried Channels
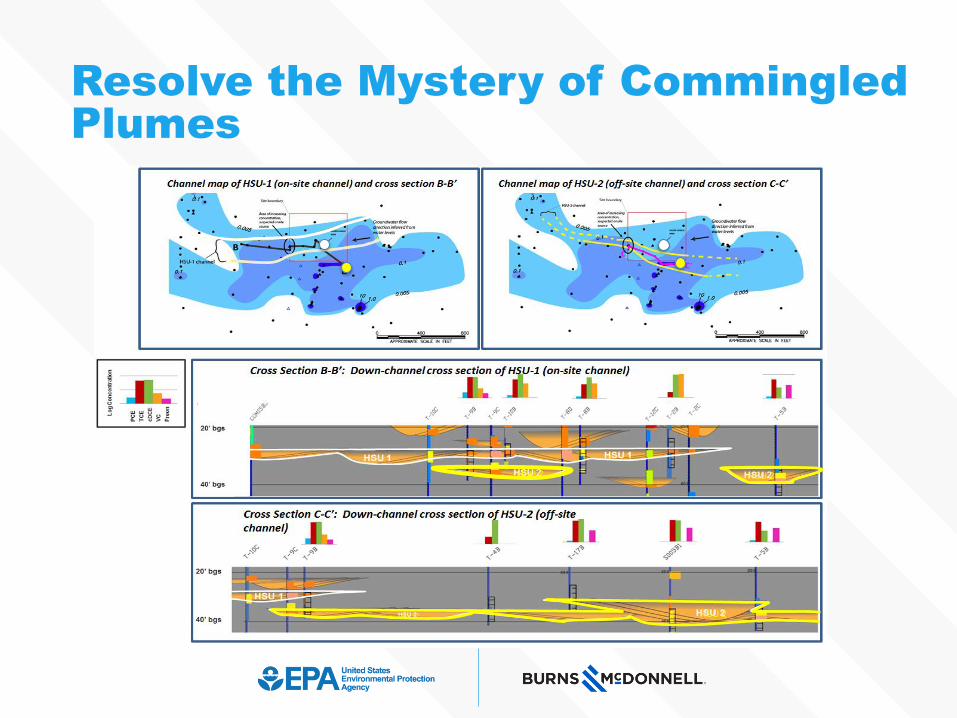
HSU 2 HSU 2
HSU 2HSU 2
Resolve the Mystery of Commingled Plumes
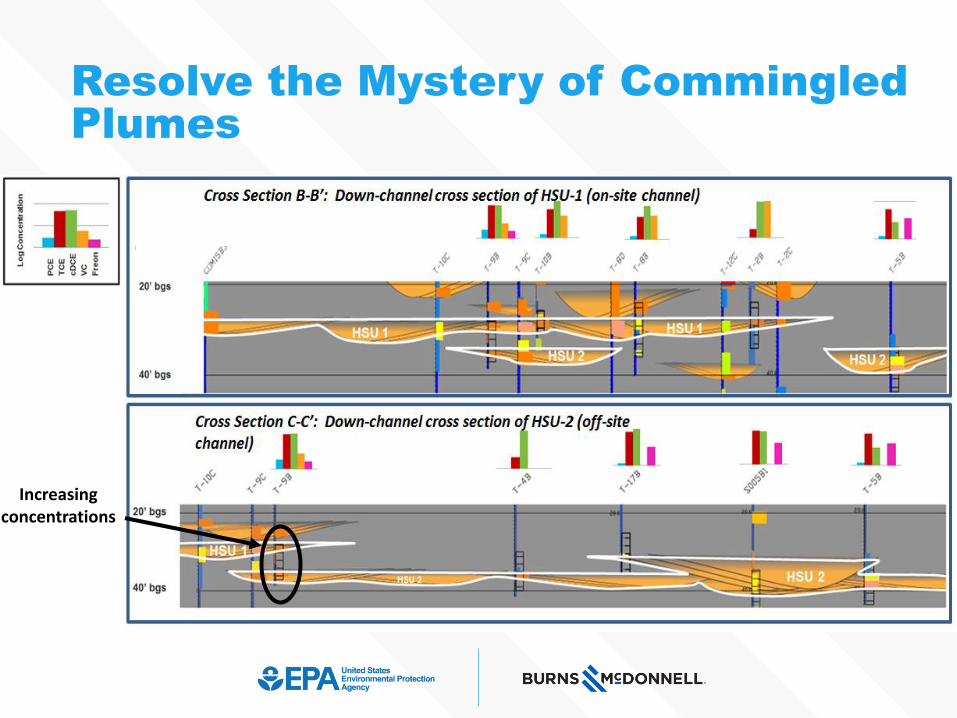
Resolve the Mystery of Commingled Plumes
Increasing concentrations
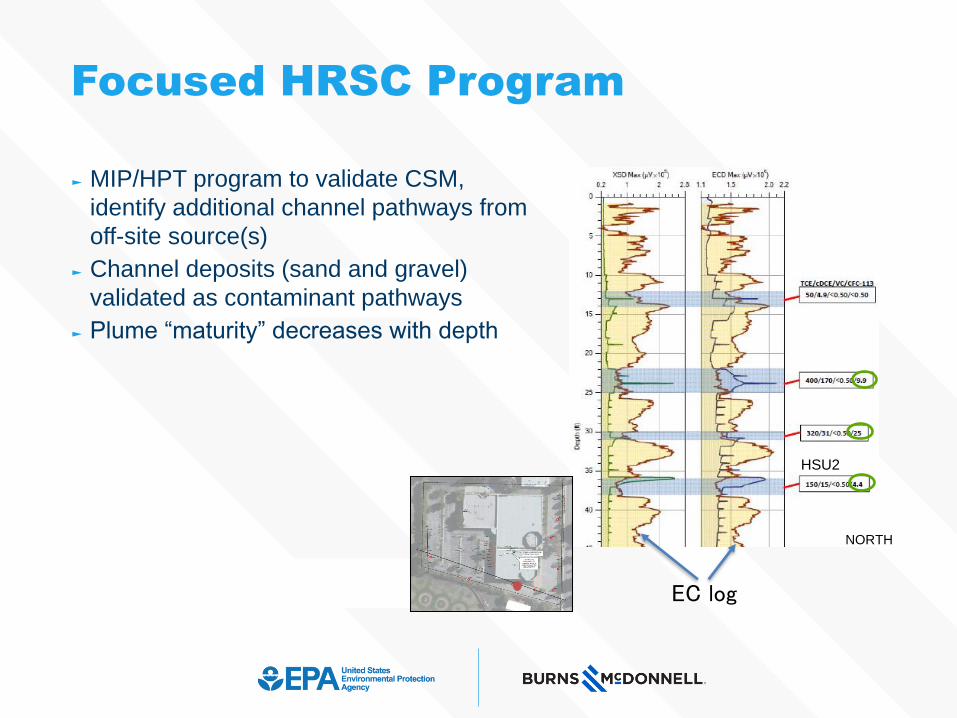
Focused HRSC Program
HSU2
NORTH
EC log
► MIP/HPT program to validate CSM,
identify additional channel pathways from
off-site source(s)
► Channel deposits (sand and gravel)
validated as contaminant pathways
► Plume “maturity” decreases with depth
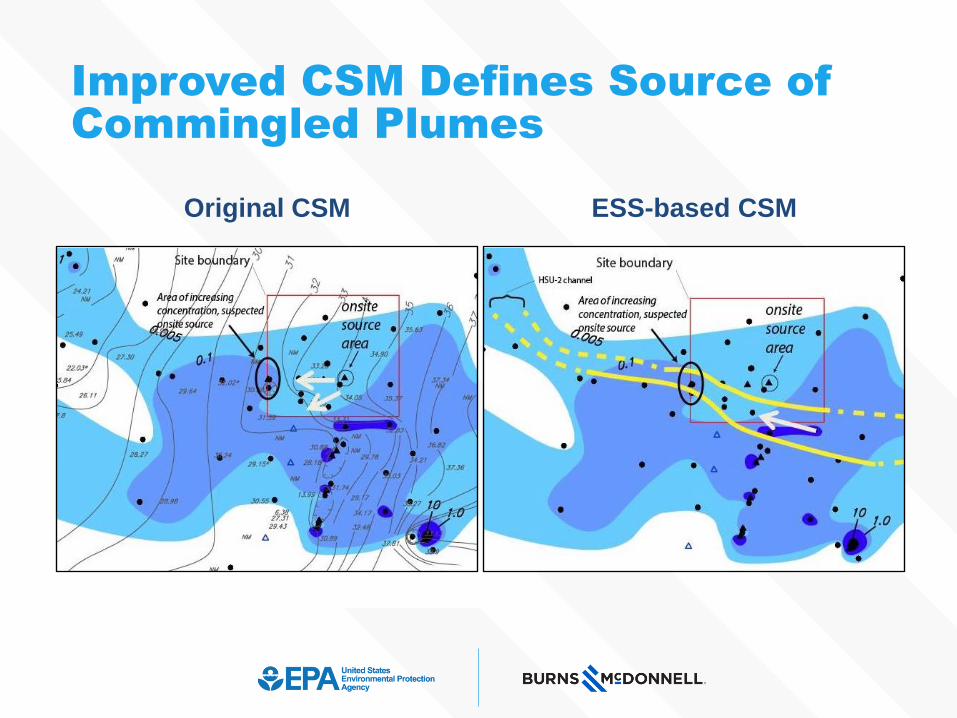
ESS-based CSMOriginal CSM
Improved CSM Defines Source of Commingled Plumes
Outcomes and Contribution to EPA
New CSM reduced uncertainty and lead to resolution of a
5 year review issue.
New CSM will provide rationale for monitoring well screen
depth and monitoring objectives.
New CSM will result in clean up by parties responsible for
each site related release.
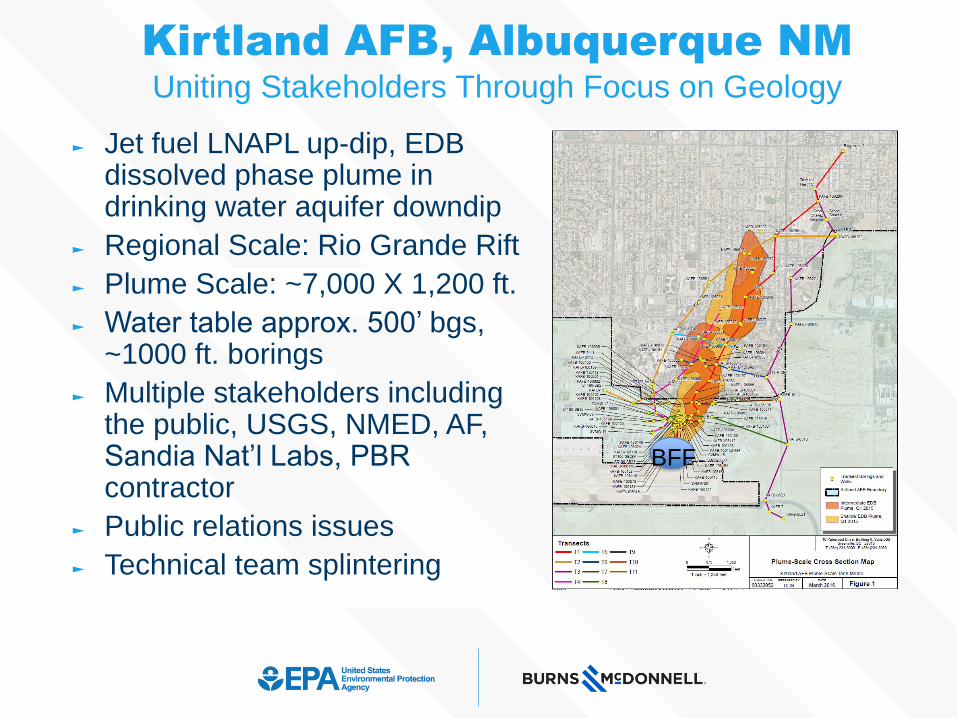
Kirtland AFB, Albuquerque NMUniting Stakeholders Through Focus on Geology
► Jet fuel LNAPL up-dip, EDB dissolved phase plume in drinking water aquifer downdip
► Regional Scale: Rio Grande Rift
► Plume Scale: ~7,000 X 1,200 ft.
► Water table approx. 500’ bgs, ~1000 ft. borings
► Multiple stakeholders including the public, USGS, NMED, AF, Sandia Nat’l Labs, PBR contractor
► Public relations issues
► Technical team splintering
BFF
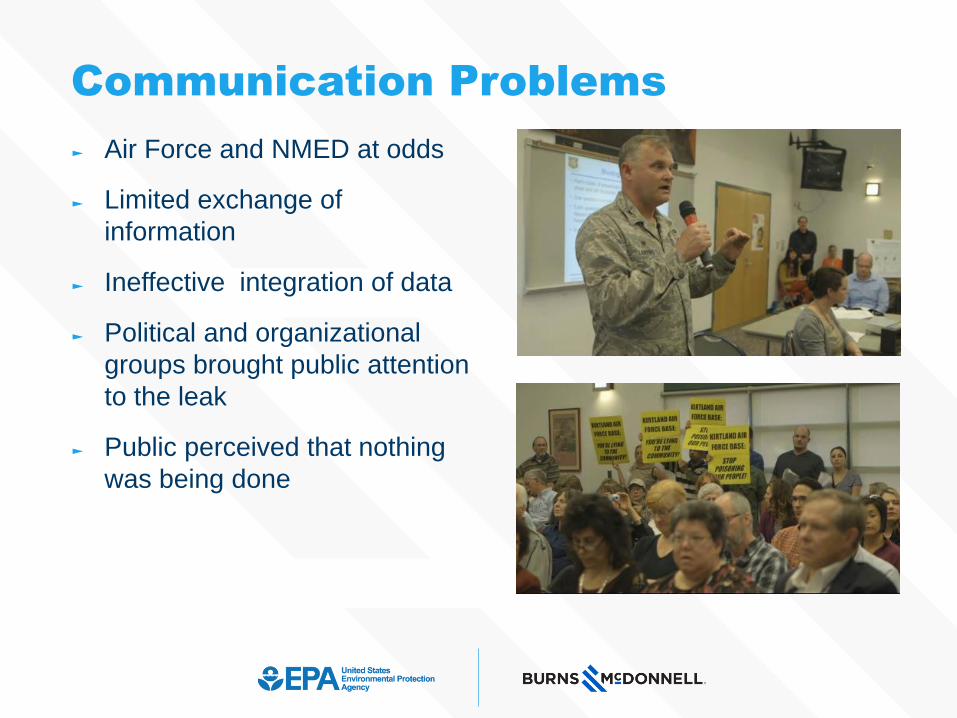
Communication Problems
► Air Force and NMED at odds
► Limited exchange of
information
► Ineffective integration of data
► Political and organizational
groups brought public attention
to the leak
► Public perceived that nothing
was being done

Kirtland AFB- Previous Section Example
“If this is simply a sand box, why can’t you give me a final answer?”
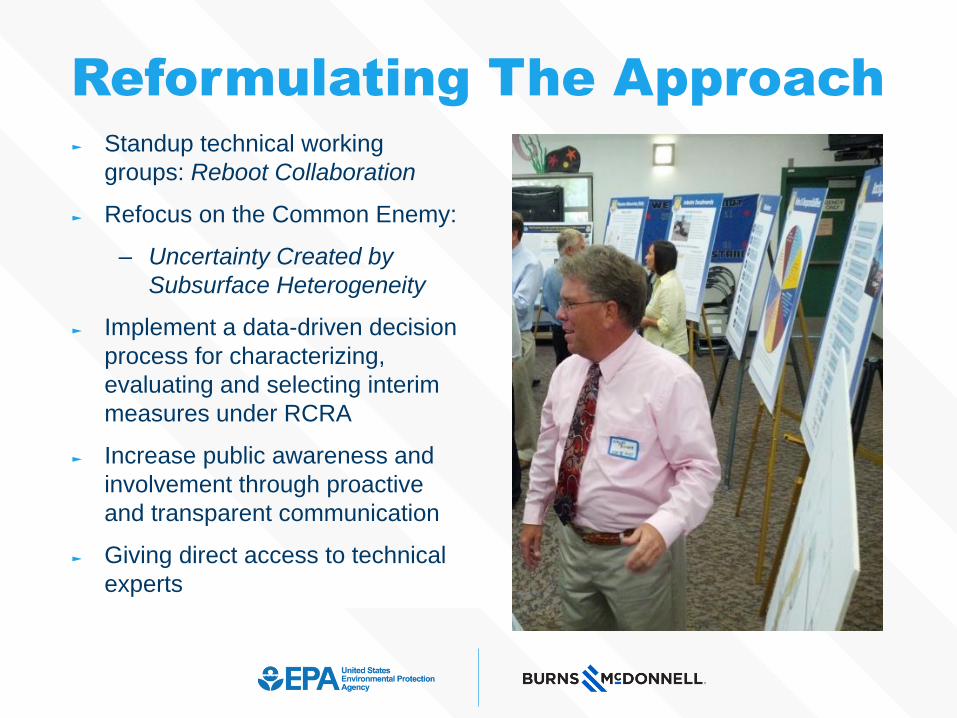
Reformulating The Approach► Standup technical working
groups: Reboot Collaboration
► Refocus on the Common Enemy:
– Uncertainty Created by
Subsurface Heterogeneity
► Implement a data-driven decision
process for characterizing,
evaluating and selecting interim
measures under RCRA
► Increase public awareness and
involvement through proactive
and transparent communication
► Giving direct access to technical
experts
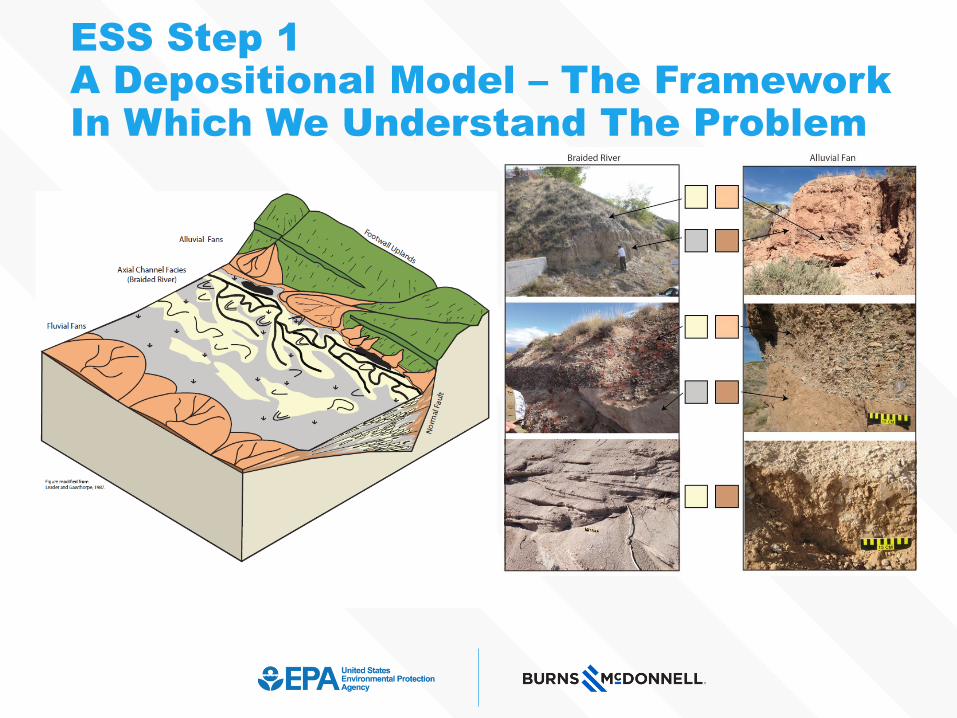
ESS Step 1A Depositional Model – The Framework In Which We Understand The Problem
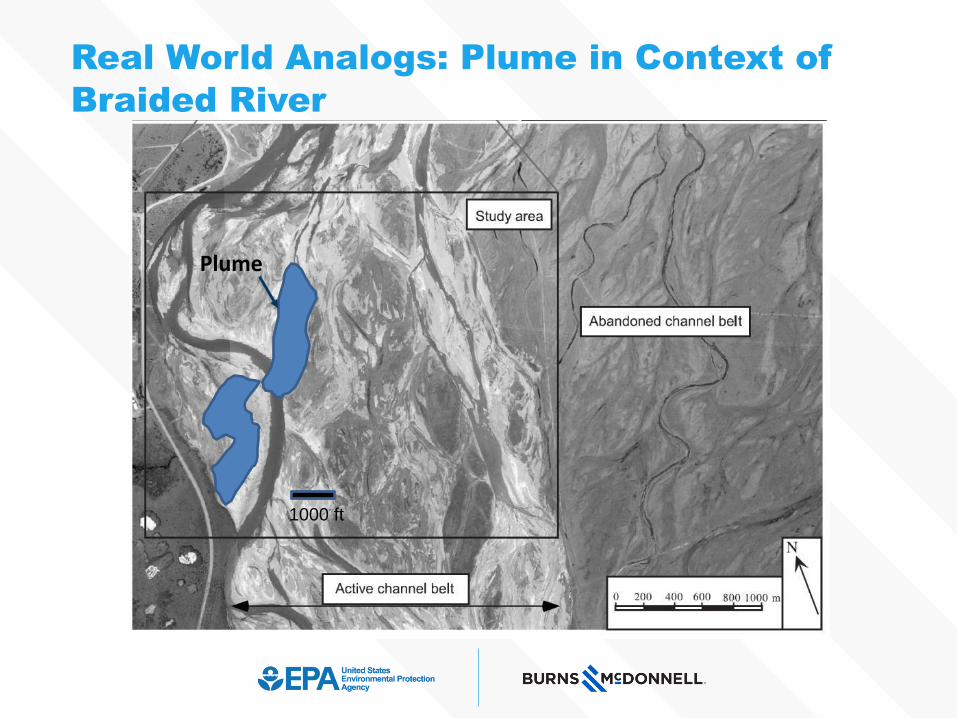
1000 ft
Real World Analogs: Plume in Context of
Braided River
Plume
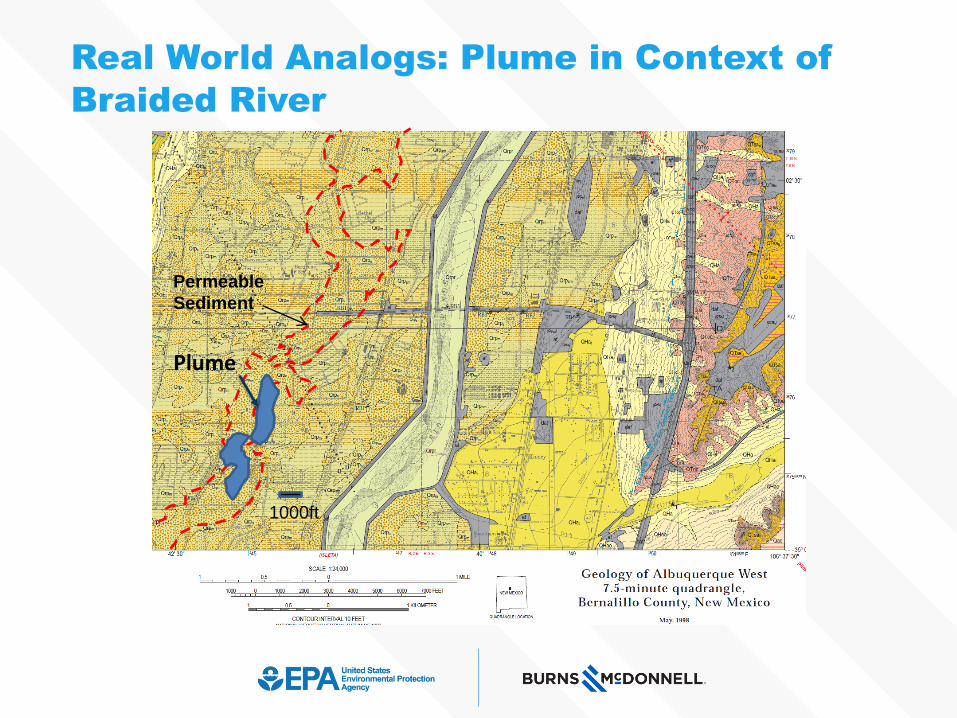
Permeable
Sediment
1000ft
Real World Analogs: Plume in Context of
Braided River
Plume
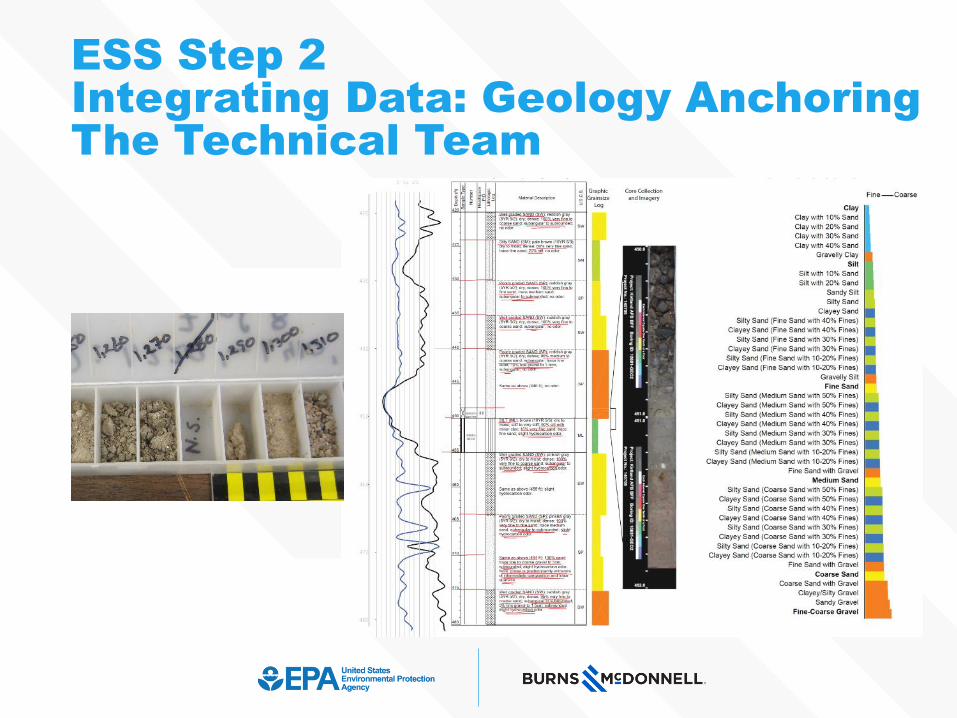
ESS Step 2Integrating Data: Geology Anchoring The Technical Team
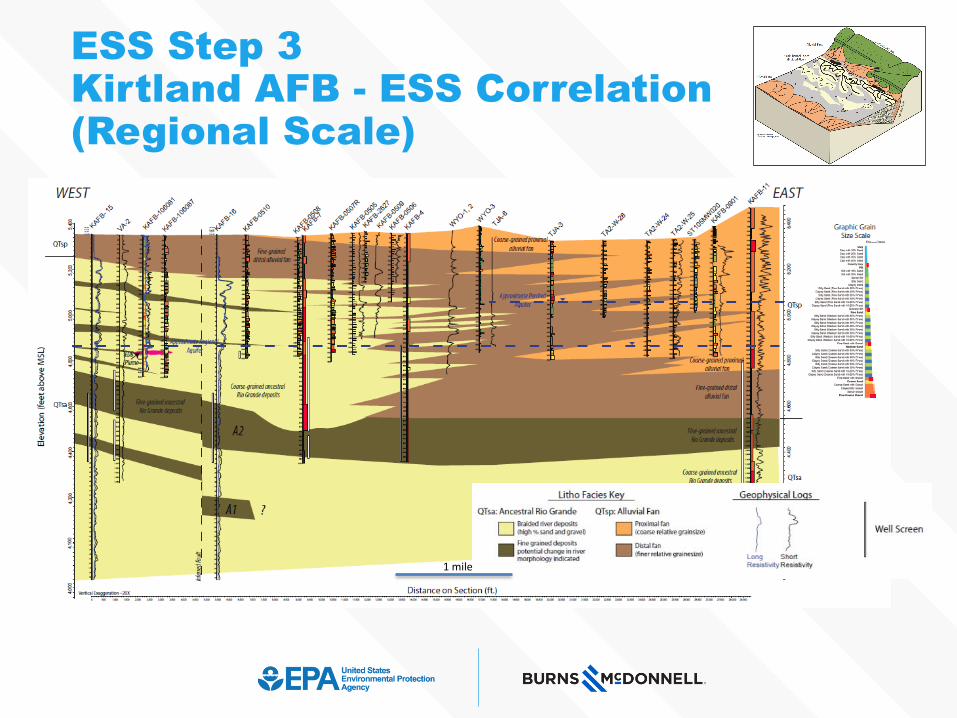
ESS Step 3Kirtland AFB - ESS Correlation(Regional Scale)
1 mile
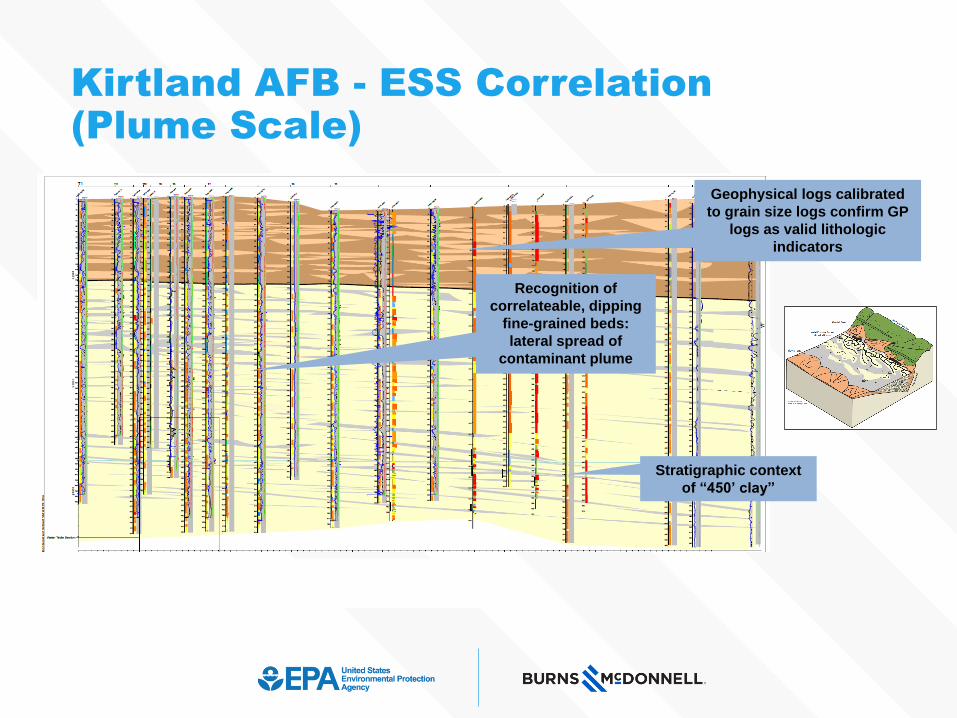
Kirtland AFB - ESS Correlation(Plume Scale)
Stratigraphic context
of “450’ clay”
Recognition of
correlateable, dipping
fine-grained beds:
lateral spread of
contaminant plume
Geophysical logs calibrated
to grain size logs confirm GP
logs as valid lithologic
indicators
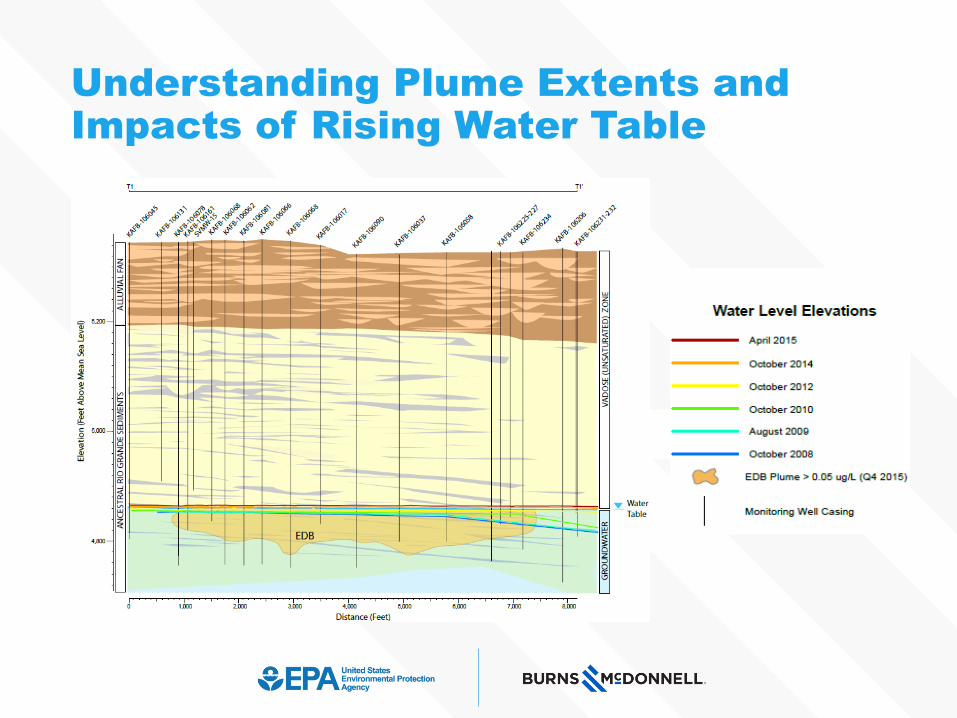
Understanding Plume Extents and Impacts of Rising Water Table
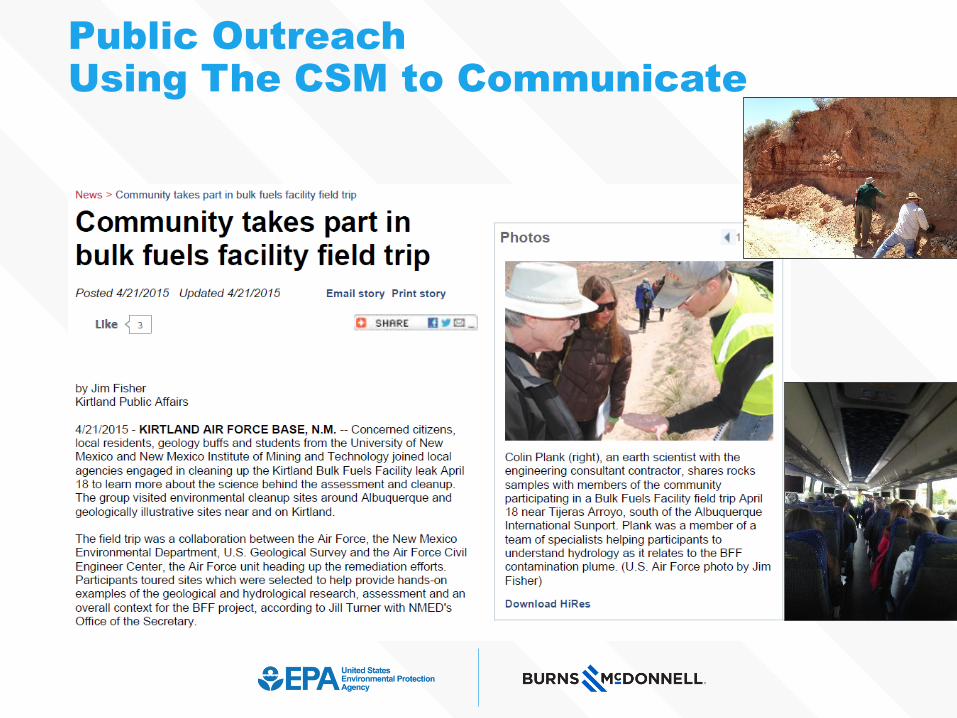
Public OutreachUsing The CSM to Communicate
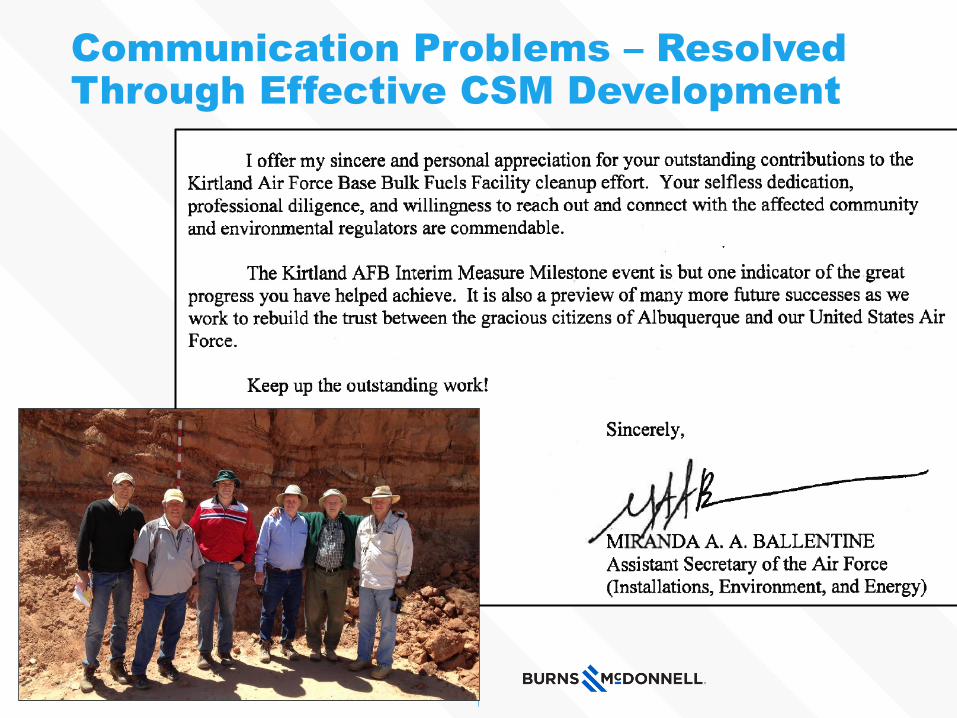
Communication Problems – Resolved Through Effective CSM Development
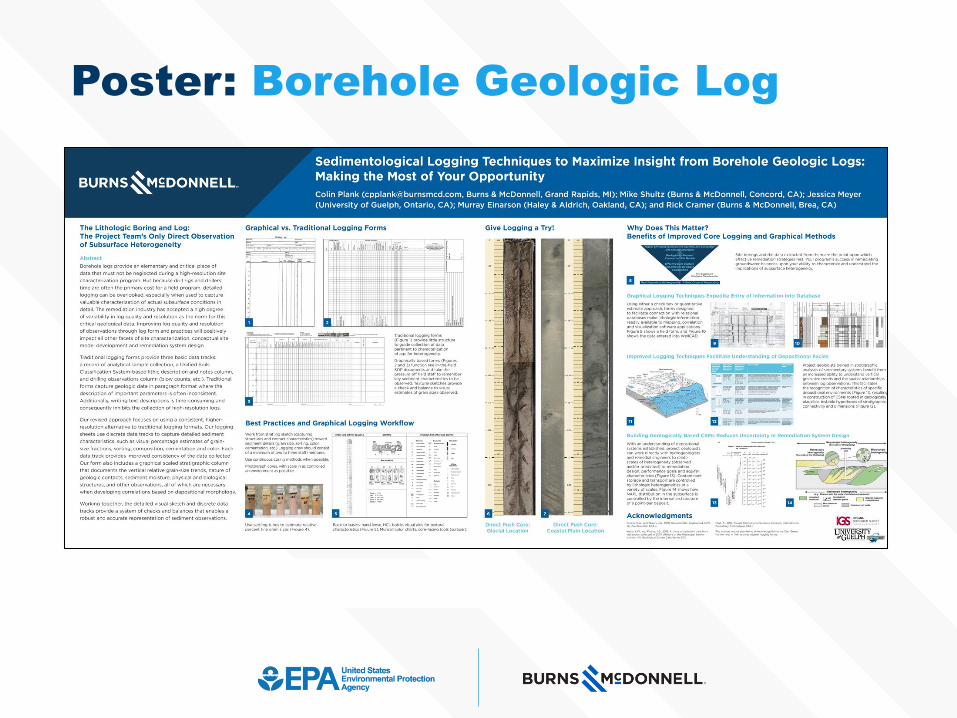
Poster: Borehole Geologic Log
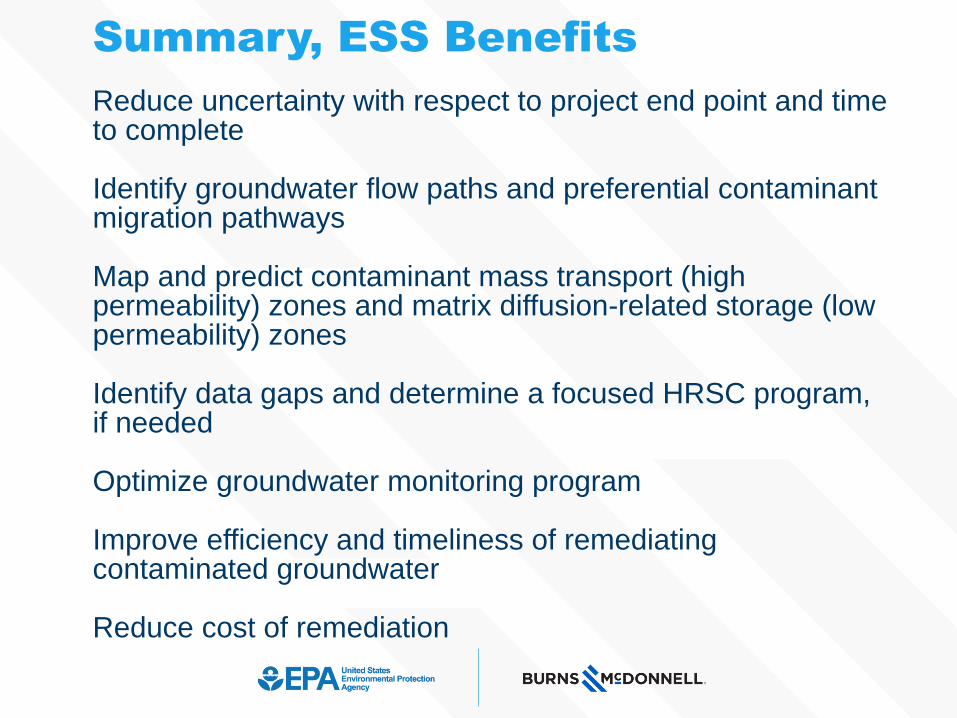
Summary, ESS Benefits
Reduce uncertainty with respect to project end point and time to complete
Identify groundwater flow paths and preferential contaminant migration pathways
Map and predict contaminant mass transport (high permeability) zones and matrix diffusion-related storage (low permeability) zones
Identify data gaps and determine a focused HRSC program, if needed
Optimize groundwater monitoring program
Improve efficiency and timeliness of remediating contaminated groundwater
Reduce cost of remediation
Thank you!
Rick Cramer
Mike Shultz
Colin Plank
Herb Levine