Embed Size (px)
Citation preview
BIOPRESENTATIONPAPER
Better Software Conference & EXPOSeptember 27-30, 2004
San Jose, CA USA
W9
September 29, 2004 3:00 PM
QA PRACTICE IN HIGHMATURITY ORGANIZATIONS
Steve ThompsonBAE Systems
Steven ThompsonSteven Thompson has been an active agent in helping mature BAE Systems Mission Solutionsprocess maturity for 14 years. Acting as process author, process action team lead, processgroup lead, assessor, and trainer, Steven has developed and applied expertise in developingand deploying high maturity CMM and CMMI processes. In his recent assignment as Director ofSoftware/Systems Assurance, Steven has developed, deployed, refined, and maintainedefficient systems for quantitatively managing and continuously improving QA activities. Thesesystems were formally assessed as satisfying CMMI Capability Level 5 for the Process andProduct Quality Assurance (PPQA) process area. BAE Systems Mission Solutions has beenformally assessed at both CMM and CMMI Level 5 Maturity. Steven holds a Bachelor ofScience degree in Mathematics, a Masters of Science in Software Engineering, and is alsocertified by the American Society for Quality as a Certified Software Quality Engineer.

© 2004 all rights reserved
Quality Assurance Practices in High Maturity Organizations
Elements, Approaches, and Lessons Learned
© 2004 all rights reserved
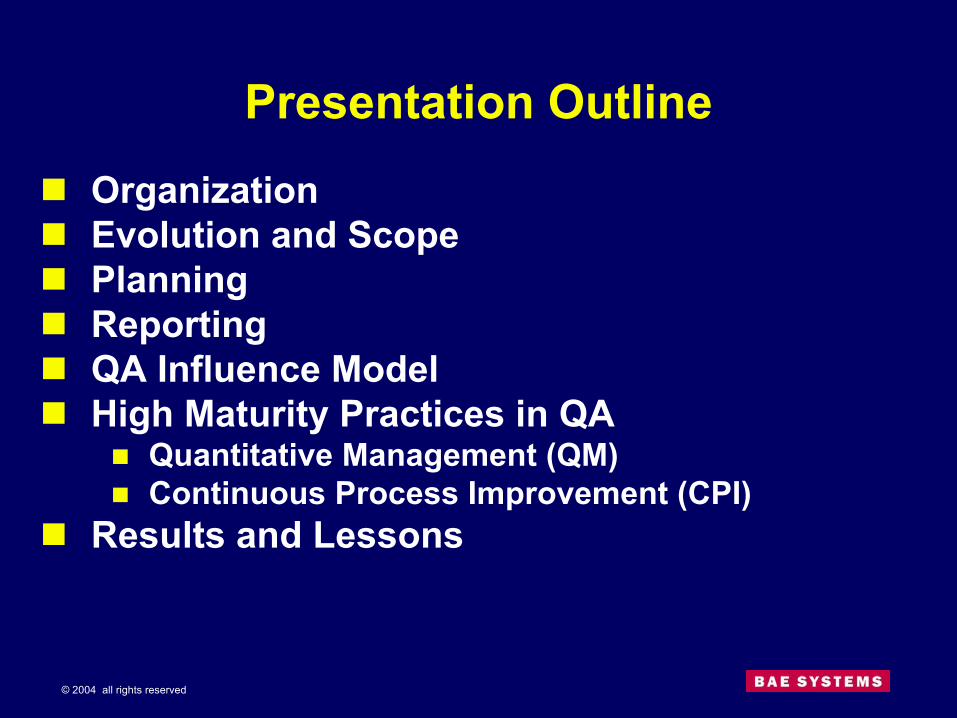
Presentation OutlineOrganizationEvolution and ScopePlanningReportingQA Influence ModelHigh Maturity Practices in QA
Quantitative Management (QM)Continuous Process Improvement (CPI)
Results and Lessons
© 2004 all rights reserved
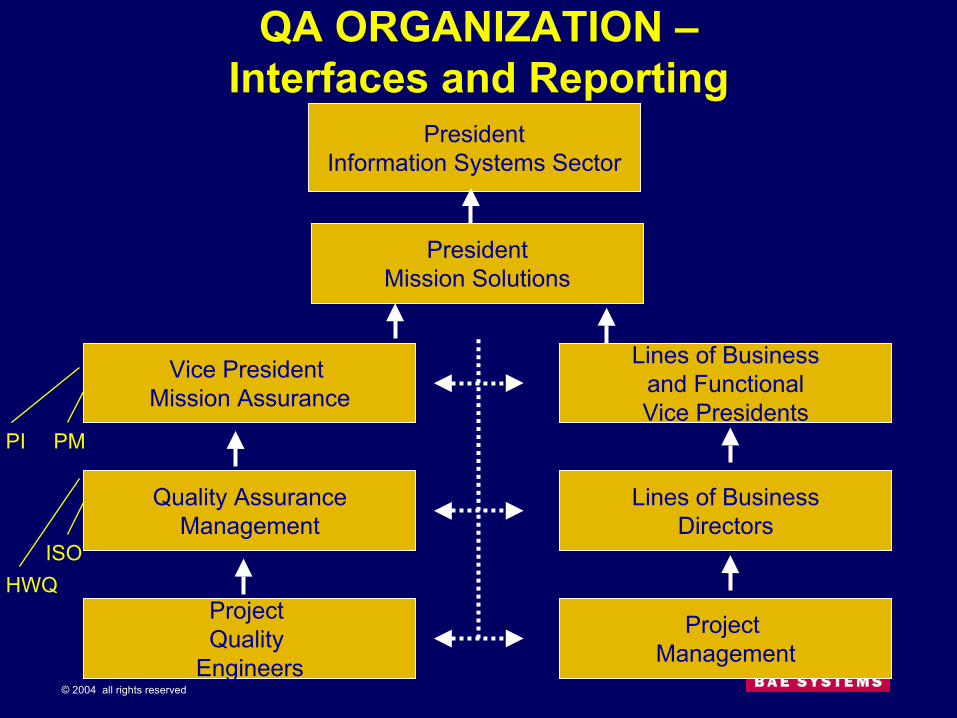
QA ORGANIZATION –Interfaces and Reporting
Quality AssuranceManagement
Project Quality
Engineers
Project Management
Lines of BusinessDirectors
Lines of Businessand FunctionalVice Presidents
Vice President Mission Assurance
PresidentInformation Systems Sector
PresidentMission Solutions
PI PM
HWQISO
© 2004 all rights reserved
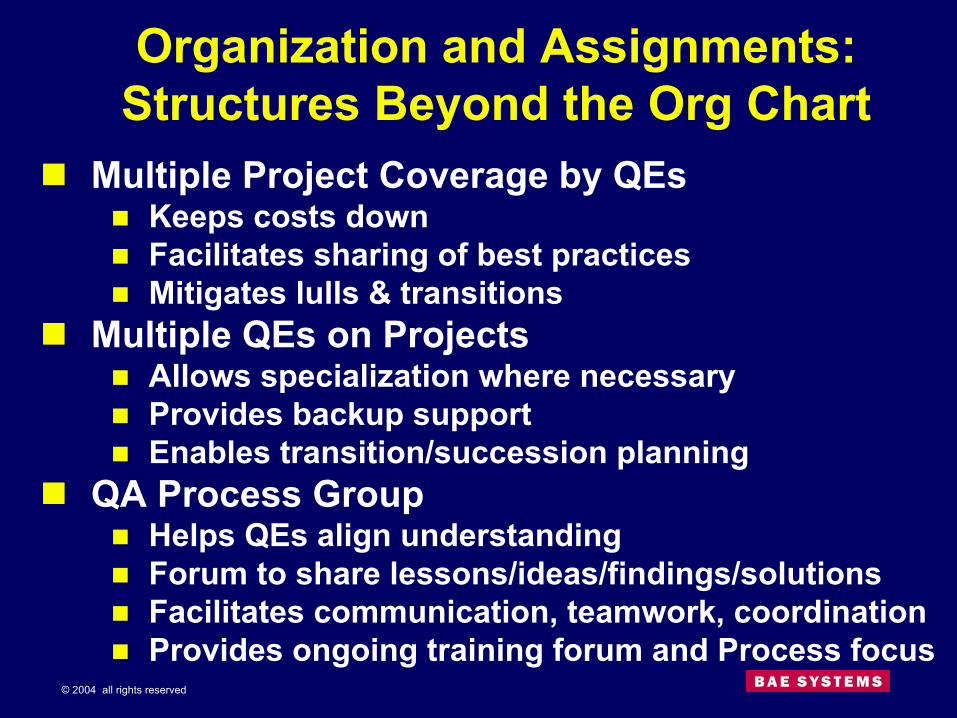
Organization and Assignments: Structures Beyond the Org Chart
Multiple Project Coverage by QEsKeeps costs downFacilitates sharing of best practicesMitigates lulls & transitions
Multiple QEs on ProjectsAllows specialization where necessaryProvides backup supportEnables transition/succession planning
QA Process GroupHelps QEs align understandingForum to share lessons/ideas/findings/solutionsFacilitates communication, teamwork, coordinationProvides ongoing training forum and Process focus
© 2004 all rights reserved
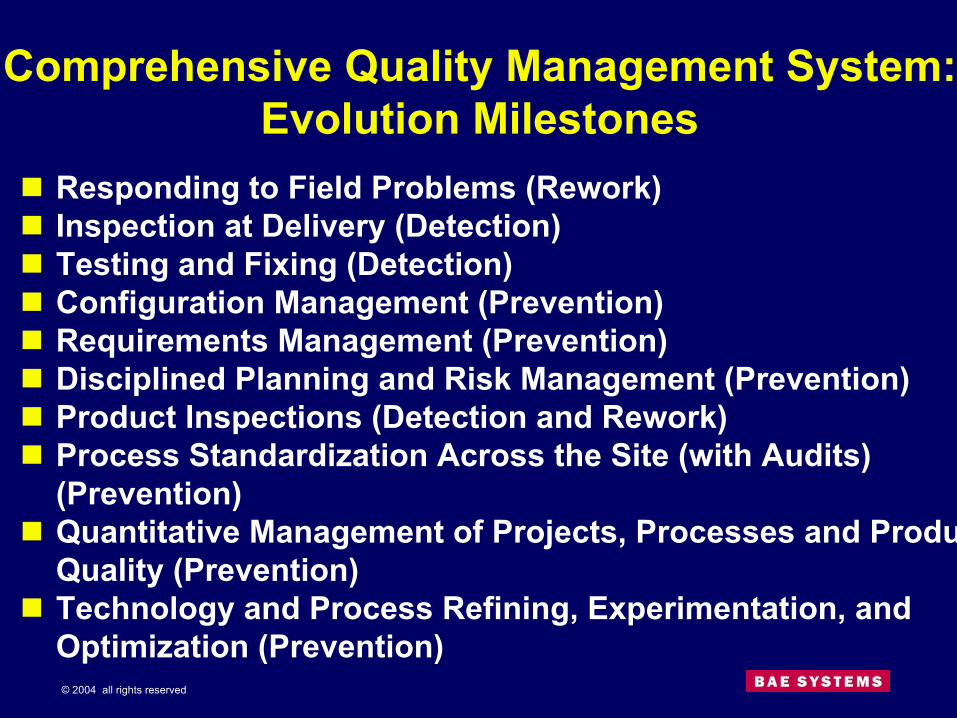
Comprehensive Quality Management System:Evolution Milestones
Responding to Field Problems (Rework)Inspection at Delivery (Detection)Testing and Fixing (Detection)Configuration Management (Prevention)Requirements Management (Prevention)Disciplined Planning and Risk Management (Prevention)Product Inspections (Detection and Rework)Process Standardization Across the Site (with Audits) (Prevention)Quantitative Management of Projects, Processes and Product Quality (Prevention)Technology and Process Refining, Experimentation, and Optimization (Prevention)
© 2004 all rights reserved
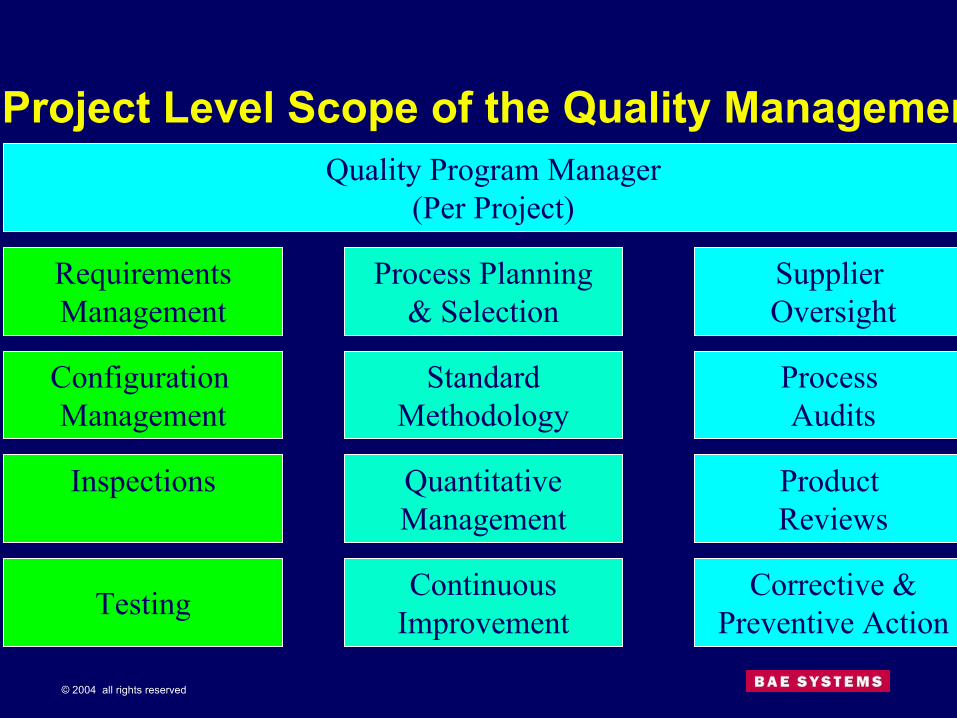
Project Level Scope of the Quality Management System (QMS)
ConfigurationManagement
Process Audits
QuantitativeManagement
Testing
StandardMethodology
RequirementsManagement
Inspections
Quality Program Manager(Per Project)
ContinuousImprovement
Process Planning& Selection
Product Reviews
Supplier Oversight
Corrective &Preventive Action
© 2004 all rights reserved
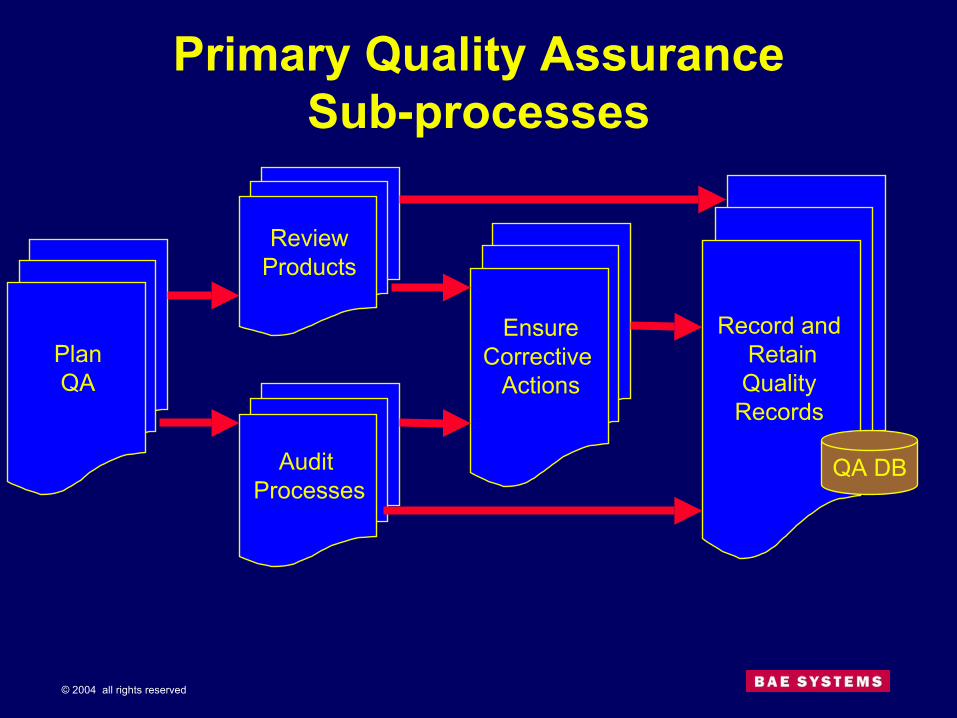
Primary Quality Assurance Sub-processes
PlanQA
ReviewProducts
Audit Processes
EnsureCorrective
Actions
Record and RetainQuality
Records
QA DB

© 2004 all rights reserved
QA PLANNINGPlans reflect scope, processes, lifecycle, and productsQA involved at onsetQA planning artifacts:QA Basis Of Estimate (BOE)
Initial planning toolIncludes Core QA, Process Engineering, PM SupportFocus for negotiations with PM
Program Quality Assurance Plan (PQAP) QA’s role and responsibilitiesTracked throughout projectUpdated annually
QA Evaluation ScheduleAssigns dates to complete specific QA eventsDriving artifact for QA activityUpdated monthly, reviewed quarterly
© 2004 all rights reserved
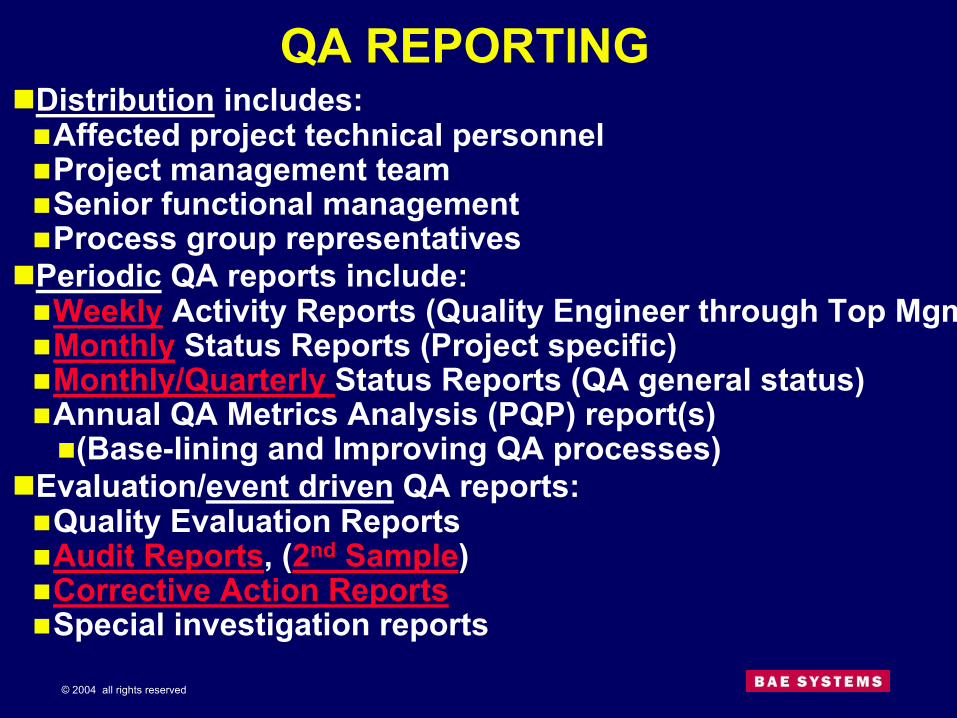
QA REPORTINGDistribution includes:Affected project technical personnelProject management teamSenior functional management Process group representatives
Periodic QA reports include:Weekly Activity Reports (Quality Engineer through Top Mgmt)Monthly Status Reports (Project specific)Monthly/Quarterly Status Reports (QA general status)Annual QA Metrics Analysis (PQP) report(s)
(Base-lining and Improving QA processes)Evaluation/event driven QA reports:Quality Evaluation ReportsAudit Reports, (2nd Sample)Corrective Action ReportsSpecial investigation reports
© 2004 all rights reserved
High Maturity Practices in Quality Assurance
Mechanisms for Quantitative Management (QM) and Continuous Process Improvement (CPI)

© 2004 all rights reserved
PROCESS IMPROVEMENT PROGRAMCMMI Capability Profiles for SE/SW/IPPD/SS
CMMI Capability
LevelsOPF OPD OT OPP OID PP PMC SAM IPM RSKM IT ISM QPM REQM RD TS PI VER VAL CM PPQA MA DAR OEI CAR
5
4
3
2
Current Capability Profile as of Dec '03 Class A SCAMPI (SE/SW)Target Capability Profile for 2004-2005 (SE/SW)Target Capability Profile for 2004-2005 (IPPD)Target Capability Profile for 2004-2005 (SS)
SupportProcess Management Project Management Engineering

© 2004 all rights reserved
Quality Assurance Influence Model
Quality Assurance Process Audits and Product Reviews
ManagementProcesses
DevelopmentProcesses
ProductQuality
<<< Management Audits Directly Influence Management Processes: Improving Cost and Schedule Performance Indices
<<< Development Audits Influence Development Processes: Improving Productivity, Defect Leakage
<<< Product Reviews Directly Influence Product Quality: Improving Post-Delivery Defect Density

© 2004 all rights reserved
Primary Quality Assurance Sub-processes
PlanQA
ReviewProducts
Audit Processes
EnsureCorrective
Actions
Record and RetainQuality
Records
QA DB
© 2004 all rights reserved
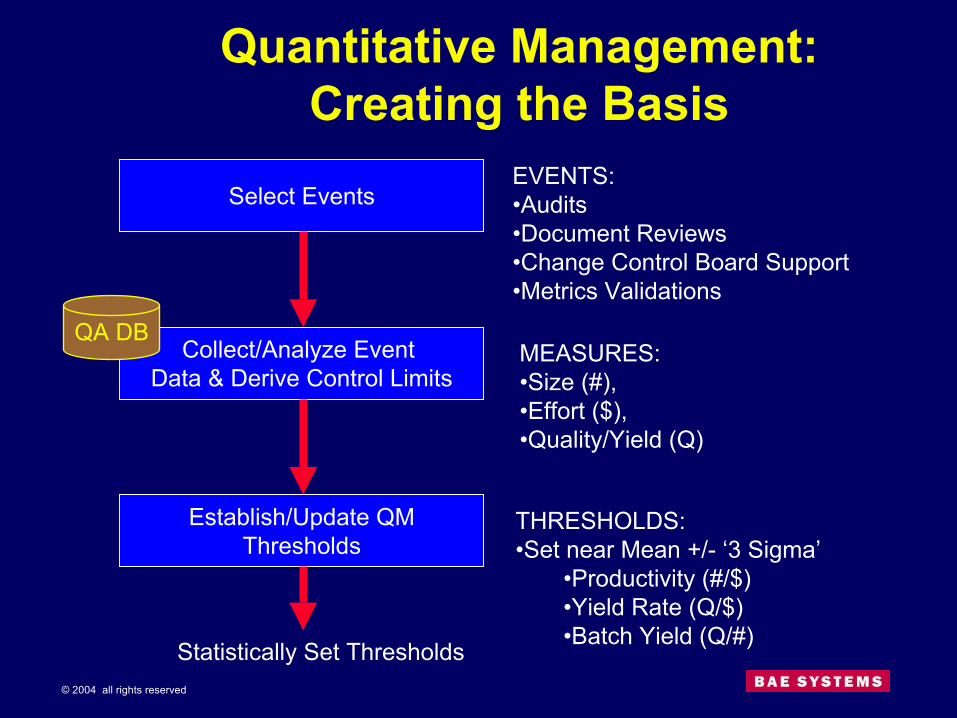
Quantitative Management: Creating the Basis
Establish/Update QMThresholds
Collect/Analyze Event Data & Derive Control Limits
MEASURES:•Size (#), •Effort ($), •Quality/Yield (Q)
THRESHOLDS:•Set near Mean +/- ‘3 Sigma’
•Productivity (#/$)•Yield Rate (Q/$)•Batch Yield (Q/#)
Select EventsEVENTS:•Audits•Document Reviews•Change Control Board Support•Metrics Validations
Statistically Set Thresholds
QA DB
© 2004 all rights reserved
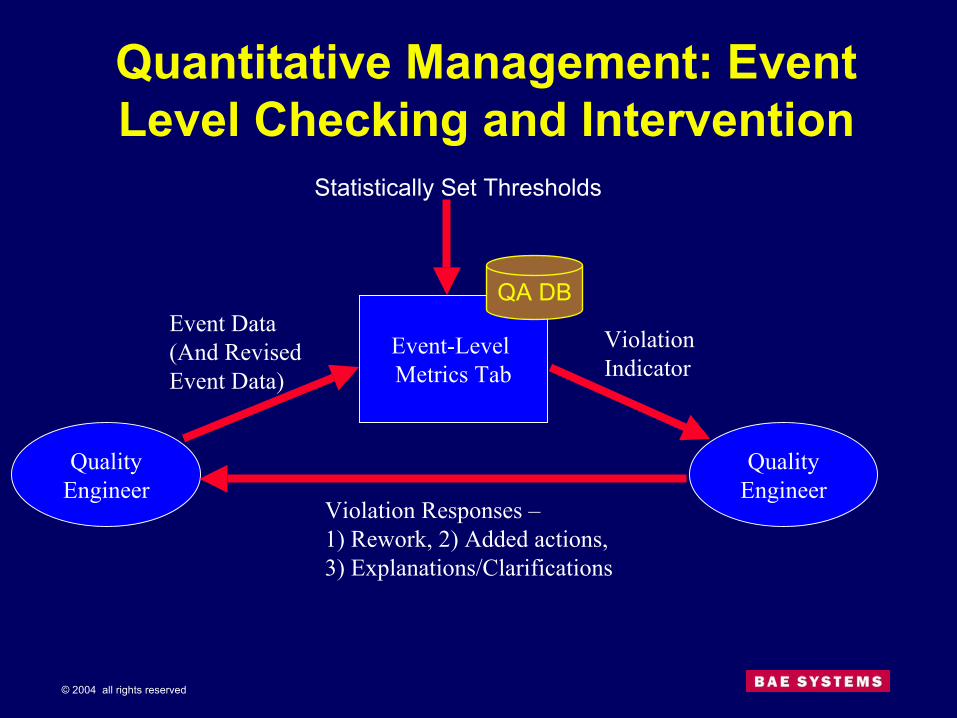
Quantitative Management: Event Level Checking and Intervention
QualityEngineer
QualityEngineer
Event-Level Metrics Tab
Event Data(And RevisedEvent Data)
Violation Indicator
Violation Responses –1) Rework, 2) Added actions,3) Explanations/Clarifications
Statistically Set Thresholds
QA DB

© 2004 all rights reserved
Metrics Tab
© 2004 all rights reserved
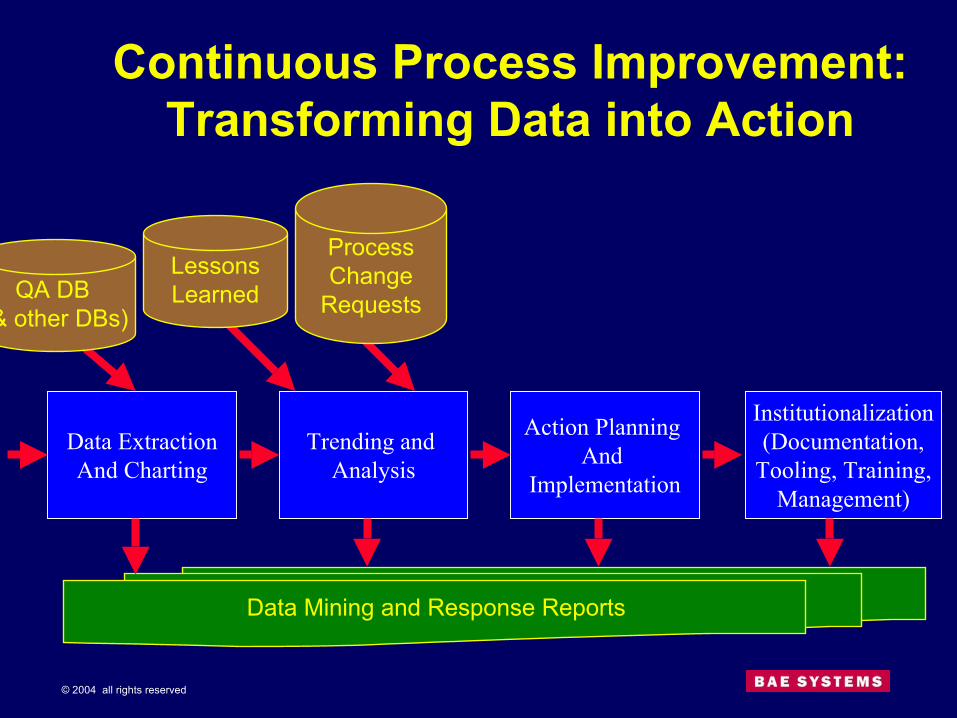
Continuous Process Improvement: Transforming Data into Action
QA DB (& other DBs)
Data ExtractionAnd Charting
Trending and Analysis
Action Planning And
Implementation
LessonsLearned
Institutionalization(Documentation,
Tooling, Training,Management)
ProcessChange
Requests
Data Mining and Response Reports
© 2004 all rights reserved
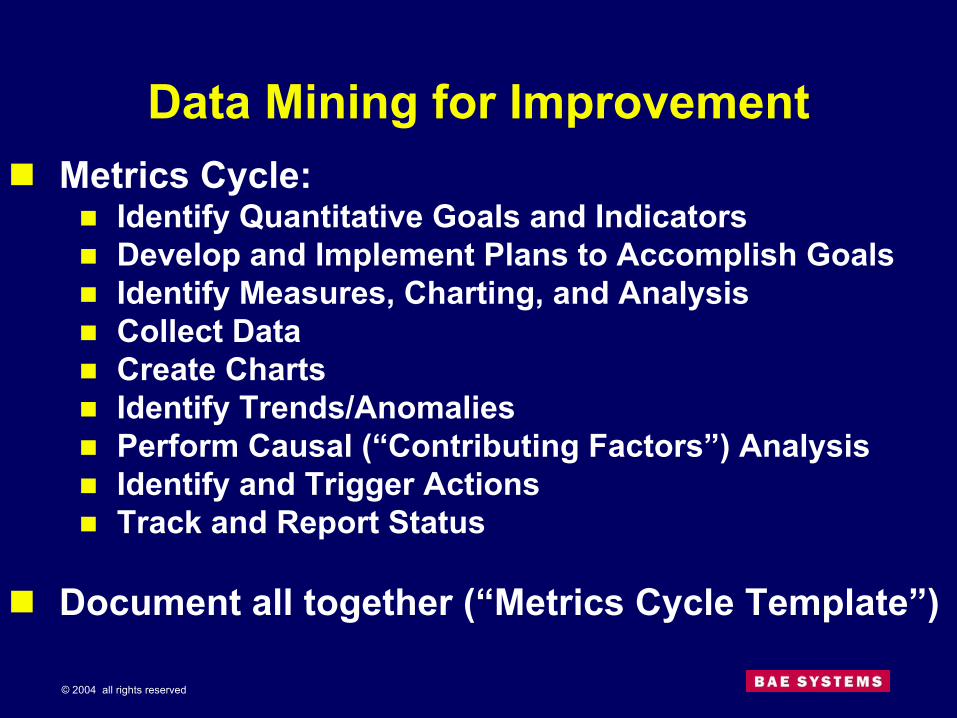
Data Mining for ImprovementMetrics Cycle:
Identify Quantitative Goals and IndicatorsDevelop and Implement Plans to Accomplish GoalsIdentify Measures, Charting, and AnalysisCollect DataCreate ChartsIdentify Trends/AnomaliesPerform Causal (“Contributing Factors”) AnalysisIdentify and Trigger ActionsTrack and Report Status
Document all together (“Metrics Cycle Template”)

© 2004 all rights reserved
Realized ImprovementsQuantitative Results:
Provided event-level data for estimating QAProject CMMI Audits take 11.74 hours on average, etc.
Improved detection of problems DR review findings/hour increased 108%
Improved Corrective ActionsProportion with Preventive actions increased from 15.7% to 26.5%
Reduced audit cycle time48.1% reduction in cycle time

© 2004 all rights reserved
Realized Improvements (continued)Qualitative Results:
Improved discipline of Quality Engineers (QE)Provided example of QM/CPI for organizationImproved QE ability to support project QM/CPIImproved perception of QA organization
© 2004 all rights reserved
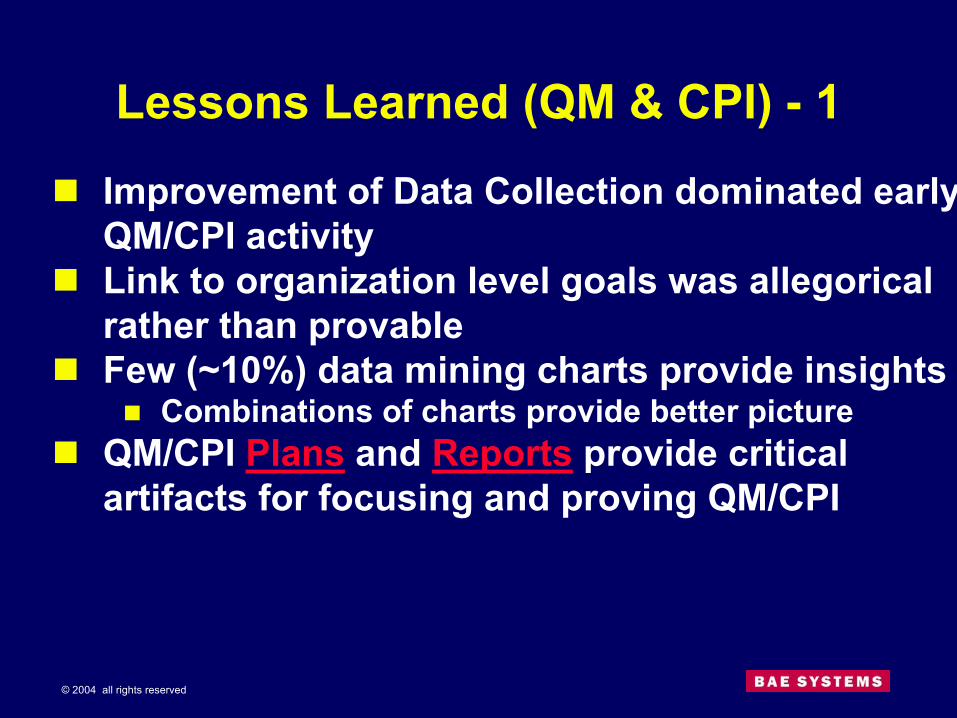
Lessons Learned (QM & CPI) - 1
Improvement of Data Collection dominated early QM/CPI activityLink to organization level goals was allegorical rather than provableFew (~10%) data mining charts provide insights
Combinations of charts provide better pictureQM/CPI Plans and Reports provide critical artifacts for focusing and proving QM/CPI

© 2004 all rights reserved
Lessons Learned / Recommendations for QA – 2
Step out of the box:Staff QA with talented personnel (Past assignments may vary widely)Aggressively train QEs in management, development, and support processesTake on roles in Process Engineering, Program Management Support, as well as core Quality AssuranceTake on miscellaneous tasks your team is capable of doing (maintain objectivity)Formalize your participation in the new roles
© 2004 all rights reserved
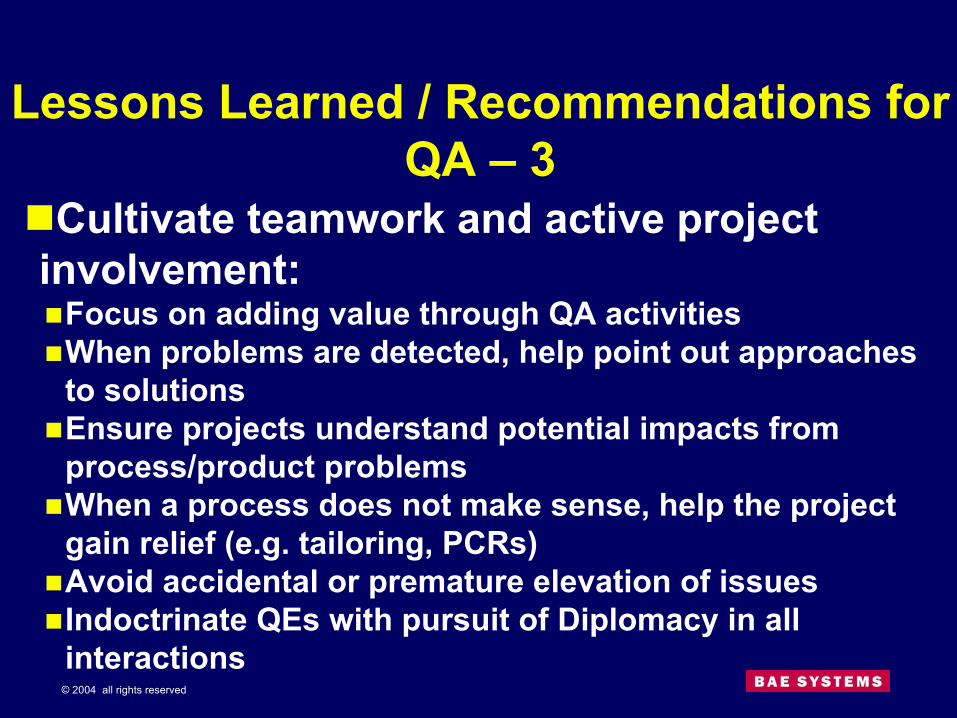
Cultivate teamwork and active project involvement:
Focus on adding value through QA activitiesWhen problems are detected, help point out approaches to solutionsEnsure projects understand potential impacts from process/product problemsWhen a process does not make sense, help the project gain relief (e.g. tailoring, PCRs)Avoid accidental or premature elevation of issuesIndoctrinate QEs with pursuit of Diplomacy in all interactions
Lessons Learned / Recommendations for QA – 3
© 2004 all rights reserved
Lessons Learned / Recommendations for QA – 4
Participate actively in the process group activities:
Help define the procedures to ensure CMMI/ISO/whatever complianceContribute to data mining, analysis, response, and reportingLead high maturity behaviors but be sure to merge with Process Group thrusts
Copyright © 2004 by BAE Systems
Mission Solutions P.O. Box 509008 San Diego, CA 92150-9008 USATelephone (858) 675-2600Permission hereby granted to Better Software Conference & EXPO to publish in 2004 proceedings.
Date: 21 June 2004
Quality Assurance Practices in High MaturityOrganizations:Elements, Approaches, and Lessons Learned
Program Title: Better Software Conference and EXPO
Prepared For: Better Software Conference and EXPOSeptember 27 – 30, 2004San Jose, CA
Document: Quality Assurance Practices in High Maturity OrganizationsDate: 21 June, 2004
1
Author:Steven Thompson,Director of Software and Systems Assurance - BAE Systems, Mission [email protected]
Biography: Steven Thompson has been an active agent in helping mature BAE Systems MissionSolutions process maturity for 14 years. Acting as process author, process action team lead,process group lead, assessor, and trainer, Steven has developed and applied expertise indeveloping and deploying high maturity CMM and CMMI processes. In his recent assignmentas Director of Software/Systems Assurance, Steven has developed, deployed, refined, andmaintained efficient systems for quantitatively managing and continuously improving QAactivities. These systems were formally assessed as satisfying CMMI Capability Level 5 for theProcess and Product Quality Assurance (PPQA) process area. BAE Systems Mission Solutionshas been formally assessed at both CMM and CMMI Level 5 Maturity. Steven holds a Bachelorof Science degree in Mathematics, a Masters of Science in Software Engineering, and is alsocertified by the American Society for Quality as a Certified Software Quality Engineer.
Context:This paper is written as an expansion companion to presentation material provided in powerpoint presentation sessions. Having the presentation at hand while reading will enhance theunderstanding of this material.
Abstract:A wave of data driven management and change is crashing through the industry affecting howengineering, management, and support functions operate. This paper provides detailed examplesfrom the evolution of the Quality Assurance organization in BAE Systems, Mission Solutions asthe QA department improved its basic infrastructure and operations to become a quantitativelymanaged and continuously improving department. The principles related in this presentation andpaper may also be applied to any management, engineering, or support areas with appropriatemodifications.
1. Introduction:This paper presents a glimpse into the Quality Assurance processes currently in place at BAESystems, Mission Solutions, Rancho Bernardo, CA. This Quality Management System is ISO9001:2000 (Reference 1) certified, CMM® (Reference 2) compliant, and recently graded in aSCAMPISM Class A appraisal as fully satisfying CMMI® (Reference 3) Capability Level 5 forthe Process and Product Quality Assurance (PPQA) process area.
2. Outline:This paper covers the organization associated with the QA department, briefly discusses somemilestone events associated with evolving QA over time, discusses the scope of a comprehensiveQuality Management System, then digs into details of mechanisms used for planning QA andreporting QA activities. Discussion is then held on how QA influences project outcomes. Next,a description of the approach used by QA to Quantitatively Manage and Continuously Improveits own activities is provided. Finally, the paper finishes up with a discussion of lessons thedepartment has learned over the last 4 year transformation.
Document: Quality Assurance Practices in High Maturity OrganizationsDate: 21 June, 2004
2
3. QA Organization:The BAE Systems Mission Solutions QA department organization is fairly standard. TheDirector of Software Systems Assurance (SSA) has about a dozen Quality Engineers reporting tohim. SSA is chartered to ensure projects maintain compliance with CMMI and also coversportions of the ISO standard. The Director of QA overseeing SSA also has branches forcovering the entire ISO standard as well as Hardware Quality (HWQ) activities such as HWinspections, supplier oversight, and calibration. The Director of QA then reports through theVice-President (VP) of Mission Assurance (MA) to the business unit and sector presidents. Inaddition to overseeing QA, the MA VP also oversees the Process Improvement (PI) group aswell as the Program & Risk Management (PM) group. The primary interactions depicted in theorganization chart occur with the Quality Engineers who work closely with their ProgramManagers, acting as an independent set of eyes and ears for the PMs.
4. Organization and Assignments:Some of the most important aspects of our organization don’t show up on the org chart. Forinstance, it is the norm for the department to assign a QE to multiple projects. Not only is this anecessity when many smaller projects have small QA budgets, but there are some advantages aswell. In addition to helping keep costs down, this arrangement facilitates sharing of bestpractices as the QE learns from one project and takes ideas across to their other projects. Thereis also an efficiency resulting from the ability of the QE to accommodate lulls and transitions inactivities on one program by working other assigned programs when they hit budget bathtubsand other times of low program activity.
Another organizing strategy currently in place is to have multiple QEs associated with eachproject. This is typically set up with a primary Quality Engineer overseeing the program havingbackup QEs supporting them. This setup allows specialization such as one QE performingprocess audits while another does document reviews. This also builds in backup support for theprimary QEs when they need to take vacation, work other assignments (temporary orpermanent), or there is a surge of quality activity needed to support events like FAT or majorprogram reviews.
A somewhat unique aspect of the business units QA organization is the QA Process Group (QAPG). This group is chartered to own and improve QA processes. All QEs are included asmembers and the full group meets every two weeks. Various subgroups such as a QA MetricsGroup, QA Training Group, QA Document Group are spun off as needed to address departmentinfrastructure operations and special issues that may arise. The QA PG has been instrumental inaligning department understanding of processes and practices. The meetings provide a forum forsharing QE experiences (such as lessons gleaned from day to day activities, new ideas fordepartment operations, findings from audits, etc. that other QEs may need to look for, andsolutions to issues that may be applicable to other programs. Just getting together periodicallycontributes significantly to communication, teamwork, and coordination of efforts. Also, the QAPG provides an ongoing forum for small training interventions while also keeping the membersfocused on process improvement of QA activities.
5. Evolution towards a Comprehensive Quality Management System:
Document: Quality Assurance Practices in High Maturity OrganizationsDate: 21 June, 2004
3
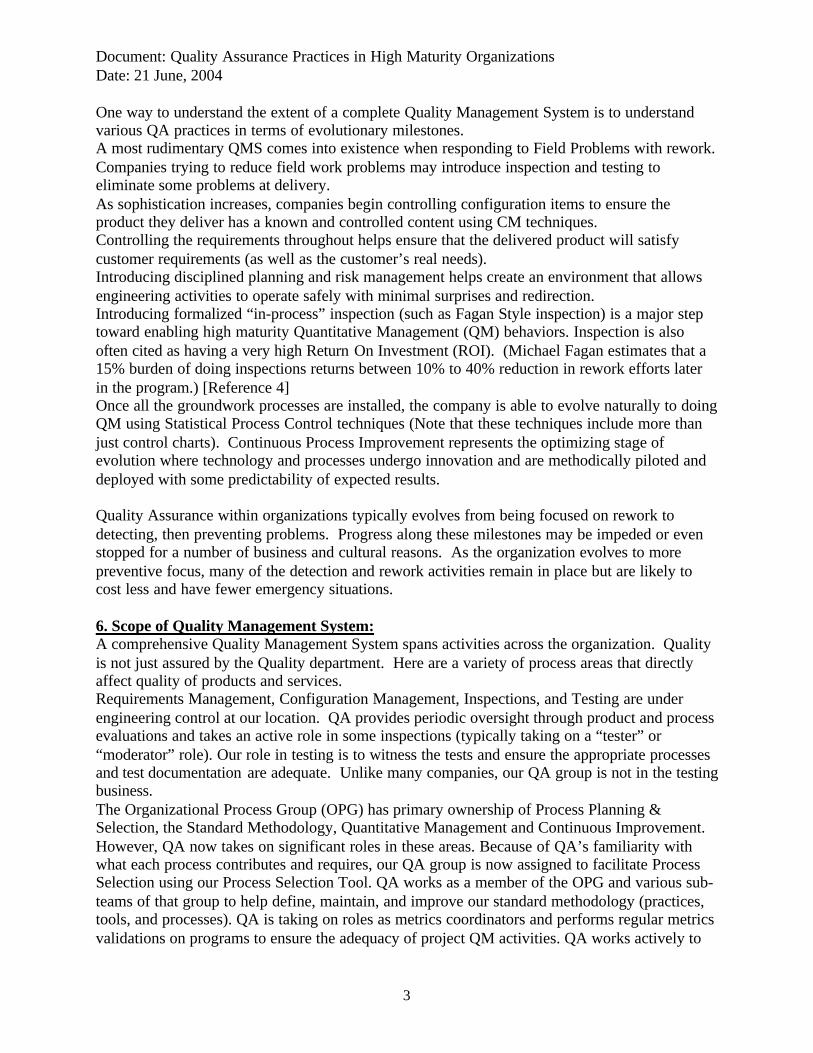
One way to understand the extent of a complete Quality Management System is to understandvarious QA practices in terms of evolutionary milestones.A most rudimentary QMS comes into existence when responding to Field Problems with rework.Companies trying to reduce field work problems may introduce inspection and testing toeliminate some problems at delivery.As sophistication increases, companies begin controlling configuration items to ensure theproduct they deliver has a known and controlled content using CM techniques.Controlling the requirements throughout helps ensure that the delivered product will satisfycustomer requirements (as well as the customer’s real needs).Introducing disciplined planning and risk management helps create an environment that allowsengineering activities to operate safely with minimal surprises and redirection.Introducing formalized “in-process” inspection (such as Fagan Style inspection) is a major steptoward enabling high maturity Quantitative Management (QM) behaviors. Inspection is alsooften cited as having a very high Return On Investment (ROI). (Michael Fagan estimates that a15% burden of doing inspections returns between 10% to 40% reduction in rework efforts laterin the program.) [Reference 4]Once all the groundwork processes are installed, the company is able to evolve naturally to doingQM using Statistical Process Control techniques (Note that these techniques include more thanjust control charts). Continuous Process Improvement represents the optimizing stage ofevolution where technology and processes undergo innovation and are methodically piloted anddeployed with some predictability of expected results.
Quality Assurance within organizations typically evolves from being focused on rework todetecting, then preventing problems. Progress along these milestones may be impeded or evenstopped for a number of business and cultural reasons. As the organization evolves to morepreventive focus, many of the detection and rework activities remain in place but are likely tocost less and have fewer emergency situations.
6. Scope of Quality Management System:A comprehensive Quality Management System spans activities across the organization. Qualityis not just assured by the Quality department. Here are a variety of process areas that directlyaffect quality of products and services.Requirements Management, Configuration Management, Inspections, and Testing are underengineering control at our location. QA provides periodic oversight through product and processevaluations and takes an active role in some inspections (typically taking on a “tester” or“moderator” role). Our role in testing is to witness the tests and ensure the appropriate processesand test documentation are adequate. Unlike many companies, our QA group is not in the testingbusiness.The Organizational Process Group (OPG) has primary ownership of Process Planning &Selection, the Standard Methodology, Quantitative Management and Continuous Improvement.However, QA now takes on significant roles in these areas. Because of QA’s familiarity withwhat each process contributes and requires, our QA group is now assigned to facilitate ProcessSelection using our Process Selection Tool. QA works as a member of the OPG and various sub-teams of that group to help define, maintain, and improve our standard methodology (practices,tools, and processes). QA is taking on roles as metrics coordinators and performs regular metricsvalidations on programs to ensure the adequacy of project QM activities. QA works actively to
Document: Quality Assurance Practices in High Maturity OrganizationsDate: 21 June, 2004
4
support our Organizational Defect Prevention Process Group and our Innovation andDeployment Group to enable specific continuous process improvements. QA is also likely tosubmit Process Change Requests as a result of detecting problems during audits and other QAactivities. QA also performs periodic data mining activities on a variety of data sources toidentify trends, perform analysis, plan & trigger actions, and monitor status to closure. Datasources include Process Change Request Database (PCR DB), Risk Registers, Lessons LearnedDB, Audit DB, Inspection DB, etc.The comprehensive QMS also includes QA participation in Supplier Selection and Oversight.QA has recently begun to extend its very well–established HW supplier oversight practices toinclude SW suppliers as well. This is one of the areas that has multiple owners includingProgram Management, Engineering, Procurement, HW QA, and SW QA.Finally, the QMS also includes what we consider to be our Core QA activities: performingaudits, product reviews, and corrective actions.
7. QA Sub-Processes:Ignoring the Process Engineering and Program Management Support activities for the moment,the primary Core QA activities include QA Planning, Product Reviews, Process Audits,Corrective Action and Quality Record Management. The procedures for establishing Core QAare brief (approximately 1 page each) and rely heavily on templates, checklists, and databases toenable performance of the QA activities. The QA records and retention database turned out to bea critical asset for establishing the QA QM paradigm.
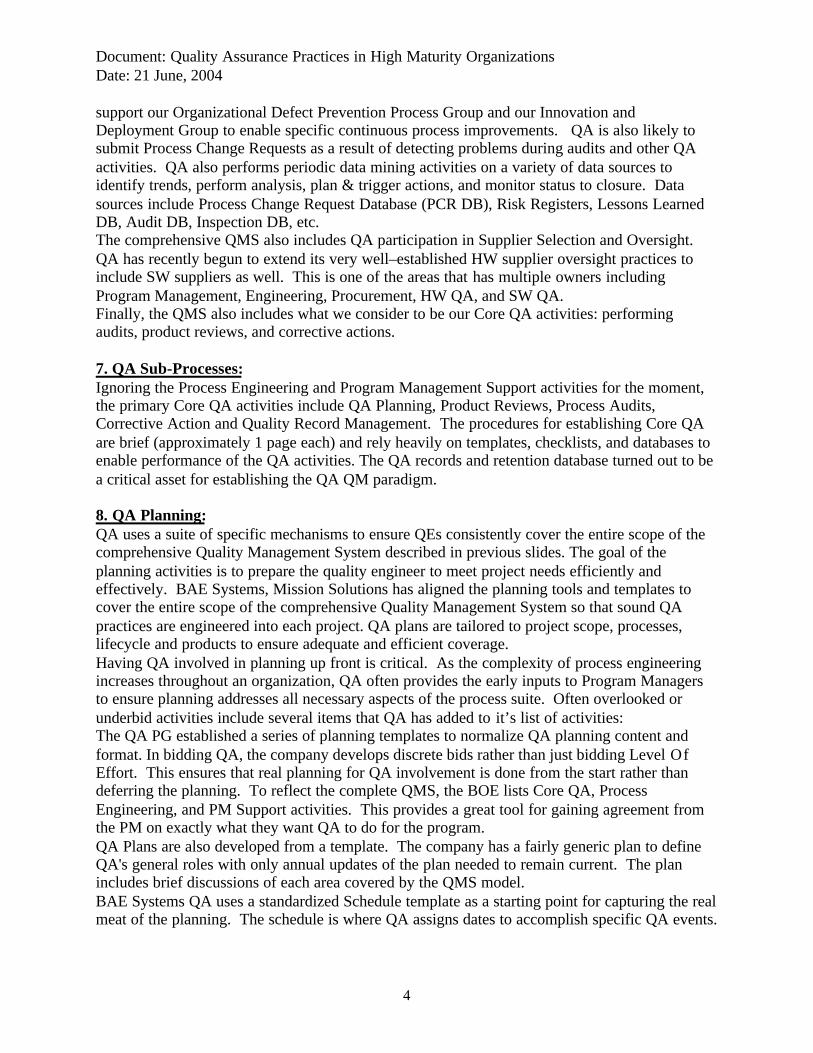
8. QA Planning:QA uses a suite of specific mechanisms to ensure QEs consistently cover the entire scope of thecomprehensive Quality Management System described in previous slides. The goal of theplanning activities is to prepare the quality engineer to meet project needs efficiently andeffectively. BAE Systems, Mission Solutions has aligned the planning tools and templates tocover the entire scope of the comprehensive Quality Management System so that sound QApractices are engineered into each project. QA plans are tailored to project scope, processes,lifecycle and products to ensure adequate and efficient coverage.Having QA involved in planning up front is critical. As the complexity of process engineeringincreases throughout an organization, QA often provides the early inputs to Program Managersto ensure planning addresses all necessary aspects of the process suite. Often overlooked orunderbid activities include several items that QA has added to it’s list of activities:The QA PG established a series of planning templates to normalize QA planning content andformat. In bidding QA, the company develops discrete bids rather than just bidding Level OfEffort. This ensures that real planning for QA involvement is done from the start rather thandeferring the planning. To reflect the complete QMS, the BOE lists Core QA, ProcessEngineering, and PM Support activities. This provides a great tool for gaining agreement fromthe PM on exactly what they want QA to do for the program.QA Plans are also developed from a template. The company has a fairly generic plan to defineQA's general roles with only annual updates of the plan needed to remain current. The planincludes brief discussions of each area covered by the QMS model.BAE Systems QA uses a standardized Schedule template as a starting point for capturing the realmeat of the planning. The schedule is where QA assigns dates to accomplish specific QA events.
Document: Quality Assurance Practices in High Maturity OrganizationsDate: 21 June, 2004
5
This is the driving artifact for the QA activity. Currently, QEs update schedules at least monthlyand have QA management spot check the schedules quarterly.This planning approach of using pre-packaged templates could be applied to any area that hasfairly stable set of activities they need to accomplish.
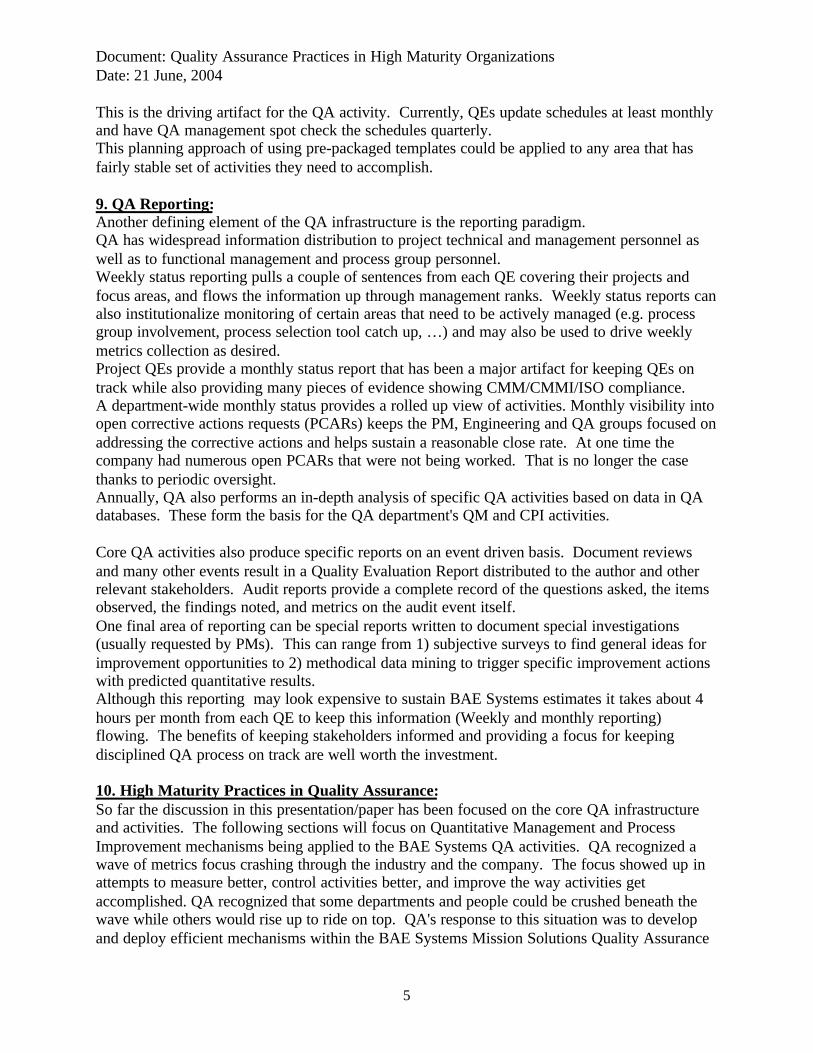
9. QA Reporting:Another defining element of the QA infrastructure is the reporting paradigm.QA has widespread information distribution to project technical and management personnel aswell as to functional management and process group personnel.Weekly status reporting pulls a couple of sentences from each QE covering their projects andfocus areas, and flows the information up through management ranks. Weekly status reports canalso institutionalize monitoring of certain areas that need to be actively managed (e.g. processgroup involvement, process selection tool catch up, …) and may also be used to drive weeklymetrics collection as desired.Project QEs provide a monthly status report that has been a major artifact for keeping QEs ontrack while also providing many pieces of evidence showing CMM/CMMI/ISO compliance.A department-wide monthly status provides a rolled up view of activities. Monthly visibility intoopen corrective actions requests (PCARs) keeps the PM, Engineering and QA groups focused onaddressing the corrective actions and helps sustain a reasonable close rate. At one time thecompany had numerous open PCARs that were not being worked. That is no longer the casethanks to periodic oversight.Annually, QA also performs an in-depth analysis of specific QA activities based on data in QAdatabases. These form the basis for the QA department's QM and CPI activities.
Core QA activities also produce specific reports on an event driven basis. Document reviewsand many other events result in a Quality Evaluation Report distributed to the author and otherrelevant stakeholders. Audit reports provide a complete record of the questions asked, the itemsobserved, the findings noted, and metrics on the audit event itself.One final area of reporting can be special reports written to document special investigations(usually requested by PMs). This can range from 1) subjective surveys to find general ideas forimprovement opportunities to 2) methodical data mining to trigger specific improvement actionswith predicted quantitative results.Although this reporting may look expensive to sustain BAE Systems estimates it takes about 4hours per month from each QE to keep this information (Weekly and monthly reporting)flowing. The benefits of keeping stakeholders informed and providing a focus for keepingdisciplined QA process on track are well worth the investment.
10. High Maturity Practices in Quality Assurance:So far the discussion in this presentation/paper has been focused on the core QA infrastructureand activities. The following sections will focus on Quantitative Management and ProcessImprovement mechanisms being applied to the BAE Systems QA activities. QA recognized awave of metrics focus crashing through the industry and the company. The focus showed up inattempts to measure better, control activities better, and improve the way activities getaccomplished. QA recognized that some departments and people could be crushed beneath thewave while others would rise up to ride on top. QA's response to this situation was to developand deploy efficient mechanisms within the BAE Systems Mission Solutions Quality Assurance

Document: Quality Assurance Practices in High Maturity OrganizationsDate: 21 June, 2004
6
department to accomplish Quantitative Management and Continuous Process Improvement oncore QA activities.
11. CMMI Capability Profile:The CMMI Capability Profile shows current and planned process capability levels in the fullsuite of CMMI process areas. The profile shows that BAE Systems has taken 7 Process Areas tocapability level 5 and plans to take at least one more to that level in the near future. Each processarea has one or more focused metric that is central to applying Quantitative Managementtechniques. Our primary focus for QM has been in preventing and removing defects through ourinspection process. The QM approach for Process and Product QA (PPQA) is described later inthis paper.
12. QA Influence Model:Why would a company be interested in taking QA to Capability Level 5? To answer thisquestion it was necessary to identify how QA influences process performance, product quality,and accomplishment of organizational goals.The current influence model is qualitative but a task is scheduled this year to perform metricsanalysis that will give QA some quantitative indication of the influence.Since QAs primary activities center around process audits and product reviews, they turn out tobe the primary influencers that QA can exert. Audits of Management processes probably havetheir greatest influence in projects meeting Cost Performance Index (CPI) and SchedulePerformance Index (SPI) targets. Audits on Development processes are likely to impact meetinggoals for productivity and Defect Leakage. QA also does direct product reviews that help meetgoals for Post-Delivery Defect Density. There are also indirect influences in the model wherebetter management results in better development processes and ultimately, better products.
13. QA Subprocesses:Once QA decided there was some potential worth in optimizing QA activities it was necessary toidentify the appropriate sub-processes to address. Ignoring the Process Engineering and ProgramManagement Support activities for the moment, our primary Core QA activities are QAplanning, Product Reviews (including several sub-event activities), Process Audits, CorrectiveActions, and Quality Records Management. The records and retention database shown hereturned out to be a critical asset for applying the Quantitative Management paradigm.
14. QM – Creating the Basis:The first step in establishing QM in an area is to select the key events that characterize its sub-processes and provide the most meaningful contribution to process performance. The eventsmust occur often enough to provide statistically significant number of data points. Events mustalso occur at times and frequencies that allow data driven management actions to be taken intime to influence overall outcomes for the process. The events must also have well-defined andobjectively perceivable beginnings and ends.QA selected Audits, Document Reviews, Change Control Board Support, and (recently added)Metrics Validation. Analysis indicated that these events are where quality engineers spend mostof their time and have the greatest influence on their projects.The next step is to collect data and calculate the naturally occurring control limits for thoseevents.
Document: Quality Assurance Practices in High Maturity OrganizationsDate: 21 June, 2004
7
QA collects a size, effort, and yield indicator on each logged event. Size may be in terms ofnumber of questions asked in an audit, number of pages reviewed, number of DRs reviewed, etc.Size is the parameter that QA found varied the most from one event-type to another. As long asa group is consistent in definitions and collection it may not be terribly important if the groupchooses one size indicator over another. Care should be taken to make the size indicator easy toobtain. That is one of the reasons QA did not use Lines Of Text in the Document Review event.QA estimated that page counts would be an adequate size indicator for its purposes. QA alwayscollects effort in labor hours spent by the QE. Yield was always collected in terms of number ofdiscrepancies noted.Once the raw data was collected, QA established thresholds for the data items.QA started threshold values near the Mean +/- 3 Sigma but performed some adjustments toperformance thresholds based on department goals. Specifically, QA set the lower thresholdsabove zero (0) on some events to trigger a response when the QE had a zero-yield event. Also,rather than just using thresholds for the raw size/effort/yield measures, QA focused on ratios ofthese measures, establishing thresholds for productivity (e.g. audit questions addressed per laborhour), Yield Rate (e.g. problems detected per labor hour), and Batch Yield (e.g. problemsdetected per audit question addressed).The final result of this activity was to arrive at a set of statistically set thresholds. The QAProcess Group evaluates and revises these thresholds each year as part of a Personal QualityProcess analysis cycle to ensure appropriate evolution of the thresholds as the process evolves.
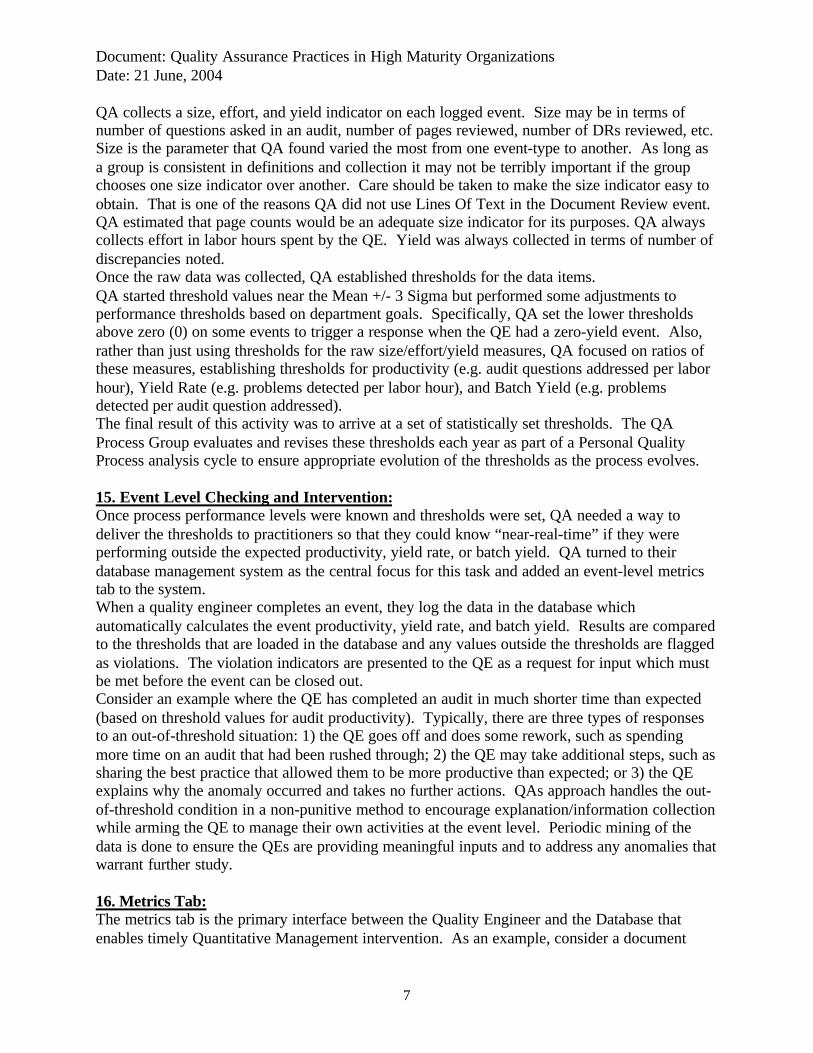
15. Event Level Checking and Intervention:Once process performance levels were known and thresholds were set, QA needed a way todeliver the thresholds to practitioners so that they could know “near-real-time” if they wereperforming outside the expected productivity, yield rate, or batch yield. QA turned to theirdatabase management system as the central focus for this task and added an event-level metricstab to the system.When a quality engineer completes an event, they log the data in the database whichautomatically calculates the event productivity, yield rate, and batch yield. Results are comparedto the thresholds that are loaded in the database and any values outside the thresholds are flaggedas violations. The violation indicators are presented to the QE as a request for input which mustbe met before the event can be closed out.Consider an example where the QE has completed an audit in much shorter time than expected(based on threshold values for audit productivity). Typically, there are three types of responsesto an out-of-threshold situation: 1) the QE goes off and does some rework, such as spendingmore time on an audit that had been rushed through; 2) the QE may take additional steps, such assharing the best practice that allowed them to be more productive than expected; or 3) the QEexplains why the anomaly occurred and takes no further actions. QAs approach handles the out-of-threshold condition in a non-punitive method to encourage explanation/information collectionwhile arming the QE to manage their own activities at the event level. Periodic mining of thedata is done to ensure the QEs are providing meaningful inputs and to address any anomalies thatwarrant further study.
16. Metrics Tab:The metrics tab is the primary interface between the Quality Engineer and the Database thatenables timely Quantitative Management intervention. As an example, consider a document
Document: Quality Assurance Practices in High Maturity OrganizationsDate: 21 June, 2004
8
review event which found higher than expected defects in the time spent on the review. The QEexplained that the high Yield Rate resulted from a quick identification of repeat errors within aspreadsheet.
Note that the total pages reviewed and the hours spent are typed in by the QE while the numberof defects is calculated from data input in the Discrepancy Item tab as a normal part of loggingthe document review.
17. Transforming Data into Action:The BAE Systems QA department model for improving processes can be applied in just aboutany arena that collects and responds to data. QA refers to this as a data mining cycle, metricscycle, or a continuous process improvement cycle. QA data mining is done primarily on the QAdatabases but QA also periodically mines other databases to help improve the company'sprocesses beyond the borders of QA. An assigned member of the QA Metrics Group (QA MG)extracts and charts data then looks for trends or anomalies in the charts (or the data itself). QAMG analyses the anomalies to determine contributing factors and /or causes. Once the QA MGhas developed this analysis, they plan and implement actions to address the causes andcontributing factors. Finally, the QA MG seeks methods to institutionalize the desired behaviorthrough improvements in documentation, tooling, training, and management practices. All ofthis activity is captured in a report format that creates a permanent record of the data miningcycle.
18. Data Mining for Improvement:The basic steps needed to establish and use a meaningful metric for some element of interest aredescribed in the following text.Some strategic activities are done up front. First, quantitative goals need to be determined andmeaningful indicators defined to track progress toward those goals. This includes capturing thebaseline measures that indicate the starting point for the element being measured.Next, plans must be put in place to accomplish the goals. Just measuring harder will not usuallyaccomplish any long-lasting change in the element, although there may be some change justfrom the added attention (Note the phenomena cited in the 1924 studies done at Western ElectricCompany, Chicago Facility, where the act of measuring the workers became the driving factor intheir productivity rather than the changes in lighting, etc. commonly called the "HawthorneEffect"- Reference 5).The measures, charting , and analysis also need to be planned out.Once these preparatory activities have been accomplished, the data collection efforts can begin inearnest, feeding into multiple instances of charting, trending, analysis, action response, and statusreporting.One key element that helps the metrics cycle operate efficiently and effectively is to documenteach step in a collocated way. BAE Systems QA uses a Metrics Cycle Template to organize QAmetrics activities. After showing a metrics chart, QA metrics reports include a slide with the lastfour items addressed (Anomaly/Analysis/Action/Status). This provides a documented record ofwhat has been scrutinized and what has been done to respond to the anomalies that are showingup in the charts. This prevents rework by others seeing the charts and creates a terrific record forshowing corrective and preventive actions are in place.

Document: Quality Assurance Practices in High Maturity OrganizationsDate: 21 June, 2004
9
19. Quantitative Improvements:So after more than 3 years performing QM and CPI on QA, what has been gained?Some of the measurable aspects include QAs ability to better estimate QA using event levelproductivity numbers. For instance, the average number of hours to perform an audit is known,documented, and available to QEs estimating future QA audits. This gives QA a basis forcreating a supportable estimate that more accurately predicts future costs for completing similaractivities. (QA collects event data on many more events beyond those listed in thispaper/presentation, but QA MG performs less detailed analysis on many of those event types dueto lack of data points or lack of expected benefit from doing the analysis.)QA has seen some increases in problem detection ability based on actions taken after completinganalysis of certain events. For instance, CCB support in performing DR reviews improved 108%after completing one set of actions. (Actions included developing a new checklist and trainingpersonnel in Discrepancy Report reviews).Another analysis (that focused on how many corrective action plans included preventive aspects)triggered actions that improved the proportion from 15.7% to 26.5%. (Training provided andmanagement mechanisms put in place. Further improvements will include modifying tools toencourage preventive actions in doing corrective action planning.)Another example of improvements was in reducing audit cycle time an average of 48.1%.(Training and increased management mechanisms.)
These are just some of the quantitative results BAE Systems QA has experienced through itsfocus on Continuous Process Improvement.
20. Qualitative Improvements:There have also been qualitative improvements.The formality of the data driven environment has conditioned QEs to be more disciplined in theirown day-to-day activities.Some of the data mining examples were snapped up by the organization process group asexamples to be used in demonstrating high maturity behaviors to appraisal teams, as well as totrain other personnel in how to accomplish causal analysis and continuous improvement.As QEs became familiar with their own metrics they were able to better support projects in theproject QM/CPI activities.All these elements also ultimately contributed to an improved perception of the QA group, andimproved teamwork with projects as a result.
21. Lessons Learned in QM and CPI:So in taking a step back and looking back over the last few years, some lessons stand out.First, a common experience for any metrics driven activity, fixing the data collection dominatedearly efforts. QA moved from voluntary data collection in spreadsheets, to enforced datacollection with internal consistency checking in a database.Second, more time should have been spent early on linking QA goals to the organizational levelgoals. QA is just now getting data to quantify that link.Third, only about 10% of the charts produced show anything remotely interesting. This insightmay dismay the reader until experience shows just how many charts are possible from any givencomplex data set. QA produced 100s of charts the first two times through the Personal QualityProcess cycle before settling in on a core set the last couple of years. QA still goes through the
Document: Quality Assurance Practices in High Maturity OrganizationsDate: 21 June, 2004
10
same experience throwing away numerous charts when performing new analysis, very much likerunning a series of experiments to see what will show up in the charts.QA also realized that the best insights often came from looking across multiple charts rather thanexpecting a single chart to tell the whole story.Finally, QAs QM/CPI plans and reports proved to be key elements to focus efforts and provideevidence of these high maturity activities.
22. General Lessons and Recommendations:Over the last four years a few general lessons emerged that seem worth mentioning. Intransforming QA from a reactive, traffic cop into a pro-active process engineering role one ofthe main things QA had to do was continually step out of the box. QA staffed up with talentedindividuals from a variety of backgrounds including Data Management, Software Engineering,and Hardware QA. The department provided a full suite of training to the QEs, especiallyensuring they were knowledgeable about CMMI, management, support, and (to a lesser degree)engineering processes. Taking on additional tasks in Process Engineering and PM Supportcontributed a lot to getting QA out of the old mold. By taking on a large variety of othermiscellaneous tasks QEs were able to improve involvement with programs and build profoundunderstanding of program issues that would not have been possible with only doing Coreactivities. Finally, after stepping outside the box for a while, QA constructed a new larger box toformalize participation in the new roles using the planning and reporting mechanisms describedin this presentation.
The second general lesson was to recognize the importance of cultivating teamwork and activeproject involvement.Elements of this included a near-religious mandate to be sure QEs were adding value inactivities. This sometimes resulted in reducing audit coverage when certain activities were notbeing performed in the project or had been completed before the audits could be accomplished.Another element of becoming more a part of the team was to actively offer suggestions forsolutions to the problems QEs were detecting.QEs also focused more on understanding and describing potential impacts from the problemsthey were detecting. This focus on project risk helped motivate project personnel to respond toproblems because they could see how it would help them.One important contributor to winning the projects trust was that QA brought a pragmatic view tothings. Rather than just grinding away at the project to be compliant with the standarddocumented processes QEs helped project personnel understand what they really needed from aprocess and helped them gain approval to tailor processes as appropriate.One problem QA needed to do better at was to avoid premature elevation of issues. Departmentmanagement actually had to reschedule release of department monthly status to be sure theproject level monthly QA status reports were all sent out before hand. This allowed projectpersonnel to become aware of issues and develop corrective action plans before their bossesheard about the issues and come asking for details that the project level had not yet considered.Above all, considering that QA is, by design, an adversarial role, QA makes it a point to applyfull-fledged Diplomacy in all interactions. As with any work place there are bound to be slip-upsand conflicts but the revamped QA group has largely been able to act and be treated as genuineteam members who are there to help further the project’s agenda.

Document: Quality Assurance Practices in High Maturity OrganizationsDate: 21 June, 2004
11
The last general lesson was to ensure QA participated actively on the process groups. QA helpeddefine procedures and was able to verify that the procedures would satisfy the standards adoptedby the company. QA is a logical group to contribute to data mining since the essence of datamining for causal analysis and response is essentially similar to auditing leading to causalanalysis and response. The final aspect of this lesson was that QA provided a great setting tolead high maturity behaviors (since the number of QEs was small and the mindset for QEs istypically already process focused). What QA failed to do early on was merge its improvementactivities with the process groups primary thrusts. As QA and Process Improvement approacheshave moved toward common ground during the last year both sides have benefited from adoptingportions of the alternate approach.
Summary:In summary, although some of the infrastructure described in this paper was QA specific, thereare components that could be used in any process area. Hopefully the sample given will provideenough insight to help some of the readers get on top of the wave which, even now, is beginningto crash just up the beach from here.
References:1. ANSI/ISO/ASQ Q9001-2000,"American National Standard: Quality Management Systems – Requirements",American Society for Quality,Quality Press, December 13, 2000
2. CMM V1.1"The Capability Maturity Model: Guidelines for Improving the Software Process"Mark C. Paulk, et alAddison-Wesley, 1994
3. CMMI V1.1,"Capability Maturity Model® Integration (CMMISM) Version 1.1"CMMI Product TeamCarnegie Mellon University, December 2001
4. Michael Fagan and Associates Training Material ~ 1998
5. CSQE 2002,"Certified Software Quality Engineer Primer",Frank, Marriott, WarzusenQuality Council of Indiana, 2002