Embed Size (px)
Citation preview
The enclosed information constitutes regulated information as defined in the Royal Decree of 14 November 2007 regarding the duties of issuers of financial instruments which have been admitted for trading on a regulated market. Inside information.
Mechelen, October 28, 2021 – Telenet Group Holding NV (“Telenet” or the “Company”) (Euronext Brussels: TNET) announces its unaudited consolidated results under International Financial Reporting Standards as adopted by the European Union (“EU IFRS”) for the nine months ended September 30, 2021.
HIGHLIGHTS
• Continued commercial traction in Q3 2021, including a strong uptake of net new FMC customers driven by our new "ONE(Up)" bundles (+27,300), +7,500 net new broadband internet RGUs and +9,100 net mobile postpaid subscribers.
▪ The fixed monthly ARPU per customer relationship reached €59.0 in 9M 2021, up 1% yoy, driven by a higher share of both higher-tier broadband and multiple-play customers in our overall customer mix and the benefit of certain price adjustments, partly offset by a greater proportion of revenue being allocated to mobile telephony from our recently launched "ONE(Up)" FMC bundles compared to our legacy bundles.
▪ 9M 2021 revenue of €1,928.9 million, +1% yoy on both a reported and rebased(1) basis, driven by a solid expansion of our total subscription revenue and our B2B business. Broadly stable revenue in Q3 2021 compared to Q3 last year, both on a reported and rebased basis, to €640.6 million driven by the same factors as mentioned above and almost fully offset by a 5% decline in our rebased other revenue.
▪ Net profit of €301.7 million in 9M 2021 (Q3 2021: €90.0 million), +1% yoy, which reflected significantly lower net finance expense, almost fully offset by higher income tax expense.
▪ 9M 2021 Adjusted EBITDA(2) of €1,027.1 million, -1% yoy, including changes to the IFRS accounting treatment of certain content-related costs for our premium entertainment packages and the Belgian football broadcasting rights because of changes related to the underlying contracts as of Q3 2020. On a rebased basis, our 9M 2021 Adjusted EBITDA increased almost 2% yoy driven by a 5% decline in direct costs and healthy organic top line growth over the period. Q3 2021 Adjusted EBITDA of €338.4 million, marking a decline of 1% yoy both on a reported and rebased basis, reflecting a tougher comparison base against the same period of last year and seasonality in some of our operating expenses.
▪ Accrued capital expenditures(3) of €417.2 million in 9M 2021 (Q3 2021: €135.4 million), -2% versus 9M last year and approximately 22% of revenue. Excluding the recognition of certain football broadcasting rights and the temporary extension of both our 2G and 3G mobile spectrum licenses, our 9M 2021 accrued capital expenditures were €397.0 million, equivalent to approximately 21% of revenue.
▪ Adjusted EBITDA less property & equipment additions (previously referred to as Operating Free Cash Flow)(4) of €630.1 million in 9M 2021 (Q3 2021: €211.8 million), +2% yoy, mainly driven by substantially lower investments compared to 9M last year. On a rebased basis and excluding the recognition of both football broadcasting rights and mobile spectrum licenses, as well as the impact of certain lease-related capital additions on our accrued capital expenditures, our 9M 2021 Adjusted EBITDA less property & equipment additions was up just over 2% yoy.
▪ Net cash from operating activities, net cash used in investing activities and net cash used in financing activities of €743.3 million, €373.1 million and €257.9 million, respectively, in 9M 2021. Our 9M 2021 Adjusted Free Cash Flow(5) increased 22% yoy to €314.1 million, mainly driven by (i) €14.4 million lower cash taxes paid relative to last year, (ii) €8.7 million lower cash interest expenses as a result of last year's refinancing of our Term Loans and (iii) a favorable trend in our working capital. Q3 2021 Adjusted Free Cash Flow of €111.6 million versus a negative €5.4 million in the same period a year ago as a result of phasing in the settlement of our annual cash taxes.
PRESS RELEASE
First Nine Months 2021 ResultsPartially upgrading our FY 2021 guidance and medium-term outlook over the FY2018-2021 period, having achieved solid operational and financial results in Q3 2021.
Delivering against our strategic roadmap, having entered into a non-binding term sheet with Fluvius on the "data network of the future" for Flanders and having commenced a strategic review of our telecommunications tower business.
Continued execution against our shareholder remuneration policy and leverage framework with a gross intermediate dividend of €1.375 per share and a share buy-back program of up to €45.0 million, or up to 1.1 million shares outstanding.
▪ FY 2021 outlook partially upgraded, expecting rebased(a) Adjusted EBITDA(b) to come in towards the upper end of the previously defined 1-2% range, while Adjusted EBITDA less property & equipment additions (previously referred to as Operating Free Cash Flow) is expected to be stable instead of the previously anticipated -1% decline. Reaffirming return to rebased(a) revenue growth in 2021 and healthy Adjusted Free Cash Flow(b, d) between €420.0 and €440.0 million. With that, we now expect to be towards the mid-end of our 2018-2021 Adjusted EBITDA less property & equipment additions(b, c) CAGR of between 6.5% to 8.0%.
▪ Delivering on our strategic roadmap: Non-binding term sheet signed with Fluvius about evolving our joint fixed network infrastructure in Flanders to “the data network of the future”, while having commenced a strategic review of our telecommunications tower business to enhance shareholder value. See 3.3 Subsequent events for additional disclosure.
▪ Continued execution against our shareholder remuneration policy and leverage framework with a gross intermediate dividend of €1.375 per share and a share buy-back program of up to €45.0 million, or up to 1.1 million shares outstanding. See 3.2 Shareholder remuneration for additional disclosure.
(a) For purposes of calculating rebased growth rates on a comparable basis for the periods shown above, we have adjusted our historical revenue and Adjusted EBITDA to reflect the impact of the following transactions to the same extent revenue and adjusted EBITDA related to these transactions is included in our current results: (i) exclude the revenue and Adjusted EBITDA of our former Luxembourg cable subsidiary Coditel S.à r.l. (deconsolidated as of April 1, 2020) and (ii) reflect changes related to the IFRS accounting outcome of certain content rights agreements entered into during the third quarter of 2020.
(b) Quantitative reconciliations to net profit (including net profit growth rates) and cash flows from operating activities for our Adjusted EBITDA, Adjusted EBITDA less property & equipment additions (previously referred to as Operating Free Cash Flow) and Adjusted Free Cash Flow guidance cannot be provided without unreasonable efforts as we do not forecast (i) certain non-cash charges including depreciation and amortization and impairment, restructuring and other operating items included in net profit, nor (ii) specific changes in working capital that impact cash flows from operating activities. The items we do not forecast may vary significantly from period to period.
(c) Excluding the recognition of the capitalized football broadcasting rights and mobile spectrum licenses and excluding the impact from certain lease-related capital additions on our accrued capital expenditures.
(d) Assuming certain payments are made for the temporary prolongation of our current 2G and 3G mobile spectrum licenses in 2021, yet excluding payments on any future spectrum licenses as part of the upcoming multiband auction, and assuming the tax payment on our 2020 tax return will not occur until early 2022.
TELENET GROUP HOLDING NV - EARNINGS RELEASE FIRST NINE MONTHS 2021 - 2
For the nine months ended September 30, 2021 2020 Change %
FINANCIAL HIGHLIGHTS (€ in millions, except per share amounts)
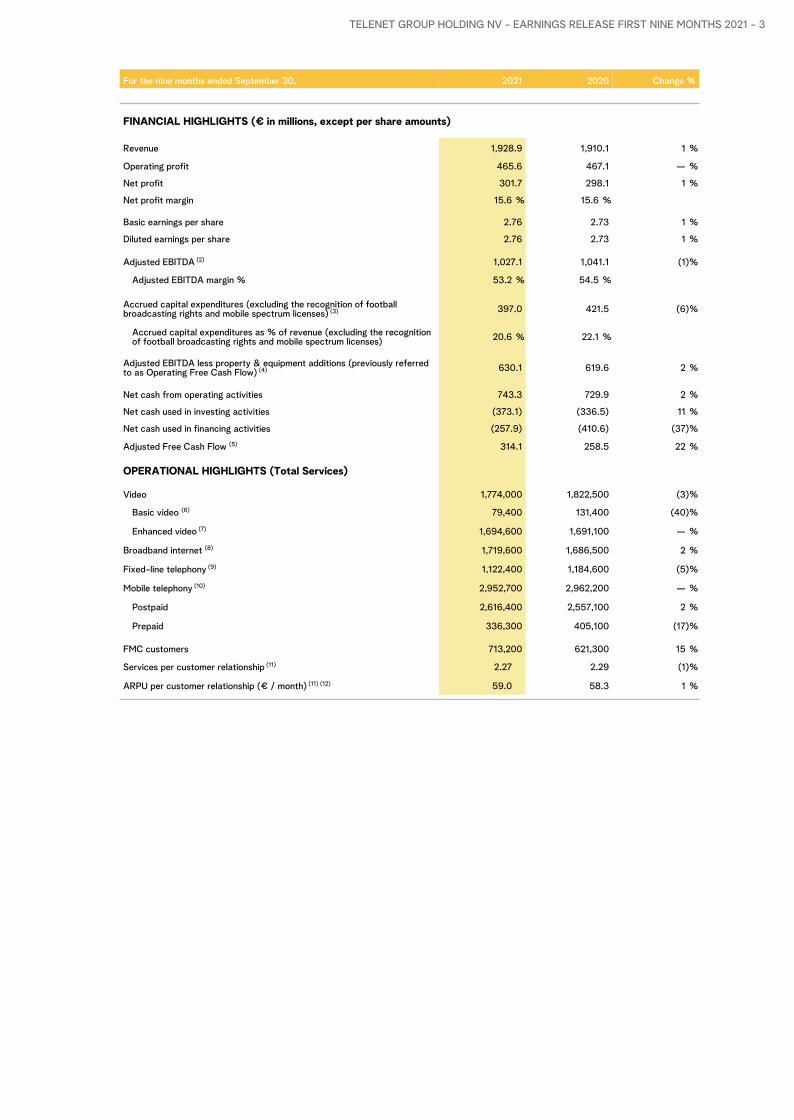
Revenue 1,928.9 1,910.1 1 %
Operating profit 465.6 467.1 — %
Net profit 301.7 298.1 1 %
Net profit margin 15.6 % 15.6 %
Basic earnings per share 2.76 2.73 1 %
Diluted earnings per share 2.76 2.73 1 %
Adjusted EBITDA (2) 1,027.1 1,041.1 (1) %
Adjusted EBITDA margin % 53.2 % 54.5 %
Accrued capital expenditures (excluding the recognition of football broadcasting rights and mobile spectrum licenses) (3) 397.0 421.5 (6) %
Accrued capital expenditures as % of revenue (excluding the recognition of football broadcasting rights and mobile spectrum licenses) 20.6 % 22.1 %
Adjusted EBITDA less property & equipment additions (previously referred to as Operating Free Cash Flow) (4) 630.1 619.6 2 %
Net cash from operating activities 743.3 729.9 2 %
Net cash used in investing activities (373.1) (336.5) 11 %
Net cash used in financing activities (257.9) (410.6) (37) %
Adjusted Free Cash Flow (5) 314.1 258.5 22 %
OPERATIONAL HIGHLIGHTS (Total Services)
Video 1,774,000 1,822,500 (3) %
Basic video (6) 79,400 131,400 (40) %
Enhanced video (7) 1,694,600 1,691,100 — %
Broadband internet (8) 1,719,600 1,686,500 2 %
Fixed-line telephony (9) 1,122,400 1,184,600 (5) %
Mobile telephony (10) 2,952,700 2,962,200 — %
Postpaid 2,616,400 2,557,100 2 %
Prepaid 336,300 405,100 (17) %
FMC customers 713,200 621,300 15 %
Services per customer relationship (11) 2.27 2.29 (1) %
ARPU per customer relationship (€ / month) (11) (12) 59.0 58.3 1 %
TELENET GROUP HOLDING NV - EARNINGS RELEASE FIRST NINE MONTHS 2021 - 3
Commenting on the results, John Porter, Telenet’s Chief Executive Officer, stated:
"I'm pleased to share that in recent months we have made great progress on many strategic files, which will further lay the foundations for long-term sustainable shareholder value. As announced this morning, we have reached a non-binding agreement with Fluvius to create Flanders' "data network of the future". By signing this non-binding term sheet, Telenet and Fluvius take a further step in the realization of the “data network of the future”, including Fiber to the Home ("FttH") technology. The network of the future will be fully open, ultra-performant, accessible to businesses and families, both in urban and rural areas, and built at the lowest societal cost. To this end, we will create together a new self-funding independent infrastructure company (“NetCo”) that will run an open access network, contributing both existing HFC and fiber assets as well as developing new build fiber assets in the future. NetCo intends to operate an open access network and is expected to enjoy a high network utilization rate from the start driven by Telenet’s customer relationships and the incremental traffic generated by wholesale partners. It is intended to be a multiparty partnership, i.e. open to further partnering with strategic and/or financial parties to develop this ambitious “data network of the future”. Final legal agreements are anticipated in spring next year and I'm excited about the journey ahead.
In addition, our board of directors has decided to commence a strategic review of our telecommunications tower business, including a preliminary market assessment. Today's announcement is consistent with the view we outlined before in the context of potential broader strategic transactions for us as a Company and generally strong demand for telecommunications infrastructure assets. As a reminder, we operate a nationwide mobile network In Belgium, consisting of 3,311 sites including 2,145 owned sites, of which 37% are towers, and 1,166 third-party sites.
And before looking back at the quarter in the review mirror, we've also announced this morning a continued execution against our existing shareholder remuneration policy and leverage framework as the board of directors has approved both a €1.375 per share gross intermediate dividend, equivalent to 50% of the dividend floor we communicated in October last year, and a share buy-back program of up to €45 million, equivalent to up to 1.1 million shares outstanding. The commitment to repurchase our own shares underlines the board’s confidence in our growth profile and the Company’s appealing intrinsic valuation. In light of today’s announcements and considering potential future M&A opportunities, the board of directors reaffirms its intention to continue to execute the €2.75 per share dividend floor (gross), as evidenced by its proposal to pay a €1.375 per share gross intermediate dividend in early December 2021.
Looking back now at our Q3 operational performance, we continued to enjoy strong commercial momentum across our core products. We recorded a strong net inflow of FMC customers in the quarter (+27,300) to 713,200 subscribers on the back of our new "ONE(Up) FMC bundles. On the broadband side, we added 7,500 net new broadband internet RGUs in the quarter with a strong performance in the residential market and in mobile we added 9,100 net mobile postpaid subscribers.
In order to let everybody benefit from our high-quality connectivity services and one year after the launch of our ‘Essential Internet’ pilot project, we shifted up a gear with our basic internet program for vulnerable families and single people. Through social organizations, poverty associations, and organizations committed to digital inclusion, we've brought basic internet at €5 a month to vulnerable target groups via various test projects. We now expanded the offer and launched a second product at €10 a month for even more intensive internet use, such as streaming. Because digital inclusion only truly starts with access to the internet, we entered into a local partnership to collect laptops that are still usable, put them to good use, and then distribute them via poverty organizations.
From a financial perspective, I'm very pleased with our third quarter performance and the continued top line growth trend, allowing us to partially upgrade our FY 2021 outlook as Erik will further detail below."
TELENET GROUP HOLDING NV - EARNINGS RELEASE FIRST NINE MONTHS 2021 - 4
Commenting on the results, Erik Van den Enden, Telenet’s Chief Financial Officer, stated:
"We can once more look back at a resilient quarter in terms of our financial performance in addition to further building onto the solid operational momentum John referred to earlier. Having turned the tide when it comes to our top line performance in the second quarter, I'm pleased to see that we managed to maintain the positive growth trend in Q3 despite a 5% decrease in our rebased other revenue due to lower interconnect and handset-related revenue. This was, however, fully offset by solid expansion of our total subscription revenue and 4% higher B2B revenue in the quarter. In Q3 2021, our revenue was modestly up to €641 million bringing our 9M 2021 revenue to €1,929 million, which was up just over 1% compared to 9M last year.
During the first nine months of the year, we generated Adjusted EBITDA of €1,027 million, representing a 1% year-on-year decrease. This mainly reflected changes to the IFRS accounting treatment of certain content-related costs for our premium entertainment packages and the Belgian football broadcasting rights because of changes related to the underlying contracts as of Q3 2020. On a rebased basis, our 9M 2021 Adjusted EBITDA increased almost 2% year-on-year driven by healthy organic top line growth of just over 1% over the period, whereas our operating expenses over the period remained broadly stable. On a rebased basis, we succeeded in expanding our 9M 2021 Adjusted EBITDA margin by 30 basis points versus the same period of last year. In Q3 2021, our Adjusted EBITDA reached €338 million, marking a nearly 1% year-on-year decrease on a reported and rebased basis, respectively. In line with our FY 2021 outlook, the trend in our Adjusted EBITDA has started to decelerate in Q3 given a tougher comparison base compared to the same period of last year and seasonality in some of our operating expenses.
Turning to Adjusted EBITDA less property & equipment additions (previously referred to as Operating Free Cash Flow), which is one of our key financial metrics and which has been our north star for the 2018-2021 financial plan, we delivered a strong performance with Adjusted EBITDA less property & equipment additions up 2% year-on-year in 9M 2021 to €630 million (Q3 2021: €212 million, -3% year-on-year). This reflected substantially lower investments in the period compared to last year as well as the aforementioned Adjusted EBITDA performance. On a rebased basis and excluding the recognition of both football broadcasting rights and mobile spectrum licenses, as well as the impact of certain lease-related capital additions on our accrued capital expenditures, our 9M 2021 Adjusted EBITDA less property & equipment additions increased just over 2% year-on-year.
Finally, our Adjusted Free Cash Flow reached €314 million for the first nine months of 2021, marking a 22% increase versus the prior year period. Relative to 9M 2020, the increase of our Adjusted Free Cash Flow was driven by (i) €14.4 million lower cash taxes paid relative to last year, (ii) €8.7 million lower cash interest expenses as a result of last year's refinancing of our Term Loans and (iii) a favorable trend in our working capital. Our year-to-date Adjusted Free Cash Flow also included a €11.9 million increase in our vendor financing program whereas last year our nine-month Adjusted Free Cash Flow included a contraction of €14.5 million due to phasing. Excluding these movements, our underlying Adjusted Free Cash Flow performance would have been more moderate. Our Adjusted Free Cash Flow in Q3 2021 was €111.6 million versus a negative €5.4 million in the same period a year ago as a result of the phasing in the settlement of our annual cash taxes and a €40.5 million higher contribution from our vendor financing program due to phasing.
Having delivered a solid financial performance over the first nine months of the year, we partially upgrade our FY 2021 outlook compared to February 2021. We expect our rebased(a) Adjusted EBITDA(b) to come in towards the upper end of the previously defined 1-2% range, while our rebased Adjusted EBITDA less property & equipment additions (previously referred to as Operating Free Cash Flow)(b,c) is expected to be stable instead of the previously anticipated decline of around -1%. We are reaffirming our top line outlook (up to 1% yoy on a rebased basis) and we will also deliver healthy Adjusted Free Cash Flow(b, d) between €420.0 and €440.0 million for the FY 2021. With that, we now expect to be towards the mid-end of our 2018-2021 Adjusted EBITDA less property & equipment additions(b, c) CAGR of between 6.5% to 8.0%."
(a) For purposes of calculating rebased growth rates on a comparable basis for the periods shown above, we have adjusted our historical revenue and Adjusted EBITDA to reflect the impact of the following transactions to the same extent revenue and adjusted EBITDA related to these transactions is included in our current results: (i) exclude the revenue and Adjusted EBITDA of our former Luxembourg cable subsidiary Coditel S.à r.l. (deconsolidated as of April 1, 2020) and (ii) reflect changes related to the IFRS accounting outcome of certain content rights agreements entered into during the third quarter of 2020.
(b) Quantitative reconciliations to net profit (including net profit growth rates) and cash flows from operating activities for our Adjusted EBITDA, Adjusted EBITDA less property & equipment additions (previously referred to as Operating Free Cash Flow) and Adjusted Free Cash Flow guidance cannot be provided without unreasonable efforts as we do not forecast (i) certain non-cash charges including depreciation and amortization and impairment, restructuring and other operating items included in net profit, nor (ii) specific changes in working capital that impact cash flows from operating activities. The items we do not forecast may vary significantly from period to period.
TELENET GROUP HOLDING NV - EARNINGS RELEASE FIRST NINE MONTHS 2021 - 5

(c) Excluding the recognition of the capitalized football broadcasting rights and mobile spectrum licenses and excluding the impact from certain lease-related capital additions on our accrued capital expenditures.
(d) Assuming certain payments are made for the temporary prolongation of our current 2G and 3G mobile spectrum licenses in 2021, yet excluding payments on any future spectrum licenses as part of the upcoming multiband auction, and assuming the tax payment on our 2020 tax return will not occur until early 2022.
TELENET GROUP HOLDING NV - EARNINGS RELEASE FIRST HALF 2021 - 6
1 Operational highlights
IMPORTANT REPORTING CHANGES:
Inclusion of Small and Medium Sized ("SME") and Large Enterprise ("LE") business customers: As of Q2 2021, our postpaid and total mobile subscriber counts include our SME and LE business customers, which were previously not recorded in our SIM count. We have represented our consolidated subscriber counts as presented below and under 4. Consolidated interim operating statistics as of Q1 2020 in order to allow both investors and analysts to assess our operational performance on a like-for-like basis. Consequently, we have added 130,100, 132,600, 140,500, 146,100, 156,600 and 158,900 mobile postpaid subscribers to our subscriber count for the quarterly periods from Q1 2020 up to Q2 2021. As a result of the aforementioned change, the subscription and usage-related revenue generated by our SME and LE business customers is now being reported under our mobile telephony revenue (as opposed to business services revenue previously), while the interconnect revenue is now being recognized under other revenue (as opposed to business services revenue previously). We provide rebased year-on-year changes in order to allow both investors and analysts to assess our financial performance on a like-for-like basis and represented our Q1 2021 revenue accordingly.
1.1 Multiple-play
OVERVIEW & MULTIPLE-PLAYAt September 30, 2021, we served 2,035,000 unique customer relationships, which represented approximately 60% of the 3,395,300 homes passed by our leading hybrid fiber coaxial ("HFC") network across our Flemish and Brussels footprint. Our cable network consists of a dense fiber backbone with local loop coaxial cable connections and spectrum of up to 1.2 GHz. Through both EuroDocsis 3.0 and 3.1 technologies, we offer data download speeds of up to 1 gigabit per second ("Gbps") across our entire footprint, reaffirming our leading market position as the fastest internet service provider. At the end of October, we also entered into a non-binding term sheet with Fluvius about evolving our HFC network infrastructure in Flanders to the “data network of the future”. Please see 3.3 Subsequent events for more details.
At September 30, 2021, we provided 4,616,000 fixed services ("RGUs") consisting of 1,774,000 video, 1,719,600 broadband internet and 1,122,400 fixed-line telephony subscriptions. Within our video mix, approximately 96% of our video subscribers have upgraded to the higher ARPU enhanced video platform at September 30, 2021, leaving just 79,400 basic TV subscribers who will largely be converted to digital by the end of this year as part of our "Signal Switch" campaign. Enhanced video subscribers enjoy an enriched TV experience with unrestricted access to a wider range of digital, HD and pay television sports, series and movies channels, a vast complementary and paid library of domestic and international video-on-demand ("VOD") content and our over-the-top ("OTT") platform "Telenet TV" and "Yelo". At September 30, 2021, we also served 2,952,700 mobile subscribers, of which approximately 89% are subscribed to one of our attractive mobile or fixed mobile converged ("FMC") rate plans. As of Q2 2021, our mobile subscriber count also includes our SME and LE business customers as mentioned above.
We reached a bundling rate of 2.27 fixed RGUs per unique customer relationship in Q3 2021, which was broadly stable compared to the prior year period. Approximately 33% of our cable customers subscribed to a quadruple-play bundle at September 30, 2021 (excluding mobile subscriptions under the BASE brand), a modest 1 percentage point increase compared to last year, underlining the continued appetite of consumers and businesses for our multiple-play value propositions. Our FMC customer base, which represents the sum of our "WIGO", "YUGO" and "KLIK" propositions, in addition to our recently added "ONE" and "ONE UP" bundles, reached 713,200 subscribers, up 15% year-on-year. In Q3 2021, we added 27,300 net new FMC subscribers (9M 2021: +71,400), which was broadly similar to the previous quarter and continues to be driven by the continued success of our "ONE" FMC propositions.
TELENET GROUP HOLDING NV - EARNINGS RELEASE FIRST NINE MONTHS 2021 - 7
ARPU PER CUSTOMER RELATIONSHIP The ARPU per customer relationship, which excludes our mobile telephony revenue and certain other types of revenue, is one of our core operating statistics as we seek to obtain a larger share of our customers' telecommunication and entertainment spending. For the nine months ended September 30, 2021, the monthly ARPU per customer relationship reached €59.0, representing a healthy increase of just over 1% compared to the prior year period. Growth in the ARPU per customer relationship was underpinned by (i) a greater share of higher-tier broadband subscribers in our mix, (ii) the favorable impact of the October 2020 and August 2021 price adjustment, (iii) a higher proportion of multiple-play subscribers. These factors were only partly offset by a greater proportion of revenue being allocated to mobile telephony from our recently launched "ONE" FMC bundles compared to our legacy bundles as further detailed under 2. 1 Revenue.
In Q3 2021, the ARPU per customer relationship was €58.6, a moderate increase of slightly less than 1% compared to €58.2 in Q3 last year. The Q3 2021 ARPU per customer relationship was broadly stable on a sequential basis and reflected predominantly the continued success of the new "ONE" FMC bundles for which a greater proportion of revenue is allocated to mobile telephony as compared to our legacy "WIGO" and "YUGO" bundles. As discussed in 2.1 Revenue, this adversely impacts our cable subscription revenue, yet is fully compensated by higher mobile telephony subscription revenue and therefore does not impact our total revenue.
1.2 Broadband internet
At September 30, 2021, we served 1,719,600 broadband internet subscribers. We were able to once again expand our broadband customer base in Q3 2021, attracting 7,500 net new subscribers (9M 2021: +22,500). The growth was mainly driven by strong performance in the residential segment as successful back-to-school promotions and traction of our ONE(Up) FMC bundles continued. Annualized churn for our broadband internet service decreased 60 basis points year-on-year to 7.7% from 8.3% in Q3 2020 when our annualized churn rate was favorably impacted by the global COVID-19 pandemic. On a sequential basis, our annualized churn rate increased moderately because of intensified competition as anticipated.
In Q3 2021, we distributed another 45,000 WiFi-boosters in order to maximize the in-home connectivity customer experience. This brings the total installed base to 933,000 customers who are equipped with our in-home plug-and-play connectivity solution, up 31% compared to Q3 2020. Approximately 54% of our broadband customer base at September 30, 2021 opted for the aforementioned in-home connectivity solution as compared to approximately 42% a year ago. The weighted average data download speed across our broadband subscriber base further continues to increase, reaching 232 Mbps at September 30, 2021, up 12% from 208 Mbps in Q3 last year.
1.3 Fixed-line telephony
At September 30, 2021, we served 1,122,400 fixed-line telephony subscribers, representing a 5% decrease compared to the same period of last year. Relative to June 30, 2021, our fixed-line telephony subscriber base contracted by 19,300 RGUs on a net organic basis in Q3 2021 (9M 2021: -49,400). In addition to the generally declining fixed-line telephony market, our recently launched "ONE" FMC bundles accelerated this downward trend as fixed-line telephony is no longer activated by default in the new "ONE" package, but needs a customer opt-in. In addition, we observe higher usage of alternative OTT solutions, driven by the COVID-19 impact and related increase of homeworking. Annualized churn for our fixed-line telephony service reached 9.5% in Q3 2021 and was broadly stable compared to the same period of last year.
1.4 Mobile telephony
Our mobile telephony subscriber base, which excludes subscribers under our commercial wholesale partnerships, totaled 2,952,700 subscribers at the end of Q3 2021, including 2,616,400 postpaid subscribers. The remaining 336,300 mobile subscribers are prepaid subscribers under the BASE brand. As mentioned under 1. Operational highlights, our mobile subscriber counts for all periods as of Q1 2020 have been restated to include our SME and LE business customers. We added 9,100 net new mobile postpaid subscribers for Q3 2021 (9M 2021: 36,500, including the inorganic adjustment in Q2 2021 related to the removal of 9,500 data
TELENET GROUP HOLDING NV - EARNINGS RELEASE FIRST NINE MONTHS 2021 - 8
SIMs). The softer performance on mobile postpaid compared to previous quarters is related to lower cross-selling because of modular configuration of the ONE(Up) bundles and lower SOHO sales, only partly compensated by good performance of the BASE mobile standalone offers. Our prepaid subscriber base decreased by 13,300 SIMs in Q3 2021 (9M 2021: -45,500), driven by a lower activity status compared to the preceding quarter.
1.5 Video
TOTAL VIDEOAt September 30, 2021, our total basic and enhanced video customer base reached 1,774,000 RGUs This represented a net organic loss of 11,900 video subscribers during Q3 2021. This net loss excludes migrations to our enhanced video service and represents customers churning to competitors’ platforms, such as other digital television, OTT and satellite providers, or customers terminating their video service or moving out of our service footprint. Within the mix of video subscribers, the proportion of analog basic TV subscribers continued to contract, reaching 79,400 at September 30, 2021. In October 2019, we launched our "Signal Switch" campaign in order to prepare for the switch-off of both the analog radio and video signals by the end of this year. This will free up capacity on the network for the ever-increasing digital traffic. After a temporary pause of this project related to COVID-19, it has been relaunched in the course of Q1 2021.
ENHANCED VIDEOAt September 30, 2021, 1,694,600 of our video customers had upgraded to our higher ARPU enhanced video services, enabling them to enjoy an enriched TV experience, including free and unrestricted access to our OTT video apps "Telenet TV" and “Yelo”, through which they can enjoy a unique content experience on multiple connected devices in the home and out-of-home. This features our latest digital TV platform, including our next-generation cloud-based set-top box with voice recognition capabilities, which we launched at the end of April 2019. For customers using this latest digital TV platform, the Telenet TV app is also available on Apple TV since mid-December 2020. Through this media box, customers can transfer their familiar television experience to a second television screen anywhere in the European Union and without an additional decoder. Our enhanced video customer base in Q3 2021 decreased moderately by 1,000 net RGUs (9M 2021: 6,600). The high attach rate to the ONE(Up) bundles was offset by the slowdown of the "Signal Switch" campaign during the summer period.
Mid-September 2020, we launched "Streamz": A unique streaming service of DPG Media and Telenet, in which we hold a 50% share. Consequently, neither the operational nor the financial results of the joint venture itself are consolidated into our accounts. However, as we offer both "Streamz" and "Streamz+" directly to customers through our digital TV platform, we will continue to include the number of premium entertainment customers to whom we directly serve. The revenue generated by these direct premium entertainment subscribers is unaffected and remains within our video subscription revenue, while the content-related costs are accounted for as direct costs (programming-related expenses) and hence impacting our Adjusted EBITDA. We refer to 2. Financial Highlights for additional information.
Following the launch of the "Streamz" streaming service, we introduced a new "Streamz+" product and rebranded the former "Play" product into "Streamz" alongside "Play More", which continues to exist. We believe our joint OTT platform is uniquely positioned, combining the best locally produced series of all local broadcasters VTM, Play and VRT, supplemented with must-see international content from HBO, in addition to an extensive kids zone, films and documentaries. Streamz is available to everyone through the Streamz app, online at Streamz.be and for Telenet customers through our digital TV platforms. In addition, we continue to have a leading market position as far as sports is concerned. "Play Sports" continues to broadcast both domestic and international football competitions, such as the English Premier League exclusively, and via the Eleven Sports channels: the Belgian Jupiler Pro League, La Liga, Serie A and Bundesliga 1. We aim to extend the rights to the Premier League for another three seasons until the 2024 – 2025 season. Other sports, such as cyclo-cross, basketball, hockey, tennis, golf and motor sports, are also included in our broad sports offering. During the first quarter of 2021, we launched "Play Sports Open", a new linear channel in our basic TV offering. Play Sports Open offers all Telenet TV customers a selection of matches from different competitions, including Premier League, Europa League, Eredivisie, ATP and WTA Tennis, Belgian Hockey and
TELENET GROUP HOLDING NV - EARNINGS RELEASE FIRST NINE MONTHS 2021 - 9
Basketball, Cyclo-cross, Formula 1 and MXGP. This channel also includes both proprietary and acquired programs and documentaries.
Furthermore, as we are evolving to offer all relevant premium entertainment to our customers, we have started to integrate other main subscription VOD services (including amongst others Netflix and Amazon Prime) to our customers through their set-top box environment and we intend to continue to expand with other relevant VOD services in the future. Consequently, we are well positioned as a leading player in the premium entertainment segment within our footprint. Our total premium entertainment subscriber base, including "Streamz", "Streamz+", "Play More" and "Play Sports" equaled approximately 36% of our total enhanced TV customer base1 at the end of Q3 2021, which was broadly stable compared to the same quarter of last year and also stable relative to June 30, 2021.
1 Including 392,000 direct subscriptions to our premium entertainment packages "Streamz", "Streamz+" and "Play More" and 219,000 "Play Sports" customers at September 30, 2021.
TELENET GROUP HOLDING NV - EARNINGS RELEASE FIRST NINE MONTHS 2021 - 10
2 Financial highlights
IMPORTANT REPORTING CHANGES:
Rebased growth: For purposes of calculating rebased growth rates on a comparable basis, we have adjusted our historical revenue and Adjusted EBITDA to reflect the impact of the following transactions, to the same extent revenue and Adjusted EBITDA related to these transactions is included in our current results: (i) exclude the revenue and Adjusted EBITDA of our former Luxembourg cable subsidiary Coditel S.à r.l. (deconsolidated as of April 1, 2020), (ii) reflect changes related to the IFRS accounting outcome of certain content rights agreements entered into during the third quarter of 2020 and (iii) reflect changes related to subscription and usage-related revenue and interconnect revenue generated by our Small & Medium Sized ("SME") and Large Enterprise ("LE") business customers as of Q1 2021 out of business services revenue into mobile telephony and other revenue, respectively. See Definitions for more disclosures. For more information regarding the variance between our reported and rebased financial results, we refer to the Appendix in this press release.
Accounting framework Streamz joint venture and Belgian football broadcasting rights: Mid-September 2020, we launched "Streamz": A unique streaming service of DPG Media and Telenet, in which we have a 50% shareholding. Consequently, neither the operational nor the financial results of the joint venture itself are consolidated into our accounts. However, as we offer both "Streamz" and "Streamz+" directly to customers through our digital TV platform, we will continue to include the number of premium entertainment customers to whom we directly serve. The revenue generated by these direct premium entertainment subscribers is unaffected and remains within our video subscription revenue, while the content-related costs are accounted for as direct costs (programming-related expenses) and hence impacting our Adjusted EBITDA. In August 2020, we signed a five-year agreement with Eleven Sports for the broadcasting of the Belgian football league. Unlike the previous contract, the cost of the new Belgian football contract will be accounted for as a direct cost (programming-related expenses) and hence impacting our Adjusted EBITDA. Both changes have started to impact our (operating) expenses and Adjusted EBITDA as of the third quarter of 2020. We provide rebased year-on-year changes in order to allow both investors and analysts to assess our financial performance on a like-for-like basis. For more information regarding the variance between our reported and rebased financial results, we refer to the Appendix in this press release.
Revenue allocation from Telenet's Small and Medium Sized ("SME") and Large Enterprise ("LE") business customers: As of Q2 2021, our postpaid and total mobile subscriber count includes our SME and LE business customers, which were previously not recorded in our SIM count. See 1. Operational highlights for additional information. As a result of the aforementioned change, the subscription and usage-related revenue generated by our SME and LE business customers is now being reported under our mobile telephony revenue (as opposed to business services revenue previously), while the interconnect revenue is now being recognized under other revenue (as opposed to business services revenue previously). We provide rebased year-on-year changes in order to allow both investors and analysts to assess our financial performance on a like-for-like basis and represented our Q1 2021 revenue accordingly.
Operating Free Cash Flow renamed into Adjusted EBITDA less property & equipment additions: Effective with the release of our third quarter earnings, we have stopped using the term Operating Free Cash Flow and now use the term "Adjusted EBITDA less property & equipment additions". As we define the term, Adjusted EBITDA less property & equipment additions has the same meaning as Operating Free Cash Flow had previously, and therefore does not impact any previously reported amounts.
TELENET GROUP HOLDING NV - EARNINGS RELEASE FIRST NINE MONTHS 2021 - 11
2.1 Revenue
We generated revenue of €1,928.9 million for the nine months ended September 30 2021, which represented an increase of 1% (+1.0%) versus €1,910.1 million of revenue we generated in the same period last year. As mentioned above, last year's first nine-month revenue still included a one quarter contribution of our Luxembourg cable subsidiary Coditel S.à r.l., which has been merged into Eltrona on April 1, 2020 and in which we hold a 50% minus 1 share shareholding. As such, we no longer consolidate its results as of Q2 2020. Also important to note for comparison basis is that (i) our 9M 2020 top line performance reflected the adverse impact of the global COVID-19 pandemic on our business with a more outspoken impact in Q2 2020 especially given the strong decline in our advertising and production revenue as recorded under other revenue and (ii) the reclassification of subscription, usage-related and interconnect revenue generated by our SME and LE business customers as further detailed above.
Excluding the impact of the aforementioned Luxembourg cable divestment, our rebased 9M 2021 revenue grew just over 1% (+1.1%) compared to the same period of last year. This positive top line trend was driven by solid growth in our total subscription revenue, which represents the sum of our cable and mobile subscription revenue, and continues to represent a solid source of cash flow for our business. Growth in our subscription revenue was driven by (i) continued momentum for our FMC bundles in both the residential and the business segments, (ii) the uptiering of broadband customers to higher speed bundles and (iii) the benefit of the October 2020 and August 2021 rate adjustments. As a result of changes to the allocation of revenue from our new "ONE FMC bundles compared to our former "WIGO" and "YUGO" FMC bundles, mobile telephony revenue increased by €4.8 million, during 9M 2021, with a corresponding decrease in cable subscription revenue. Finally, our B2B business continued to perform well with rebased revenue up 6% for the first nine months of the year compared to the prior year period.
In Q3 2021, our top line evolution was broadly stable on a reported and rebased basis (+0.4%), yielding €640.6 million of revenue. As anticipated and as fully embedded in our FY 2021 outlook, our revenue growth decelerated in the third quarter versus the first six months of the year. A solid 1% increase of our total rebased subscription revenue and a healthy 4% higher rebased B2B revenue in the quarter was almost fully offset by a 5% decline of our rebased other revenue as detailed below.
VIDEOOur video revenue represents the monthly fee paid by our video subscribers for the channels they receive in the basic tier and the revenue generated by our enhanced video subscribers which primarily includes (i) recurring set-top box rental fees, (ii) fees for supplemental premium content offerings, including our subscription VOD packages “Streamz”, "Streamz+" “Play More” and “Play Sports” and (iii) transactional and broadcasting-on-demand services. Our video revenue for the nine months ended September 30, 2021 amounted to €413.2 million (Q3 2021: €134.4 million), representing a 2% and 1% decrease compared to 9M 2020 both on a reported and rebased basis, respectively. This reflected (i) a lower average number of video RGUs, (ii) the adverse impact of the COVID-19 pandemic on our transactional video-on-demand revenue caused by certain delays in the release of new blockbuster movies and series and (iii) the decline in revenue allocation because of the new "ONE" FMC bundles as described above not fully offset by the benefit from the October 2020 and August 2021 price adjustment.
BROADBAND INTERNETThe revenue generated by our residential and small business broadband internet RGUs totaled €508.1 million for the nine months ended September 30, 2021 (Q3 2021: €170.3 million), up over 4% compared to last year's first nine months, both on a reported and rebased basis. This robust year-on-year performance reflected (i) the benefit from the October 2020 and August 2021 price adjustment, (ii) the continued uptiering of our broadband internet customer base and (iii) the successful launch of our new "ONE" FMC propositions. This was partly offset by the aforementioned change in revenue allocation from the new "ONE" FMC bundles.
TELENET GROUP HOLDING NV - EARNINGS RELEASE FIRST NINE MONTHS 2021 - 12
FIXED-LINE TELEPHONYOur fixed-line telephony revenue includes recurring subscription-based revenue from our fixed-line telephony subscribers and variable usage-related revenue, but excludes the interconnect revenue generated by these customers, which is reported under other revenue. For the nine months ended September 30, 2021, our fixed-line telephony revenue fell 5% year-on-year on both a reported and rebased basis to €162.1 million (Q3 2021: €52.8 million). This mainly reflected lower average RGUs over the period and the aforementioned change in revenue allocation from the new "ONE" FMC bundles, which more than offset the favorable impact of the October 2020 and August 2021 price adjustment.
MOBILE TELEPHONYOur mobile telephony revenue represents the subscription-based revenue generated by our direct mobile telephony subscribers and out-of-bundle revenue, but excludes (i) the interconnect revenue generated by these customers, (ii) the revenue earned from handset sales and (iii) revenue recognized under our "Choose Your Device" programs, which are all recorded in other revenue. Our mobile telephony revenue also includes the subscription and usage-related revenue generated by our SME and LE business customers as mentioned above. In 9M 2021, we generated mobile telephony revenue of €365.9 million (Q3 2021: €127.9 million), representing a year-on-year increase of almost 8% on a reported basis mainly as a result of the inclusion of the subscription and usage-related revenue generated by our SME and LE business customers which was recorded under business service last year. On a rebased basis, our mobile telephony revenue was up 3% for the first nine months of the year. The increase was mainly attributable to a favorable comparison as last year's mobile usage was impacted by COVID-19 lockdown restrictions and on top there is the positive impact on mobile revenue from the aforementioned ONE FMC allocation change.
BUSINESS SERVICESThe revenue reported under business services relates to (i) the revenue generated on non-coax products, including fiber and leased DSL lines, (ii) our carrier business and (iii) value-added services such as network hosting and managed data security. Revenue generated by our business customers on all coax-related products, such as our flagship "KLIK" bundle, is allocated to our cable subscription revenue lines and is not captured within Telenet Business, our business services division. Our business services revenue no longer includes the subscription, usage-related and interconnect revenue generated by our SME and LE business customers as mentioned above, now reflected under mobile telephony and other revenue, respectively.
Telenet Business generated revenue of €135.8 million for the nine months ended September 30, 2021 (Q3 2021: €45.5 million), representing a 9% year-on-year decline on a reported basis as a result of the aforementioned change in the way we report the subscription and usage-related revenue generated by our SME and LE business customers. On a rebased basis, our B2B revenue for the first nine months of the year was up 6% year-on-year. The increase was mainly driven by (i) the growth of our ICT integrator business driven by higher equipment, data and security revenues and (ii) the expansion of our large enterprises customer base.
OTHEROther revenue primarily includes (i) interconnect revenue from both our fixed-line and mobile telephony customers, including our SME and LE business customers as mentioned above (ii) advertising and production revenue from our wholly-owned media subsidiary De Vijver Media NV, (iii) mobile handset sales, including the revenue earned under our "Choose Your Device" programs, (iv) wholesale revenue generated through both our commercial and regulated wholesale businesses, (v) product activation and installation fees and (vi) set-top box sales revenue. Our other revenue reached €343.8 million for the nine months ended September 30, 2021, broadly stable on a reported and rebased basis. A solid performance of our advertising and production business and higher wholesale revenue were largely offset by a continued decline in our interconnect revenue and lower revenue from handset sales, reflecting a shortage of certain devices due to the global chip shortage.
In Q3 2021, our other revenue decreased 4% and 5% year-on-year on a reported and rebased basis, respectively, to €109.7 million. The decline was mainly attributable to decreases in both interconnect and handset-related revenue, not fully compensated by the good performance in our wholesale and advertising and production businesses.
TELENET GROUP HOLDING NV - EARNINGS RELEASE FIRST NINE MONTHS 2021 - 13
2.2 Expenses
For the nine months ended September 30, 2021, we incurred total expenses of €1,463.3 million, representing a 1% increase compared to the prior year period. Our total expenses for the first nine months of 2020 included (i) a one-quarter contribution from our Luxembourg cable business prior to the divestment to Eltrona as of April 1, 2020 as well as (ii) a €18.5 million goodwill impairment charge on De Vijver Media following the re-assessment of their strategic long-range plan in Q2 2020, reflecting the impact of the COVID-19 pandemic on its financial profile. Total expenses represented approximately 76% of revenue in 9M 2021, representing a similar percentage as the first nine months of 2020. Cost of services provided as a percentage of revenue represented approximately 49% for 9M 2021 (9M 2020: approximately 54%), while selling, general and administrative expenses represented approximately 27% of our total revenue in 9M 2021 (9M 2020: approximately 22%).
Our operating expenses, which include our (i) network operating expenses, (ii) direct costs, (iii) staff-related expenses, (iv) sales and marketing expenses, (v) outsourced labor and professional services and (vi) other indirect expenses, increased almost 4% on a reported basis for the nine months ended September 30, 2021 and reflected changes to the IFRS accounting treatment of certain content-related costs for our premium entertainment packages and the Belgian football broadcasting rights because of changes related to the underlying contracts (see 2 Financial highlights for additional information). On a rebased basis, our 9M 2021 operating expenses remained broadly stable compared to the prior year period. This was predominantly driven by a 5% rebased decrease (€19.9 million) in our direct costs, which partially offset (i) higher other indirect expenses, (ii) higher staff-related expenses and (iii) higher network operating expenses as described further below.
In Q3 2021, our total expenses reached €487.5 million, representing a 3% increase compared to Q3 last year and reflecting predominantly the aforementioned changes to the IFRS accounting treatment of certain content-related costs for our premium entertainment packages and the Belgian football broadcasting rights because of changes related to the underlying contracts. As flagged in last quarter's release, the year-on-year trend in our rebased operating expenses has started to worsen in Q3 2021 given last year's generally lower cost levels as a result of the global COVID-19 pandemic and the increased activity throughout this year. As a result, our rebased operating expenses were up nearly 2% year-on-year as (i) higher network operating expenses, (ii) higher staff-related expenses and higher costs related to outsourced labor and professional services were not fully offset by lower sales and marketing expenses, as described further below.
NETWORK OPERATING EXPENSESNetwork operating expenses for the nine months ended September 30, 2021 were €157.7 million (Q3 2021: €51.6 million), an increase of 5% year-on-year on both a reported and rebased basis. This increase relates to a greater proportion of technical customer visits, reflecting an increase in homeworking as a result of the COVID-19 pandemic, as well as the resumption of our analog Signal Switch program as mentioned above.
DIRECT COSTS (PROGRAMMING AND COPYRIGHTS, INTERCONNECT AND OTHER)Our direct costs include all of our direct expenses such as (i) programming and copyright costs, including, as of Q3 2020, costs related to the purchase of content for our "Streamz", "Streamz+" and "Play More" packages, as well as the costs related to the Belgian football broadcasting rights, (ii) interconnect costs and (iii) handset sales and subsidies. For the nine months ended September 30, 2021, our direct costs were €381.0 million, a 3% increase compared to 9M 2020, reflecting the aforementioned changes to the IFRS accounting treatment of certain content-related costs for our premium entertainment packages and the Belgian football broadcasting rights because of changes related to the underlying contracts. On a rebased basis, our direct costs for the first nine months of the year decreased 5% year-on-year due to significantly lower interconnect costs and despite higher programming and roaming costs. In Q3 2021, we incurred €130.7 million of direct costs, up 3% on a reported basis and reflecting the same inorganic change as mentioned above. On a rebased basis, direct costs were broadly stable as higher programming costs were fully offset by lower interconnect costs.
TELENET GROUP HOLDING NV - EARNINGS RELEASE FIRST NINE MONTHS 2021 - 14
STAFF-RELATED EXPENSESStaff-related expenses for the nine months ended September 30, 2021 were €204.2 million (Q3 2021: €66.1 million), which represented an increase of 3% and 4% compared to the prior year period on a reported and rebased basis respectively. This reflected (i) lower staff-related expenses in the first nine months of last year following the COVID-19 pandemic, (ii) an higher average headcount and (iii) the effect of the mandatory wage indexation as of early 2021.
SALES AND MARKETING EXPENSESOur sales and marketing expenses for the nine months ended September 30, 2021 were €59.8 million representing a 5% year-on-year decrease. On a rebased basis, sales and marketing expenses for the nine months ended September 30, 2021 decreased 3% year-on-year, reflecting timing variances in some of our marketing campaigns. In Q3 2021, our sales and marketing expenses reached €20.5 million, down 12% and 11% relative to the same period last year on a reported and rebased basis, respectively, which had significantly higher commercial costs following the end of the first mandatory COVID-19 lockdown in Belgium.
OUTSOURCED LABOR AND PROFESSIONAL SERVICESCosts related to outsourced labor and professional services were €23.6 million in 9M 2021 (Q3 2021: €8.4 million), a 12% year-on-year increase both on a reported and rebased basis, respectively, as our expenses in the first nine months of last year reflected the impact of the global COVID-19 pandemic with lower costs.
OTHER INDIRECT EXPENSESOther indirect expenses reached €75.5 million for the nine months ended September 30, 2021 (Q3 2021: €24.9 million), representing a 12% increase compared to the prior year period both on a reported and rebased basis, due to higher outsourced call center costs triggered by COVID-19 regulation requiring mandatory homeworking and an increase in bad debt provisions.
DEPRECIATION, AMORTIZATION AND RESTRUCTURING, INCL. IMPAIRMENT OF LONG-LIVED ASSETS AND GAIN ON DISPOSAL OF ASSETSDepreciation and amortization, including impairment of long-lived assets, gain on disposal of assets and restructuring charges, reached €533.4 million in 9M 2021 (Q3 2021: €174.9 million) compared to €552.7 million for the prior year period which included the aforementioned €18.5 million goodwill impairment charge.
2.3 Net result
FINANCE INCOME AND EXPENSES For the nine months ended September 30, 2021, net finance expense totaled €66.2 million compared to €153.3 million in 9M 2020. Finance income for the nine months ended September 30, 2021 increased substantially year-on-year to €230.0 million from €125.5 million in 9M last year and included a non-cash gain on our derivatives of €228.4 million, whereas the prior year period reflected a non-cash foreign exchange gain of €124.8 million. Finance expense for the nine months ended September 30, 2021 increased 6% to €296.2 million from €278.8 million in 9M 2020. Finance expense for 9M 2021 included a €154.4 million non-cash foreign exchange loss on our USD-denominated debt, whereas last year's finance expense reflected a €103.8 million non-cash loss of our derivatives and a €15.2 million loss on extinguishment of debt. As detailed under 2.8 Debt profile, cash balance and net total leverage ratio, our USD-denominated debt has been hedged until the respective maturity dates, hence minimizing the impact of foreign exchange fluctuations on our cash flows. Excluding the impact from both derivatives and foreign exchange losses, our net interest expense in 9M 2021 decreased 11%, reflecting the benefit of certain refinancing transactions in the first quarter of 2020.
Net finance expense in Q3 2021 was €37.4 million compared to €55.5 million in the prior year period, which included a non-cash loss on our derivatives of €126.5 million in Q3 last year compared to a non-cash gain of €76.1 million in the third quarter of the current year as well as a non-cash foreign exchange gain of €120.1 million in Q3 last year compared to a non-cash foreign exchange loss of €66.8 million in Q3 2021.
INCOME TAXES We recorded income tax expense of €96.5 million for the nine months ended September 30, 2021 (Q3 2021: €26.8 million) compared to €43.5 million in 9M 2020. Last year's income tax expense was favorably
TELENET GROUP HOLDING NV - EARNINGS RELEASE FIRST NINE MONTHS 2021 - 15
impacted by the recognition of the innovation income tax deduction, including a one-time effect of deductions related to prior periods, whereas 9M 2021 reflected a more normalized run-rate.
NET PROFITWe realized a net profit of €301.7 million for the nine months ended September 30, 2021 compared to €298.1 million in the prior year period. The modest 1% increase in our net profit reflected significantly lower net finance expense, as mentioned above, almost fully offset by higher income tax expense as mentioned above. In 9M 2021, we achieved a net profit margin of 15.6%, which was stable compared to 9M last year.
In Q3 2021, we earned €90.0 million of net profit. This represented a 20% decrease relative to the prior year period, driven by a 7% lower operating profit, only partly offset by lower net finance expense. This translated into a net profit margin of 14.0% in the quarter compared to 17.7% in Q3 last year.
2.4 Adjusted EBITDA
For the nine months ended September 30, 2021, we achieved Adjusted EBITDA of €1,027.1 million, which represented a modest decline of just over 1% versus the €1,041.1 million we delivered in 9M 2020. This was mainly driven by (i) the aforementioned changes to the IFRS accounting outcome of certain content-related costs for our premium entertainment packages and the Belgian football broadcasting rights because of changes related to the underlying contracts (see 2 Financial highlights for more information) and (ii) the divestment of our Luxembourg cable business into Eltrona as mentioned earlier. In 9M 2021, we achieved an Adjusted EBITDA margin of 53.2% compared to 54.5% in 9M 2020.
On a rebased basis, excluding these impacts, our Adjusted EBITDA for the nine months ended September 30, 2021 increased nearly 2% (+1.7%) driven by healthy organic top line growth of just over 1% over the period, whereas our operating expenses over the period remained broadly stable as a 5% decline in our direct costs was partially offset higher other indirect expenses, higher staff-related expenses and higher network operating expenses. On a rebased basis, we succeeded in expanding our 9M 2021 Adjusted EBITDA margin by 30 basis points versus the same period of last year.
In Q3 2021, our Adjusted EBITDA reached €338.4 million, representing a decrease of slightly more than 1% compared to last year's Adjusted EBITDA of €343.1 million, translating into a healthy margin of 52.8%. In line with our FY 2021 outlook, the trend in our Adjusted EBITDA has started to decelerate in Q3 given a tougher comparison base compared to the same period of last year and seasonality in some of our operating expenses. On a rebased basis, our Adjusted EBITDA showed a modest contraction of less than 1% (-0.6%) in Q3 2021 as lower sales and marketing expenses were more than offset by higher network operating expenses, higher staff-related expenses and higher costs related to outsourced labor and professional services.
TELENET GROUP HOLDING NV - EARNINGS RELEASE FIRST NINE MONTHS 2021 - 16
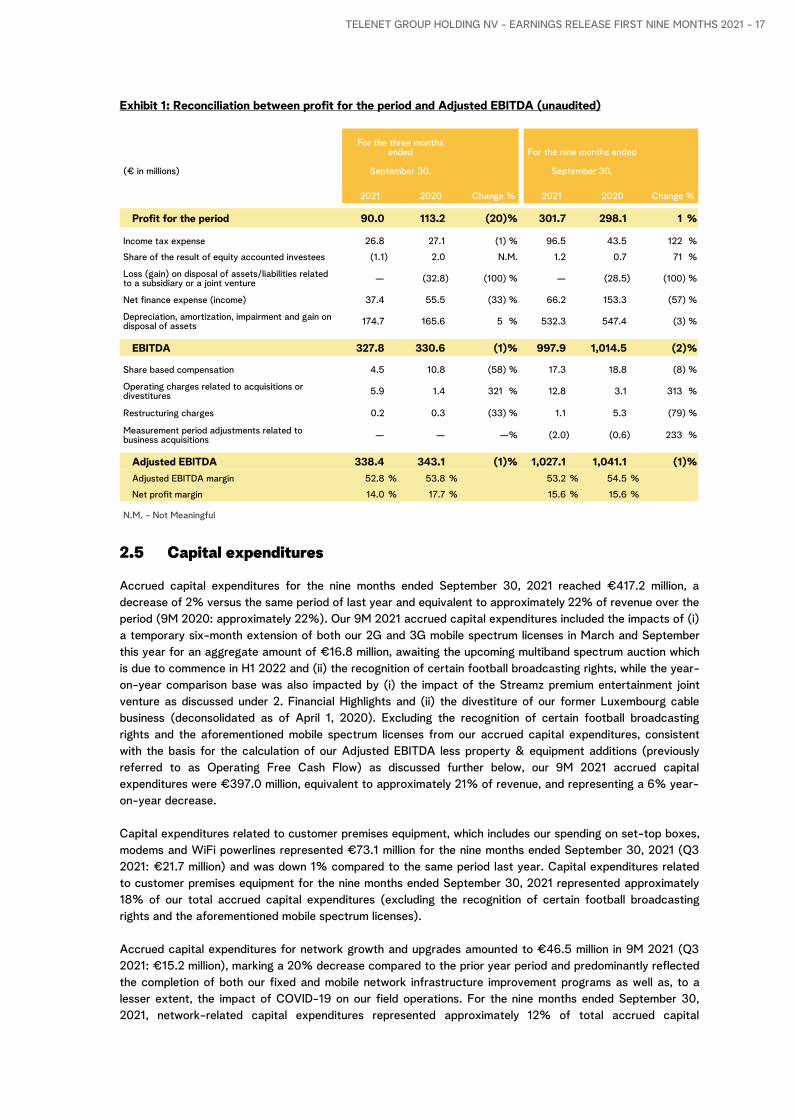
Exhibit 1: Reconciliation between profit for the period and Adjusted EBITDA (unaudited)
(€ in millions)
For the three months ended For the nine months ended
September 30, September 30,
2021 2020 Change % 2021 2020 Change %
Profit for the period 90.0 113.2 (20) % 301.7 298.1 1 %
Income tax expense 26.8 27.1 (1) % 96.5 43.5 122 %
Share of the result of equity accounted investees (1.1) 2.0 N.M. 1.2 0.7 71 %
Loss (gain) on disposal of assets/liabilities related to a subsidiary or a joint venture — (32.8) (100) % — (28.5) (100) %
Net finance expense (income) 37.4 55.5 (33) % 66.2 153.3 (57) %
Depreciation, amortization, impairment and gain on disposal of assets 174.7 165.6 5 % 532.3 547.4 (3) %
EBITDA 327.8 330.6 (1) % 997.9 1,014.5 (2) %
Share based compensation 4.5 10.8 (58) % 17.3 18.8 (8) %
Operating charges related to acquisitions or divestitures 5.9 1.4 321 % 12.8 3.1 313 %
Restructuring charges 0.2 0.3 (33) % 1.1 5.3 (79) %
Measurement period adjustments related to business acquisitions — — —% (2.0) (0.6) 233 %
Adjusted EBITDA 338.4 343.1 (1) % 1,027.1 1,041.1 (1) %Adjusted EBITDA margin 52.8 % 53.8 % 53.2 % 54.5 %
Net profit margin 14.0 % 17.7 % 15.6 % 15.6 %
N.M. - Not Meaningful
2.5 Capital expenditures
Accrued capital expenditures for the nine months ended September 30, 2021 reached €417.2 million, a decrease of 2% versus the same period of last year and equivalent to approximately 22% of revenue over the period (9M 2020: approximately 22%). Our 9M 2021 accrued capital expenditures included the impacts of (i) a temporary six-month extension of both our 2G and 3G mobile spectrum licenses in March and September this year for an aggregate amount of €16.8 million, awaiting the upcoming multiband spectrum auction which is due to commence in H1 2022 and (ii) the recognition of certain football broadcasting rights, while the year-on-year comparison base was also impacted by (i) the impact of the Streamz premium entertainment joint venture as discussed under 2. Financial Highlights and (ii) the divestiture of our former Luxembourg cable business (deconsolidated as of April 1, 2020). Excluding the recognition of certain football broadcasting rights and the aforementioned mobile spectrum licenses from our accrued capital expenditures, consistent with the basis for the calculation of our Adjusted EBITDA less property & equipment additions (previously referred to as Operating Free Cash Flow) as discussed further below, our 9M 2021 accrued capital expenditures were €397.0 million, equivalent to approximately 21% of revenue, and representing a 6% year-on-year decrease.
Capital expenditures related to customer premises equipment, which includes our spending on set-top boxes, modems and WiFi powerlines represented €73.1 million for the nine months ended September 30, 2021 (Q3 2021: €21.7 million) and was down 1% compared to the same period last year. Capital expenditures related to customer premises equipment for the nine months ended September 30, 2021 represented approximately 18% of our total accrued capital expenditures (excluding the recognition of certain football broadcasting rights and the aforementioned mobile spectrum licenses).
Accrued capital expenditures for network growth and upgrades amounted to €46.5 million in 9M 2021 (Q3 2021: €15.2 million), marking a 20% decrease compared to the prior year period and predominantly reflected the completion of both our fixed and mobile network infrastructure improvement programs as well as, to a lesser extent, the impact of COVID-19 on our field operations. For the nine months ended September 30, 2021, network-related capital expenditures represented approximately 12% of total accrued capital
TELENET GROUP HOLDING NV - EARNINGS RELEASE FIRST NINE MONTHS 2021 - 17
expenditures (excluding the recognition of certain football broadcasting rights and the aforementioned mobile spectrum licenses).
Capital expenditures for products and services, which reflects our investments in product development and the upgrade of our IT platforms and systems, amongst others, totaled €124.8 million in 9M 2021 (Q3 2021: €39.6 million). This represented a strong 14% year-on-year increase, reflecting higher spending on our IT upgrade program. Capital expenditures for products and services represented approximately 31% of total accrued capital expenditures for the nine months ended September 30, 2021 (excluding the recognition of certain football broadcasting rights and the aforementioned mobile spectrum licenses).
The remainder of our accrued capital expenditures includes (i) refurbishments and replacements of network equipment, (ii) sports and programming acquisition costs, including certain content acquired by De Vijver Media, (iii) certain recurring investments in our IT platform and systems and (iv) lease-related capital additions. These reached €172.8 million for the nine months ended September 30, 2021 (Q3 2021: €58.9 million), representing a 7% decrease compared to the same period last year.
The above implies that approximately 61% of our accrued capital expenditures for the nine months ended September 30, 2021 (excluding the recognition of certain football broadcasting rights and the aforementioned mobile spectrum licenses) were scalable and subscriber growth related. We continue to closely monitor our capital expenditures in order to drive incremental returns.
In Q3 2021, our accrued capital expenditures totaled €135.4 million, marking an 4% increase compared to Q3 last year and included the aforementioned temporary extension of our mobile spectrum licenses in September 2021. As a percentage of revenue, our accrued capital expenditures in Q3 2021 represented approximately 21% as compared to approximately 20% in the prior year period. Approximately 60% of our accrued capital expenditure in the quarter (excluding the recognition of certain football broadcasting rights and the aforementioned mobile spectrum licenses) were scalable and subscriber growth related.
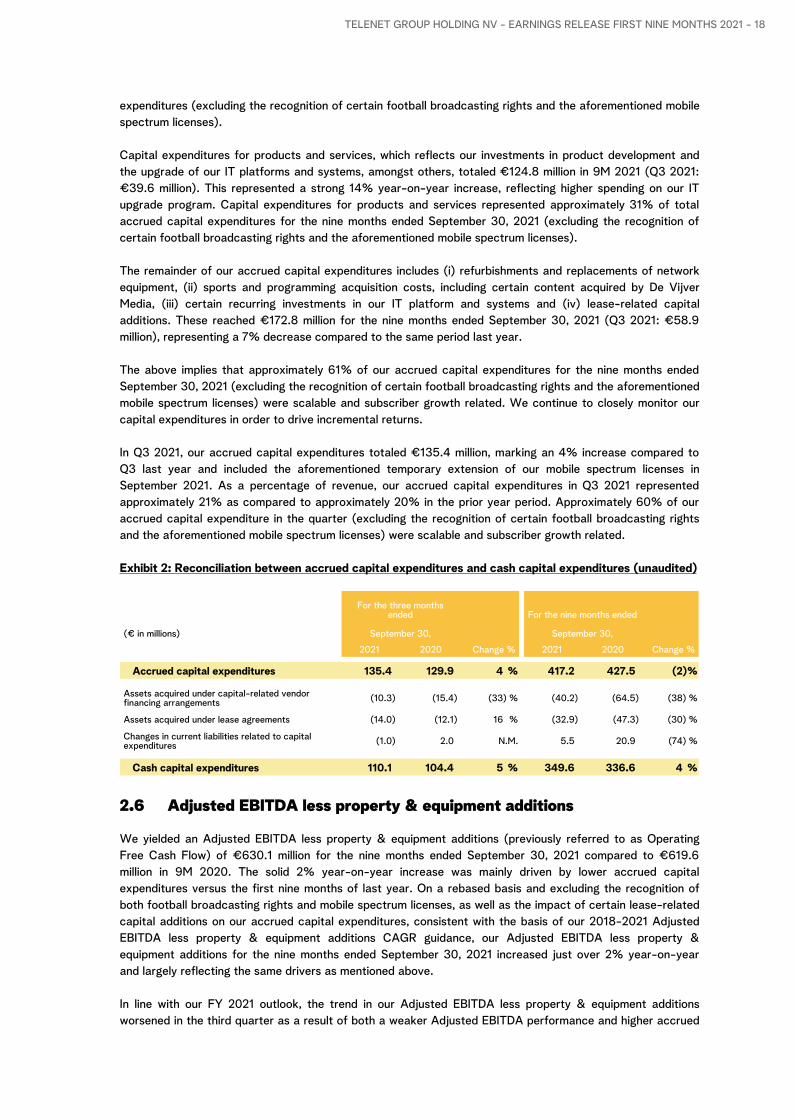
Exhibit 2: Reconciliation between accrued capital expenditures and cash capital expenditures (unaudited)
(€ in millions)
For the three months ended For the nine months ended
September 30, September 30,
2021 2020 Change % 2021 2020 Change %
Accrued capital expenditures 135.4 129.9 4 % 417.2 427.5 (2) %
Assets acquired under capital-related vendor financing arrangements (10.3) (15.4) (33) % (40.2) (64.5) (38) %
Assets acquired under lease agreements (14.0) (12.1) 16 % (32.9) (47.3) (30) %
Changes in current liabilities related to capital expenditures (1.0) 2.0 N.M. 5.5 20.9 (74) %
Cash capital expenditures 110.1 104.4 5 % 349.6 336.6 4 %
2.6 Adjusted EBITDA less property & equipment additions
We yielded an Adjusted EBITDA less property & equipment additions (previously referred to as Operating Free Cash Flow) of €630.1 million for the nine months ended September 30, 2021 compared to €619.6 million in 9M 2020. The solid 2% year-on-year increase was mainly driven by lower accrued capital expenditures versus the first nine months of last year. On a rebased basis and excluding the recognition of both football broadcasting rights and mobile spectrum licenses, as well as the impact of certain lease-related capital additions on our accrued capital expenditures, consistent with the basis of our 2018-2021 Adjusted EBITDA less property & equipment additions CAGR guidance, our Adjusted EBITDA less property & equipment additions for the nine months ended September 30, 2021 increased just over 2% year-on-year and largely reflecting the same drivers as mentioned above.
In line with our FY 2021 outlook, the trend in our Adjusted EBITDA less property & equipment additions worsened in the third quarter as a result of both a weaker Adjusted EBITDA performance and higher accrued
TELENET GROUP HOLDING NV - EARNINGS RELEASE FIRST NINE MONTHS 2021 - 18
capital expenditures relative to last year when our investments were impacted by the COVID-19 pandemic. In Q3 2021, we recorded a 3% decrease in our Adjusted EBITDA less property & equipment additions from €218.7 million in the same period last year to €211.8 million.
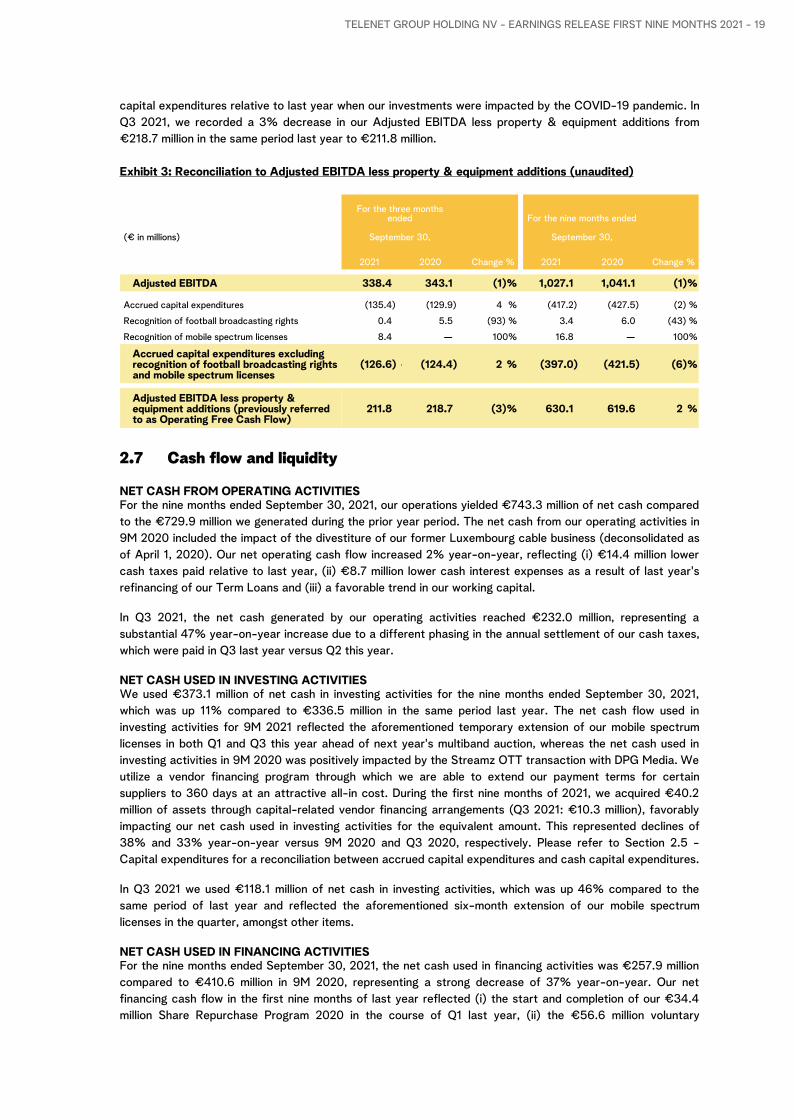
Exhibit 3: Reconciliation to Adjusted EBITDA less property & equipment additions (unaudited)
(€ in millions)
For the three months ended For the nine months ended
September 30, September 30,
2021 2020 Change % 2021 2020 Change %
Adjusted EBITDA 338.4 343.1 (1) % 1,027.1 1,041.1 (1) %
Accrued capital expenditures (135.4) (129.9) 4 % (417.2) (427.5) (2) %
Recognition of football broadcasting rights 0.4 5.5 (93) % 3.4 6.0 (43) %
Recognition of mobile spectrum licenses 8.4 — 100% 16.8 — 100%
Accrued capital expenditures excluding recognition of football broadcasting rights and mobile spectrum licenses
(126.6) — (124.4) 2 % (397.0) (421.5) (6) %
Adjusted EBITDA less property & equipment additions (previously referred to as Operating Free Cash Flow)
211.8 218.7 (3) % 630.1 619.6 2 %
2.7 Cash flow and liquidity NET CASH FROM OPERATING ACTIVITIES For the nine months ended September 30, 2021, our operations yielded €743.3 million of net cash compared to the €729.9 million we generated during the prior year period. The net cash from our operating activities in 9M 2020 included the impact of the divestiture of our former Luxembourg cable business (deconsolidated as of April 1, 2020). Our net operating cash flow increased 2% year-on-year, reflecting (i) €14.4 million lower cash taxes paid relative to last year, (ii) €8.7 million lower cash interest expenses as a result of last year's refinancing of our Term Loans and (iii) a favorable trend in our working capital.
In Q3 2021, the net cash generated by our operating activities reached €232.0 million, representing a substantial 47% year-on-year increase due to a different phasing in the annual settlement of our cash taxes, which were paid in Q3 last year versus Q2 this year.
NET CASH USED IN INVESTING ACTIVITIESWe used €373.1 million of net cash in investing activities for the nine months ended September 30, 2021, which was up 11% compared to €336.5 million in the same period last year. The net cash flow used in investing activities for 9M 2021 reflected the aforementioned temporary extension of our mobile spectrum licenses in both Q1 and Q3 this year ahead of next year's multiband auction, whereas the net cash used in investing activities in 9M 2020 was positively impacted by the Streamz OTT transaction with DPG Media. We utilize a vendor financing program through which we are able to extend our payment terms for certain suppliers to 360 days at an attractive all-in cost. During the first nine months of 2021, we acquired €40.2 million of assets through capital-related vendor financing arrangements (Q3 2021: €10.3 million), favorably impacting our net cash used in investing activities for the equivalent amount. This represented declines of 38% and 33% year-on-year versus 9M 2020 and Q3 2020, respectively. Please refer to Section 2.5 - Capital expenditures for a reconciliation between accrued capital expenditures and cash capital expenditures.
In Q3 2021 we used €118.1 million of net cash in investing activities, which was up 46% compared to the same period of last year and reflected the aforementioned six-month extension of our mobile spectrum licenses in the quarter, amongst other items.
NET CASH USED IN FINANCING ACTIVITIES For the nine months ended September 30, 2021, the net cash used in financing activities was €257.9 million compared to €410.6 million in 9M 2020, representing a strong decrease of 37% year-on-year. Our net financing cash flow in the first nine months of last year reflected (i) the start and completion of our €34.4 million Share Repurchase Program 2020 in the course of Q1 last year, (ii) the €56.6 million voluntary
TELENET GROUP HOLDING NV - EARNINGS RELEASE FIRST NINE MONTHS 2021 - 19
redemption of part of our Senior Secured Fixed Rate Notes in addition to (iii) €142.3 million of dividends paid to shareholders as part of our shareholder remuneration policy. The net cash used in financing activities for the nine months ended September 30, 2021 reflected (i) a net €38.2 million reduction in our outstanding loans and borrowings, including scheduled repayments under our vendor financing program, as well as (ii) a dividend payment of €156.0 million, up 10% year-on-year. The remainder of our net cash used in financing activities primarily consisted of lease repayments and other financial payments.
In Q3 2021, we only used €14.5 million of net cash in financing activities compared to €64.3 million of net cash used in Q3 last year. The net cash used in financing activities in the quarter primarily consisted of finance lease repayments and other financial payments.
ADJUSTED FREE CASH FLOWFor the nine months ended September 30, 2021, we generated a robust Adjusted Free Cash Flow of €314.1 million compared to €258.5 million in the same period of last year. Relative to 9M 2020, our Adjusted Free Cash Flow increased 22% driven by (i) €14.4 million lower cash taxes paid relative to last year, (ii) €8.7 million lower cash interest expenses as a result of last year's refinancing of our Term Loans and (iii) a favorable trend in our working capital. Our Adjusted Free Cash Flow for the nine months ended September 30, 2021 also included a €11.9 million increase in our vendor financing program whereas last year our nine-month Adjusted Free Cash Flow included a contraction of €14.5 million due to phasing. Excluding these movements, our underlying Adjusted Free Cash Flow performance would have been more moderate. As a reminder, our FY 2021 Adjusted Free Cash Flow outlook includes a broadly stable contribution from our vendor financing program, suggesting a decrease in the year-end quarter.
Our Adjusted Free Cash Flow in Q3 2021 was €111.6 million versus a negative €5.4 million in the same period a year ago as a result of the aforementioned phasing in the settlement of our annual cash taxes and a €40.5 million higher contribution from our vendor financing program due to phasing.
2.8 Debt profile, cash balance and net leverage ratio
DEBT PROFILEAt September 30, 2021, we carried a total debt balance (including accrued interest) of €5,527.0 million, of which €1,404.3 million principal amount is related to the € and USD-denominated Senior Secured Fixed Rate Notes due March 2028 and €3,093.5 million principal amount is owed under our 2020 Amended Senior Credit Facility with maturities ranging from April 2028 through April 2029. Our total debt balance at September 30, 2021 also included a principal amount of €362.9 million related to our vendor financing program, while the remainder primarily represents lease obligations associated with the Interkabel Acquisition and other leases.
At September 30, 2021, we carried €362.9 million of short-term debt related to our vendor financing program, all of which is maturing within less than twelve months. This represented increases of respectively €11.9 million versus December 31, 2020 and €15.3 million versus June 30, 2021, reflecting seasonality in some of our scheduled vendor financing payments and positively impacting our Adjusted Free Cash Flow by the same amounts in both periods. For the full year 2021, we continue to anticipate a broadly stable evolution from December 31, 2020 as embedded in our FY 2021 Adjusted Free Cash Flow outlook. As of end-October 2020, the applicable margin on our future short-dated commitments under the vendor financing program has been reduced by another 15 basis points to 1.95% over EURIBOR floored at 0%. This reduced interest cost comes on top of an equivalent 15 basis points margin reduction in February 2020. Given the aforementioned size of the program, this will have a modest accretive impact on our Adjusted Free Cash Flow in 2021 and beyond.
We didn't transact any refinancings or debt amortizations in the first nine months of the year, while substantially all of our floating interest rate risk and foreign exchange currency risk have been hedged until the maturity of such debt instruments through a series of derivatives, improving the visibility on our future Adjusted Free Cash Flow. Excluding short-term liabilities related to our vendor financing program, we face no debt maturities prior to March 2028 with a weighted average maturity of approximately 6.8 years at September 30, 2021. In addition, we also had full access to €555.0 million of undrawn commitments under our revolving credit facilities at September 30, 2021, with certain availabilities up to September 2026.
TELENET GROUP HOLDING NV - EARNINGS RELEASE FIRST NINE MONTHS 2021 - 20
DEBT OVERVIEW AND PAYMENT SCHEDULESThe table below provides an overview of the principal amounts under our main debt instruments and payment schedule at September 30, 2021.
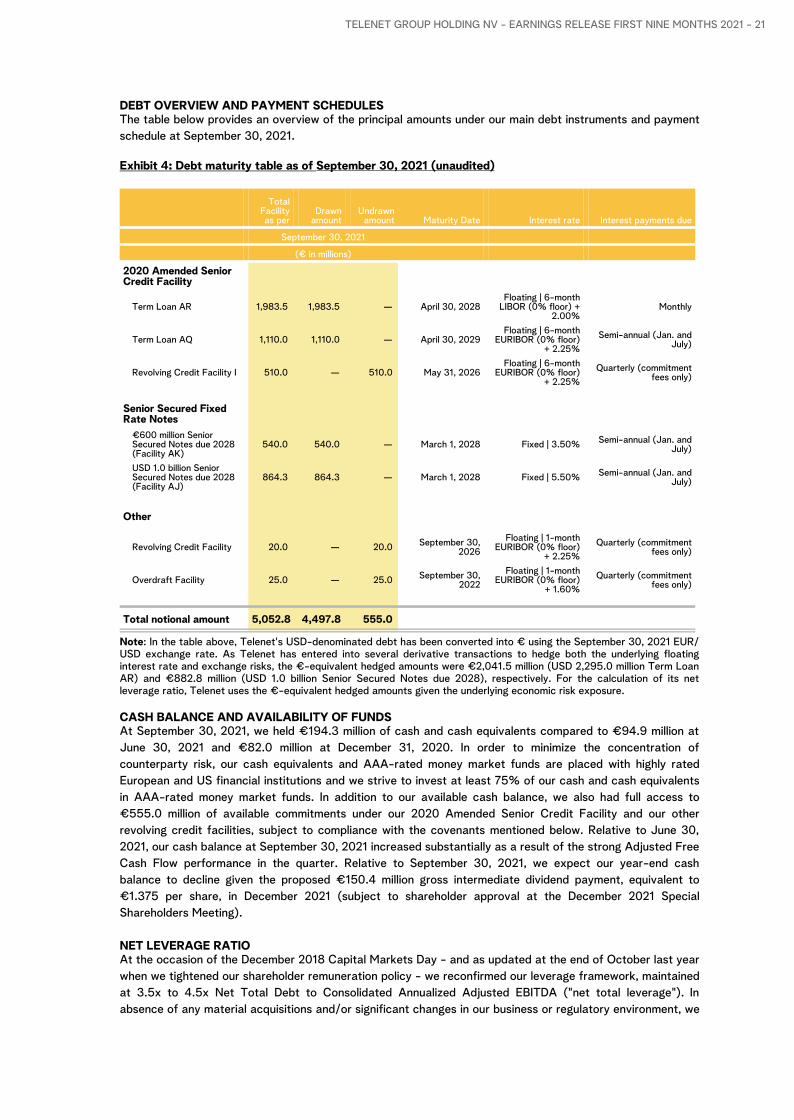
Exhibit 4: Debt maturity table as of September 30, 2021 (unaudited)
Total Facility as per
Drawn amount
Undrawn amount Maturity Date Interest rate Interest payments due
September 30, 2021
(€ in millions)
2020 Amended Senior Credit Facility
Term Loan AR 1,983.5 1,983.5 — April 30, 2028Floating | 6-month
LIBOR (0% floor) + 2.00%
Monthly
Term Loan AQ 1,110.0 1,110.0 — April 30, 2029Floating | 6-month
EURIBOR (0% floor) + 2.25%
Semi-annual (Jan. and July)
Revolving Credit Facility I 510.0 — 510.0 May 31, 2026Floating | 6-month
EURIBOR (0% floor) + 2.25%
Quarterly (commitment fees only)
Senior Secured Fixed Rate Notes
€600 million Senior Secured Notes due 2028 (Facility AK)
540.0 540.0 — March 1, 2028 Fixed | 3.50% Semi-annual (Jan. and July)
USD 1.0 billion Senior Secured Notes due 2028 (Facility AJ)
864.3 864.3 — March 1, 2028 Fixed | 5.50% Semi-annual (Jan. and July)
Other
Revolving Credit Facility 20.0 — 20.0 September 30, 2026
Floating | 1-month EURIBOR (0% floor)
+ 2.25%Quarterly (commitment
fees only)
Overdraft Facility 25.0 — 25.0 September 30, 2022
Floating | 1-month EURIBOR (0% floor)
+ 1.60%Quarterly (commitment
fees only)
Total notional amount 5,052.8 4,497.8 555.0
Note: In the table above, Telenet's USD-denominated debt has been converted into € using the September 30, 2021 EUR/USD exchange rate. As Telenet has entered into several derivative transactions to hedge both the underlying floating interest rate and exchange risks, the €-equivalent hedged amounts were €2,041.5 million (USD 2,295.0 million Term Loan AR) and €882.8 million (USD 1.0 billion Senior Secured Notes due 2028), respectively. For the calculation of its net leverage ratio, Telenet uses the €-equivalent hedged amounts given the underlying economic risk exposure.
CASH BALANCE AND AVAILABILITY OF FUNDSAt September 30, 2021, we held €194.3 million of cash and cash equivalents compared to €94.9 million at June 30, 2021 and €82.0 million at December 31, 2020. In order to minimize the concentration of counterparty risk, our cash equivalents and AAA-rated money market funds are placed with highly rated European and US financial institutions and we strive to invest at least 75% of our cash and cash equivalents in AAA-rated money market funds. In addition to our available cash balance, we also had full access to €555.0 million of available commitments under our 2020 Amended Senior Credit Facility and our other revolving credit facilities, subject to compliance with the covenants mentioned below. Relative to June 30, 2021, our cash balance at September 30, 2021 increased substantially as a result of the strong Adjusted Free Cash Flow performance in the quarter. Relative to September 30, 2021, we expect our year-end cash balance to decline given the proposed €150.4 million gross intermediate dividend payment, equivalent to €1.375 per share, in December 2021 (subject to shareholder approval at the December 2021 Special Shareholders Meeting).
NET LEVERAGE RATIOAt the occasion of the December 2018 Capital Markets Day - and as updated at the end of October last year when we tightened our shareholder remuneration policy - we reconfirmed our leverage framework, maintained at 3.5x to 4.5x Net Total Debt to Consolidated Annualized Adjusted EBITDA ("net total leverage"). In absence of any material acquisitions and/or significant changes in our business or regulatory environment, we
TELENET GROUP HOLDING NV - EARNINGS RELEASE FIRST NINE MONTHS 2021 - 21

intend to stay around the 4.0x mid-point through an attractive and sustainable level of shareholder disbursements. This now includes a gross dividend per share floor of €2.75, representing the upper end of the previous pay-ratio between 50-70% as a percentage of our Adjusted Free Cash Flow. At September 30, 2021, our net total leverage was 3.9x, representing a modest decrease compared to June 30, 2021 as a result of the strong Adjusted Free Cash Flow generation in the quarter.
Our net covenant leverage, as calculated under the 2020 Amended Senior Credit Facility, differs from our net total leverage as it excludes (i) lease-related liabilities, (ii) any vendor financing-related short-term liabilities and includes (iii) the Credit Facility Excluded Amount (which is the greater of €400.0 million and 0.25x Consolidated Adjusted Annualized EBITDA). Our net covenant leverage reached 2.9x at September 30, 2021, which was slightly lower versus June 30, 2021. Our current net covenant leverage ratio is significantly below the springing maintenance covenant of 6.0x and the incurrence test of 4.5x net senior leverage. The aforementioned maintenance covenant only applies, however, in case we would draw 40% or more under our revolving credit facilities. At September 30, 2021, our revolving credit facilities were fully undrawn as mentioned above.
TELENET GROUP HOLDING NV - EARNINGS RELEASE FIRST NINE MONTHS 2021 - 22
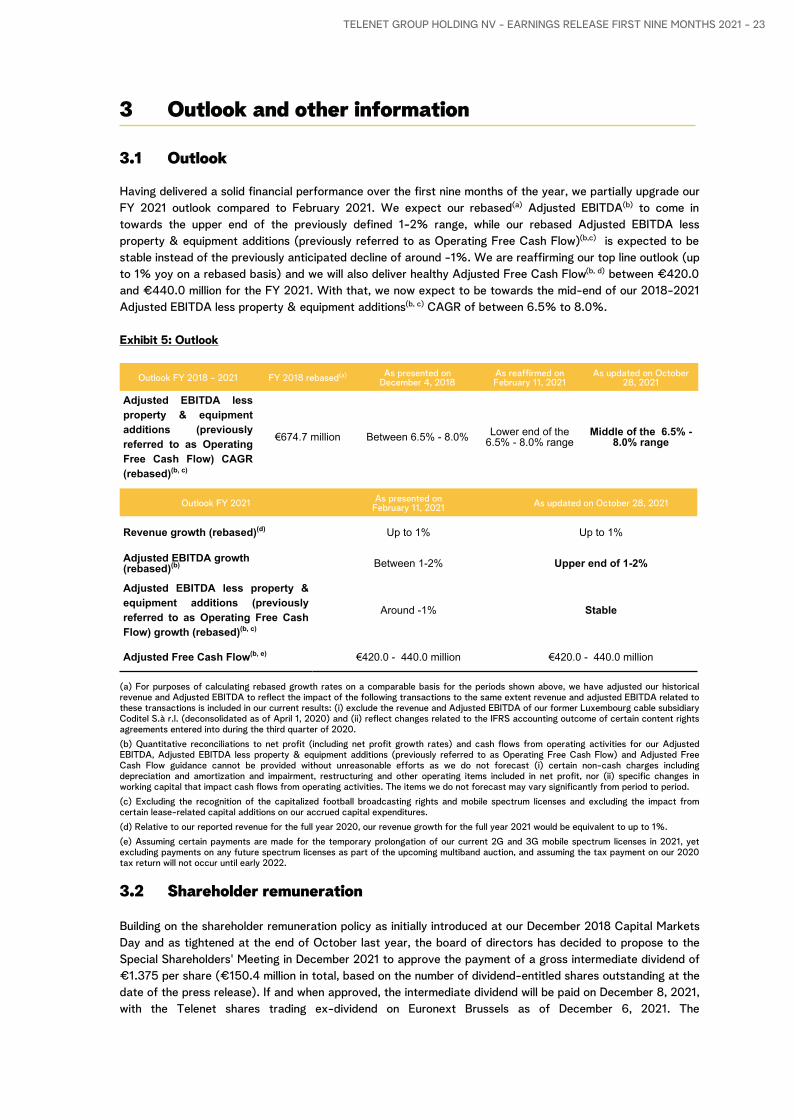
3 Outlook and other information
3.1 Outlook
Having delivered a solid financial performance over the first nine months of the year, we partially upgrade our FY 2021 outlook compared to February 2021. We expect our rebased(a) Adjusted EBITDA(b) to come in towards the upper end of the previously defined 1-2% range, while our rebased Adjusted EBITDA less property & equipment additions (previously referred to as Operating Free Cash Flow)(b,c) is expected to be stable instead of the previously anticipated decline of around -1%. We are reaffirming our top line outlook (up to 1% yoy on a rebased basis) and we will also deliver healthy Adjusted Free Cash Flow(b, d) between €420.0 and €440.0 million for the FY 2021. With that, we now expect to be towards the mid-end of our 2018-2021 Adjusted EBITDA less property & equipment additions(b, c) CAGR of between 6.5% to 8.0%.
Exhibit 5: Outlook
Outlook FY 2018 - 2021 FY 2018 rebased(a) As presented on December 4, 2018
As reaffirmed on February 11, 2021
As updated on October 28, 2021
Adjusted EBITDA less property & equipment additions (previously referred to as Operating Free Cash Flow) CAGR (rebased)(b, c)
€674.7 million Between 6.5% - 8.0% Lower end of the 6.5% - 8.0% range
Middle of the 6.5% - 8.0% range
Outlook FY 2021 As presented on February 11, 2021 As updated on October 28, 2021
Revenue growth (rebased)(d) Up to 1% Up to 1%
Adjusted EBITDA growth (rebased)(b) Between 1-2% Upper end of 1-2%
Adjusted EBITDA less property & equipment additions (previously referred to as Operating Free Cash Flow) growth (rebased)(b, c)
Around -1% Stable
Adjusted Free Cash Flow(b, e) €420.0 - 440.0 million €420.0 - 440.0 million
(a) For purposes of calculating rebased growth rates on a comparable basis for the periods shown above, we have adjusted our historical revenue and Adjusted EBITDA to reflect the impact of the following transactions to the same extent revenue and adjusted EBITDA related to these transactions is included in our current results: (i) exclude the revenue and Adjusted EBITDA of our former Luxembourg cable subsidiary Coditel S.à r.l. (deconsolidated as of April 1, 2020) and (ii) reflect changes related to the IFRS accounting outcome of certain content rights agreements entered into during the third quarter of 2020.(b) Quantitative reconciliations to net profit (including net profit growth rates) and cash flows from operating activities for our Adjusted EBITDA, Adjusted EBITDA less property & equipment additions (previously referred to as Operating Free Cash Flow) and Adjusted Free Cash Flow guidance cannot be provided without unreasonable efforts as we do not forecast (i) certain non-cash charges including depreciation and amortization and impairment, restructuring and other operating items included in net profit, nor (ii) specific changes in working capital that impact cash flows from operating activities. The items we do not forecast may vary significantly from period to period.(c) Excluding the recognition of the capitalized football broadcasting rights and mobile spectrum licenses and excluding the impact from certain lease-related capital additions on our accrued capital expenditures.(d) Relative to our reported revenue for the full year 2020, our revenue growth for the full year 2021 would be equivalent to up to 1%.(e) Assuming certain payments are made for the temporary prolongation of our current 2G and 3G mobile spectrum licenses in 2021, yet excluding payments on any future spectrum licenses as part of the upcoming multiband auction, and assuming the tax payment on our 2020 tax return will not occur until early 2022.
3.2 Shareholder remuneration
Building on the shareholder remuneration policy as initially introduced at our December 2018 Capital Markets Day and as tightened at the end of October last year, the board of directors has decided to propose to the Special Shareholders' Meeting in December 2021 to approve the payment of a gross intermediate dividend of €1.375 per share (€150.4 million in total, based on the number of dividend-entitled shares outstanding at the date of the press release). If and when approved, the intermediate dividend will be paid on December 8, 2021, with the Telenet shares trading ex-dividend on Euronext Brussels as of December 6, 2021. The
TELENET GROUP HOLDING NV - EARNINGS RELEASE FIRST NINE MONTHS 2021 - 23
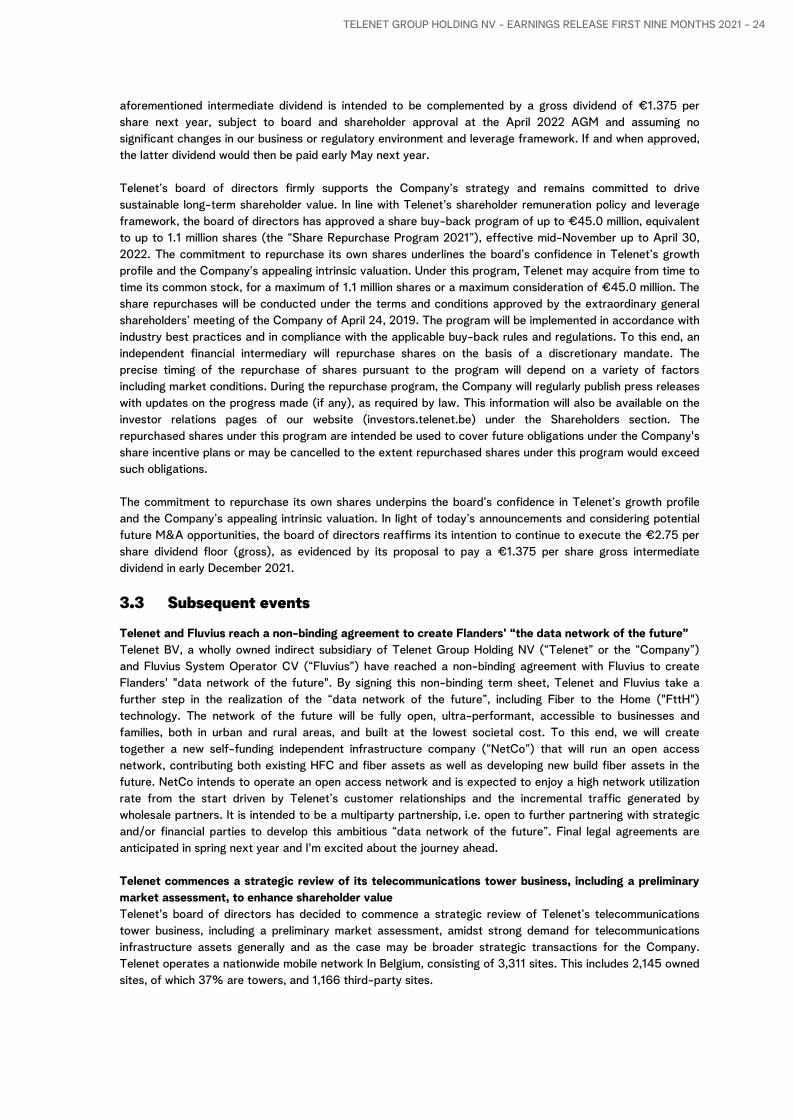
aforementioned intermediate dividend is intended to be complemented by a gross dividend of €1.375 per share next year, subject to board and shareholder approval at the April 2022 AGM and assuming no significant changes in our business or regulatory environment and leverage framework. If and when approved, the latter dividend would then be paid early May next year.
Telenet’s board of directors firmly supports the Company’s strategy and remains committed to drive sustainable long-term shareholder value. In line with Telenet’s shareholder remuneration policy and leverage framework, the board of directors has approved a share buy-back program of up to €45.0 million, equivalent to up to 1.1 million shares (the “Share Repurchase Program 2021”), effective mid-November up to April 30, 2022. The commitment to repurchase its own shares underlines the board’s confidence in Telenet’s growth profile and the Company’s appealing intrinsic valuation. Under this program, Telenet may acquire from time to time its common stock, for a maximum of 1.1 million shares or a maximum consideration of €45.0 million. The share repurchases will be conducted under the terms and conditions approved by the extraordinary general shareholders’ meeting of the Company of April 24, 2019. The program will be implemented in accordance with industry best practices and in compliance with the applicable buy-back rules and regulations. To this end, an independent financial intermediary will repurchase shares on the basis of a discretionary mandate. The precise timing of the repurchase of shares pursuant to the program will depend on a variety of factors including market conditions. During the repurchase program, the Company will regularly publish press releases with updates on the progress made (if any), as required by law. This information will also be available on the investor relations pages of our website (investors.telenet.be) under the Shareholders section. The repurchased shares under this program are intended be used to cover future obligations under the Company's share incentive plans or may be cancelled to the extent repurchased shares under this program would exceed such obligations.
The commitment to repurchase its own shares underpins the board’s confidence in Telenet’s growth profile and the Company’s appealing intrinsic valuation. In light of today’s announcements and considering potential future M&A opportunities, the board of directors reaffirms its intention to continue to execute the €2.75 per share dividend floor (gross), as evidenced by its proposal to pay a €1.375 per share gross intermediate dividend in early December 2021.
3.3 Subsequent events
Telenet and Fluvius reach a non-binding agreement to create Flanders' “the data network of the future”Telenet BV, a wholly owned indirect subsidiary of Telenet Group Holding NV (“Telenet” or the “Company”) and Fluvius System Operator CV (“Fluvius”) have reached a non-binding agreement with Fluvius to create Flanders' "data network of the future". By signing this non-binding term sheet, Telenet and Fluvius take a further step in the realization of the “data network of the future”, including Fiber to the Home ("FttH") technology. The network of the future will be fully open, ultra-performant, accessible to businesses and families, both in urban and rural areas, and built at the lowest societal cost. To this end, we will create together a new self-funding independent infrastructure company (“NetCo”) that will run an open access network, contributing both existing HFC and fiber assets as well as developing new build fiber assets in the future. NetCo intends to operate an open access network and is expected to enjoy a high network utilization rate from the start driven by Telenet’s customer relationships and the incremental traffic generated by wholesale partners. It is intended to be a multiparty partnership, i.e. open to further partnering with strategic and/or financial parties to develop this ambitious “data network of the future”. Final legal agreements are anticipated in spring next year and I'm excited about the journey ahead.
Telenet commences a strategic review of its telecommunications tower business, including a preliminary market assessment, to enhance shareholder valueTelenet's board of directors has decided to commence a strategic review of Telenet’s telecommunications tower business, including a preliminary market assessment, amidst strong demand for telecommunications infrastructure assets generally and as the case may be broader strategic transactions for the Company. Telenet operates a nationwide mobile network In Belgium, consisting of 3,311 sites. This includes 2,145 owned sites, of which 37% are towers, and 1,166 third-party sites.
TELENET GROUP HOLDING NV - EARNINGS RELEASE FIRST NINE MONTHS 2021 - 24
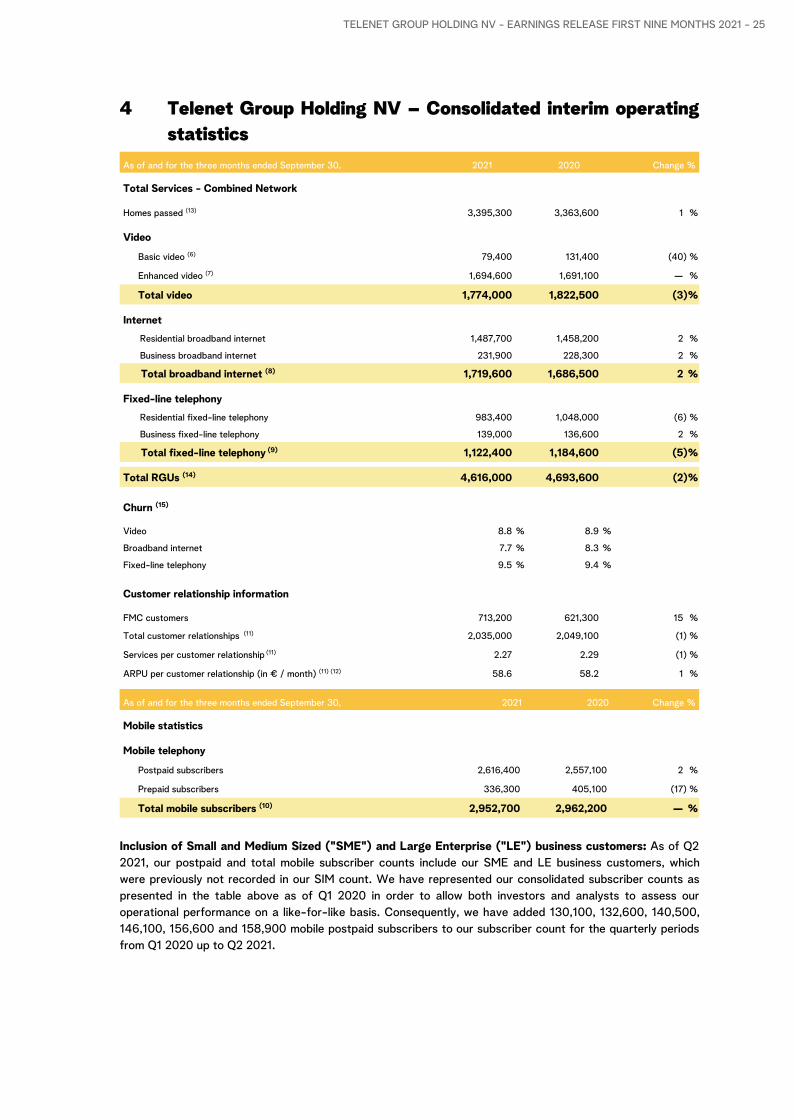
4 Telenet Group Holding NV – Consolidated interim operating statistics
As of and for the three months ended September 30, 2021 2020 Change %
Total Services - Combined Network
Homes passed (13) 3,395,300 3,363,600 1 %
Video
Basic video (6) 79,400 131,400 (40) %
Enhanced video (7) 1,694,600 1,691,100 — %
Total video 1,774,000 1,822,500 (3) %
Internet Residential broadband internet 1,487,700 1,458,200 2 %
Business broadband internet 231,900 228,300 2 %
Total broadband internet (8) 1,719,600 1,686,500 2 %
Fixed-line telephony Residential fixed-line telephony 983,400 1,048,000 (6) %
Business fixed-line telephony 139,000 136,600 2 %
Total fixed-line telephony (9) 1,122,400 1,184,600 (5) %
Total RGUs (14) 4,616,000 4,693,600 (2) %
Churn (15)
Video 8.8 % 8.9 %
Broadband internet 7.7 % 8.3 %
Fixed-line telephony 9.5 % 9.4 %
Customer relationship information
FMC customers 713,200 621,300 15 %
Total customer relationships (11) 2,035,000 2,049,100 (1) %
Services per customer relationship (11) 2.27 2.29 (1) %
ARPU per customer relationship (in € / month) (11) (12) 58.6 58.2 1 %
As of and for the three months ended September 30, 2021 2020 Change %
Mobile statistics
Mobile telephony
Postpaid subscribers 2,616,400 2,557,100 2 %
Prepaid subscribers 336,300 405,100 (17) %
Total mobile subscribers (10) 2,952,700 2,962,200 — %
Inclusion of Small and Medium Sized ("SME") and Large Enterprise ("LE") business customers: As of Q2 2021, our postpaid and total mobile subscriber counts include our SME and LE business customers, which were previously not recorded in our SIM count. We have represented our consolidated subscriber counts as presented in the table above as of Q1 2020 in order to allow both investors and analysts to assess our operational performance on a like-for-like basis. Consequently, we have added 130,100, 132,600, 140,500, 146,100, 156,600 and 158,900 mobile postpaid subscribers to our subscriber count for the quarterly periods from Q1 2020 up to Q2 2021.
TELENET GROUP HOLDING NV - EARNINGS RELEASE FIRST NINE MONTHS 2021 - 25
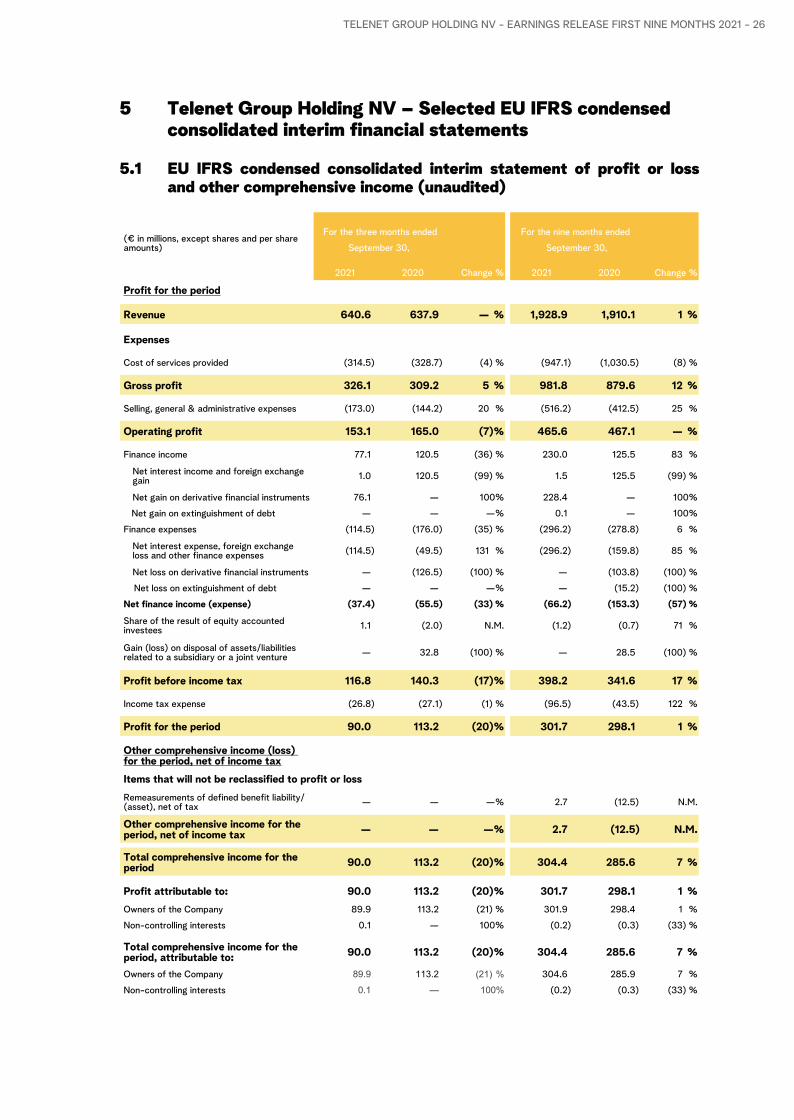
5 Telenet Group Holding NV – Selected EU IFRS condensed consolidated interim financial statements
5.1 EU IFRS condensed consolidated interim statement of profit or loss and other comprehensive income (unaudited)
(€ in millions, except shares and per share amounts)
For the three months ended For the nine months ended
September 30, September 30,
2021 2020 Change % 2021 2020 Change %
Profit for the period
Revenue 640.6 637.9 — % 1,928.9 1,910.1 1 %
Expenses
Cost of services provided (314.5) (328.7) (4) % (947.1) (1,030.5) (8) %
Gross profit 326.1 309.2 5 % 981.8 879.6 12 %
Selling, general & administrative expenses (173.0) (144.2) 20 % (516.2) (412.5) 25 %
Operating profit 153.1 165.0 (7) % 465.6 467.1 — %
Finance income 77.1 120.5 (36) % 230.0 125.5 83 %
Net interest income and foreign exchange gain 1.0 120.5 (99) % 1.5 125.5 (99) %
Net gain on derivative financial instruments 76.1 — 100% 228.4 — 100%
Net gain on extinguishment of debt — — —% 0.1 — 100%
Finance expenses (114.5) (176.0) (35) % (296.2) (278.8) 6 %
Net interest expense, foreign exchange loss and other finance expenses (114.5) (49.5) 131 % (296.2) (159.8) 85 %
Net loss on derivative financial instruments — (126.5) (100) % — (103.8) (100) %
Net loss on extinguishment of debt — — —% — (15.2) (100) %
Net finance income (expense) (37.4) (55.5) (33) % (66.2) (153.3) (57) %
Share of the result of equity accounted investees 1.1 (2.0) N.M. (1.2) (0.7) 71 %
Gain (loss) on disposal of assets/liabilities related to a subsidiary or a joint venture — 32.8 (100) % — 28.5 (100) %
Profit before income tax 116.8 140.3 (17) % 398.2 341.6 17 %
Income tax expense (26.8) (27.1) (1) % (96.5) (43.5) 122 %
Profit for the period 90.0 113.2 (20) % 301.7 298.1 1 %
Other comprehensive income (loss) for the period, net of income taxItems that will not be reclassified to profit or lossRemeasurements of defined benefit liability/(asset), net of tax — — —% 2.7 (12.5) N.M.
Other comprehensive income for the period, net of income tax — — —% 2.7 (12.5) N.M.
Total comprehensive income for the period 90.0 113.2 (20) % 304.4 285.6 7 %
Profit attributable to: 90.0 113.2 (20) % 301.7 298.1 1 %Owners of the Company 89.9 113.2 (21) % 301.9 298.4 1 %
Non-controlling interests 0.1 — 100% (0.2) (0.3) (33) %
Total comprehensive income for the period, attributable to: 90.0 113.2 (20) % 304.4 285.6 7 %
Owners of the Company 89.9 113.2 (21) % 304.6 285.9 7 %
Non-controlling interests 0.1 — 100% (0.2) (0.3) (33) %
TELENET GROUP HOLDING NV - EARNINGS RELEASE FIRST NINE MONTHS 2021 - 26
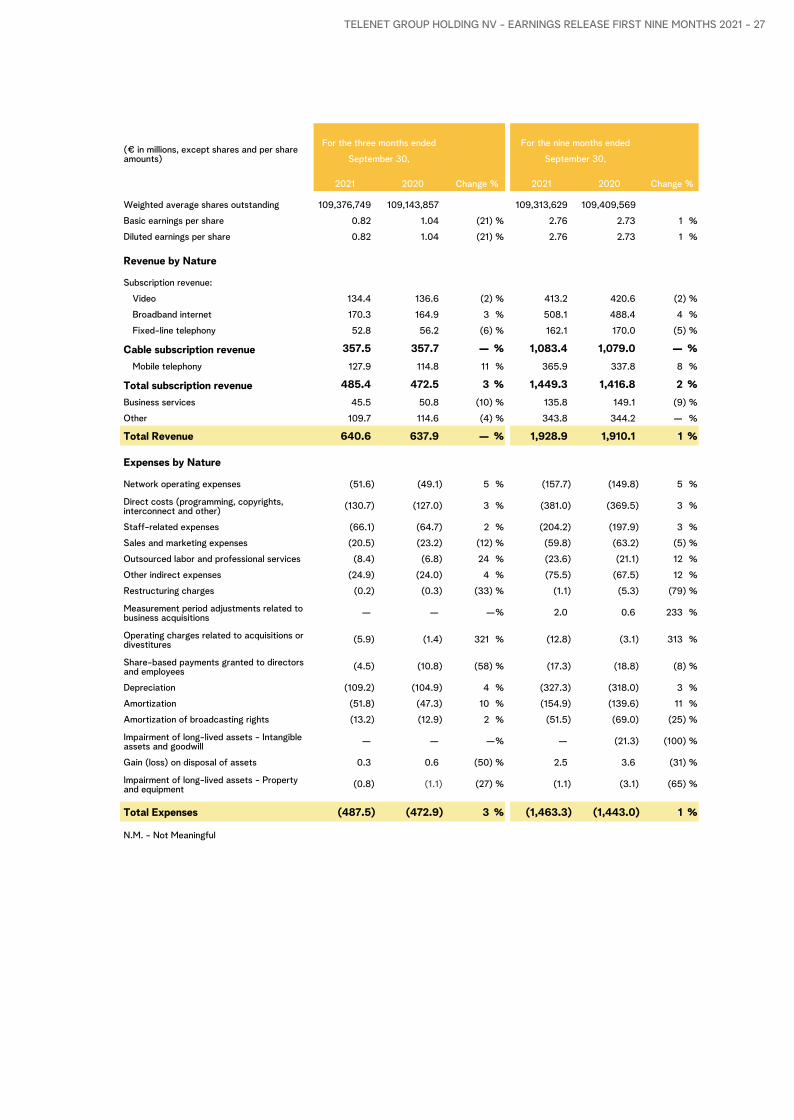
(€ in millions, except shares and per share amounts)
For the three months ended For the nine months ended
September 30, September 30,
2021 2020 Change % 2021 2020 Change %
Weighted average shares outstanding 109,376,749 109,143,857 109,313,629 109,409,569
Basic earnings per share 0.82 1.04 (21) % 2.76 2.73 1 %
Diluted earnings per share 0.82 1.04 (21) % 2.76 2.73 1 %
Revenue by Nature
Subscription revenue:
Video 134.4 136.6 (2) % 413.2 420.6 (2) %
Broadband internet 170.3 164.9 3 % 508.1 488.4 4 %
Fixed-line telephony 52.8 56.2 (6) % 162.1 170.0 (5) %
Cable subscription revenue 357.5 357.7 — % 1,083.4 1,079.0 — %Mobile telephony 127.9 114.8 11 % 365.9 337.8 8 %
Total subscription revenue 485.4 472.5 3 % 1,449.3 1,416.8 2 %Business services 45.5 50.8 (10) % 135.8 149.1 (9) %
Other 109.7 114.6 (4) % 343.8 344.2 — %
Total Revenue 640.6 637.9 — % 1,928.9 1,910.1 1 %
Expenses by Nature
Network operating expenses (51.6) (49.1) 5 % (157.7) (149.8) 5 %
Direct costs (programming, copyrights, interconnect and other) (130.7) (127.0) 3 % (381.0) (369.5) 3 %
Staff-related expenses (66.1) (64.7) 2 % (204.2) (197.9) 3 %
Sales and marketing expenses (20.5) (23.2) (12) % (59.8) (63.2) (5) %
Outsourced labor and professional services (8.4) (6.8) 24 % (23.6) (21.1) 12 %
Other indirect expenses (24.9) (24.0) 4 % (75.5) (67.5) 12 %
Restructuring charges (0.2) (0.3) (33) % (1.1) (5.3) (79) %
Measurement period adjustments related to business acquisitions — — —% 2.0 0.6 233 %
Operating charges related to acquisitions or divestitures (5.9) (1.4) 321 % (12.8) (3.1) 313 %
Share-based payments granted to directors and employees (4.5) (10.8) (58) % (17.3) (18.8) (8) %
Depreciation (109.2) (104.9) 4 % (327.3) (318.0) 3 %
Amortization (51.8) (47.3) 10 % (154.9) (139.6) 11 %
Amortization of broadcasting rights (13.2) (12.9) 2 % (51.5) (69.0) (25) %
Impairment of long-lived assets - Intangible assets and goodwill — — —% — (21.3) (100) %
Gain (loss) on disposal of assets 0.3 0.6 (50) % 2.5 3.6 (31) %
Impairment of long-lived assets - Property and equipment (0.8) (1.1) (27) % (1.1) (3.1) (65) %
Total Expenses (487.5) (472.9) 3 % (1,463.3) (1,443.0) 1 %
N.M. - Not Meaningful
TELENET GROUP HOLDING NV - EARNINGS RELEASE FIRST NINE MONTHS 2021 - 27
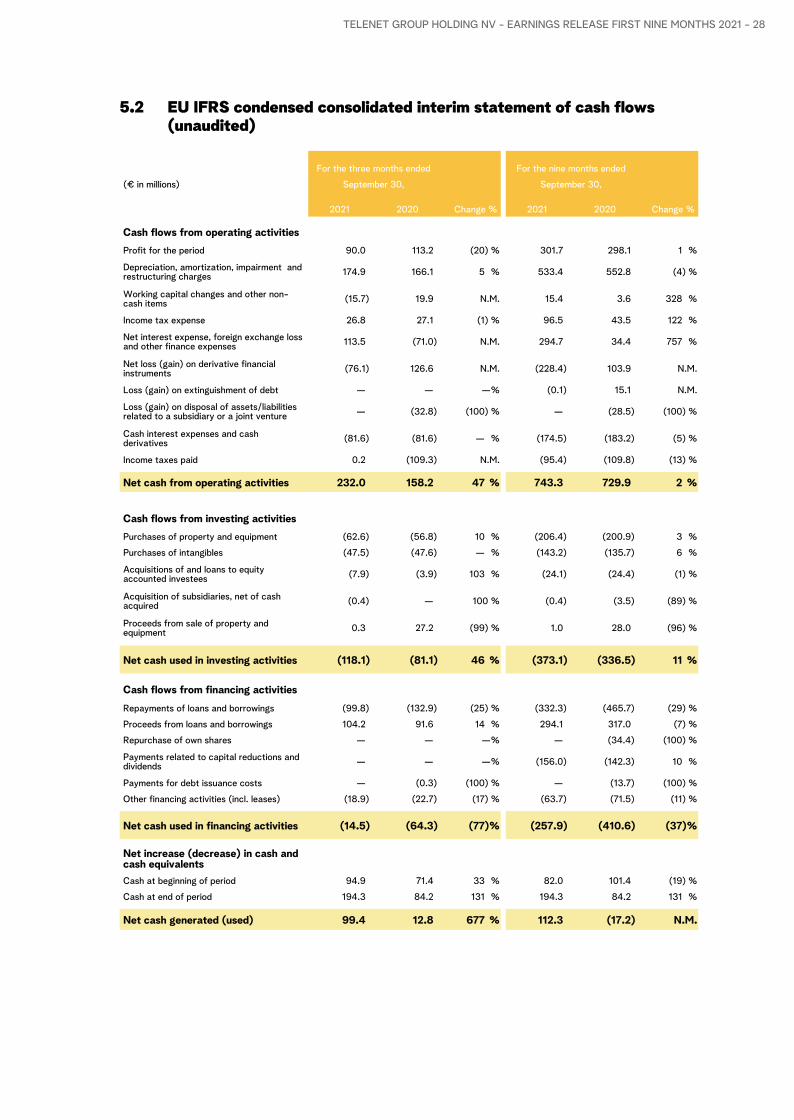
5.2 EU IFRS condensed consolidated interim statement of cash flows (unaudited)
(€ in millions)
For the three months ended For the nine months ended
September 30, September 30,
2021 2020 Change % 2021 2020 Change %
Cash flows from operating activitiesProfit for the period 90.0 113.2 (20) % 301.7 298.1 1 %
Depreciation, amortization, impairment and restructuring charges 174.9 166.1 5 % 533.4 552.8 (4) %
Working capital changes and other non-cash items (15.7) 19.9 N.M. 15.4 3.6 328 %
Income tax expense 26.8 27.1 (1) % 96.5 43.5 122 %
Net interest expense, foreign exchange loss and other finance expenses 113.5 (71.0) N.M. 294.7 34.4 757 %
Net loss (gain) on derivative financial instruments (76.1) 126.6 N.M. (228.4) 103.9 N.M.
Loss (gain) on extinguishment of debt — — —% (0.1) 15.1 N.M.
Loss (gain) on disposal of assets/liabilities related to a subsidiary or a joint venture — (32.8) (100) % — (28.5) (100) %
Cash interest expenses and cash derivatives (81.6) (81.6) — % (174.5) (183.2) (5) %
Income taxes paid 0.2 (109.3) N.M. (95.4) (109.8) (13) %
Net cash from operating activities 232.0 158.2 47 % 743.3 729.9 2 %
Cash flows from investing activitiesPurchases of property and equipment (62.6) (56.8) 10 % (206.4) (200.9) 3 %
Purchases of intangibles (47.5) (47.6) — % (143.2) (135.7) 6 %
Acquisitions of and loans to equity accounted investees (7.9) (3.9) 103 % (24.1) (24.4) (1) %
Acquisition of subsidiaries, net of cash acquired (0.4) — 100 % (0.4) (3.5) (89) %
Proceeds from sale of property and equipment 0.3 27.2 (99) % 1.0 28.0 (96) %
Net cash used in investing activities (118.1) (81.1) 46 % (373.1) (336.5) 11 %
Cash flows from financing activitiesRepayments of loans and borrowings (99.8) (132.9) (25) % (332.3) (465.7) (29) %
Proceeds from loans and borrowings 104.2 91.6 14 % 294.1 317.0 (7) %
Repurchase of own shares — — —% — (34.4) (100) %
Payments related to capital reductions and dividends — — —% (156.0) (142.3) 10 %
Payments for debt issuance costs — (0.3) (100) % — (13.7) (100) %
Other financing activities (incl. leases) (18.9) (22.7) (17) % (63.7) (71.5) (11) %
Net cash used in financing activities (14.5) (64.3) (77) % (257.9) (410.6) (37) %
Net increase (decrease) in cash and cash equivalentsCash at beginning of period 94.9 71.4 33 % 82.0 101.4 (19) %
Cash at end of period 194.3 84.2 131 % 194.3 84.2 131 %
Net cash generated (used) 99.4 12.8 677 % 112.3 (17.2) N.M.
TELENET GROUP HOLDING NV - EARNINGS RELEASE FIRST NINE MONTHS 2021 - 28
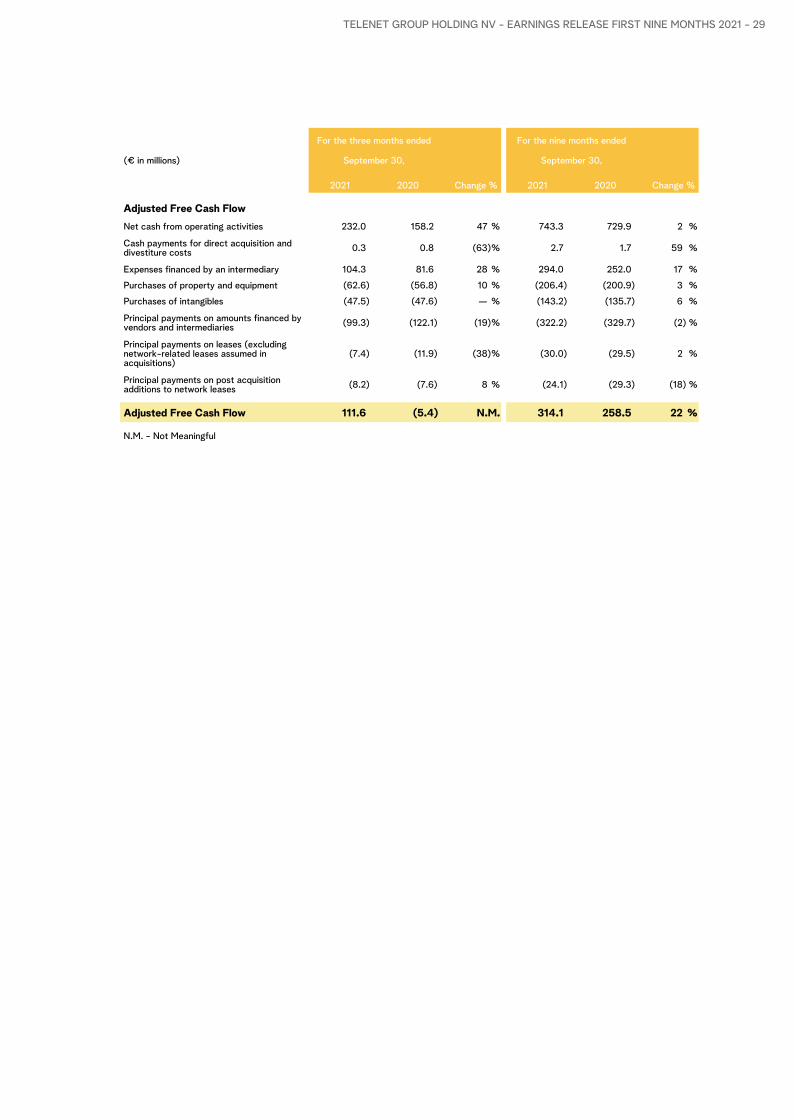
(€ in millions)
For the three months ended For the nine months ended
September 30, September 30,
2021 2020 Change % 2021 2020 Change %
Adjusted Free Cash FlowNet cash from operating activities 232.0 158.2 47 % 743.3 729.9 2 %
Cash payments for direct acquisition and divestiture costs 0.3 0.8 (63) % 2.7 1.7 59 %
Expenses financed by an intermediary 104.3 81.6 28 % 294.0 252.0 17 %
Purchases of property and equipment (62.6) (56.8) 10 % (206.4) (200.9) 3 %
Purchases of intangibles (47.5) (47.6) — % (143.2) (135.7) 6 %
Principal payments on amounts financed by vendors and intermediaries (99.3) (122.1) (19) % (322.2) (329.7) (2) %
Principal payments on leases (excluding network-related leases assumed in acquisitions)
(7.4) (11.9) (38) % (30.0) (29.5) 2 %
Principal payments on post acquisition additions to network leases (8.2) (7.6) 8 % (24.1) (29.3) (18) %
Adjusted Free Cash Flow 111.6 (5.4) N.M. 314.1 258.5 22 %
N.M. - Not Meaningful
TELENET GROUP HOLDING NV - EARNINGS RELEASE FIRST NINE MONTHS 2021 - 29
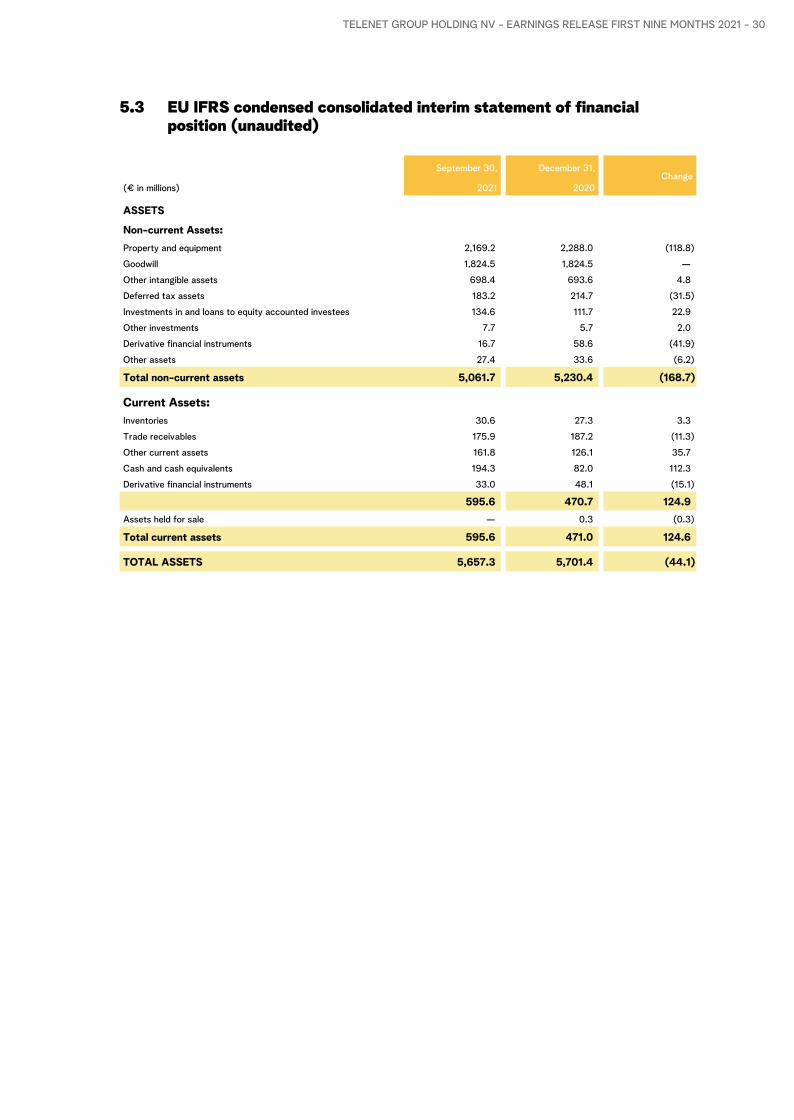
5.3 EU IFRS condensed consolidated interim statement of financial position (unaudited)
(€ in millions)
September 30, December 31,Change
2021 2020
ASSETS
Non-current Assets:Property and equipment 2,169.2 2,288.0 (118.8)
Goodwill 1,824.5 1,824.5 —
Other intangible assets 698.4 693.6 4.8
Deferred tax assets 183.2 214.7 (31.5)
Investments in and loans to equity accounted investees 134.6 111.7 22.9
Other investments 7.7 5.7 2.0
Derivative financial instruments 16.7 58.6 (41.9)
Other assets 27.4 33.6 (6.2)
Total non-current assets 5,061.7 5,230.4 (168.7)
Current Assets:Inventories 30.6 27.3 3.3
Trade receivables 175.9 187.2 (11.3)
Other current assets 161.8 126.1 35.7
Cash and cash equivalents 194.3 82.0 112.3
Derivative financial instruments 33.0 48.1 (15.1)
595.6 470.7 124.9 Assets held for sale — 0.3 (0.3)
Total current assets 595.6 471.0 124.6
TOTAL ASSETS 5,657.3 5,701.4 (44.1)
TELENET GROUP HOLDING NV - EARNINGS RELEASE FIRST NINE MONTHS 2021 - 30
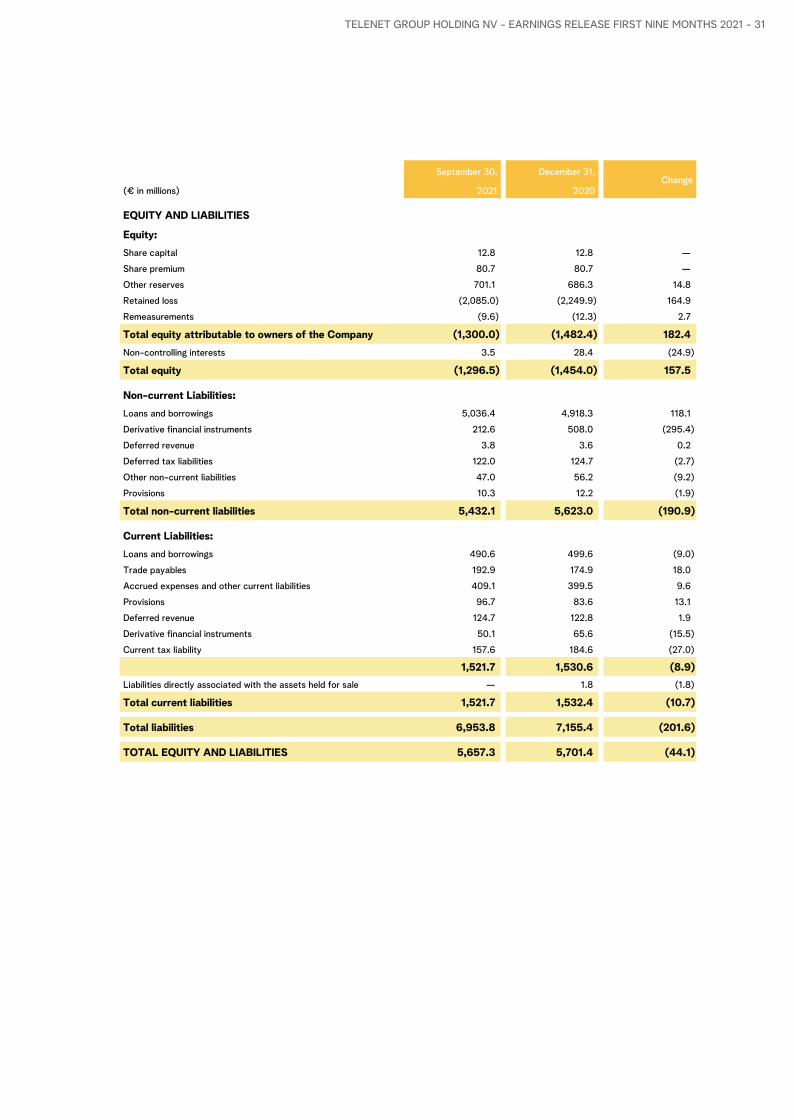
(€ in millions)
September 30, December 31,Change
2021 2020
EQUITY AND LIABILITIES
Equity:Share capital 12.8 12.8 —
Share premium 80.7 80.7 —
Other reserves 701.1 686.3 14.8
Retained loss (2,085.0) (2,249.9) 164.9
Remeasurements (9.6) (12.3) 2.7
Total equity attributable to owners of the Company (1,300.0) (1,482.4) 182.4 Non-controlling interests 3.5 28.4 (24.9)
Total equity (1,296.5) (1,454.0) 157.5
Non-current Liabilities:Loans and borrowings 5,036.4 4,918.3 118.1
Derivative financial instruments 212.6 508.0 (295.4)
Deferred revenue 3.8 3.6 0.2
Deferred tax liabilities 122.0 124.7 (2.7)
Other non-current liabilities 47.0 56.2 (9.2)
Provisions 10.3 12.2 (1.9)
Total non-current liabilities 5,432.1 5,623.0 (190.9)
Current Liabilities:Loans and borrowings 490.6 499.6 (9.0)
Trade payables 192.9 174.9 18.0
Accrued expenses and other current liabilities 409.1 399.5 9.6
Provisions 96.7 83.6 13.1
Deferred revenue 124.7 122.8 1.9
Derivative financial instruments 50.1 65.6 (15.5)
Current tax liability 157.6 184.6 (27.0)
1,521.7 1,530.6 (8.9) Liabilities directly associated with the assets held for sale — 1.8 (1.8)
Total current liabilities 1,521.7 1,532.4 (10.7)
Total liabilities 6,953.8 7,155.4 (201.6)
TOTAL EQUITY AND LIABILITIES 5,657.3 5,701.4 (44.1)
TELENET GROUP HOLDING NV - EARNINGS RELEASE FIRST NINE MONTHS 2021 - 31
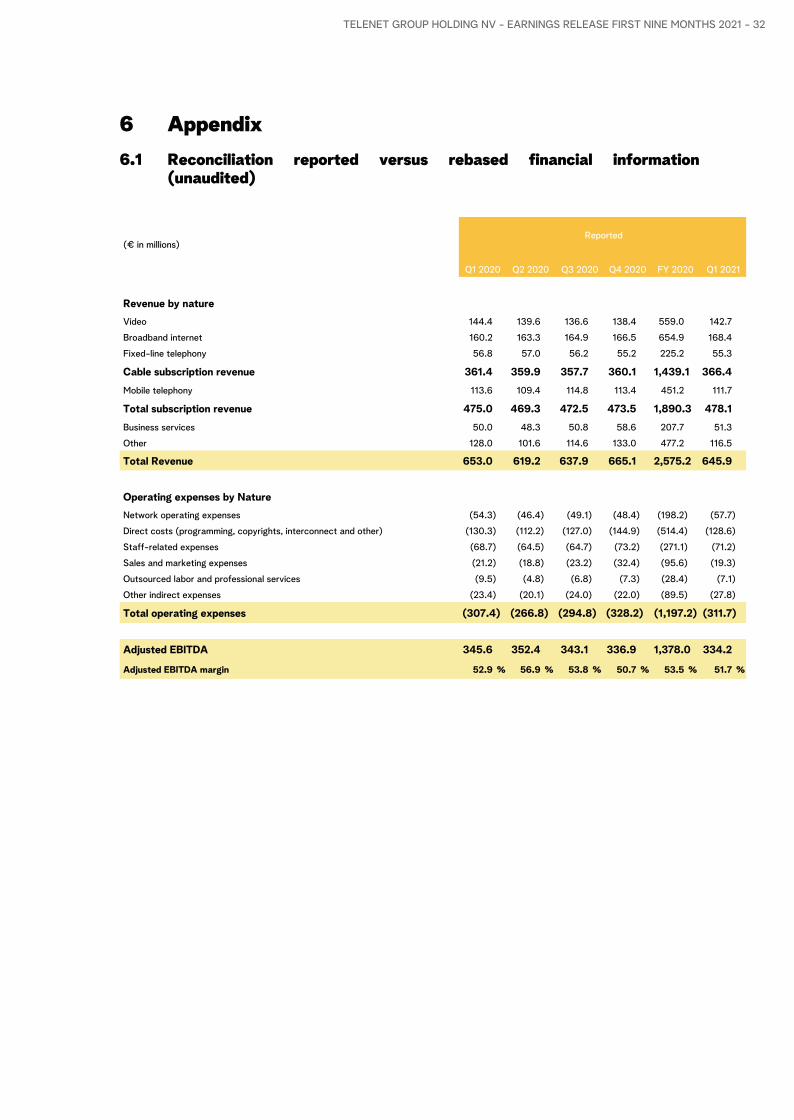
6 Appendix6.1 Reconciliation reported versus rebased financial information
(unaudited)
(€ in millions)Reported
Q1 2020 Q2 2020 Q3 2020 Q4 2020 FY 2020 Q1 2021
Revenue by natureVideo 144.4 139.6 136.6 138.4 559.0 142.7
Broadband internet 160.2 163.3 164.9 166.5 654.9 168.4
Fixed-line telephony 56.8 57.0 56.2 55.2 225.2 55.3
Cable subscription revenue 361.4 359.9 357.7 360.1 1,439.1 366.4 Mobile telephony 113.6 109.4 114.8 113.4 451.2 111.7
Total subscription revenue 475.0 469.3 472.5 473.5 1,890.3 478.1 Business services 50.0 48.3 50.8 58.6 207.7 51.3
Other 128.0 101.6 114.6 133.0 477.2 116.5
Total Revenue 653.0 619.2 637.9 665.1 2,575.2 645.9
Operating expenses by NatureNetwork operating expenses (54.3) (46.4) (49.1) (48.4) (198.2) (57.7)
Direct costs (programming, copyrights, interconnect and other) (130.3) (112.2) (127.0) (144.9) (514.4) (128.6)
Staff-related expenses (68.7) (64.5) (64.7) (73.2) (271.1) (71.2)
Sales and marketing expenses (21.2) (18.8) (23.2) (32.4) (95.6) (19.3)
Outsourced labor and professional services (9.5) (4.8) (6.8) (7.3) (28.4) (7.1)
Other indirect expenses (23.4) (20.1) (24.0) (22.0) (89.5) (27.8)
Total operating expenses (307.4) (266.8) (294.8) (328.2) (1,197.2) (311.7)
Adjusted EBITDA 345.6 352.4 343.1 336.9 1,378.0 334.2
Adjusted EBITDA margin 52.9 % 56.9 % 53.8 % 50.7 % 53.5 % 51.7 %
TELENET GROUP HOLDING NV - EARNINGS RELEASE FIRST NINE MONTHS 2021 - 32
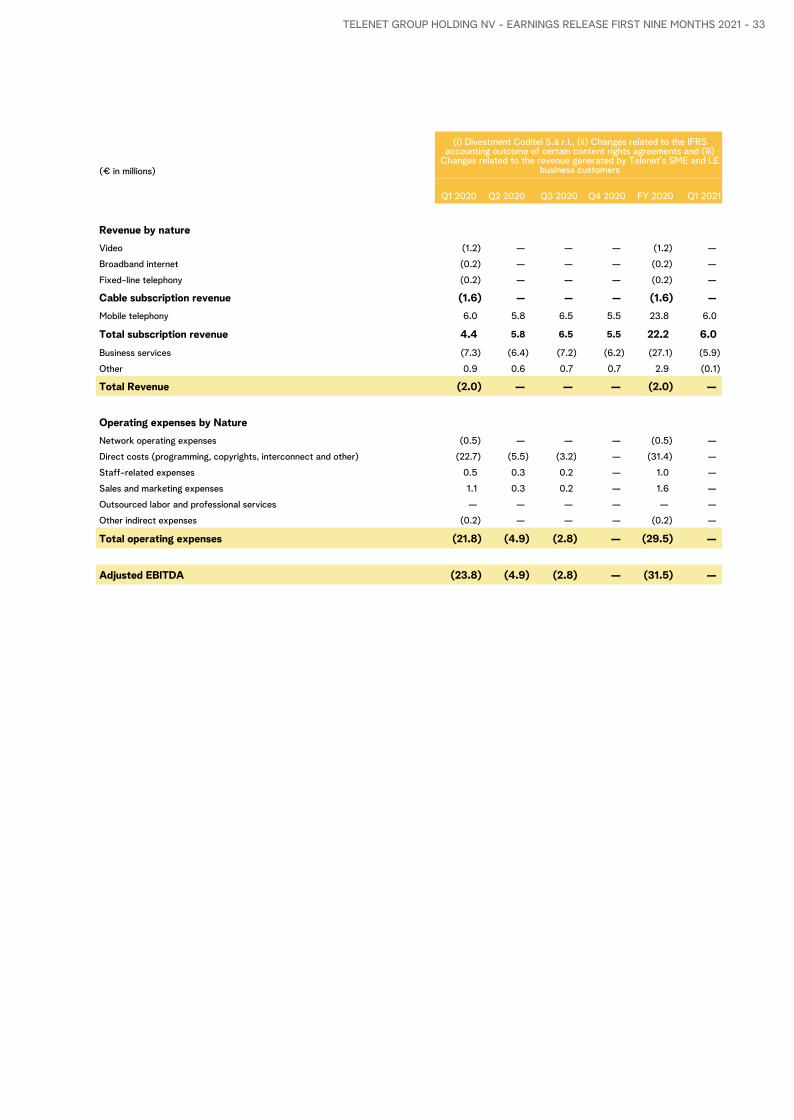
(€ in millions)
(i) Divestment Coditel S.à r.l., (ii) Changes related to the IFRS accounting outcome of certain content rights agreements and (iii)
Changes related to the revenue generated by Telenet's SME and LE business customers
Q1 2020 Q2 2020 Q3 2020 Q4 2020 FY 2020 Q1 2021
Revenue by natureVideo (1.2) — — — (1.2) —
Broadband internet (0.2) — — — (0.2) —
Fixed-line telephony (0.2) — — — (0.2) —
Cable subscription revenue (1.6) — — — (1.6) —
Mobile telephony 6.0 5.8 6.5 5.5 23.8 6.0
Total subscription revenue 4.4 5.8 6.5 5.5 22.2 6.0 Business services (7.3) (6.4) (7.2) (6.2) (27.1) (5.9)
Other 0.9 0.6 0.7 0.7 2.9 (0.1)
Total Revenue (2.0) — — — (2.0) —
Operating expenses by NatureNetwork operating expenses (0.5) — — — (0.5) —
Direct costs (programming, copyrights, interconnect and other) (22.7) (5.5) (3.2) — (31.4) —
Staff-related expenses 0.5 0.3 0.2 — 1.0 —
Sales and marketing expenses 1.1 0.3 0.2 — 1.6 —
Outsourced labor and professional services — — — — — —
Other indirect expenses (0.2) — — — (0.2) —
Total operating expenses (21.8) (4.9) (2.8) — (29.5) —
Adjusted EBITDA (23.8) (4.9) (2.8) — (31.5) —
TELENET GROUP HOLDING NV - EARNINGS RELEASE FIRST NINE MONTHS 2021 - 33
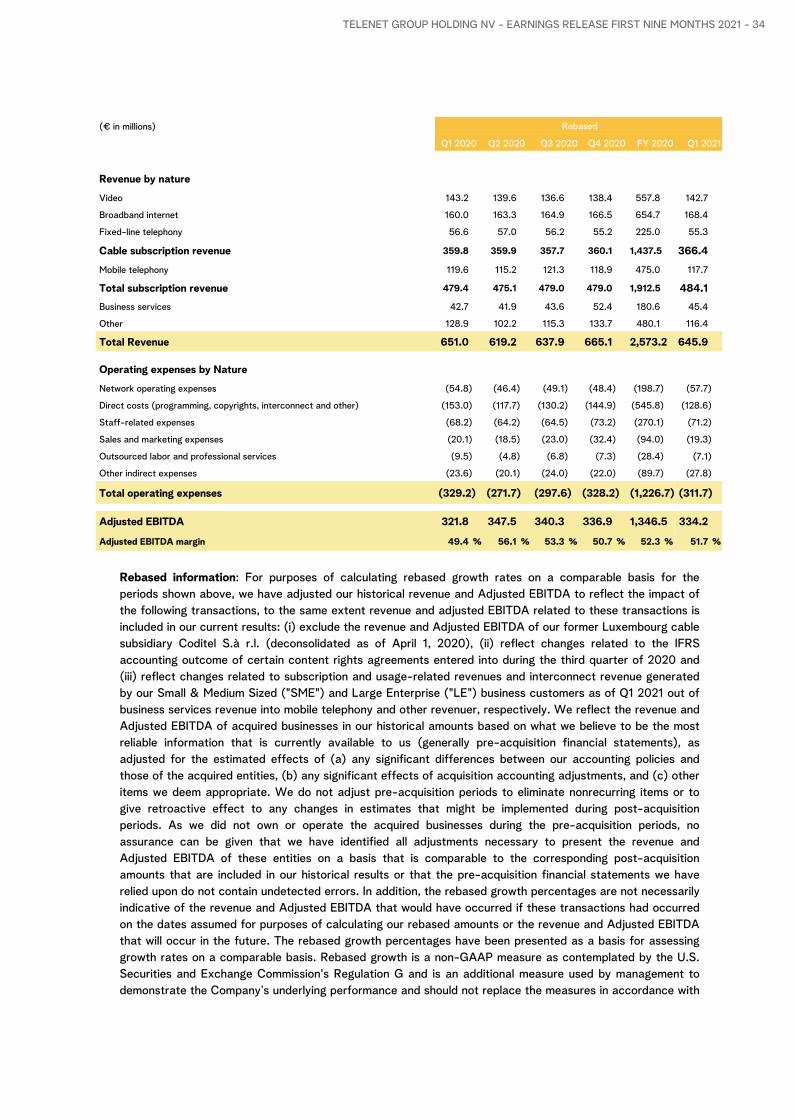
(€ in millions) Rebased
Q1 2020 Q2 2020 Q3 2020 Q4 2020 FY 2020 Q1 2021
Revenue by nature
Video 143.2 139.6 136.6 138.4 557.8 142.7
Broadband internet 160.0 163.3 164.9 166.5 654.7 168.4
Fixed-line telephony 56.6 57.0 56.2 55.2 225.0 55.3
Cable subscription revenue 359.8 359.9 357.7 360.1 1,437.5 366.4
Mobile telephony 119.6 115.2 121.3 118.9 475.0 117.7
Total subscription revenue 479.4 475.1 479.0 479.0 1,912.5 484.1 Business services 42.7 41.9 43.6 52.4 180.6 45.4
Other 128.9 102.2 115.3 133.7 480.1 116.4
Total Revenue 651.0 619.2 637.9 665.1 2,573.2 645.9
Operating expenses by Nature
Network operating expenses (54.8) (46.4) (49.1) (48.4) (198.7) (57.7)
Direct costs (programming, copyrights, interconnect and other) (153.0) (117.7) (130.2) (144.9) (545.8) (128.6)
Staff-related expenses (68.2) (64.2) (64.5) (73.2) (270.1) (71.2)
Sales and marketing expenses (20.1) (18.5) (23.0) (32.4) (94.0) (19.3)
Outsourced labor and professional services (9.5) (4.8) (6.8) (7.3) (28.4) (7.1)
Other indirect expenses (23.6) (20.1) (24.0) (22.0) (89.7) (27.8)
Total operating expenses (329.2) (271.7) (297.6) (328.2) (1,226.7) (311.7)
Adjusted EBITDA 321.8 347.5 340.3 336.9 1,346.5 334.2
Adjusted EBITDA margin 49.4 % 56.1 % 53.3 % 50.7 % 52.3 % 51.7 %
Rebased information: For purposes of calculating rebased growth rates on a comparable basis for the periods shown above, we have adjusted our historical revenue and Adjusted EBITDA to reflect the impact of the following transactions, to the same extent revenue and adjusted EBITDA related to these transactions is included in our current results: (i) exclude the revenue and Adjusted EBITDA of our former Luxembourg cable subsidiary Coditel S.à r.l. (deconsolidated as of April 1, 2020), (ii) reflect changes related to the IFRS accounting outcome of certain content rights agreements entered into during the third quarter of 2020 and (iii) reflect changes related to subscription and usage-related revenues and interconnect revenue generated by our Small & Medium Sized ("SME") and Large Enterprise ("LE") business customers as of Q1 2021 out of business services revenue into mobile telephony and other revenuer, respectively. We reflect the revenue and Adjusted EBITDA of acquired businesses in our historical amounts based on what we believe to be the most reliable information that is currently available to us (generally pre-acquisition financial statements), as adjusted for the estimated effects of (a) any significant differences between our accounting policies and those of the acquired entities, (b) any significant effects of acquisition accounting adjustments, and (c) other items we deem appropriate. We do not adjust pre-acquisition periods to eliminate nonrecurring items or to give retroactive effect to any changes in estimates that might be implemented during post-acquisition periods. As we did not own or operate the acquired businesses during the pre-acquisition periods, no assurance can be given that we have identified all adjustments necessary to present the revenue and Adjusted EBITDA of these entities on a basis that is comparable to the corresponding post-acquisition amounts that are included in our historical results or that the pre-acquisition financial statements we have relied upon do not contain undetected errors. In addition, the rebased growth percentages are not necessarily indicative of the revenue and Adjusted EBITDA that would have occurred if these transactions had occurred on the dates assumed for purposes of calculating our rebased amounts or the revenue and Adjusted EBITDA that will occur in the future. The rebased growth percentages have been presented as a basis for assessing growth rates on a comparable basis. Rebased growth is a non-GAAP measure as contemplated by the U.S. Securities and Exchange Commission's Regulation G and is an additional measure used by management to demonstrate the Company’s underlying performance and should not replace the measures in accordance with
TELENET GROUP HOLDING NV - EARNINGS RELEASE FIRST NINE MONTHS 2021 - 34

EU IFRS as an indicator of the Company’s performance, but rather should be used in conjunction with the most directly comparable EU IFRS measure.
TELENET GROUP HOLDING NV - EARNINGS RELEASE FIRST NINE MONTHS 2021 - 35
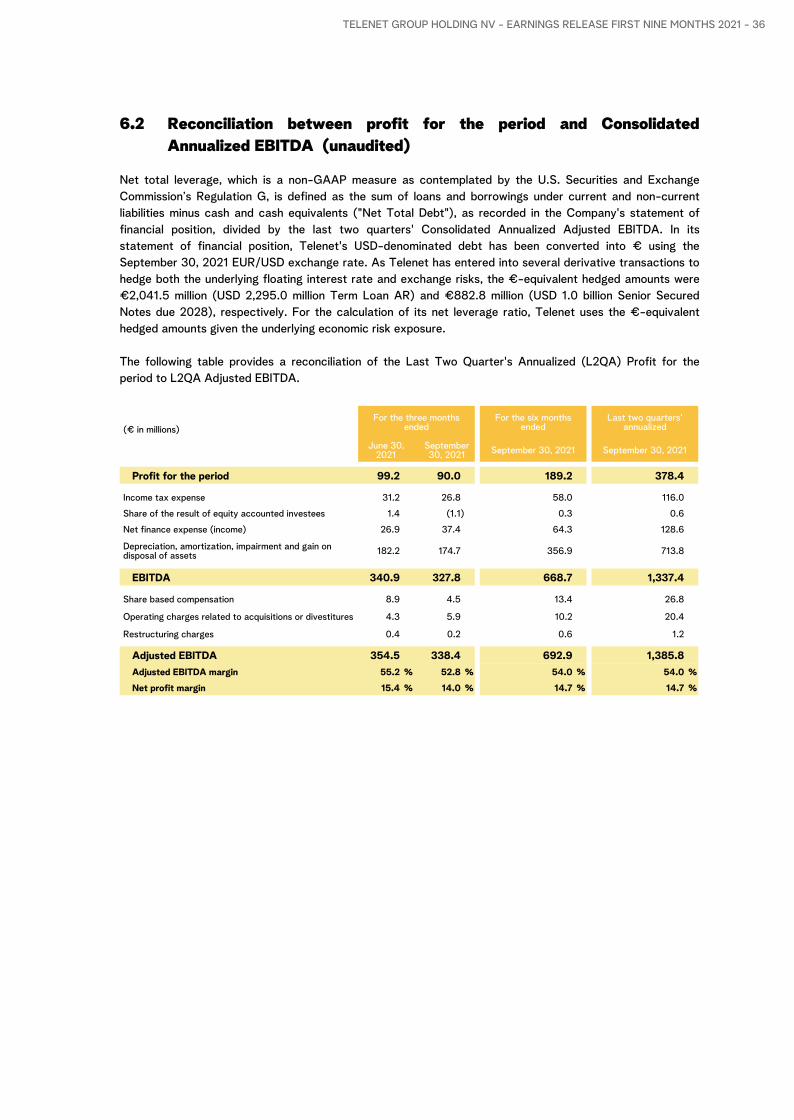
6.2 Reconciliation between profit for the period and Consolidated Annualized EBITDA (unaudited)
Net total leverage, which is a non-GAAP measure as contemplated by the U.S. Securities and Exchange Commission’s Regulation G, is defined as the sum of loans and borrowings under current and non-current liabilities minus cash and cash equivalents ("Net Total Debt"), as recorded in the Company's statement of financial position, divided by the last two quarters' Consolidated Annualized Adjusted EBITDA. In its statement of financial position, Telenet's USD-denominated debt has been converted into € using the September 30, 2021 EUR/USD exchange rate. As Telenet has entered into several derivative transactions to hedge both the underlying floating interest rate and exchange risks, the €-equivalent hedged amounts were €2,041.5 million (USD 2,295.0 million Term Loan AR) and €882.8 million (USD 1.0 billion Senior Secured Notes due 2028), respectively. For the calculation of its net leverage ratio, Telenet uses the €-equivalent hedged amounts given the underlying economic risk exposure.
The following table provides a reconciliation of the Last Two Quarter's Annualized (L2QA) Profit for the period to L2QA Adjusted EBITDA.
(€ in millions)For the three months
endedFor the six months
endedLast two quarters'
annualized
June 30, 2021
September 30, 2021 September 30, 2021 September 30, 2021
Profit for the period 99.2 90.0 189.2 378.4
Income tax expense 31.2 26.8 58.0 116.0
Share of the result of equity accounted investees 1.4 (1.1) 0.3 0.6
Net finance expense (income) 26.9 37.4 64.3 128.6
Depreciation, amortization, impairment and gain on disposal of assets 182.2 174.7 356.9 713.8
EBITDA 340.9 327.8 668.7 1,337.4
Share based compensation 8.9 4.5 13.4 26.8
Operating charges related to acquisitions or divestitures 4.3 5.9 10.2 20.4
Restructuring charges 0.4 0.2 0.6 1.2
Adjusted EBITDA 354.5 338.4 692.9 1,385.8 Adjusted EBITDA margin 55.2 % 52.8 % 54.0 % 54.0 %
Net profit margin 15.4 % 14.0 % 14.7 % 14.7 %
TELENET GROUP HOLDING NV - EARNINGS RELEASE FIRST NINE MONTHS 2021 - 36
6.3 Definitions
(1) Rebased information: For purposes of calculating rebased growth rates on a comparable basis, we have adjusted our historical revenue and Adjusted EBITDA to reflect the impact of the following transactions, to the same extent revenue and adjusted EBITDA related to these transactions is included in our current results: (i) exclude the revenue and Adjusted EBITDA of our former Luxembourg cable subsidiary Coditel S.à r.l. (deconsolidated as of April 1, 2020), (ii) reflect changes related to the IFRS accounting outcome of certain content rights agreements entered into during the third quarter of 2020 and (iii) reflect changes related to subscription and usage-related revenues and interconnect revenue generated by our Small & Medium Sized ("SME") and Large Enterprise ("LE") business customers as of Q1 2021 out of business services revenue into mobile telephony and other revenue, respectively. We reflect the revenue and Adjusted EBITDA of acquired businesses in our historical amounts based on what we believe to be the most reliable information that is currently available to us (generally pre-acquisition financial statements), as adjusted for the estimated effects of (a) any significant differences between our accounting policies and those of the acquired entities, (b) any significant effects of acquisition accounting adjustments, and (c) other items we deem appropriate. We do not adjust pre-acquisition periods to eliminate nonrecurring items or to give retroactive effect to any changes in estimates that might be implemented during post-acquisition periods. As we did not own or operate the acquired businesses during the pre-acquisition periods, no assurance can be given that we have identified all adjustments necessary to present the revenue and Adjusted EBITDA of these entities on a basis that is comparable to the corresponding post-acquisition amounts that are included in our historical results or that the pre-acquisition financial statements we have relied upon do not contain undetected errors. In addition, the rebased growth percentages are not necessarily indicative of the revenue and Adjusted EBITDA that would have occurred if these transactions had occurred on the dates assumed for purposes of calculating our rebased amounts or the revenue and Adjusted EBITDA that will occur in the future. The rebased growth percentages have been presented as a basis for assessing growth rates on a comparable basis. Rebased growth is a non-GAAP measure as contemplated by the U.S. Securities and Exchange Commission's Regulation G and is an additional measure used by management to demonstrate the Company’s underlying performance and should not replace the measures in accordance with EU IFRS as an indicator of the Company’s performance, but rather should be used in conjunction with the most directly comparable EU IFRS measure.
(2) EBITDA is defined as profit before net finance expense, the share of the result of equity accounted investees, income taxes, depreciation, amortization and impairment. Adjusted EBITDA is defined as EBITDA before stock-based compensation, measurement period adjustments related to business acquisitions and restructuring charges, and before operating charges or credits related to successful or unsuccessful acquisitions or divestitures. Operating charges or credits related to acquisitions or divestitures include (i) gains and losses on the disposition of long-lived assets, (ii) due diligence, legal, advisory and other third-party costs directly related to the Company’s efforts to acquire or divest controlling interests in businesses, and (iii) other acquisition-related items, such as gains and losses on the settlement of contingent consideration. Adjusted EBITDA is a non-GAAP measure as contemplated by the U.S. Securities and Exchange Commission’s Regulation G and represents an additional measure used by management to demonstrate the Company’s underlying performance and should not replace the measures in accordance with EU IFRS as an indicator of the Company’s performance, but rather should be used in conjunction with the most directly comparable EU IFRS measure. A reconciliation of this measure to the most directly comparable EU IFRS measure is disclosed in Exhibit 1 on page 15.
(3) Accrued capital expenditures are defined as additions to property, equipment and intangible assets, including additions from leases and other financing arrangements, as reported in the Company’s consolidated statement of financial position on an accrued basis.
(4) Adjusted EBITDA less property & equipment additions (formerly referred to as Operating Free Cash Flow (“OFCF”)) is defined as Adjusted EBITDA minus accrued capital expenditures as reported in the Company’s consolidated financial statements. Accrued capital expenditures exclude the recognition of football broadcasting rights and mobile spectrum licenses. Adjusted EBITDA less property & equipment additions is a non-GAAP measure as contemplated by the U.S. Securities and Exchange Commission’s Regulation G and represents an additional measure used by management to demonstrate the Company’s underlying performance and should not replace the measures in accordance with EU IFRS as an indicator of the Company’s performance, but rather should be used in conjunction with the most directly comparable EU IFRS measure.
(5) Adjusted Free Cash Flow is defined as net cash provided by the Company’s operating activities, plus (i) cash payments for third-party costs directly associated with successful and unsuccessful acquisitions and divestitures and (ii) expenses financed by an intermediary, less (i) purchases of property and equipment and purchases of intangibles as reported in the Company's consolidated statement of cash flows, (ii) principal payments on amounts financed by vendors and intermediaries, (iii) principal payments on leases (exclusive of network-related leases that were assumed in acquisitions), and (iv) principal payments on post acquisition additions to network leases, each as reported in the Company’s consolidated statement of cash flows. Adjusted Free Cash Flow is a non-GAAP measure as contemplated by the U.S. Securities and Exchange Commission's Regulation G and is an additional measure used by management to demonstrate the Company’s ability to service debt and fund new investment opportunities and should not replace the measures in accordance with EU IFRS as an indicator of the Company’s performance, but rather should be used in conjunction with the most directly comparable EU IFRS measure.
(6) Basic Video Subscriber is a home, residential multiple dwelling unit or commercial unit that receives Telenet's video service over the Combined Network either via an analog video signal or via a digital video signal without subscribing to any recurring monthly service that requires the use of encryption-enabling technology. Encryption-enabling technology includes smart cards, or other integrated or virtual technologies that Telenet uses to provide its enhanced service offerings. Telenet counts Revenue Generating Unites (“RGUs”) on a unique premises basis. In other words, a subscriber with multiple outlets in one premise is counted as one RGU and a subscriber with two homes and a subscription to Telenet's video service at each home is counted as two RGUs.
TELENET GROUP HOLDING NV - EARNINGS RELEASE FIRST NINE MONTHS 2021 - 37
(7) Enhanced Video Subscriber is a home, residential multiple dwelling unit or commercial unit that receives Telenet's video service over the Combined Network via a digital video signal while subscribing to any recurring monthly service that requires the use of encryption-enabling technology. Enhanced Video Subscribers are counted on a unique premises basis. For example, a subscriber with one or more set-top boxes that receives Telenet's video service in one premise is generally counted as just one subscriber. An Enhanced Video Subscriber is not counted as a Basic Video Subscriber. As Telenet migrates customers from basic to enhanced video services, Telenet reports a decrease in its Basic Video Subscribers equal to the increase in Telenet's Enhanced Video Subscribers.
(8) Internet Subscriber is a home, residential multiple dwelling unit or commercial unit that receives internet services over the Combined Network.
(9) Fixed-line Telephony Subscriber is a home, residential multiple dwelling unit or commercial unit that receives fixed-line voice services over the Combined Network. Fixed-line telephony Subscribers exclude mobile telephony subscribers.
(10) Telenet's mobile subscriber count represents the number of active subscriber identification module (“SIM”) cards in service rather than services provided. For example, if a mobile subscriber has both a data and voice plan on a smartphone this would equate to one mobile subscriber. Alternatively, a subscriber who has a voice and data plan for a mobile handset and a data plan for a laptop (via a dongle) would be counted as two mobile subscribers. Customers who do not pay a recurring monthly fee are excluded from Telenet's mobile telephony subscriber counts after a 90-day inactivity period.
(11) Customer Relationships are the number of customers who receive at least one of Telenet's video, internet or telephony services that Telenet counts as RGUs, without regard to which or to how many services they subscribe. Customer Relationships generally are counted on a unique premises basis. Accordingly, if an individual receives Telenet's services in two premises (e.g. a primary home and a vacation home), that individual generally will count as two Customer Relationships. Telenet excludes mobile-only customers from Customer Relationships.
(12) Average Revenue Per Unit (“ARPU”) refers to the average monthly subscription revenue per average customer relationship and is calculated by dividing the average monthly subscription revenue (excluding mobile services, Business-to-Business ("B2B") services, interconnect, channel carriage fees, mobile handset sales and installation fees) for the indicated period, by the average of the opening and closing balances for customer relationships for the period.
(13) Homes Passed are homes, residential multiple dwelling units or commercial units that can be connected to the Combined Network without materially extending the distribution plant. Telenet's Homes Passed counts are based on census data that can change based on either revisions to the data or from new census results.
(14) RGU is separately a Basic Video Subscriber, Enhanced Video Subscriber, Internet Subscriber or Fixed-line Telephony Subscriber. A home, residential multiple dwelling unit, or commercial unit may contain one or more RGUs. For example, if a residential customer subscribed to Telenet's enhanced video service, fixed-line telephony service and broadband internet service, the customer would constitute three RGUs. Total RGUs is the sum of Basic Video, Enhanced Video, Internet and Fixed-line Telephony Subscribers. RGUs generally are counted on a unique premises basis such that a given premises does not count as more than one RGU for any given service. On the other hand, if an individual receives one of Telenet's services in two premises (e.g. a primary home and a vacation home), that individual will count as two RGUs for that service. Each bundled cable, internet or fixed-line telephony service is counted as a separate RGU regardless of the nature of any bundling discount or promotion. Non-paying subscribers are counted as subscribers during their free promotional service period. Some of these subscribers may choose to disconnect after their free service period. Services offered without charge on a long-term basis (e.g. VIP subscribers, free service to employees) generally are not counted as RGUs. Telenet does not include subscriptions to mobile services in its externally reported RGU counts.
(15) Customer Churn represents the rate at which customers relinquish their subscriptions. The annual rolling average basis is calculated by dividing the number of disconnects during the preceding 12 months by the average number of customer relationships. For the purpose of computing churn, a disconnect is deemed to have occurred if the customer no longer receives any level of service from Telenet and is required to return Telenet's equipment. A partial product downgrade, typically used to encourage customers to pay an outstanding bill and avoid complete service disconnection is not considered to be disconnected for purposes of Telenet's churn calculations. Customers who move within Telenet's cable footprint and upgrades and downgrades between services are also excluded from the disconnect figures used in the churn calculation.
(16) Net total leverage is defined as the sum of loans and borrowings under current and non-current liabilities minus cash and cash equivalents ("Net Total Debt"), as recorded in the Company's statement of financial position, divided by the last two quarters' Consolidated Annualized Adjusted EBITDA. In its statement of financial position, Telenet's USD-denominated debt has been converted into € using the September 30, 2021 EUR/USD exchange rate. As Telenet has entered into several derivative transactions to hedge both the underlying floating interest rate and exchange risks, the €-equivalent hedged amounts were €2,041.5 million (USD 2,295.0 million Term Loan AR) and €882.8 million (USD 1.0 billion Senior Secured Notes due 2028), respectively. For the calculation of its net leverage ratio, Telenet uses the €-equivalent hedged amounts given the underlying economic risk exposure. Net total leverage is a non-GAAP measure as contemplated by the U.S. Securities and Exchange Commission's Regulation G.
(17) Net covenant leverage is calculated as per the 2020 Amended Senior Credit Facility definition, using Net Total Debt (using the €-equivalent hedged amounts for its USD-denominated debt as highlighted above), excluding (i) subordinated shareholder loans, (ii) capitalized elements of indebtedness under the Clientele and Annuity Fees, (iii) any finance leases entered into on or prior to August 1, 2007, (iv) any indebtedness incurred under the network lease entered into with the pure intermunicipalities, (v) any vendor financing-related liabilities, and including (vi) the Credit Facility Excluded Amount (which is the greater of (a) €400.0 million and (b) 0.25x Consolidated Annualized Adjusted EBITDA), divided by last two quarters’ Consolidated Annualized Adjusted EBITDA.
TELENET GROUP HOLDING NV - EARNINGS RELEASE FIRST NINE MONTHS 2021 - 38
Investor & Analyst call – Telenet will host a video webcast and conference call for institutional investors and analysts on October 28, 2021 at 3:00pm CET, For details and webcast links, please visit: https://investors.telenet.be.
Contacts
Investor Relations: Rob Goyens [email protected] Phone: +32 15 333 054
Bart Boone [email protected] Phone: +32 15 333 738
Press & Media Relations: Stefan Coenjaerts [email protected] Phone: +32 15 335 006
About Telenet – As a provider of entertainment and telecommunication services in Belgium, Telenet Group is always looking for the perfect experience in the digital world for its customers. Under the brand name Telenet, the company focuses on offering digital television, high-speed Internet and fixed and mobile telephony services to residential customers in Flanders and Brussels. Under the brand name BASE, it supplies mobile telephony in Belgium. The Telenet Business department serves the business market in Belgium and Luxembourg with connectivity, hosting and security solutions. More than 3,000 employees have one aim in mind: making living and working easier and more pleasant. Telenet Group is part of Telenet Group Holding NV and is quoted on Euronext Brussels under ticker symbol TNET. For more information, visit www.telenet.be. Liberty Global - one of the world’s leading converged video, broadband and communications companies, innovating and empowering people in six countries across Europe to make the most of the digital revolution – owns a direct stake of 58.3% in Telenet Group Holding NV (excluding any treasury shares held by the latter from time to time).
Additional Information – Additional information on Telenet and its products can be obtained from the Company’s website https://www.telenet.be. Further information regarding the operating and financial data presented herein can be downloaded from the investor relations pages of this website. The Company’s Consolidated Annual Report 2020 as well as unaudited condensed consolidated financial statements and presentations related to the financial results for the nine months ended September 30, 2021 have been made available on the investor relations pages of the Company’s website (https://investors.telenet.be).
Safe Harbor Statement under the U.S. Private Securities Litigation Reform Act of 1995 – Various statements contained in this document constitute “forward-looking statements” as that term is defined under the U.S. Private Securities Litigation Reform Act of 1995. Words like “believe,” “anticipate,” “should,” “intend,” “plan,” “will,” “expects,” “estimates,” “projects,” “positioned,” “strategy,” and similar expressions identify these forward-looking statements related to our financial and operational outlook; future growth prospects; strategies; product, network and technology launches and expansion and the anticipated impact of acquisitions on our combined operations and financial performance, which involve known and unknown risks, uncertainties and other factors that may cause our actual results, performance or achievements or industry results to be materially different from those contemplated, projected, forecasted, estimated or budgeted whether expressed or implied, by these forward-looking statements. These factors include: potential adverse developments with respect to our liquidity or results of operations; potential adverse competitive, economic or regulatory developments; the potential adverse impact of the recent outbreak of the novel cornoavirus (COVID-19) pandemic, our significant debt payments and other contractual commitments; our ability to fund and execute our business plan; our ability to generate cash sufficient to service our debt; interest rate and currency exchange rate fluctuations; the impact of new business opportunities requiring significant up-front investments; our ability to attract and retain customers and increase our overall market penetration; our ability to compete against other communications and content distribution businesses; our ability to maintain contracts that are critical to our operations; our ability to respond adequately to technological developments; our ability to develop and maintain back-up for our critical systems; our ability to continue to design networks, install facilities, obtain and maintain any required governmental licenses or approvals and finance construction and development, in a timely manner at reasonable costs and on satisfactory terms and conditions; our ability to have an impact upon, or to respond effectively to, new or modified laws or regulations; our ability to make value-accretive investments; and our ability to sustain or increase shareholder distributions in future periods. We assume no obligation to update these forward-looking statements contained herein to reflect actual results, changes in assumptions or changes in factors affecting these statements.
Financial Information – The consolidated annual financial statements of Telenet Group Holding as of and for the year ended December 31, 2020 have been prepared in accordance with EU IFRS unless otherwise stated and are available on the Company’s website.
Non-GAAP measures –Adjusted EBITDA, Adjusted EBITDA less property & equipment additions (previously referred to as Operating Free Cash Flow), Adjusted Free Cash Flow and net total leverage are non-GAAP measures as contemplated by the U.S. Securities and Exchange Commission’s Regulation G. For related definitions and reconciliations, see the Investor Relations section of the Liberty Global plc website (https://www.libertyglobal.com). Liberty Global plc is the Company’s controlling shareholder.
This document has been released on October 28, 2021 at 7:00am CET
TELENET GROUP HOLDING NV - EARNINGS RELEASE FIRST NINE MONTHS 2021 - 39


![Earnings Release January 29, 2016 For the Nine Months Ended December … · Earnings Release January 29, 2016 For the Nine Months Ended December 31, 2015 [U.S. GAAP] Name of registrant:](https://img.pdfslide.net/doc/110x75/5b93805d09d3f206218d870c/earnings-release-january-29-2016-for-the-nine-months-ended-december-earnings.jpg)


![Earning Release for the Quarter and nine months ended December 31, 2015 [Company Update]](https://img.pdfslide.net/doc/110x75/577ca4fa1a28abea748b57b7/earning-release-for-the-quarter-and-nine-months-ended-december-31-2015-company.jpg)