Embed Size (px)
Citation preview
First nine months¡
¡
¡
¡
¡
¡
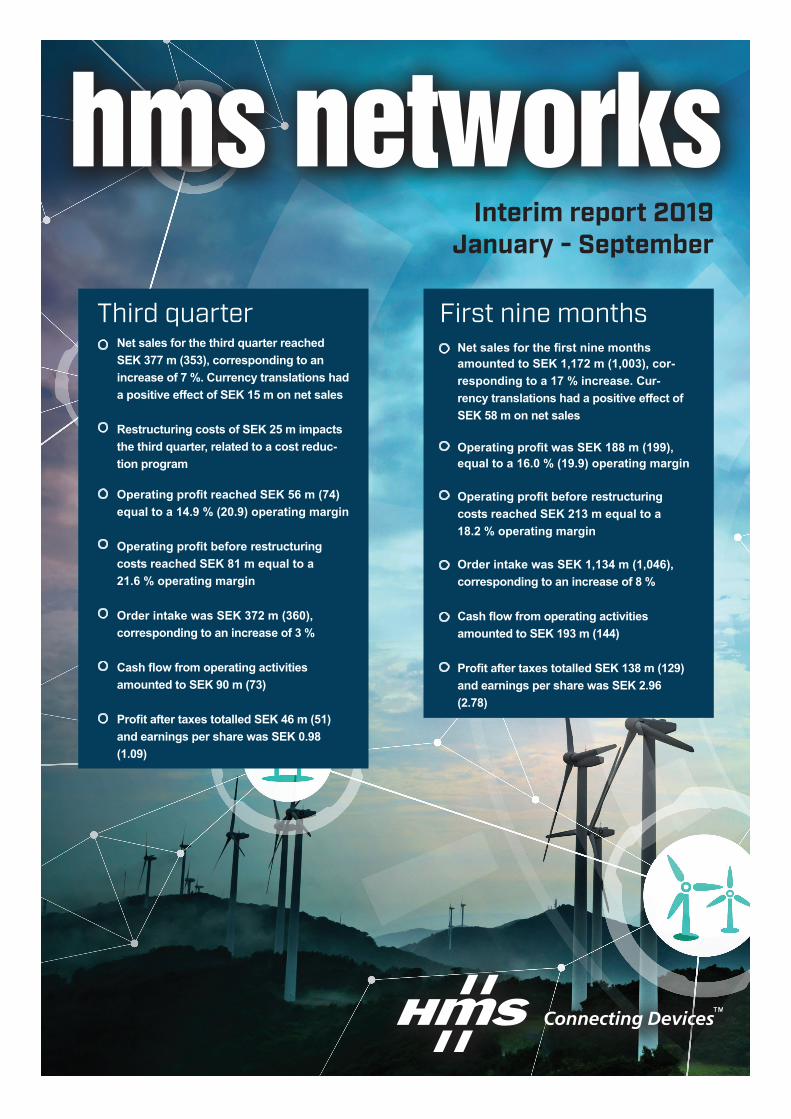
Net sales for the first nine months amounted to SEK 1,172 m (1,003), cor-responding to a 17 % increase. Cur-rency translations had a positive effect of SEK 58 m on net sales
Operating profit was SEK 188 m (199),equal to a 16.0 % (19.9) operating margin
Operating profit before restructuring costs reached SEK 213 m equal to a 18.2 % operating margin
Order intake was SEK 1,134 m (1,046), corresponding to an increase of 8 %
Cash flow from operating activitiesamounted to SEK 193 m (144)
Profit after taxes totalled SEK 138 m (129)and earnings per share was SEK 2.96(2.78)
Third quarter
Net sales for the third quarter reachedSEK 377 m (353), corresponding to anincrease of 7 %. Currency translations had a positive effect of SEK 15 m on net sales
Restructuring costs of SEK 25 m impacts the third quarter, related to a cost reduc-tion program Operating profit reached SEK 56 m (74)equal to a 14.9 % (20.9) operating margin
Operating profit before restructuring costs reached SEK 81 m equal to a 21.6 % operating margin
Order intake was SEK 372 m (360), corresponding to an increase of 3 %
Cash flow from operating activities amounted to SEK 90 m (73)
Profit after taxes totalled SEK 46 m (51)and earnings per share was SEK 0.98(1.09)
¡
¡
¡
¡
¡
¡
¡
Interim report 2019January - September
2
This is a translation of the Swedish language original. In the event of any differences between this translation and the Swedish original, the latter shall prevail.
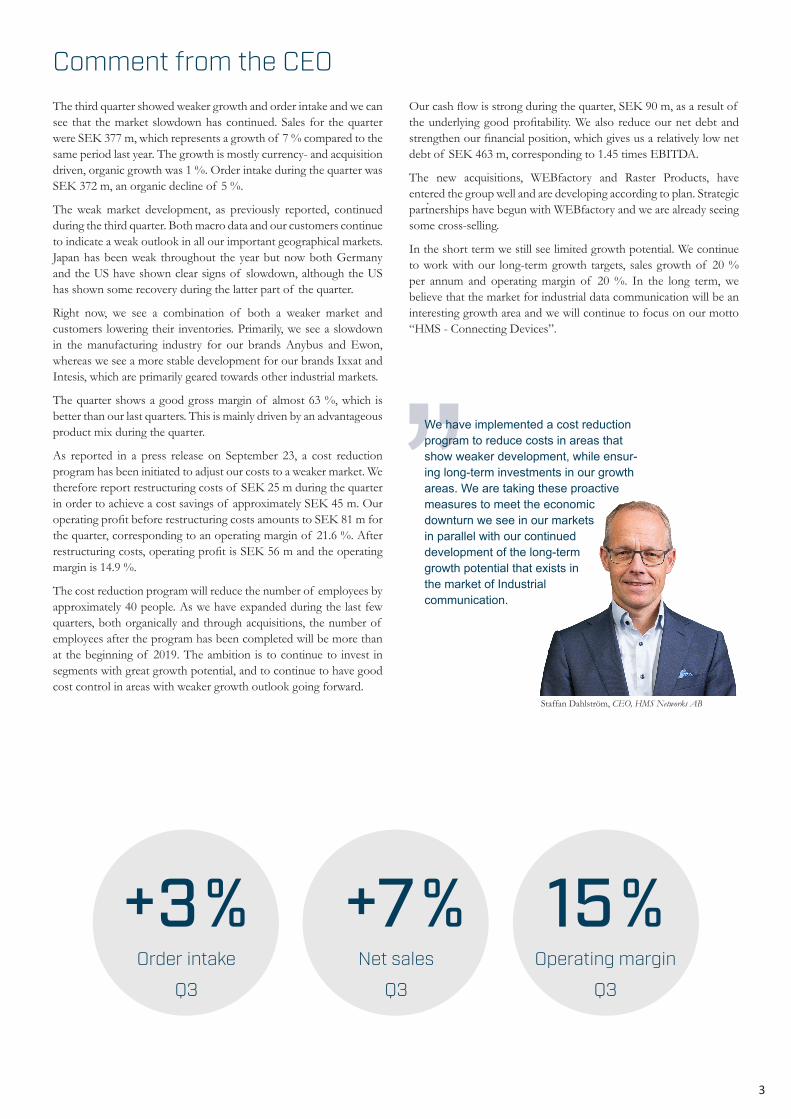
Comment from the CEOThe third quarter showed weaker growth and order intake and we can see that the market slowdown has continued. Sales for the quarter were SEK 377 m, which represents a growth of 7 % compared to the same period last year. The growth is mostly currency- and acquisition driven, organic growth was 1 %. Order intake during the quarter was SEK 372 m, an organic decline of 5 %.
The weak market development, as previously reported, continued during the third quarter. Both macro data and our customers continue to indicate a weak outlook in all our important geographical markets. Japan has been weak throughout the year but now both Germany and the US have shown clear signs of slowdown, although the US has shown some recovery during the latter part of the quarter.
Right now, we see a combination of both a weaker market and customers lowering their inventories. Primarily, we see a slowdown in the manufacturing industry for our brands Anybus and Ewon, whereas we see a more stable development for our brands Ixxat and Intesis, which are primarily geared towards other industrial markets.
The quarter shows a good gross margin of almost 63 %, which is better than our last quarters. This is mainly driven by an advantageous product mix during the quarter.
As reported in a press release on September 23, a cost reduction program has been initiated to adjust our costs to a weaker market. We therefore report restructuring costs of SEK 25 m during the quarter in order to achieve a cost savings of approximately SEK 45 m. Our operating profit before restructuring costs amounts to SEK 81 m for the quarter, corresponding to an operating margin of 21.6 %. After restructuring costs, operating profit is SEK 56 m and the operating margin is 14.9 %.
The cost reduction program will reduce the number of employees by approximately 40 people. As we have expanded during the last few quarters, both organically and through acquisitions, the number of employees after the program has been completed will be more than at the beginning of 2019. The ambition is to continue to invest in segments with great growth potential, and to continue to have good cost control in areas with weaker growth outlook going forward.
Our cash flow is strong during the quarter, SEK 90 m, as a result of the underlying good profitability. We also reduce our net debt and strengthen our financial position, which gives us a relatively low net debt of SEK 463 m, corresponding to 1.45 times EBITDA.
The new acquisitions, WEBfactory and Raster Products, have entered the group well and are developing according to plan. Strategic partnerships have begun with WEBfactory and we are already seeing some cross-selling.
In the short term we still see limited growth potential. We continue to work with our long-term growth targets, sales growth of 20 % per annum and operating margin of 20 %. In the long term, we believe that the market for industrial data communication will be an interesting growth area and we will continue to focus on our motto “HMS - Connecting Devices”.
Staffan Dahlström, CEO, HMS Networks AB
”
3
We have implemented a cost reduction program to reduce costs in areas that show weaker development, while ensur-ing long-term investments in our growth areas. We are taking these proactive measures to meet the economic downturn we see in our markets in parallel with our continued development of the long-term growth potential that exists in the market of Industrial communication.
Net sales
Q3
Operating margin
Q3
Order intake
Q3
+3 % +7 % 15 %
Order intake, net sales and earningsThird quarterOrder intake increased by 3 % to SEK 372 m (360) of which cur-rency translations affected positively by SEK 18 m. The companies WEBfactory and Raster Products acquired during the second quarter have contributed to the order intake with SEK 11 m. The organic change was -5 %.
Net sales increased by 7 % to SEK 377 m (353) of which currency translation effects affected positively by SEK 15 m (29). WEBfactory and Raster Products have contributed to the net sales with SEK 7 m. The organic increase in net sales was 1 %.
Gross profit increased by SEK 23 m to SEK 236 m (213) to a gross margin of 62.8 % (60.3). Operating expenses increased in total by SEK 41 m to SEK 180 m (139) whereof SEK 25 m relates to re-structuring costs initiated in the Group at the end of the quarter to adjust to a weaker market. Estimated cost for ongoing share savings programs have been adjusted downwards and contribute positively to the profit in the quarter by SEK 4 m.
Operating profit before depreciation amounted to SEK 82 m (87), corresponding to a margin of 21.7 % (24.5). Depreciations amount-ed to SEK 25 m (13) whereof SEK 8 m are related to IFRS 16 Leas-es. Operating profit amounted to SEK 56 m (74) corresponding to a margin of 14.9 % (20.9). Currency translations had a positive effect on the Group’s operating profit for the quarter of SEK 6 m (11). Due to the decline of the Swedish krona during the quarter, realized currency hedges have reduced operating profit by SEK -4 m (-1). The
4
SEK millionsQ3
2019Q3
2018 %Order intake 372 360 3.3
Net sales 377 353 6.5
Gross profit 236 213 10.8
Gross margin (%) 62.8 60.3
EBITDA 82 87 -5.9
EBITDA (%) 21.7 24.5
EBIT 56 74 -24.0
EBIT (%) 14.9 20.9
SEK millionsQ1-Q3
2019Q1-Q3
2018 %Order intake 1,134 1,046 8.4
Net sales 1,172 1,003 16.9
Gross profit 716 618 15.9
Gross margin (%) 61.1 61.6
EBITDA 255 237 7.6
EBITDA (%) 21.8 23.6
EBIT 188 199 -5.6
EBIT (%) 16.0 19.9
First nine monthsOrder intake increased by 8 % to SEK 1,134 m (1,046) of which currency translations affected positively by SEK 56 m. The acquired enteties have contributed to the order intake with SEK 41 m. The organic change was -1 %.
Net sales increased by 17 % to SEK 1,172 m (1,003) of which cur-rency translations affected positively by SEK 58 m (44). The acquired enteties have contributed to the net sales with SEK 55 m. The or-ganic increase in net sales was 6 %.
Gross profit increased by SEK 98 m to SEK 716 m (618) to a gross margin of 61.1 % (61.6). Operating expenses increased in total by SEK 109 m to SEK 528 m (418) of which SEK 25 m relates to non-recurring cost for the restructuring program started in the third quarter to adjust to a weaker market. The estimated costs for on-going share savings programs have been adjusted downwards and contribute positive to the profit in the period by SEK 4 m. Part of the increase can also be explained by acquisition effects from the acquired companies.
Operating profit before depreciation amounted to SEK 255 m (237), corresponding to a margin of 21.8 % (23.6). Depreciations amounted to SEK 67 m (38) whereof SEK 22 m are related to IFRS 16 Leases. Operating profit amounted to SEK 188 m (199) corresponding to a margin of 16.0 (19.9). Currency translations had a positive effect on the Group’s operating profit of SEK 25 m (16). Due to a continued decline of the Swedish krona, realized currency hedges have reduced operating profit by SEK -10 m (-4). The acquired companies WEB-
acquired companies had a limited impact on the operating profit in the quarter.
Net financials was SEK -1 m (-4) which gave a profit before tax of SEK 55 m (70). Profit after tax amounted to SEK 46 m (51) and earnings per share before and after dilution was SEK 0.98 (1.09) and SEK 0.98 (1.08) respectively.
factory and Raster Products had a limited impact on the operating profit of the period.
Net financials was SEK -7 m (-20) which gave a profit before tax of SEK 181 m (180). Profit after tax amounted to SEK 138 m (129) and earnings per share before and after dilution was SEK 2.96 (2.78) and SEK 2.95 (2.76) respectively.
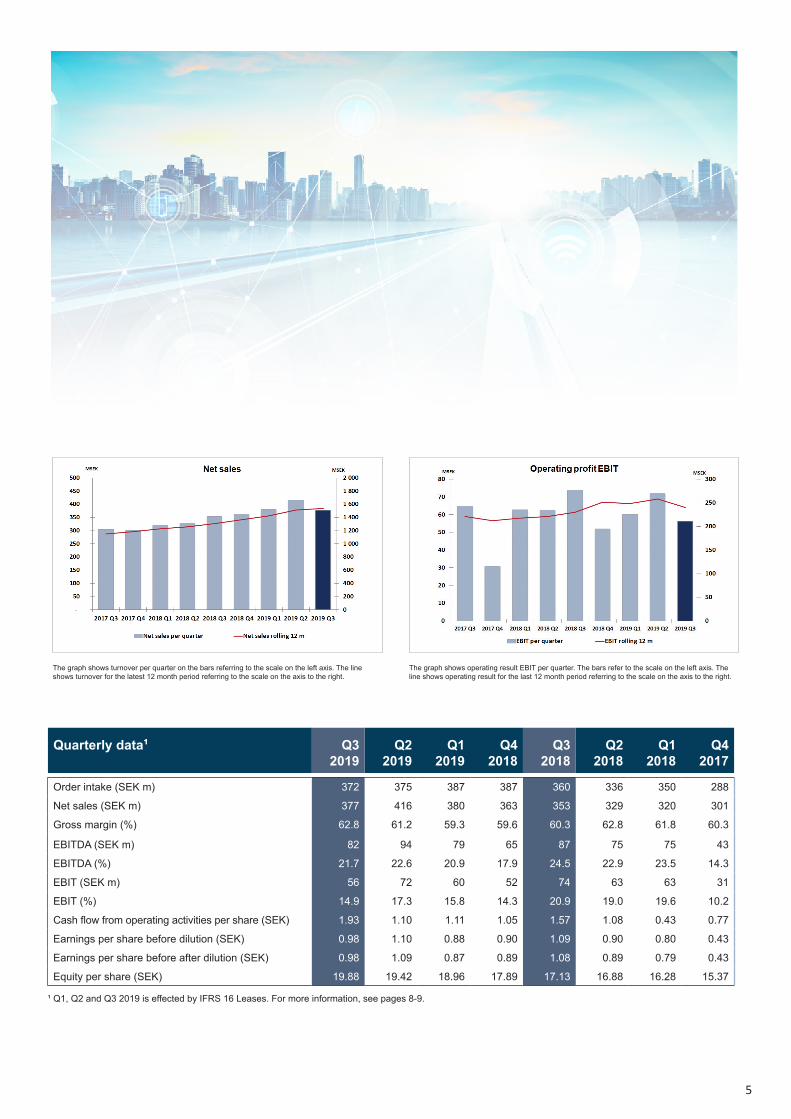
The graph shows operating result EBIT per quarter. The bars refer to the scale on the left axis. The line shows operating result for the last 12 month period referring to the scale on the axis to the right.
Quarterly data¹ Q32019
Q22019
Q12019
Q42018
Q32018
Q22018
Q12018
Q42017
Order intake (SEK m) 372 375 387 387 360 336 350 288
Net sales (SEK m) 377 416 380 363 353 329 320 301
Gross margin (%) 62.8 61.2 59.3 59.6 60.3 62.8 61.8 60.3
EBITDA (SEK m) 82 94 79 65 87 75 75 43
EBITDA (%) 21.7 22.6 20.9 17.9 24.5 22.9 23.5 14.3
EBIT (SEK m) 56 72 60 52 74 63 63 31
EBIT (%) 14.9 17.3 15.8 14.3 20.9 19.0 19.6 10.2
Cash flow from operating activities per share (SEK) 1.93 1.10 1.11 1.05 1.57 1.08 0.43 0.77
Earnings per share before dilution (SEK) 0.98 1.10 0.88 0.90 1.09 0.90 0.80 0.43
Earnings per share before after dilution (SEK) 0.98 1.09 0.87 0.89 1.08 0.89 0.79 0.43
Equity per share (SEK) 19.88 19.42 18.96 17.89 17.13 16.88 16.28 15.37
¹ Q1, Q2 and Q3 2019 is effected by IFRS 16 Leases. For more information, see pages 8-9.
The graph shows turnover per quarter on the bars referring to the scale on the left axis. The line shows turnover for the latest 12 month period referring to the scale on the axis to the right.
5
Cash flow, investments and financial positionThird quarterCash flow from operating activities before changes in working capital amounted to SEK 101 m (59) for the third quarter. Changes in work-ing capital was SEK -11 m (15). Cash flow from operating activities was thereby SEK 90 m (73).
During the quarter, investments in new assets claimed SEK 20 m (28). Cash flow from investing activities was thereby SEK -20 m (-28).
Cash flow from financing activities claimed SEK -101 m (-86), which is mainly explained by a decrease in external loans of SEK 96 m (76). Moreover, amortizations of lease liabilities claimed SEK 8 m (1). This means that cash flow for the quarter was SEK -31 m (-40).
First nine monthsCash flow from operating activities before changes in working capital amounted to SEK 231 m (188) for the first nine months. Changes in working capital was SEK -38 m (-44), mainly due to a combination of decreased accounts payable and an inventory increase. Cash flow from operating activities was thereby SEK 193 m (144).
During the first nine months investments in new assets claimed SEK 48 m (23) and aquisitions of new shares in subsidiaries claimed SEK 24 m (22). Cash flow from investing activities was SEK -74 m (-45).
Cash flow from financing activities amounted to SEK -128 m (-137), mainly explained by a disbursed dividend of SEK 84 m (70) as well as a decrease in external loans of SEK 20 m (25). Amortizations of lease liabilities claimed SEK 22 m (2). This means that cash flow for the first nine months was SEK -8 m (-38).
Cash and cash equivalents and net debtCash and cash equivalents amounted to SEK 57 m (55) and unused credit facilities to SEK 146 m (125). Net debt amounted to SEK 463 m (381) and net debt to EBITDA ratio for the last twelve months was 1.45 (1.36). Net debt/Equity ratio was 49 % (47) and Equity/Assets ratio 52 % (52).
Net debt and the ratios above, for 2019, are calculated according to the new accounting standard IFRS 16. See the table on page 9 for cor-responding amounts and ratios excluding IFRS 16.
In the second quarter, a dividend of SEK 1.80 per share, in total SEK 84 m (70) was distributed to the shareholders.
The HMS Networks AB shareHMS Networks AB (publ) is listed on the Nasdaq OMX Stockholm Mid Cap list, in the Information Technology sector. By the end of the period the total number of shares amounted to 46,818,868 of which 202,999 shares are held by the company.
A list of the company’s ownership structure can be found on the company’s website (www.hms-networks.com).
Share savings programToday the Company has four ongoing share saving programs. Based on a decision by the Annual General Meetings permanent employees are offered to save in HMS shares in an annual share saving program. Between 46 % and 60 % of the employees opted to participate in the respective program. If certain criterias are met the Company is committed to give the participant a maximum of two HMS shares for every share saved by the employee. As of September 30, 2019, the total number of saved shares amounted to 138,784 (157,071) within ongoing programs.
On December 31, 2018 the share saving program from 2015 was finalized. During the first quarter of 2019, 89,826 shares, of which 44,913 were performance shares, were distributed free of charge to the participants. Shares used for the allocation was own shares held by the company.
The parent companyThe Parent Company’s operations are primarily focused on Group wide management and financing. Apart from the Group’s CEO, the Parent Company has no employees. The operating profit for the first nine months amounted to SEK 0 m (1). Dividends from subsidiaries totalled SEK 179 m (165) and the profit for the period amounted to SEK 183 m (164) after tax. Cash and cash equivalents amounted to SEK 1 m (1), external borrowing does not exist.
Related party transactionsNo material transactions with related parties have occurred during the period.
Contingent liabilitiesThere have been no changes in the Group’s contingent liabilities, described on page 98 in Note 34 of the Annual Report for 2018.
6
Significant eventsHMS acquires WEBfactory GmbHOn April 1, 2019 HMS acquired 74.9 % of the shares in the German company WEBfactory GmbH, a leading provider of web-based soft-ware solutions for the Industrial Internet of Things, IIoT. The purchase price amounted to EUR 3.2 m on a debt free basis and a performance-based additional purchase price of maximum EUR 1.5 m. The acquisition was financed with existing bank credit.
Preliminary the acquisition will generate a SEK 43 m excess value in the Group (25.1 % non-controlling interest included). The acquired company is consolidated in the HMS Group accounts as of April 1, 2019. During the first six months, WEBfactory had a positive impact on the net sales of the Group of SEK 10 m. The acquisition’s con-tribution to operating profit, including acquisition costs, amounted to SEK -4 m.
Pending the allocation of excess value to specific assets and the as-sessment of the tax position at WEBfactory as per the acquisition date, the acquisition analysis is preliminary. No changes have been made compared to the preliminary acquisition analysis presented in the half-year report 2019.
HMS acquires Raster Products B.V.On May 2, 2019 HMS acquired 100 % of the shares in the Dutch company Raster Products B.V. For several years, the company has been HMS’ primary distributor of Ewon products in the Nether-lands.
The purchase price amounted to EUR 1.1 m on a debt free basis and was financed with existing bank credit.
Preliminary the acquisition will generate a SEK 8 m excess value in the Group. The acquired company is consolidated in the HMS Group accounts as of May 1, 2019. Raster Products had a limited impact on the net sales and operating profit of the Group during the first five months.
Pending the allocation of excess value to specific assets the acquisi-tion analysis is preliminary. No changes have been made compared to the preliminary acquisition analysis presented in the half-year report 2019.
Acquisition analysis of Beck IPCThe acquisition analysis from the acquisition of Beck IPC has been finalized in the third quarter 2019, as one year has passed since the acquisition on July 17, 2018.
According to the final acquisition analysis, the purchase sum, ac-quired net assets and goodwill amount to:
Purchase sum:SEK
millionCash and cash equivalents 23 Contingent additional consideration 21Total purchase sum 44
The assets and liabilities recognized in con-junction with the acquisition are as follows:
SEK million
Intangible fixed assets- Intellectual property rights 12- Customer relations 3- Deferred tax liabilities -2Property, plants and equipment 1Deferred tax assets 5Inventories 7Accounts receivable and other receivables 8Cash and cash equivalents 0Non-current liabilities - 2Accounts payable and other liabilities -36Total identifiable net assets -3Goodwill* 47Acquired net assets 44
*Goodwill is attributable to expected synergies with existing operations. No part of the recognized goodwill is expected to be tax deductable.
Cost reduction programHMS implements a cost reduction program to adapt to a weaker mar-ket. The financial impact will be a run-rate saving of SEK 45 m with full impact 2020. The restructuring activities are expected to generate costs of SEK 25 m that will impact the third quarter 2019. In total the program will affect 40 employees throughout the group, of which 24 employees are affected in Sweden.
Subsequent eventsThere are no events after the end of the period which have had a significant impact on the result or financial position of the company.
OutlookThe HMS Group long term growth is supported by a continued in-flow of Design-Wins, a broader product offering within the Industri-al Internet of Things (IIoT) and Wireless, supplementary technology platforms from earlier acquisitions, and expansion of the HMS sales channels according to the existing strategy.
The global business climate is still weakened and will probably create challenges for our growth ambitions in the short term. The economic climate in various geographical areas and industrial segments and its impact on the market for HMS’ product offering is difficult to esti-mate. The currency development will play an important role and also this effect is difficult to estimate.
HMS’ long-term goals are unchanged: Long-term growth on average 20 % per year and an operating margin of 20 %.
7
8
Risk managementThe HMS Group is exposed to business and financial risks through its operations. These risks have been described at length in the Com-pany’s Annual Report 2018. In addition to the risks described in these documents, no additional significant risks have been identified.
Nomination committeeIn accordance with principles adopted at a prior HMS’ Annual Gen-eral Meeting, the following persons have been assigned to be a part of the Nomination Committee: Johan Hjertonsson, Investment AB Latour, representing 26 % of the shares, Staffan Dahlström repre-senting 14 % of the shares, Evert Carlsson, Swedbank Robur Fonder AB representing 9 % of the shares, Per Trygg, SEB Fonder repre-senting 6 % of the shares and Charlotte Brogren, Chairman of the Board. The Nomination Committee has appointed Johan Hjertons-son as its Chairman.
Shareholders who wish to present proposals to HMS’s Nomination Committee may do so by e-mail to: [email protected] or in writ-ing to: HMS Networks AB, Investors Relations, Att: Nomination Committee, Box 4126, SE 300 04 Halmstad, Sweden no later than February 1, 2020.
Accounting policies HMS’ consolidated accounts have been prepared in accordance with the International Financial Reporting Standards (IFRS), adopted by the EU. The Interim Report has been prepared in accordance with IAS 34 Interim Financial Reporting and the Swedish Annual Ac-counts Act. The Parent Company applies Swedish Financial Report-ing Board’s recommendation, RFR 2 Accounting for Legal Entities, and the Swedish Annual Accounts Act.
The accounting principles applied conform to those described in the 2018 Annual Report, except for the implementation of IFRS 16 Leases. Other new or revised IFRS standards or other IFRIC-inter-pretations that came into effect after January 1, 2019 have not had any significant impact on the Group’s financial reports as of Septem-ber 30, 2019.
HMS applies the European Securities and Market Authority’s (ESMA) guidelines on alternative key indicators (measures that are not defined in accordance with IFRS).
Items affecting comparabilityItems affecting comparability are reported separately in the finan-cial statements when it is necessary to explain the Group’s results. Items affecting comparability refer to significant income or expense items that are reported separately due to the significance of their character or amount. During the third quarter of 2019, the Group reports restructuring costs of SEK 25 m related to a cost reduction program. Since the costs are significant in the individual quarter and not normally occurring, these costs are reported as an item affecting comparability on a separate line in the Group’s income statement.
IFRS 16 LeasesAs of January 1, 2019, the new accounting standard related to lease are applied (IFRS 16). The lease standard requires that assets and li-abilities attributable to all lease contracts, with some exceptions, are reported in the balance sheet. For more information, please see Note 38 in the 2018 Annual Report.
HMS has chosen to apply the simplified method and will not apply the standard retrospectively. In accordance with the simplified transi-tion method, the comparison figures for 2018 have not been recalcu-lated. The main impact on HMS’ accounts arise from the reporting of lease contracts for premises.
The change means that leases are recognized as a right-of-use asset and a lease liability in the balance sheet. In the income statement the linear operating lease cost is replaced by depreciation of the right-of-use asset and an interest expense attributable to the lease liability. HMS has used a discount rate of 1.8 % to determine the lease liability in the opening balance as of January 1, 2019.
The effects in the Balance sheet and Income statements as well as in key figures, which the transition to the new lease standard entails, are presented in the table on page 9.
9
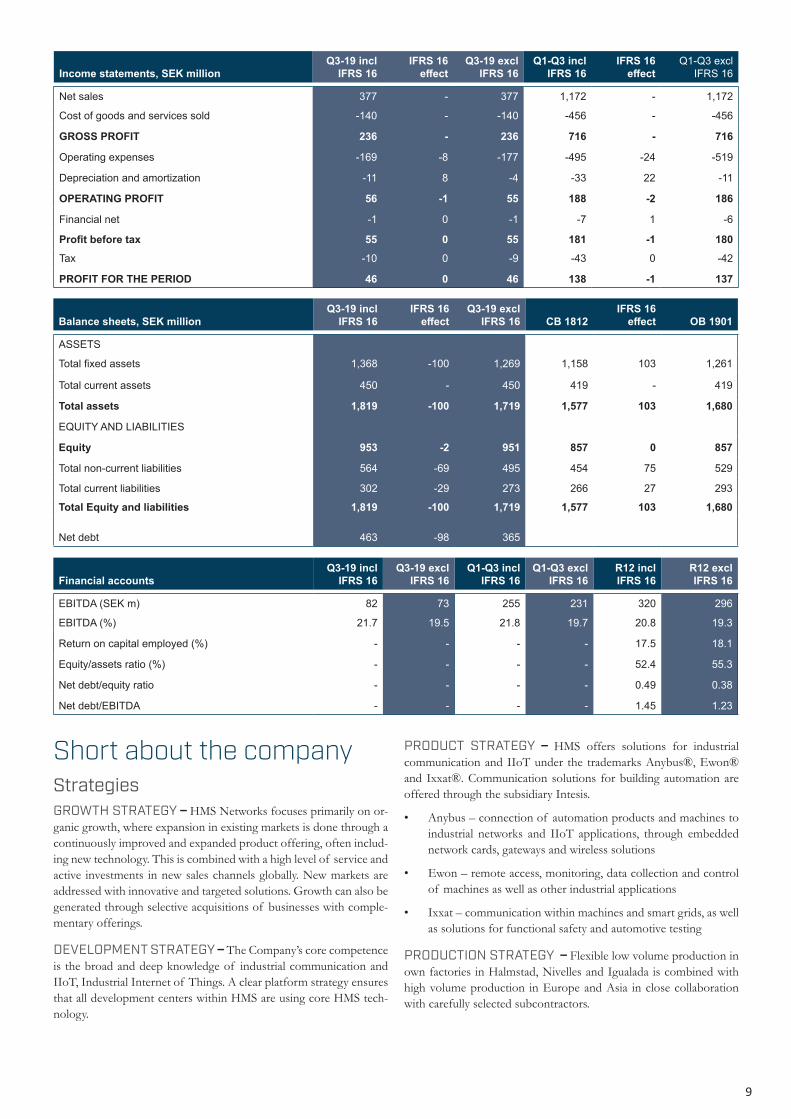
Income statements, SEK millionQ3-19 incl
IFRS 16IFRS 16
effectQ3-19 excl
IFRS 16Q1-Q3 incl
IFRS 16IFRS 16
effectQ1-Q3 excl
IFRS 16
Net sales 377 - 377 1,172 - 1,172
Cost of goods and services sold -140 - -140 -456 - -456
GROSS PROFIT 236 - 236 716 - 716
Operating expenses -169 -8 -177 -495 -24 -519
Depreciation and amortization -11 8 -4 -33 22 -11
OPERATING PROFIT 56 -1 55 188 -2 186
Financial net -1 0 -1 -7 1 -6
Profit before tax 55 0 55 181 -1 180Tax -10 0 -9 -43 0 -42
PROFIT FOR THE PERIOD 46 0 46 138 -1 137
Balance sheets, SEK millionQ3-19 incl
IFRS 16IFRS 16
effectQ3-19 excl
IFRS 16 CB 1812IFRS 16
effect OB 1901
ASSETS
Total fixed assets 1,368 -100 1,269 1,158 103 1,261
Total current assets 450 - 450 419 - 419
Total assets 1,819 -100 1,719 1,577 103 1,680
EQUITY AND LIABILITIES
Equity 953 -2 951 857 0 857
Total non-current liabilities 564 -69 495 454 75 529
Total current liabilities 302 -29 273 266 27 293
Total Equity and liabilities 1,819 -100 1,719 1,577 103 1,680
Net debt 463 -98 365
Financial accountsQ3-19 incl
IFRS 16Q3-19 excl
IFRS 16Q1-Q3 incl
IFRS 16Q1-Q3 excl
IFRS 16R12 incl IFRS 16
R12 excl IFRS 16
EBITDA (SEK m) 82 73 255 231 320 296
EBITDA (%) 21.7 19.5 21.8 19.7 20.8 19.3
Return on capital employed (%) - - - - 17.5 18.1
Equity/assets ratio (%) - - - - 52.4 55.3
Net debt/equity ratio - - - - 0.49 0.38
Net debt/EBITDA - - - - 1.45 1.23
Short about the company StrategiesGROWTH STRATEGY – HMS Networks focuses primarily on or-ganic growth, where expansion in existing markets is done through a continuously improved and expanded product offering, often includ-ing new technology. This is combined with a high level of service and active investments in new sales channels globally. New markets are addressed with innovative and targeted solutions. Growth can also be generated through selective acquisitions of businesses with comple-mentary offerings.
DEVELOPMENT STRATEGY – The Company’s core competence is the broad and deep knowledge of industrial communication and IIoT, Industrial Internet of Things. A clear platform strategy ensures that all development centers within HMS are using core HMS tech-nology.
PRODUCT STRATEGY – HMS offers solutions for industrial communication and IIoT under the trademarks Anybus®, Ewon® and Ixxat®. Communication solutions for building automation are offered through the subsidiary Intesis.
• Anybus – connection of automation products and machines to industrial networks and IIoT applications, through embedded network cards, gateways and wireless solutions
• Ewon – remote access, monitoring, data collection and control of machines as well as other industrial applications
• Ixxat – communication within machines and smart grids, as well as solutions for functional safety and automotive testing
PRODUCTION STRATEGY – Flexible low volume production in own factories in Halmstad, Nivelles and Igualada is combined with high volume production in Europe and Asia in close collaboration with carefully selected subcontractors.
10
MARKETING STRATEGY – HMS’ markets targeted solutions to all key players in the industrial value chain. Device manufacturers and machine builders are offered solutions that are tightly integrated into the customer’s application. System integrators and end users are of-fered flexible infrastructure products that solve all kinds of commu-nication problems in industrial systems and IoT applications. HMS’ most important market is still factory automation, but other impor-tant markets are energy and infrastructure, transport and logistics, and building automation.
SALES STRATEGY – HMS combines direct sales from own sales offices with sales through distribution. HMS has sales offices in key markets in 16 countries, complemented by a network of distributors and solution partners in more than 50 countries.
Business modelHMS has developed its business models by packaging advanced in-dustrial communication and IIoT technology into targeted solutions that match the needs of each target group. With device manufactur-ers and machine builders, HMS signs long-term framework agree-ments, so-called Design-Wins. This model is characterized by a rela-tively long sales cycle and design phase during which HMS’s solutions are specified into the customer’s application, after which long-term revenues are secured. The close collaboration gives HMS clear insight into the customer’s future needs. The business model towards system integrators is more traditional with a short sales cycle and manufacturing against customer orders or short-term forecasts. This sale is often handled by local distribu-tors who are supported by HMS’ sales and marketing organization.
Report occasions• Year-end report 2019 will be published February 3, 2020
• First quarter report 2020 will be published on April 23, 2020
• Annual General Meeting will be held on April 23, 2020
• Half-year report 2020 will be published July 15, 2020
Halmstad October 22, 2019
Staffan Dahlström Chief Executive Officer
Further information can be obtained by:CEO Staffan Dahlström, telephone +46 35 17 2901 or CFO Joakim Nideborn, telephone +46 35 710 6983
This information is such that HMS Networks AB (publ) is obliged to make public pursuant to the EU Market Abuse Regulation and the Securities Markets Act. The information was submit-ted for publication, through the contact persons set out above, at 14.00 CET on October 22, 2019.
Report of Review of Interim Financial InformationIntroduction
We have reviewed the condensed interim financial information (interim report) of HMS Networks AB (publ) as of September 30, 2019 and the nine-month period then ended. The board of directors and the CEO are responsible for the preparation and presentation of the in-terim financial information in accordance with IAS 34 and the Swedish Annual Accounts Act. Our responsibility is to express a conclusion on this interim report based on our review.
Scope of Review
We conducted our review in accordance with the International Stand-ard on Review Engagements ISRE 2410, Review of Interim Report Performed by the Independent Auditor of the Entity. A review con-sists of making inquiries, primarily of persons responsible for financial and accounting matters, and applying analytical and other review pro-cedures. A review is substantially less in scope than an audit conducted in accordance with International Standards on Auditing, ISA, and other generally accepted auditing standards in Sweden. The procedures per-formed in a review do not enable us to obtain assurance that we would become aware of all significant matters that might be identified in an audit. Accordingly, we do not express an audit opinion.
Conclusion
Based on our review, nothing has come to our attention that causes us to believe that the interim report is not prepared, in all material respects, in accordance with IAS 34 and the Swedish Annual Accounts Act, regarding the Group, and with the Swedish Annual Accounts Act, regarding the Parent Company.
Halmstad October 22, 2019Öhrlings PricewaterhouseCoopers AB
Fredrik GöranssonAuthorized Public Accountant

11
Income statements
SEK millionsQ3
2019Q3
2018Q1-Q3
2019Q1-Q3
20181810-190912 months
Q1-Q4 2018
Net sales 377 353 1,172 1,003 1,535 1,366
Cost of goods and services sold -140 -140 -456 -385 -603 -532
GROSS PROFIT 236 213 716 618 932 834Sales and marketing costs -86 -72 -258 -220 -349 -310
Administrative expenses -23 -27 -89 -83 -117 -111
Research and development costs -41 -40 -141 -117 -186 -162
Restructuring costs¹ -25 - -25 - -25 -
Other operating income - 2 - 6 0 6
Other operating costs -5 -1 -15 -4 -15 -5
OPERATING PROFIT 56 74 188 199 240 251Financial income and costs -1 -4 -7 -20 -7 -20
Profit before tax 55 70 181 180 233 232Tax -10 -20 -43 -50 -53 -61
PROFIT FOR THE PERIOD 46 51 138 129 180 171
Attributed to:
Parent company shareholders 46 51 138 129 180 171
Non-controlling interests 0 - 0 - 0 -
Earnings per share regarding profit attributed to parent company shareholders
Before dilution, SEK 0.98 1.09 2.96 2.78 3.86 3.68
After dilution, SEK 0.98 1.08 2.95 2.76 3.84 3.65
SEK millionsQ3
2019Q3
2018Q1-Q3
2019Q1-Q3
20181810-190912 months
Q1-Q4 2018
Profit for the period 46 51 138 129 180 171
Other comprehensive income
Items that may be reclassified subsequently to income statementCash flow hedges -5 6 -10 2 -12 0
Hedging of net investments -3 4 -11 -11 -11 -10
Translation differences 16 -11 44 49 43 48
Income tax relating to components of other comprehensive income 2 -2 4 2 5 2
Other comprehensive income for the period, net of tax 10 -3 27 42 25 39Total comprehensive income for the period 56 48 165 171 205 211
Attributed to:
Parent company shareholders 56 48 165 171 205 211
Non-controlling interests 0 - 0 - 0 -
Statement of comprehensive income
¹ Restructuring costs are allocated as follows: Cost of goods and services sold SEK 2 m, Sales and marketing costs SEK 8 m, Administrative expenses SEK 3 m and Research and development costs SEK 12 m.
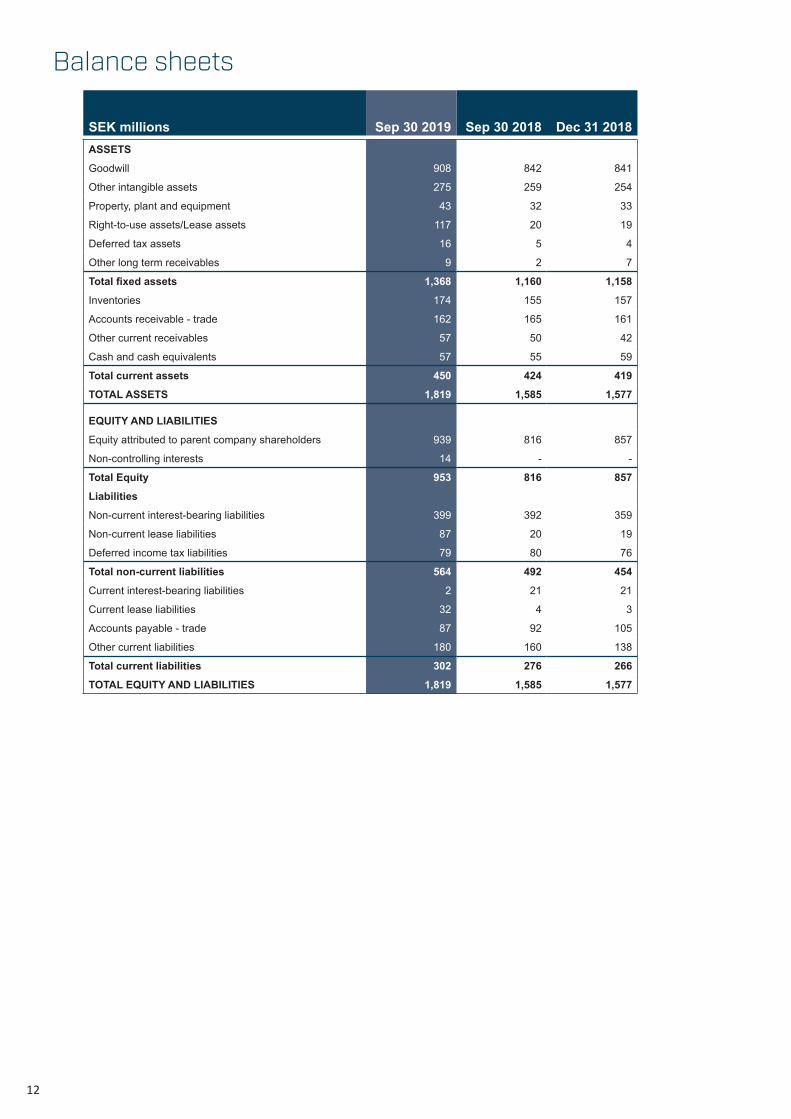
SEK millions Sep 30 2019 Sep 30 2018 Dec 31 2018ASSETSGoodwill 908 842 841
Other intangible assets 275 259 254
Property, plant and equipment 43 32 33
Right-to-use assets/Lease assets 117 20 19
Deferred tax assets 16 5 4
Other long term receivables 9 2 7
Total fixed assets 1,368 1,160 1,158Inventories 174 155 157
Accounts receivable - trade 162 165 161
Other current receivables 57 50 42
Cash and cash equivalents 57 55 59
Total current assets 450 424 419TOTAL ASSETS 1,819 1,585 1,577
EQUITY AND LIABILITIESEquity attributed to parent company shareholders 939 816 857
Non-controlling interests 14 - -
Total Equity 953 816 857Liabilities
Non-current interest-bearing liabilities 399 392 359
Non-current lease liabilities 87 20 19
Deferred income tax liabilities 79 80 76
Total non-current liabilities 564 492 454Current interest-bearing liabilities 2 21 21
Current lease liabilities 32 4 3
Accounts payable - trade 87 92 105
Other current liabilities 180 160 138
Total current liabilities 302 276 266TOTAL EQUITY AND LIABILITIES 1,819 1,585 1,577
Balance sheets
12
13
SEK millionsQ3
2019Q3
2018Q1-Q3
2019Q1-Q3
20181810-190912 months
Q1-Q4 2018
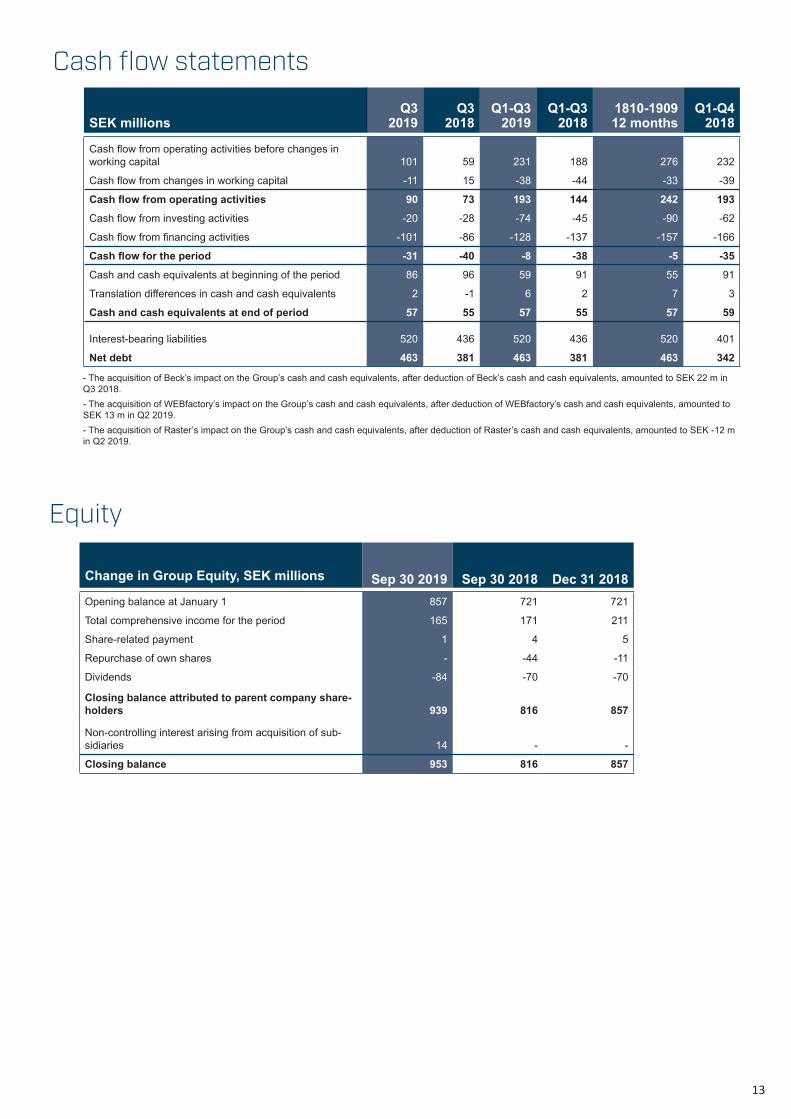
Cash flow from operating activities before changes in working capital 101 59 231 188 276 232
Cash flow from changes in working capital -11 15 -38 -44 -33 -39
Cash flow from operating activities 90 73 193 144 242 193Cash flow from investing activities -20 -28 -74 -45 -90 -62
Cash flow from financing activities -101 -86 -128 -137 -157 -166
Cash flow for the period -31 -40 -8 -38 -5 -35Cash and cash equivalents at beginning of the period 86 96 59 91 55 91
Translation differences in cash and cash equivalents 2 -1 6 2 7 3
Cash and cash equivalents at end of period 57 55 57 55 57 59
Interest-bearing liabilities 520 436 520 436 520 401
Net debt 463 381 463 381 463 342
Cash flow statements
Change in Group Equity, SEK millions Sep 30 2019 Sep 30 2018 Dec 31 2018Opening balance at January 1 857 721 721
Total comprehensive income for the period 165 171 211
Share-related payment 1 4 5
Repurchase of own shares - -44 -11
Dividends -84 -70 -70
Closing balance attributed to parent company share-holders 939 816 857
Non-controlling interest arising from acquisition of sub-sidiaries 14 - -
Closing balance 953 816 857
Equity
- The acquisition of Beck’s impact on the Group’s cash and cash equivalents, after deduction of Beck’s cash and cash equivalents, amounted to SEK 22 m in Q3 2018.- The acquisition of WEBfactory’s impact on the Group’s cash and cash equivalents, after deduction of WEBfactory’s cash and cash equivalents, amounted to SEK 13 m in Q2 2019.- The acquisition of Raster’s impact on the Group’s cash and cash equivalents, after deduction of Raster’s cash and cash equivalents, amounted to SEK -12 m in Q2 2019.
14
Financial accounts
Q32019
Q32018
Q1-Q32019
Q1-Q32018
1810-190912 months
Q1-Q4 2018
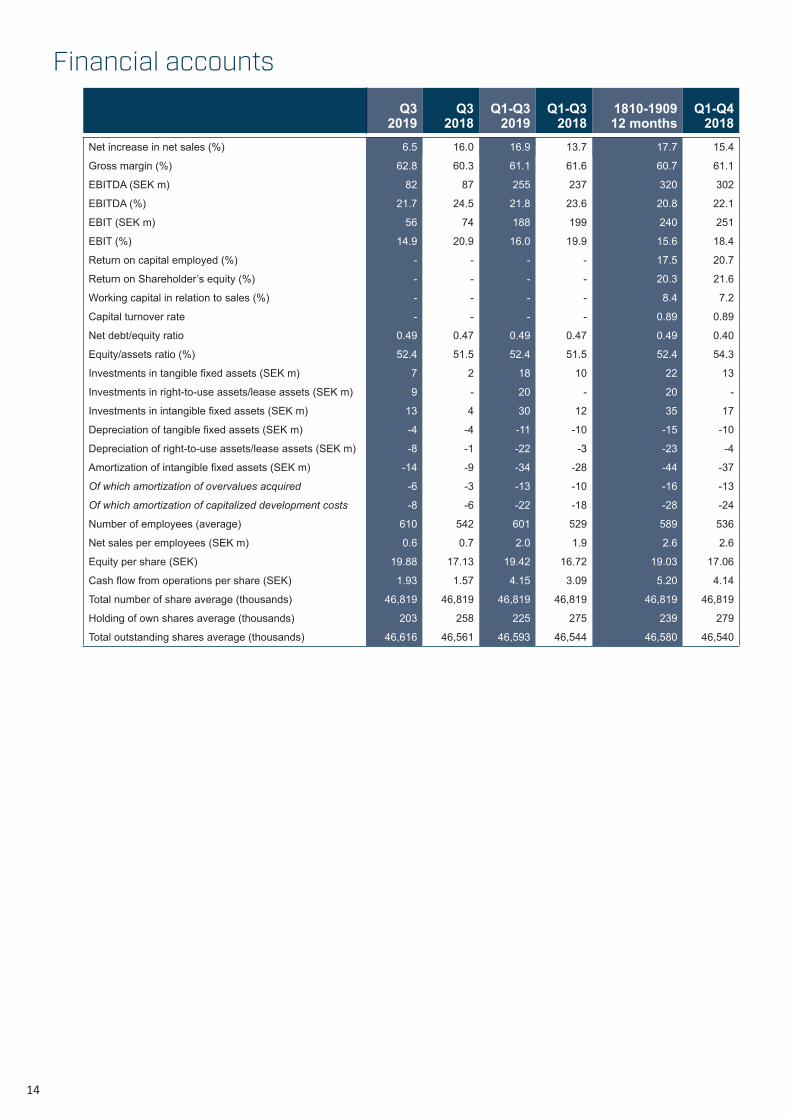
Net increase in net sales (%) 6.5 16.0 16.9 13.7 17.7 15.4
Gross margin (%) 62.8 60.3 61.1 61.6 60.7 61.1
EBITDA (SEK m) 82 87 255 237 320 302
EBITDA (%) 21.7 24.5 21.8 23.6 20.8 22.1
EBIT (SEK m) 56 74 188 199 240 251
EBIT (%) 14.9 20.9 16.0 19.9 15.6 18.4
Return on capital employed (%) - - - - 17.5 20.7
Return on Shareholder’s equity (%) - - - - 20.3 21.6
Working capital in relation to sales (%) - - - - 8.4 7.2
Capital turnover rate - - - - 0.89 0.89
Net debt/equity ratio 0.49 0.47 0.49 0.47 0.49 0.40
Equity/assets ratio (%) 52.4 51.5 52.4 51.5 52.4 54.3
Investments in tangible fixed assets (SEK m) 7 2 18 10 22 13
Investments in right-to-use assets/lease assets (SEK m) 9 - 20 - 20 -
Investments in intangible fixed assets (SEK m) 13 4 30 12 35 17
Depreciation of tangible fixed assets (SEK m) -4 -4 -11 -10 -15 -10
Depreciation of right-to-use assets/lease assets (SEK m) -8 -1 -22 -3 -23 -4
Amortization of intangible fixed assets (SEK m) -14 -9 -34 -28 -44 -37
Of which amortization of overvalues acquired -6 -3 -13 -10 -16 -13
Of which amortization of capitalized development costs -8 -6 -22 -18 -28 -24
Number of employees (average) 610 542 601 529 589 536
Net sales per employees (SEK m) 0.6 0.7 2.0 1.9 2.6 2.6
Equity per share (SEK) 19.88 17.13 19.42 16.72 19.03 17.06
Cash flow from operations per share (SEK) 1.93 1.57 4.15 3.09 5.20 4.14
Total number of share average (thousands) 46,819 46,819 46,819 46,819 46,819 46,819
Holding of own shares average (thousands) 203 258 225 275 239 279
Total outstanding shares average (thousands) 46,616 46,561 46,593 46,544 46,580 46,540
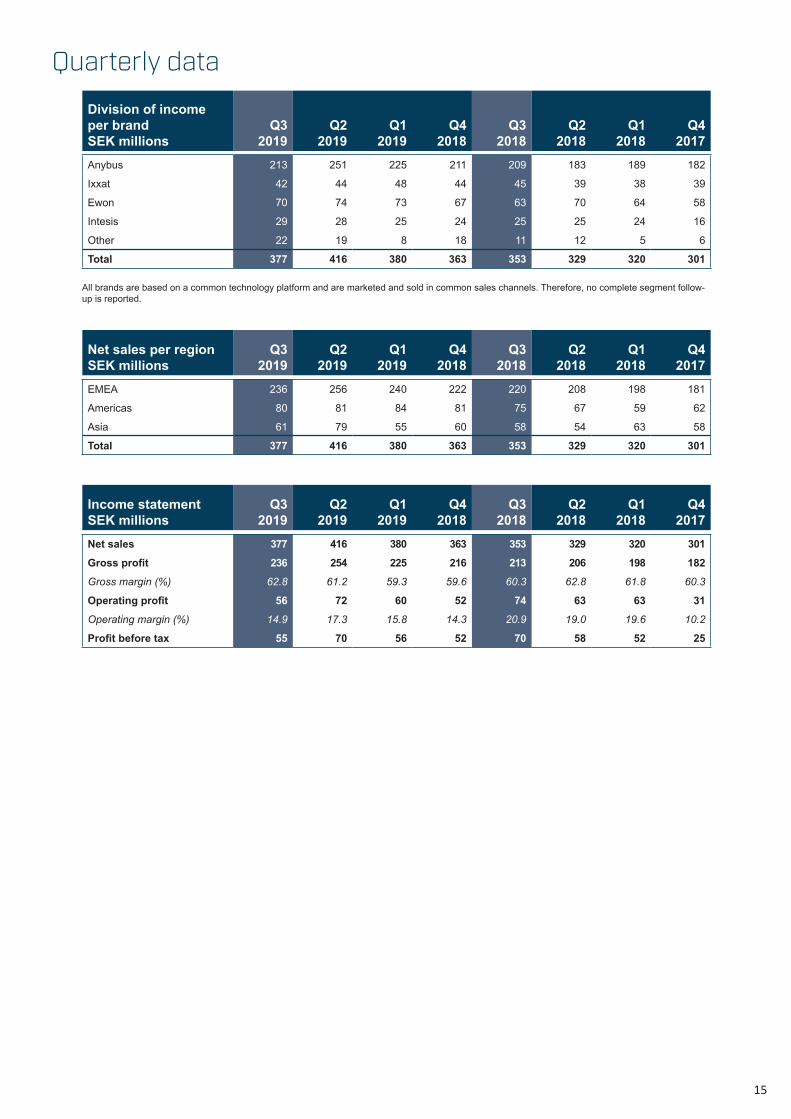
Net sales per regionSEK millions
Q32019
Q22019
Q1 2019
Q4 2018
Q3 2018
Q22018
Q1 2018
Q4 2017
EMEA 236 256 240 222 220 208 198 181
Americas 80 81 84 81 75 67 59 62
Asia 61 79 55 60 58 54 63 58
Total 377 416 380 363 353 329 320 301
Income statement SEK millions
Q32019
Q22019
Q1 2019
Q4 2018
Q3 2018
Q22018
Q1 2018
Q4 2017
Net sales 377 416 380 363 353 329 320 301Gross profit 236 254 225 216 213 206 198 182Gross margin (%) 62.8 61.2 59.3 59.6 60.3 62.8 61.8 60.3
Operating profit 56 72 60 52 74 63 63 31Operating margin (%) 14.9 17.3 15.8 14.3 20.9 19.0 19.6 10.2
Profit before tax 55 70 56 52 70 58 52 25
Quarterly data
Division of income per brandSEK millions
Q32019
Q22019
Q1 2019
Q4 2018
Q3 2018
Q22018
Q1 2018
Q4 2017
Anybus 213 251 225 211 209 183 189 182
Ixxat 42 44 48 44 45 39 38 39
Ewon 70 74 73 67 63 70 64 58
Intesis 29 28 25 24 25 25 24 16
Other 22 19 8 18 11 12 5 6
Total 377 416 380 363 353 329 320 301
All brands are based on a common technology platform and are marketed and sold in common sales channels. Therefore, no complete segment follow-up is reported.
15
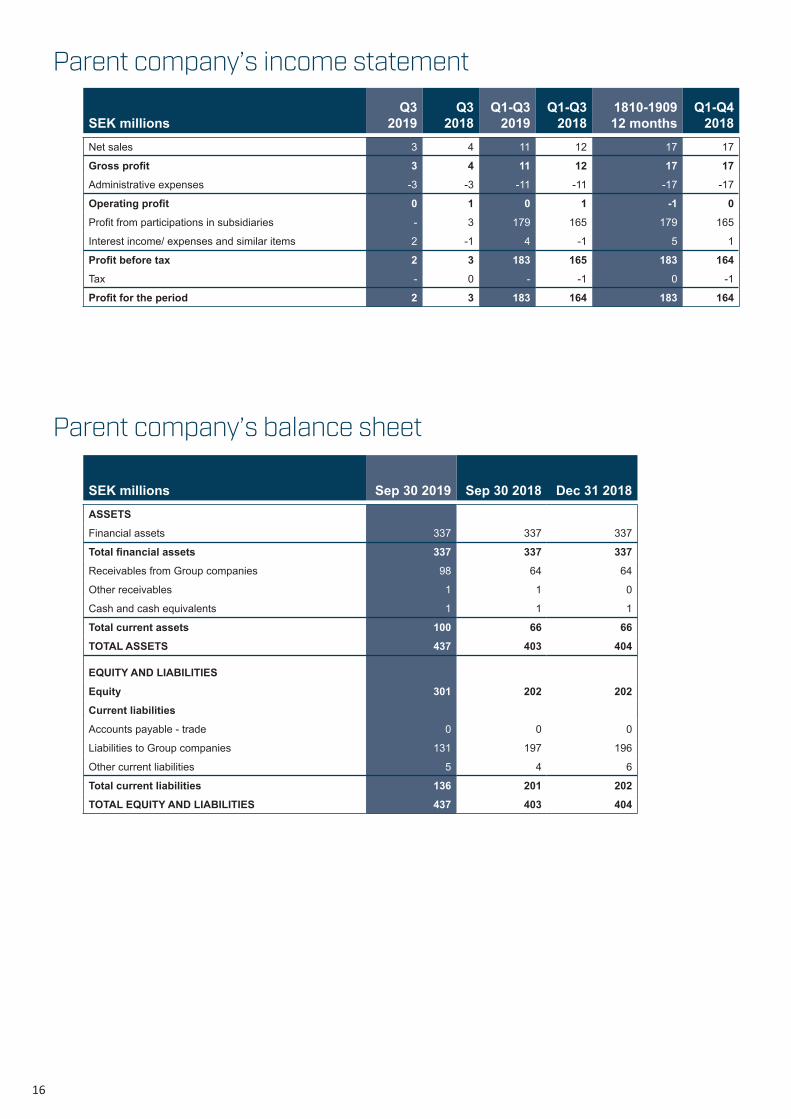
Parent company’s balance sheet
Parent company’s income statement
SEK millionsQ3
2019Q3
2018Q1-Q3
2019Q1-Q3
20181810-190912 months
Q1-Q4 2018
Net sales 3 4 11 12 17 17
Gross profit 3 4 11 12 17 17Administrative expenses -3 -3 -11 -11 -17 -17
Operating profit 0 1 0 1 -1 0Profit from participations in subsidiaries - 3 179 165 179 165
Interest income/ expenses and similar items 2 -1 4 -1 5 1
Profit before tax 2 3 183 165 183 164Tax - 0 - -1 0 -1
Profit for the period 2 3 183 164 183 164
SEK millions Sep 30 2019 Sep 30 2018 Dec 31 2018ASSETSFinancial assets 337 337 337
Total financial assets 337 337 337Receivables from Group companies 98 64 64
Other receivables 1 1 0
Cash and cash equivalents 1 1 1
Total current assets 100 66 66TOTAL ASSETS 437 403 404
EQUITY AND LIABILITIESEquity 301 202 202Current liabilitiesAccounts payable - trade 0 0 0
Liabilities to Group companies 131 197 196
Other current liabilities 5 4 6
Total current liabilities 136 201 202TOTAL EQUITY AND LIABILITIES 437 403 404
16
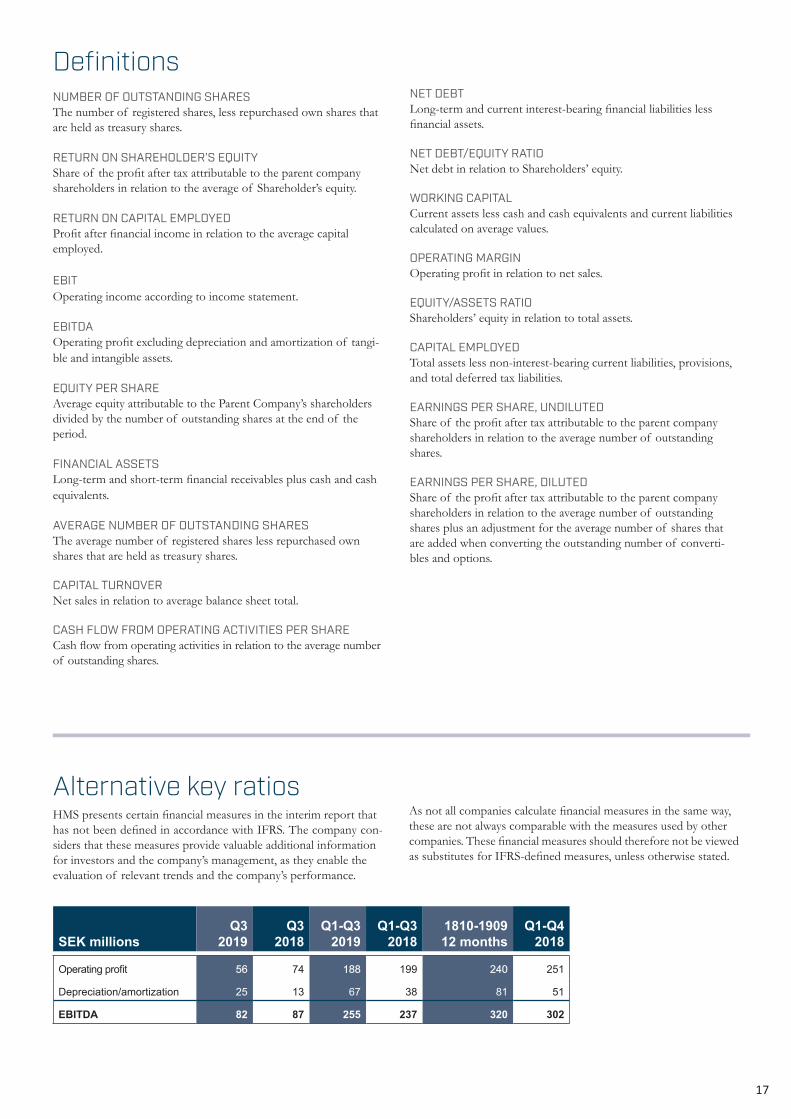
Alternative key ratiosHMS presents certain financial measures in the interim report thathas not been defined in accordance with IFRS. The company con-siders that these measures provide valuable additional informationfor investors and the company’s management, as they enable theevaluation of relevant trends and the company’s performance.
As not all companies calculate financial measures in the same way,these are not always comparable with the measures used by othercompanies. These financial measures should therefore not be viewed as substitutes for IFRS-defined measures, unless otherwise stated.
SEK millionsQ3
2019Q3
2018Q1-Q3
2019Q1-Q3
20181810-190912 months
Q1-Q4 2018
Operating profit 56 74 188 199 240 251
Depreciation/amortization 25 13 67 38 81 51
EBITDA 82 87 255 237 320 302
DefinitionsNUMBER OF OUTSTANDING SHARES The number of registered shares, less repurchased own shares that are held as treasury shares.
RETURN ON SHAREHOLDER’S EQUITY Share of the profit after tax attributable to the parent company shareholders in relation to the average of Shareholder’s equity.
RETURN ON CAPITAL EMPLOYED Profit after financial income in relation to the average capital employed.
EBIT Operating income according to income statement.
EBITDA Operating profit excluding depreciation and amortization of tangi-ble and intangible assets.
EQUITY PER SHARE Average equity attributable to the Parent Company’s shareholders divided by the number of outstanding shares at the end of the period.
FINANCIAL ASSETS Long-term and short-term financial receivables plus cash and cash equivalents.
AVERAGE NUMBER OF OUTSTANDING SHARESThe average number of registered shares less repurchased own shares that are held as treasury shares.
CAPITAL TURNOVERNet sales in relation to average balance sheet total.
CASH FLOW FROM OPERATING ACTIVITIES PER SHARE Cash flow from operating activities in relation to the average number of outstanding shares.
NET DEBT Long-term and current interest-bearing financial liabilities less financial assets.
NET DEBT/EQUITY RATIO Net debt in relation to Shareholders’ equity.
WORKING CAPITAL Current assets less cash and cash equivalents and current liabilities calculated on average values.
OPERATING MARGIN Operating profit in relation to net sales.
EQUITY/ASSETS RATIO Shareholders’ equity in relation to total assets.
CAPITAL EMPLOYED Total assets less non-interest-bearing current liabilities, provisions, and total deferred tax liabilities. EARNINGS PER SHARE, UNDILUTED Share of the profit after tax attributable to the parent company shareholders in relation to the average number of outstanding shares.
EARNINGS PER SHARE, DILUTED Share of the profit after tax attributable to the parent company shareholders in relation to the average number of outstanding shares plus an adjustment for the average number of shares that are added when converting the outstanding number of converti-bles and options.
17

18
HMS Networks AB (publ) is the leading independent supplier of solutions for industrial communication and the Industrial Internet of Things. HMS develops and manufactures products under the Anybus®, Ixxat® and Ewon® brands. Communication solutions for building automation are offered through the subsidiary Intesis. Development and manufacturing take place at the headquarters in Halmstad, and in Ravensburg, Nivelles, Igualada, Wetzlar and Buchen. Local sales and support are handled by branch offices in Germany, USA, Japan, China, Singapore, Italy, France, Switzerland, Spain, the Netherlands, India, UK, Sweden, South Korea and UAE, as well as through a worldwide network of distributors and part-ners. HMS employs over 600 people and reported sales of SEK 1,366 million in 2018. HMS is listed on the NASDAQ OMX in Stockholm, category Mid Cap, Information Technology.
19
HMS Networks AB (publ)Org.Nr. 556661-8954Box 4126 | 300 04 Halmstad | SwedenTel: +46 35 17 29 00 [email protected]/ir
Our mission“We drive innovation in collabora-tion with partners and customers creating leading technologies, prod-ucts and solutions bringing value to real-world challenges”.
Our vision“In a world where all devices are intelligent and networked… HMS is the leader in making indus-trial devices and systems commu-nicate – for a more productive and sustainable world.”.