Embed Size (px)
Citation preview

1
Pressure-Drop and Flow Rate Model of Slide Gate Metal Delivery Systems: (PFSG)
Hamed Olia1, Hyunjin Yang2, Seong-Mook Cho1, Mingyi Liang1, Mathew Zappulla1, and Brian G. Thomas1
1. Department of Mechanical Engineering, Colorado School of Mines Brown Hall W370-B, 1610 Illinois Street, Golden, CO, 80401, USA
Phone: 303-273-3309 Email: [email protected] (Hamed Olia) and [email protected] (Brian G. Thomas)
2. Swerim AB.
Aronstorpsvagen 1, Lulea, Sweden, SE 97437.
Keywords: continuous casting; pressure distribution; flow rate; PFSG
ABSTRACT
The pressure distribution in the flow delivery system is very important to steel quality, since the minimum pressure in the nozzle can cause air aspiration through cracks, joints, or porous refractory. A new MATLAB-based modeling tool has been developed to predict Pressure-drop Flow-rate relations in a Slide Gate system (PFSG) that enables researchers to investigate these phenomena. This model is validated with three-dimensional finite-difference model calculations and plant measurements and is applied to conduct parametric studies. The slide gate opening at which the minimum pressure occurs depends only on the nozzle diameter and is not affected by tundish height or casting speed. Decreasing lower diameter of the Submerged Entry Nozzle requires an increase in the slide gate opening to maintain casting speed. Furthermore, changing all diameters of the nozzle together has even more effect on the slide gate opening. This effect is beneficial to increase the minimum pressure in the system and lessen air aspiration problems.
INTRODUCTION
In continuous casting of steel, the delivery of molten steel into the mold can be controlled by either a stopper rod or a slide gate, and depends on the complete system, including the tundish, Upper Tundish Nozzle (UTN), Submerged Entry Nozzle (SEN), and its ports. In a slide gate control system, the main flow restriction from the reduced slide gate opening may cause negative pressure in the region. The negative pressure can induce partial vacuum which in turn may cause air aspiration from the environment into the nozzle [1, 2]. Oxygen in the aspirated air can react with metals in the molten steel to form oxides such as Alumina. The oxides can either attach to the nozzle wall, forming clogging leading to (SEN) replacement [3, 4], or can enter the mold and may be captured into the solidifying shell as inclusions [5, 6]. In addition to the productivity loss, clogging can lead to level fluctuations in the mold and surface defects [7]. Inclusions trapped in the shell can lead to final product defects, which lower steel strength and toughness and even safety problems from catastrophic failure [8, 9]. Thus, minimizing air aspiration may help to prevent nozzle clogging and inclusions. Argon gas can be injected through porous regions of the nozzle refractory as a solution for clogging [6]. Even surrounding the slide gate with a vacuum chamber has been implemented as another solution [10]. Finally, negative pressure and air aspiration depend greatly on the (UTN), slide-gate, and SEN geometry in addition to other casting conditions, including tundish height, casting speed, slide gate opening, and argon gas injection rate. Quantifying the pressure distribution through the metal delivery system is crucial to understanding multiphase flow behavior and avoiding aspiration problems discussed above. More specifically, it is critical to quantify the minimum pressure inside the nozzle. A few previous researchers have investigated the flow pattern and pressure inside the SEN for stopper rod [11] and slide-gate [1, 12] metal delivery systems. This study presents a new software package to calculate Pressure drop and Flow rate in Slide Gate metal-delivery systems, (PFSG).

2
PFSG PROGRAM DESCRIPTION
In PFSG, flow and pressure are calculated starting from the tundish, through the upper tundish nozzle (UTN), slide-gate plates, submerged entry nozzle (SEN), and ending at the top surface level in the mold. This model calculates the pressure at different points in slide gate metal delivery system as a function of geometry and process conditions. The process conditions include slide gate opening, strand area, fluid density (in case water model is investigated), flow rate, UTN and SEN absolute roughness, argon gas injection rate, and possible clogging. Theory The model utilizes a Bernoulli approach to calculate 1-D fluid flow and pressure at several points in the slide-gate flow-control system, from the molten steel top surface in the tundish, through the UTN, slide gate, SEN, ports, and to the mold level, as shown in Figure 1).
Figure 1. Typical pressure distribution for 10 points in slide gate metal delivery system
The Bernoulli equations consist of a set of simultaneous nonlinear equations involving pressure energy, potential energy, kinetic energy, and pressure energy loss at each of 10 points, which have the following form: 𝑃 = 𝑃 + 𝜌𝑔ℎ − 𝜌𝑔ℎ + 𝜌𝑉 − 𝜌𝑉 − ∑∆𝑃 (1) where 𝑃 is gauge pressure of point x [Pa], 𝜌 fluid density [kg/m3], 𝑉 velocity at point x [m/s], ℎ the height associated with point x [m], and g gravity acceleration [m/s2]. The pressure energy loss terms [Pa], ∑∆𝑃 , requires special treatment, which is geometry dependent. Details of the specific equations at each point in Figure 1 and how to calculate velocity, areas, clogging, and pressure losses are given elsewhere [13, 14]. Inputs and Outputs A typical set of conditions at a commercial slab caster (Inland steel caster [1]) is chosen as Case 1 to explain the PFSG model. Casting conditions and nozzle dimensions for the two cases investigated in this work are given in Figure 2. Conditions for Case 1 are also shown in Figure 2, which is also a snapshot of the main window of the user interface of the user-friendly PFSG program.

3
Figure 2. PFSG input for Case 1
By clicking on “Run Calculations” button, PFSG generates the error associated with a given set of inputs and the value of any one of 6 potentially-missing casting conditions (Main window) or any one of 8 potentially-missing Clogging values or the Slide Gate Pressure Drop Constant (Settings Menu), chosen by the user. This requires an inverse calculation, which is useful for the parametric studies discussed later. The error in the energy balance [kJ/m3] for the conditions specified should be near zero, ie < 0.001 kJ/m3, if the model has converged, indicating that the data is compatible.
Three graphs are plotted by clicking on “Plot graphs” button. Figure 3(a) shows the gauge pressure problem with vertical height plotted for the 10 points, for Case 1, shown in Figure 1 and Figure 2. Figure 3(b) shows flow rate variation with slide-gate opening fraction for three different definitions of slide gate opening. Case 1 is shown in Figure 3(b) as the “Current case” point.
(a) (b)
Figure 3. Typical results of PFSG (a) pressure distribution (b) flow rate (Case 1).

4
The relationship between the different slide gate opening definitions is depicted in Figure 4. These three definitions are: linear slide-gate opening fraction (fL), slide-gate area opening fraction, (fA) and plant offset linear opening fraction (fP), which depends on E and Emax, as discussed later.
(a) (b)
Figure 4. (a) Relationship between slide-gate opening measures fp, fL, and fA (b) geometrical relationship between parameters in calculating fL and fp (Case 1).
Additionally, the program outputs several other parameters in a .txt output file: port to bore area ratio, tundish top surface distance to the liquid level in the mold, plant offset slide gate opening fraction (fP), difference between linear and Plant offset slide gate opening fraction (|fL- fP|), UTN Reynolds number, SEN Reynolds number, port Reynolds number, strand Reynolds number, gauge pressure at 10 different points and their corresponding heights, hot argon gas flow rate at different points, and the total liquid flow rate based on all 3 different forms of the slide gate opening.
Parametric Study Feature An important feature of the PFSG program, that enables easy parametric studies, is its ability to find the value of any one unknown casting condition, given all other inputs (casting and geometric parameters). This feature enables realistic scenarios, such as changing a particular parameter, such as lower-SEN diameter, and calculating the value of a second parameter, chosen as the unknown, such as slide-gate opening, while keeping all other parameters constant, including casting speed and flow rate. In addition to the value of the unknown parameter, the new pressure distribution will be revealed. Different PFSG Versions PFSG Versions 1.0, 2.0, and 2.2 assume constant argon gas density and flow rate. PFSG Version 2.2 runs faster and includes a Settings menu (Figure 2) which enables input of variable clogging at different places inside the nozzle, variable wall roughness in UTN and SEN, pressure loss constants at slide gate and port, fluid density (steel or water to simulate a water model), number of nozzles mounted on tundish bottom, and transition Reynolds number for turbulent flow. Finally, PFSG Version 3.0 models varying argon gas flow rate due to gas expansion at different locations inside the system according to the local pressure. Different Slide Gate Opening Definitions Four different popular definitions of slide gate opening are considered in PFSG. Firstly, in this work, 𝑓 , linear slide-gate opening fraction, is employed, which is defined as: 𝑓 = (2)

5
where 𝐷 is slide gate diameter [m] and L is the gap [m], shown in Figure 4 (b). It ranges from fully closed (0%), when L = 0, to fully open (100%), when L = 𝐷 . The opening gap distance L is the maximum distance from the left side of the nozzle bore to the right side of the circular opening in the sliding gate plate.
Secondly, a practical measure, 𝑓 , plant offset linear opening fraction, is defined in terms of variable distance 𝐸 [m], shown in Figure 4 (b), and the distance to the fixed reference line, distance 𝐸 [m], which is offset (relative to fL) from the left side of the nozzle bore by the distance (Emax - DUSEN). Specifically, 𝑓 is defined as:
𝑓 = (3)
This common situation occurs when the reference line for zero opening (𝐸 = 0) does not align with the left edge of the lower plate (SEN nozzle bore). This measure of gate opening ranges from zero (when 𝐸 = 𝐸 − DSEN) to fully open (when 𝐸 = 𝐸 ). In the special case where the reference line does align, and Dslide=DSEN, then Emax = DSEN, E = L, and fp = fL.
Thirdly, a more fundamental measure, 𝑓 , is an area-based slide-gate opening fraction, defined as:
𝑓 = (4)
where 𝐴 is the area of gap (black shaded region in Figure 4(b)) in [m2]) and 𝐴 the area of lower plate [m2]. The user typically inputs 𝑓 and the program outputs the corresponding results for 𝑓 , and 𝑓 . Alternatively, if both E and Emax are input, and fL is left unknown, then the program calculates 𝑓 and uses it to find fL. If either E or Emax are left unknown, and 𝑓 is input, the program finds the missing value (E or Emax). If both E and Emax are unknown, then 𝑓 is assumed equal to fL, meaning Emax = DSlide. Note that E, Emax, and fL are related as follows: 𝐸 = 𝐸 − 𝑓 𝐷 + 𝐷 (5)
where: 𝐷 = min 𝐷 ,𝐷 (6)
where 𝐷 is diameter of upper/lower plate, which are assumed to always be the same.
The plant offset measure 𝑓 is useful for model calibration, if there is any uncertainty regarding the location of the reference line in the plant relative to the edge of the nozzle bore. Note that the user can input linear opening distance (instead of linear opening fraction), as a special case of 𝑓 , simply by setting Emax = Dp, and inputting E, which will then become the same as L. Beware that one of E, Emax, and fL must be left unknown, or the problem is over constrained and will give an error if these 3 inputs are not compatible. The program output, Figure 4, shows the relationship between all 3 methods to define slide-gate opening.
Solution Procedure The explicit pressure energy equations are solved simultaneously for the user-specified unknown using the fsolve subroutine in MATLAB. This subroutine iterates on the system of nonlinear equations until the relative error is ~ 10-12. The model runs in less than 2 s on a personal computer and typical converges to within 10-3 kJ/m3 error in energy balance of the system.
MODEL VERIFICATION AND VALIDATION
Flow rate and pressure distribution predictions using the PFSG models are compared with CFD simulations and available plant data to verify and validate the new program. Verification with CFD Three-dimensional finite-volume Computational Fluid Dynamics (CFD) modeling was applied to predict velocity and pressure fields in the nozzles during continuous casting of the real caster. The results then were compared with both PFSG calculations,

6
and plant measurements. A Reynolds-Averaged Navier-Stokes equations (RANS) based standard k-ε model is employed to predict the steady turbulent fluid flow field. This involves solving the continuity equation for mass conservation: 𝜌𝑢 = 0 (7)
and the Navier-Stokes equations for momentum conservation:
𝜌𝑢 𝑢 = − ∗ + 𝜇 + 𝜇 + (8)
where ρ is fluid density [kg/m3], ui is velocity in the 3 coordinate directions [m/s], p* is modified pressure (𝑝∗ = 𝑝 + 𝜌𝑘 ) [Pa], p is gauge static pressure [Pa], kr is turbulent kinetic energy, μ is dynamic viscosity of fluid [Pa.s], μt is turbulent viscosity [Pa.s]. To consider argon gas injection in the CFD models, the Eulerian-Eulerian multiphase flow model is implemented into the mass and momentum equations by treating gas/liquid phases as two separate, but coupled continuum fields [15, 16]. The computational domain includes the UTN, the slide gate (including upper, middle, and lower plates), the SEN, and the nozzle ports, but the tundish is treated with a simple analytical solution. The domains consist of hexahedral shaped cells for better computational efficiency in the finite volume method calculations. The discretized equations were solved for velocity and pressure by the Semi-Implicit Pressure Linked Equations (SIMPLE) algorithm, initiating from zero velocity in all cells in the domain. Convergence of the model calculations was defined when all scaled residuals were stably lower than 10-4.
Verification and Validation of PFSG with Inland Steel Plant Data Using experimental data (curve fit plant data) provided by Inland steel [1], Case 2 shown in Table I, the gate opening flow rate prediction has been plotted and compared with the PFSG Version 2.2, PFSG Version 3.0, and CFX simulations done by Bai et al. [1] in Figure 5(a). Also, the pressure distribution is plotted in Figure 5(b) for the same case using PFSG Version 2.2 and PFSG Version 3.0. As shown in Figure 5(a), flow rate-gate opening relation matches fairly well with both plant data and CFX predictions. [1] More specifically, the maximum error between PFSG Version 2.2 and the CFX simulations is around 4%.
Table I. Nozzle Geometry and Casting Conditions for Different Cases Used in This Study
Dimension / Condition Case 2 Case 3 UTN entry diameter [mm] 115 80 UTN length [mm] 260 255 Upper plate thickness [mm] 45 50 UTN exit diameter [mm] 75 80 Middle-plate thickness [mm] 45 25 Middle-plate bore diameter [mm] 75 80 Lower-plate thickness [mm] 100 160 SEN bore diameter [mm] 91 80 SEN length [mm] 703 714 Port height [mm] 78 80 Port area [mm2] 5625 4800 Port angle (down) [deg] 15 15 Slide-gate opening f [%] 50 (fp=62%) 40 Tundish depth h [mm] 1125 1030 Casting speed V [m/min] 1.58 (PFSG V3.0) & 1.9 (PFSG V2.2) 0.6 Argon gas flow rate [SLPM] 7 6 Submergence depth [mm] 120 210 Slab thickness [mm] × width [mm] 1321 × 203 300 × 1900 Fluid density [kg/m3] 7000 7000 Transition Reynolds number 4000 4000 Clogging 0 (everywhere) 0 (everywhere) Hot argon gas Temperature [K] 1823 1823 Dynamic viscosity of steel [Pa.s] 0.0063 0.0063

7
Also, it is clear from Figure 5(a) that the flow rate predicted by PFSG Version 3.0 and PFSG Version 2.2 do not exactly coincide, because flow rate drops in PFSG Version 3.0 due to the expanded gas volume in the low-pressure slide-gate region. For a given casting speed, higher slide-gate opening is needed to accommodate this expanded gas volume, when argon gas expansion is included (PFSG Version 3.0). Specifically, this effect would require ~4% increase in slide gate opening, to maintain the same steel flow rate. The pressure distribution for Case 2 (fL=50% and fp=62%) is plotted for both PFSG versions in Figure 5(b). For this gate opening, both pressure distributions are very similar, although the varying argon gas expansion in PFSG Version 3.0 causes a significant drop in molten steel flow rate, from 3.6 (PFSG V2.2) to 3.0 (PFSG V3.0) tonne/min.
(a) (b)
Figure 5. PFSG validation with Inland steel caster data [1] Case 2 (a) flow rate (b) pressure distribution. Verification of PFSG with FLUENT for Case 3 Figure 6 shows the pressure distribution predicted by PFSG Version 1 compared with 3-D CFD simulation results using ANSYS FLUENT. The 1-D model is seen to be in good agreement with the 3-D numerical simulation. The pressure, velocity, and argon gas volume distribution from the 3-D numerical simulation in the UTN, slide-gate, and SEN are illustrated in Figure 7. Although there are significant variations in velocity and volume fraction across the nozzle, the pressure distribution at a given height is similar, and features a similar large (minimum) negative pressure beneath the slide-gate as predicted by PFSG.
Figure 6. Pressure Distribution comparison of PFSG
and the 3-D model (CFD) for Case 3 Figure 7. (a) Pressure, (b) velocity and (c) gas volume
fraction field from the 3-D model for Case 3

8
PARAMETRIC STUDY
Having validated the PFSG model, parametric studies are performed to investigate the effect of nozzle diameter. First, the effect of lower-SEN diameter on pressure distribution and flow rate is studied, followed by investigating the effect of varying all nozzle diameters (UTN, slide gate plates, and SEN) together. Throughout, attention is focused on the effect on the minimum pressure in the system, owing to its practical importance to air aspiration. Effect of the Lower-SEN Diameter Change in Case 3 Four different lower-SEN diameters were simulated (DSEN,L= 51, 58, 66 and 75mm) to investigate the effect of lower-SEN diameter on the pressure distribution and flow rate using PFSG Version 1. Other geometry and casting conditions are fixed to the original case (Case 3). Since the energy balance in the system must be maintained, along with decreasing lower-SEN diameter, the slide-gate openings must also be increased to maintain the same throughput. Figure 8(a) shows the gauge pressure distributions predicted by PFSG for the different lower-SEN diameters. It can be seen that decreasing the lower-SEN diameter helps to reduce the negative pressure through the slide-gate. This benefit is accomplished by the increased slide-gate opening. The minimum pressure just below the slide-gate gradually increases by increasing lower-SEN diameter and the smallest diameter (DSEN,L=51mm) is the critical case that barely achieves positive gauge pressure. The effect of increasing the lower-SEN diameter on flow rate is shown in Figure 8(b). Figure 8(b) quantifies how decreasing the lower-SEN diameter (with the same gate opening) decreases the flow rate. This figure also shows how much the gate opening must increase to maintain the same flow rate for 0.6 m/min (0.0057 m3/s). Specifically, this is shown in the four points in this figure. Finally, it is clear that the maximum flow rate possible (at 100% open) decreases for decreasing the lower-SEN diameter. This lessens the ability to increase flow rate to compensate for some plant situation such as clogging, or a need to increase casting speed. This is the potential drawback associated with decreasing the SEN diameter to mitigate the negative pressure air aspiration problem.
(a) (b)
Figure 8. (a) Axial pressure Distributions and (b) flow rate for different lower-SEN diameters predicted by PFSG (Case 3) Effect of the Overall Nozzle Diameter Change in Case 3 Another version of the previous parametric study was investigated by varying all diameters (UTN, slide gate, upper SEN and lower-SEN) together. These nozzles are essentially straight vertical pipes. Four different diameters (52.6, 58, 66, 75mm) are tested. Results are similar to the first parametric study (Figure 8(a)), except the effect is much stronger, so the slide gate must open further to maintain a given flow rate (0.0057 m3/s in this case). This is quantified by comparing Figure 8(b) with Figure 9. This result is expected as decreasing the entire pipe diameter (ie. all 4 diameters) rather than only a portion of the nozzle below the slide gate (ie. lower SEN), naturally decreases the flow rate more. Furthermore, negative pressure is more difficult to avoid when decreasing all four diameters, owing to the extra flow restriction above the slide gate.
9
Figure 9. Effect of changing all diameters (UTN, slide gate, upper SEN and lower-SEN) on slide-gate opening 𝑓L - flow rate Q relation (Case 3)
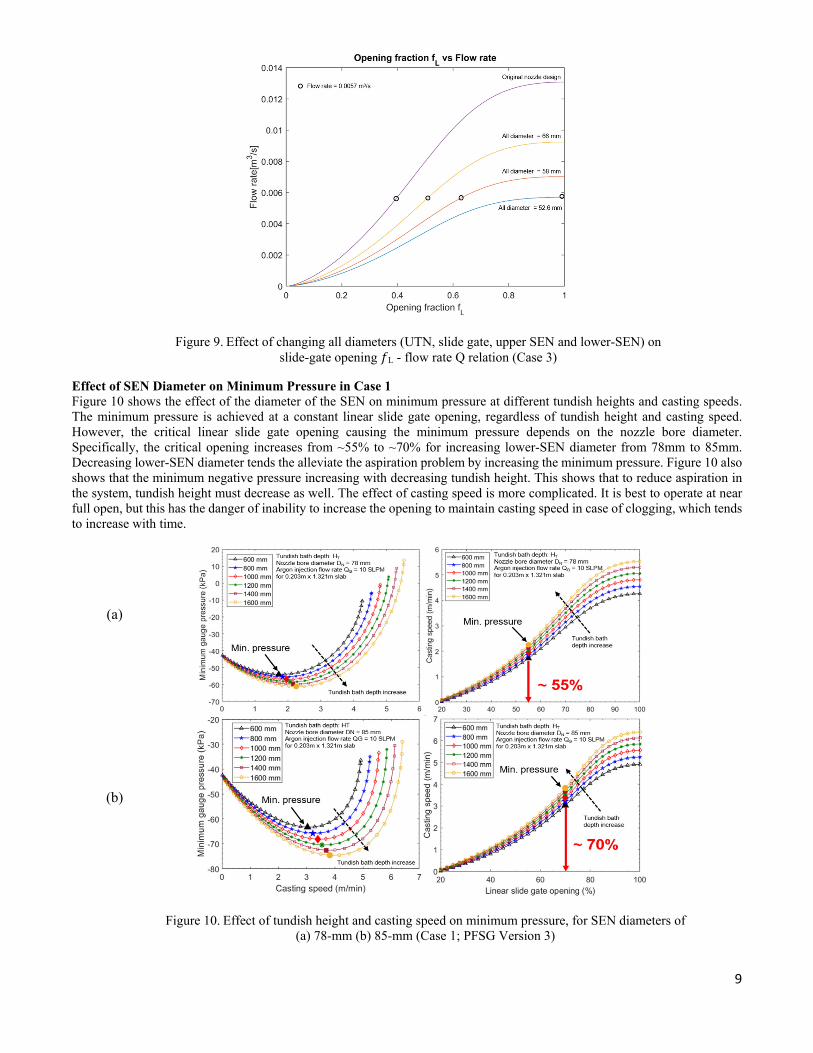
Effect of SEN Diameter on Minimum Pressure in Case 1 Figure 10 shows the effect of the diameter of the SEN on minimum pressure at different tundish heights and casting speeds. The minimum pressure is achieved at a constant linear slide gate opening, regardless of tundish height and casting speed. However, the critical linear slide gate opening causing the minimum pressure depends on the nozzle bore diameter. Specifically, the critical opening increases from ~55% to ~70% for increasing lower-SEN diameter from 78mm to 85mm. Decreasing lower-SEN diameter tends the alleviate the aspiration problem by increasing the minimum pressure. Figure 10 also shows that the minimum negative pressure increasing with decreasing tundish height. This shows that to reduce aspiration in the system, tundish height must decrease as well. The effect of casting speed is more complicated. It is best to operate at near full open, but this has the danger of inability to increase the opening to maintain casting speed in case of clogging, which tends to increase with time.
(a)
(b)
Figure 10. Effect of tundish height and casting speed on minimum pressure, for SEN diameters of (a) 78-mm (b) 85-mm (Case 1; PFSG Version 3)

10
SUMMARY AND CONCLUSIONS
A new, user-friendly, modeling tool to investigate Pressure distribution and Flow rate for Slide Gate metal delivery systems, PFSG, has been developed. It is verified with CFD simulations using ANYSYS FLUENT and validated with several different sets of plant data. For a given casting speed and flow rate, higher slide-gate opening is needed to accommodate the extra gas volume in the low-pressure region below the slide gate, when argon gas expansion is included in the model (PFSG Version 3.0). Finally, parametric studies with PFSG on the effect of nozzle diameter show:
• The slide gate opening increases with lower-SEN diameter decreases to maintain the same flow rate. • Decreasing SEN diameter significantly increases the slide gate opening, for a given casting speed, if the opening is
large enough. This is beneficial for increasing the minimum pressure in the system, which is found just below the slide gate.
• The effect of changing all nozzle diameters (UTN, slide gate, and SEN) together has more severe effect on the slide gate opening than changing only the lower-SEN diameter.
• The worst minimum pressure always occurs at a particular slide gate opening for a particular SEN diameter (lower and upper) which does not depend on either the tundish height or the casting speed.
• To avoid problems related to negative pressure, it is best to use smaller nozzle diameters, causing the slide gate to operate at near full open. However, this lessens plant flexibility to increase the opening to maintain casting speed in case of clogging.
ACKNOWLEDGEMENTS
Support from the Continuous Casting Center at Colorado School of Mines, Baosteel, China, and the National Science Foundation GOALI grant (Grant No. CMMI-18-08731) are gratefully acknowledged. Provision of FLUENT licenses through the ANSYS Inc. academic partnership program is also much appreciated.
REFERENCES
1. H. Bai and B. G. Thomas, “Effects of clogging, argon injection, and continuous casting conditions on flow and air aspiration in submerged entry nozzles,” Metallurgical and Materials Transactions B, Vol. 32, No. 4, 2001, pp. 702-722.
2. L. Zhang, Y. Wang, X. Zuo, “Flow Transport and Inclusion Motion in Steel Continuous-Casting Mold under Submerged Entry Nozzle Clogging Condition,” Metallurgical and Materials Transactions B, Vol. 39, No. 4, 2008, pp. 534-550.
3. K. G. Rackers and B. G. Thomas, “Clogging in Continuous Casting Nozzles,” 78th Steelmaking Conference Proceedings, The Iron and Steel Society, Warrendale, PA, Vol. 78, 1995, pp. 723-734.
4. Y. Murakami, S. Kodama and S. Konuma, “Quantitative evaluation of effects of non-metallic inclusions on fatigue strength of high strength steels. I: Basic fatigue mechanism and evaluation of correlation between the fatigue fracture stress and the size and location of non-metallic inclusions,” International Journal of Fatigue, 1989, vol. 11 (5), pp. 291-298.
5. J Knoepke, M Hubbard, J Kelly, R Kittridge, J Lucas, “Pencil blister reduction at inland steel company,” Steelmaking Conference Proceedings, Vol. 77, 1994, p. 381-388.
6. Brian G. Thomas, Alex Dennisov, Hua Bai, “Behavior of Argon Bubbles during Continuous Casting of Steel,” 80th Steelmaking Conference Proceedings, The Iron and Steel Society, Vol. 97, pp. 375-384.
7. B.G. Thomas, “Fluid Flow in the Mold,” Making, Shaping and Treating of Steel:Continuous Casting, Vol. 5, 2003, pp. 14.1-14.41.
8. A. D. Wilson, MS Thesis, “The Influence of Inclusions on the Toughness and Fatigue Properties of A516-70 Steel, ” Journal of Engineering Materials and Technology, 1979, vol. 101, No. 3, p. 265.
9. L. Zhang, J. Aoki, B. G. Thomas, “Inclusion removal by bubble flotation in a continuous casting mold, ” Metallurgical and Materials Transactions B, 2006, vol. 37, No. 3, pp. 361-379.
10. POSCO: Korean patent application 10-2012-0026720, 2012. 11. M. Javurek, M. Thumfart, R. Wincor, “Investigations on Flow Pattern and Pressure inside SEN below Stopper Rod,”
Steel research international, 2010, No. 8

11
12. R. Liu, B. G Thomas, B. Forman, H. Yin, “Transient turbulent flow simulation with water model validation and application to slide gate dithering”, AISTech Iron Steel Technol. Conf. Proc., 2012, Atlanta, GA, pp 1317.
13. H. Olia, B.G. Thomas, “Pressure Drop Flow Rate Model for Slide Gate Flow Control Systems (PFSG): A New CCC GUI Program,” Report presented at CCC annual meeting, 2017.
14. H. Olia, B.G. Thomas, “Flow Rate Stopper Position Model of NUCOR Caster using Pressure Drop Flow Rate Model for Stopper Rod Flow Control Systems (PFSR),” Report presented at CCC annual meeting, 2018.
15. ANSYS FLUENT 14.5-Theory Guide, ANSYS. Inc., Canonsburg, PA, USA, 2012.
16. CFX 4.2 User’s Manual, AEA Technology, Pittsburgh, PA, 1998.