Embed Size (px)
Citation preview
Prevalence and associations of Coronary Artery Calcification in Patients with Stages 3-5
Chronic Kidney Disease without Cardiovascular Disease
By
Jocelyn Suzanne Garland
A thesis submitted to the Department of Community Health and Epidemiology,
in conformity with the requirements for the degree of Master of Science
Queen’s University
Kingston, Ontario, Canada
April, 2009
Copyright © Jocelyn Suzanne Garland, 2009
Abstract
Background: Coronary artery calcification (CAC) is common in chronic kidney disease
(CKD) patients, and is demonstrable in fifty percent of incident dialysis patients.
Therefore, the process of CAC initiation likely occurs in the pre-dialysis period. Pre-
dialysis CKD patients have been shown to have a substantially higher burden of CAC
than age and sex matched controls from the general population. Consequently, the
hypothesis that CKD itself is a risk factor for CAC occurrence is biologically plausible.
Objective: 1) To quantify the relationship between CKD and CAC in stage three to five
CKD patients without known cardiovascular disease. 2) To estimate the strengths of
associations between traditional cardiovascular disease risk factors, non- traditional
cardiovascular disease risk factors and CAC in this patient population.
Methods: This cross-sectional study investigated one hundred and nineteen CKD
patients (excluding dialysis) receiving care at a single hospital in Kingston, Ontario,
Canada. For the primary objective, correlational analyses were performed to evaluate
associations between a priori selected variables of kidney function and CAC scores, as
well as other a priori chosen variables of interest.
Results: Mean and median CAC scores were 566.5 SD: 1108 and 111 (inter-quartile
range 2 to 631.5) respectively. CAC correlated with age (r = 0.44, p<0.001), body mass
index (r = 0.28, p = 0.002), high density lipoprotein cholesterol (r = -0.23, p = 0.01),
diabetes mellitus (r = 0.23, p = 0.01), and the cardiovascular risk score (r = 0.35; p <
0.001). By multivariable linear regression controlling for eGFR and diabetes, age (ß =
0.05, 95% CI 0.03-0.06; p<0.001), body mass index (ß = 0.04, 0.02 - 0.07; p=0.001), and
i
serum calcium (ß = 0.9, 0.15 - 1.6; p=0.02), were risk factors for CAC. Results from
multivariable logistic regression modeling demonstrated consistent findings.
Limitations: Inadequate sample size and uncontrolled confounding are possible
limitations, but are unlikely to have changed the main study findings.
Conclusions: In this study, traditional cardiovascular disease risk factors and serum
calcium were associated with coronary artery calcification. No association was
demonstrated between CKD and CAC. Studies exploring potential protective
mechanisms against coronary artery calcification are needed.
ii

Co- Authorship Statement
This thesis and accompanying manuscript is the work of Jocelyn S. Garland MD along
with the following co-authors:
Rachel M. Holden MD, Division of Nephrology, Department of Medicine, Queen’s
University, enrolled patients in this study, participated in clinical aspects regarding study
design, and edited the manuscript.
Patti A. Groome PhD, Department of Community Health and Epidemiology, Queen’s
University, is Jocelyn Garland’s thesis co-supervisor, and was involved with the study
design and manuscript preparation.
Miu Lam PhD, Department of Community Health and Epidemiology, Queen’s
University, is part of Jocelyn Garland’s thesis committee, and was involved in planning
the statistical analysis.
Robert L. Nolan MD reviewed all CT scans for this study, and provided advice regarding
the coronary artery calcification scan procedure.
A. Ross Morton MD, Division of Nephrology, Department of Medicine, Queen’s
University, participated in clinical aspects regarding study design, and edited the
manuscript.
William Pickett PhD, Department of Community Health and Epidemiology, Queen’s
University, is Jocelyn Garland’s thesis co-supervisor, and was involved with the study
design and manuscript preparation.
iii

Drs Garland, Holden and Morton are members of the Queen’s University Vascular
Calcification Research Group. The idea to study the association of coronary artery
calcification and chronic kidney disease was Jocelyn Garland’s, and statistical analysis,
interpretations of results, and writing the manuscript were done by Jocelyn Garland in
collaboration with the above co-authors.
In preparation of the thesis components, Jocelyn Garland was the primary author and
received feedback from her thesis supervisors, Drs. Patti Groome, and William Pickett.
iv

Acknowledgements
I would like to acknowledge all co-authors for their help and guidance in bring this work
to fruition, from the study design, patient enrollment, and to manuscript preparation.
Your time, effort and work are very much appreciated.
v
TABLE OF CONTENTS
Abstract ................................................................................................................................ i
Co- authorship statement ................................................................................................... iii
Acknowledgements............................................................................................................. v
Table of contents................................................................................................................ vi
List of tables………………………………………………………………………………ix
List of figures………………………………………………………………...……………x
Abbreviations..................................................................................................................... xi
Chapter 1: Introduction ....................................................................................................... 1
1.1 Chronic kidney disease and cardiovascular disease.................................................. 1
1.2 Coronary artery calcification and chronic kidney disease ........................................ 3
1.3 Clinical studies exploring the relationship between chronic kidney disease and coronary artery calcification in chronic kidney disease patients not requiring dialysis . 4
1.4 Objectives and Hypothesis........................................................................................ 5
1.5 Reference List ........................................................................................................... 6
Chapter 2: Literature review ............................................................................................. 10
2.1 Biological mechanism of vascular calcification ..................................................... 10
2.2 Vascular calcification occurs through mechanisms similar to those of developing bone............................................................................................................................... 10
2.3 Chronic kidney disease definition and diagnosis.................................................... 12
2.4 Clinical studies examining the relationship between chronic kidney disease and cardiovascular disease................................................................................................... 13
vi
2.5 Relationship between coronary artery calcification and cardiovascular disease in the general population................................................................................................... 14
2.6 Relationship between coronary artery calcification and chronic kidney disease in the dialysis population .................................................................................................. 15
2.7 Relationship between CAC and CKD in the pre-dialysis CKD population ........... 16
2.8 Clinical significance, summary and rationale......................................................... 17
2.9 Reference List ......................................................................................................... 19
Chapter 3: Methods (supplementary to those contained in manuscript)........................... 25
3.1 Study design............................................................................................................ 25
3.2 Inclusion criteria ..................................................................................................... 25
3.3 Definition of cardiovascular disease....................................................................... 25
3.4 Enrollment procedure.............................................................................................. 26
3.5 Measurement issues ................................................................................................ 26 A) Measurement of estimated glomerular filtration rate .......................................... 26 B) Measurement of cardiovascular disease risk........................................................ 27 C) Coronary artery calcification measurement ......................................................... 28
3.6 Data compilation, sample size and analysis............................................................ 28 A) Data management ................................................................................................ 28 B) Sample size considerations .................................................................................. 29
3.7 Ethical considerations and safety............................................................................ 29
3.8 Reference list .......................................................................................................... 31
Chapter 4: Manuscript....................................................................................................... 33
Abstract:........................................................................................................................ 35
Introduction................................................................................................................... 37
Materials and Methods.................................................................................................. 38
Results........................................................................................................................... 42
Discussion..................................................................................................................... 45
References..................................................................................................................... 51
Chapter 5: Implications..................................................................................................... 66
5.1 Summary of key findings........................................................................................ 66
5.2 Information and selection bias ................................................................................ 67
vii
5.3 External validity and confounding.......................................................................... 69
5.4 Study design limitations.......................................................................................... 70
5.5 Sample size considerations ..................................................................................... 70
5. 6 Future research opportunities................................................................................. 71
5.7 Conclusion .............................................................................................................. 72
5.8 Reference list .......................................................................................................... 73
Appendix 1 - Sample of information and consent form for patients .............................. 766
Appendix 2 - Confirmation of ethics approval ................................................................. 81
Appendix 3 - Responses to editorial reviews.................................................................... 82
viii
LIST OF TABLES
Chapter 1
1.1 Stages of Chronic Kidney Disease…………………………………………...………1
1.2 Conceptual Model : Coronary Artery Calcification and Chronic Kidney Disease…..3
Chapter 4
Table 1: Clinical Characteristics of Study Participants Stratified by Chronic Kidney
Disease (CKD) Stage 3-5……………………………………………………….………..55
Table 2: Correlations (unadjusted) between Coronary Artery Calcification Score and
Cardiovascular Disease Risk Factors…………………………………………………….57
Table 3: Multivariable linear regression risk factors for coronary calcification…….......58
Table 4: Multivariable logistic regression risk factors for coronary artery
calcification……………………………………...…………………………….………..59
ix
LIST OF FIGURES
Chapter 4
Figure 1: Selection of Study Participants……………………………………….……….61
Figure 2: Coronary artery calcification total scores by CKD stage...………….…….......62
Figure 3: Relationship between log Coronary Artery Calcification Total Score and eGFR
(N=119)…………………………………………………………………………………..63
x

xi
Abbreviations
CAC Coronary Artery Calcification CKD Chronic Kidney Disease eGFR estimated Glomerular Filtration Rate GFR Glomerular Filtration Rate MDRD Modification of Diet in Renal Disease sCr serum Creatinine EBCT Electron Beam Computed Tomography MSCT Multi Slice Computed Tomography
Chapter 1: Introduction
1.1 Chronic kidney disease and cardiovascular disease
Chronic kidney disease (CKD) is defined as the presence of kidney damage with
or without reduced kidney function (1). Once detected, for clinical purposes CKD is
divided into stages, with mild CKD represented by stages one and two, and moderate to
severe CKD represented by stages three to five. CKD may be diagnosed by calculating an
estimate of the glomerular filtration rate (GFR), which describes the flow rate of filtered
fluid passing through the glomerulus (functional unit of the kidney) per unit time (1). In
2004, it was estimated that 11% of the general population in the United States had CKD,
translating into more than 19 million people (2).
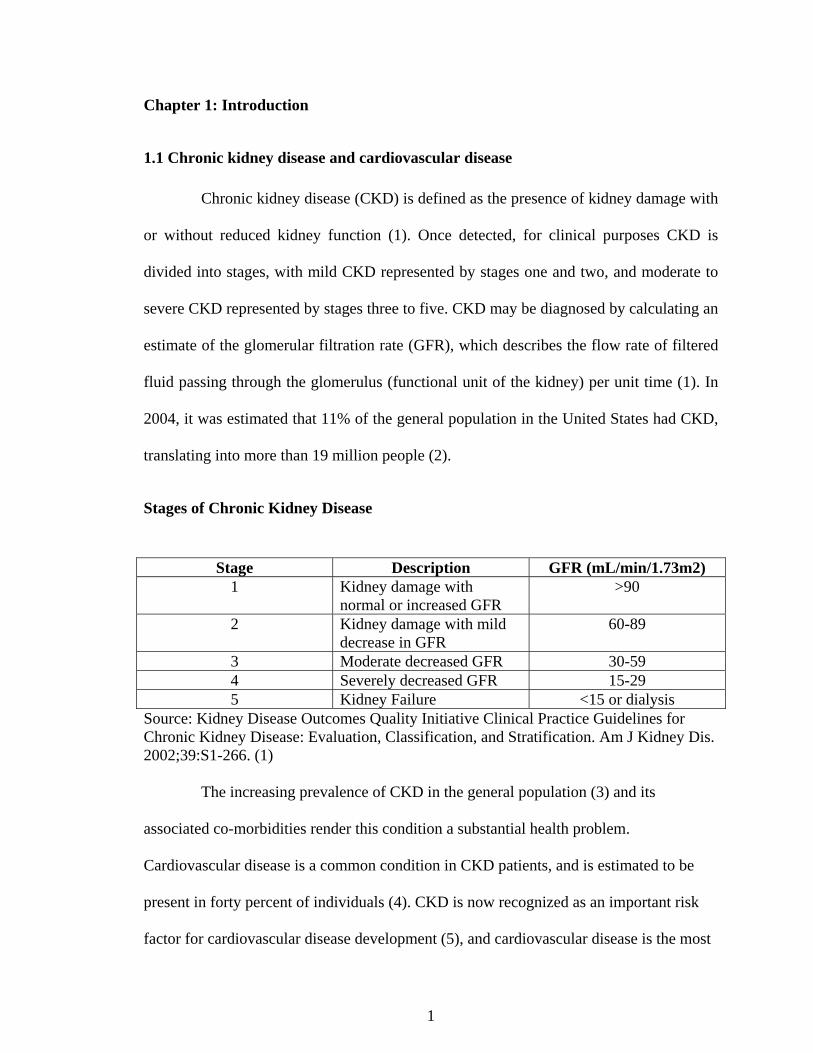
Stages of Chronic Kidney Disease
Stage Description GFR (mL/min/1.73m2) 1 Kidney damage with
normal or increased GFR >90
2 Kidney damage with mild
decrease in GFR 60-89
3 Moderate decreased GFR 30-59 4 Severely decreased GFR 15-29 5 Kidney Failure <15 or dialysis
Source: Kidney Disease Outcomes Quality Initiative Clinical Practice Guidelines for Chronic Kidney Disease: Evaluation, Classification, and Stratification. Am J Kidney Dis. 2002;39:S1-266. (1)
The increasing prevalence of CKD in the general population (3) and its
associated co-morbidities render this condition a substantial health problem.
Cardiovascular disease is a common condition in CKD patients, and is estimated to be
present in forty percent of individuals (4). CKD is now recognized as an important risk
factor for cardiovascular disease development (5), and cardiovascular disease is the most
1
common cause of death in CKD patients (5-8). The etiology of cardiovascular disease in
individuals with CKD is multi-factorial (9-11). Although traditional cardiovascular
disease risk factors (older age, male sex, hypertension, hyperlipidemia, and diabetes
mellitus) are more prevalent in individuals with CKD than in the general population (12),
these factors are likely inadequate to explain the increased risk of cardiovascular disease
in individuals with CKD (13). Rather, non-traditional risk factors unique to the CKD
population are important contributors to the development of cardiovascular disease once
kidney function is moderately to severely decreased, such as inflammation (14)
hyperhomocysteinemia (15), altered bone mineral metabolism (16,17), hypervolemia,
microalbuminuria, anemia, impaired kidney function, and low serum albumin (18).
Several studies have identified an increased risk of fatal and nonfatal
cardiovascular events in the CKD population (5-11). In dialysis patients, the risk of death
from cardiovascular disease is 9% per year of hemodialysis (13), and cardiovascular
disease mortality is 10-20 times higher in dialysis patients than in the general population
after adjustment for age, sex, and diabetes mellitus (13). Of even greater concern is that a
large proportion of individuals with CKD will die from cardiovascular disease related
causes before requiring dialysis (19). Many individuals with CKD are unaware that they
have developed kidney disease, (due to the asymptomatic nature of the disorder in earlier
stages), and are at increased risk for developing cardiovascular disease. (20). Therefore,
there is an urgent need to study the epidemiology of cardiovascular disease in chronic
kidney disease patients.
2
1.2 Coronary artery calcification and chronic kidney disease
Coronary artery calcification (CAC) is a form of cardiovascular disease common
in CKD patients. Fifty percent of incident dialysis patients have documented evidence of
this phenonomen (21), and its presence is associated with an increased cardiovascular
death risk (22). Since CAC is prevalent in incident dialysis patients, it follows that CAC
development must occur in the pre-dialysis period.
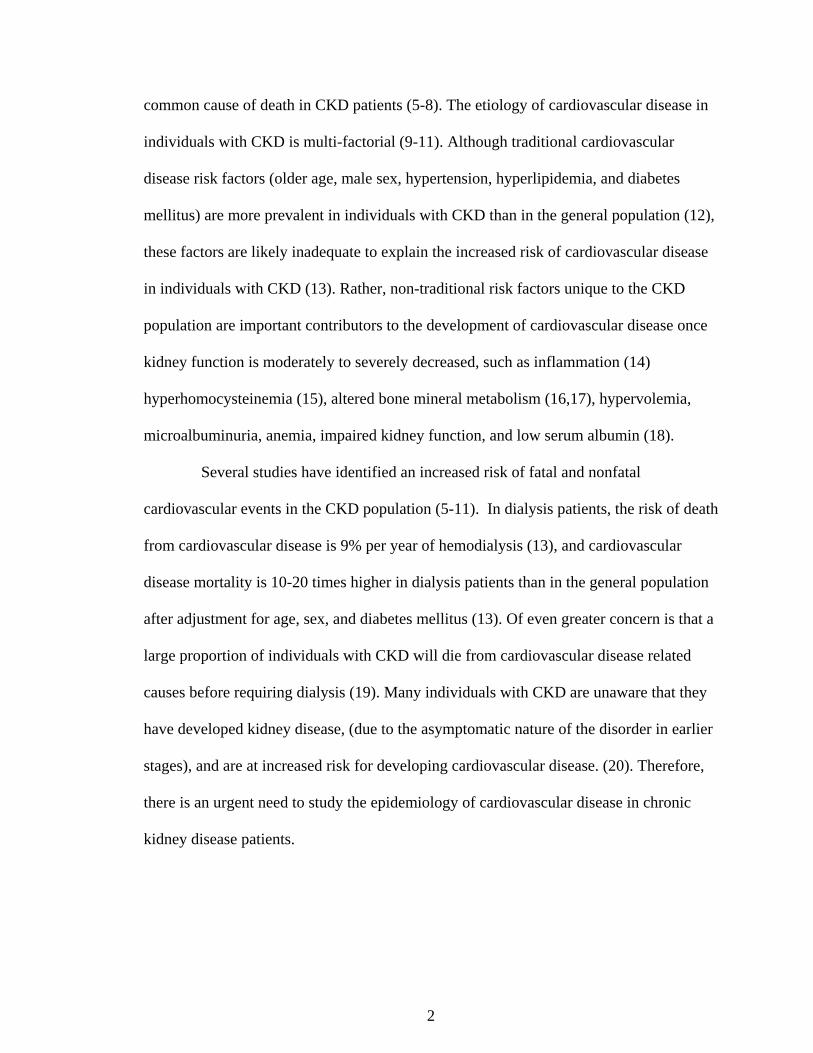
Past research efforts have described an association between CKD and CAC (23,
24). Pre-dialysis CKD patients have been shown to have a substantially higher burden of
CAC than age and sex matched controls from the general population (25). The following
Conceptual Model depicts the importance of traditional and non traditional
Conceptual Model: Coronary Artery Calcification and Chronic Kidney Disease
Adapted from: Parfrey PS. Cardiac disease in dialysis patients: diagnosis, burden of disease, prognosis, risk factors and management. Nephrol Dial Transplant. 2000;15 Suppl 5:58-68. (18)
A rte rioscler osis(Mo nc keber g’s Sc leros is )
C alcium deposition in medial la yer of bloo d vesse l w all
Tradit ional Cardio vascular Dise ase R isk Facto rs
AgeM ale SexHype rtensionHype rlipidemiaDiabete s M ellitusSmokingFamily history
N on traditional C ardiovascular D ise ase R isk Factors
M icroalbuminuriaAne miaHy pe rhomocysteinemiaCa lcium/Phosphate M eta bolismVo lume O verloadInflam mationHy poa lbumine mia
A ther osclerosisFatty plaque development a nd depos ition in intimallayer of medium and large bloo d vessel w alls
C oronary A rte ry Calcif ication
C hronic Kidne y Disease
3
cardiovascular disease risk factors which are postulated to impact on the calcification
process. The higher prevalence of traditional risk factors is thought to be insufficient to
explain the increased burden of CAC in the CKD population (12). Non-traditional risk
factors, as previously described, are believed to be of greater importance in CKD patients
who develop vascular calcification (26). Therefore, it is plausible that non-traditional risk
factors, including a CKD diagnosis, are vitally important in contributing to the severity of
CAC demonstrated in CKD patients. These non-traditional risk factors, unique to the
CKD population, may create metabolic abnormalities that initiate the calcification
process. This process is believed to accelerate as kidney function declines, suggesting
CKD itself is a risk factor for CAC occurrence.
1.3 Clinical studies exploring the relationship between chronic kidney disease and
coronary artery calcification in chronic kidney disease patients not requiring
dialysis
Few studies have systematically examined for the presence and risk factors for
CAC in individuals with CKD not receiving dialysis (11, 18-20). Fox et al (23) and
Kramer et al (24) examined the potential association of CKD and CAC in cohorts
comprised primarily of individuals with mild CKD (stages one and two). Results
demonstrated an initial association between CAC score and decreased kidney function,
which no longer remained in adjusted analyses. Seyahi et al (25) enrolled 101 individuals
with Stages one and two CKD, and evaluated the association between decreased kidney -
function and CAC against 99 matched controls. No association was demonstrated.
Similarly, Russo et al (26) and Tomiyama et al (27) examined CAC scores in non-
4
dialysis CKD patients, but the relationship between kidney function and CAC was not
evaluated in detail.
Despite the lack of association between CKD and CAC in these studies, it is
possible that a relationship does exist, but was missed because of the inclusion of
individuals with very early CKD. These individuals may not have developed CKD
metabolic complications associated with CAC, which occur when kidney function is
moderately to severely impaired (stages three to five CKD).
The relationship between CKD and CAC is important to discern, since CAC is a
risk factor for cardiovascular death in this population (5). An improved understanding of
the risk factors for CAC in the CKD population is critical for the nephrology community
to understand, so that treatment strategies may be developed to prevent the occurrence of
premature cardiovascular death in CKD patients.
1.4 Objectives and hypothesis
This study sought to understand better the relationship between CKD and CAC in
individuals with moderate to severe CKD. The objectives for this thesis are:
1. To quantify the association between CKD and CAC in individuals with
confirmed stage 3-5 CKD (excluding dialysis), without symptoms or history of
cardiovascular disease.
2. To evaluate the associations between traditional cardiovascular disease risk
factors, non- traditional cardiovascular disease risk factors and CAC in this
patient population.
Hypothesis: CAC presence and severity will increase as kidney function declines in
stage 3 to 5 CKD patients without known cardiovascular disease.
5

1.5 Reference List
(1) K/DOQI clinical practice guidelines for chronic kidney disease: evaluation,
classification, and stratification. Am J Kidney Dis. 2002;39:S1-266.
(2) Clase CM, Garg AX, Kiberd BA. Prevalence of low glomerular filtration rate in
nondiabetic Americans: Third National Health and Nutrition Examination Survey
(NHANES III). J Am Soc Nephrol. 2002;13:1338-49.
(3) Coresh J, Astor BC, Greene T, Eknoyan G, Levey AS. Prevalence of chronic kidney
disease and decreased kidney function in the adult US population: Third National Health
and Nutrition Examination Survey. Am J Kidney Dis. 2003;41:1-12.
(4) Murphy SW, Foley RN, Parfrey PS. Screening and treatment for cardiovascular
disease in patients with chronic renal disease. Am J Kidney Dis. 1998;32:S184-S199.
(5) Weiner DE, Tighiouart H, Amin MG, Stark PC, MacLeod B, Griffith JL et al.
Chronic kidney disease as a risk factor for cardiovascular disease and all-cause mortality:
a pooled analysis of community-based studies. J Am Soc Nephrol. 2004;15:1307-15.
(6) Culleton BF, Larson MG, Wilson PW, Evans JC, Parfrey PS, Levy D. Cardiovascular
disease and mortality in a community-based cohort with mild renal insufficiency. Kidney
Int. 1999;56:2214-19.
(7) Mann JF, Gerstein HC, Pogue J, Bosch J, Yusuf S. Renal insufficiency as a predictor
of cardiovascular outcomes and the impact of ramipril: the HOPE randomized trial. Ann
Intern Med. 2001;134:629-36.
(8) Muntner P, He J, Hamm L, Loria C, Whelton PK. Renal insufficiency and subsequent
death resulting from cardiovascular disease in the United States. J Am Soc Nephrol.
2002;13:745-53.
6
(9) Locatelli F, Pozzoni P, Tentori F, del VL. Epidemiology of cardiovascular risk in
patients with chronic kidney disease. Nephrol Dial Transplant. 2003;18 Suppl 7:vii2-vii9.
(10) Muntner P, He J, Astor BC, Folsom AR, Coresh J. Traditional and nontraditional
risk factors predict coronary heart disease in chronic kidney disease: results from the
atherosclerosis risk in communities study. J Am Soc Nephrol. 2005;16:529-38.
(11) Foley RN, Parfrey PS, Sarnak MJ. Clinical epidemiology of cardiovascular disease
in chronic renal disease. Am J Kidney Dis. 1998;32:S112-S119.
(12) Longenecker JC, Coresh J, Powe NR, Levey AS, Fink NE, Martin A et al.
Traditional cardiovascular disease risk factors in dialysis patients compared with the
general population: the CHOICE Study. J Am Soc Nephrol. 2002;13:1918-27.
(13) Foley RN, Murray AM, Li S, Herzog CA, McBean AM, Eggers PW, Collins AJ.
Chronic kidney disease and the risk for cardiovascular disease, renal replacement, and
death in the United States Medicare population, 1998 to 1999. J Am Soc Nephrol. 2005
Feb;16(2):489-95.
(14) Stenvinkel P. Interactions between inflammation, oxidative stress, and endothelial
dysfunction in end-stage renal disease. J Ren Nutr. 2003;13:144-48.
(15) Suliman ME, Stenvinkel P, Barany P, Heimburger O, Anderstam B, Lindholm B.
Hyperhomocysteinemia and its relationship to cardiovascular disease in ESRD: influence
of hypoalbuminemia, malnutrition, inflammation, and diabetes mellitus. Am J Kidney
Dis. 2003;41:S89-S95.
(16) Block GA, Hulbert-Shearon TE, Levin NW, Port FK. Association of serum
phosphorus and calcium x phosphate product with mortality risk in chronic hemodialysis
patients: a national study. Am J Kidney Dis. 1998;31:607-17.
7
(17) K/DOQI clinical practice guidelines for bone metabolism and disease in chronic
kidney disease. Am J Kidney Dis. 2003;42:S1-201.
(18) Parfrey PS. Cardiac disease in dialysis patients: diagnosis, burden of disease,
prognosis, risk factors and management. Nephrol Dial Transplant. 2000;15 Suppl 5:58-
68.
(19) Keith DS, Nichols GA, Gullion CM, Brown JB, Smith DH. Longitudinal follow-up
and outcomes among a population with chronic kidney disease in a large managed care
organization. Arch Intern Med. 2004; 22;164(6):659-63.
(20) Coresh J, Byrd-Holt D, Astor BC, Briggs JP, Eggers PW, Lacher DA et al. Chronic
kidney disease awareness, prevalence, and trends among U.S. adults, 1999 to 2000. J Am
Soc Nephrol. 2005;16:180-188.
(21) Block GA, Spiegel DM, Ehrlich J, Mehta R, Lindbergh J, Dreisbach A, Raggi P.
Effects of sevelamer and calcium on coronary artery calcification in patientsnew to
hemodialysis.Kidney Int. 2005 Oct;68(4):1815- 24
(22) Matsuoka M, Iseki K, Tamashiro M et al: Impact of high coronary artery
calcification score (CACS) on survival in patients on chronic hemodialysis. Clin Exp
Nephrol 8: 54-58, 2004
(23) Fox CS, Larson MG, Keyes MJ, Levy D, Clouse ME, Culleton B et al. Kidney
function is inversely associated with coronary artery calcification in men and women free
of cardiovascular disease: the Framingham Heart Study. Kidney Int. 2004;66:2017-21.
(24) Kramer H, Toto R, Peshock R, Cooper R, Victor R. Association between chronic
kidney disease and coronary artery calcification: the Dallas Heart Study. J Am Soc
Nephrol. 2005;16:507-13.
8

(25) Seyahi N, Kahveci A, Bolgayirli M et al: Coronary artery calcification and
chronically decreased GFR in living kidney donors. Am J Kidney Dis. 2007; 49:143-152.
(26) Russo D, Palmiero G, De Blasio AP, Balletta MM, Andreucci VE. Coronary artery
calcification in patients with CRF not undergoing dialysis. Am J Kidney Dis.
2004;44:1024-30.
(27) Tomiyama C, Higa A, Dalboni MA et al: The impact of traditional and non-
traditional risk factors on coronary calcification in pre-dialysis patients. Nephrol Dial
Transplant 21: 2464-2471, 2006
9
Chapter 2: Literature Review
2.1 Biological mechanism of vascular calcification
There are two distinct types of arterial calcification known to manifest in
individuals with chronic kidney disease: intimal and medial arterial wall calcification (1).
Both patterns of calcification are important, as both contribute to the development of
cardiovascular disease by different mechanisms. Intimal calcification or atherosclerosis,
is a patchy process leading to focal areas of plaque formation and occlusive lesions (2).
Clinically, atherosclerosis may lead to obstruction of the blood vessel lumen and, in
advanced stages, may impede blood flow completely causing tissue ischemia and
necrosis (e.g. myocardial infarction). Medial calcification or Monckeberg's sclerosis
(arteriosclerosis) is characterized by diffuse mineral deposition of the medial blood vessel
wall at the level of the internal elastic lamina (2). Clinically, arteriosclerosis may lead to
vascular stiffness and reduced vascular compliance, increased systolic blood pressure and
widened pulse pressure. These hemodynamic changes predispose an individual to adverse
ventricular remodeling (left ventricular hypertrophy) and diastolic dysfunction. They
have also been associated with increased risk of death attributable to cardiovascular
disease in hemodialysis patients (3).
2.2 Vascular calcification occurs through mechanisms similar to those of developing bone
Blood vessels contain vascular smooth muscle cells which possess the ability,
through tissue specific cellular mechanisms, to transform into osteoblast-like (bone
forming) cells. This transformation leads these cells to produce "bone" in the blood vessel
10
wall (i.e. vascular ossification) and this process appears to be accelerated in CKD patients
(4).
The mechanisms of vascular calcification in CKD remain incompletely
understood; however, the extent of vascular calcification reflects disequilibrium between
processes which promote calcification, and those which inhibit it. Risk factors for
cardiovascular disease and vascular calcification are shared, and include traditional and
non-traditional factors. Traditional cardiovascular disease risk factors are more prevalent
in the CKD population, thus increasing risk for cardiovascular disease (5). Non-
traditional risk factors are also more common in the CKD population (6,7), and
independently increase risks for cardiovascular disease (6,7) and vascular calcification
(8). Whether CKD itself is an independent risk factor for vascular calcification is
uncertain, and is the subject of this study.
Several factors have been proposed to promote the aggressive vascular
calcification observed in CKD patients. In CKD, non-traditional cardiovascular disease
risk factors (including inflammation, hyper-homocysteinemia, oxidative stress, as well as
the development of secondary hyperparathyroidism and accompanying abnormalities in
serum phosphorous and calcium concentrations) occur as kidney function declines (9).
First, hyperphosphatemia alone has been associated with an increased risk of death from
cardiovascular disease (7). Second, required use of calcium-containing phosphate binders
and administration of active vitamin D sterols to treat secondary hyperparathyroidism
exacerbate calcium/phosphate imbalance, and may worsen vascular calcification (10).
Third, inhibitors to vascular calcification may be reduced or are defective in CKD.
Known inhibitors fetuin-A, matrix Gla-protein and osteoprotegerin (11) appear to be
11

involved in vascular calcification, but their mechanisms and magnitudes of contribution
to this problem in kidney disease remain controversial.
2.3 Chronic kidney disease definition and diagnosis
In 2002, The National Kidney Foundation, in an effort to improve CKD
diagnosis, recommended kidney function be determined by calculating an estimate of the
glomerular filtration rate (GFR) (12). GFR describes the flow rate of filtered fluid passing
through the glomerulus (functional unit of the kidney) per unit time (12). Many formulae
have been developed and validated as a means of estimating GFR (eGFR). CKD is
diagnosed based on the obtained eGFR result, with stages one and two describing less
severe kidney disease, and stages three to five describing moderate to severe CKD. For
earlier stages of CKD, impaired eGFR alone is insufficient to diagnose CKD (12). Other
features suggesting CKD are required, such as kidney ultrasound abnormality, urinalysis
abnormality, or metabolic derangements consistent with CKD (12). For all stages, the
finding of low eGFR must be persistent (at least three months duration) so as to ensure
the diagnosis is not simply a one time occurrence (12). These requirements are very
important to ensure CKD is correctly diagnosed, as obtained eGFR results are less precise
when eGFR is calculated to be greater than 60/mLmin/1.73m2 (13-15). The eGFR
equation used in this study is the following:
MDRD estimated Glomerular filtration rate formula (13)
Estimated GFR = 175 X (sCr umol/L/88.4)–1.154 X age –0.203 X (0.742 for women) X (1.21 if African American), where sCr= serum creatinine, umol/L
12
2.4 Clinical studies examining the relationship between chronic kidney disease and
cardiovascular disease
Observational studies have demonstrated that CKD presence is an independent
risk factor for increased cardiovascular disease morbidity and mortality (16-19). This
observation, although concerning, may simply be a result of confounding, and a diagnosis
of CKD may simply be reflective of the duration and severity of underlying
cardiovascular disease risk factors. Alternatively, it is also possible that CKD itself may
either initiate or accelerate the development of cardiovascular disease through traditional
risk factors, and/or through mechanisms of non traditional cardiovascular disease risk
factors (20). In this circumstance, CKD may indeed increase the risk of cardiovascular
disease development, and a “true” relationship between CKD and cardiovascular disease
development would be important to discern.
It is difficult to ascertain the true prevalence of cardiovascular disease in CKD
patients, and whether or not degree of kidney function is independently associated with
cardiovascular disease development. Cardiovascular disease occurs in the absence of
symptoms in many CKD patients; consequently, individuals with CKD may have
inappropriately low rates of cardiovascular disease diagnosis (21,22). However, screening
for cardiovascular disease in CKD patients who do not have cardiovascular symptoms is
currently not recommended (21). The reference standard diagnostic test for
cardiovascular disease detection is coronary angiography. This test is invasive and
requires an injection of radio-contrast dye increasing risk of nephrotoxicity, worsening
kidney function and dialysis initiation. Because of these risks, CKD patients are often not
referred for coronary angiography, unless symptoms are overt and unmanageable
13
medically (22). This is unfortunate as it has been shown that patients with CKD who
undergo angiography and subsequent revascularization have decreased cardiovascular
mortality relative to those who do not (OR 0.58, 95% confidence interval 0.5,0.67) (29).
Therefore, non- invasive methods to diagnose cardiovascular disease in patients who
have less severe kidney disease are desirable.
Diagnosis of cardiovascular disease by detection of CAC with Electron Bean CT
(EBCT) (23) or MSCT (24) may be useful as a surrogate for cardiovascular disease
diagnosis in CKD patients (30). EBCT and MSCT have both been used to quantify CAC,
and have the advantage of being non-invasive and do not require the administration of
nephro-toxic radio-contrast agent. However, studies published to date examining CKD
patients and CAC scores are mainly limited to the dialysis population (25-30). Studies of
CAC scores in pre-dialysis CKD patients are few, and are either underpowered or have
other epidemiological concerns.(31-34). In addition, studies have excluded older
individuals, and patients who have diabetes mellitus. These exclusions limit the external
validity of obtained results to a typical Canadian CKD clinic, where older, diabetic
individuals comprise greater than 50% of patients (35).
2.5 Relationship between coronary artery calcification and cardiovascular disease in
the general population
In the general population, CAC has been shown to be associated with an increased
risk of cardiovascular disease morbidity and mortality in individuals known to have
cardiovascular disease, and also in asymptomatic individuals at increased risk for
developing cardiovascular disease. (36-40). Arad et al demonstrated that, in individuals
without a history of cardiovascular disease or kidney disease, CAC scores greater than
14
160 were associated with an odds ratio of 19.7 (95% confidence interval 6.9,56.4) for
developing a cardiac event over 3.6 years, adjusting for cardiovascular disease risk
factors (37). Diabetic patients who do not have established kidney disease have been
found to have higher CAC scores compared to individuals who do not have diabetes
mellitus. Raggi et al (38) screened approximately 900 diabetic individuals and
determined the average CAC score to be twice the score of non-diabetic individuals.
Other studies have produced similar results (41,42). CAC scores have also been reported
to be higher in individuals with advancing age (40).
2.6 Relationship between coronary artery calcification and chronic kidney disease in
the dialysis population
In considering patients who have end stage renal disease, the significance of
elevated CAC scores is less clear. Goodman et al studied 39 young (less than 30 years of
age) non-diabetic hemodialysis patients who received dialysis treatment for an average of
7 years (43). All patients underwent EBCT studies to evaluate CAC. Patients younger
than 20 years of age did not have any evidence of increased CAC; whereas, 88% of those
greater than 30 years of age had evidence of increased CAC. In those who had elevated
CAC, most were severely calcified and total CAC scores were commonly in the
thousands. Interestingly, none of these hemodialysis patients with increased CAC scores
had symptoms of cardiovascular disease, yet CAC scores were much higher compared to
scores of individuals asymptomatic for cardiovascular disease in the general population
as previously described. In addition, CAC scores were found to be higher in those who
required hemodialysis for longer duration (14 ± 5 years versus 4 ± 4 years; p= 0.001)
suggesting that dialysis may accelerate the development of CAC. In another study
15
performed in forty-nine hemodialysis patients aged twenty-eight to seventy-four, the
median CAC score was found to be very high (595; interquartile range, 76 to 1600) and
the odds of having a higher CAC score were greater in older individuals (p=0.02) and in
individuals with diabetes (p=0.01) (44).
Therefore, in the hemodialysis population, the prevalence of CAC is high, CAC
scores are much higher than scores observed in individuals without evidence of chronic
kidney disease, CAC increases as hemodialysis duration increases, and CAC appears to
be progressive over time. Although CAC scores have been found to be profoundly
elevated in the dialysis population, it is unknown whether CAC occurs to the same degree
in the pre-dialysis population. However, it is reasonable to hypothesize that since incident
dialysis patients have increased CAC scores, the calcification process in pre-dialysis
CKD patients is initiated as kidney function declines; however, at which CKD stage the
calcification begins or accelerates, is unknown.
2.7 Relationship between coronary artery calcification and chronic kidney disease in
the pre-dialysis chronic kidney disease population
In considering individuals with CKD who do not require hemodialysis, it is
controversial whether CKD itself is a risk factor for CAC development. Two studies have
attempted to demonstrate such an association (33, 34). Both studies enrolled individuals
from the general population who were found on screening blood work to have impaired
eGFR, possibly reflective of early CKD (Stages one and two CKD). Fox et al (33)
examined three hundred and nineteen individuals and determined a negative association
between decreased kidney function and CAC scores. This association was lost upon
adjustment for a priori confounders and non-traditional cardiovascular disease risk factors
16
were not examined. Further, a major limitation of this study is the fact that level of
kidney function (eGFR) was determined years before CAC testing was actually
measured, and results are therefore unreliable. This study, although reporting a non-
significant association between decreased kidney function and CAC, may not have truly
investigated the relationship between CKD and CAC. The finding of decreased kidney
function (impaired eGFR) alone, corresponding to what would be considered early CKD,
does not necessarily allow for a CKD diagnosis, as other factors are necessary to
diagnose CKD (for example urinalysis abnormality). It is possible that individuals in this
study were misclassified as having CKD, and the lack of association between CAC and
CKD is a reflection of misclassification bias, which lends uncertainty to the study results.
In another study of individuals under 65 years of age sampled from the general
population, 211 were determined to have CKD (34). However, again, only 41 patients
had confirmed CKD as determined by eGFR less than 60/mLmin/1.73m2 This study
initially demonstrated a negative association between increased CAC scores and
decreased kidney function; however, this observation did not remain in the adjusted
analyses
2.8 Clinical significance, summary and rationale
In summary, compared to the general population, dialysis patients have a higher
prevalence of traditional cardiovascular disease risk factors, a higher risk of
cardiovascular disease morbidity and mortality, and a higher prevalence of increased
CAC scores. In pre-dialysis CKD patients, although a possible association between
impaired kidney function and CAC exists, there are few studies examining this
relationship, and concerns with study methodologies remain. The study base for
17
published investigations reporting on the association of CKD and cardiovascular disease
risk has been comprised from the general population where stage one and two CKD
patients would be expected to be over-represented. The relationship between CAC and
CKD has not been properly explored in a true CKD population. Therefore, the
significance of elevated CAC scores and its relationship to kidney function in CKD
patients warrants investigation. The issue of when CAC begins or accelerates in
individuals with CKD is crucial to ascertain so that treatment and preventive strategies
may be developed.
We propose to examine whether level of kidney function, as determined by eGFR,
is a risk factor for CAC in a population of stage three to five CKD patients, adjusting for
traditional and kidney-related cardiovascular disease risk factors. Results from this study
will serve to provide preliminary data for prospective longitudinal studies. If CAC scores
increase as kidney function declines, it will be possible to design studies to determine the
relative risk of cardiovascular morbidity and mortality in CKD patients who have
increased CAC scores, and whether measures aimed at treating CAC are efficacious in
improving cardiovascular disease events in this population.
18
2.9 Reference List
(1) Goodman WG, London G, Amann K, Block GA, Giachelli C, Hruska KA et al.
Vascular calcification in chronic kidney disease. Am J Kidney Dis. 2004;43:572-79.
(2) London GM, Drueke TB. Atherosclerosis and arteriosclerosis in chronic renal failure.
Kidney Int. 1997;51:1678-95.
(3) Blacher J, Guerin AP, Pannier B, Marchais SJ, London GM. Arterial calcifications,
arterial stiffness, and cardiovascular risk in end-stage renal disease. Hypertension.
2001;38:938-42.
(4) Shroff RC, Shanahan CM. The vascular biology of calcification. Semin Dial. 2007;
20(2):103-9.
(5) Muntner P, He J, Astor BC, Folsom AR, Coresh J. Traditional and nontraditional risk
factors predict coronary heart disease in chronic kidney disease: results from the
atherosclerosis risk in communities study. J Am Soc Nephrol. 2005;16:529-38.
(6) Weiner DE, Tighiouart H, Elsayed EF, Griffith JL, Salem DN, Levey AS, Sarnak MJ.
The relationship between nontraditional risk factors and outcomes in individuals with
stage 3 to 4 CKD. Am J Kidney Dis. 2008; 51(2):212-23.
(7) Block GA, Hulbert-Shearon TE, Levin NW, Port FK. Association of serum
phosphorus and calcium x phosphate product with mortality risk in chronic hemodialysis
patients: a national study. Am J Kidney Dis. 1998;31:607-17.
(8) Tomiyama C, Higa A, Dalboni MA et al: The impact of traditional and non-traditional
risk factors on coronary calcification in pre-dialysis patients. Nephrol Dial Transplant 21:
2464-2471, 2006
19
(9) Clase CM, Kiberd BA, Garg AX. Relationship between glomerular filtration rate and
the prevalence of metabolic abnormalities: results from the Third National Health and
Nutrition Examination Survey (NHANES III). Nephron Clin Pract. 2007;105(4):c178-
184.
(10) Block GA, Spiegel DM, Ehrlich J, Mehta R, Lindbergh J, Dreisbach A, Raggi P.
Effects of sevelamer and calcium on coronary artery calcification in patientsnew to
hemodialysis. Kidney Int. 2005 Oct;68(4):1815- 24
(11) Moe SM, Reslerova M, Ketteler M, O'neill K, Duan D, Koczman J et al. Role of
calcification inhibitors in the pathogenesis of vascular calcification in chronic kidney
disease (CKD). Kidney Int. 2005; 67:2295-304.
(12) K/DOQI clinical practice guidelines for chronic kidney disease: evaluation,
classification, and stratification. Am J Kidney Dis. 2002; 39:S1-266.
(13) Levey AS, Coresh J, Greene T et al: Chronic Kidney Disease Epidemiology
Collaboration. Expressing the Modification of Diet in Renal Disease Study equation for
estimating glomerular filtration rate with standardized serum creatinine values.
Clin Chem. 2007; 53: 766-772.
(14) Rule AD, Larson TS, Bergstralh EJ et al: Using serum creatinine to estimate
glomerular filtration rate: accuracy in good health and in chronic kidney disease.
Ann Intern Med. 2004; 141: 929-937.
(15) Froissart M, Rossert J, Jacquot C et al: Predictive performance of the modification of
diet in renal disease and Cockcroft-Gault equations for estimating renal function.
J Am Soc Nephrol. 2005; 16: 763-773.
20
(16) Weiner DE, Tighiouart H, Amin MG, Stark PC, MacLeod B, Griffith JL et al.
Chronic kidney disease as a risk factor for cardiovascular disease and all-cause mortality:
a pooled analysis of community-based studies. J Am Soc Nephrol. 2004;15:1307-15.
(17) Culleton BF, Larson MG, Wilson PW, Evans JC, Parfrey PS, Levy D.
Cardiovascular disease and mortality in a community-based cohort with mild renal
insufficiency. Kidney Int. 1999; 56:2214-19.
(18) Mann JF, Gerstein HC, Pogue J, Bosch J, Yusuf S. Renal insufficiency as a predictor
of cardiovascular outcomes and the impact of ramipril: the HOPE randomized trial. Ann
Intern Med. 2001; 134:629-36.
(19) Muntner P, He J, Hamm L, Loria C, Whelton PK. Renal insufficiency and
subsequent death resulting from cardiovascular disease in the United States. J Am Soc
Nephrol. 2002;13:745-53.
(20) Muntner P, He J, Astor BC, Folsom AR, Coresh J. Traditional and nontraditional
risk factors predict coronary heart disease in chronic kidney disease: results from the
atherosclerosis risk in communities study. J Am Soc Nephrol. 2005;16:529-38.
(21) Murphy SW, Foley RN, Parfrey PS. Screening and treatment for cardiovascular
disease in patients with chronic renal disease. Am J Kidney Dis. 1998;32:S184-S199.
(22) Chertow GM, Normand SL, McNeil BJ. "Renalism": inappropriately low rates of
coronary angiography in elderly individuals with renal insufficiency. J Am Soc Nephrol.
2004; 15:2462-68.
(23) Raggi P. Coronary calcium on electron beam tomography imaging as a surrogate
marker of coronary artery disease. Am J Cardiol. 2001; 87:27A-34A.
21

(24) Becker CR, Kleffel T, Crispin A, Knez A, Young J, Schoepf UJ et al. Coronary
artery calcium measurement: agreement of multirow detector and electron beam CT. AJR
Am J Roentgenol. 2001;176:1295-98.
(25) Goodman WG, Goldin J, Kuizon BD, Yoon C, Gales B, Sider D et al. Coronary-
artery calcification in young adults with end-stage renal disease who are undergoing
dialysis. N Engl J Med. 2000;342:1478-83.
(26) Raggi P, Boulay A, Chasan-Taber S, Amin N, Dillon M, Burke SK et al. Cardiac
calcification in adult hemodialysis patients. A link between end-stage renal disease and
cardiovascular disease? J Am Coll Cardiol. 2002;39:695-701.
(27) Haydar AA, Hujairi NM, Covic AA, Pereira D, Rubens M, Goldsmith DJ. Coronary
artery calcification is related to coronary atherosclerosis in chronic renal disease patients:
a study comparing EBCT-generated coronary artery calcium scores and coronary
angiography. Nephrol Dial Transplant. 2004;19:2307-12.
(28) Adragao T, Pires A, Lucas C, Birne R, Magalhaes L, Goncalves M et al. A simple
vascular calcification score predicts cardiovascular risk in haemodialysis patients.
Nephrol Dial Transplant. 2004;19:1480-1488.
(29) Moe SM, O'Neill KD, Fineberg N, Persohn S, Ahmed S, Garrett P et al. Assessment
of vascular calcification in ESRD patients using spiral CT. Nephrol Dial Transplant.
2003; 18:1152-58.
(30) Braun J, Oldendorf M, Moshage W, Heidler R, Zeitler E, Luft FC. Electron beam
computed tomography in the evaluation of cardiac calcification in chronic dialysis
patients. Am J Kidney Dis. 1996; 27:394-401.
22
(31) Russo D, Palmiero G, De Blasio AP, Balletta MM, Andreucci VE. Coronary artery
calcification in patients with CRF not undergoing dialysis. Am J Kidney Dis.
2004;44:1024-30.
(32) Tomiyama C, Higa A, Dalboni MA et al: The impact of traditional and non-
traditional risk factors on coronary calcification in pre-dialysis patients. Nephrol Dial
Transplant. 2006; 21: 2464-2471.
(33) Fox CS, Larson MG, Keyes MJ, Levy D, Clouse ME, Culleton B et al. Kidney
function is inversely associated with coronary artery calcification in men and women free
of cardiovascular disease: the Framingham Heart Study. Kidney Int. 2004;66:2017-21.
(34) Kramer H, Toto R, Peshock R, Cooper R, Victor R. Association between chronic
kidney disease and coronary artery calcification: the Dallas Heart Study. J Am Soc
Nephrol. 2005;16:507-13.
(35) Curtis BM, Barrett BJ, Djurdjev O, Singer J, Levin A. Evaluation and treatment of
CKD patients before and at their first nephrologists encounter in Canada. Am J Kidney
Dis. 2007;50(5):733-42.
(36) Alexopoulos D, Toulgaridis T, Davlouros P, Christodoulou J, Sitafidis G, Hahalis G
et al. Prognostic significance of coronary artery calcium in asymptomatic subjects with
usual cardiovascular risk. Am Heart J. 2003;145:542-48.
(37) Arad Y, Spadaro LA, Goodman K, Newstein D, Guerci AD. Prediction of coronary
events with electron beam computed tomography. J Am Coll Cardiol. 2000;36:1253-60.
(38) Raggi P, Shaw LJ, Berman DS, Callister TQ. Prognostic value of coronary artery
calcium screening in subjects with and without diabetes. J Am Coll Cardiol.
2004;43:1663-69.
23
(39) Shemesh J, Morag-Koren N, Goldbourt U, Grossman E, Tenenbaum A, Fisman EZ
et al. Coronary calcium by spiral computed tomography predicts cardiovascular events in
high-risk hypertensive patients. J Hypertens. 2004;22:605-10.
(40) Lamonte MJ, Fitzgerald SJ, Church TS, Barlow CE, Radford NB, Levine BD et al.
Coronary artery calcium score and coronary heart disease events in a large cohort of
asymptomatic men and women. Am J Epidemiol. 2005;162:421-29.
(41) Mehrotra R, Budoff M, Christenson P, Ipp E, Takasu J, Gupta A et al. Determinants
of coronary artery calcification in diabetics with and without nephropathy. Kidney Int.
2004;66:2022-31.
(42) Qu W, Le TT, Azen SP, Xiang M, Wong ND, Doherty TM et al. Value of coronary
artery calcium scanning by computed tomography for predicting coronary heart disease
in diabetic subjects. Diabetes Care. 2003;26:905-10.
(43) Goodman WG, Goldin J, Kuizon BD, Yoon C, Gales B, Sider D et al. Coronary-
artery calcification in young adults with end-stage renal disease who are undergoing
dialysis. N Engl J Med. 2000;342:1478-83.
(44) Raggi P, Boulay A, Chasan-Taber S, Amin N, Dillon M, Burke SK et al. Cardiac
calcification in adult hemodialysis patients. A link between end-stage renal disease and
cardiovascular disease? J Am Coll Cardiol. 2002;39:695-701.
24

Chapter 3: Methods (Supplementary to those contained in manuscript)
3.1 Study design
This was a cross-sectional observational study designed to evaluate the
relationship between kidney function and CAC in Stage three to five CKD patients
without diagnosed cardiovascular disease.
3.2 Inclusion criteria
The study base for this investigation was comprised of patients presenting for
kidney disease follow-up from July 2005 to September 2006 at Kingston General
Hospital. The sampling frame involved consecutive patients attending Kingston General
Hospital’s Chronic Kidney Disease clinic, as well as from 4 of 8 separate private
nephrologists’ clinics. Patients were excluded if they had any of the following conditions:
1) pregnancy; 2) dialysis or renal transplant recipient; 3) age less than 18 years; 4)
diagnosed cardiovascular disease as indicated by a history of a cardiovascular event or
condition, or current cardiovascular disease symptoms.
3.3 Definition of cardiovascular disease
Cardiovascular disease was defined by both history of previous cardiovascular
event or condition and/or current symptoms using New York Heart Association and
Canadian Cardiovascular Society criteria for heart failure (1) and angina (2), respectively.
25

Event history included history of myocardial infarction, angina, coronary artery bypass
graft or angioplasty, transient ischemic attack, cerebrovascular accident, peripheral
vascular disease, congestive heart failure.
3.4 Enrollment Procedure
The study was introduced to eligible patients during scheduled appointments
within the weekly chronic kidney disease clinic located in Kingston General Hospital.
Informed consent (Appendix 1) was obtained prior to study recruitment. By consenting to
participate in this study, the patient provided consent to have blood drawn and analyzed
for kidney disease parameters of interest, as well as undergo a MSCT scan of the heart at
a later date.
3.5 Measurement Issues
A) Measurement of estimated glomerular filtration rate
Levy and colleagues developed and validated a 7 variable equation known as the
MDRD predictive GFR equation to estimate kidney function (3). This equation calculates
GFR based on an individual’s serum creatinine as well as other variables known to
influence kidney function. This equation was validated against the reference standard
inulin clearance and was found to provide a reliable estimation of kidney function (r2=0
.903) (3). The original Levy equation was modified in 2000 to a simplified 4 variable
equation and was found to perform extremely well compared to the original 7 variable
equation (r2=0.892)(4). Therefore, this simplified equation (4), re-expressed for
standardized serum creatinine (5), was used to calculate eGFR in this study. Individuals
26
who have stage one and two CKD (eGFR greater than 60 mLmin/1.73m2 ) were
excluded, as the accuracy of obtained eGFR measurements above this level has been
determined to be less precise (6-8).
B) Measurement of cardiovascular disease risk
Wilson and colleagues (9) developed a cardiovascular disease prediction
algorithm using known risk factors for coronary artery disease (age, gender, diabetes
mellitus, smoking, hypertension, hyperlipidemia). This score is a well-validated tool
designed to predict the likelihood of a future cardiovascular event over ten years in
individuals who have no diagnosed cardiovascular disease at the time of scoring.
Although this score has been validated in the general population and not the CKD
population, it was nevertheless an important variable to include in our analysis plan for
two reasons. First, it allowed for the inclusion of multiple risk factors in one score,
increasing the statistical efficiency of the analysis as compared to a plan that would have
included each risk factor separately. Second, traditional cardiovascular disease risk
factors have been shown to be risk factors for adverse cardiovascular events in patients
with CKD (10). In addition, traditional risk factors have been shown to be more strongly
associated with adverse cardiovascular disease outcomes as compared to non-traditional
cardiovascular disease risk factors in CKD (11). Therefore, it was essential to adjust for
the traditional cardiovascular disease risk factors in our analysis plan. Conversely, a
failure to account for traditional cardiovascular disease risk factors in modeling the
determinants of CAC may have generated results that overestimated the importance of
non-traditional risk factors.
27
C) Coronary artery calcification measurement
Coronary artery calcification scores were evaluated using The Toshiba Aquillion
CT multislice scanner (4 sets of detectors) and VScore analytical software package. A
total CAC score was obtained as per the Agatston method which has been described
elsewhere (12). The Agatson scoring method evaluates volume of calcium to correlate for
“potential” obstructive coronary artery disease. Individual CAC scores are calculated for
the left main coronary artery, left anterior descending artery, circumflex artery, and right
coronary arteries. Scores are added and a total CAC score is reported. CAC may also be
classified categorically as follows: less than 10 (minimal plaque burden, low
cardiovascular risk), 11-100 (mild plaque burden, moderate cardiovascular risk), 101-400
(moderate plaque burden, high cardiovascular risk) and >400 (extensive plaque burden,
very high cardiovascular risk)(12).
3.6 Data compilation, sample size and analysis
A) Data management
A spreadsheet was constructed to enter patient demographic data, biochemical test
results, and CAC scores. Study-specific files in SPSS 16 for Windows (SPSS Inc.,
Chicago, IL, USA) were created for each of the outcomes of interest. Range checks and
entry restrictions were implemented to reduce data entry errors. After entry, all data were
verified with the study case report forms.
28
B) Sample size considerations
Review of the literature demonstrated the biological plausibility of a
relationship between impaired kidney function and CAC (13, 14). In designing our study,
our aim was to detect a Pearson r of 0.22 or more between CAC score and CKD with 5%
significance level and 80% power (20% dropouts) by recruiting and retaining one
hundred and sixty patients. The calculation was based on the Fisher’s z transformation of
the correlation (15). A correlation of 0.22 translates into approximately 5% of the
variance explained from the risk of kidney related risk factors with respect to CAC.
Although seemingly small, studies have suggested that the majority of the cardiovascular
disease risk in CKD patients is translated from traditional risk factors as opposed to
kidney related risk factors (11). Therefore, we were not anticipating the amount of added
risk contributed by kidney function to be significantly more, and 5% of the variance
explained is at the lower end of what we expected to detect. With respect to our primary
objective, we were successful in enrolling one hundred and nineteen patients, which
provided 68% power to detect a correlation of 0.22 or more between CAC and CKD. In
fact, we were unsuccessful in demonstrating an association between CKD and CAC, and
the obtained correlation was very weak (r=0.042; 95% confidence interval -0.14, 0.22;
p=0.6).
3.7 Ethical considerations and safety
All study participants received the usual care provided to all CKD clinic patients.
Participation was entirely voluntary, and withdrawl was permitted at any time without
compromising patient care. The individual provided permission for Dr. Garland to
abstract data for this research study only from the individual's clinic chart, hospital
29
record, or chronic kidney disease database record. Each patient enrolled to the chronic
kidney disease clinic has a chart where the above information was collected as part of
standard medical care, facilitating data collection for this study. Participants were
assigned a unique identifier to protect their confidentiality. CT scan results were not
added to the hospital record. Any hardcopy of information was stored in a locked filing
cabinet located in a locked office at Queen’s University. Data were entered on a
password-protected computer in a locked office at Queen’s University. All participant
information was managed with strict privacy and confidentiality. The intervention
involved in this study is a MSCT scan, which delivers a radiation dose equivalent to
3mSv. To compare, a plain back/spine X-Ray delivers a dose of 2.4 mSv. The study
protocol was approved by the Queen’s University Health Sciences and Affiliated
Teaching Hospitals Research Ethics Board (Appendix 2).
30
3.8 Reference List:
(1) Arnold JM, Liu P, Demers C et al: Canadian Cardiovascular Society: Canadian
Cardiovascular Society Consensus Conference recommendations on Heart Failure 2006:
Diagnosis and Management. Can J Cardiol 2006; 22: 23 – 45.
(2) Hemingway H, Fitzpatrick NK, Gnani S et al: Prospective validity of measuring
angina severity with Canadian Cardiovascular Society class: The ACRE study. Can J
Cardiol 2004; 20: 305-309.
(3) Levey AS, Bosch JP, Lewis JB, Greene T, Rogers N, Roth D. A more accurate
method to estimate glomerular filtration rate from serum creatinine: a new prediction
equation. Modification of Diet in Renal Disease Study Group. Ann Intern Med.
1999;130:461-70.
(4) K/DOQI clinical practice guidelines for chronic kidney disease: evaluation,
classification, and stratification. Am J Kidney Dis. 2002; 39:S1-266.
(5) Levey AS, Coresh J, Greene T et al: Chronic Kidney Disease Epidemiology
Collaboration. Using standardized serum creatinine values in the modification of diet in
renal disease study equation for estimating glomerular filtration rate. Ann Intern Med
2006; 145: 247-254.
(6) Levey AS, Coresh J, Greene T et al: Chronic Kidney Disease Epidemiology
Collaboration. Expressing the Modification of Diet in Renal Disease Study equation for
estimating glomerular filtration rate with standardized serum creatinine values.
Clin Chem 2007; 53: 766-772.
(7) Rule AD, Larson TS, Bergstralh EJ et al: Using serum creatinine to estimate
glomerular filtration rate: accuracy in good health and in chronic kidney disease.
31
Ann Intern Med 2004; 141: 929-937.
(8) Froissart M, Rossert J, Jacquot C et al: Predictive performance of the modification of
diet in renal disease and Cockcroft-Gault equations for estimating renal function.
J Am Soc Nephrol 2005; 16:763-773.
(9) Wilson PW, D'Agostino RB, Levy D et al: Prediction of coronary heart disease using
risk factor categories. Circulation 1998; 97:1837-1847.
(10) Weiner DE, Tighiouart H, Elsayed EF, Griffith JL, Salem DN, Levey AS, Sarnak
MJ. The relationship between nontraditional risk factors and outcomes in individuals with
stage 3 to 4 CKD. Am J Kidney Dis. 2008; 51(2):212-23.
(11) Shlipak MG, Fried LF, Cushman M et al: Cardiovascular mortality risk in chronic
kidney disease: comparison of traditional and novel risk factors. JAMA 2005; 293:1737-
1745.
(12) Agatston AS, Janowitz WR, Hildner F: Quantification of coronary artery calcium
using ultra fast computed tomography. J Am Coll Cardiol 1990;15: 827–832.
(13) Fox CS, Larson MG, Keyes MJ, Levy D, Clouse ME, Culleton B et al. Kidney
function is inversely associated with coronary artery calcification in men and women free
of cardiovascular disease: the Framingham Heart Study. Kidney Int. 2004;66:2017-21.
(14) Kramer H, Toto R, Peshock R, Cooper R, Victor R. Association between chronic
kidney disease and coronary artery calcification: the Dallas Heart Study. J Am Soc
Nephrol. 2005;16:507-513.
(15) Rosner, Bernard. Fundamentals of Biostatistics, 6th Edition. Pacific Grove, CA: Duxbury Press, 2006.
32
Chapter 4: Manuscript
This manuscript was written according to specifications for submission to the American
Journal of Kidney Diseases, published online June 19th, 2008; journal publication vol 52
(5) (November) 849-858; 2008.
Title: Prevalence and associations of Coronary Artery Calcification in Patients with
Stages 3-5 CKD without Cardiovascular Disease
Authors: Jocelyn S. Garland MD¹, Rachel M. Holden MD¹, Patti A. Groome PhD2, Miu
Lam PhD², Robert L. Nolan MD3, A. Ross Morton MD¹, William Pickett PhD²
Institution: Queen’s University, Kingston, Ontario, Canada
Affiliations: Department of Medicine1, Division of Nephrology1, Queen’s University and
Queen’s University Vascular Calcification Investigators1; Department of Community
Health and Epidemiology2, Queen's University, Kingston, ON, Canada, and Department
of Radiology3, Queen's University, Kingston, ON, Canada.
33

34
Title: Prevalence and associations of Coronary Artery Calcification in Patients with Stages 3-5 CKD without Cardiovascular Disease Authors: Jocelyn S. Garland MD¹, Rachel M. Holden MD¹, Patti A. Groome PhD2, Miu Lam PhD², Robert L. Nolan MD3, A. Ross Morton MD¹, William Pickett PhD² Institution: Queen’s University, Kingston, Ontario, Canada Affiliations: Department of Medicine1, Division of Nephrology1 Queen’s University and Queen’s University Vascular Calcification Investigators1; Department of Community Health and Epidemiology2, Queen's University, Kingston, ON, Canada, and Department of Radiology3, Queen's University, Kingston, ON, Canada. Address correspondence to: Dr. Jocelyn S. Garland, Room 2043 Etherington Hall, Queen’s; University, Kingston, Ontario, Canada, K7L 3N6. Tel: (613) 533 3207; Fax: (613) 533 2923; Email: [email protected] Abstract Word Count: 300 Manuscript Word Count: 3466 Running Title: Stage 3-5 Chronic Kidney Disease and CAC Subject of Manuscript: Clinical nephrology
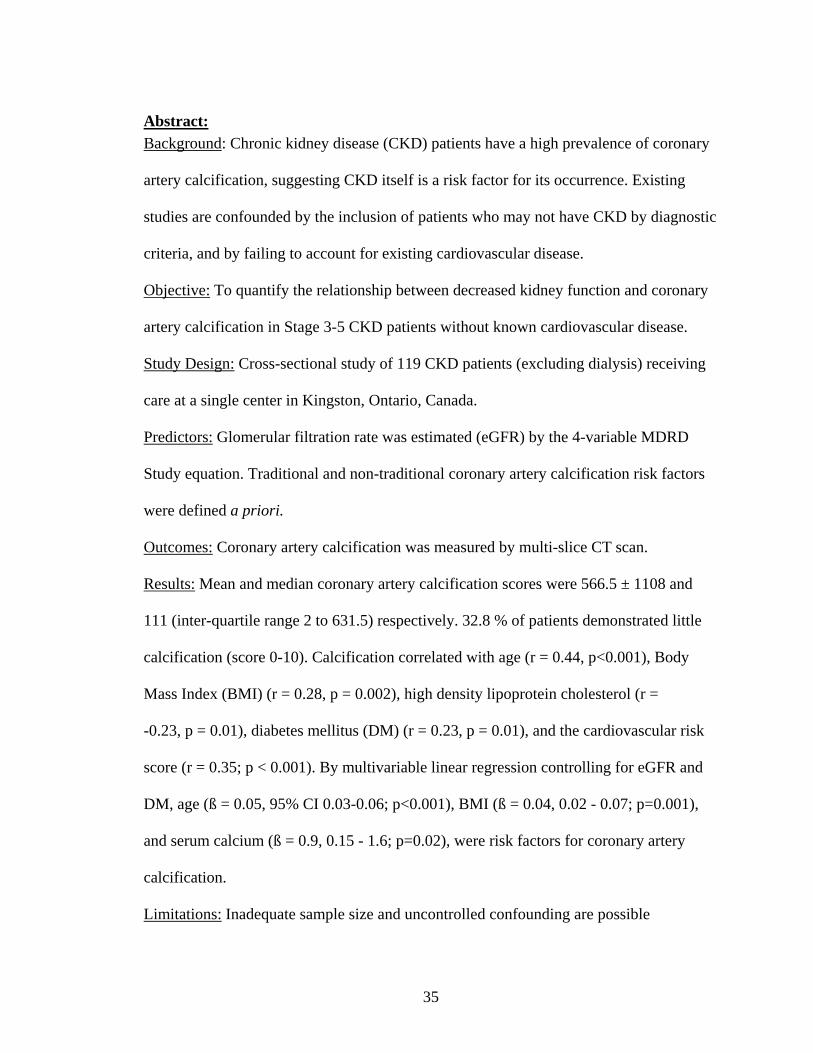
Abstract:
Background: Chronic kidney disease (CKD) patients have a high prevalence of coronary
artery calcification, suggesting CKD itself is a risk factor for its occurrence. Existing
studies are confounded by the inclusion of patients who may not have CKD by diagnostic
criteria, and by failing to account for existing cardiovascular disease.
Objective: To quantify the relationship between decreased kidney function and coronary
artery calcification in Stage 3-5 CKD patients without known cardiovascular disease.
Study Design: Cross-sectional study of 119 CKD patients (excluding dialysis) receiving
care at a single center in Kingston, Ontario, Canada.
Predictors: Glomerular filtration rate was estimated (eGFR) by the 4-variable MDRD
Study equation. Traditional and non-traditional coronary artery calcification risk factors
were defined a priori.
Outcomes: Coronary artery calcification was measured by multi-slice CT scan.
Results: Mean and median coronary artery calcification scores were 566.5 ± 1108 and
111 (inter-quartile range 2 to 631.5) respectively. 32.8 % of patients demonstrated little
calcification (score 0-10). Calcification correlated with age (r = 0.44, p<0.001), Body
Mass Index (BMI) (r = 0.28, p = 0.002), high density lipoprotein cholesterol (r =
-0.23, p = 0.01), diabetes mellitus (DM) (r = 0.23, p = 0.01), and the cardiovascular risk
score (r = 0.35; p < 0.001). By multivariable linear regression controlling for eGFR and
DM, age (ß = 0.05, 95% CI 0.03-0.06; p<0.001), BMI (ß = 0.04, 0.02 - 0.07; p=0.001),
and serum calcium (ß = 0.9, 0.15 - 1.6; p=0.02), were risk factors for coronary artery
calcification.
Limitations: Inadequate sample size and uncontrolled confounding are possible
35

limitations, but are unlikely to have changed the main study findings.
Conclusions: In this study, traditional cardiovascular disease risk factors and serum
calcium were associated with coronary artery calcification. No association was
demonstrated with eGFR. Studies exploring protective mechanisms against coronary
artery calcification are needed.
Key Words: 1. Coronary artery calcification 2. Chronic kidney disease 3.
Cardiovascular disease
36
Introduction:
Coronary artery calcification is a phenomenon described in individuals with
chronic kidney disease (CKD) and its presence is associated with an increased risk of
cardiovascular death (1). 40-50% of incident dialysis patients have documented evidence
of coronary artery calcification (2). Available data in pre-dialysis CKD patients have
suggested an association between decreased kidney function and coronary artery
calcification (3, 4). It is hypothesized that the calcification process accelerates as kidney
function declines, suggesting CKD itself may be a risk factor for its occurrence.
Fox et al (3) and Kramer et al (4) examined the potential association of decreased
kidney function and coronary artery calcification in cohorts comprised of primarily Stage
1 and 2 CKD patients. In these studies, only 31 and 41 patients, respectively, had Stage 3-
5 CKD. Results demonstrated initial associations between coronary artery calcification
score and decreased kidney function, but these no longer remained in adjusted analyses.
Seyahi et al (5) enrolled 101 individuals with Stage 1 and 2 CKD resulting from elective
nephrectomies for kidney donation, and evaluated the association between decreased
kidney function and coronary artery calcification against 99 matched controls. No
association was demonstrated. Similarly, Russo et al (6) and Tomiyama et al (7)
examined coronary artery calcification scores in non-dialysis CKD patients. Although
these studies enrolled more individuals with Stage 3-5 CKD, the relationship between
kidney function and coronary artery calcification was not evaluated in detail.
Therefore, studies exploring the potential relationship between decreased kidney
function and coronary artery calcification are limited by the by the inclusion of
individuals with prevalent cardiovascular disease (7), by the inclusion of patients who do
37
not necessarily have proven CKD by strict diagnostic criteria (3, 4), and by the inclusion
of few individuals with Stage 3-5 CKD (3-5). These limitations have introduced
confounding and unreliability in interpreting coronary artery calcification scores and their
relationship to decreased kidney function. The relationship between decreased kidney
function and coronary artery calcification is important to discern, since many studies
have demonstrated a strong association between decreased kidney function, and
cardiovascular death (8-12).
Objectives: In this cross sectional study, we enrolled individuals with confirmed stage 3-
5 CKD (excluding dialysis), without symptoms or history of cardiovascular disease. Our
primary objective was to quantify the association between decreased kidney function and
coronary artery calcification. Our secondary objective was to determine the associations
between traditional cardiovascular disease risk factors (age, sex, hypertension,
hyperlipidemia, diabetes mellitus, and the cardiovascular risk score), non- traditional
cardiovascular disease risk factors (eGFR), serum total calcium (Ca), serum phosphate
(PO4), serum calcium/phosphorus product, serum intact parathyroid hormone (iPTH),
serum albumin, serum C-reactive protein (CRP), and albumin to creatinine ratio (ACR))
and coronary artery calcification in this patient population.
Materials and Methods:
Consecutive patients presenting for follow-up to Kingston General Hospital’s
CKD clinic from July 2005 to September 2006 were screened for enrollment. Kingston
General Hospital Nephrology programs serve the south-eastern Ontario region, which has
a catchment area of 1.1-1.25 million individuals. Clinic patients were augmented by
patients identified in four of eight private nephrologists’ clinics at Kingston General
38
Hospital. Patient eligibility criteria were: 1) patients greater than 18 years of age; 2) Stage
3-5 CKD (not requiring dialysis) and 3) no documented history of cardiovascular disease.
National Kidney Foundation criteria were applied to diagnose Stage 3-5 CKD
(13). For each participant, cardiovascular disease was determined by assessing for both
current symptoms (patient interview) using Canadian Cardiovascular Society criteria for
heart failure and angina (14, 15), and history of cardiovascular events was determined by
patient interview and detailed chart review. Event history included history of myocardial
infarction, angina, coronary artery bypass graft or angioplasty, transient ischemic attack,
cerebral vascular accident, peripheral vascular disease, and congestive heart failure.
Weight and height data were collected on each individual in order to calculate body mass
index (BMI). Diagnoses of hypertension were made as per 2006 Canadian Hypertension
Education Program Guidelines (16), hyperlipidemia as per Canadian Cardiovascular
Society criteria (17), and diabetes mellitus as per the Canadian Diabetes Association
criteria (18). Current smokers were defined as patients smoking at least one cigarette per
day during the previous 6 months. To ascertain baseline risk of cardiovascular disease, a
Cardiovascular Risk Score based on traditional risk factors for cardiovascular disease was
determined for each participant (19). Risk factor categories were sex specific, and
included age, low density lipoprotein (LDL) cholesterol, high density lipoprotein (HDL)
cholesterol, blood pressure (systolic and diastolic), smoking status, and diabetes mellitus.
All patients gave informed consent, and the study protocol was approved by The Queen’s
University Health Sciences and Affiliated Teaching Hospitals Research Ethics Board.
Laboratory Measures:
39
Laboratory measures drawn from routine monthly blood-work were averaged for
6 months prior to study enrollment: serum PO4 (mg/dL), serum total Ca (mg/dL), mean
intact parathyroid hormone level (iPTH) (pg/mL), alkaline phosphatase (ALP) (U/L),
serum albumin (g/dL), serum CRP (mg/L), total cholesterol (mg/dL), LDL cholesterol
(mg/dL), HDL cholesterol (mg/dL) and triglycerides (TG) (mg/dL). The measured total
serum Ca was corrected for serum albumin from the following equation: Corrected
sCa = Measured total Ca + (0.8 X (4.5 - serum albumin). Levels of iPTH were assessed
by electrochemiluminescence (Roche) modular analytics E170 immunoassay. A Roche
Modular BCG method was used to measure serum albumin. A Roche modular
immunoturbidimetric assay was used to assess CRP. Serum creatinine (sCr) (on the day
of study enrollment) was used in the 4-variable MDRD Study equation to determine
eGFR. sCR was measured by the Roche Creatinine Plus Modular assay (enzymatic)
(coefficients of variation <3% for serum creatinine of 1.84 mg/dL (163umol/L)or more,
and 1% for serum creatinine of 6.67 mg/dL (590umol/L) or more). All sCr creatinine
values were obtained from the same laboratory at Kingston General Hospital in order to
minimize inter-laboratory variability and misclassification errors. Random urine samples
were obtained to determine UACR.
Coronary Artery Calcification Measurement:
Coronary artery calcification scores were evaluated using The Toshiba Aquillion
CT multislice scanner (4 sets of detectors) and VScore analytical software package. The
scan thickness is 3 mm x 4 slices simultaneously over 12 mm per rotation, and the field
of coverage is 12 cm. Images were acquired with prospective gating technique using a
40
discrete algorithm (20). A total coronary artery calcification score was generated as per
the Agatston method which has been described elsewhere (21).
Estimation of Glomerular Filtration Rate:
The 4-variable MDRD Study equation (22), re-expressed for standardized sCr
(23), was used to calculate eGFR. The equation is as follows: Estimated GFR = 175 *
(sCr )–1.154 * age –0.203 * 0.742 (for women) * 1.21 (if black). Individuals who had eGFR
greater than 60 mLmin/1.73m2 were excluded, as the accuracy of obtained eGFR
measurements above this level has been determined to be less precise (24-26).
Statistical Methods:
Summary statistics were expressed as means and standard deviations (for
normally distributed data), or as medians and inter-quartile ranges, counts and
percentages, as appropriate. Estimated GFR was stratified into CKD stages 3-5 as per
National Kidney Foundation criteria (13). Coronary artery calcification scores were
reported as mean and median total scores. The Mann–Whitney test, Kruskal-Wallis or
Student's t-test was used for comparisons between groups, as appropriate. The
significance of associations for categorical variables was determined by chi-square
analysis or by Fisher's exact test, as appropriate. Correlational analysis was performed to
evaluate the associations between the a priori selected variables of decreased kidney
function (eGFR), traditional and non-traditional cardiovascular disease risk factors and
coronary artery calcification scores. Prior to analysis, coronary artery calcification scores,
CRP and UACR were logarithmically transformed to ensure normality. 1.0 was added to
coronary artery calcification scores prior to logarithmic transformation.
41
A series of linear and logistic regression models were constructed to identify risk
factors for coronary artery calcification. All variables from the bivariate analysis which
showed an association with CAC, at the significance level p < 0.10, were included in the
initial models for linear and logistic regressions. All models were adjusted for eGFR and
final models were adjusted for diabetes mellitus. The subsequent exploratory analyses
tested other possible a priori chosen variables: traditional cardiovascular disease risk
factors (age, sex, hypertension, BMI, hyperlipidemia, diabetes mellitus, and the
Cardiovascular Risk score) and non- traditional risk factors (eGFR, serum Ca, serum
PO4, serum calcium/phosphorus product, serum iPTH, serum albumin, serum CRP, and
UACR). All statistical analyses were performed using SPSS 16 for Windows (SPSS Inc.,
Chicago, IL, USA).
Sample Size Considerations:
We expected the correlation between decreased kidney function and coronary
artery calcification to be approximately - 0.30 (3). With 160 patients, it was anticipated
that the correlation between kidney function and coronary artery calcification would have
to be less than 0.22 (5% significance level and 80% power) to be missed.
Results:
Figure 1 summarizes the study recruitment process. Of 710 chronic kidney
disease patients screened for study participation, 119 had coronary artery calcification
scores available for the final analysis. Individuals who did not have coronary artery
calcification scans completed (N=16), as compared to included patients (N=119), were of
similar age (64.25 years ± 10 versus 58.5 ± 14; p=0.13), eGFR measurements (31.4 ± 13
mL/min/1.73m2 versus 26.72 ± 12; p= 0.15) as well as proportions of individuals within
42
CKD stages 3-5. However, excluded patients had higher systolic blood pressure (146 ± 23
mmHg vs 136.2 ± 16; p=0.03 ) and had increased median albuminuria (median UACR
846.4 mg/mmol (95.6mg/mmol), interquartile range 205.1 to 2079.2) compared to
included patients (297.5 mg/g (33.6 mg/mmol), interquartile range 51.3 to 894.6;
p=0.05).
Table 1 describes clinical characteristics of included study participants. The mean
age of participants was 58.5 years (± 14), 37.8% were greater than 65 years of age, and a
high proportion were men (61.3%). Most individuals had evidence of hypertension
(92.4%) and/or albuminuria (UACR greater than 26.5 mg/g (3mg/mmol)) (82.5%). Mean
eGFR was 26.7 ± 12.1 mLmin/1.73m2. 33.6% of individuals had Stage 3 chronic kidney
disease, 50.4% had Stage 4, and 16% had Stage 5. Age, sex, diabetes status, and
cardiovascular risk scores did not differ significantly according to stage of chronic kidney
disease.
Figure 2 demonstrates mean and median coronary artery calcification scores for
study participants by chronic kidney disease stages 3-5. Overall, the mean coronary artery
calcification score was 566.5 ± 1108 and the median score was 111 (inter-quartile range 2
to 631.5). 83.2% of participants had evidence of coronary artery calcification: 16.8% had
no evidence of coronary artery calcification, 16.0% had minimal calcification (score 1-
9.9), 16.0% had mild calcification (score 10-99), 19.3% had moderate calcification (score
100-399) and 31.9% had evidence of severe coronary artery calcification (score 400 or
greater). Median coronary artery calcification scores were higher in individuals with
Stage 5 chronic kidney disease versus Stages 3 and 4, although this difference was not
statistically significant.
43
Coronary artery calcification scores from all categories, (i.e. no calcification to
severe) were distributed across chronic kidney disease stages 3-5 (Figure 3). Median
coronary artery calcification scores were significantly lower in individuals younger than
65 years of age (18, interquartile range 1 to 312), compared to individuals greater than 65
years of age (376, interquartile range 57.8 to 1010.8; p<0.001). In considering
participants with diabetes mellitus, median coronary artery calcification scores were
significantly higher (376.5, inter-quartile range 17 to 1058.5) compared with non-
diabetics (34.0, inter-quartile range 1 to 465.5) (p=0.01).
Table 2 reports findings from the bivariate analysis examining eGFR, log
coronary artery calcification score, and potential correlates. No significant association
was demonstrated between eGFR and coronary artery calcification score (r=0.042; 95%
confidence interval -0.14, 0.22; p=0.6). This result remained consistent in a separate
categorical analysis of Stage 3-5 CKD and coronary artery calcification (no
calcification/minimal; mild/moderate calcification and severe calcification) and Stage 3-5
CKD, and no association could be demonstrated (Spearman’s rho r = -0.093, p=0.3).
Other a priori defined traditional and non-traditional cardiovascular disease risk factors
were tested in the bivariate analysis for their possible association with coronary artery
calcification score. At p < 0.05 significance level, age was most strongly correlated with
coronary artery calcification, followed by the Cardiovascular Risk Score, BMI, HDL
cholesterol, and diabetes mellitus.
A series of multivariable linear (Table 3) and multiple logistic (Table 4)
regression models were developed by first identifying all variables from bivariate
analysis which showed an association with coronary artery calcification. For linear
44
regression, (Table 3) log coronary artery calcification was the dependent variable. eGFR
was forced into all models, and the final model was adjusted for diabetes mellitus. The
subsequent exploratory analyses tested other a priori chosen variables. The final model
R2 was 0.38, and age, BMI, and serum Ca were found to be independent risk factors for
coronary artery calcification while controlling for eGFR and diabetes mellitus.
For multiple logistic regression, the binary outcome variable coronary artery
calcification was coded as zero, or greater than zero. Obtained results were consistent
with those from the multivariable linear regression (Table 4). The final logistic regression
model showed age, BMI, HDL and serum Ca to be independent risk factors for coronary
artery calcification, while controlling for eGFR and diabetes mellitus.
Discussion:
The primary intent of this study was to quantify the association between
decreased kidney function and coronary artery calcification. Numerous studies have
documented the finding of elevated coronary artery calcification scores in dialysis
patients (27- 33). In addition, coronary artery calcification scores have been found to be
higher in individuals with CKD, compared to scores in the general population (4, 6).
Consequently, there is a biological basis for the idea that CKD itself may be an
independent risk factor for the development of coronary artery calcification.
In this sample of chronic kidney disease patients without history or symptoms of
cardiovascular disease, no significant association was demonstrated between decreased
kidney function and coronary artery calcification. This finding remained consistent with
numerous statistical analyses. While median coronary artery calcification scores were
higher in individuals with Stage 5 CKD versus Stages 3 and 4, there were no significant
45
differences between these values. Further, our findings showed that the prevalence and
extent of coronary artery calcification scores were not associated significantly with CKD
stage. Interestingly, some individuals (32.8%) seemed to be “protected” from
calcification (zero or minimal calcification score, N = 39), despite the high prevalence of
cardiovascular disease risk factors and level of kidney impairment in this patient cohort.
CKD has been demonstrated to be an independent risk factor for adverse
cardiovascular events in many studies (8-12). It is also known that CKD and
cardiovascular disease “share” many of the same risk factors. Consequently, we expected
to observe an association between eGFR and coronary artery calcification. Weiner et al
(34) showed that CKD and cardiovascular disease are each independent risk factors for
cardiovascular morbidity and mortality, but they do not act synergistically. A diagnosis of
CKD may, therefore, simply reflect “global” vascular disease, possibly resulting from
mechanisms creating diffuse endothelial injury (35), and decreased kidney function may
be a marker of this process.
Data from this study suggested that traditional cardiovascular disease risk factors,
which are highly prevalent in the CKD population, are important in the etiology of
coronary artery calcification. In this CKD cohort, age, BMI, and HDL cholesterol were
each associated with of coronary artery calcification. Non-traditional cardiovascular
disease risk factors were not associated with coronary artery calcification with one
exception (serum Ca). The latter finding is intriguing, and although based upon small
numbers of observations, is consistent with the hypotheses of others (36-38). Most
patients in this study were not prescribed supplementary Vitamin D (5%), or calcium-
46
based phosphate binders (20%). There are also reports in the dialysis population
suggesting that serum calcium and mortality are associated (36-38).
In developing our study, we were cognizant of the limitations of other studies that
have explored the relationship between decreased kidney function and coronary artery
calcification in pre-dialysis CKD patients. We restricted our study population to those
with a CKD diagnosis according to National Kidney Foundation criteria (13). We
excluded individuals with Stage 1-2 CKD, since the accuracy of obtained eGFR results is
less precise at this level (24-26). We improved accuracy of obtained eGFR results by
using the newer standardized serum creatinine equation, as suggested by Levey et al in
2006 (23). Patients with diabetes mellitus and individuals greater than 65 years of age
were well represented in this study, as would be expected in a typical CKD clinic.
Studies have demonstrated an association between cardiovascular events and
coronary artery calcification (1, 39-40), and between CKD and cardiovascular events (8-
12). Therefore, such diagnoses are possible confounders of the relationship between
kidney function and coronary artery calcification scores. There are several possible
methods of controlling for any confounding introduced by a diagnosis of cardiovascular
disease. We chose to use restriction to patients without such a diagnosis, in order to
cleanly control for this confounding.
This study has some limitations. First, while we adjusted for known traditional
and non-traditional cardiovascular disease risk factors, there is always the possibility that
other possible confounders remain unaccounted for in our analysis. Second, our target
sample size was not achieved. However, it is statistically doubtful that the finding of “no
association” between eGFR and coronary artery calcification would have changed with
47
additional patients, since the identified correlation between these two variables was very
weak (r=0.042; 95% confidence interval -0.14, 0.22; p=0.6). Inadequate sample size is a
potential factor, however, in accounting for the lack of association between coronary
artery calcification and other a priori chosen risk factors.
Third, inaccuracies in determining eGFR, measurement of coronary artery
calcification, and the cardiovascular disease risk score could have introduced
misclassification errors. In terms of eGFR, we believe we have minimized the error in
obtained results by using the MDRD Study equation re-expressed for standardized serum
creatinine values.
Coronary artery calcification was measured by a multi-slice CT scanner. There is
inherent inaccuracy in coronary artery calcification detection due to motion artifact,
which could have caused scores to be slightly higher than their true value. The
consistency of our main study finding of virtually no association between CKD and
coronary artery calcification across several types of analyses is re-assuring, and gave us
confidence in the robustness of this finding even in the potential presence of
measurement error.
The cardiovascular disease risk score that was used in this study, (19) to our
knowledge, has not been validated in a CKD population. The Framingham predictive
instrument has been applied to a CKD cohort, and was found to be inconsistent in its
ability to predict future cardiovascular events (41). However, in our situation, the latter
score was not used as a predictive instrument but as a means of quantifying the baseline
cardiovascular disease risk based on “traditional” cardiovascular disease risk factors in
this cohort.
48
Fourth, selection bias may also be a limitation of this study. Since all study
participants were referred to our center, enrolled patients would be more likely to have
CKD and other comorbidities. This may have biased our enrollment towards including
individuals with subclinical cardiovascular disease, and possibly with greater
calcification scores. In order for selection bias to have impacted study results, the
relationship between coronary artery calcification, eGFR and other possible risk factors
would need to be different in selected versus non-selected participants. However, results
from this study are consistent with observations from Stage 1 and 2 CKD patients (3-5),
as no association between eGFR and coronary artery calcification was demonstrated.
Finally, the clinical significance of coronary artery calcification in non-dialysis
CKD remains unknown, and is an area that warrants further thought. The coronary artery
calcification score is a composite of vascular calcification arising from both the intimal
blood vessel layer (where traditional cardiovascular disease risk factors are known to
impact) and the medial blood vessel layer (where non-traditional cardiovascular risk
factors including decreased kidney dysfunction are known to impact) (42,43). The total
coronary artery calcification score does not indicate whether the calcification is intimal or
medial in nature, and what the relative contribution from either blood vessel layer might
be. This distinction may be important, as individuals with CKD are at risk for both types
of calcification which are thought to manifest in different clinical mechanisms (42,43).
For this study, we were unable to consider the location of calcification (intimal versus
medial) when addressing the main study objective.
In summary, this study explored the relationship between decreased kidney
function and coronary artery calcification in confirmed Stage 3-5 CKD patients without
49
history or symptoms of cardiovascular disease. No significant association was
demonstrated between these two clinical variables. The prevalence of coronary artery
calcification was high in this cohort of patients, and scores from all calcification
categories were distributed across CKD stages 3-5. Traditional cardiovascular disease
risk factors remained the strongest potential factors associated with coronary artery
calcification. Studies are necessary to determine whether coronary artery calcification is a
determinant of cardiovascular events in the CKD patients, and to explore protective
mechanisms that might prevent patients from developing coronary artery calcification in
clinical populations.
50
References:
(1) Matsuoka M, Iseki K, Tamashiro M et al: Impact of high coronary artery
calcification score (CACS) on survival in patients on chronic hemodialysis. Clin Exp
Nephrol 8: 54-58, 2004
(2) Block GA, Raggi P, Bellasi A et al: Mortality effect of coronary calcification and
phosphate binder choice in incident hemodialysis patients. Kidney Int 71: 438-441, 2007
(3) Fox CS, Larson MG, Keyes MJ et al: Kidney function is inversely associated with
coronary artery calcification in men and women free of cardiovascular disease: the
Framingham Heart Study. Kidney Int 66: 2017-2021, 2004
(4) Kramer H, Toto R, Peshock R et al: Association between chronic kidney disease and
coronary artery calcification: the Dallas Heart Study. J Am Soc Nephrol 16: 507-513,
2005
(5) Seyahi N, Kahveci A, Bolgayirli M et al: Coronary artery calcification and
chronically decreased GFR in living kidney donors. Am J Kidney Dis 49: 143-152, 2007
(6) Russo D, Palmiero G, De Blasio AP et al: Coronary artery calcification in patients
with CRF not undergoing dialysis. Am J Kidney Dis 44: 1024-1030, 2004
(7) Tomiyama C, Higa A, Dalboni MA et al: The impact of traditional and non-traditional
risk factors on coronary calcification in pre-dialysis patients. Nephrol Dial Transplant 21:
2464-2471, 2006
(8) Weiner DE, Tighiouart H, Amin MG et al: Chronic kidney disease as a risk factor for
cardiovascular disease and all-cause mortality: a pooled analysis of community-based
studies. J Am Soc Nephrol 15: 1307-1315, 2004
51
(9) Henry RM, Kostense PJ, Bos G et al: Mild renal insufficiency is associated with
increased cardiovascular mortality: The Hoorn Study. Kidney Int 62: 1402-1407, 2002
(10) Muntner P, He J, Hamm L: Renal insufficiency and subsequent death resulting from
cardiovascular disease in the United States. J Am Soc Nephrol 13: 745-753, 2002
(11) Muntner P, He J, Astor BC et al: Traditional and nontraditional risk factors predict
coronary heart disease in chronic kidney disease: results from the atherosclerosis risk in
communities study. J Am Soc Nephrol 16: 529-538, 2005
(12) Shlipak MG, Fried LF, Cushman M et al: Cardiovascular mortality risk in chronic
kidney disease: comparison of traditional and novel risk factors. JAMA 293: 1737-1745,
2005.
(13) K/DOQI clinical practice guidelines for chronic kidney disease: evaluation,
classification, and stratification. National Kidney Foundation. Am J Kidney Dis 39
(Suppl 1): S1-266, 2004
(14) Arnold JM, Liu P, Demers C et al: Canadian Cardiovascular Society: Canadian
Cardiovascular Society Consensus Conference recommendations on Heart Failure 2006:
Diagnosis and Management. Can J Cardiol 22: 23 – 45, 2006
(15) Hemingway H, Fitzpatrick NK, Gnani S et al: Prospective validity of measuring
angina severity with Canadian Cardiovascular Society class: The ACRE study. Can J
Cardiol 20: 305-309, 2004
(16) Hemmelgarn BR, McAlister FA, Grover S et al: Canadian Hypertension Education
Program: The 2006 Canadian Hypertension Education Program Recommendations for
the Management of Hypertension. Part 1 - Blood Pressure Measurement, Diagnosis and
Assessment of Risk. Can J Cardiol 22: 573-581, 2006
52
(17) McPherson R, Frohlich J, Fodor G et al: Canadian Cardiovascular Society:
Canadian Cardiovascular Society position statement--recommendations for the diagnosis
and treatment of dyslipidemia and prevention of cardiovascular disease. Can J Cardiol
22: 913-927, 2006
(18) Canadian Diabetes Association Clinical Practice Guidelines Expert Committee.
Canadian Diabetes Association 2003 Clinical Practice Guidelines for the Prevention and
Management of Diabetes in Canada. Can J Diabetes 27 (suppl 2), 2003
(19) Wilson PW, D'Agostino RB, Levy D et al: Prediction of coronary heart disease
using risk factor categories. Circulation 97: 1837-1847, 1998
(20) Wexler L, Brundage B, Crouse J et al: Coronary artery calcification:
pathophysiology, epidemiology, imaging methods, and clinical implications. A statement
for health professionals from the American Heart Association Writing Group. Circulation
94: 1175-1192, 1996
(21) Agatston AS, Janowitz WR, Hildner F: Quantification of coronary artery calcium
using ultra fast computed tomography. J Am Coll Cardiol 15: 827–832, 1990
(22) Levey AS, Bosch JP, Lewis JB et al: A more accurate method to estimate
glomerular filtration rate from serum creatinine: a new prediction equation. Modification
of Diet in Renal Disease Study Group. Ann Intern Med 130: 461-470, 1999
(23) Levey AS, Coresh J, Greene T et al: Chronic Kidney Disease Epidemiology
Collaboration. Using standardized serum creatinine values in the modification of diet in
renal disease study equation for estimating glomerular filtration rate. Ann Intern Med
145: 247-254, 2006
53
(24) Levey AS, Coresh J, Greene T et al: Chronic Kidney Disease Epidemiology
Collaboration. Expressing the Modification of Diet in Renal Disease Study equation for
estimating glomerular filtration rate with standardized serum creatinine values.
Clin Chem 53: 766-772, 2007
(25) Rule AD, Larson TS, Bergstralh EJ et al: Using serum creatinine to estimate
glomerular filtration rate: accuracy in good health and in chronic kidney disease.
Ann Intern Med 141: 929-937, 2004
(26) Froissart M, Rossert J, Jacquot C et al: Predictive performance of the modification of
diet in renal disease and Cockcroft-Gault equations for estimating renal function.
J Am Soc Nephrol 16: 763-773, 2005
(27) Blacher J, Guerin AP, Pannier B et al: Arterial calcifications, arterial stiffness, and
cardiovascular risk in end-stage renal disease. Hypertension 38: 938-942, 2001
(28) Block GA, Spiegel DM, Ehrlich J et al: Effects of sevelamer and calcium on
coronary artery calcification in patients new to hemodialysis. Kidney Int 68: 1815- 1824,
2005
(29) Goodman WG, Goldin J, Kuizon BD et al: Coronary-artery calcification in young
adults with end-stage renal disease who are undergoing dialysis. N Engl J Med 342:
1478-1483, 2000
(30) Adragao T, Pires A, Lucas C et al: A simple vascular calcification score predicts
cardiovascular risk in haemodialysis patients. Nephrol Dial Transplant 19:1480-1488
2004
(31) Moe SM, O'Neill KD, Fineberg N et al: Assessment of vascular calcification in
ESRD patients using spiral CT. Nephrol Dial Transplant 18: 1152-1158, 2003
54
(32) Braun J, Oldendorf M, Moshage W et al: Electron beam computed tomography in
the evaluation of cardiac calcification in chronic dialysis patients. Am J Kidney Dis 27:
394-401, 1996
(33) Nitta K, Akiba T, Suzuki K et al: Assessment of coronary artery calcification in
hemodialysis patients using multi-detector spiral CT scan. Hypertens Res 27: 527-533,
2004
(34) Weiner DE, Sayed T, Tighiouart et al: Cardiovascular outcomes and all-cause
mortality: exploring the interaction between CKD and cardiovascular disease. Am J
Kidney Dis 48: 392-401, 2006
(35) Kaysen GA: The microinflammatory state in uremia: Causes and potential
consequences. J Am Soc Nephrol 12: 1549 – 1557, 2001
(36) Block GA, Klassen PS, Lazarus JM et al: Mineral metabolism, mortality and
morbidity in maintenance hemodialysis. J Am Soc Nephrol 15: 2208 – 2218, 2004
(37) Young EW, Albert JM, Satayathum S et al: Predictors and consequences of altered
mineral metabolism: The Dialysis Outcomes and Practice Patterns Study. Kidney Int 67:
1179 – 1187, 2005
(38) Slinin Y, Foley RN, Collins AJ: Calcium, phosphorus, parathyroid hormone and
cardiovascular disease in hemodialysis patients: the USRDS Waves 1, 3 and 4 Study. J
Am Soc Nephrol 16: 1788-1793, 2005
(39) Arad Y, Spadaro LA, Goodman K et al: Prediction of coronary events with electron
beam computed tomography. J Am Coll Cardiol. 36:1253-60, 2000
55
(40) Shemesh J, Morag-Koren N, Goldbourt U, et al: Coronary calcium by spiral
computed tomography predicts cardiovascular events in high-risk hypertensive patients. J
Hypertens. 22:605-10, 2004
(41) Weiner DE, Tighiouart H, Elsayed EF et al: The Framingham predictive instrument
in chronic kidney disease. J Am Coll Cardio. 17: 217-224, 2007
(42) Goodman WG, London G, Amann K et al: Vascular Calcification Work Group:
Vascular calcification in chronic kidney disease. Am J Kidney Dis 43: 572-579, 2004
(43) London GM, Drueke TB: Atherosclerosis and arteriosclerosis in chronic renal
failure. Kidney Int 51: 1678-1695, 1997
56
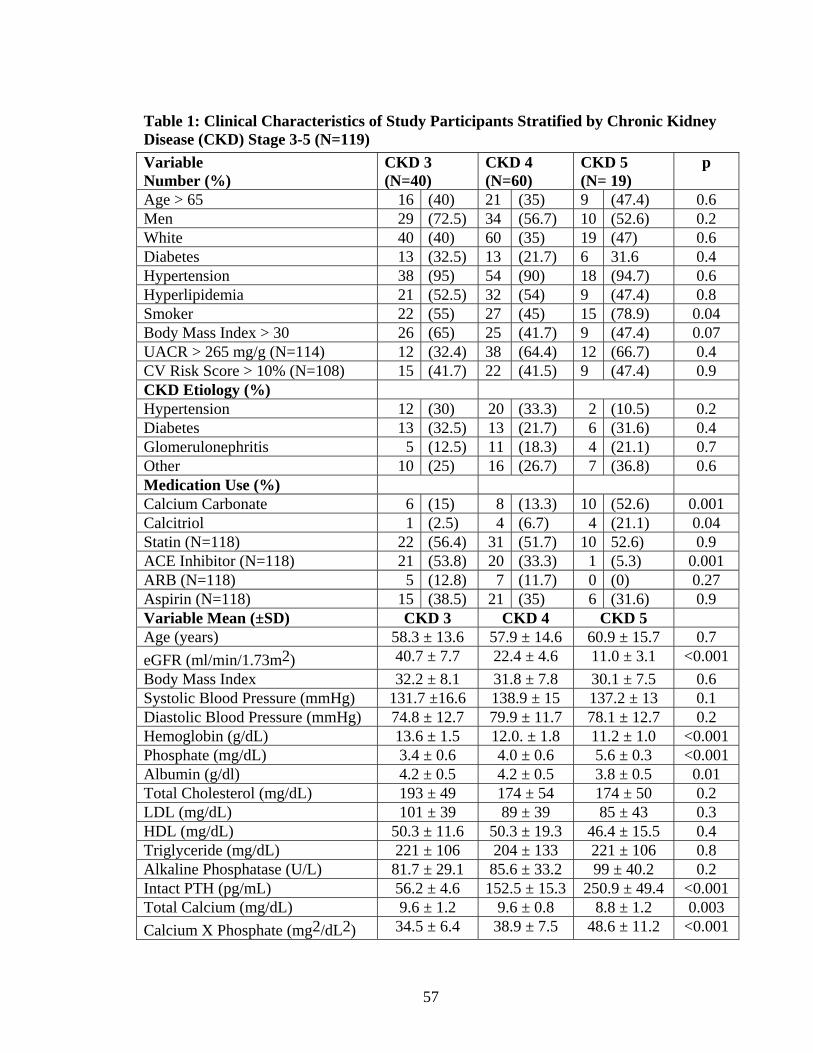
Table 1: Clinical Characteristics of Study Participants Stratified by Chronic Kidney Disease (CKD) Stage 3-5 (N=119)
Variable Number (%)
CKD 3 (N=40)
CKD 4 (N=60)
CKD 5 (N= 19)
p
Age > 65 16 (40) 21 (35) 9 (47.4) 0.6 Men 29 (72.5) 34 (56.7) 10 (52.6) 0.2 White 40 (40) 60 (35) 19 (47) 0.6 Diabetes 13 (32.5) 13 (21.7) 6 31.6 0.4 Hypertension 38 (95) 54 (90) 18 (94.7) 0.6 Hyperlipidemia 21 (52.5) 32 (54) 9 (47.4) 0.8 Smoker 22 (55) 27 (45) 15 (78.9) 0.04 Body Mass Index > 30 26 (65) 25 (41.7) 9 (47.4) 0.07 UACR > 265 mg/g (N=114) 12 (32.4) 38 (64.4) 12 (66.7) 0.4 CV Risk Score > 10% (N=108) 15 (41.7) 22 (41.5) 9 (47.4) 0.9 CKD Etiology (%) Hypertension 12 (30) 20 (33.3) 2 (10.5) 0.2 Diabetes 13 (32.5) 13 (21.7) 6 (31.6) 0.4 Glomerulonephritis 5 (12.5) 11 (18.3) 4 (21.1) 0.7 Other 10 (25) 16 (26.7) 7 (36.8) 0.6 Medication Use (%) Calcium Carbonate 6 (15) 8 (13.3) 10 (52.6) 0.001 Calcitriol 1 (2.5) 4 (6.7) 4 (21.1) 0.04 Statin (N=118) 22 (56.4) 31 (51.7) 10 52.6) 0.9 ACE Inhibitor (N=118) 21 (53.8) 20 (33.3) 1 (5.3) 0.001 ARB (N=118) 5 (12.8) 7 (11.7) 0 (0) 0.27 Aspirin (N=118) 15 (38.5) 21 (35) 6 (31.6) 0.9 Variable Mean (±SD) CKD 3 CKD 4 CKD 5 Age (years) 58.3 ± 13.6 57.9 ± 14.6 60.9 ± 15.7 0.7
eGFR (ml/min/1.73m2) 40.7 ± 7.7 22.4 ± 4.6 11.0 ± 3.1 <0.001
Body Mass Index 32.2 ± 8.1 31.8 ± 7.8 30.1 ± 7.5 0.6 Systolic Blood Pressure (mmHg) 131.7 ±16.6 138.9 ± 15 137.2 ± 13 0.1 Diastolic Blood Pressure (mmHg) 74.8 ± 12.7 79.9 ± 11.7 78.1 ± 12.7 0.2 Hemoglobin (g/dL) 13.6 ± 1.5 12.0. ± 1.8 11.2 ± 1.0 <0.001 Phosphate (mg/dL) 3.4 ± 0.6 4.0 ± 0.6 5.6 ± 0.3 <0.001 Albumin (g/dl) 4.2 ± 0.5 4.2 ± 0.5 3.8 ± 0.5 0.01 Total Cholesterol (mg/dL) 193 ± 49 174 ± 54 174 ± 50 0.2 LDL (mg/dL) 101 ± 39 89 ± 39 85 ± 43 0.3 HDL (mg/dL) 50.3 ± 11.6 50.3 ± 19.3 46.4 ± 15.5 0.4 Triglyceride (mg/dL) 221 ± 106 204 ± 133 221 ± 106 0.8 Alkaline Phosphatase (U/L) 81.7 ± 29.1 85.6 ± 33.2 99 ± 40.2 0.2 Intact PTH (pg/mL) 56.2 ± 4.6 152.5 ± 15.3 250.9 ± 49.4 <0.001 Total Calcium (mg/dL) 9.6 ± 1.2 9.6 ± 0.8 8.8 ± 1.2 0.003
Calcium X Phosphate (mg2/dL2) 34.5 ± 6.4 38.9 ± 7.5 48.6 ± 11.2 <0.001
57
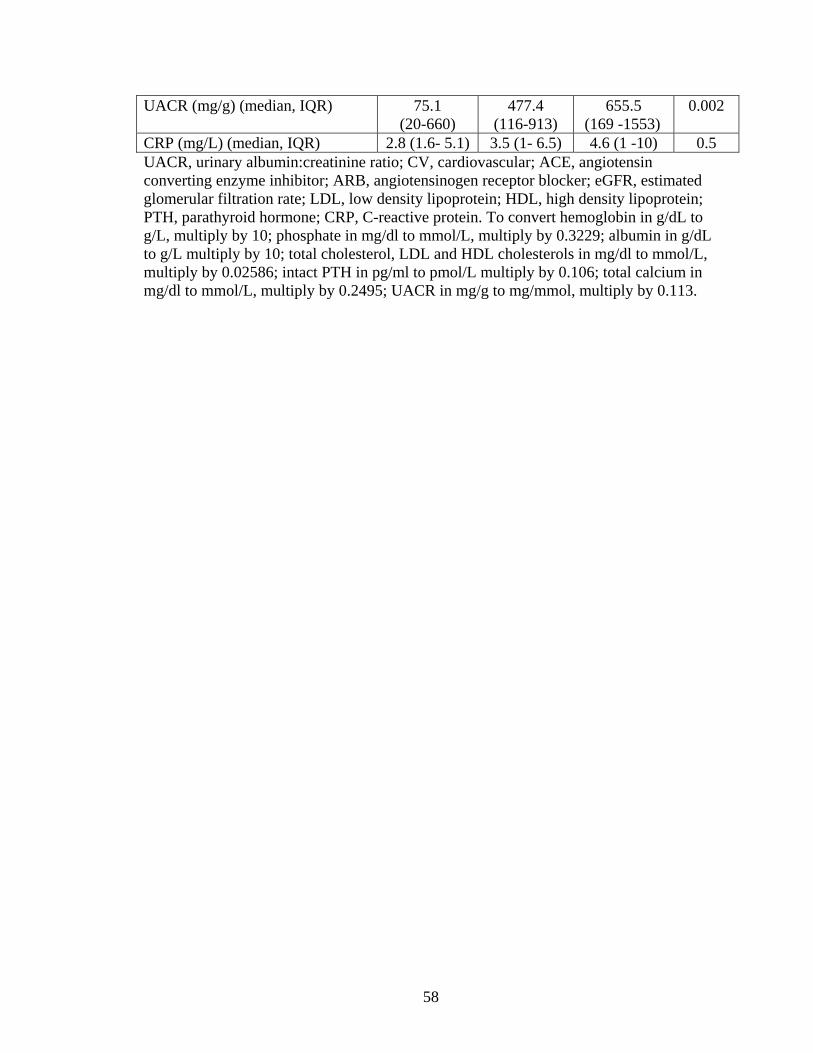
UACR (mg/g) (median, IQR) 75.1 (20-660)
477.4 (116-913)
655.5 (169 -1553)
0.002
CRP (mg/L) (median, IQR) 2.8 (1.6- 5.1) 3.5 (1- 6.5) 4.6 (1 -10) 0.5 UACR, urinary albumin:creatinine ratio; CV, cardiovascular; ACE, angiotensin converting enzyme inhibitor; ARB, angiotensinogen receptor blocker; eGFR, estimated glomerular filtration rate; LDL, low density lipoprotein; HDL, high density lipoprotein; PTH, parathyroid hormone; CRP, C-reactive protein. To convert hemoglobin in g/dL to g/L, multiply by 10; phosphate in mg/dl to mmol/L, multiply by 0.3229; albumin in g/dL to g/L multiply by 10; total cholesterol, LDL and HDL cholesterols in mg/dl to mmol/L, multiply by 0.02586; intact PTH in pg/ml to pmol/L multiply by 0.106; total calcium in mg/dl to mmol/L, multiply by 0.2495; UACR in mg/g to mg/mmol, multiply by 0.113.
58
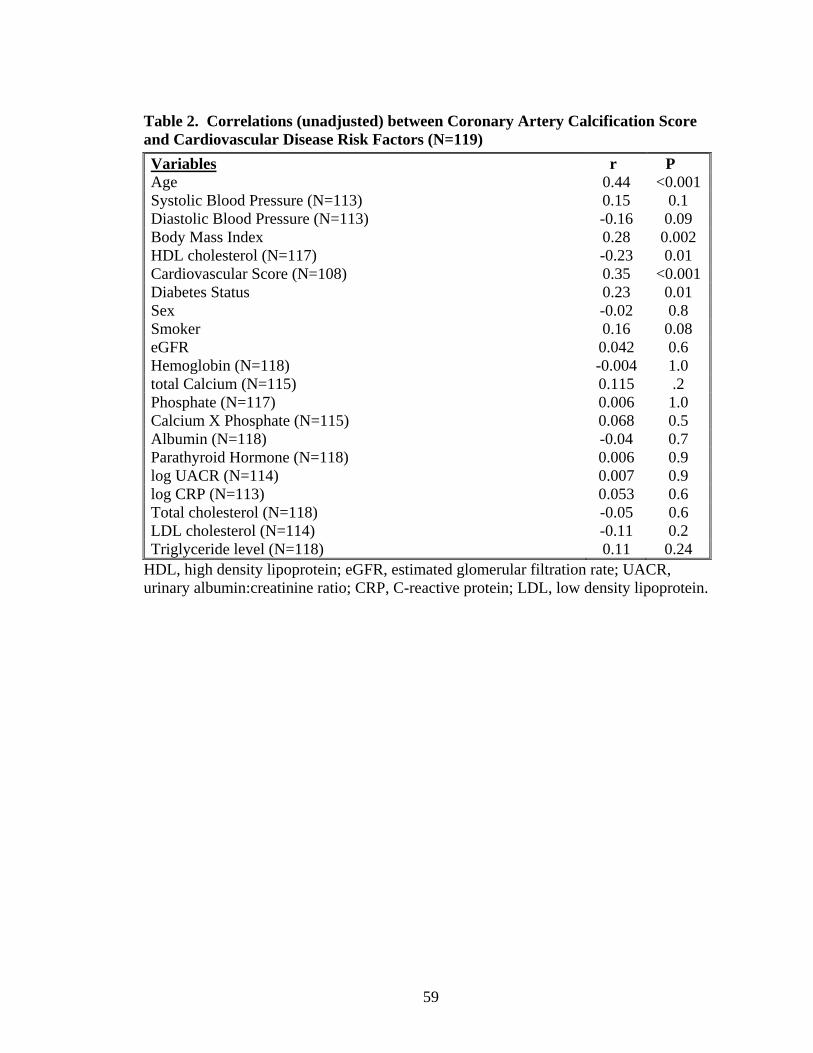
Table 2. Correlations (unadjusted) between Coronary Artery Calcification Score and Cardiovascular Disease Risk Factors (N=119)
Variables r P Age 0.44 <0.001 Systolic Blood Pressure (N=113) 0.15 0.1 Diastolic Blood Pressure (N=113) -0.16 0.09 Body Mass Index 0.28 0.002 HDL cholesterol (N=117) -0.23 0.01 Cardiovascular Score (N=108) 0.35 <0.001 Diabetes Status 0.23 0.01 Sex -0.02 0.8 Smoker 0.16 0.08 eGFR 0.042 0.6 Hemoglobin (N=118) -0.004 1.0 total Calcium (N=115) 0.115 .2 Phosphate (N=117) 0.006 1.0 Calcium X Phosphate (N=115) 0.068 0.5 Albumin (N=118) -0.04 0.7 Parathyroid Hormone (N=118) 0.006 0.9 log UACR (N=114) 0.007 0.9 log CRP (N=113) 0.053 0.6 Total cholesterol (N=118) -0.05 0.6 LDL cholesterol (N=114) -0.11 0.2 Triglyceride level (N=118) 0.11 0.24
HDL, high density lipoprotein; eGFR, estimated glomerular filtration rate; UACR, urinary albumin:creatinine ratio; CRP, C-reactive protein; LDL, low density lipoprotein.
59
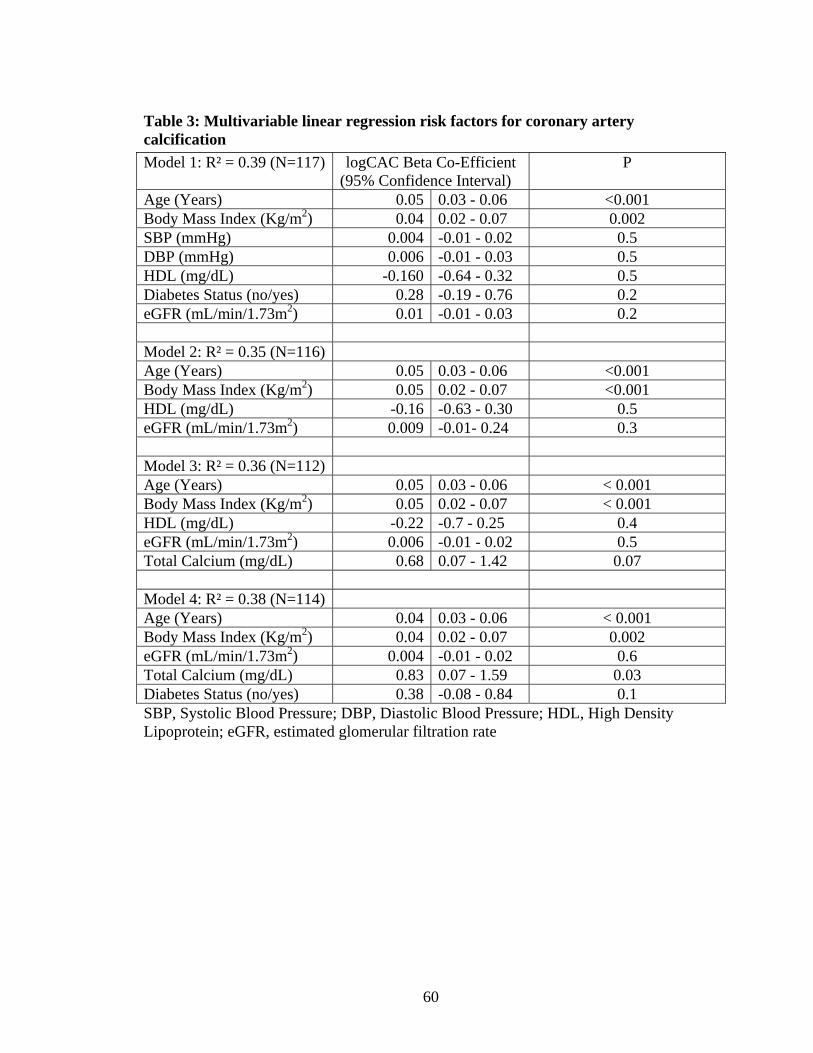
Table 3: Multivariable linear regression risk factors for coronary artery calcification
Model 1: R² = 0.39 (N=117) logCAC Beta Co-Efficient (95% Confidence Interval)
P
Age (Years) 0.05 0.03 - 0.06 <0.001 Body Mass Index (Kg/m2) 0.04 0.02 - 0.07 0.002 SBP (mmHg) 0.004 -0.01 - 0.02 0.5 DBP (mmHg) 0.006 -0.01 - 0.03 0.5 HDL (mg/dL) -0.160 -0.64 - 0.32 0.5 Diabetes Status (no/yes) 0.28 -0.19 - 0.76 0.2 eGFR (mL/min/1.73m2) 0.01 -0.01 - 0.03 0.2 Model 2: R² = 0.35 (N=116) Age (Years) 0.05 0.03 - 0.06 <0.001 Body Mass Index (Kg/m2) 0.05 0.02 - 0.07 <0.001 HDL (mg/dL) -0.16 -0.63 - 0.30 0.5 eGFR (mL/min/1.73m2) 0.009 -0.01- 0.24 0.3 Model 3: R² = 0.36 (N=112) Age (Years) 0.05 0.03 - 0.06 < 0.001 Body Mass Index (Kg/m2) 0.05 0.02 - 0.07 < 0.001 HDL (mg/dL) -0.22 -0.7 - 0.25 0.4 eGFR (mL/min/1.73m2) 0.006 -0.01 - 0.02 0.5 Total Calcium (mg/dL) 0.68 0.07 - 1.42 0.07 Model 4: R² = 0.38 (N=114) Age (Years) 0.04 0.03 - 0.06 < 0.001 Body Mass Index (Kg/m2) 0.04 0.02 - 0.07 0.002 eGFR (mL/min/1.73m2) 0.004 -0.01 - 0.02 0.6 Total Calcium (mg/dL) 0.83 0.07 - 1.59 0.03 Diabetes Status (no/yes) 0.38 -0.08 - 0.84 0.1 SBP, Systolic Blood Pressure; DBP, Diastolic Blood Pressure; HDL, High Density Lipoprotein; eGFR, estimated glomerular filtration rate
60
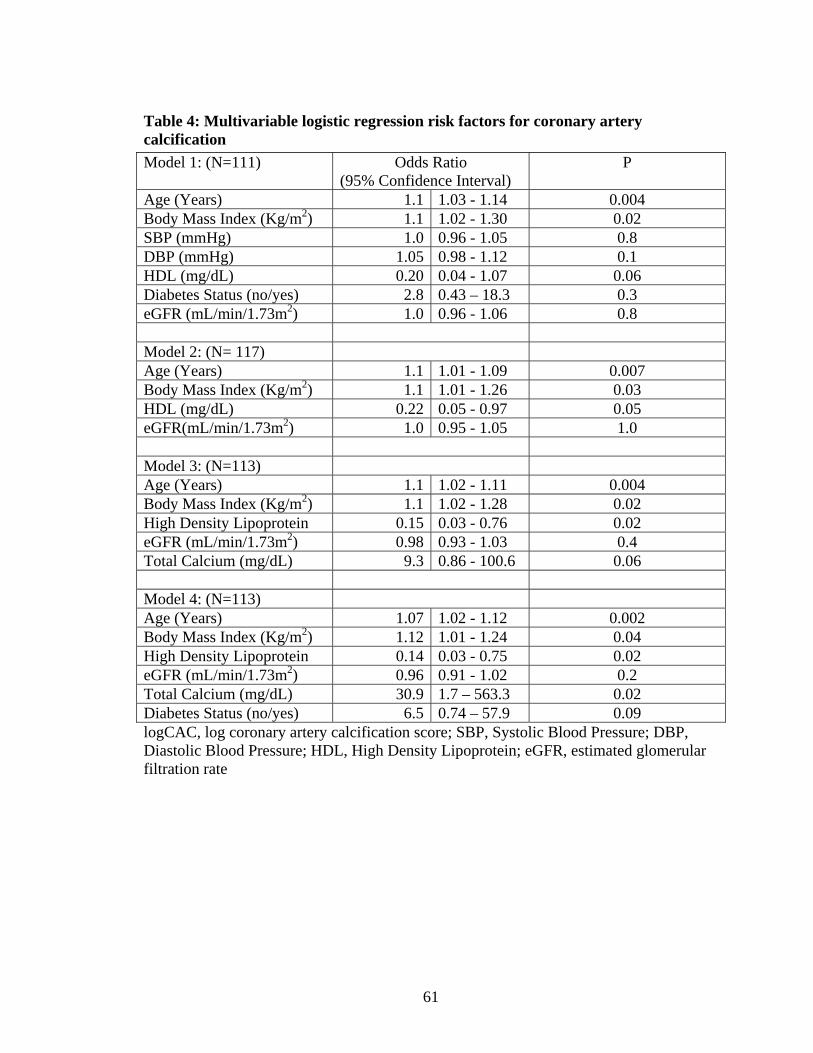
Table 4: Multivariable logistic regression risk factors for coronary artery calcification
Model 1: (N=111) Odds Ratio (95% Confidence Interval)
P
Age (Years) 1.1 1.03 - 1.14 0.004 Body Mass Index (Kg/m2) 1.1 1.02 - 1.30 0.02 SBP (mmHg) 1.0 0.96 - 1.05 0.8 DBP (mmHg) 1.05 0.98 - 1.12 0.1 HDL (mg/dL) 0.20 0.04 - 1.07 0.06 Diabetes Status (no/yes) 2.8 0.43 – 18.3 0.3 eGFR (mL/min/1.73m2) 1.0 0.96 - 1.06 0.8 Model 2: (N= 117) Age (Years) 1.1 1.01 - 1.09 0.007 Body Mass Index (Kg/m2) 1.1 1.01 - 1.26 0.03 HDL (mg/dL) 0.22 0.05 - 0.97 0.05 eGFR(mL/min/1.73m2) 1.0 0.95 - 1.05 1.0 Model 3: (N=113) Age (Years) 1.1 1.02 - 1.11 0.004 Body Mass Index (Kg/m2) 1.1 1.02 - 1.28 0.02 High Density Lipoprotein 0.15 0.03 - 0.76 0.02 eGFR (mL/min/1.73m2) 0.98 0.93 - 1.03 0.4 Total Calcium (mg/dL) 9.3 0.86 - 100.6 0.06 Model 4: (N=113) Age (Years) 1.07 1.02 - 1.12 0.002 Body Mass Index (Kg/m2) 1.12 1.01 - 1.24 0.04 High Density Lipoprotein 0.14 0.03 - 0.75 0.02 eGFR (mL/min/1.73m2) 0.96 0.91 - 1.02 0.2 Total Calcium (mg/dL) 30.9 1.7 – 563.3 0.02 Diabetes Status (no/yes) 6.5 0.74 – 57.9 0.09 logCAC, log coronary artery calcification score; SBP, Systolic Blood Pressure; DBP, Diastolic Blood Pressure; HDL, High Density Lipoprotein; eGFR, estimated glomerular filtration rate
61

Titles and legends to figures:
Figure 1. Selection of Study Participants
Figure 2. Coronary artery calcification total scores by CKD stage. Means, medians (solid lines) and interquartile ranges (boxes) are presented (N=119) Figure 3. Relationship between log Coronary Artery Calcification Total Score and eGFR (N= 119)
62
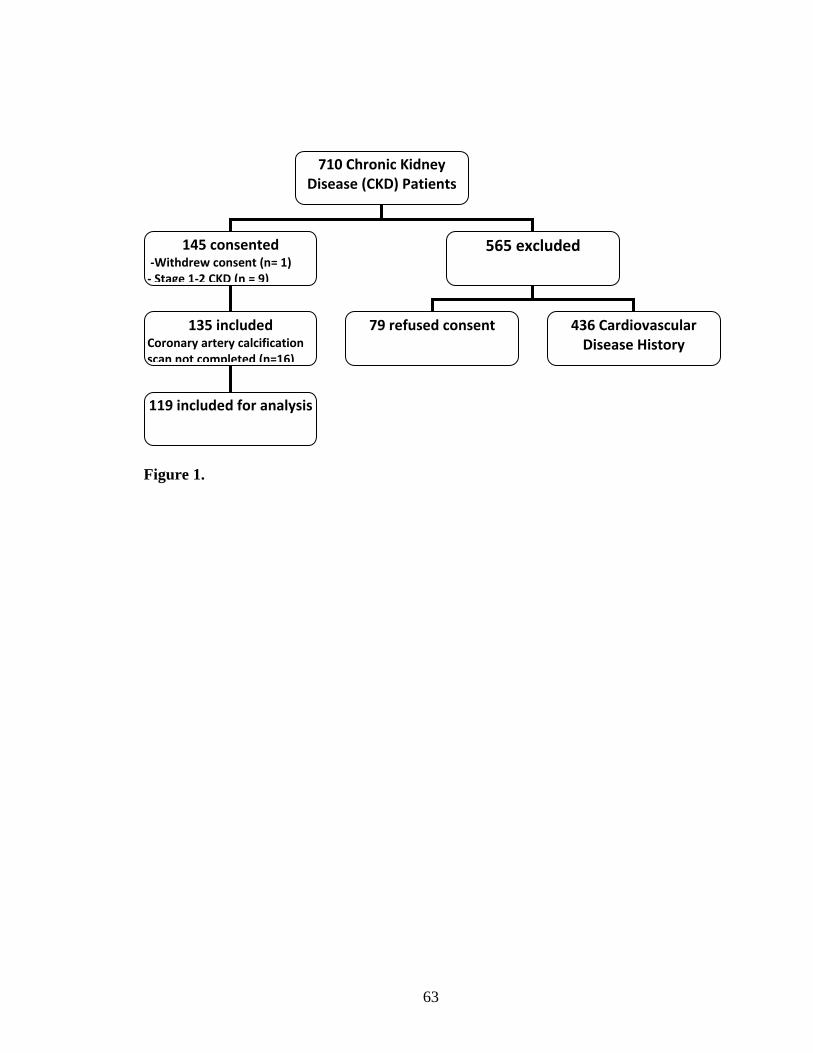
710 Chronic Kidney Disease (CKD) Patients
145 consented ‐Withdrew consent (n= 1) ‐ Stage 1‐2 CKD (n = 9)
565 excluded
135 included Coronary artery calcification scan not completed (n=16)
119 included for analysis
79 refused consent
436 Cardiovascular Disease History
Figure 1.
63
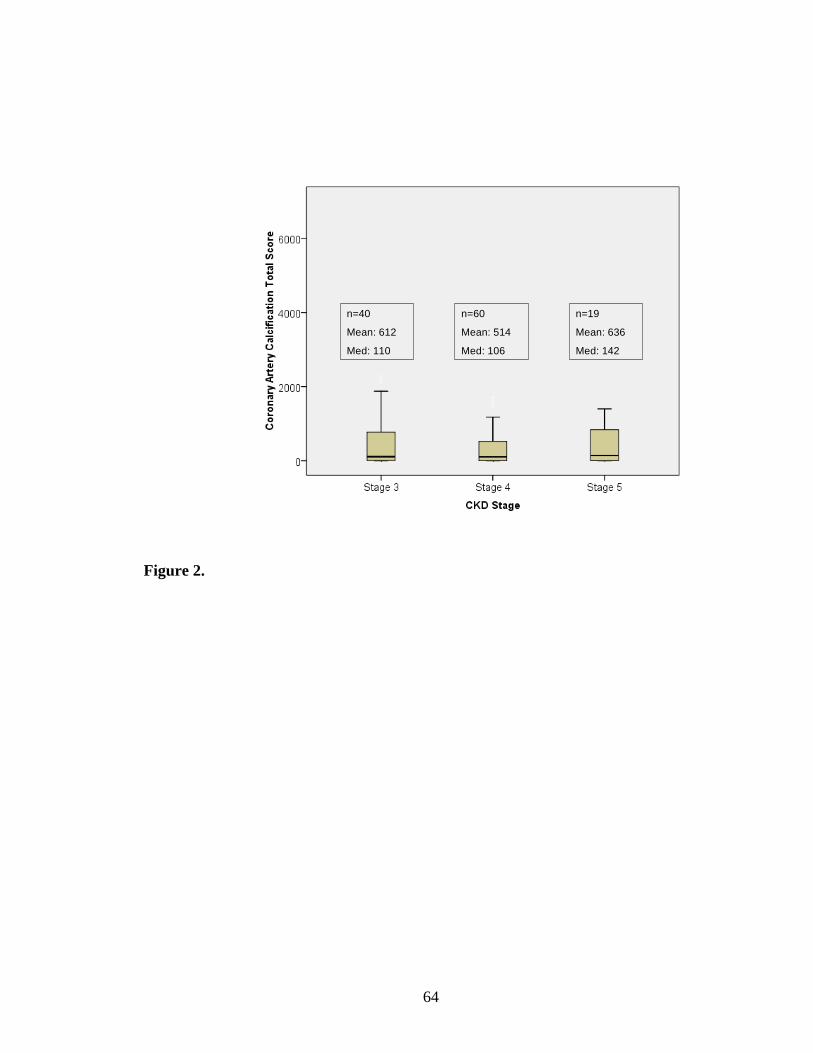
n=40
Mean: 612
Med: 110
n=60
Mean: 514
Med: 106
n=19
Mean: 636
Med: 142
Figure 2.
64
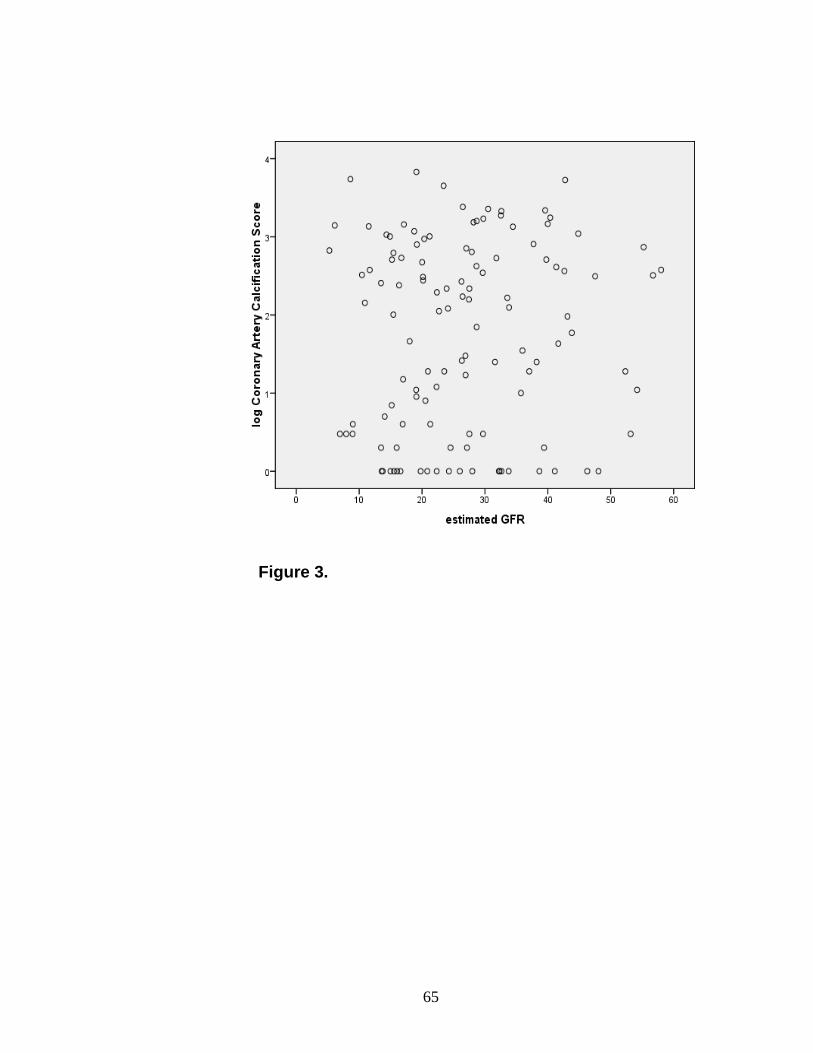
Figure 3.
65
Chapter 5: Implications
5.1 Summary of key findings
The primary intent of this study was to quantify the association between CKD and
CAC in a sample of stage three to five CKD patients without history or symptoms of
cardiovascular disease. Numerous studies have documented the finding of elevated CAC
scores in dialysis patients (1-7). In addition, CAC scores have been found to be higher in
individuals with CKD, compared to scores in the general population (8, 9). Consequently,
there is a biological basis for the idea that CKD itself may be an independent risk factor
for the development of CAC, and this was our primary hypothesis. Our results
demonstrated no significant association between eGFR or CKD stage and CAC (10).
This finding remained consistent with numerous statistical analyses. While median CAC
scores were higher in individuals with stage five CKD versus stages three and four, there
were no significant differences between these values (10).
Data from this study suggested that traditional cardiovascular disease risk factors,
which are highly prevalent in the CKD population, are important in the etiology of CAC.
The regression model we developed explained 38% of the variability in CAC scores,
mainly on the basis of traditional cardiovascular disease risk factors. Age, body mass
index, diabetes, low high density lipoprotein cholesterol, and the composite
cardiovascular risk score were each associated with CAC (10). These findings highlight
the potential importance of ensuring traditional cardiovascular disease risk factors are
aggressively managed in CKD patients.
Conversely, non-traditional cardiovascular disease risk factors were not
associated with CAC with one exception (serum calcium)(10). In CKD, vascular
66
calcification is believed to occur as a consequence of disordered bone and mineral
metabolism (11). Derangements within the vitamin D endocrine system are central to
inciting this process (12). Abnormalities in calcium, phosphorus, and the development of
secondary hyperparathyroidism in CKD patients with vitamin D deficient activity have
been associated with vascular calcification, (13,14). Although our study results revealed
gradated bone and mineral metabolism parameters across CKD stages, no associations
could be demonstrated with CAC (10).
5.2 Misclassification and selection biases
There are some possible explanations for our finding of no association between
CKD and CAC. First, inaccuracies in the diagnosis of CKD, measurement of CAC, and
the estimation of the cardiovascular disease risk score could have introduced
misclassification errors. In designing this study, we were cognizant of the limitations of
other studies that have attempted to address this question. To avoid misclassification of
CKD stage, we restricted our recruitment to individuals with confirmed CKD diagnoses.
However, this strategy could have introduced selection bias, since all participants were
receiving CKD treatment at a tertiary care hospital, and were more likely to have co-
morbid illnesses. Selection bias could have biased our enrollment towards including
individuals with subclinical cardiovascular disease, and possibly with greater
calcification scores. If selection bias had significantly impacted on our results, we would
have been more likely to demonstrate an association between CKD and CAC, and this
was not the case. The lack of association between CAC and CKD in our cohort
comprised of tertiary care patients; therefore, increases the robustness of our finding of
no association between these two variables. Our results are also consistent with
67
observations from stage one and two CKD patients (8,9,15,16), which have also failed to
identify a relationship between CKD and CAC.
It is possible that our methods in diagnosing CKD and CAC could have
introduced error, resulting in misclassification biases of these two variables. In terms of
the former, misclassification of CKD stage could have distorted the potential association
between CAC and CKD. However, the accuracy of eGFR formulae relative to reference
standard GFR testing has been shown, in stage three to five CKD patients, to be quite
precise (17). Consequently, it is doubtful that eGFR levels obtained in this study were
biased to a point that significant misclassification errors would have nullified a potential
association. In terms of the latter, CAC score was measured by MSCT scanning. There is
inherent inaccuracy in the quantification of CAC due to motion artifact, which could have
caused scores to be slightly higher than their true value. The consistency of our main
study finding of virtually no association between CKD and CAC across several types of
analyses supported our findings, even in the potential presence of measurement error.
The cardiovascular disease risk score used in this study to quantify the baseline
cardiovascular disease risk also could have introduced misclassification error. This score,
which is based on traditional cardiovascular disease risk factors, was created from studies
involving subjects from the general population (18). It has not been validated in the stage
three to five CKD population. Given the high prevalence of cardiovascular disease risk
factors in the CKD population (19), it is likely that the magnitude of risk obtained from
this score underestimated the impact of traditional cardiovascular diseases risk factors on
CAC in this study. As such, any introduced bias would be biased towards detecting a
null result.
68
5.3 External validity and confounding
Uncontrolled confounding is also a potential concern in interpreting our study
results. One of our study’s strengths was the exclusion of individuals with a history of
cardiovascular disease to minimize the potential confounding prevalent cardiovascular
disease could confer to the CAC score. On the other hand, since the calcification
mechanism in the CKD population remains largely unexplained, there are likely other
confounding factors which we failed to account for in our analyses.
Our recruitment objective was to assemble a cohort of CKD patients, with varied
levels of renal function, across the spectrum of stages three to five CKD. This endeavor
would augment external validity of our findings, and ensure our results would be
generalizable to a typical CKD clinic, where a paucity of data exists. Individuals with
confirmed stages three to five CKD would be more likely to possess both traditional (19)
and, in particular, non-traditional risk factors for cardiovascular disease (20), and would
consequently be at higher risk of developing CAC. Sixty six percent of our study’s
participants had stage four and five CKD; eighty percent of our cohort had detectable
CAC, and more than fifty percent had moderate to severe CAC (score greater than one
hundred) (10). Stage three to five CKD patients have been shown to have a greater
prevalence of metabolic derangements which are associated with CAC
(hyperparathyroidism, hyperphosphatemia, etc) (21). Our study results demonstrated
similar findings, and more severe derangements of bone and mineral metabolism
parameters were evident across CKD stages, as was expected (10). Despite these
findings, CKD was not associated with CAC.
69
5.4 Study design limitations
The nature of our study, which was cross sectional study, is subject to limitations.
First, since both the exposure (kidney function (eGFR)) and outcome (CAC score) were
measured at one point in time, the temporal direction of the association between these
two variables may be unclear. Second, the cross sectional design did not allow for the
evaluation of two important factors which could be relevant to the relationship between
CKD and CAC: CKD duration, and CKD progression. CKD may present in an insidious
manner, and is often discovered only by routine screening. In fact, many individuals
diagnosed with CKD are unaware that they have the disease (22). It is possible that CKD
could be present, and be progressive, without detection for a number of years. Therefore,
CKD duration and progression could be important factors when considering CAC
development, but neither could be accounted for in our analyses. Prospective studies are
required to study their potential roles.
5.5 Sample size considerations
Our target sample size of one hundred and sixty participants was not achieved.
However, it is statistically doubtful that the finding of no association between CKD and
CAC would have changed with reaching the target sample size, since correlation we
identified between these two variables was very weak (r = 0.042; p = 0.6) (10).
Inadequate sample size is a potential factor in accounting for the lack of association
between CAC and other a priori non traditional risk factors, since our study was powered
based on the primary objective of evaluating the relationship between CKD and CAC.
Although our regression model explained 38% of the variability in CAC scores, it is
70
certainly possible that other factors important in the CAC process remain unaccounted for
in our analyses.
5. 6 Future research opportunities
The process of calcification is controlled by an imbalance between factors that
promote and inhibit its occurrence. The function of vascular calcification inhibitors (for
example, osteoprotegerin, matrix Gla protein, fetuin) may be defective, or decreased, in
CKD patients; however, we were unable to test this hypothesis in this study (11). One
interesting finding from our study is that approximately thirty percent of our patient
cohort was “protected” (zero or minimal calcification score, N = 39) from CAC, despite
possessing significant traditional and non-traditional risk factors for its occurrence (10).
The fact that some CKD patients seem to be protected from the development of CAC is
significant, and warrants further investigation.
Finally, the clinical significance of CAC in non-dialysis CKD remains unknown,
and is an area that warrants further thought. The computed tomography scanning method
used for CAC detection is not nephrotoxic, and could theoretically be applied as a tool to
determine which CKD patients might benefit from coronary angiography to detect
occlusive coronary disease. CAC, although a form of cardiovascular disease, has not been
proven to be a reliable surrogate marker for occlusive coronary artery disease (23). The
CAC score is a composite of vascular calcification arising from both the intimal blood
vessel layer (where traditional cardiovascular disease risk factors are known to impact)
and the medial blood vessel layer (where non-traditional cardiovascular risk factors
including decreased kidney dysfunction are known to impact) (24). Prospective studies
71
are needed to determine if increased CAC is associated with cardiovascular morbidity
and mortality in stage three to five CKD patients.
5.7 Conclusion
In summary, this study explored the relationship between decreased kidney
function and CAC in confirmed Stage 3-5 CKD patients without history or symptoms of
cardiovascular disease. No significant association was demonstrated between these two
clinical variables (10). The prevalence of CAC was high in this cohort of patients, and
scores from all calcification categories were distributed across CKD stages 3-5 (10).
Traditional cardiovascular disease risk factors remained the strongest potential factors
associated with CAC (10). Studies are necessary to determine whether CAC is a risk
factor for cardiovascular events in the CKD patients, and to explore protective
mechanisms that might prevent patients from developing CAC in clinical populations.
72
5.8 Reference List
(1) Blacher J, Guerin AP, Pannier B et al: Arterial calcifications, arterial stiffness, and
cardiovascular risk in end-stage renal disease. Hypertension 38: 938-942, 2001
(2) Block GA, Spiegel DM, Ehrlich J et al: Effects of sevelamer and calcium on
coronary artery calcification in patients new to hemodialysis. Kidney Int 68: 1815- 1824,
2005
(3) Goodman WG, Goldin J, Kuizon BD et al: Coronary-artery calcification in young
adults with end-stage renal disease who are undergoing dialysis. N Engl J Med 342:
1478-1483, 2000
(4) Adragao T, Pires A, Lucas C et al: A simple vascular calcification score predicts
cardiovascular risk in haemodialysis patients. Nephrol Dial Transplant 19:1480-1488
2004
(5) Moe SM, O'Neill KD, Fineberg N et al: Assessment of vascular calcification in
ESRD patients using spiral CT. Nephrol Dial Transplant 18: 1152-1158, 2003
(6) Braun J, Oldendorf M, Moshage W et al: Electron beam computed tomography in the
evaluation of cardiac calcification in chronic dialysis patients. Am J Kidney Dis 27: 394-
401, 1996
(7) Nitta K, Akiba T, Suzuki K et al: Assessment of coronary artery calcification in
hemodialysis patients using multi-detector spiral CT scan. Hypertens Res 27: 527-533,
2004
(8) Kramer H, Toto R, Peshock R et al: Association between chronic kidney disease and
coronary artery calcification: the Dallas Heart Study. J Am Soc Nephrol 16: 507-513,
2005
73
(9) Russo D, Palmiero G, De Blasio AP et al: Coronary artery calcification in patients
with CRF not undergoing dialysis. Am J Kidney Dis. 2004; 44:1024-1030.
(10) Garland JS, Holden RM, Groome PA, Lam M, Nolan R, Morton AR, Pickett W.
Prevalence and associations of Coronary Artery Calcification in Patients with Stages 3-5
CKD without Cardiovascular Disease. Am J Kidney Dis. 2008; 52: 849-858.
(11) Shanahan CM. Mechanisms of vascular calcification in renal disease. Clin Nephrol.
63(2):146-157, 2005.
(12) Holick MF. Vitamin D: A millenium perspective. J Cell Biochem. 2003;1;88(2):296-
307.
(13) Coen G, Manni M, Mantella D, et al: Are PTH serum levels predictive of coronary
calcifications in haemodialysis patients? Nephrol Dial Transplant. 2007; 22(11):3262-
3267.
(14) Yang H, Curinga G, Giachelli CM. Elevated extracellular calcium levels induce
smooth muscle cell matrix mineralization in vitro. Kidney Int. 2004; 66(6):2293-2299.
(15) Fox CS, Larson MG, Keyes MJ et al: Kidney function is inversely associated with
coronary artery calcification in men and women free of cardiovascular disease: the
Framingham Heart Study. Kidney Int 66: 2017-2021, 2004
(16) Seyahi N, Kahveci A, Bolgayirli M et al: Coronary artery calcification and
chronically decreased GFR in living kidney donors. Am J Kidney Dis 49: 143-152, 2007
(17) Levey AS, Coresh J, Greene T et al: Chronic Kidney Disease Epidemiology
Collaboration. Expressing the Modification of Diet in Renal Disease Study equation for
estimating glomerular filtration rate with standardized serum creatinine values.
Clin Chem.2007; 53: 766-772.
74
(18) Wilson PW, D'Agostino RB, Levy D et al: Prediction of coronary heart disease
using risk factor categories. Circulation 1998; 97:1837-1847.
(19) Curtis BM, Barrett BJ, Djurdjev O, Singer J, Levin A. Evaluation and treatment of
CKD patients before and at their first nephrologists encounter in Canada. Am J Kidney
Dis. 2007;50(5):733-42.
(20)Weiner DE, Tighiouart H, Amin MG, Stark PC, MacLeod B, Griffith JL et al.
Chronic kidney disease as a risk factor for cardiovascular disease and all-cause mortality:
a pooled analysis of community-based studies. J Am Soc Nephrol. 2004;15:1307-15.
(21) Clase CM, Kiberd BA, Garg AX. Relationship between glomerular filtration rate
and the prevalence of metabolic abnormalities: results from the Third National Health
and Nutrition Examination Survey (NHANES III). Nephron Clin Pract. 2007;
105(4):c178-184.
(22) Coresh J, Byrd-Holt D, Astor BC, Briggs JP, Eggers PW, Lacher DA et al. Chronic
kidney disease awareness, prevalence, and trends among U.S. adults, 1999 to 2000. J Am
Soc Nephrol. 2005;16:180-188.
(23) Sharples EJ, Pereira D, Summers S, Cunningham J, Rubens M, Goldsmith D et al.
Coronary artery calcification measured with electron-beam computerized tomography
correlates poorly with coronary artery angiography in dialysis patients. Am J Kidney Dis.
2004; 43:313-19.
(24) London GM, Drueke TB: Atherosclerosis and arteriosclerosis in chronic renal
failure. Kidney Int. 1997; 51: 1678-1695.
75
Appendix 1 – Sample of information and consent form for patients
July 25th , 2005
INFORMATION AND CONSENT FORM
Title: What is the relationship between decreased kidney function and coronary artery calcification?
Background Information
You are being invited to participate in a research study directed by Dr. Jocelyn Garland to evaluate the role of kidney disease in calcification of the arteries of the heart. Dr. Jocelyn Garland, or one of her research representatives, will read through this consent form with you and describe any procedures in detail and answer any questions you may have. This study has been reviewed for ethical compliance by the Queen’s University Health Sciences and Affiliated Teaching Hospitals Research Ethics Board.
Details of the Study
Study Overview
The purpose of this study is to determine if individuals with decreasing levels of kidney function have an increased extent of coronary artery calcification and by extension cardiovascular disease. Cardiovascular disease is very common in patients who have kidney disease, and is much more common than in the general population. Symptoms of heart disease include shortness of breath and chest pain, but it is also possible not to have any symptoms. We will explore whether kidney disease is associated with the development of cardiovascular disease, by determining whether degree of kidney impairment is associated with calcium deposition (calcification) in the arteries that supply the heart in patients with kidney disease. You will be considered for the study if you are above the age of 18, you have kidney disease, and you do not have a documented history of heart disease. Degree of kidney disease will be measured from blood tests that are taken as part of your usual care in the
76
Chronic Kidney Disease clinic at Kingston General Hospital. No extra blood tests will be required. Calcification of the heart arteries will be determined by a CT scan of the chest.
Procedure
Patients attending the Kingston General Hospital multidisciplinary renal clinic will be invited to participate. A research nurse or representative will approach you during your scheduled clinic visit. They will explain the study to you and give you the opportunity to ask any questions. You may take the form home with you to discuss with family or significant others. After providing informed consent, you will decide whether you wish to participate. The only other information required (medication lists, other medical problems) will be obtained from your Kidney Disease Outpatient chart or Chronic Kidney Disease Computer Database which are tools currently being used as part of your standard medical care. An appointment for an outpatient CT scan of your chest will be arranged at the Hotel Dieu Hospital. It will be scheduled on the date of your regular clinic visit if possible. The CT scan takes approximately 20 minutes to complete and will be performed by a technician. A radiologist will interpret the results. The CT scans will take place between 4:30 pm and 7 pm at the Hotel Dieu Hospital. The Hotel Dieu Hospital is about 1.5 km from Kingston General Hospital.
Risks & side effects
A CT scan is a safe and non-invasive type of x-ray. The primary risk of a CT scan, similar to any x-ray test, is the small dose of radiation that you will receive. Radiation exposure is measured in milliSievert units. A CT scan performed for the purpose of measuring calcification of the heart arteries, delivers between 1.5-5.2 milliSieverts to male patients and 1.8-6.2 milliSieverts to female patients. The range occurs due to varying body sizes; larger people receive a higher radiation dose. The amount of radiation received for this test, as compared to other x-rays you may have received in the past, is small. It is less than a standard CT scan of the chest, and is comparable to what would be received by obtaining a plain x-ray of the stomach. One thousand milliSieverts is a large radiation exposure. If you feel you have had many x-rays in the past (greater than 100), you may wish to reconsider participation in this study. The CT scan will require approximately 10 minutes to complete. If you are very claustrophobic and have not had a CT scan before, this may be a problem for you and you may wish to reconsider participation in this study.
77
This CT scan is only of the heart; however, part of your lungs may be visualized. If there is any abnormality noted other than cardiac calcification, then your family doctor will be informed and appropriate action taken. If you do not have a family doctor, your nephrologist will be notified of the abnormality. You may experience minor pain and bruising at the time that your blood is drawn.
Benefits
You will be informed about the results of the CT scan of your chest. This information will not be stored on your hospital medical record. Results from this study may improve the understanding of the role of kidney disease in the development of cardiac artery calcification and cardiovascular disease. Patients with kidney disease may benefit in future. It may be possible to begin therapy to prevent the development of calcification if it may be determined ”when” during the course of kidney disease that this process is most likely to start.
Exclusions
You will not be considered for this study if you are under the age of 18, are pregnant or have a history of cardiovascular disease. If you have been admitted to a hospital within the previous month, you will be invited to participate once you have recovered.
Confidentiality
All information obtained during the course of this study is strictly confidential and your anonymity will be protected at all times. You will be identified by hospital ID number only. All data will be stored in locked files and will be available only to Dr. Jocelyn Garland, her research support staff, the Queen’s University Research Ethics Board and the Health Protection Branch in Canada. There is a possibility that your medical record, including identifying information, may be inspected by the Health Protection Agency of Canada in the course of carrying out regular government functions. You will not be identified in any publication or reports.
Freedom to withdraw or participate
Your participation in this study is voluntary. You may withdraw from this study at any time and your withdrawal will not affect your current or future medical care with your physician or at this hospital.
78
Withdrawl of subject by principal investigator
The study physician may decide to withdraw you from this study if you are deemed medically unfit, or you fulfill any of the exclusion criteria between the time of consenting and undergoing the CT scan.
Liability
In the event that you are injured as a result of the study procedures, medical care will be provided to you until resolution of the medical problem. By signing this consent form, you do not waive your legal rights nor release the investigator(s) and sponsors from their legal and professional responsibilities.
Payment
You will receive reimbursement for parking expenses at the hospital. You will receive a stipend of $13.00 for a meal if you are traveling from outside Kingston or are undergoing your CT scan following your clinic visit.
79

Subject Statement and Signature Section
I have read and understand the consent form for this study. I have had the purposes, procedures and technical language of this study explained to me. I have been given sufficient time to consider the above information and to seek advice if I choose to do so. I have had the opportunity to ask questions which have been answered to my satisfaction. I am voluntarily signing this form. I will receive a copy of this consent form for my information. If at any time I have further questions, problems or adverse events, I can contact Dr. Jocelyn Garland, the principal investigator at 613-533-3207 or Dr. John McCans, professor and head of medicine at 613-533-6327 If I have questions regarding my rights as a research subject I can contact Dr. Albert Clark, Chair, Research Ethics Board at 613-533-6081 By signing this consent form, I am indicating that I agree to participate in this study. __________________________________ __________________ Signature of Patient Date __________________________________ __________________ Signature of Witness Date
Statement of Investigator
I, or one of my colleagues, have carefully explained to the subject the nature of the above research study. I certify that, to the best of my knowledge, the subject understands clearly the nature of the study and demands, benefits, and risks involved to participate in this study. ___________________________________ __________________ Signature of Principal Investigator Date
80

Appendix 2 – Confirmation of ethics approval
81
Appendix 3: Responses to editorial reviews
1. AJKD EDITORIAL COMMITTEE COMMENTS General comments: 1. Please note the comments of all of the reviewers, particularly those of reviewer #1 regarding statistical analyses.
Response: Thank you for the detailed and thoughtful reviews. All comments have been addressed. Revised Tables and Figures that are referred to in this documents are attached at the end for your convenience.
2. a) Combine tables 1 and 2.
Response: Completed. Now only reads as Table 1 in manuscript. b) State definition of albuminuria in caption and remove CVD row.
Response: Completed. Please see Table 1. c) For non-normal data, give medians and interquartile range.
Response: Completed. Please see Table 1. d) For better presentation, consider stratifying by CKD stage. You can put the medication data in this table as well and remove from the text.
Response: Completed. Please see Table 1. e) Also present Framingham score here - you can transform it to a % risk or even just report the proportion of individuals with a risk score that comes out to >20%.
Response: Completed. Please see Table 1. Cardiovascular risk scores presented as proportion of individuals with a risk score that comes out to >10%. 3. Would expand table 3 to show all of your a priori planned tests for association with log(CAC). Then in Table 4 show your multivariable model results as regression coefficients and confidence intervals, rather than correlations. This is well-delineated by reviewer #1. Since the primary hypothesis is the relationship of kidney function to CAC, estimated GFR should be forced into the final multivariable models, and your conclusions should be based on the coefficient and 95% confidence interval for this variable.
Response: We have modified Tables based on your suggestions and have performed both linear and logistic regression testing for predictors of CAC. Please refer to Tables 2 (a priori correlations), 3 (multivariable regression analysis) and 4 (multiple logistic regression analysis).
4. What was done for log(CAC) when the CAC was 0?
Response: Our analysis was similar to the analysis by Seyahi et al, which was a reference provided to us by the statistical editors. 1.0 was added to CAC scores prior to log transformation. Seyahi et al, AJKD 2007;49(1): 143-52 5. Hypothesize on the potential biases that could explain the lack of association between CKD stage (or eGFR) and CAC.
82
Response: Please refer to marked area in the manuscript discussion where these changes have been incorporated. Biases that could explain the lack of association between CKD stage / eGFR and CAC include:
a) Uncontrolled confounding – In our analysis of predictors of logCAC, we adjusted for known traditional and non-traditional risk factors shown to be associated with its occurrence. Based on our univariate analysis, we determined that the Cardiovascular disease Risk Score was associated with CAC. Separately, we determined that Age, HDL cholesterol, and Body Mass Index were independent risk factors of CAC. We forced eGFR into all models in order to test for its potential effect on CAC as suggested by the AJKD Editorial Committee, but it was not associated. We also adjusted for Diabetes, as other studies have shown CAC scores are higher in diabetics, and in our study, diabetics had higher CAC scores. Diabetes was not a significant risk factor in the multi-variable regression model. Certainly, there are other possible other confounding factors accounting for CAC presence and severity that we may not have controlled for in this study.
b) Measurement error – Inaccuracies in determining eGFR, CAC, and the Cardiovascular disease Risk Score could have introduced misclassification errors.
In terms of eGFR, we believe the error in using 4 variable MDRD Study equation with standardized serum creatinine assay in individuals who have eGFR < 60ml/min/1.72m2 is minimal.
CAC was measured by a multi-slice CT scanner There is inherent inaccuracy in coronary artery calcification detection due to motion artifact, which could have caused scores to be slightly higher than their true value. The consistency of our main study finding of virtually no association between CKD and coronary artery calcification across several types of analyses is re-assuring, and gave us confidence in the robustness of this finding even in the potential presence of measurement error.
The cardiovascular disease risk score that was used in this study, (1) to our knowledge, has not been validated in a CKD population. The Framingham predictive instrument has been applied to a CKD cohort, and was found to be inconsistent in its ability to predict future cardiovascular events (2). However, in our situation, the latter score was not used as a predictive instrument but as a means of quantifying the baseline cardiovascular disease risk based on “traditional” cardiovascular disease risk factors in this cohort. Interesting, there was no difference in CVD risk across CKD stages (see Table 1 in Manuscript). (1) Wilson PW, D'Agostino RB, Levy D et al: Prediction of coronary heart disease using risk factor categories. Circulation 97: 1837-1847, 1998 (2) Weiner DE, Tighiouart H, Elsayed EF et al: The Framingham predictive instrument in chronic kidney disease. J Am Coll Cardio. 17: 217-224, 2007
c) Study design – There are limitations to cross sectional designs. In this study, one important limitation is that since both the exposure (kidney function (eGFR)) and outcome (coronary artery calcification score) were measured at
83
one point in time, the temporal direction of the association between these two variables is unclear. We agree with reviewer #3 and #1 that a prospective study design with longitudinal follow-up would be preferable, and that time and cost in particular are barriers in completing such a study.
d) Sample Size – Our sample size calculation (designed to quantify the association between eGFR and CAC), required 160 patients, and we included only 119 patients. Our sample size calculation was not designed to test the associations of CAC and other known risk factors. However, it is statistically doubtful that 160 patients would have changed the finding of “no association” between eGFR and CAC, since the identified correlation between these two variables was very weak (r = 0.042, p = 0.6). Reviewer #3 also identified inadequate sample size as a concern, but agreed that “additional patients were unlikely to have changed the conclusions with respect to eGFR and CACs”. Inadequate sample size could have accounted for the lack of association between CAC and a priori chosen risk factors. We are cognizant of Reviewer 1’s comments with respect to sample size. To be consistent with the STROBE recommendations, we have included a modified version of the sample size considerations in the method section (highlighted) which we hope will suit both requests.
6. Delete the sample size paragraph from the discussion.
Response: It has been deleted.
7. Note as a limitation the selection/referral bias. Response: Selection bias/referral may also be a limitation of this study. Since
all study participants were referred to our center, enrolled patients would be more likely to have CKD and other comorbidities. This may have biased our enrollment towards including individuals with subclinical cardiovascular disease, and possibly with greater calcification scores. In order for selection bias to have impacted study results, the relationship between coronary artery calcification, eGFR and other possible risk factors would need to be different in selected versus non-selected participants. However, results from this study are consistent with observations from Stage 1 and 2 CKD patients (1-3), as no association between eGFR and coronary artery calcification was demonstrated. Please also refer to the highlighted area in the manuscript discussion. (1) Fox CS, Larson MG, Keyes MJ et al: Kidney function is inversely associated with coronary artery calcification in men and women free of cardiovascular disease: the Framingham Heart Study. Kidney Int 66: 2017-2021, 2004 (2) Kramer H, Toto R, Peshock R et al: Association between chronic kidney disease and coronary artery calcification: the Dallas Heart Study. J Am Soc Nephrol 16: 507-513, 2005 (3) Seyahi N, Kahveci A, Bolgayirli M et al: Coronary artery calcification and chronically decreased GFR in living kidney donors. Am J Kidney Dis 49: 143-152, 2007
84
Specific Comments: 1. Change the title to: "Prevalence and Associations of Coronary Artery Calcification in Patients with Stages 3-5 CKD without Cardiovascular Disease".
Response: Title changed as suggested.
2. Differentiate this study more from references 18 (only 31 patients with eGFR<60) and 19 (only 41 with stage 3-5 CKD) by including the n's with CKD 3-5 in the introduction.
Response: Please see highlighted section in the introduction, where this suggested change has been incorporated.
3. Instead of saying "the method by Wilson", just say Framingham risk scores.
Response: "the method by Wilson" has been changed to “Cardiovascular risk scores” and referenced (1). This method is not a “Framingham” score, although is based on “traditional” Framingham risk factors. (1) Wilson PW, D'Agostino RB, Levy D et al: Prediction of coronary heart disease using risk factor categories. Circulation 97: 1837-1847, 1998 4. Try to remove the decimal points from the x-axis of figure 3.
Response: Completed. Please refer to Figure 3.
5. Is there an association with log(ACR) and log(CAC) - unsure if you transformed ACR. Response: ACR was not log transformed and should have been, as it is not
normally distributed. Log ACR and log CAC are not associated.
6. Could discuss the following manuscripts: a. Seyahi et al, AJKD 2007;49(1): 143-52, where they compared individuals who had a nephrectomy for kidney donation to matched controls and evaluated CAC. b. Weiner et al. The Framingham predictive instrument in chronic kidney disease. J Am Coll Cardiol 2007;50(3):217-24, where they examine the ability of traditional risk factors to predict future cardiac events in individuals with stage 3-4 CKD without known baseline coronary artery disease and find that traditional risk factors can predict outcomes but require re-weighting from the original Framingham equations.
Response: We thank the Editorial Committee for the additional provided references which were indicated as potentially useful. We have included these two references, in the introduction and discussion respectively. Seyahi’s paper is an important addition in considering other studies that have attempted to address the relationship between eGFR and CAC. The paper by Weiner et al is cited when addressing issues with respect to study limitations.
7. If you choose to focus on this, in a final analysis, compare the characteristics of individuals who are protected vs those who have elevated CAC.
Response: We did not choose to focus on this issue as we believe this would divert the focus of the primary objective, which was to examine the relationship between eGFR and CAC. The Editorial Committee raises an important point, however, in suggesting individuals with and without CAC be compared. We plan to study this issue separately as we prospectively follow these individuals.
85
8. Please follow the STROBE recommended reporting format for observational studies, found at http://www.editorialmanager.com/ajkd/account/AJKD_Info_for_Authors.pdf. In addition, the abstract should be structured with the observational study subheads (Background, Study Design, Setting & Participants, Predictor, Outcomes, Measurements, Results, Limitations, and Conclusions.)
Response: Have revised according to your instructions.
9. Although the editors and reviewers have requested additional information and discussion, we expect you to shorten other parts of the manuscript as necessary to adhere to the word limit of 3,500 for original investigations.
Response: Have revised according to your instructions.
10. Address the required format and style changes noted in section 3 below; pay particular attention to the guidelines on reporting p values, levels of kidney function, and units of measurement.
Response: Have revised according to your instructions. 1A. STATISTICAL EDITOR COMMENTS 1. As suggested by the editorial committee, combine table 1 and 2 and present the data stratified by stages of CKD. This would help the reader identify variables that may have confounded the association between CAC and eGFR.
Response: Completed. Now only reads as Table 1 and results are presented as per CKD stage.
2. It is unclear why tables 1 and 2 are presented for then n=135 subjects enrolled but the remaining correlation analysis are based on n=119 (patients with CAC) only. To be consistent, we would like these tables to be on the n=119 subjects and include a discussion whether patients included were different from patients excluded; in particular, what is the distribution of eGFR for the 16 patients enrolled and did not have CAC measurements?
Response: Completed. Tables 1 and 2 are combined, and refer to the 119 subjects who had CAC scores completed. Please see Table 1, attached. In the results section, the analysis of the 16 patients that did not have completed CAC scores is included as suggested. Please refer to highlighted are in the results section.
3. Figure 2 should be replaced with another one that shows the boxplots of CAC for each stage of CKD. Within each boxplot, show the mean and the median of CAC. Include the sample sizes for each boxplot on top of the box or on the x-axis.
Response: A new Figure 2 has been created to these specifications. 4. Provide us with a scatter plot of Log (CAC) and eGFR.
Response: This has been completed. Please refer to Figure 3.
86
5. Since the range of CAC is very large and perhaps the logarithm transformation is not enough to normalize this variable, we would like you to test the univariate and adjusted association between the 3-level categorical CAC (No evidence/minimal CAC, moderate/mild CAC and severe CAC) and stages of CKD (3 levels). Response: We have performed both suggested analyses.
a) The univariate analysis of 3 level categorical CAC and Stage 3-5 CKD did not demonstrate any association (Spearman’s rho r = -0.093, p=0.3). Please refer to highlighted are in the results section.
b) Adjusted analysis: Concerns with the analysis were identified both by Reviewer #1, and the Editorial Committee. Since reviewer #1 pointed out that similar studies exploring associations of CAC have preformed binary logistic regression with calcification (yes/no) as the dependent variable, we thought such an analysis would be the most appropriate. Please refer to highlighted are in the results section.
Multiple logistic regression demonstrated very similar results to the multivariable regression (also addressed by Reviewer 1, point #10). A series of models were developed by first selecting all variables from univariate analysis which showed an association with CAC, at the significance level p < 0.10: age, body mass index, HDL, diabetes mellitus, systolic blood pressure, diastolic blood pressure and eGFR. Age, body mass index and HDL were determined to be independent risk factors in logistic regression Model 1. eGFR was forced into the model, and diabetes mellitus was also retained in the model as CAC scores were higher in diabetics versus non-diabetics in our cohort. The subsequent exploratory analyses included these covariates, and also tested other possible a priori chosen variables: eGFR, serum total calcium, serum phosphate, serum calcium / phosphorus product, serum intact parathyroid hormone, serum albumin, serum C-reactive protein, and urinary albumin to creatinine ratio. Of these, serum calcium was also found to be an independent risk factor of CAC. Of note, the confidence interval for the Odds ratio for serum calcium was wide, suggesting instability of this obtained result. Please see tables at the end of this document, and/or refer to Table 4 in the manuscript and highlighted area in the Results section.
REVIEWER #1: 1) ”It would be better for the title to reflect the design of the study rather than the results”. Response: The title has been changed to: "Prevalence and Associations of Coronary Artery Calcification in Patients with Stages 3-5 CKD without Cardiovascular Disease".
2) Given that the objective of this study is mostly about adding new knowledge about nontraditional cardiovascular risk factors, it might be worthwhile enumerating these in the abstract. As an aside, C-reactive protein, calcium phosphate, parathyroid hormone and microalbuminuria are hardly 'Nontraditional' at this stage, especially in a
87
population with chronic renal failure and with a readership involved with care of patients with chronic renal failure. Response: We agree with the reviewer that the term “non-traditional is perhaps not the best term. However, this is how such factors are referred to in the medical literature (Reference below). We therefore kept the term “non traditional” to be consistent with current practice. We were unable to list the non-traditional factors in the abstract due to word limit constraints. We do agree that these should be listed earlier in the paper, and noted them instead at the end of the introduction. Please refer to the highlighted area in the introduction. Tomiyama C, Higa A, Dalboni MA et al: The impact of traditional and non-traditional risk factors on coronary calcification in pre-dialysis patients. Nephrol Dial Transplant 21: 2464-2471, 2006 3) Also, if one is making the case that traditional factors alone are responsible for coronary calcification, then some statistic showing that most of the variance observed as explained by traditional risk factors is needed. Response: We did not mean to convey that traditional factors alone are responsible for coronary calcification. Our hypothesis was that both traditional and non-traditional factors would be important, and this study was designed with the specific intent of exploring the impact of eGFR on CAC. We believe that our analysis demonstrates that of the calcification risk factors we tested for, mainly traditional risk factors (age, BMI, HDL, diabetes status and the cardiovascular risk score) were associated with CAC. Similarly, the regression model we developed explains 36% of the variability in CAC scores, mainly on the basis of traditional risk factors. These results emphasize the potential importance of traditional risk factors in contributing to CAC development in the CKD population.
4) The conclusion in the abstract is far too definitive, given that this is a cross-sectional study. Also the standard statement about the need for future studies is somewhat of a waste of abstract words, given that virtually every study in the medical literature finishes with the same truism. Response: We agree that cross sectional observational studies are subject to limitations. Therefore, we have changed the wording in the abstract conclusion. Please refer to the highlighted area in the abstract conclusion section. 5) At the end of the introduction it is stated that an inception cohort was studied. This is not really the case, as future prospective longitudinal data have not been added, especially regarding the evolution of coronary artery calcification scores. Re: outcome variable and potential exploratory factors, this a cross-sectional study and should be described as such. Response: We agree and regret the error. We have deleted the reference to an “inception cohort”. 6) I'm not sure that I agree with the strategy of averaging laboratory parameters in the
88
six-month period prior to enrollment. I say this because this strategy introduces the possibility that different methodologies are used to phenotype patients. It would be ideal to quote the values measured on day zero of the study. If this was not done, which would be regrettable, the next best option would be to quote the final pre-study value. We chose to average parameters to be consistent with the methodology others have used in studying risk factors for coronary artery calcification (please see reference, below). However, since our primary objective was to quantify the cross sectional relationship between eGFR and CAC, we did not average serum creatinine values which were used to measure eGFR. Russo D, Palmiero G, De Blasio AP et al: Coronary artery calcification in patients with CRF not undergoing dialysis. Am J Kidney Dis 44: 1024-1030, 2004 7) It would be useful to know the assay used to measure serum creatinine, and also to know how this laboratory compares with national and international standards. If this information is not available, or if multiple laboratories have been used, this limitation should be added to the discussion section. Response: Serum creatinine was measured by the Roche Creatinine Plus Modular assay (enzymatic) (coefficients of variation <3% for serum creatinine of 163umol/L or more, and 1% for serum creatinine of 590umol/L or more). All serum creatinine values were obtained from Kingston General Hospital’s Laboratory in order to minimize inter-laboratory variability and misclassification errors. Please refer to the highlighted area in the methods section in the manuscript for this information. 8) The sample size considerations might be best dropped as some of the assumptions may be erroneous, or so highly optimistic as to be equivalent to erroneous. For example, it is stated that a correlation of 0.22 means that 5% of the variance is explained. This may well be the case in a perfectly linear world. I strongly doubt whether linearity applies to the phenomenon of coronary calcification. For example, if one works backwards through the sequence of numbers 3, 2, 1, 0, one would expect that the next numbers in the sequence would be -1, -2, minus three etc. This is obviously impossible. Similarly, values that are not exact multiples of 1 are not possible, which is hardly the definition of an interval variable. In fact, in the coronary calcification literature, most analyses tend to treat coronary calcification as a yes/no variable, or as an ordinal variable. Response: Thank you for these comments. We agree that such formulae are based on assumption that may not hold true (i.e. linearity). However, we believe that information on sample size requirements is useful for the reader, as it aids in the understanding of what we were hoping to demonstrate with our sample size, (correlation of 0.22 between eGFR and CAC) versus what we actually found (correlation of 0.04). This information is also required for the STROBE format, as mentioned by the Editorial Committee. We have therefore revised this section in the methods. Please refer to the highlighted area in the methods section. 9) I am not sure that partial correlation is the best strategy for summarizing findings for coronary calcification. Multiple regression in which each variable is adjusted for a standard set of covariates would a less cumbersome way to describe analyses based on
89
assumptions of linearity. One could report the Beta value, confidence interval and P. value for each variable, as well as the overall R2 explained by full models. Given the very high likelihood that coronary calcification is a linear variable, it would be very important to do other types of analysis. In particular, it would be worth repeating all analysis using the strategy of coding coronary calcification as a yes/no categorical variable. In addition, it might be worthwhile repeating this analysis using ordinal logistic regression. For example, a commonly used set of brackets is as follows: zero; > 0. < 10 ( minimal calcification); 10 - 100 ( mild calcification); > 100 - 300 ( moderate calcification); > 300 ( extensive calcification). We thank the reviewer for these constructive comments regarding the statistical analysis. We have repeated the analysis based on the reviewers specifications and have included results of a multivariable linear regression, where logCAC is the dependent variable. A series of models was developed by first selecting all variables from univariate analysis which showed an association with CAC, at the significance level p < 0.10: age, body mass index, HDL, diabetes mellitus, systolic blood pressure, diastolic blood pressure and eGFR. Age, body mass index and HDL were determined to be independent risk factors in the multiple linear regression Model 1. eGFR was forced into the model, and diabetes mellitus was also retained in the model as CAC scores were higher in diabetics versus non-diabetics in our cohort. The subsequent exploratory analyses included these covariates, and also tested other possible a priori chosen variables: eGFR, serum total calcium, serum phosphate, serum calcium/phosphorus product, serum intact parathyroid hormone, serum albumin, serum C-reactive protein, and urinary albumin to creatinine ratio. Of these, serum calcium was also found to be an independent risk factor of CAC. The final model R2 was 0.36, and age, BMI, HDL and serum calcium were independent predictors of CAC, while controlling for eGFR and diabetes mellitus. Multiple logistic regression demonstrated very similar results to the multivariable linear regression. A series of models were developed by first selecting all variables from univariate analysis which showed an association with CAC, at the significance level p < 0.10: age, body mass index, HDL, diabetes mellitus, systolic blood pressure, diastolic blood pressure and eGFR. Age, body mass index and HDL were determined to be independent risk factors in logistic regression Model 1. eGFR was forced into the model, and diabetes mellitus was also retained in the model as CAC scores were higher in diabetics versus non-diabetics in our cohort. The subsequent exploratory analyses included these covariates, and also tested other possible a priori chosen variables: eGFR, serum total calcium, serum phosphate, serum calcium/phosphorus product, serum intact parathyroid hormone, serum albumin, serum C-reactive protein, and urinary albumin to creatinine ratio. Of these, serum calcium was also found to be an independent risk factor of CAC. Of note, the confidence interval for the Odds ratio for serum calcium was wide, suggesting instability of this obtained result. Please see the methods and results sections, where these analyses are explained. 10) In the discussion, the case is made that some patients appear to be protected from
90
calcification. This is a somewhat specious argument, given that 70% of patients actually have it. Response: We believe that minimal (<10) and zero CAC scores which occurred across CKD stages is an interesting and exploratory finding. Also, the fact that just under 1/3 of our study population were free of calcification is an important observation, and should be included. Similar findings have also been noted by Block et. al. in the dialysis population. Block GA, Raggi P, Bellasi A et al: Mortality effect of coronary calcification and phosphate binder choice in incident hemodialysis patients. Kidney Int 71: 438-441, 2007 11) The always unfortunate claim to be the largest ever study is best omitted. In fact this strategy usually points to the major flaw of studies making this claim, namely small sample size. In point of fact, the study examines just over a hundred patients, subjected to a large number of statistical analyses. I'm guessing that there is a strong possibility that the current sample sizes is not adequate to bear all of this analytical activity without invoking the issue of multiple comparisons and type 2 error. Response: This sentence has been omitted from the revised version. 12) It is argued that exclusion of individuals with GFR above 60 was obligatory, because the GFR equations are not accurate about this value. This may well be the case, but the biological question remains: what was the impact of excluding subjects with true GFR (for example, with an isotope scan) > 60. It is obvious that no claims a for lack of relationship between GFR and calcification can be safe when 95% of the possible study population have been excluded. The discussion should emphasize the point that much higher threshold values of GFR may define the zone at which currently calcification develops. Related to this, there is a strong possibility of referral bias, and this could certainly explain the disparity between the study and community-based study studies. Response: We chose to examine Stage 3-5 CKD (eGFR<60ml/min/1.73m2) because other studies have already examined CAC in individuals with mainly Stage 1 and 2 CKD and demonstrated no association (1,2). The reference provided by the Editorial Committee written by Seyahi (3) et al, also examines the relationship between eGFR (Stage 1/2 CKD) and CAC, and no relationship could be demonstrated. We also chose Stage 3-5 CKD in order to avoid possible misclassification error as eGFR equations, as we discussed, are known to be less accurate in predicting GFR when “true” GFR is greater that 60ml/min/1.73m2 (4-6). Since our primary objective was to quantify the relationship between eGFR and CAC, we wanted to only study individuals with kidney function measurements we could rely on. We included this information in the study introduction, as suggested by the Editorial Committee (Please see highlighted area in introduction) (1) Fox CS, Larson MG, Keyes MJ et al: Kidney function is inversely associated with coronary artery calcification in men and women free of cardiovascular disease: the Framingham Heart Study. Kidney Int 66: 2017-2021, 2004 (2) Kramer H, Toto R, Peshock R et al: Association between chronic kidney disease and coronary artery calcification: the Dallas Heart Study. J Am Soc Nephrol 16: 507-513, 2005
91

(3) Seyahi N, Kahveci A, Bolgayirli M et al: Coronary artery calcification and chronically decreased GFR in living kidney donors. Am J Kidney Dis 49: 143-152, 2007 (4) Levey AS, Coresh J, Greene T et al: Chronic Kidney Disease Epidemiology Collaboration. Expressing the Modification of Diet in Renal Disease Study equation for estimating glomerular filtration rate with standardized serum creatinine values. Clin Chem 53: 766-772, 2007 (5) Rule AD, Larson TS, Bergstralh EJ et al: Using serum creatinine to estimate glomerular filtration rate: accuracy in good health and in chronic kidney disease. Ann Intern Med 141: 929-937, 2004 (6) Froissart M, Rossert J, Jacquot C et al: Predictive performance of the modification of diet in renal disease and Cockcroft-Gault equations for estimating renal function. J Am Soc Nephrol 16: 763-773, 2005 Response: Selection bias/referral may also be a limitation of this study. Since all study participants were referred to our center, enrolled patients would be more likely to have CKD and other comorbidities. This may have biased our enrollment towards including individuals with subclinical cardiovascular disease, and possibly with greater calcification scores. In order for selection bias to have impacted study results, the relationship between coronary artery calcification, eGFR and other possible risk factors would need to be different in selected versus non-selected participants. However, results from this study are consistent with observations from Stage 1 and 2 CKD patients (see ref 1-3, just above), as no association between eGFR and coronary artery calcification was demonstrated. Please also refer to the highlighted area in the manuscript discussion. 13) As stated above, the part of the discussion talk about sample size may be erroneous and close perusal of the phraseology used leads one to conclude that there is a strong possibility that inadequate sample size may the responsible for some of the lack of association seen for novel risk factors. I'm not sure that this defensive posturing really helps the reader, and this section might be best removed. Instead, it would be more helpful to explore impact of inadequate sample size (whether or not this is the largest ever studied) and lack of longitudinal follow-up on the findings of the study. Response: Thank you for these comments. Sample Size – We have revised this section as suggested. We did include a brief discussion regarding sample size when addressing study limitations, as both Reviewer 1 and 3 identified this as a potential limitation. Reviewer #3 agreed that “additional patients were unlikely to have changed the conclusions with respect to eGFR and CACs”. Inadequate sample size could be a factor, however, accounting for the lack of association between CAC and other a priori chosen risk factors. Study design – There are limitations to cross sectional designs. In this study, one important limitation is that since both the exposure (kidney function (eGFR)) and outcome (coronary artery calcification score) were measured at one point in time, the temporal direction of the association between these two variables is unclear. We agree with reviewer #1 that a prospective study design with longitudinal follow-up would be preferable, and that time and cost in particular are barriers in completing
92
such a study. Please also refer to the highlighted area in the manuscript discussion for the revised section on study limitations. REVIEWER #2: This is a very interesting observational study which attempts to co-relate and quantify the relationship between kidney function and coronary artery calcification and states 3-5 chronic kidney disease patients (m=135) that have no known history or symptoms of cardiovascular disease at the time of inception of the cohort. Response: We thank the reviewer for the positive comments about our work. The study demonstrated that there is no significant co-relation between kidney function and coronary artery calcification, but the coronary artery calcification did correlate with traditional cardiovascular risk factors, age, BMI and the composite cardiovascular risk score. 1) The BMI finding could be included in the abstract. Response: BMI finding was included in the abstract as suggested. Please refer to the highlighted area in the abstract. 2) The observational report could be considerably strengthened by an attempt to determine the duration of chronic kidney disease. In other words time the patient initially had an eGFR> 60 until time the patient had an estimated GFR of less than 60 ml/min/1.73m2. We agree that using this time measure does not precisely reflect the onset of kidney disease, however it may serve as a crude measure in an attempt to discern whether duration of renal failure has an impact on coronary calcification scores. If this was negative it would strengthen the initially observed negative observation. Response: We completely agree with the Reviewer #2 that “progression” of CKD may indeed be an important factor in contributing to CAC risk that we were unable to account for. However, referral patterns vary greatly at our center, and unfortunately, any result attempting to determine “duration” of CKD would be unreliable at best. We believe that progressive CKD and its potential importance with respect to CKD should be examined prospectively and we plan to do this in future. 3) It is interesting that 436 out of 631 subjects who were initially considered for the study had symptomatic cardiovascular disease, meaning 69 % of patients with renal impairment had significant cardiovascular disease but the authors did not note an association between coronary calcification a marker of worsening vascular disease and the worsening estimated GFR. They make mention of the biological possibility to support the theory that kidney impairment may be an important risk factor for coronary calcification. However, their results do no correlate with this but one wonders looking at the prevalence of chronic kidney disease with known cardiovascular disease whether the current findings are more in keeping with the non-nephrocentric concept that renal disease is a manifestation of systemic accelerated vascular disease reflected in the renal microcirculation.
93
Response: We agree with these statements. We expanded on this idea in the discussion and please refer to the highlighted area.
Numerous studies have documented the finding of elevated coronary artery calcification scores in dialysis patients. In addition, coronary artery calcification scores have been found to be higher in individuals with CKD, compared to scores in the general population. Consequently, there is biological plausibility to support the theory that CKD itself may be an independent risk factor for the development of coronary artery calcification. The development of coronary artery calcification in individuals who have chronic kidney disease is complex, and is incompletely understood. It is thought to occur as a result of an imbalance between factors that promote its occurrence (including traditional and non-traditional cardiovascular disease risk factors), and those that inhibit it.
CKD has been demonstrated to be an independent risk factor for adverse cardiovascular events in many studies. It is also known that CKD and cardiovascular disease “share” many of the same risk factors. Consequently, we expected to observe a relationship between eGFR and coronary artery calcification. Weiner et al showed that CKD and cardiovascular disease are each independent risk factors for cardiovascular morbidity and mortality, but they do not act synergistically. A diagnosis of CKD may, therefore, simply reflect “global” vascular disease, possibly resulting from mechanisms creating diffuse endothelial injury, and decreased kidney function may be a marker of this process. REVIEWER #3: Weakness of the study: 1) Recruitment less than required based on sample size calculations - however, as pointed out by the authors, the additional patients were unlikely to have changed the conclusions with respect to eGFR and CACs. Response: Thank you for the comment. We agree with this statement. 2) 79- ~10% of patients refused consent. Unclear if these patients are different. Of the patients with cardiac disease who were excluded - were they systematically different in some way. Perhaps the majority of them had stage 5 CKD. However, I think this is highly unlikely. Response: Thank you for this comment. We do not have access to this requested data. However, similarly to the concern raised by Reviewer #2, the Statistical Editor suggested we include a discussion whether enrolled participants were different from excluded patients. Please refer to the results section, highlighted area.
16 patients enrolled but did not have CAC measurements were compared to 119 included patients. Excluded patients were of similar age (64.25 years ± 10 versus 58.5 ± 14; p=0.13), had similar eGFR measurements (31.4 ± 13 mL/min/1.73m2
versus 26.72 ± 12; p= 0.15) as well as proportions of individuals within CKD stages
3-5. However, excluded patients had higher systolic blood pressure (146 ± 23 mmHg vs 136.2 ± 16; p=0.03 ) and had increased median albuminuria (median ACR 95.75
94
mg/mmol, interquartile range 23.2 to 235.2) compared to included patients (33.65 mg/mmol, interquartile range 5.8 to 101.2; p=0.05). 3) X-sectional design. One could image a prospective cohort study (similar to Framingham) in patients at risk for CKD being the more 'optimal' design. However, this type of study with CT imaging is unlikely to be done due to the patient numbers, time and cost that would be required for this type of trial. Response: We agree, and plan to follow our current cohort in the future. 4) Stage 5 - I assume none of these patients were on dialysis but this is not mentioned in the manuscript Response: No patients were receiving dialysis. Thank you for clarifying this, and we have been more specific in detailing the study exclusion criteria. Please see the highlighted area in the Methods section, where this has been noted. 5) Pulse pressure did not appear to be an a priori variable. As widened pulse pressure may simply be a surrogate for vascular calcification - perhaps does not really add much to the model Response: Pulse pressure has been removed from the model. 6) I would like to see the correlations that were tested in the tables Response: All tested correlations have been added. Please refer to Table 3 at the end of this document, and in the manuscript.
95

96