Embed Size (px)
Citation preview
www.pkpsa.pl
PKP GROUP
A CASE FOR SUCCESSFUL RESTRUCTURING OF A RAILWAY
COMPANY IN CENTRAL AND EASTERN EUROPE
21 September 2015
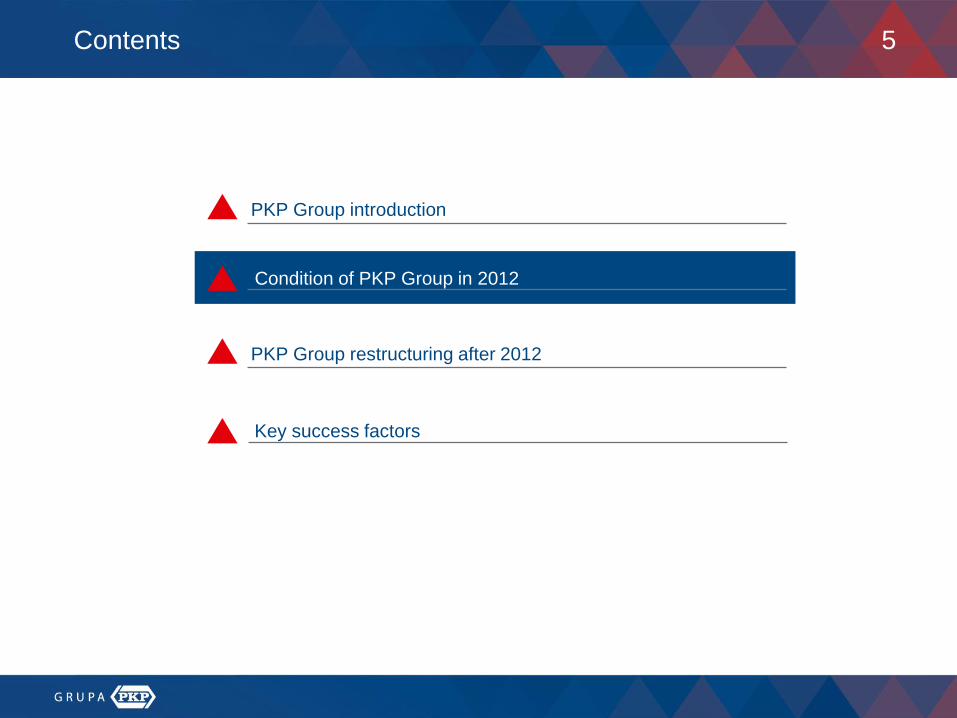
2Contents
Condition of PKP Group in 2012
PKP Group restructuring after 2012
Key success factors
PKP Group introduction
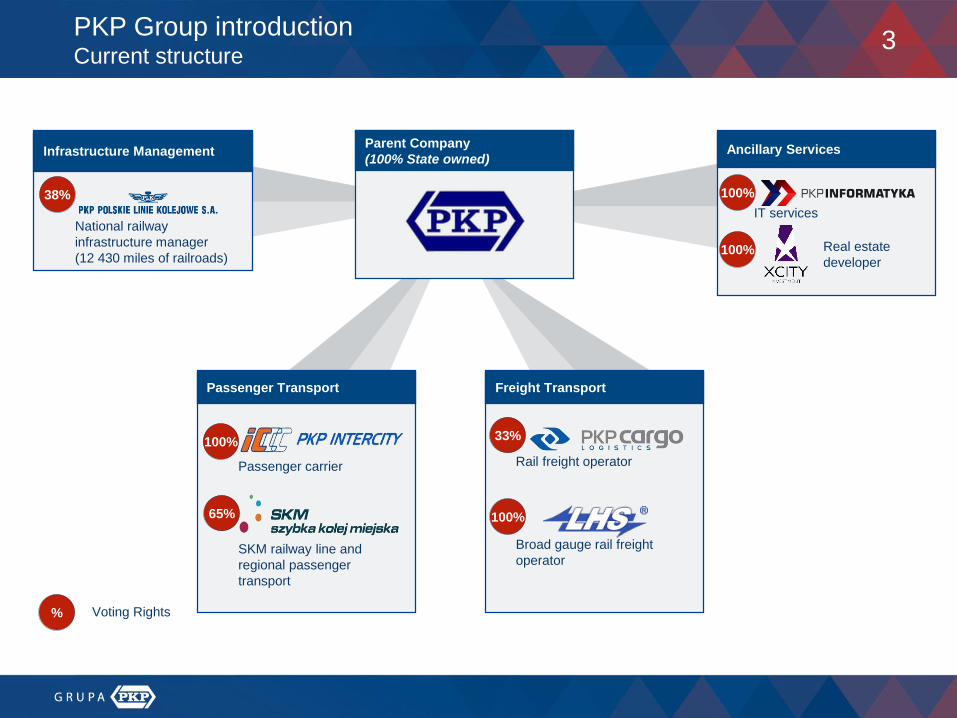
3PKP Group introductionCurrent structure
Parent Company
(100% State owned)
Voting Rights%
Passenger Transport
Passenger carrier
SKM railway line and
regional passenger
transport
100%
65%
Freight Transport
Broad gauge rail freight
operator
Rail freight operator
33%
100%
Infrastructure Management
National railway
infrastructure manager
(12 430 miles of railroads)
38%
Ancillary Services
IT services
100%
100% Real estate
developer
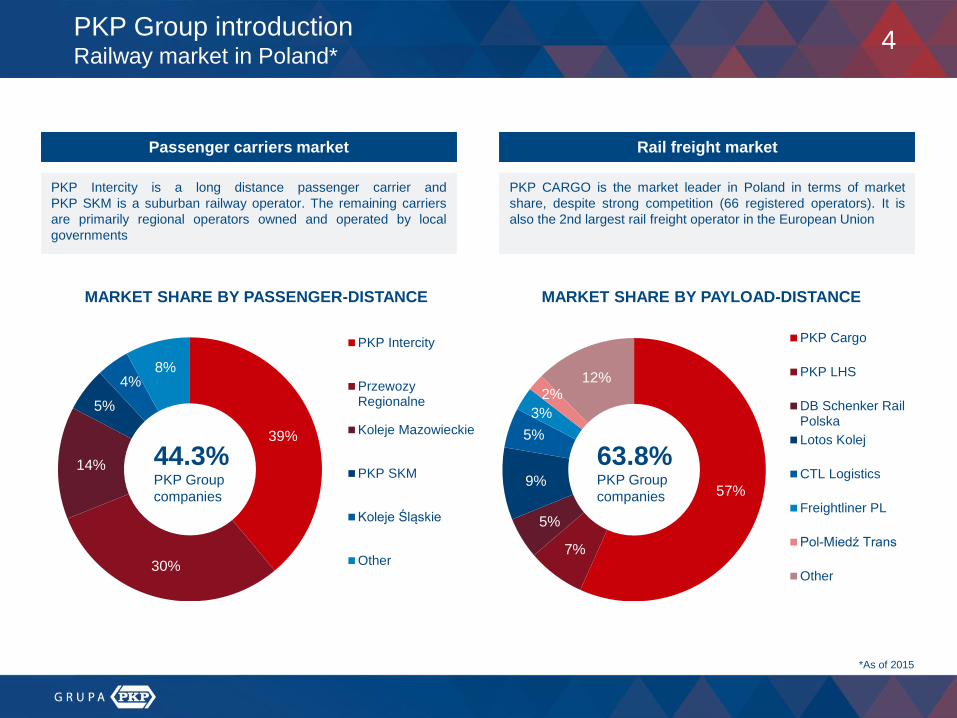
MARKET SHARE BY PAYLOAD-DISTANCEMARKET SHARE BY PASSENGER-DISTANCE
Passenger carriers market Rail freight market
PKP Intercity is a long distance passenger carrier and
PKP SKM is a suburban railway operator. The remaining carriers
are primarily regional operators owned and operated by local
governments
PKP CARGO is the market leader in Poland in terms of market
share, despite strong competition (66 registered operators). It is
also the 2nd largest rail freight operator in the European Union
39%
30%
14%
5%
4%8%
PKP Intercity
PrzewozyRegionalne
Koleje Mazowieckie
PKP SKM
Koleje Śląskie
Other
57%
7%
5%
9%
5%
3%
2%12%
PKP Cargo
PKP LHS
DB Schenker RailPolska
Lotos Kolej
CTL Logistics
Freightliner PL
Pol-Miedź Trans
Other
63.8%PKP Group
companies
44.3%PKP Group
companies
4PKP Group introductionRailway market in Poland*
*As of 2015
5Contents
Condition of PKP Group in 2012
PKP Group restructuring after 2012
Key success factors
PKP Group introduction
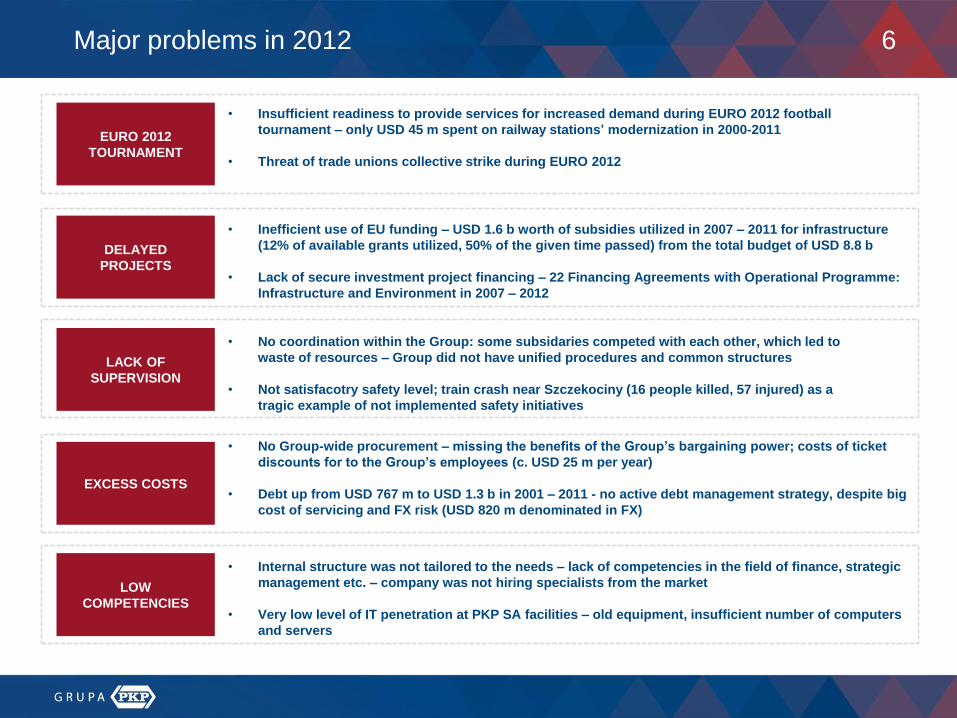
6
• Insufficient readiness to provide services for increased demand during EURO 2012 football
tournament – only USD 45 m spent on railway stations’ modernization in 2000-2011
• Threat of trade unions collective strike during EURO 2012
• Inefficient use of EU funding – USD 1.6 b worth of subsidies utilized in 2007 – 2011 for infrastructure
(12% of available grants utilized, 50% of the given time passed) from the total budget of USD 8.8 b
• Lack of secure investment project financing – 22 Financing Agreements with Operational Programme:
Infrastructure and Environment in 2007 – 2012
• No coordination within the Group: some subsidaries competed with each other, which led to
waste of resources – Group did not have unified procedures and common structures
• Not satisfacotry safety level; train crash near Szczekociny (16 people killed, 57 injured) as a
tragic example of not implemented safety initiatives
• No Group-wide procurement – missing the benefits of the Group’s bargaining power; costs of ticket
discounts for to the Group’s employees (c. USD 25 m per year)
• Debt up from USD 767 m to USD 1.3 b in 2001 – 2011 - no active debt management strategy, despite big
cost of servicing and FX risk (USD 820 m denominated in FX)
• Internal structure was not tailored to the needs – lack of competencies in the field of finance, strategic
management etc. – company was not hiring specialists from the market
• Very low level of IT penetration at PKP SA facilities – old equipment, insufficient number of computers
and servers
EURO 2012
TOURNAMENT
DELAYED
PROJECTS
LACK OF
SUPERVISION
EXCESS COSTS
LOW
COMPETENCIES
Major problems in 2012
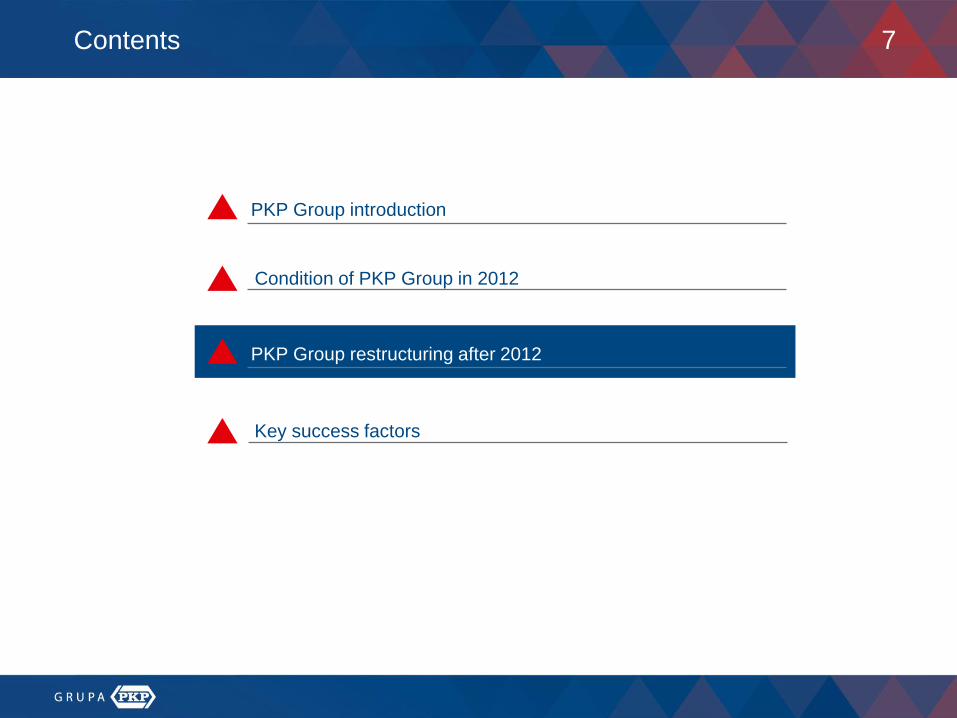
7Contents
Condition of PKP Group in 2012
PKP Group restructuring after 2012
Key success factors
PKP Group introduction
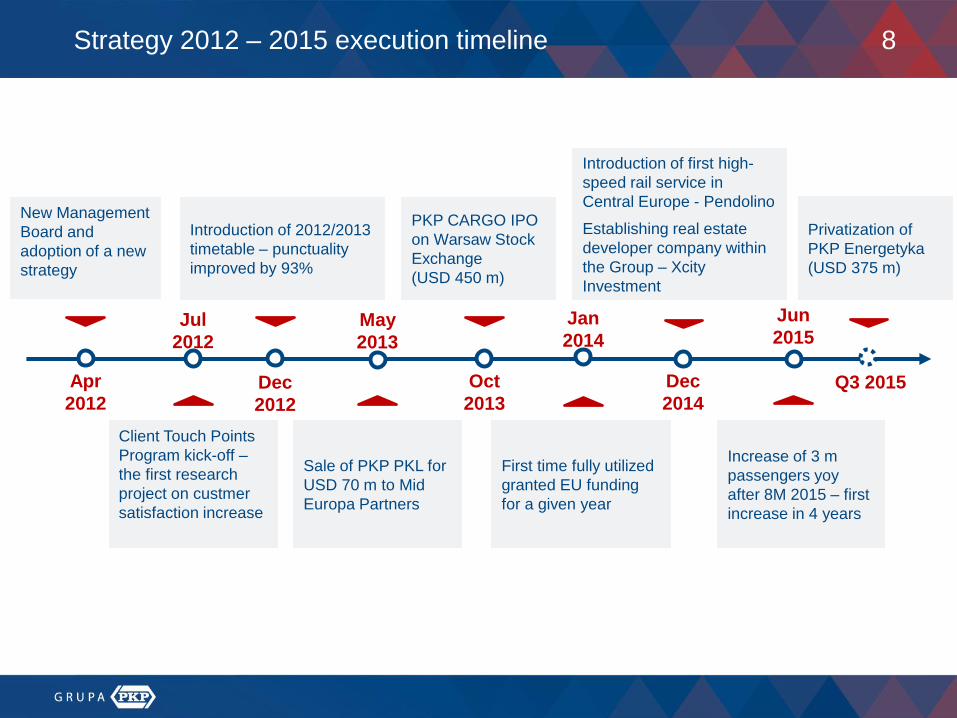
8
Jan
2014
Apr
2012
New Management
Board and
adoption of a new
strategy
Jul
2012
Client Touch Points
Program kick-off –
the first research
project on custmer
satisfaction increase
Dec
2012
Introduction of 2012/2013
timetable – punctuality
improved by 93%
May
2013
Sale of PKP PKL for
USD 70 m to Mid
Europa Partners
Oct
2013
PKP CARGO IPO
on Warsaw Stock
Exchange
(USD 450 m)
First time fully utilized
granted EU funding
for a given year
Dec
2014
Introduction of first high-
speed rail service in
Central Europe - Pendolino
Establishing real estate
developer company within
the Group – Xcity
Investment
Q3 2015
Increase of 3 m
passengers yoy
after 8M 2015 – first
increase in 4 years
Strategy 2012 – 2015 execution timeline
Jun
2015
Privatization of
PKP Energetyka
(USD 375 m)
9
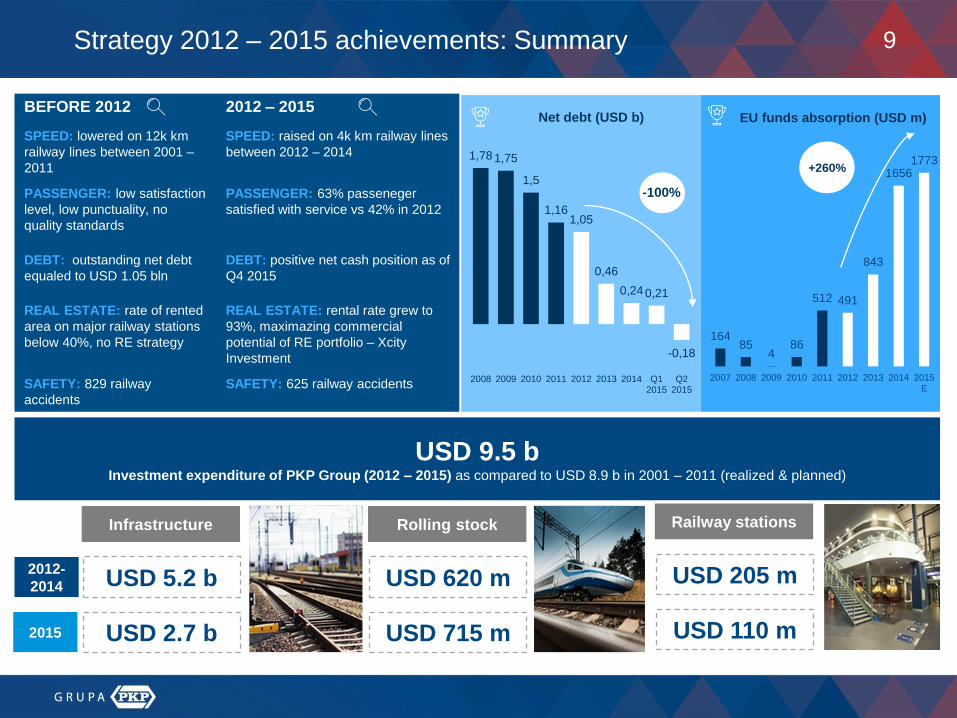
1,78 1,75
1,5
1,161,05
0,46
0,24 0,21
-0,18
2008 2009 2010 2011 2012 2013 2014 Q12015
Q22015
Net debt (USD b)BEFORE 2012 2012 – 2015
SPEED: lowered on 12k km
railway lines between 2001 –
2011
SPEED: raised on 4k km railway lines
between 2012 – 2014
PASSENGER: low satisfaction
level, low punctuality, no
quality standards
PASSENGER: 63% passeneger
satisfied with service vs 42% in 2012
DEBT: outstanding net debt
equaled to USD 1.05 bln
DEBT: positive net cash position as of
Q4 2015
REAL ESTATE: rate of rented
area on major railway stations
below 40%, no RE strategy
REAL ESTATE: rental rate grew to
93%, maximazing commercial
potential of RE portfolio – Xcity
Investment
SAFETY: 829 railway
accidents
SAFETY: 625 railway accidents
-100%
Strategy 2012 – 2015 achievements: Summary
USD 2.7 b
USD 9.5 bInvestment expenditure of PKP Group (2012 – 2015) as compared to USD 8.9 b in 2001 – 2011 (realized & planned)
16485
486
512 491
843
16561773
2007 2008 2009 2010 2011 2012 2013 2014 2015E
EU funds absorption (USD m)
+260%
Infrastructure
USD 5.2 b
USD 715 m
Rolling stock
USD 620 m
USD 110 m
Railway stations
USD 205 m2012-
2014
2015
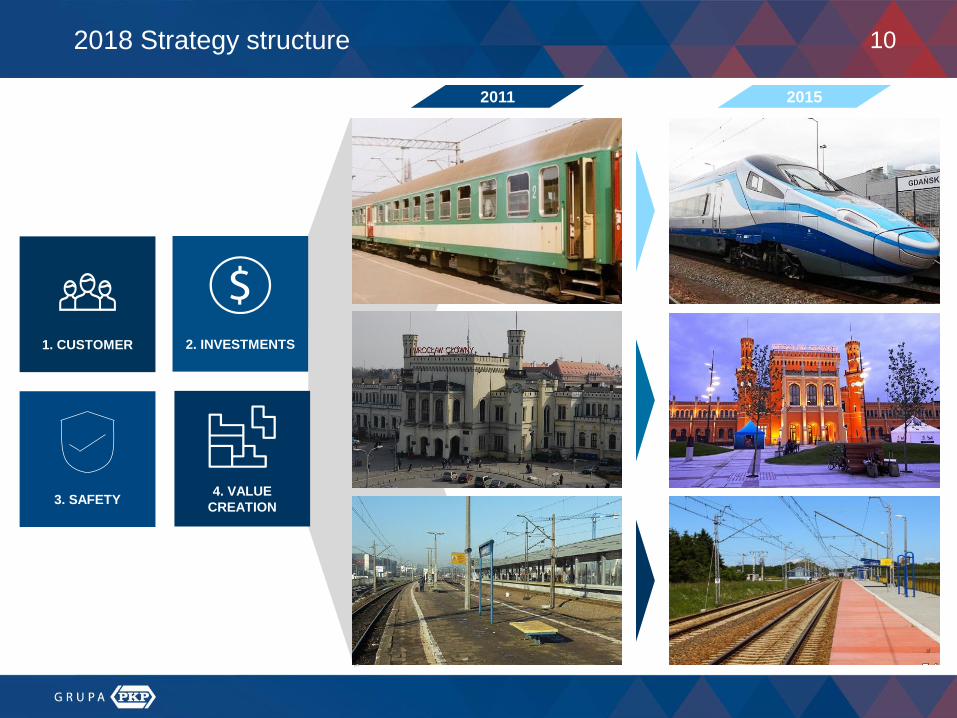
102018 Strategy structure
2. INVESTMENTS
3. SAFETY4. VALUE
CREATION
1. CUSTOMER
2011 2015
11
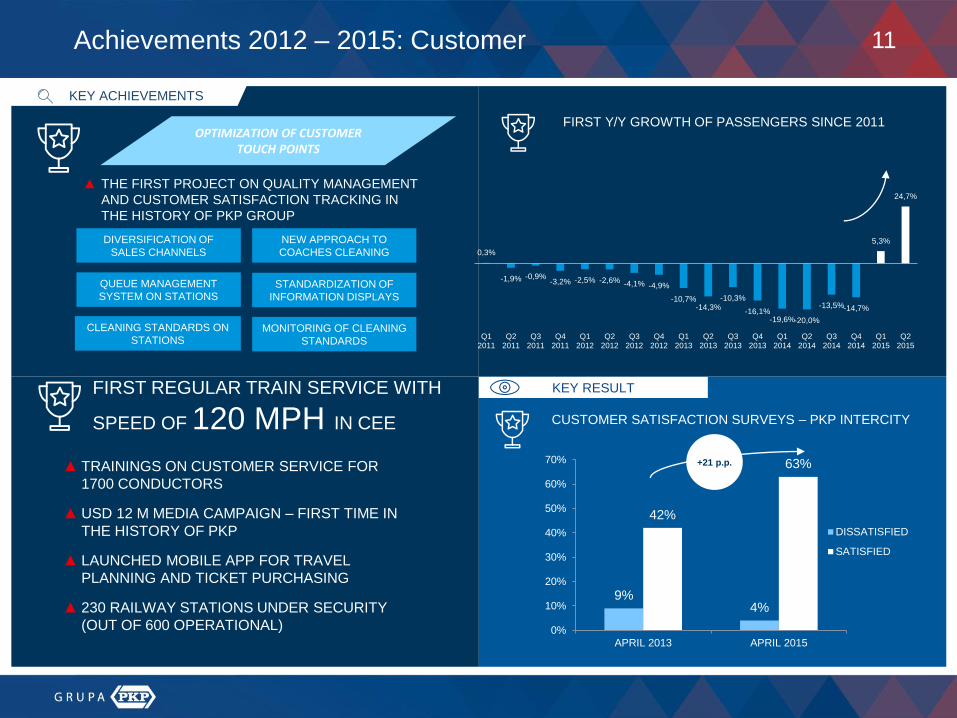
CUSTOMER SATISFACTION SURVEYS – PKP INTERCITY
+21 p.p.
Achievements 2012 – 2015: Customer
KEY ACHIEVEMENTS
9%4%
42%
63%
0%
10%
20%
30%
40%
50%
60%
70%
APRIL 2013 APRIL 2015
DISSATISFIED
SATISFIED
KEY RESULT
▲ TRAININGS ON CUSTOMER SERVICE FOR
1700 CONDUCTORS
▲ USD 12 M MEDIA CAMPAIGN – FIRST TIME IN
THE HISTORY OF PKP
▲ LAUNCHED MOBILE APP FOR TRAVEL
PLANNING AND TICKET PURCHASING
▲ 230 RAILWAY STATIONS UNDER SECURITY
(OUT OF 600 OPERATIONAL)
FIRST REGULAR TRAIN SERVICE WITH
SPEED OF 120 MPH IN CEE
FIRST Y/Y GROWTH OF PASSENGERS SINCE 2011
0,3%
-1,9% -0,9%-3,2% -2,5% -2,6% -4,1% -4,9%
-10,7%-14,3%
-10,3%
-16,1%-19,6%-20,0%
-13,5%-14,7%
5,3%
24,7%
Q12011
Q22011
Q32011
Q42011
Q12012
Q22012
Q32012
Q42012
Q12013
Q22013
Q32013
Q42013
Q12014
Q22014
Q32014
Q42014
Q12015
Q22015
OPTIMIZATION OF CUSTOMER TOUCH POINTS
▲ THE FIRST PROJECT ON QUALITY MANAGEMENT
AND CUSTOMER SATISFACTION TRACKING IN
THE HISTORY OF PKP GROUP
DIVERSIFICATION OF
SALES CHANNELS
QUEUE MANAGEMENT
SYSTEM ON STATIONS
CLEANING STANDARDS ON
STATIONS
NEW APPROACH TO
COACHES CLEANING
STANDARDIZATION OF
INFORMATION DISPLAYS
MONITORING OF CLEANING
STANDARDS
12
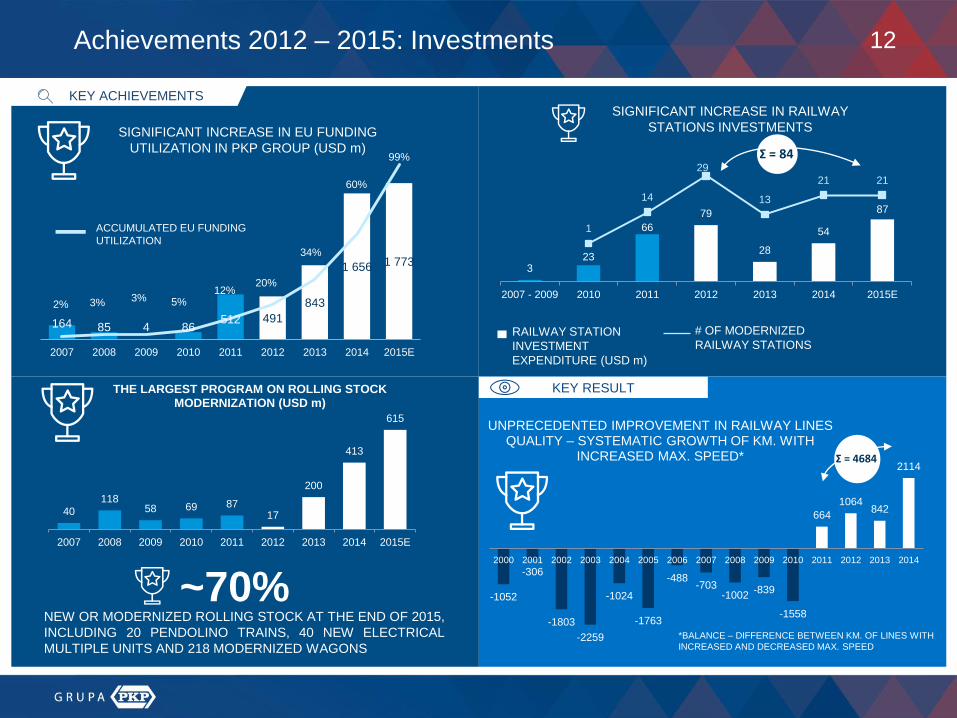
~70%NEW OR MODERNIZED ROLLING STOCK AT THE END OF 2015,
INCLUDING 20 PENDOLINO TRAINS, 40 NEW ELECTRICAL
MULTIPLE UNITS AND 218 MODERNIZED WAGONS
Achievements 2012 – 2015: Investments
KEY RESULT
KEY ACHIEVEMENTS
-1052
-306
-1803
-2259
-1024
-1763
-488-703
-1002-839
-1558
664
1064842
2114
2000 2001 2002 2003 2004 2005 2006 2007 2008 2009 2010 2011 2012 2013 2014
UNPRECEDENTED IMPROVEMENT IN RAILWAY LINES QUALITY – SYSTEMATIC GROWTH OF KM. WITH
INCREASED MAX. SPEED* Σ = 4684
*BALANCE – DIFFERENCE BETWEEN KM. OF LINES WITH
INCREASED AND DECREASED MAX. SPEED
SIGNIFICANT INCREASE IN EU FUNDING
UTILIZATION IN PKP GROUP (USD m)
164 85 4 86512 491
843
1 656 1 773
2% 3% 3% 5%12%
20%
34%
60%
99%
2007 2008 2009 2010 2011 2012 2013 2014 2015E
ACCUMULATED EU FUNDING
UTILIZATION
SIGNIFICANT INCREASE IN RAILWAY
STATIONS INVESTMENTS
323
66
79
28
54
87
1
14
29
13
21 21
2007 - 2009 2010 2011 2012 2013 2014 2015E
RAILWAY STATION
INVESTMENT
EXPENDITURE (USD m)
# OF MODERNIZED
RAILWAY STATIONS
Σ = 84
40
11858 69 87
17
200
413
615
2007 2008 2009 2010 2011 2012 2013 2014 2015E
THE LARGEST PROGRAM ON ROLLING STOCK MODERNIZATION (USD m)
13
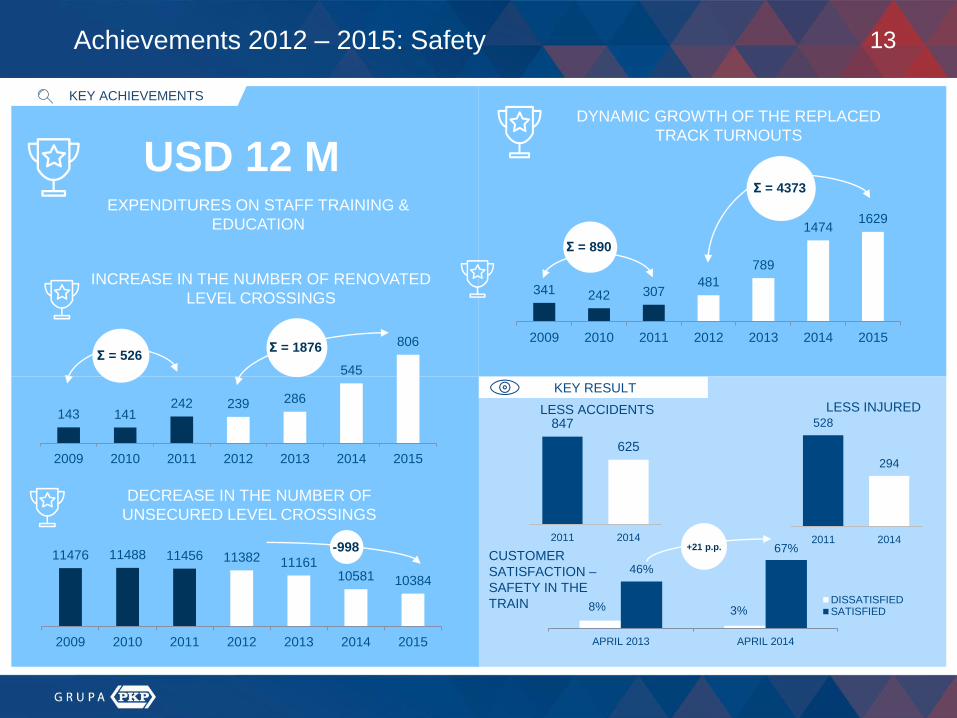
341 242 307481
789
14741629
2009 2010 2011 2012 2013 2014 2015
DYNAMIC GROWTH OF THE REPLACED
TRACK TURNOUTS
Σ = 4373
Σ = 890
USD 12 MEXPENDITURES ON STAFF TRAINING &
EDUCATION
143 141242 239 286
545
806
2009 2010 2011 2012 2013 2014 2015
INCREASE IN THE NUMBER OF RENOVATED
LEVEL CROSSINGS
Σ = 526Σ = 1876
11476 11488 11456 11382 1116110581 10384
2009 2010 2011 2012 2013 2014 2015
DECREASE IN THE NUMBER OF
UNSECURED LEVEL CROSSINGS
-998
Achievements 2012 – 2015: Safety
KEY RESULT
KEY ACHIEVEMENTS
8% 3%
46%
67%
APRIL 2013 APRIL 2014
DISSATISFIEDSATISFIED
+21 p.p.CUSTOMER
SATISFACTION –
SAFETY IN THE
TRAIN
847
625
2011 2014
528
294
2011 2014
LESS INJUREDLESS ACCIDENTS
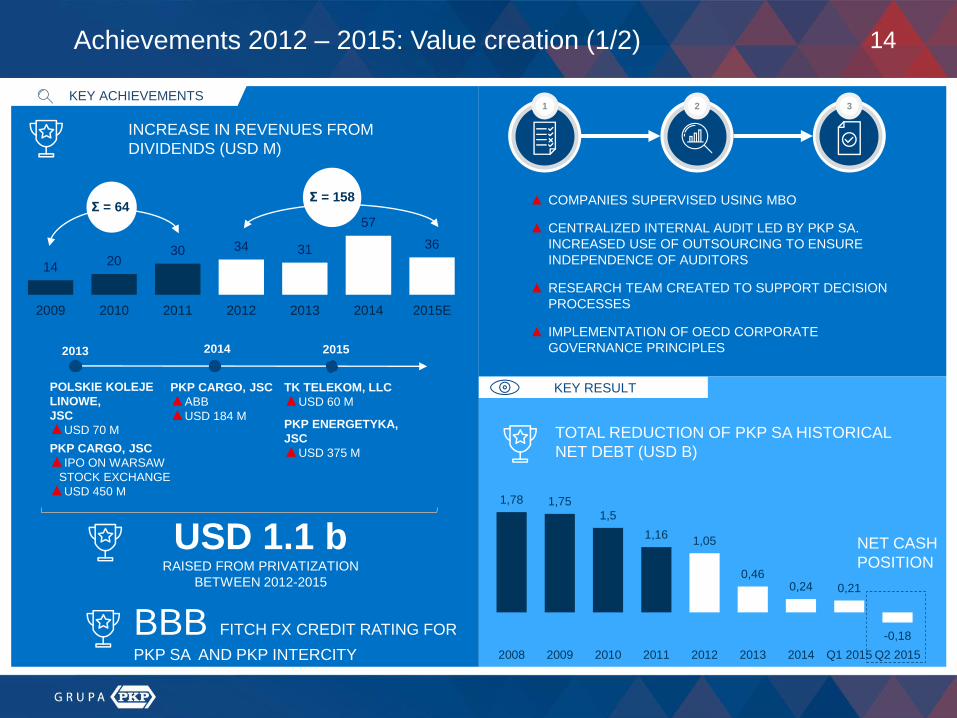
14
1420
30 34 31
57
36
2009 2010 2011 2012 2013 2014 2015E
INCREASE IN REVENUES FROM
DIVIDENDS (USD M)
Σ = 64Σ = 158
Achievements 2012 – 2015: Value creation (1/2)
KEY RESULT
KEY ACHIEVEMENTS
TOTAL REDUCTION OF PKP SA HISTORICAL
NET DEBT (USD B)
1,78 1,75
1,5
1,161,05
0,460,24 0,21
-0,18
2008 2009 2010 2011 2012 2013 2014 Q1 2015 Q2 2015
NET CASH
POSITION
POLSKIE KOLEJE
LINOWE,
JSC
▲USD 70 M
PKP CARGO, JSC
▲IPO ON WARSAW
STOCK EXCHANGE
▲USD 450 M
PKP CARGO, JSC
▲ABB
▲USD 184 M
TK TELEKOM, LLC
▲USD 60 M
PKP ENERGETYKA,
JSC
▲USD 375 M
2013 2014 2015
USD 1.1 bRAISED FROM PRIVATIZATION
BETWEEN 2012-2015
BBB FITCH FX CREDIT RATING FOR
PKP SA AND PKP INTERCITY
▲ COMPANIES SUPERVISED USING MBO
▲ CENTRALIZED INTERNAL AUDIT LED BY PKP SA.
INCREASED USE OF OUTSOURCING TO ENSURE
INDEPENDENCE OF AUDITORS
▲ RESEARCH TEAM CREATED TO SUPPORT DECISION
PROCESSES
▲ IMPLEMENTATION OF OECD CORPORATE
GOVERNANCE PRINCIPLES
1 32
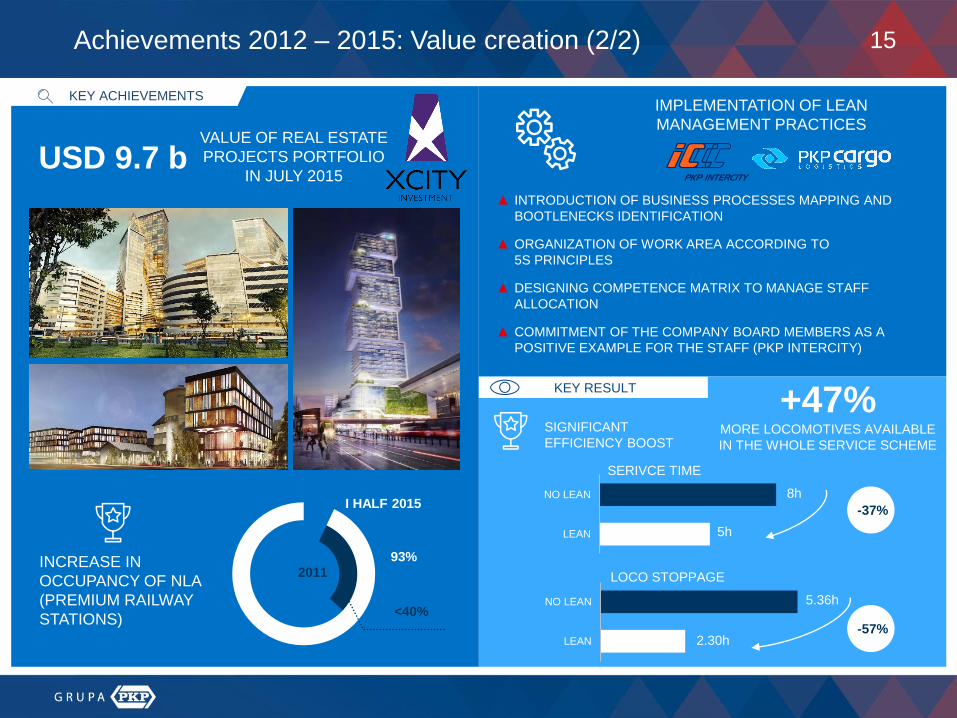
15
USD 9.7 bVALUE OF REAL ESTATE
PROJECTS PORTFOLIO
IN JULY 2015
Achievements 2012 – 2015: Value creation (2/2)
KEY RESULT
KEY ACHIEVEMENTS
<40%
93%
I HALF 2015
2011INCREASE IN
OCCUPANCY OF NLA
(PREMIUM RAILWAY
STATIONS)
IMPLEMENTATION OF LEAN
MANAGEMENT PRACTICES
▲ INTRODUCTION OF BUSINESS PROCESSES MAPPING AND
BOOTLENECKS IDENTIFICATION
▲ ORGANIZATION OF WORK AREA ACCORDING TO
5S PRINCIPLES
▲ DESIGNING COMPETENCE MATRIX TO MANAGE STAFF
ALLOCATION
▲ COMMITMENT OF THE COMPANY BOARD MEMBERS AS A
POSITIVE EXAMPLE FOR THE STAFF (PKP INTERCITY)
SIGNIFICANT
EFFICIENCY BOOST
NO LEAN
LEAN
NO LEAN
LEAN
8h
5h
2.30h
5.36h
-37%
-57%
SERIVCE TIME
LOCO STOPPAGE
+47% MORE LOCOMOTIVES AVAILABLE
IN THE WHOLE SERVICE SCHEME
16Contents
Condition of PKP Group in 2012
PKP Group restructuring after 2012
Key success factors
PKP Group introduction
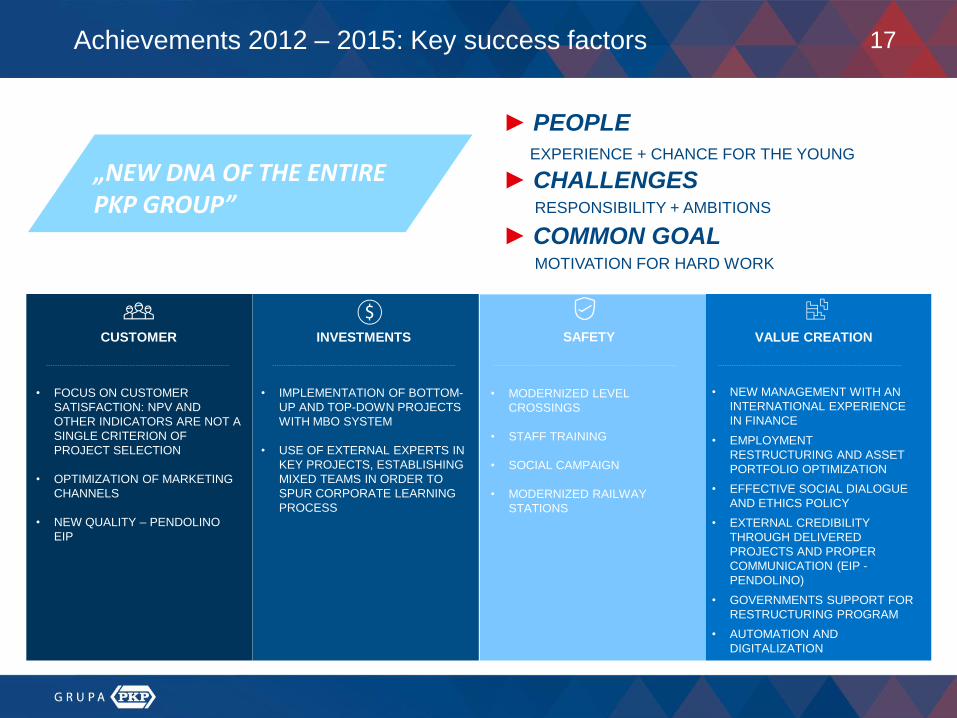
17Achievements 2012 – 2015: Key success factors
CUSTOMER INVESTMENTS SAFETY VALUE CREATION
• NEW MANAGEMENT WITH AN
INTERNATIONAL EXPERIENCE
IN FINANCE
• EMPLOYMENT
RESTRUCTURING AND ASSET
PORTFOLIO OPTIMIZATION
• EFFECTIVE SOCIAL DIALOGUE
AND ETHICS POLICY
• EXTERNAL CREDIBILITY
THROUGH DELIVERED
PROJECTS AND PROPER
COMMUNICATION (EIP -
PENDOLINO)
• GOVERNMENTS SUPPORT FOR
RESTRUCTURING PROGRAM
• AUTOMATION AND
DIGITALIZATION
• FOCUS ON CUSTOMER
SATISFACTION: NPV AND
OTHER INDICATORS ARE NOT A
SINGLE CRITERION OF
PROJECT SELECTION
• OPTIMIZATION OF MARKETING
CHANNELS
• NEW QUALITY – PENDOLINO
EIP
• IMPLEMENTATION OF BOTTOM-
UP AND TOP-DOWN PROJECTS
WITH MBO SYSTEM
• USE OF EXTERNAL EXPERTS IN
KEY PROJECTS, ESTABLISHING
MIXED TEAMS IN ORDER TO
SPUR CORPORATE LEARNING
PROCESS
• MODERNIZED LEVEL
CROSSINGS
• STAFF TRAINING
• SOCIAL CAMPAIGN
• MODERNIZED RAILWAY
STATIONS
KEY TO SUCCESS
NEW DNA OF THE ENTIRE PKP GROUP
„NEW DNA OF THE ENTIREPKP GROUP”
► PEOPLE
EXPERIENCE + CHANCE FOR THE YOUNG
► CHALLENGESRESPONSIBILITY + AMBITIONS
► COMMON GOALMOTIVATION FOR HARD WORK