Embed Size (px)
Citation preview
Energy Economics 45 (2014) 229–233
Contents lists available at ScienceDirect
Energy Economics
j ourna l homepage: www.e lsev ie r .com/ locate /eneco
Price discovery in energy markets
Keshab Shrestha 1
Monash University Malaysia, Jalan Lagoon Selatan, 47500 Bandar Sunway, Selangor Darul Ehsan, Malaysia
E-mail address: [email protected] Monash University Malaysia.
http://dx.doi.org/10.1016/j.eneco.2014.06.0070140-9883/© 2014 Elsevier B.V. All rights reserved.
a b s t r a c t
a r t i c l e i n f oArticle history:Received 30 July 2013Received in revised form 26 May 2014Accepted 6 June 2014Available online 22 July 2014
JEL classification:C5G14
Keywords:Unit rootCointegrationPrice discoveryEnergy futures
In this study, we empirically analyze the price discovery process in the futures and spot markets for crude oil,heating oil and natural gas using daily closing prices. We use two different information share measures thatare based on the methods proposed by Gonzalo and Granger (1995) and Lien and Shrestha (2014). Bothmeasures indicate that almost all the price discovery takes place in the futures markets for the heating oil andnatural gas. However, for the crude oil, the price discovery takes place both in the futures and spot markets. Asa whole, our study indicates that futures markets play an important role in the price discovery process.
© 2014 Elsevier B.V. All rights reserved.
1. Introduction
It is well recognized that futures markets perform two central roles.Firstly, they provide instruments which can be used to hedge price risk.Secondly, they are supposed to be the markets where price discoverytakes place. Nainar (1993) analyzes heating oil, heavy oil and regulargasoline spot prices and finds evidence that the spot market informa-tion increases with the futures trading of various petroleum derivatives.This study provides evidence of the price discovery role played by thefutures markets. Price discovery in energy markets is a significant areaof research in thefield of Energy Economics. This is evident fromnumer-ous published studies (e.g., Bopp and Sitzer, 1987; Bopp and Lady, 1991;Quan, 1992; Schwarz and Szakmary, 1994; Serletis, 1994; Silvapulle andMoosa, 1999; Lin and Tamvakis, 2001; Bekiros and Diks, 2008; Serletisand Rangel-Ruiz, 2004; Huang et al., 2009; Kaufmann and Ullman,2009; Lee and Zeng, 2011 and Silvério and Szklo, 2012). The reasonfor this is because prices, in a free market economy, play an importantrole in guiding the allocation of resources to their optimal levels.
As Silvapulle and Moosa (1999) point out, there are theoreticalreasons for the price discovery to take place in the futuresmarket. For ex-ample, the futures price responds to new information faster than the spotprice due to lower transaction costs and ease of short selling associatedwith the futures contracts. Therefore, we expect individuals with privateor superior information to trade in the futures market to benefit fromsuch information. Also, speculators prefer to hold futures contracts
because they are not interested in the physical commodities per se andfind it easy to offset futures positions. Finally, hedgers with storage con-straints will also buy futures contracts.
Garbade and Silber (1983) develop a model to measure the pricediscovery and introduce the concept of dominant and satellite marketswhere the dominant market is the place where the price discoveryprimarily takes place. Using a vector autoregressive (VAR) model, theyalso suggest a method of measuring the price discovery. Garbade andSilber (1983) empirically analyze the price discovery for wheat, corn,oats, orange juice, copper, gold and silver. They find empirical evidencethat the price discovery mainly takes place in the futures markets.
Bopp and Sitzer (1987) use cost pass through regression, polynomialdistributed lag model and some forecasting models to analyze monthlydata on heating oil and find that 1-month futures price contains signif-icant information about the cash price. Similarly, Bopp and Lady (1991)find that, when deseasonalized data are employed, the predictive signif-icances of both the spot and futures price series turn out to be about bethe same. However, when the actual prices are employed, futures pricedoes correctly anticipate the observed seasonal pattern.
Since the spot and futures prices are normally found to follow unit-root processes with the two series being cointegrated, some studiesincorporate the existence of cointegration in the analysis of pricediscovery. For example, Quan (1992) uses monthly data on crude oiland tests for the cointegration and price discovery. Quan (1992) findsevidence that the spot crude oil market always leads the futures marketand that the crude oil futures market does not play an important role inthe price discovery. Schwarz and Szakmary (1994) suspect that Quan's(1992) results are influenced by themonthly data used in the study due
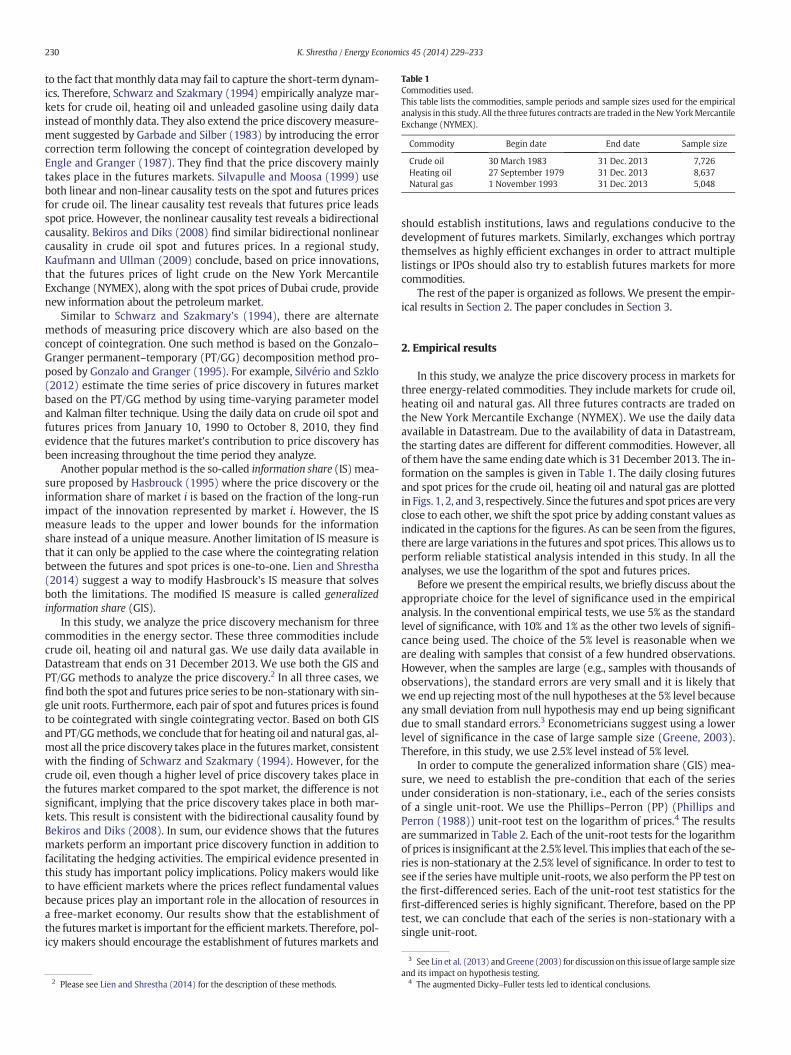
Table 1Commodities used.This table lists the commodities, sample periods and sample sizes used for the empiricalanalysis in this study. All the three futures contracts are traded in theNewYorkMercantileExchange (NYMEX).
Commodity Begin date End date Sample size
Crude oil 30 March 1983 31 Dec. 2013 7,726Heating oil 27 September 1979 31 Dec. 2013 8,637Natural gas 1 November 1993 31 Dec. 2013 5,048
230 K. Shrestha / Energy Economics 45 (2014) 229–233
to the fact that monthly datamay fail to capture the short-term dynam-ics. Therefore, Schwarz and Szakmary (1994) empirically analyze mar-kets for crude oil, heating oil and unleaded gasoline using daily datainstead of monthly data. They also extend the price discovery measure-ment suggested by Garbade and Silber (1983) by introducing the errorcorrection term following the concept of cointegration developed byEngle and Granger (1987). They find that the price discovery mainlytakes place in the futures markets. Silvapulle and Moosa (1999) useboth linear and non-linear causality tests on the spot and futures pricesfor crude oil. The linear causality test reveals that futures price leadsspot price. However, the nonlinear causality test reveals a bidirectionalcausality. Bekiros and Diks (2008) find similar bidirectional nonlinearcausality in crude oil spot and futures prices. In a regional study,Kaufmann and Ullman (2009) conclude, based on price innovations,that the futures prices of light crude on the New York MercantileExchange (NYMEX), along with the spot prices of Dubai crude, providenew information about the petroleum market.
Similar to Schwarz and Szakmary's (1994), there are alternatemethods of measuring price discovery which are also based on theconcept of cointegration. One such method is based on the Gonzalo–Granger permanent–temporary (PT/GG) decomposition method pro-posed by Gonzalo and Granger (1995). For example, Silvério and Szklo(2012) estimate the time series of price discovery in futures marketbased on the PT/GG method by using time-varying parameter modeland Kalman filter technique. Using the daily data on crude oil spot andfutures prices from January 10, 1990 to October 8, 2010, they findevidence that the futures market's contribution to price discovery hasbeen increasing throughout the time period they analyze.
Another popularmethod is the so-called information share (IS) mea-sure proposed by Hasbrouck (1995) where the price discovery or theinformation share of market i is based on the fraction of the long-runimpact of the innovation represented by market i. However, the ISmeasure leads to the upper and lower bounds for the informationshare instead of a unique measure. Another limitation of IS measure isthat it can only be applied to the case where the cointegrating relationbetween the futures and spot prices is one-to-one. Lien and Shrestha(2014) suggest a way to modify Hasbrouck's IS measure that solvesboth the limitations. The modified IS measure is called generalizedinformation share (GIS).
In this study, we analyze the price discovery mechanism for threecommodities in the energy sector. These three commodities includecrude oil, heating oil and natural gas. We use daily data available inDatastream that ends on 31 December 2013. We use both the GIS andPT/GG methods to analyze the price discovery.2 In all three cases, wefind both the spot and futures price series to be non-stationarywith sin-gle unit roots. Furthermore, each pair of spot and futures prices is foundto be cointegrated with single cointegrating vector. Based on both GISand PT/GGmethods,we conclude that for heating oil and natural gas, al-most all the price discovery takes place in the futuresmarket, consistentwith the finding of Schwarz and Szakmary (1994). However, for thecrude oil, even though a higher level of price discovery takes place inthe futures market compared to the spot market, the difference is notsignificant, implying that the price discovery takes place in both mar-kets. This result is consistent with the bidirectional causality found byBekiros and Diks (2008). In sum, our evidence shows that the futuresmarkets perform an important price discovery function in addition tofacilitating the hedging activities. The empirical evidence presented inthis study has important policy implications. Policy makers would liketo have efficient markets where the prices reflect fundamental valuesbecause prices play an important role in the allocation of resources ina free-market economy. Our results show that the establishment ofthe futuresmarket is important for the efficientmarkets. Therefore, pol-icy makers should encourage the establishment of futures markets and
2 Please see Lien and Shrestha (2014) for the description of these methods.
should establish institutions, laws and regulations conducive to thedevelopment of futures markets. Similarly, exchanges which portraythemselves as highly efficient exchanges in order to attract multiplelistings or IPOs should also try to establish futures markets for morecommodities.
The rest of the paper is organized as follows. We present the empir-ical results in Section 2. The paper concludes in Section 3.
2. Empirical results
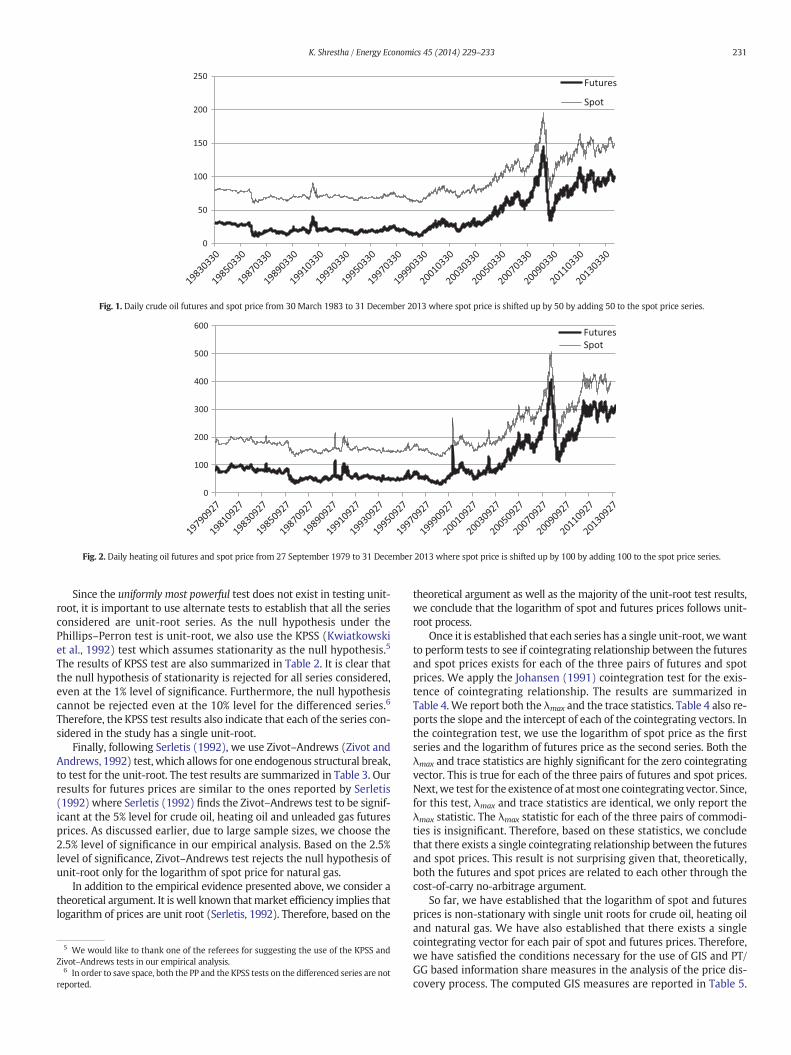
In this study, we analyze the price discovery process in markets forthree energy-related commodities. They include markets for crude oil,heating oil and natural gas. All three futures contracts are traded onthe New York Mercantile Exchange (NYMEX). We use the daily dataavailable in Datastream. Due to the availability of data in Datastream,the starting dates are different for different commodities. However, allof them have the same ending date which is 31 December 2013. The in-formation on the samples is given in Table 1. The daily closing futuresand spot prices for the crude oil, heating oil and natural gas are plottedin Figs. 1, 2, and 3, respectively. Since the futures and spot prices are veryclose to each other, we shift the spot price by adding constant values asindicated in the captions for the figures. As can be seen from the figures,there are large variations in the futures and spot prices. This allows us toperform reliable statistical analysis intended in this study. In all theanalyses, we use the logarithm of the spot and futures prices.
Before we present the empirical results, we briefly discuss about theappropriate choice for the level of significance used in the empiricalanalysis. In the conventional empirical tests, we use 5% as the standardlevel of significance, with 10% and 1% as the other two levels of signifi-cance being used. The choice of the 5% level is reasonable when weare dealing with samples that consist of a few hundred observations.However, when the samples are large (e.g., samples with thousands ofobservations), the standard errors are very small and it is likely thatwe end up rejecting most of the null hypotheses at the 5% level becauseany small deviation from null hypothesis may end up being significantdue to small standard errors.3 Econometricians suggest using a lowerlevel of significance in the case of large sample size (Greene, 2003).Therefore, in this study, we use 2.5% level instead of 5% level.
In order to compute the generalized information share (GIS) mea-sure, we need to establish the pre-condition that each of the seriesunder consideration is non-stationary, i.e., each of the series consistsof a single unit-root. We use the Phillips–Perron (PP) (Phillips andPerron (1988)) unit-root test on the logarithm of prices.4 The resultsare summarized in Table 2. Each of the unit-root tests for the logarithmof prices is insignificant at the 2.5% level. This implies that each of the se-ries is non-stationary at the 2.5% level of significance. In order to test tosee if the series havemultiple unit-roots, we also perform the PP test onthe first-differenced series. Each of the unit-root test statistics for thefirst-differenced series is highly significant. Therefore, based on the PPtest, we can conclude that each of the series is non-stationary with asingle unit-root.
3 See Lin et al. (2013) andGreene (2003) for discussion on this issue of large sample sizeand its impact on hypothesis testing.
4 The augmented Dicky–Fuller tests led to identical conclusions.
0
50
100
150
200
250Futures
Spot
Fig. 1. Daily crude oil futures and spot price from 30 March 1983 to 31 December 2013 where spot price is shifted up by 50 by adding 50 to the spot price series.
0
100
200
300
400
500
600FuturesSpot
Fig. 2. Daily heating oil futures and spot price from 27 September 1979 to 31 December 2013 where spot price is shifted up by 100 by adding 100 to the spot price series.
231K. Shrestha / Energy Economics 45 (2014) 229–233
Since the uniformly most powerful test does not exist in testing unit-root, it is important to use alternate tests to establish that all the seriesconsidered are unit-root series. As the null hypothesis under thePhillips–Perron test is unit-root, we also use the KPSS (Kwiatkowskiet al., 1992) test which assumes stationarity as the null hypothesis.5
The results of KPSS test are also summarized in Table 2. It is clear thatthe null hypothesis of stationarity is rejected for all series considered,even at the 1% level of significance. Furthermore, the null hypothesiscannot be rejected even at the 10% level for the differenced series.6
Therefore, the KPSS test results also indicate that each of the series con-sidered in the study has a single unit-root.
Finally, following Serletis (1992), we use Zivot–Andrews (Zivot andAndrews, 1992) test, which allows for one endogenous structural break,to test for the unit-root. The test results are summarized in Table 3. Ourresults for futures prices are similar to the ones reported by Serletis(1992) where Serletis (1992) finds the Zivot–Andrews test to be signif-icant at the 5% level for crude oil, heating oil and unleaded gas futuresprices. As discussed earlier, due to large sample sizes, we choose the2.5% level of significance in our empirical analysis. Based on the 2.5%level of significance, Zivot–Andrews test rejects the null hypothesis ofunit-root only for the logarithm of spot price for natural gas.
In addition to the empirical evidence presented above, we consider atheoretical argument. It is well known thatmarket efficiency implies thatlogarithm of prices are unit root (Serletis, 1992). Therefore, based on the
5 We would like to thank one of the referees for suggesting the use of the KPSS andZivot–Andrews tests in our empirical analysis.
6 In order to save space, both the PP and the KPSS tests on the differenced series are notreported.
theoretical argument as well as the majority of the unit-root test results,we conclude that the logarithm of spot and futures prices follows unit-root process.
Once it is established that each series has a single unit-root, wewantto perform tests to see if cointegrating relationship between the futuresand spot prices exists for each of the three pairs of futures and spotprices. We apply the Johansen (1991) cointegration test for the exis-tence of cointegrating relationship. The results are summarized inTable 4. We report both the λmax and the trace statistics. Table 4 also re-ports the slope and the intercept of each of the cointegrating vectors. Inthe cointegration test, we use the logarithm of spot price as the firstseries and the logarithm of futures price as the second series. Both theλmax and trace statistics are highly significant for the zero cointegratingvector. This is true for each of the three pairs of futures and spot prices.Next,we test for the existence of atmost one cointegrating vector. Since,for this test, λmax and trace statistics are identical, we only report theλmax statistic. The λmax statistic for each of the three pairs of commodi-ties is insignificant. Therefore, based on these statistics, we concludethat there exists a single cointegrating relationship between the futuresand spot prices. This result is not surprising given that, theoretically,both the futures and spot prices are related to each other through thecost-of-carry no-arbitrage argument.
So far, we have established that the logarithm of spot and futuresprices is non-stationary with single unit roots for crude oil, heating oiland natural gas. We have also established that there exists a singlecointegrating vector for each pair of spot and futures prices. Therefore,we have satisfied the conditions necessary for the use of GIS and PT/GG based information share measures in the analysis of the price dis-covery process. The computed GIS measures are reported in Table 5.
0
5
10
15
20
25
30 FuturesSpot
Fig. 3. Daily natural gas futures and spot price from 1 November 1993 to 31 December 2013 where spot price is shifted up by 5 by adding 5 to the spot price series.
Table 2Unit-root test results.This table summarizes the results of the Phillips–Perron (PP) and Kwiatkowski–Phillips–Schmidt–Shin (KPSS) unit-root tests on logarithm of spot and futures prices. The criticalvalues for PP test are −2.557, −2.861, −3.122, and −3.430 at 10%, 5%, 2.5%, and 1%significance levels, respectively. The critical values are generated using techniquesdescribed in MacKinnon (1996). Similarly, the critical values for the KPSS test are 0.347,0.463, 0.574, and 0.739 at 10%, 5%, 2.5%, and 1% significance levels, respectively.
Series Log of spot price Log of futures price
Panel A: PP testCrude oil −1.088 −1.011Heating oil −1.230 −0.881Natural gas −2.885* −2.331
Panel B: KPSS testCrude oil 8.046*** 8.058***Heating oil 6.958*** 7.01***Natural gas 3.912*** 4.088***
***, **, and * indicate the test statistic to be significant at 1%, 2.5%, and 5% significance levels,respectively.
Table 3Zivot–Andrews unit-root test results.This table summarizes the results of the Zivot–Andrews unit-root tests on logarithm ofspot and futures prices which allow breaks in both the intercept and linear trend. Thecritical values are −4.82, −5.08, −5.30, and −5.57 at 10%, 5%, 2.5%, and 1% significancelevels, respectively.
Series Log of spot price Log of futures price
Level Break Level Break
232 K. Shrestha / Energy Economics 45 (2014) 229–233
Based on GIS, it is clear that for heating oil and natural gas, almost all ofthe price discovery takes place in the futures market, where the GISmeasures are more than 95%. As for the crude oil, the GIS measuresare 45.44% and 54.56% for the spot and the futures prices, respectively.This implies that more price discovery takes place in the futures marketcompared to the spot market. However, a significant level of price dis-covery also takes place in the spot market for the crude oil.
Next, we compute the PT/GG based information share measure. Letμ1 and μ2 denote the PT/GG based information shares for the spotprice (i.e., the first series) and futures price (i.e., the second series),respectively. Then, μ1 and μ2 are given by7
μ1 ¼ α2
α2−α1& μ2 ¼ −α1
α2−α1
where α1 and α2 are the adjustment coefficients for the spot and futuresprices, respectively.We expect the estimate of α1 to be negative and theestimate of α2 to be positive so that any disequilibrium in the spot andfutures prices on any given day would partially be corrected on the fol-lowing day through the appropriate change in the spot and the futuresprices. As reported in Table 4, all three estimates of α1 are negative asexpected. However, the estimates of α2 for heating oil and natural gasare negativewith only the estimate of α2 for crude oil having the correct
7 See Lien and Shrestha (2014) for the description of the PT/GGbased information sharemeasure.
positive sign. Therefore, in the computation of the PT/GG based infor-mation share, we replace the negative estimates of α2 for heating oiland natural gas with 0. The PT/GG based information share measuresare also reported in Table 5. Based on these measures, we concludethat for the heating oil and the natural gas, the price discovery takesplace only in the futuresmarket. As for the crude oil, the price discoverymeasures for the spot and futures markets are 39.56 and 60.44, respec-tively. This indicates thatmore price discovery takes place in the futuresmarket compared to spot market so far as the crude oil is concerned. Inorder to test whether the difference is statistically significant, we per-form a likelihood ratio (LR) test based on the following hypotheses:
H0 : α2 ¼ −α1; H1 : α2≠−α1
where the acceptance of null hypothesis means that the difference inPT/GG based information shares is not significant, i.e., μ1 = μ2. The LRtest static is equal to 0.8510 with a p-value of 35.65%. Therefore, weconclude that the difference in the PT/GG based information sharemeasures for the spot and futures markets is not statistically significantfor crude oil. Therefore, we conclude that the price discovery takes placein both the spot and futures markets in the case of crude oil. There arefew possible explanations for this result. Firstly, spot markets forheating oil and natural gas are more or less localized markets andfutures markets play an important role in price discovery in such mar-kets. However, the spot market for crude oil is an international marketwith many participants including big and well informed oil companiesas well as oil refineries. These players can eliminate arbitrage opportu-nities in spot markets as well. Therefore, we expect the price discoveryto take place in the spot market as well as the futures market for crudeoil. Secondly, our results are based on daily data and it is possible that, atleast for the crude oil, one day is long enough for the spot price to reflectfundamental information.
Crude oil −5.265* 17 Feb. 1999 −4.994 17 Feb. 1999Heating oil −5.11* 22 Feb. 1999 −4.777 2 Jun. 1999Natural gas −5.316** 8 Jul. 2008 −5.055 7 Jul. 2008
***, **, and * indicate the test statistic to be significant at 1%, 2.5%, and 5% significance levels,respectively.
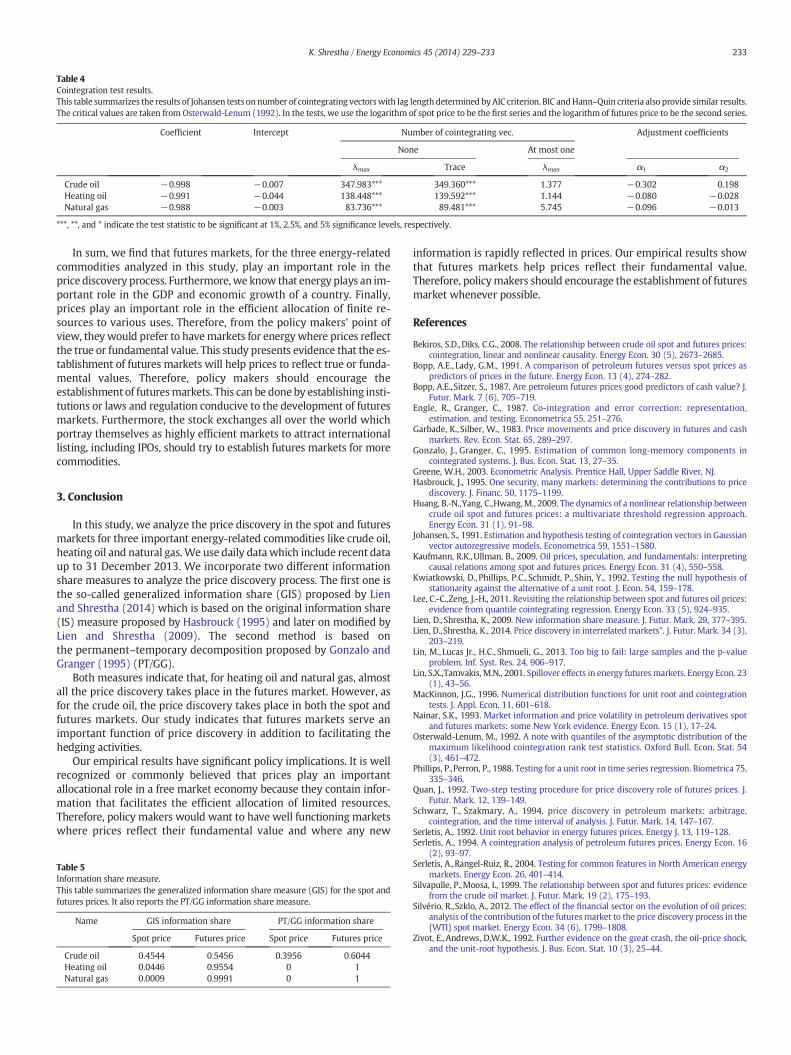
Table 4Cointegration test results.This table summarizes the results of Johansen tests on number of cointegrating vectorswith lag length determined byAIC criterion. BIC andHann–Quin criteria also provide similar results.The critical values are taken from Osterwald-Lenum (1992). In the tests, we use the logarithm of spot price to be the first series and the logarithm of futures price to be the second series.
Coefficient Intercept Number of cointegrating vec. Adjustment coefficients
None At most one
λmax Trace λmax α1 α2
Crude oil −0.998 −0.007 347.983*** 349.360*** 1.377 −0.302 0.198Heating oil −0.991 −0.044 138.448*** 139.592*** 1.144 −0.080 −0.028Natural gas −0.988 −0.003 83.736*** 89.481*** 5.745 −0.096 −0.013
***, **, and * indicate the test statistic to be significant at 1%, 2.5%, and 5% significance levels, respectively.
233K. Shrestha / Energy Economics 45 (2014) 229–233
In sum, we find that futures markets, for the three energy-relatedcommodities analyzed in this study, play an important role in theprice discovery process. Furthermore,we know that energy plays an im-portant role in the GDP and economic growth of a country. Finally,prices play an important role in the efficient allocation of finite re-sources to various uses. Therefore, from the policy makers' point ofview, theywould prefer to havemarkets for energywhere prices reflectthe true or fundamental value. This study presents evidence that the es-tablishment of futures markets will help prices to reflect true or funda-mental values. Therefore, policy makers should encourage theestablishment of futuresmarkets. This can be done by establishing insti-tutions or laws and regulation conducive to the development of futuresmarkets. Furthermore, the stock exchanges all over the world whichportray themselves as highly efficient markets to attract internationallisting, including IPOs, should try to establish futures markets for morecommodities.
3. Conclusion
In this study, we analyze the price discovery in the spot and futuresmarkets for three important energy-related commodities like crude oil,heating oil and natural gas.We use daily data which include recent dataup to 31 December 2013. We incorporate two different informationshare measures to analyze the price discovery process. The first one isthe so-called generalized information share (GIS) proposed by Lienand Shrestha (2014) which is based on the original information share(IS) measure proposed by Hasbrouck (1995) and later on modified byLien and Shrestha (2009). The second method is based onthe permanent–temporary decomposition proposed by Gonzalo andGranger (1995) (PT/GG).
Both measures indicate that, for heating oil and natural gas, almostall the price discovery takes place in the futures market. However, asfor the crude oil, the price discovery takes place in both the spot andfutures markets. Our study indicates that futures markets serve animportant function of price discovery in addition to facilitating thehedging activities.
Our empirical results have significant policy implications. It is wellrecognized or commonly believed that prices play an importantallocational role in a free market economy because they contain infor-mation that facilitates the efficient allocation of limited resources.Therefore, policy makers would want to have well functioning marketswhere prices reflect their fundamental value and where any new
Table 5Information share measure.This table summarizes the generalized information share measure (GIS) for the spot andfutures prices. It also reports the PT/GG information share measure.
Name GIS information share PT/GG information share
Spot price Futures price Spot price Futures price
Crude oil 0.4544 0.5456 0.3956 0.6044Heating oil 0.0446 0.9554 0 1Natural gas 0.0009 0.9991 0 1
information is rapidly reflected in prices. Our empirical results showthat futures markets help prices reflect their fundamental value.Therefore, policymakers should encourage the establishment of futuresmarket whenever possible.
References
Bekiros, S.D.,Diks, C.G., 2008. The relationship between crude oil spot and futures prices:cointegration, linear and nonlinear causality. Energy Econ. 30 (5), 2673–2685.
Bopp, A.E., Lady, G.M., 1991. A comparison of petroleum futures versus spot prices aspredictors of prices in the future. Energy Econ. 13 (4), 274–282.
Bopp, A.E., Sitzer, S., 1987. Are petroleum futures prices good predictors of cash value? J.Futur. Mark. 7 (6), 705–719.
Engle, R., Granger, C., 1987. Co-integration and error correction: representation,estimation, and testing. Econometrica 55, 251–276.
Garbade, K., Silber, W., 1983. Price movements and price discovery in futures and cashmarkets. Rev. Econ. Stat. 65, 289–297.
Gonzalo, J., Granger, C., 1995. Estimation of common long-memory components incointegrated systems. J. Bus. Econ. Stat. 13, 27–35.
Greene, W.H., 2003. Econometric Analysis. Prentice Hall, Upper Saddle River, NJ.Hasbrouck, J., 1995. One security, many markets: determining the contributions to price
discovery. J. Financ. 50, 1175–1199.Huang, B.-N.,Yang, C.,Hwang, M., 2009. The dynamics of a nonlinear relationship between
crude oil spot and futures prices: a multivariate threshold regression approach.Energy Econ. 31 (1), 91–98.
Johansen, S., 1991. Estimation and hypothesis testing of cointegration vectors in Gaussianvector autoregressive models. Econometrica 59, 1551–1580.
Kaufmann, R.K.,Ullman, B., 2009. Oil prices, speculation, and fundamentals: interpretingcausal relations among spot and futures prices. Energy Econ. 31 (4), 550–558.
Kwiatkowski, D., Phillips, P.C., Schmidt, P., Shin, Y., 1992. Testing the null hypothesis ofstationarity against the alternative of a unit root. J. Econ. 54, 159–178.
Lee, C.-C.,Zeng, J.-H., 2011. Revisiting the relationship between spot and futures oil prices:evidence from quantile cointegrating regression. Energy Econ. 33 (5), 924–935.
Lien, D., Shrestha, K., 2009. New information share measure. J. Futur. Mark. 29, 377–395.Lien, D.,Shrestha, K., 2014. Price discovery in interrelated markets”. J. Futur. Mark. 34 (3),
203–219.Lin, M., Lucas Jr., H.C., Shmueli, G., 2013. Too big to fail: large samples and the p-value
problem. Inf. Syst. Res. 24, 906–917.Lin, S.X.,Tamvakis, M.N., 2001. Spillover effects in energy futures markets. Energy Econ. 23
(1), 43–56.MacKinnon, J.G., 1996. Numerical distribution functions for unit root and cointegration
tests. J. Appl. Econ. 11, 601–618.Nainar, S.K., 1993. Market information and price volatility in petroleum derivatives spot
and futures markets: some New York evidence. Energy Econ. 15 (1), 17–24.Osterwald-Lenum, M., 1992. A note with quantiles of the asymptotic distribution of the
maximum likelihood cointegration rank test statistics. Oxford Bull. Econ. Stat. 54(3), 461–472.
Phillips, P.,Perron, P., 1988. Testing for a unit root in time series regression. Biometrica 75,335–346.
Quan, J., 1992. Two-step testing procedure for price discovery role of futures prices. J.Futur. Mark. 12, 139–149.
Schwarz, T., Szakmary, A., 1994. price discovery in petroleum markets: arbitrage,cointegration, and the time interval of analysis. J. Futur. Mark. 14, 147–167.
Serletis, A., 1992. Unit root behavior in energy futures prices. Energy J. 13, 119–128.Serletis, A., 1994. A cointegration analysis of petroleum futures prices. Energy Econ. 16
(2), 93–97.Serletis, A.,Rangel-Ruiz, R., 2004. Testing for common features in North American energy
markets. Energy Econ. 26, 401–414.Silvapulle, P.,Moosa, I., 1999. The relationship between spot and futures prices: evidence
from the crude oil market. J. Futur. Mark. 19 (2), 175–193.Silvério, R.,Szklo, A., 2012. The effect of the financial sector on the evolution of oil prices:
analysis of the contribution of the futuresmarket to the price discovery process in the{WTI} spot market. Energy Econ. 34 (6), 1799–1808.
Zivot, E.,Andrews, D.W.K., 1992. Further evidence on the great crash, the oil-price shock,and the unit-root hypothesis. J. Bus. Econ. Stat. 10 (3), 25–44.