Embed Size (px)
Citation preview

Pricing Weather Derivative: an Equilibrium Approach¤
Melanie Caoy
Research Department Department of Economics
Chicago Mercantile Exchange Queen's University
Chicago, Illinois Kingston, Ontario,
U.S.A., 60606 Canada, K7L 3N6
Jason WeiFaculty of Management
University of Toronto
105 St. George Street
Toronto, Ontario, Canada
M5S 3E6
e-mail: [email protected]
First Draft: October, 1998 This Draft: October, 1999
Abstract
This paper proposes and implements an equilibrium framework for valuing weather deriva-tives. We generalize the Lucas model of 1978 to include the daily temperature as a fundamentalvariable in the economy. Temperature behavior in the past twenty years is closely studied for¯ve major cities in the U.S., and a model is proposed for the daily temperature variable whichincorporates all the key properties of temperature behavior including seasonal cycles and un-even variations throughout the year. The model system is estimated using the 20-year dataand numerical analyses are performed for forward and option contracts on HDD's and CDD's.The key advantages of our model include the use of weather forecasts as inputs and the abilityto handle contracts of any maturity, for any season. Numerical analyses show that within ourframework, the market price of risk associated with the temperature variable does not appearto impact the weather derivatives' value in a signi¯cant way, which indirectly justi¯es the useof riskfree rate to derive weather derivatives' values as many practitioners do in the industry.Finally, we show that the so-called historical simulation method can lead to signi¯cant pricingerrors due to its erroneous implicit assumptions.
¤ We are grateful to the Social Sciences and Humanities Research Council of Canada for ¯nancial support. We,respectively, also acknowledge Queen's Edith Whyte research grant and the University of Toronto Connaught Fund.The analysis and conclusions of this paper are those of the authors and do not indicate concurrence by the ChicagoMercantile Exchange. All remaining errors are ours alone.
y Corresponding author.

Pricing Weather Derivative: An Equilibrium Approach
Abstract
This paper proposes and implements an equilibrium framework for valuing weather derivatives.
We generalize the Lucas model of 1978 to include the daily temperature as a fundamental variable in
the economy. Temperature behavior in the past twenty years is closely studied for ¯ve major cities in
the U.S., and a model is proposed for the daily temperature variable which incorporates all the key
properties of temperature behavior including seasonal cycles and uneven variations throughout the
year. The model system is estimated using the 20-year data and numerical analyses are performed
for forward and option contracts on HDD's and CDD's. The key advantages of our model include
the use of weather forecasts as inputs and the ability to handle contracts of any maturity, for any
season. Numerical analyses show that within our framework, the market price of risk associated with
the temperature variable does not appear to impact the weather derivatives' value in a signi¯cant
way, which indirectly justi¯es the use of riskfree rate to derive weather derivatives' values as many
practitioners do in the industry. Finally, we show that the so-called historical simulation method
can lead to signi¯cant pricing errors due to its erroneous implicit assumptions.
0
1. Introduction
It is estimated that about $ 1 trillion of the $ 7 trillion U.S. economy is weather-sensitive (Challis
1999 and Hanley 1999). Weather conditions directly a®ect the outputs of agricultural products
and the demand for energy products, and indirectly a®ect retail businesses. For example, the
inventory of winter coats at a department store depends on weather forecast for the coming winter
and eventual sales depend on the actual weather condition (Agins and Kranhold, 1999). Likewise,
earnings in the power industry depend on the retail prices and the sales quantities of electricity.
Although weather conditions may not play a key role in determining the electricity retail price,
it is certainly one of the most important factors a®ecting the electricity demand. Until 1997,
earnings stabilization for utility ¯rms was primarily achieved through price hedging mechanisms
while volumetric risks were largely left unhedged. The increasing competition caused by ongoing
deregulation has created incentives for utility ¯rms to stabilize revenues. It has become necessary
for companies to hedge against the volumetric risks caused by unexpected weather conditions. Such
needs have created a new family of over-the-counter weather derivatives. Meantime, the Chicago
Mercantile Exchange has introduced futures contracts on the temperature of several U.S. cities.
The underlying variables for weather contracts include temperatures, rainfall, snowfall and
precipitations.1 However, the most commonly used variables are Heating-Degree-Days (HDD) and
Cooling-Degree-Days (CDD) de¯ned on daily average temperatures. The daily average tempera-
ture, in turn, is the arithmetic average of the maximum and minimum temperature recorded on a
1For a complete survery, see Hanley (1999).
1

midnight-to-midnight basis. The precise expressions of HDD and CDD are de¯ned below:
Daily HDD = max(65± degree Fahrenheit - daily average temperature, 0);
Daily CDD = max(daily average temperature - 65± degree Fahrenheit, 0).
To simplify the language in the text, we refer to the daily average temperature as daily temperature.
Intuitively, HDD measures the coldness of the day compared to a benchmark of 65 Fahrenheit for
the winter season while CDD measures the extent to which a summer day is hot. An HDD season
includes winter months from November to March and the CDD season (or summer season) from
May to September. April and October are commonly referred to as the shoulder months.
Because of the high correlation between the electricity consumption and HDD/CDD, most
contracts are written on the accumulation of HDD or CDD over a certain period (e.g., a calendar
month or a season) so that one contract can be used to hedge a particular period. The popular
transactions in the OTC market include HDD / CDD swaps and options for large cities like Atlanta,
Chicago, Dallas, New York and Philadelphia. 2 The swap contracts or forward contracts are similar
to the exchange-traded futures contracts. There are four basic elements in these contracts: (i) the
underlying variable: HDD or CDD; (ii) the accumulation period: a season or a calendar month;
(iii) a speci¯c weather station reporting daily temperatures for a particular city; and (iv) the tick
size: the dollar amount attached to each HDD or CDD. Table 1 presents the typical transactions
of an HDD swap (or forward) on New York and a CDD option on Chicago. In the New York HDD
swap, the tick size is set at $5,000 per HDD. XYZ Co. agrees to pay ABC Co. a ¯xed rate of
1,000 HDD and in return for a °oating rate which is the actual accumulated HDD during January,
1999. The realized HDD for January, 1999 is 956. Then the payo® for XYZ Co. at maturity is
$5000 £ (956 ¡ 1000) = ¡$220; 000: Similarly, the Chicago CDD option has a tick size of $5,000
2See Smithson and Choe (1999) for a brief survey of the market.
2

and a strike level of 190 CDD. The actual accumulated CDD in June, 1999 is 196, which is higher
than the strike level. Thus, xyz Co. would exercise the call option at maturity and receive a payo®
of $5; 000 £ (196 ¡ 190) = $30; 000.
Table 1: Examples of HDD- and CDD-based Swap and Option
HDD Swap (or Forward) CDD Call Option
Location La Guardia Airport, New York O'Hare Airport, ChicagoBuyer YYY Co. (paying ¯xed rate) xyz Co. (paying call premium)Seller AAA Co. (paying °oating rate) abc Co.AccumulationPeriod
January 1 - 31, 1999 June 1 - 30, 1999
Tick Size $5,000 per HDD $5,000 per CDDFixed Rate 1,000 HDDStrike Level 190 CDD
Floating Ratethe actual HDDfor January, 1999
= 956 HDD
Settlement Pricethe actual CDDfor June, 1999
= 196 CDD
Payo®s at Maturityfor the Buyer
(956 ¡ 1000) £ 5000 = ¡$220; 000 (196 ¡ 190) £ 5000 = $30; 000
Despite the rapid growth of weather derivatives in the OTC market, the bid / ask spread is still
very large and there is no e®ective pricing method accepted by all industry participants. In this
paper we propose an equilibrium model to price weather derivatives. Our objectives are three-fold.
First, we will present a realistic model for the dynamics of the daily average temperature, which is
very di®erent from that of a security price. For example, temperatures are seasonal and cyclical,
can be predicted accurately for the very near future, and will vary within a well-de¯ned range in
the long run. The traditional stochastic di®usion process used for modelling security prices will
not be suitable for temperature dynamics. Second, we would like to establish, in a rudimental way,
whether the market price of risk associated with the temperature variable signi¯cantly a®ects the
3

valuation of weather derivatives. Third, we will develop a pricing framework for derivatives based
on the accumulated HDD or CDD. Challenges arise because the underlying is the accumulation of
the daily HDD/CDD which are non-linear in daily temperatures.
The key contributions of this paper lie in the accomplishments of the aforementioned objectives.
First, we propose an auto-regressive, mean-reverting dynamic system for the daily temperature.
This system is capable of capturing the seasonality and the global warming trend and can incorpo-
rate weather forecast information. Second, the market price of risk associated with the temperature
variable is analyzed in an equilibrium framework. Speci¯cally, we extend Lucas' (1978) equilibrium
asset-pricing model where fundamental uncertainties in the economy are generated by aggregate
dividend and a state variable representing the daily temperature. It is shown that the equilibrium
prices of weather derivatives depend on the agent's risk preference and the correlation between
the temperature variable and the aggregate dividend. Lastly, we use Maximum Likelihood method
to estimate the temperature dynamics for Atlanta, Chicago, Dallas, New York and Philadelphia.
Based on the estimated parameters, we simulate forward and option prices for seasonal and monthly
HDD / CDD contracts and examine the importance of the market price of risk thereof.
The paper is organized as follows. Section 2 presents the underlying equilibrium model, dis-
cusses the dynamics of the fundamental variables: the aggregate dividend and daily temperatures.
Section 3 discusses the equilibrium valuation of weather derivatives. Section 4 presents temperature
estimation results for ¯ve cities. Section 5 analyzes the simulated weather derivative prices. Section
6 concludes the paper. Proofs and exhibitions are collected in appendices.
4

2. The Structure of the Economy
In a discrete-setting, consider an extension of the Lucas (1978) pure exchange economy with two
state variables: aggregate dividends (±) and weather conditions (Y ) which generate the fundamental
uncertainties in the economy. Aggregate dividends can be viewed as aggregate outputs or dividend
on the market portfolio. The weather variable can refer to temperatures, rainfall, snowfall or
precipitations. The dynamics governing the aggregate dividend and the temperature variable are
assumed to be exogenous processes on a given probability space (, F , P). There is a representative
investor whose information structure is given by the ¯ltration Ft ´ ¾(±¿ ; Y¿ ; ¿ 2 (0; 1; 2; :::; t)). The
agent has an in¯nite lifetime horizon.
In the ¯nancial market, the representative agent can trade a single risky stock, pure discount
bonds and a ¯nite number of other contingent claims at any time. The risky stock can be viewed as
the market portfolio. Therefore, its dividend stream f±tg is understood as aggregate dividends in
the economy. The total supply is normalized to one share and the contingent claims are written on
the risky stock, the pure discount bond and the weather variable. The net supply of all contingent
claims and the riskless bond is zero.
In the following subsections, we specify the fundamentals in the economy: the agent's preference,
the dynamics of the aggregate dividend and the weather variable.
2.1. Agent's Preference and Aggregate Dividend Behavior
The agent's preference is described by a smooth time-additive expected utility function
V (c) = E0
à 1X
t=0
U(ct; t)
!;
5

where U : R+ £ (0;1) ! R is smooth on (0;1) £ (0;1) and, for each t 2 (0; 1; 2; :::;1),
U(¢; t) : R+ ! R is increasing, strictly concave, and has a continuous derivative Uc(¢; t) on (0;1).
For analytical tractability, the agent's period t utility is assumed to be the Constant-Relative-Risk-
Aversion (CRRA) type of preference:
Assumption 1. The representative agent's period utility is described by
U(ct; t) = e¡½tc°+1t
° + 1;
with the rate of time preference, ½ > 0 and the risk parameter ° 2 [¡1; 0].
For the aggregate dividend process, we appeal to Marsh and Merton (1987), whose estima-
tion results suggest mean-reversion in dividend rate changes. This feature is incorporated in the
following assumption:3
Assumption 2. The aggregate dividend, ±, evolves according to the following Markov process:
ln ±t = ® + ¹ ln ±t¡1 + ¾± ²t; 8 ¹ 6 1
where ²t is an independently and identically distributed standard normal random variable.
2.2. Dynamics of the Temperature Variable
We will focus on temperature-related weather derivatives since they are the most traded products.
The equilibrium model proposed here can be easily adapted to weather derivatives on other variables
such as rainfall, snowfall or precipitations.
3Lintner (1956) and Fama and Babiak (1968) study the dividend behavior for individual stocks. They use theaccounting earnings variable instead of the changes in stock prices.
6
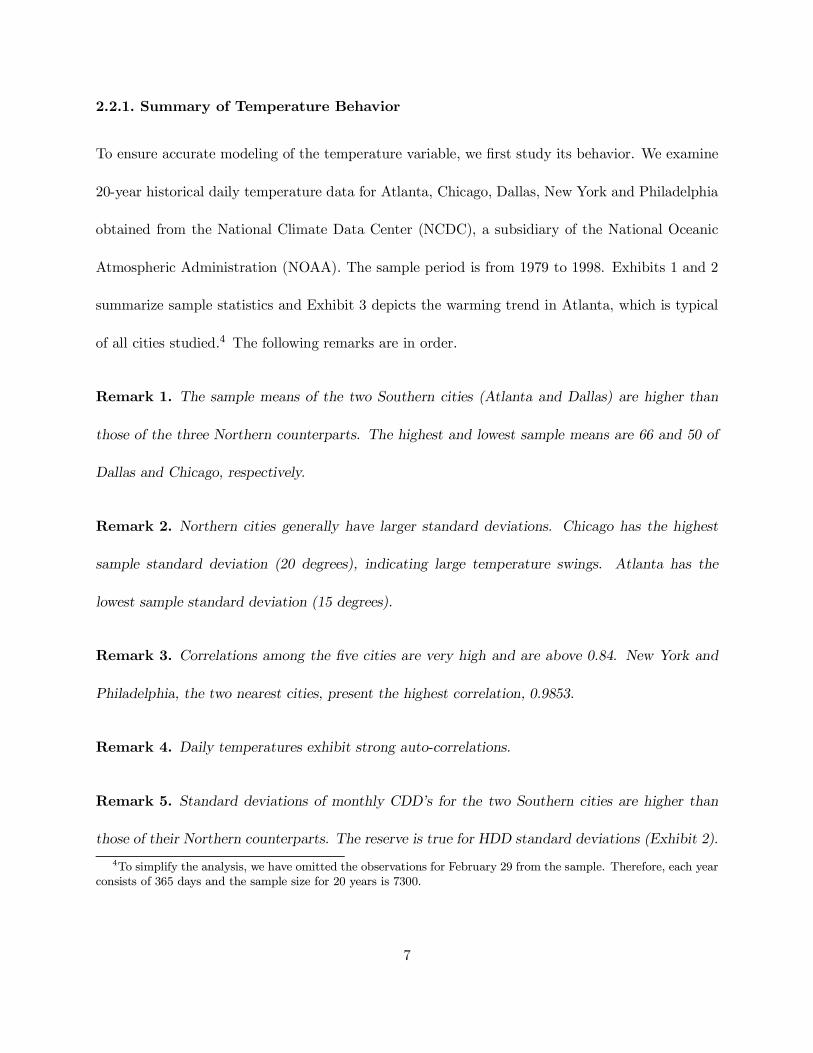
2.2.1. Summary of Temperature Behavior
To ensure accurate modeling of the temperature variable, we ¯rst study its behavior. We examine
20-year historical daily temperature data for Atlanta, Chicago, Dallas, New York and Philadelphia
obtained from the National Climate Data Center (NCDC), a subsidiary of the National Oceanic
Atmospheric Administration (NOAA). The sample period is from 1979 to 1998. Exhibits 1 and 2
summarize sample statistics and Exhibit 3 depicts the warming trend in Atlanta, which is typical
of all cities studied.4 The following remarks are in order.
Remark 1. The sample means of the two Southern cities (Atlanta and Dallas) are higher than
those of the three Northern counterparts. The highest and lowest sample means are 66 and 50 of
Dallas and Chicago, respectively.
Remark 2. Northern cities generally have larger standard deviations. Chicago has the highest
sample standard deviation (20 degrees), indicating large temperature swings. Atlanta has the
lowest sample standard deviation (15 degrees).
Remark 3. Correlations among the ¯ve cities are very high and are above 0.84. New York and
Philadelphia, the two nearest cities, present the highest correlation, 0.9853.
Remark 4. Daily temperatures exhibit strong auto-correlations.
Remark 5. Standard deviations of monthly CDD's for the two Southern cities are higher than
those of their Northern counterparts. The reserve is true for HDD standard deviations (Exhibit 2).
4To simplify the analysis, we have omitted the observations for February 29 from the sample. Therefore, each yearconsists of 365 days and the sample size for 20 years is 7300.
7

To facilitate further discussions, let us index the years in the sample period by yr, thus yr = 1
for 1979, yr = 2 for 1980, ..., yr = 20 for 1998. Also, index January 1 as t = 1 , January 2 as t = 2,
and so on for 365 days in a year. Denote Yyr;t as the temperature on date t in year yr. Below, we
de¯ne the mean (Y t) and the standard deviation (Ãt) for date t as
Y t = 120
P20yr=1 Yyr;t & Ãt =
q120
P20yr=1
¡Yyr;t ¡ Y t
¢2; 8 t = 1; 2; :::; 365:
We plot in Exhibit 4 the daily standard deviations for Atlanta and Chicago, which show a clear
seasonal pattern: the temperature variation in the HDD season is larger than that in the CDD
season. This is common for all cities in consideration.
2.2.2. Modelling Daily Temperature Behavior
In light of the properties identi¯ed in the previous section, a model for the daily temperature must
possess the following features. First, it must capture the seasonal cyclical patterns; second, the daily
variations in temperature must be around some average \normal" temperature, to be elaborated
on later; third, it should allow forecasts to play a key role in projecting temperature paths in the
future; fourth, it should incorporate the autoregressive property in temperature changes (i.e., a
warmer day is most likely to be followed by another warmer day, and vice versa); ¯fth, the extent
of variation must be bigger in the winter and smaller in the summer; sixth, a projected temperature
path into the future should never wander outside of the normal range of the temperature for each
projected point in time; and seventh, the model must re°ect the global warming trend.
A di®usion process would fail most of the above requirements, especially the ¯rst and the sixth.
Even with the most plausible candidate, the mean-reverting process, it is always possible (and this
has been veri¯ed by our empirical estimation and subsequent simulations) that a particular path
8

of temperatures does not resemble a temperature evolution at all. For this reason, we resort to a
discrete, autoregressive model. To this end, de¯ne the de-meaned and de-trended residual of the
daily temperature as Uyr;t,
Uyr;t = Yyr;t ¡ bY yr;t; 8 yr = 1; 2; :::; 20 & t = 1; 2; :::; 365: (2.1)
Assumption 3. The daily temperature residual, Uyr;t, is described by a k-lag autocorrelation
system: 5
Uyr;t =Pki=1 ½iUyr;t¡i + ¾yr;t ¤ »yr;t
¾yr;t = ¾ ¡ ¾1 j sin(¼t=365 + Á) j;
»yr;t » i:i:d: N(0; 1);
8 yr = 1; 2; :::; 20; & t = 1; 2; :::; 365:
(2.2)
The correlation between » and ² (the white noise in aggregate dividend) is assumed to be:
corr(»yr;t ; ²yr0;t0) =
8<:
' if yr = yr0 and t = t0;
0 otherwise:
In the above, bY t serves the purpose of de-mean and de-trend. It is tempting to use the historical
daily average, Y t as an input for bY t: But this will be a poor choice, because for a very cold or
very warm year, all the realized temperatures could be below or above the historical averages. To
illustrate, let us consider a colder-than-normal winter in New York from November 1980 to March
1981. Panel A of Exhibit 5 compares date t's average temperature with the realized temperature.
(The plots are extended at both ends to have a complete view.) Although Y t was more or less in the
center of realized temperatures before the winter months, it was much higher for those extremely
cold days. To correct this problem, we make certain adjustments in the following steps. 1) For
5We confess a slight abuse of notation here. Notice that at the beginning of year yr; we must use the data fromthe end of the previous year, (yr ¡ 1) to calculate the auto-regressive terms. It is understood that the index yr willautomatically take appropriate values when required.
9

each month of the year, we average the daily means, Y t; 2) for the same year, we calculate the
realized, average temperature of each month; 3) for each month, we ¯nd the di®erence between
the averages from Step 2 and Step 1; and 4) we adjust the simple mean for each day of the month
by the quantity calculated in Step 3, and this adjusted mean is referred to as bY t: The period of
one month is chosen as a trade-o®. Too long a period will not solve the non-centering problem
and too short a period will unnecessarily exaggerate the short term °uctuations and diminish the
meaning of \average" or \mean". Needless to say, one could be more sophisticated in making the
adjustments. For instance, rather than following the calendar months, one could always center
the day in question in a 30 day (e.g.) period and make the above adjustments on a rolling basis.
However, as shown in Panel B of Exhibit 5, our scheme already works very well.
The volatility speci¯cation in (2.2) using the sine wave re°ects the ¯fth requirement and the
feature in Exhibit 4. The autocorrelation setup re°ects the fourth feature. The other features
(including the global warming trend) are captured by the speci¯cation of bY t: The correlation spec-
i¯cation indicates that the current temperature is correlated with the current aggregate dividend.6
2.3. Agent's Optimization Problem
Initially, the agent is endowed with one share of the risky stock. Denote his portfolio holdings at
time t as µt = (µst ; µBt ; µx0t ), where µst ; µBt and µx0t represent the number of shares invested in the
risky stock, the discount bond and other contingent claims, respectively. Also denote the security
prices at time t by a vector Xt and the corresponding vector of dividends by Dt. The agent's
consumption over time is ¯nanced by a trading strategy fµt; t ¸ 0g. His decision problem is to
6Amore general speci¯cation would allow the current aggregate dividend to be a®ected by the lagged temperatures.This type of setup will make the estimation and valuation much more complicated, and we will leave it to futureresearch.
10

choose an optimal trading strategy so as to maximize his expected lifetime utility. The ¯rst order
conditions yield the standard Euler equation:
Xt = Et
à 1X
¿=t+1
Uc(c¿ ; ¿)
Uc(ct; t)D¿
!:
Thus, the price of any security equals the expected discounted sum of its dividends, with the
marginal rate of substitution being the stochastic state price de°ator. 7
In equilibrium, both the ¯nancial market and the goods market clear so that aggregate con-
sumption equals the dividends generated from the risky stock. Therefore, for a riskless bond paying
1 unit of consumption goods at T and 0 at all other times, its equilibrium price at time t, denoted
by B(t; T ), is
B(t; T) =1
Uc(±t; t)Et (Uc(±T ; T)) ; 8 t 2 (0; T ): (2.3)
For any contingent claim with a payo® qT at maturity T , its price at time t, denoted by Ft(t; T ), is
F (t; T) =1
Uc(±t; t)Et (Uc(±T ; T )qT ) ; 8 t 2 (0; T ): (2.4)
For example, if K denotes the delivery level of a forward contract written on the temperature
variable, Y , and the tick size is assumed to be $1 per degree days, then qT = YT ¡ K is the payo®
of the contract at maturity.
3. Pricing HDD / CDD Derivatives
3.1. Term Structure of the Interest Rate under the CRRA Preference
Proposition 3.1. Under the CRRA utility and Assumption 2, the pure discount price at time t is
7All expectations in this paper are taken with respect to the ¯ltration speci¯ed in Assumptions 2 & 3.
11

B(t; T ) = ±°(¹T¡t¡1)t exp
á½(T ¡ t) +
TX
i=t+1
[®°¹T¡i +1
2°2¾2±¹
2(T¡i)]
!;
and the yield-to-maturity de¯ned through e¡R(t;T )(T¡t) = B(t; T ) is
R(t; T ) = ½ ¡PTi=t+1[®°¹T¡i + 1
2°2¾2±¹
2(T¡i)]
T ¡ t¡ °(¹T¡t ¡ 1) ln ±t
T ¡ t:
Proof: see Appendix A.
A special case is ¹ = 1 where changes in the dividend growth rate follow a random walk. In
this case, the pure discount bond price reduces to
B(t; T ) = exp
·µ¡½ + ®° +
1
2°2¾2±
¶(T ¡ t)
¸;
which yields a °at term structure R(t; T ) = ½ ¡ ®° ¡ 12°2¾2± . In order to ensure a stable system,
the yield-to-maturity has to be positive, i.e., ½ ¡ ®° ¡ 12°2¾2± > 0.
3.2. HDD / CDD Forward Prices and Market Price of Risk
Consider an HDD forward contract with a tick size of $1 and delivery price, K. The accumulation
period starts at T1 and ends at maturity T2 > T1. Denote HDD(T1; T2) =PT2¿=T1
max(65 ¡ Y¿ ; 0):
The value of the HDD forward contract at time t, fHDD(t; T1; T2; K), can be determined by equation
(2.4):
fHDD(t; T1; T2; K) = Et³Uc(±T2 ;T2)
Uc(±t;t)[HDD(T1; T2) ¡ K]
´
= e¡½(T2¡t)Et
µ±°T2±°t
[HDD(T1; T2) ¡ K]
¶:
(3.1)
When a forward contract is initiated, the delivery price, K is chosen so that the value of the
contract is zero. Therefore, the forward price at time t, FHDD(t; T1; T2), is the value of K which
12

makes f = 0 in (3.1). That is,
FHDD(t; T1; T2) =Et
³±°T2HDD(T1; T2)
´
Et(±°T2
)=
e¡½(T2¡t)±¡°t Et³±°T2HDD(T1; T2)
´
B(t; T2):
Similar expressions can be written for CDD contracts:
fCDD(t; T1; T2;K) = e¡½(T2¡t)Et
µ±°T2±°t
[CDD(T1; T2) ¡ K]
¶;
FCDD(t; T1; T2) =e¡½(T2¡t)±¡°t Et
³±°T2
CDD(T1;T2)´
B(t;T2):
It is easier to analyze the market price of risk or the risk premium with closed-form formulas. To
this end, we set the autocorrelation parameters to zero and obtain the following proposition.
Proposition 3.2. When ½i = 0 (i = 1; 2; ::; k); the equilibrium forward prices at time t < T1
before the accumulation period are
FHDD(t; T1; T2) =PT2¿=T1
³[65 ¡ ¹0Y (¿)] ¢ N(
65¡¹0Y (¿)¾yr;¿
) + ¾yr;¿p2¼
exph¡ (65¡¹0Y (¿))2
2¾2yr;¿
i´;
FCDD(t; T1; T2) =PT2¿=T1
³[¹0Y (¿) ¡ 65] ¢ N(
¹0Y (¿)¡65¾yr;¿
) + ¾yr;¿p2¼
exph¡ (65¡¹0Y (¿))2
2¾2yr;¿
i´;
with ¹0Y (¿) = bY ¿ + °'¹¿¡t¾±¾yr;¿ :
The equilibrium forward prices at time t 2 (T1; T2) during the accumulation period are
FHDD(t; T1; T2) = HDD(T1; t) +PT2¿=t+1
³[65 ¡ ¹0Y (¿)] ¢ N(
65¡¹0Y (¿ )¾yr;¿
) + ¾yr;¿p2¼
exph¡ (65¡¹0Y (¿))2
2¾2yr;¿
i´;
FCDD(t; T1; T2) = CDD(T1; t) +PT2¿=t+1
³[¹0Y (¿) ¡ 65] ¢ N(
¹0Y (¿)¡65¾yr;¿
) + ¾yr;¿p2¼
exph¡ (65¡¹0Y (¿))2
2¾2yr;¿
i´:
The equilibrium values of the forward contracts at time t are
fHDD(t; T1; T2;K) = B(t; T2)(FHDD(t; T1; T2) ¡ K) and
fCDD(t; T1; T2;K) = B(t; T2)(FCDD(t; T1; T2) ¡ K):
Proof: (see Appendix B).
13

Remark 6. The equilibrium value of an HDD/CDD forward contract in Proposition 3.2 is the
present value of the di®erence between the forward price and the delivery price discounted at the
riskfree rate, which is consistent with results for stock or currency forward contracts when interest
rates are non-stochastic.
Remark 7. The equilibrium forward prices converge to the spot prices at maturity T2:
FHDD(T2; T1; T2) = HDD(T1; T2) and FCDD(T2; T1; T2) = CDD(T1; T2):
A special case of Proposition 3.2 is when ' = 0, i.e., when the temperature variable Y is not
correlated with the aggregate dividend. In this case, the forward prices at time t < T1 collapse to
F ¤HDD(t; T1; T2) =
PT2¿=T1
³[65 ¡ ¹Y (¿)] ¢ N(65¡¹Y (¿)¾yr;¿
) + ¾yr;¿p2¼
exph¡ (65¡¹Y (¿))2
2¾2yr;¿
i´
F ¤CDD(t; T1; T2) =
PT2¿=T1
³[¹Y (¿) ¡ 65] ¢ N(¹Y (¿)¡65¾yr;¿
) + ¾yr;¿p2¼
exph¡ (65¡¹Y (¿))2
2¾2yr;¿
i´
with ¹Y (¿) = bY ¿ :
It can be veri¯ed that the forward prices, F ¤HDD and F ¤
CDD; are simply the expected values of HDD
and CDD, respectively, conditional on today's information on temperature. That is,
F ¤HDD(t; T1; T2) = Et(HDD(T1; T2)) and F ¤
CDD(t; T1T2) = Et(CDD(T1; T2)):
No risk premium is required for the temperature variable in this case.
Given the parameter restrictions ¡1 < ° < 0 , 0 < ¹ 6 1 , ¾± > 0 and ¾yr;t > 0, parameter
' plays a key role in determining the relationship between the forward prices and the expected
HDD/CDD values. To gain more insights, we compute the following comparative statics:
@FHDD@'
= ¡T2X
¿=T1
µN(
65 ¡ ¹0Y (¿)
¾yr;¿)°¹¿¡t¾±¾yr;¿
¶> 0;
14

@FCDD@'
=T2X
¿=T1
µN(
¹0Y (¿) ¡ 65
¾yr;¿)°¹¿¡t¾±¾yr;¿
¶< 0:
Since ' = 0 corresponds to the case where the forward prices are equal to the expect HDD/CDD,
we obtain the following relations:
Table 2: Comparative Statics
' < 0 ' > 0
FHDD < Et (HDD(T1; T2)) FHDD > Et (HDD(T1; T2))
FCDD > Et (CDD(T1; T2)) FCDD < Et (CDD(T1; T2))
Note: ¡1 < ° < 0 , 0 < ¹ 6 1 , ¾± > 0 and ¾yr;t > 0:
When the temperature is negatively correlated with the aggregate dividend, i.e., ' < 0, HDD
forward prices are lower than the expected HDD, but CDD forward prices are higher than the
expected CDD. The reverse is true when ' > 0. Simulation results in subsequent sections show
that the results in Table 2 still obtain when the auto-correlations are not zero.
3.3. Valuation of HDD and CDD Options
HDD and CDD options can be priced in a similar way as the corresponding forward contracts.
Consider a European option written on HDD(T1; T2) with maturity T2 and a strike price X.
Denote the call and put prices at time t as CHDD(t; T1; T2;X) and PHDD(t; T1; T2;X); respectively.
According to (2.4), the call and put values can be determined as
CHDD(t; T1; T2;X) = e¡½(T2¡t)±¡°t Et³±°T2 max(HDD(T1; T2) ¡ X; 0)
´;
PHDD(t; T1; T2;X) = e¡½(T2¡t)±¡°t Et³±°T2 max(X ¡ HDD(T1; T2); 0)
´:
15

Similarly, call and put options written on CDD(T1; T2) can be priced as
CCDD(t; T1; T2;X) = e¡½(T2¡t)±¡°t Et³±°T2 max(CDD(T1; T2) ¡ X; 0)
´;
PCDD(t; T1; T2;X) = e¡½(T2¡t)±¡°t Et³±°T2 max(X ¡ CDD(T1; T2); 0)
´:
It is important to note that, when ' 6= 0, the above option pricing equations also incorporate
market price of risks for the temperature variable. When ' = 0, similar to forward prices, the
option prices can be determined by discounting the future payo®s at the riskfree rate, i.e.,
CHDD(t; T1; T2;X) = e¡½(T2¡t)±¡°t Et³±°T2 max(HDD(T1; T2) ¡ X; 0)
´;
= e¡½(T2¡t)±¡°t Et³±°T2
´Et (max(HDD(T1; T2) ¡ X; 0)) (when ' = 0)
= B(t; T2)Et (max(X ¡ HDD(T1; T2); 0)) (by Appendix A.1)
= e¡R(t;T2)(T2¡t)Et (max(X ¡ HDD(T1; T2); 0)) : (by de¯nition)
Since the above pricing equations do not admit closed-form formulas, we will perform the
analysis of market price of risk in Section 5 through simulations.
4. Estimation of Temperature Dynamics
Our setup calls for the estimation of the joint distribution of the aggregate dividend and the daily
temperature. The aggregate dividend can be approximated by several variables. To start with,
one could use the aggregate output, although the lower frequency of such data will make the joint
estimation di±cult since the temperature data are daily. One may also use the dividend yield of
a stock market index. Since our primary task in this paper is to lay out a pricing framework, we
will not perform a joint estimation. Instead, we only estimate the parameters for the temperature
16

behavior. For simulations, parameters for the utility function (½, °) and the aggregate dividend
(®, ¹, ¾±) will be calibrated via the results in Proposition 3.1.
Let £ be the vector containing all the parameters (½1, ½2, ½3, ..., ½k; ¾, ¾1, Á), then the
log-likelihood function is
l(£;Y ) = ¡1
2
20X
yr=1
TX
t=1
Ã[Yyr;t ¡ Eyr;t¡1(Yyr;t)]2
¾2yr;t+ log
¡2¼¾2yr;t
¢!
with
Eyr;t¡1(Yyr;t) = bY yr;t +kX
i=1
½iUyr;t¡i; ¾yr;t = ¾ ¡ ¾1 j sin(¼t=365 + Á) j;
8 yr = 1; 2; :::; 20; & t = 1; 2; :::; 365
Given the large sample size, the estimation variances can be computed based on the asymptotic
distribution of b£:
pT (b£ ¡ £) ~ N [0; I(£)¡1] with I(£) ´ lim
T!1¡E
µ1
T
@2l(µ;Y )
@µ@µ0
¶:
In order to determine k, the number of lags, we estimate the system separately for k = 1; 2; 3; :::,
and perform sequential maximum likelihood ratio tests (i.e. Â2 tests). We stop when the maximum
likelihood value ceases to improve. It turns out that three lags describe the data the best. For
brevity, we only report the estimation and testing results for k = 3, 4 in Exhibit 6.
Several observations are in order. First, for k = 3; almost all parameters are estimated with
very low standard errors, implying the proper speci¯cation of the estimation system. This is by no
means a °uke since we have extensively explored and eliminated many other systems. For instance,
we have estimated a system which utilizes the simple mean Y t together with a trending parameter.
The likelihood value of such a system is much smaller. Second, standard errors of the parameter
17

¾1 is very small, implying the appropriateness of using the sine wave to ¯t the overall volatility
structure. (When the system is estimated by specifying a constant volatility throughout the year
(i.e. ¾1 = 0), the likelihood value is much smaller.) Third, the ¯rst order auto-regressive behavior
tends to be stronger for Southern cities, and ½1 has the highest value for Atlanta. Roughly, a
stronger auto-correlation means less dramatic changes in temperature, and vice versa. As shown
in Exhibit 1, Atlanta does have the lowest overall standard deviation in the sample period.
5. Numerical Analysis
5.1. Simulation Design
Broadly speaking, the simulation procedure consists of 1) generating bivariate paths for the dividend
process in Assumption 2 (by assuming ¹ = 1) and the daily temperature process in Assumption 3
(by using the parameters in Exhibit 6 for the case of k = 3); 2) tracking realized HDD/CDD values
of each path; 3) calculating the payo® of the derivative security in question according to (2.4) by
using CRRA utility; and 4) repeating steps 1 through 3 a large number of times and averaging the
payo®s to obtain the desired derivative security value. To accomplish the above we must ¯rst make
some speci¯cations and adopt certain simulation strategies.
To begin with, the riskfree rate does not explicitly enter the valuation equations in Sections 3.2
and 3.3. Instead, it is endogenously determined by ½; ®; °; and ¾±; as shown in Proposition 3.1.
The rate of time preference, ½ is typically set equal to, or estimated as the real riskfree interest rate.
We set it at 0.03. The volatility of the dividend growth rate, ¾± is set at 0.2, mimicking the average
volatility of a stock market index. The risk-aversion parameter, ° will serve as a comparative static
parameter in our analysis, ranging from -1 to 0. Given a value of °, we will assign a value to ® so
18

that the riskfree rate is maintained at 0.06. The only other free standing parameter in the bi-variate
system is the correlation coe±cient, which we will also use as a comparative static parameter.
Next, we must decide on the inputs for the adjusted mean temperature, bY yr;t. In the estimation
context, bY yr;t serves as the \anchoring point" and the temperature dynamics are estimated around
these anchoring points. In the valuation context which by necessity is forward looking, bY yr;t can
naturally be considered as daily temperature forecasts. If the forecasts were of 100% accuracy, then
derivatives valuation becomes a simple arithmetic calculation using these forecasts. As a matter of
fact, derivative securities won't even exist in this case, because perfect planning is achievable. In
reality, it is precisely the uncertainty in the forecasts that drives the value of weather derivatives.
The random term in the temperature dynamic captures this uncertainty. (Indeed, this is one of
the key advantages of our model, since it allows forecasts to be used as inputs and is capable of
accommodating deviations from forecasts commensurate with history, i.e., data.) As for the choice
of forecasts, there are no restrictions. In our simulations, we will use two sets of inputs for bY yr;t;
one being the historical daily average temperatures and the other being last season's adjusted daily
average temperatures.
To reduce simulation errors, we employ the antithetic variable technique. Each value estimate
is based on 10,000 runs.
Finally, we employ a procedure which is equivalent to the control variate technique. Notice that
the fundamental variable in our framework is the daily temperature, and the underlying variable
for most weather derivatives is HDD or CDD, which is a nonlinear function of daily temperatures.
While our model will produce almost \unbiased" temperature forecasts in that the average temper-
ature for a future point will be almost equal to the input forecast, it can not guarantee an unbiased
19

forecast for the HDD / CDD. To further illustrate this point, we compare some forward prices in
Exhibit 7. The ¯rst column reports the average seasonal CDD and HDD for each city averaged
across the twenty years. (It is actually nineteen years for the HDD.) The third column contains
the CDD and HDD calculated from the average daily temperatures. (The di®erence between the
two columns is due to the di®erent sequence of averaging.) The ¯fth column is the counterpart
of Column three except that the inputs are the adjusted daily average temperatures of the last
season. Columns two and four report the simulated forward CDD's and HDD's using the corre-
sponding forecast inputs when the correlation between the dividend process and the temperature
is set to zero. Let us compare Column two with Column three, and Column four with Column ¯ve.
Notice that the di®erence in some cases is very small, almost entirely attributable to simulation
errors; but in some other cases, the di®erence is too big to be explained by simulation errors. The
reason for the sizable di®erences lies in the aforementioned fact that the simulated quantities are
nonlinear functions of the underlying variable. To ensure correct pricing, we perform a two-stage
simulation for each value estimate. In the ¯rst stage, we simulate forward prices by setting the
correlation parameter to zero (' = 0); and record the di®erence between the model price and the
implied forward price from the forecasts (e.g., in Exhibit 7, when average temperatures are used
as forecasts, this is the di®erence between Column two and Column three). Then, in the second
stage, we simulate the derivative security's price by setting the correlation parameter back to its
actual value. Here, before calculating the derivative's payo® for each path, we ¯rst adjustment the
realized CDD or HDD by the di®erence found in the ¯rst stage. In a nutshell, the above proce-
dure amounts to ensuring unbiased paths of the CDD and HDD which are underlying variables for
weather derivatives. It should be pointed out that when the temperature dynamic, especially the
20

volatility structure, is modelled and estimated perfectly, this procedure will not be necessary.
5.2. HDD / CDD Derivative Prices and Market Price of Risk
For all subsequent simulations, we will examine two risk-aversion cases (° = ¡0:5 corresponding to
a power utility and ° = ¡1:0 corresponding to a log utility) and two correlation cases (' = ¡0:2
and ' = 0:2). For each parameter combination, we perform two sets of simulations, each based
on a di®erent set of forecasts. We will examine both CDD and HDD contracts. Throughout the
discussions we will attempt to assess the importance of market price of risk. (Recall that, when
the interest rate is maintained at a constant level, ' = 0:0 amounts to a zero market price of risk
for the temperature variable, irrespective of the risk-aversion level.)
5.2.1. CDD Forward Prices and Option Prices
Exhibit 8 reports CDD forward prices. Several observations are in order. First, the level of forward
price depends heavily on the forecast inputs, as re°ected by the di®erences between the two panels.
Second, since the forecast forward prices correspond to ' = 0, comparing the forecast forward
prices with those under ' = ¡0:2 and ' = 0:2 reveal that the predictions in Table 2 also hold
for the general case where the auto-correlations are not zero. Third, depending on the sign of the
correlation, a higher risk-aversion may lead to a higher or lower forward price. Speci¯cally, with
a negative correlation '; a higher risk-aversion (' = ¡1:0) leads to a higher forward price, and
vice versa. The intuitive reason lies in the valuation equations in Section 3.2. Notice that the
future payo® is \discounted" back at a rate which is a function of certain ¯xed parameters and
the stochastic dividend ratio raised to the power of °: Since ° < 0 and since the average dividend
growth rate is positive (i.e. ® > 0), a higher dividend ratio leads to a smaller discount factor (i.e. a
21

lower present value), and vice versa. Now, with a negative correlation, a higher CDD ending value
is most likely accompanied by a lower dividend ratio, and a lower dividend ratio (meaning close to
one) will lead to a higher present value. The closer ° is to -1, the more manifest the above e®ect,
and hence the pattern. (To see the last point, realize that in general, let f = 1=Aa and g = 1=Ab
and 1 > a > b > 0; then j @f@A j > j @g
@A j :) Of course, this also explains why, under a particular
risk-aversion parameter, the relationship between the forward price and the correlation is negative.
Lastly, irrespective of the above patterns, the overall impact of the market price of temperature risk
does not seem to be signi¯cant. Going from a zero to a non-zero market price of risk, the forward
price only changes by less than one percent, which is true across di®erent parameter combinations.
Exhibit 9 contains CDD option prices. We ¯rst explain the so-called historical simulation prices.
Some authors (e.g. Hunter, 1999) have discussed the use of historical simulation in pricing weather
derivatives. The idea is similar to the historical simulation used in some of the VaR calculations.
Speci¯cally, a derivative contract's payo® is calculated using realized, historical underlying variable
values, and the average payo® over a sample period (say 10 years) is taken as the estimate of the
derivative's value. In our case, it boils down to evaluating the payo® for each of the twenty years
and then averaging the payo®s to arrive at a value. (The discounting is done using the 6% constant
rate.) The strike price is set equal to the historical average CDD for each city. It is seen that the
call and put option values are equal for each city. This is expected since the exercise price is set at
the (realized) forward price level.
In Exhibit 9, we also report simulated option values under di®erent parameter combinations.
For Panel A, the strike price is set equal to the forecast forward price level (from the ¯rst column
of Exhibit 8). For Panel B, two sets of strike prices are used. Option prices in Column 4 are based
22
on the strike prices in Column 3. Other option prices are based on the strike prices in Column 1.
We use di®erent strike prices to examine the behavior of away-from-the-money options.
The ¯rst observation is the signi¯cant di®erence between the historical simulation prices and
the regular simulated prices, especially in Panel A where the historical simulation prices are much
higher. To understand why, realize that in the regular simulations, the overall level of the tem-
perature one year into the future is more or less contained by the forecasts, and variations are
around this overall level. But with historical simulations, we are implicitly assuming that next
year's temperatures can have extremely large variations, even in terms of the general level; the very
cool and the very hot summers in the past 20 years command the same probability in realization.
In reality however, meteorologists are at least able to forecast the general level of temperatures
(i.e. cool, normal or hot) for the next summer with reasonable accuracy. Historical simulations
tend to exaggerate the impact of extreme realizations when the sample size is not large, and in our
case, we have only 20 observations for each season. This points out a serious drawback of historical
simulations used in pricing weather derivatives.
Another observation has to do with the impacts of parameter values. First of all, we observe
exactly the same patterns in CDD call option prices as in CDD forward prices: the higher the
risk-aversion, the lower the option's price, when the correlation is positive, and so on. Similarly,
a positive correlation is associated with lower option prices for a given level of risk-aversion. The
explanations for the CDD forward prices also apply to CDD call options. It is seen that the patterns
for put options are reversed. This is easy to understand, since the value of a put option is inversely
related to the level of CDD. Second, the option prices do not seem to change signi¯cantly across
di®erent parameter combinations, although percentage-wise, the change is bigger than that for the
23
forward prices. The higher the risk-aversion, the bigger the impact of the market price of risk.
However all percentages are less than 3.5% in absolute values. If an investor is willing to tolerate
an error in that magnitude, the market price of risk can be safely ignored.
Finally, it is observed in Panel B that di®erent strike prices can lead to quite di®erent option
values, as expected. What is interesting is the non-linear relationship between the option price and
the strike price. For example, for Dallas, when the strike price changes from 3153.45 to 2424.55,
representing a decrease of 728.9, the call value increases from 35.01 to 697.57, representing an
increase of 662.56. (We ignore the minor impact of the correlation.) The option value's increase is
smaller than the decrease in the strike price. It is tempting to calculate one option value based on
a set of forecasts and simply adjust linearly for another set of forecasts to get a new option value.
Exhibit 9 shows that this is not valid.
5.2.2. HDD Forward Prices and Option Prices
Exhibits 10 and 11 are HDD counterparts of Exhibits 8 and 9. All the conclusions in the previ-
ous section apply here. Of course, it is seen that all the patterns are the reverse of their CDD
counterparts. This is because HDD as an underlying contract variable is negatively related to the
temperature level, whereas CDD is positively related to the temperature.
5.2.3. Monthly HDD / CDD Options
Finally, in Exhibit 12, we report option values for individual months of a CDD or HDD season. The
setup is exactly the same as those in Exhibits 9 and 11, except that every quantity is for a particular
month. For brevity, we only report results for two cities under two parameter combinations. It is
seen that all the qualitative conclusions drawn before also apply here. However, we would like to
24

draw the reader's attention to an important result implied in the exhibit. Take the CDD contracts
as an example, and let's restrict our attention to New York under ° = ¡0:5 and ' = ¡0:2. It can
be veri¯ed that the sum of the strike prices across the ¯ve months is equal to the CDD seasonal
strike reported in Exhibit 9: 1101.80 (allowing for a small rounding error). The sum of the call
option prices is 75.22 and that of the puts is 74.26. But the corresponding seasonal contract values
are 34.84 and 33.98 respectively (from Exhibit 9), much smaller than the sums. This is the well
known result that the option on a portfolio is worth less than the sum of options written on the
individual components of the portfolio.
6. Summary and Conclusion
In this paper, we propose and implement an equilibrium valuation framework for weather deriv-
atives. We specialize the framework to HDD/CDD contracts. The framework is the generalized
Lucas's model of 1978. The underlying economic variable is the aggregate dividend and the un-
derlying variable for weather derivatives is the daily temperature, and the two are correlated. We
study the temperature behavior in the past twenty years for ¯ve major cities in the U.S., and derive
key properties of the temperature dynamics. We develop a model system that not only allows easy
estimation, but also incorporates key features of the daily temperature dynamics such as seasonal
cycles and uneven variations throughout the year. The system is estimated using the maximum
likelihood method, and HDD and CDD contracts are priced accordingly.
Our valuation framework has many advantages. It allows the use of weather forecasts in mod-
elling the future temperature behavior. In addition, since our starting point is the daily tempera-
25

ture, the framework is capable of handling temperature contracts of any maturity, for any season,
and it requires only a one-time estimation. In contrast, if one starts by modelling CDD or HDD
directly, then by nature of the temperature behavior, the CDD or HDD will necessarily be season
and maturity speci¯c, which implies that each contract will require a separate estimation proce-
dure. This will not only create potential inconsistency in pricing, but also render the whole idea
impractical if many di®erent contracts are dealt with or if the valuation is to be done on an on-
going basis. Last but not least, our equilibrium framework allows us to answer a very important
question: Can one use the riskfree rate in deriving weather derivative values without incurring too
big an error?
Several conclusions can be drawn from the study. First and foremost, the market price of
risk associated with the temperature variable does not seem to a®ect the derivatives' value in a
signi¯cant way. This is true for the range of plausible correlations between the aggregate dividend
and the temperature variable, and under di®erent utility functions within the CRRA family. This
conclusion is signi¯cant in that the common practice in the industry is to use the riskfree rate as
the discount rate. Our study represents the ¯rst attempt to inquire into the validity of such a
practice. Notwithstanding, we are obliged to admit that the conclusion is not universal, because
we use a special class of utility function and we only allow contemporaneous correlation between
the aggregate dividend and the temperature.
The second conclusion has to do with another common practice in the industry, which is to use
the historical simulation approach to estimate weather derivative values. We show that in most
cases, this is not valid. Weather contracts typically cover a period to come and do not extend
very far into the future. However, historical simulations implicitly assume that the next season's
26

temperature can resemble any of the past seasons in the sample, including extreme seasons (very
cold or very warm). As a result, in most cases, the historical simulation method tends to over
estimate option prices.
As for future research directions, one obvious avenue is to generalize the framework to incorpo-
rate intertemporal correlations between the aggregate dividend and the temperature variable and
investigate the impact of market price of risk from within. This will be useful in that, intuitively,
an abnormal weather season may a®ect the future output more than the current. Our e®orts in
this paper represent the ¯rst step in such a general pursuit.
27
References
[1] Agins, T. and K. Kranhold, February 18, 1999, \Coat Peddlers Turn to Forecasters to Beat
Winter Heat", Wall Street Journal, page B1 and B9.
[2] Black, F. and M. Scholes, 1973, \The Pricing of Options and Corporate Liabilities," Journal
of Political Economy, 81, 637-655.
[3] Challis, Simon, 1999, \Bright Forecast for Pro¯ts", Reactions, June 1999.
[4] Fama, E. and H. Babiak, 1968, \Dividend Policy: An Empirical Analysis," Journal of the
American Statistical Association, 63, No.4., 1132-1161.
[5] Fama, E. and K. R. French, 1988a, \Permanent and Temporary Components of Stock Market
Prices," Journal of Political Economy, 96, No. 1-3, 246-273.
[6] Fama, E. and K. R. French, 1988b, \Dividend Yields and Expected Stock Returns," Journal
of Financial Economics, 22, 3-26.
[7] Hanley, M., 5 July/August, 1999, \Hedging the Force of Nature", Risk Professional, issue1,
21-25.
[8] Hull, J., 1997, Options, Futures and other Derivative Securities, Prentice Hall, Englewood
Cli®s, New Jersey.
[9] Hunter, Robert, 1999, \Managing Mother Nature", Derivatives Strategy, February 1999.
[10] Lintner, J., 1956, \Distribution and Incomes of Corporations among Dividends, Retained
Earnings and Taxes," American Economic Review, 46, 97-113.
[11] Lucas, R. E., 1978, \Asset Prices in an Exchange Economy," Econometrica, 46, 1429-1445.
[12] Marsh, T. A. and R. Merton, 1987, \Dividend Behavior for the Aggregate Stock Market,"
Journal of Business, 60, 1-40.
[13] Smithson, C. and C. Choe, 1999, \Whatever the Weather", Risk, 12 (9).
28

Appendices
A. Proof of Proposition 3.1
A.1. Equilibrium Discount Bond Price
Since the marginal distribution of ln ±T conditional on ln ±t is
f (ln ±T j ln ±t) = 1p2¼§±(t;T )
exp³¡ (ln ±T¡¹±(t;T ))2
§±(t;T )
´
with
¹±(t; T ) = Et(ln ±T ) = Et³¹T¡t ln ±t +
PTi=t+1 ¹T¡i(® + ¾±²i)
´
= ¹T¡t ln ±t + ®PTi=t+1 ¹T¡i;
§±(t; T) = vart(ln ±T ) = ¾2±PTi=t+1 ¹2(T¡i);
the price of a pure discount bond at time t with maturity T is
B(t; T ) = Et
³Uc(cT ;T )Uc(ct;t)
¢ 1´
= e¡½(T¡t)Et³±°T±°t
´
= e¡½(T¡t)Et
µ±°¹
T¡tt e
°PTi=t+1 ¹
T¡i(®+¾±²1i)
±°t
¶
= ±°(¹T¡t¡1)t exp
³¡½(T ¡ t) +
PTi=t+1[®°¹T¡i + 1
2°2¾2±¹
2(T¡i)]´
= ±°(¹T¡t¡1)t exp
³¡½(T ¡ t) +
PTi=t+1[®°¹T¡i + 1
2°2¾2±¹
2(T¡i)]´
:
Then, the yield-to-maturity, R(t; T), is
R(t; T) = ¡ lnB(t; T)
T ¡ t= ½ ¡
PTi=t+1[®°¹T¡i + 1
2°2¾2±¹
2(T¡i)]
T ¡ t¡ °(¹T¡t ¡ 1) ln ±t
T ¡ t:
B. Proof of Proposition 3.2: Equilibrium forward Prices
When there is no autocorrelation in daily temperatures, i.e., ½i = 0 (for i = 1; 2; :::; k), the joint dis-
tribution of (ln ±T , YT ) conditional on (ln ±t, Yt) is a bi-variate normal distribution with correlation
coe±cient ' :
f(ln ±T ; Yyr;T j ln ±t; Yyr;t) = N [ln ±T ; Yyr;T ;¹±(t; T ); §±(t; T); ¹Y (t; T );§Y (t; T); '];
where
¹Y (T ) = Et(Yyr;T ) = bY yr;T and §Y (T ) = vart(Yyr;T ) = ¾2yr;T :
29

B.1. Forward Prices before the Accumulation Period
For an HDD forward contract with the accumulation period from T1 to maturity T2, its forward
price at time t < T1 (before the accumulation period) is
FHDD(t; T1; T2) = 1B(t;T2)
Et
³Uc(cT2 ;T2)
Uc(ct;t)¢ HDD(T1; T2)
´
=e¡½(T2¡t)±¡°tB(t;T2)
Et³±°T2
PT2¿=T1
max(65 ¡ Yyr;¿ ; 0)´
=e¡½(T2¡t)±¡°tB(t;T2)
±°¹T2¡t
t Et³ePT2i=t+1 °¹
(T2¡i)[®+¾±"i]PT2¿=T1
max(65 ¡ Yyr;¿ ; 0)´
:
We can rewrite the above as
=e¡½(T2¡t)±°(¹
T2¡t¡1)t
B(t;T2)Et
ÃPT2¿=T1
e
PT2i=t+1i6=¿
°¹(T2¡i)[®+¾±"i]e°¹
T2¡¿ (®+¾±"¿ )max(65 ¡ Yyr;¿ ; 0)
!
=e¡½(T2¡t)±°(¹
T2¡t¡1)t
B(t;T2)
PT2¿=T1
Et
"e
PT2i=t+1i 6=¿
°¹(T2¡i)[®+¾±"i]#
Ethe°¹
T2¡¿ (®+¾±"¿ )max(65 ¡ Yyr;¿ ; 0)i
=e¡½(T2¡t)±°(¹
T2¡t¡1)t
B(t;T2)
PT2¿=T1
"e
PT2i=t+1i6=¿
°¹(T2¡i)[®+ 12°¾2±¹
(T2¡i)]#
Et
he°¹
T2¡¿ (®+¾±"¿ )max(65 ¡ Yyr;¿ ; 0)i
Tedious exercise shows that
Et
he°¹
T2¡¿ (®+¾±"¿ ) max(65 ¡ Yyr;¿ ; 0)i
= e°¹T2¡¿ (®+ 1
2°¾2±¹
(T2¡¿))³[65 ¡ ¹0Y (¿)] ¢ N(
65¡¹0Y (¿ )¾yr;¿
) + ¾yr;¿p2¼
exph¡ (65¡¹0Y (¿ ))2
2¾2yr;¿
i´
with ¹0Y (¿) = bY yr;¿ + °'¹¿¡t¾±¾yr;¿ :
Therefore,
FHDD(t; T1; T2) =
e¡½(T2¡t)±°(¹T2¡t¡1)
tB(t;T2)
PT2¿=T1
0BB@
"e
PT2i=t+1i 6=¿
°¹(T2¡i)[®+ 12°¾2±¹
(T2¡i)]#
e°¹T2¡¿ (®+ 1
2°¾2±¹
(T2¡¿))
£h[65 ¡ ¹0Y (¿)] ¢ N(
65¡¹0Y (¿)¾yr;¿
) +¾yr;¿p2¼
exp³¡ (65¡¹0Y (¿ ))2
2¾2yr;¿
´i
1CCA
=PT2¿=T1
³h[65 ¡ ¹0Y (¿)] ¢ N(
65¡¹0Y (¿)¾yr;¿
) + ¾yr;¿p2¼
exp³¡ (65¡¹0Y (¿))2
2¾2yr;¿
´i´:
30

Similarly, the corresponding forward prices on CDD is
FCDD(t; T1; T2) = 1B(t;T2)
Et³Uc(cT2 ;T2)
Uc(ct;t)¢ CDD(T1; T2)
´
=PT2¿=T1
³[¹0Y (¿) ¡ 65] ¢ N(
¹0Y (¿ )¡65¾yr;¿
) + ¾yr;¿p2¼
exph¡ (65¡¹0Y (¿ ))2
2¾2yr;¿
i´:
B.2. Forward Prices during the Accumulation Period
For HDD forward price at time t 2 (T1; T2) during the accumulation period, we have
FHDD(t; T1; T2) = 1B(t;T2)
Et³Uc(cT2 ;T2)
Uc(ct;t)¢ HDD(T1; T2)
´
= 1B(t;T2)
Et³Uc(cT2 ;T2)
Uc(ct;t)¢ HDD(T1; t)
´+ 1
B(t;T2)Et
³Uc(cT2 ;T2)
Uc(ct;t)¢ HDD(t + 1; T2)
´
= HDD(T1; t)1
B(t;T2)Et
³Uc(cT2 ;T2)
Uc(ct;t)
´+
e¡½(T2¡t)±¡°tB(t;T2)
Et³±°T2HDD(t + 1; T2)
´
= HDD(T1; t) +PT2¿=t+1
³[65 ¡ ¹0Y (¿)] ¢ N(
65¡¹0Y (¿)¾yr;¿
) + ¾yr;¿p2¼
exph¡ (65¡¹0Y (¿))2
2¾2yr;¿
i´:
Also, the CDD forward price at time t 2 (T1; T2) is
FCDD(t; T1; T2)
= CDD(T1; t) +PT2¿=t+1
³[¹0Y (¿) ¡ 65] ¢ N(
¹0Y (¿)¡65¾yr;¿
) + ¾yr;¿p2¼
exph¡ (65¡¹0Y (¿))2
2¾2yr;¿
i´:
31

Exhibit 1: Summary Statistics
Atlanta Chicago Dallas New York Philadelphia
Mean 63 50 66 56 56
Median 64 50 67 56 56
Mode 79 70 86 72 75
Standard Deviation 15 20 16 17 18
Minimum 5 -17 9 3 1
Maximum 92 93 97 93 92
Sample Size 7,300 7,300 7,300 7,300 7,300
Correlation
Atlanta 1.0000
Chicago 0.8847 1.0000
Dallas 0.8777 0.9038 1.0000
New York 0.8966 0.8964 0.8443 1.0000
Philadelphia 0.9125 0.8970 0.8455 0.9853 1.0000
Auto Correlation
k-lags
1 0.9402 0.9421 0.9354 0.9448 0.9462
2 0.8690 0.8809 0.8680 0.8896 0.8926
3 0.8281 0.8494 0.8318 0.8654 0.8678
4 0.8069 0.8304 0.8132 0.8533 0.8550
5 0.7952 0.8181 0.8005 0.8470 0.8486
6 0.7867 0.8091 0.7918 0.8431 0.8437
7 0.7804 0.8022 0.7855 0.8394 0.8380
8 0.7764 0.7973 0.7813 0.8346 0.8330
9 0.7728 0.7925 0.7773 0.8297 0.8283
10 0.7687 0.7894 0.7731 0.8246 0.8228
11 0.7665 0.7870 0.7718 0.8197 0.8175
12 0.7652 0.7857 0.7720 0.8164 0.8142
13 0.7614 0.7835 0.7683 0.8124 0.8098
14 0.7562 0.7793 0.7608 0.8099 0.8054
15 0.7534 0.7759 0.7558 0.8070 0.8017
32

Exhibit 2: Summary Statistics of Monthly HDD and CDD (1979 - 1998)
Jan. Feb. Mar. Apr. May June July Aug. Sept. Oct. Nov. Dec.
Atlanta
HDD Average 679 493 328 143 21 1 0 1 11 117 336 586Std. Dev. 125 90 85 63 18 4 0 2 10 43 97 126Maximum 882 657 465 261 63 18 0 11 32 188 514 797Minimum 462 297 156 36 2 0 0 0 0 22 131 346
CDD Average 0 2 14 59 198 385 502 452 275 67 8 2Std. Dev. 1 3 10 39 66 68 72 63 59 38 13 3Maximum 3 8 36 141 322 494 639 589 440 178 49 13Minimum 0 0 2 4 62 221 372 349 192 12 0 0
Chicago
HDD Average 1308 1065 857 516 230 51 6 10 112 407 766 1132Std. Dev. 189 165 101 80 81 31 6 12 46 79 106 184Maximum 1627 1359 1095 643 364 118 19 37 189 583 958 1562Minimum 956 733 733 393 87 6 0 0 34 288 598 891
CDD Average 0 0 2 9 48 161 283 240 93 9 0 0Std. Dev. 0 0 3 15 40 62 73 92 36 10 0 0Maximum 0 0 13 53 167 254 398 445 158 44 1 0Minimum 0 0 0 0 4 38 152 106 19 0 0 0
Dallas
HDD Average 627 442 269 91 10 0 0 0 8 69 305 557Std. Dev. 124 101 63 40 9 0 0 0 10 32 66 128Maximum 911 635 384 186 29 2 0 0 38 145 414 933Minimum 401 299 164 26 0 0 0 0 0 14 190 389
CDD Average 1 4 28 87 270 491 642 622 399 145 22 4Std. Dev. 2 9 20 35 78 74 77 73 64 35 16 5Maximum 6 37 77 158 464 668 844 737 563 220 52 13Minimum 0 0 4 24 171 382 551 480 302 78 3 0
New York
HDD Average 988 838 702 374 120 13 0 1 35 234 513 824Std. Dev. 145 125 80 46 40 12 1 3 16 73 69 139Maximum 1241 1173 913 446 187 49 3 9 74 376 651 1198Minimum 735 671 613 286 51 1 0 0 11 101 389 644
CDD Average 0 0 1 4 63 224 392 350 153 22 1 0Std. Dev. 0 0 4 8 42 55 56 56 37 23 2 0Maximum 0 0 18 34 184 325 490 444 222 95 7 2Minimum 0 0 0 0 4 112 271 239 100 0 0 0
Philadelphia
HDD Average 1002 835 676 349 106 10 0 2 39 261 538 852Std. Dev. 154 124 95 60 46 11 1 5 19 75 86 136Maximum 1243 1170 911 440 191 42 4 21 92 408 704 1219Minimum 738 644 542 193 38 0 0 0 14 138 392 701
CDD Average 0 0 2 9 79 245 409 352 155 22 1 0Std. Dev. 0 0 5 11 47 66 71 65 42 21 2 0Maximum 0 0 20 34 230 401 540 470 244 83 6 0Minimum 0 0 0 0 9 133 283 268 90 0 0 0
33

Exhibit 3: Global Warming Trend
Global Warming Trend in Atlanta
0.00
20.00
40.00
60.00
80.00
100.00
1/1/79 12/31/82 12/30/86 12/29/90 12/28/94 12/27/98
Dai
ly T
empe
ratu
re (
Deg
rees
)
Exhibit 4: Standard Deviation of Date t's Temperature (Ãt)
2
6
10
14
18
1-Jan 14-Mar 26-May 7-Aug 19-Oct 31-Dec Date t
Deg
rees
Atlanta Chicago
Date t's Standard Deviation ( ψt )
34

Exhibit 5: Realized Temperatures in New YorkFor a Colder-Than-Normal Winter (November 1980 - March 1981)
Panel A: Date t's Mean Temperature (Y t) vs Realized Temperatures
0
20
40
60
80
100
9/23/79 1/1/80 4/10/80 7/19/80 10/27/80 2/4/81 5/15/81 8/23/81 12/1/81
Deg
rees
Realized Temperature Date t's Mean Temperature
Panel B: Date t's Adjusted Mean Temperature (bY t) vs Realized Temperatures
0
20
40
60
80
100
9/23/79 1/1/80 4/10/80 7/19/80 10/27/80 2/4/81 5/15/81 8/23/81 12/1/81
Deg
rees
Realized Temperature Date t's adjusted Mean Temperature
35

Exhibit 6: Maximum Likelihood Estimation Results
LR =
ρ 1 ρ 2 ρ 3 ρ 4 σ σ 1 φ Log - Likelihood 2ln(L 1 /L 2 )
Atlanta
0.8833 -0.3035 0.0322 7.5980 5.0912 -0.1881 ln(L 1 ) = -20,626 250 *
(0.01170) (0.01520) (0.01169) (0.12086) (0.14603) (0.01067)
0.9482 -0.3158 0.0760 0.0083 7.6565 5.0781 -0.1940 ln(L 2 ) = -20,751(0.01166) (0.01567) (0.01166) (0.01288) (0.12208) (0.14776) (0.01088)
Chicago
0.7989 -0.2570 0.0428 7.8289 3.1294 -0.2014 ln(L 1 ) = -23,130 268 *
(0.01170) (0.01467) (0.01170) (0.13922) (0.18181) (0.02316)
0.8619 -0.2697 0.1029 -0.0188 7.9315 3.1211 -0.1998 ln(L 2 ) = -23,264(0.01166) (0.01509) (0.01165) (0.01905) (0.14057) (0.18135) (0.02369)
Dallas
0.8158 -0.2436 0.0201 8.9378 6.3349 -0.1418 ln(L 1 ) = -21,381 258 *
(0.01170) (0.01483) (0.01170) (0.14060) (0.16800) (0.00953)
0.8711 -0.2482 0.0567 0.0162 9.0257 6.3488 -0.1497 ln(L 2 ) = -21,510(0.01168) (0.01522) (0.01167) (0.01267) (0.14175) (0.16936) (0.00970)
New York
0.7558 -0.2631 0.0463 6.5372 2.7035 -0.2432 ln(L 1 ) = -21,719 298 *
(0.01169) (0.01433) (0.01169) (0.11241) (0.14520) (0.02238)
0.8117 -0.2612 0.1007 -0.0071 6.7129 2.8152 -0.2420 ln(L 2 ) = -21,868(0.01166) (0.01472) (0.01166) (0.01374) (0.11510) (0.14831) (0.02201)
Philadelphia
0.7726 -0.2595 0.0473 6.9034 3.1654 -0.2015 ln(L 1 ) = -21,792 306 *
(0.01169) (0.01446) (0.01169) (0.11957) (0.15360) (0.01932)
0.8290 -0.2559 0.0973 0.0015 7.0545 3.2360 -0.2024 ln(L 2 ) = -21,945(0.01166) (0.01486) (0.01166) (0.01459) (0.12207) (0.15675) (0.01932)
Note: 1. The Estimated Systems:Uyr;t = ½1Uyr;t¡1 + ½2Uyr;t¡2 + ½3Uyr;t¡3 + ¾yr;t ¤ »yr;t (1)Uyr;t = ½1Uyr;t¡1 + ½2Uyr;t¡2 + ½3Uyr;t¡3 + ½4Uyr;t¡4 + ¾yr;t ¤ »yr;t (2)
with Uyr;t = Yyr;t ¡ bY yr;t; ¾yr;t = ¾ ¡ ¾1 j sin(¼t=365 + Á) j;»yr;t » i:i:d: N(0; 1); 8 yr = 1; 2; :::; 20 & t = 1; 2; :::; 365:
2. The numbers in the parentheses are standard errors.3. The null hypothesis (H0) is ½4 = 0. The likelihood ratio (LR) test is computed
as LR = 2 lnL 1 ¡ 2 lnL2 which is asymptotically distributed as Â2(1) under H0.4. The 1 percent critical level for Â2 with 1 degree of freedom is 6.6 and¤ indicates that the test statistic is signi¯cant.
36

Exhibit 7: Comparison of Forward Prices
Price Based on
Theoretical Price Based Theoretical Adjusted Avg.
Sample Model on Average Model Temperature
Average Price Temperature Price of 1998
(1) (2) (3) (4) (5)
CDD Season (May - September)
Atlanta 1812.00 1797.22 1777.95 1902.17 1893.41
Chicago 823.60 799.26 674.80 1002.25 858.24
Dallas 2424.55 2414.13 2405.65 3154.69 3153.45
New York 1181.80 1169.98 1101.80 1296.11 1226.85
Philadelphia 1239.75 1220.75 1149.35 1351.34 1286.41
HDD Season (November - March)
Atlanta 2419.47 2423.70 2396.95 2729.68 2715.65
Chicago 5114.37 5127.72 5126.15 4508.18 4506.00
Dallas 2179.21 2202.51 2141.05 2246.26 2192.98
New York 3859.63 3864.00 3862.35 3419.25 3417.25
Philadelphia 3901.00 3901.62 3899.75 3406.81 3404.08
Note: 1. Theoretical model prices are calculated based on ° = ¡0:5, Á = 0:0.2. When forecasts are the adjusted average temperatures, we use November,
and December of 1997 and the ¯rst three months of 1998 for HDD calculation.
37

Exhibit 8: Forward Prices for a CDD Season
Forecast γ = − 0.5 γ = − 1.0
Forward φ = − 0.2 φ = 0.2 φ = − 0.2 φ = 0.2
(1) (2) (3) = (4) (5) = (6) (7) = (8) (9) =
(2)/(1)-1 (4)/(1)-1 (6)/(1)-1 (8)/(1)-1
Panel A: Forecast is Historical Average
Atlanta 1777.95 1779.02 0.06% 1776.86 -0.06% 1780.06 0.12% 1775.86 -0.12%
Chicago 674.80 675.93 0.17% 673.63 -0.17% 676.98 0.32% 672.41 -0.35%
Dallas 2405.65 2406.75 0.05% 2404.52 -0.05% 2407.86 0.09% 2403.57 -0.09%
New York 1101.80 1102.85 0.10% 1100.72 -0.10% 1103.82 0.18% 1099.65 -0.19%
Philadelphia 1149.35 1150.45 0.10% 1148.22 -0.10% 1151.48 0.19% 1147.09 -0.20%
Panel B: Forecast is Adjusted Historical Average of 1998
Atlanta 1893.41 1894.51 0.06% 1892.29 -0.06% 1895.58 0.11% 1891.28 -0.11%
Chicago 858.24 859.58 0.16% 856.85 -0.16% 860.81 0.30% 855.41 -0.33%
Dallas 3153.45 3154.56 0.04% 3152.31 -0.04% 3155.72 0.07% 3151.45 -0.06%
New York 1226.85 1227.95 0.09% 1225.72 -0.09% 1228.98 0.17% 1224.62 -0.18%
Philadelphia 1286.41 1287.59 0.09% 1285.20 -0.09% 1288.69 0.18% 1284.02 -0.19%
Note: 1. \Forecast Forward" prices are the CDD values implied in the forecasts.2. Forward prices under di®erent parameter combinations are calculated by making an
adjustment to each path of the simulated CDD so that when the correlation is zero,the model always gives the forecast forward price. See the text for details.
38

Exhibit 9: Option Prices for a CDD Season
γ = - 0.5 γ = - 0.5 γ = - 1.0
Historical Simulation φ = 0.0 φ = - 0.2 φ = 0.2 φ = - 0.2 φ = 0.2
Strike Option Strike Option Option % Option % Option % Option %
Price Value Price Value Value (6) = Value (8) = Value (10) = Value (12) =
(1) (2) (3) (4) (5) (5)/(4) - 1 (7) (7)/(4) - 1 (9) (9)/(4) - 1 (11) (11)/(4) - 1
Panel A: Forecast is Historical Average
1812.00 87.62 1777.95 33.16 33.70 1.62% 32.64 -1.59% 34.17 3.04% 32.05 -3.36%
87.62 33.44 32.91 -1.59% 33.97 1.59% 32.46 -2.93% 34.59 3.45%
823.60 84.88 674.80 39.25 39.82 1.46% 38.68 -1.44% 40.32 2.73% 38.05 -3.05%
84.88 39.37 38.83 -1.38% 39.92 1.39% 38.36 -2.58% 40.54 2.96%
2424.55 86.02 2405.65 34.35 34.91 1.62% 33.81 -1.59% 35.40 3.04% 33.20 -3.36%
86.02 34.72 34.17 -1.59% 35.28 1.60% 33.70 -2.96% 35.92 3.44%
1181.80 57.72 1101.80 34.31 34.84 1.53% 33.79 -1.51% 35.29 2.87% 33.21 -3.20%
57.72 34.49 33.98 -1.48% 35.00 1.49% 33.55 -2.74% 35.60 3.22%
1239.75 80.29 1149.35 35.70 36.26 1.55% 35.16 -1.52% 36.74 2.90% 34.55 -3.22%
80.29 35.89 35.35 -1.50% 36.43 1.50% 34.90 -2.77% 37.06 3.25%
Panel B: Forecast is Adjusted Historical Average of 1998
1812.00 87.62 1893.41 33.95 86.88 85.10 87.66 84.10
87.62 34.24 8.24 8.64 8.06 8.87
823.60 84.88 858.24 43.61 62.81 61.15 63.53 60.22
84.88 43.76 28.52 29.50 28.09 30.07
2424.55 86.02 3153.45 35.01 697.57 695.34 698.59 694.17
86.02 35.50 0.00 0.00 0.00 0.00
1181.80 57.72 1226.85 35.23 61.47 59.97 62.12 59.14
57.72 35.43 17.51 18.18 17.22 18.57
1239.75 80.29 1286.41 37.17 64.31 62.72 65.00 61.83
80.29 37.38 18.74 19.47 18.43 19.89
Note: Under \Historical Simulation", we assume that the future will mimic history exactlyaccording to the sample data. The strike prices are the historical average CDD's.For all other simulations, in Panel A, the strike prices are reported under theheading \° = ¡0:5, Á = 0:0". They are the CDD's implied in the forecasts. InPanel B, the option prices under \° = ¡0:5, Á = 0:0" are based on the strike pricesreported under the same heading; but for other option prices, the stirke prices arethose reported under \Historical Simulation".
39

Exhibit 10: Forward Prices for an HDD Season
Forecast γ = - 0.5 γ = - 1.0
Forward φ = − 0.2 φ = 0.2 φ = − 0.2 φ = 0.2
(1) (2) (3) = (4) (5) = (6) (7) = (8) (9) =
(2)/(1)-1 (4)/(1)-1 (6)/(1)-1 (8)/(1)-1
Panel A: Forecast is Historical Average
Atlanta 2396.95 2394.44 -0.10% 2399.43 0.10% 2391.60 -0.22% 2402.25 0.22%
Chicago 5126.15 5123.18 -0.06% 5129.09 0.06% 5118.98 -0.14% 5132.22 0.12%
Dallas 2141.05 2138.41 -0.12% 2143.64 0.12% 2135.59 -0.26% 2146.63 0.26%
New York 3862.35 3860.13 -0.06% 3864.55 0.06% 3856.99 -0.14% 3866.88 0.12%
Philadelphia 3899.75 3897.35 -0.06% 3902.13 0.06% 3894.05 -0.15% 3904.67 0.13%
Panel B: Forecast is Adjusted Historical Average of 1998
Atlanta 2715.65 2713.07 -0.10% 2718.20 0.09% 2710.07 -0.21% 2721.09 0.20%
Chicago 4506.00 4503.07 -0.06% 4508.90 0.06% 4499.15 -0.15% 4512.03 0.13%
Dallas 2192.98 2190.32 -0.12% 2195.60 0.12% 2187.45 -0.25% 2198.61 0.26%
New York 3417.25 3415.06 -0.06% 3419.41 0.06% 3412.11 -0.15% 3421.75 0.13%
Philadelphia 3404.08 3401.72 -0.07% 3406.42 0.07% 3398.63 -0.16% 3408.97 0.14%
Note: 1. \Forecast Forward" prices are the HDD values implied in the forecasts.2. When forecasts are the adjusted average temperatures, we use November
and December of 1997 and the ¯rst three months of 1998.3. Forward prices under di®erent parameter combinations are calculated by making an
adjustment to each path of the simulated HDD so that when the correlation is zero,the model always gives the forecast forward price. See the text for details.
40

Exhibit 11: Option Prices for an HDD Season
γ = - 0.5 γ = - 0.5 γ = - 1.0
Historical Simulation φ = 0.0 φ = - 0.2 φ = 0.2 φ = - 0.2 φ = 0.2
Strike Option Strike Option Option % Option % Option % Option %
Price Value Price Value Value (6) = Value (8) = Value (10) = Value (12) =
(1) (2) (3) (4) (5) (5)/(4) - 1 (7) (7)/(4) - 1 (9) (9)/(4) - 1 (11) (11)/(4) - 1
Panel A: Forecast is Historical Average
Atlanta Call 2419.47 108.78 2396.95 68.44 67.35 -1.59% 69.53 1.59% 66.48 -2.87% 70.86 3.54%
Put 108.78 68.74 69.82 1.58% 67.67 -1.55% 70.63 2.75% 66.35 -3.47%
Chicago Call 5114.37 144.22 5126.15 74.96 73.76 -1.61% 76.17 1.61% 72.79 -2.89% 77.65 3.59%
Put 144.23 75.59 76.81 1.61% 74.40 -1.58% 77.71 2.80% 72.91 -3.55%
Dallas Call 2179.21 60.40 2141.05 73.17 72.01 -1.58% 74.33 1.59% 71.08 -2.85% 75.74 3.51%
Put 60.40 73.44 74.58 1.55% 72.32 -1.52% 75.42 2.70% 70.93 -3.42%
New York Call 3859.63 105.53 3862.35 55.97 55.07 -1.61% 56.87 1.61% 54.35 -2.89% 57.97 3.58%
Put 105.53 56.44 57.35 1.61% 55.55 -1.58% 58.02 2.79% 54.44 -3.54%
Philadelphia Call 3901.00 109.67 3899.75 61.14 60.16 -1.61% 62.12 1.61% 59.37 -2.89% 63.33 3.58%
Put 109.67 61.62 62.61 1.61% 60.65 -1.58% 63.34 2.80% 59.44 -3.54%
Panel B: Forecast is Adjusted Historical Average of 1997 / 1998
Atlanta Call 2419.47 108.78 2715.65 69.32 276.48 280.69 274.75 283.24
Put 108.78 69.65 4.24 3.99 4.33 3.84
Chicago Call 5114.37 144.22 4506.00 74.88 0.08 0.09 0.08 0.09
Put 144.23 75.43 567.50 562.76 569.12 559.80
Dallas Call 2179.21 60.40 2192.98 73.29 78.55 81.01 77.56 82.51
Put 60.40 73.57 68.37 66.22 69.17 64.89
New York Call 3859.63 105.53 3417.25 55.93 0.07 0.08 0.07 0.09
Put 105.53 56.35 412.74 409.21 413.95 407.00
Philadelphia Call 3901.00 109.67 3404.08 61.03 0.06 0.07 0.06 0.07
Put 109.67 61.45 463.50 459.64 464.81 457.23
Note: 1. Under \Historical Simulation", we assume that the future will mimic history exactlyaccording to the sample data. The strike prices are the historical average HDD's.For all other simulations, in Panel A, the strike prices are reported under theheading \° = ¡0:5, Á = 0:0". They are the HDD's implied in the forecasts. InPanel B, the option prices under \° = ¡0:5, Á = 0:0" are based on the strikeprices reported under the same heading; but for other option prices, the stirkeprices are those reported under \Historical Simulation".
2. When forecasts are adjusted average temperature, we use November andDecember of 1997 and the ¯rst three months of 1998.
41

Exhibit 12: Option Prices for Monthly Contracts
ATLANTA NEW YORK
γ = -0.5 γ = -0.5
Historical Simulation φ = - 0.2 φ = 0.2 Historical Simulation φ = - 0.2 φ = 0.2
Strike Option Strike Option Option Strike Option Strike Option Option
Price Value Price Value Value Price Value Price Value Value
Panel A: Months of a CDD Season
May Call 197.60 25.48 176.30 16.16 15.92 62.70 14.63 24.50 9.78 9.65
Put 25.48 15.97 16.20 14.63 9.68 9.78
June Call 384.90 25.72 383.70 15.23 15.01 223.90 20.58 210.80 16.71 16.47
Put 25.67 15.12 15.34 20.53 16.54 16.77
July Call 502.10 26.33 502.20 13.54 13.34 391.90 21.39 391.60 17.27 17.02
Put 26.28 13.44 13.64 21.34 17.10 17.35
August Call 452.10 24.70 451.50 14.19 13.99 350.10 21.24 348.90 17.41 17.16
Put 24.75 14.03 14.23 21.19 17.20 17.45
September Call 275.20 20.44 264.30 15.17 14.96 153.10 14.01 126.10 14.05 13.85
Put 20.39 15.00 15.21 14.06 13.88 14.06
Panel B: Months of a HDD Season
January Call 679.10 53.33 678.90 39.25 39.83 987.90 56.82 987.90 29.13 29.56
Put 53.33 39.76 39.19 56.82 29.46 29.04
February Call 493.00 33.07 491.50 33.84 34.33 837.60 46.20 837.60 27.37 27.76
Put 33.07 34.48 34.00 46.15 28.03 27.63
March Call 327.70 35.37 313.40 27.06 27.46 702.50 31.77 701.40 25.31 25.68
Put 35.37 27.53 27.14 31.82 25.85 25.47
November Call 336.40 36.35 328.30 23.45 23.79 512.50 26.95 511.40 21.31 21.62
Put 36.30 23.84 23.50 26.95 21.70 21.39
December Call 586.40 48.97 584.90 31.08 31.52 824.10 49.49 824.00 24.56 24.90
Put 48.97 31.56 31.13 49.49 24.96 24.62
Note: 1. Under \Historical Simulation", we assume that the future will mimic history exactlyaccording to the sample data. The strike prices are the historical average CDD's orHDD's. The stirke prices for all other simulations are reported under the heading\° = ¡0:5". They are the CDD's or HDD's implied in the forecasts.
2. In this table, the forecasts are historical average temperature.
42