Embed Size (px)
Citation preview

Promoting and improving patient safety and health service quality across Alberta.
PRIMARY CARE MEASUREMENT INITIATIVE
March 2014


TABLE OF CONTENTS
EXECUTIVE SUMMARY ............................................................................................................................. 3 INTRODUCTION ......................................................................................................................................... 4
Primary care ........................................................................................................................................... 4 Primary care in Alberta .......................................................................................................................... 6 Measuring the impact of primary care on the health system ................................................................. 7 Current measurement infrastructure for primary care in Alberta ............................................................ 8
THE HQCA PRIMARY CARE MEASUREMENT INITIATIVE ...................................................................... 9 Methods overview .................................................................................................................................. 9 Findings ............................................................................................................................................... 10 Discussion ............................................................................................................................................ 18 Limitations ............................................................................................................................................ 18 Opportunities for improvement ............................................................................................................. 20
CONCLUSION ........................................................................................................................................... 23 APPENDICES ............................................................................................................................................ 24 APPENDIX A: DETAILED METHODS ....................................................................................................... 25 APPENDIX B: THE HQCA PANEL SELECTION ALGORITHM ................................................................ 32 APPENDIX C: COMPARISON OF PCN AND NON-PCN PATIENTS ....................................................... 36 APPENDIX D: HEALTHCARE SERVICE UTILIZATION RATES FOR HIGH- AND LOW-ATTACHED PCN PATIENTS BY BURDEN OF ILLNESS CATEGORY ................................................................................ 42 APPENDIX E: VARIATION BETWEEN PCNS IN HEALTHCARE SERVICE UTILIZATION OF THEIR PATIENTS ................................................................................................................................................. 45 APPENDIX F: FOUR-CUT METHOD FOR ASSIGNING PATIENTS TO A FP PANEL ............................ 48 APPENDIX G. CLINICAL RISK GROUPER (CRG) CLASSIFICATION DESCRIPTIONS ........................ 49 REFERENCES .......................................................................................................................................... 51


EXECUTIVE SUMMARY 3
EXECUTIVE SUMMARY
The Health Quality Council of Alberta (HQCA) undertook a measurement initiative in 2010 to understand the impact that primary care networks (PCNs) were having on Alberta’s healthcare system. PCNs were introduced in Alberta to improve access to primary care and health outcomes of Albertans. Between 2003 and 2013, Alberta invested more than $870 million in the PCN program, exclusive of other primary healthcare innovations, with the intent of improving the health of Albertans.
Alberta Health, the Alberta Medical Association (AMA), and the former nine health regions in Alberta established the Primary Care Initiative (PCI) in 2003 to develop PCNs and support them to:
§ Increase the proportion of residents with ready access to primary care.
§ Provide coordinated 24-‐hour, 7-‐day-‐per-‐week access to appropriate primary care services.
§ Increase the emphasis on health promotion, disease and injury prevention, and care of medically complex patients and those with chronic diseases.
§ Improve coordination and integration with other healthcare services including secondary, tertiary and long-‐term care.
§ Facilitate the greater use of multi-‐disciplinary teams to provide comprehensive primary care.
Using administrative data, the HQCA determined through its measurement initiative that:
1. Physician attachment substantially impacts healthcare service resource utilization. Overall, patients who consistently see the same family physician over a period of time utilize less acute care services (emergency department visits and hospitalizations).
2. Acute care services decreased in most patient populations after the patients’ involvement with a PCN, while visits to family physicians increased.
3. Conclusions about the performance of individual PCNs should not be drawn based only on a comparison of healthcare service utilization of their patients. There are differences between PCNs that cannot be controlled and accounted for with the currently available province-‐wide data.
4. Conclusions about the impact of PCNs should not be drawn based on a comparison of PCN and non-‐PCN patients. These two populations differ substantially on characteristics known to influence utilization of healthcare services: age, gender, burden of illness and physician attachment.
Currently, province-‐wide data is insufficient to effectively measure the overall performance and quality of primary healthcare in Alberta. Further work is required to understand the impact of PCNs and primary healthcare on Alberta’s healthcare system.

INTRODUCTION 4
INTRODUCTION
Primary care
Primary care refers to the level of the health system that provides person-‐focused care over time for prevention and treatment of common health problems, first contact access for new health problems, and coordination of care with other levels of service (e.g., hospital, speciality care, continuing care).1 Traditionally primary care is organized around healthcare services provided by a primary care physician (family physician -‐ FP), often working in collaboration with other healthcare providers to meet a broad spectrum of patient health needs. Services typically include: health and wellness promotion; disease and injury prevention; diagnosis and treatment of short-‐term acute health issues; referral of more complex issues; ongoing management of chronic conditions; and, coordination with other levels of care. Primary healthcare encompasses a range of additional services and models of care that rely on other healthcare professionals and non-‐medical healthcare providers, and it places a greater emphasis on factors influencing health, such as addressing social determinants of health by connecting people with social supports that influence their health status.2,3 Improving delivery of primary healthcare services is the goal of primary care reform. This report focuses on the primary care system in Alberta that is organized around the family physician (FP) but has been in transition to a more comprehensive primary healthcare system since the introduction of primary care networks in 2003.
There has been a considerable amount of research into the effects of primary care on health and the health system. A literature review that considered research from both the United States and internationally found:4
§ A consistent association between access to primary care and improved health outcomes as measured by all-‐cause mortality, heart disease mortality, stroke mortality, infant mortality, infant low birth weight, life expectancy, and self-‐rated health.
§ An association between greater access to primary care physicians and preventive care that is either general (e.g., breast-‐feeding, smoking cessation, physical activity, healthy eating) or disease-‐focused (e.g., early detection of common cancers such as breast, colon, cervical, and melanoma).
§ An association between higher ratios of primary care physicians to population and reductions in disparities in health across racial and socioeconomic groups, which was consistent across all types of studies.
§ Lower overall healthcare costs and generally better health outcomes in countries with strong primary healthcare systems. In the United States, lower total healthcare costs were seen in areas with higher ratios of primary care physicians to population. Primary care was consistently associated with lower rates of hospitalization for conditions that should be preventable by exposure to primary care (e.g., ambulatory care-‐sensitive conditions). In addition, care for illnesses common in the population was less costly when patients were cared for by a primary care physician compared to a specialist.
§ Primary care physicians to be as effective as specialists in caring for specific common diseases, particularly when overall health rather than condition-‐specific

INTRODUCTION 5
measures are considered. Person-‐focused rather than disease-‐focused care is important for patients who have multiple conditions.
A relationship over time between a patient and a FP is one distinguishing feature of primary care.5 Studies have shown that an ongoing relationship (referred to as interpersonal or relational continuity) between a patient and their mutually agreed-‐upon FP results in better recognition of the patient’s problems and needs, more accurate diagnosis, better preventive care, better compliance with appointments and treatment advice, fewer unmet needs, and greater patient satisfaction.1,5 Benefits to the health system include better preventive care and chronic illness management, fewer emergency department visits and hospitalizations, as well as a reduction in overall costs of care.1,6,7 At least two to five years of ongoing care is required for a patient and their FP to build the trusting, personal relationship that is required to provide optimal person-‐focused care.4
In addition to continuity of the physician-‐patient relationship (relational continuity), three other types of continuity are relevant to primary care.5,8
1. Informational continuity, in which knowledge of the patient (preferences, values, context) and his disease is communicated among and considered by all care providers as a bridge between separate care events;
2. Longitudinal continuity, in which the patient consistently receives care over time in an accessible and familiar environment from an organized team of providers.5
3. Management continuity, in which care is coordinated among several providers using shared management plans or care protocols in a way that is both consistent and flexible to meet patient needs.8
These different types of continuity are all features of the ‘medical home’ which is a central organizing concept and structure for primary care reform in the United States and Canada. In Canada, the features of a patient’s medical home include:9
§ a personal FP for each patient
§ care that is person-‐focused rather than disease-‐focused
§ care that is coordinated, comprehensive and supported by an interdisciplinary team
§ timely access to appointments for patients
§ electronic medical record support
§ ongoing attention to quality improvement and patient safety
Research suggests that when patients identify a relationship with a particular place where they receive their primary care (i.e., longitudinal continuity), the rate of missed appointments is lower, there is better preventive care, and fewer unmet patient needs.1 There is also a reduction in hospitalizations although to a lesser degree than that seen with a strong patient-‐FP relationship.1 Attachment to a practice is inversely related to total cost of care for higher-‐needs patients with congestive heart failure and diabetes.6 Patients who consistently attended a single primary care clinic (medical home) as compared with those who received care from various medical groups within the same health plan had lower levels of health system utilization and cost.10 Likewise, complex patients attending clinics with a high degree of medical home attributes (including a number of interpersonal continuity attributes), were shown to

INTRODUCTION 6
have significantly lower total costs than clinics with a low degree of medical home attributes.11 A review of medical home literature suggests that this model of primary care yields improved quality, reduced errors, and improved patient satisfaction.12 Because an ongoing relationship between a patient and a personal FP is the first principle of the patient’s medical home model,9 it can be difficult to separate the effect of the continuity of the relationship between the patient and their primary care provider from the effect of the medical home model.
An FP panel is the list of unique patients that have an established relationship with a FP, and to whom the FP is considered responsible for providing primary care services.13,14 An ongoing process for panel management is a key component of the patient’s medical home model. Validation of panels requires both the physician and patient to agree on who is the most responsible FP for the patient’s care. The validation process reflects at least a tacit, if not explicit (some practices require patients to sign an agreement with their FP), social contract between the patient and their FP related to the provision of healthcare.14 The process of establishing and maintaining a validated patient panel by the FP and their staff is challenging and time-‐consuming but most who have established a panel management process recognize that it is important for both patient care and quality improvement activities.15
Primary care in Alberta
In 2003, Alberta Health, the Alberta Medical Association (AMA), and the former nine health regions in Alberta established the Primary Care Initiative (PCI) to improve access to primary healthcare in Alberta. The purpose of the PCI was to develop primary care networks (PCNs) and support them in meeting the following objectives:16
§ Increase the proportion of residents with ready access to primary care.
§ Provide coordinated 24-‐hour, 7-‐day-‐per-‐week management of access to appropriate primary care services.
§ Increase the emphasis on health promotion, disease and injury prevention, care of the medically complex patient and patients with chronic diseases.
§ Improve coordination and integration with other health care services including secondary, tertiary and long-‐term care through specialty care linkages to primary care.
§ Facilitate the greater use of multi-‐disciplinary teams to provide comprehensive primary care.
A PCN is comprised of a group of FPs and other healthcare providers who coordinate healthcare services for patients in their geographic area. The PCN can be a single clinic with a number of FPs, health professionals and support staff, or a group of several clinics with multiple FPs, health professionals and support staff from across a geographic area. Each PCN is unique and has the flexibility to develop programs and services suitable for the specific needs of the PCN patient population. This grassroots approach allows local cooperation among the PCN, the healthcare professionals that work within it, and Alberta Health Services (AHS) to determine how best to meet the needs of the PCN’s patient population while working within the provincial PCI framework. The PCN concept includes many of the features of a patient’s medical home and represents a transition from a traditional primary care model to the broader scope of primary healthcare.

INTRODUCTION 7
As of April 2012, there were over 2,600 FPs working within 40 PCNs to deliver primary care services to 2.9 million Albertans in communities across the province.17 It is estimated that 86% of Albertans who were covered by the Alberta Healthcare Insurance Plan (AHCIP) and living in Alberta on March 31, 2010 were linked to a PCN.
Alberta has invested more than $870 million in the PCN program since its inception,17 but has also invested in a variety of other primary healthcare innovations and reforms over the same period. These include chronic disease management programs, the Access Improvement Measures (AIM) collaborative,18 the Physician Office System Program (POSP)16 and most recently Family Care Clinics (FCCs).19 Evaluation of the impact of PCNs is challenging due to the changing environment of primary healthcare and the difficulty of controlling for the many initiatives that were introduced while PCNs were developing.
Measuring the impact of primary care on the health system
In evaluating primary care, it is important to consider what the most important functions of primary care are within the larger health system.20 Starfield identified a conceptual framework for assessing the impact of primary care on the health system by considering how its structure/capacity and process/performance influences health outcomes. This approach assumes that structural attributes are in place to meet the demand for the primary care activities required by the target patient population.20 Measures related to structure, capacity, process, performance and health outcomes are all required to draw conclusions about primary care. The clinical value compass is an approach to measuring outcomes of healthcare which recommends measures to capture patient functional status, risk status and well-‐being; patient satisfaction with healthcare and perceived benefit; clinical outcomes; and cost.21 The clinical value compass approach acknowledges that different stakeholders value different outcomes of medical care, therefore performance outcomes of interest to different stakeholders in the primary care system (patients, clinicians, managers, policy makers) need to be considered.
In 2012 the Auditor General of Alberta conducted an audit to determine whether systems were in place to demonstrate the value that Albertans are receiving from the investment in PCNs. The Auditor’s report mentioned many of the elements for primary care measurement identified in the Starfield framework. The report noted that a healthcare system requires:17
§ Clear definitions of service delivery expectations, measures and targets.
§ Systems to measure and manage costs, activities, outputs and outcomes.
§ Systems to report on program performance.
The report also noted that a system for measuring and managing primary care performance requires activities at three levels:17
1. The clinical level, to measure the impact on individual patients of individual programs. This relates to the performance outcomes of interest identified by the clinical value compass.
2. The PCN level, to measure factors under control of the PCN such as management and clinical decisions related to volume, type, and quality of programs that support the care provided to patients in their area. These relate to the structure, capacity and process measures in Starfield’s framework.

INTRODUCTION 8
3. The PCI program level, to measure the success of the program in relation to its core objectives and its impact on the healthcare system as a whole.
In summary, effective program evaluation in primary care requires information on:
§ Inputs (e.g., cost of services, patient population and their needs and demands).
§ Processes and activities at the clinic and PCN level (e.g., use of electronic medical records, disease registries, care provided by other healthcare professionals, programs and services provided, hours of operation, compliance with good clinical practices such as screening and chronic disease management guidelines).
§ Outcomes at many levels (e.g., utilization of healthcare services, health outcomes including patient self-‐assessed outcomes, patient satisfaction, costs over time).17
Current measurement infrastructure for primary care in Alberta
Currently in Alberta there are two main sources of data that might be used to measure the impact of primary care: administrative datasets and electronic medical records (EMR) used by physicians in their clinics to provide care to their patients.
§ Administrative datasets include physician claims data, ambulatory care (urgent care and emergency department) visits, hospitalizations and inpatient hospital stays, laboratory and diagnostic imaging reports, and medications dispensed in community pharmacies. The patient provincial health number (PHN) is used to link data from the various databases. Because much of the information available in administrative datasets is not designed or intended for program evaluation at the health system level, it can be difficult to infer health system effects of a program like the PCI.
§ When used to its full capability, an EMR includes information on scheduling and billing, services provided to patients, and detailed encounter information about patients, such as patient demographics, allergies, medical history, encounter summaries, and laboratory test histories.22 The EMR is potentially a source of direct information about patients, the kinds of services they are receiving from their FP and PCN, and clinical outcomes of their care. In Alberta it is estimated that approximately 70 to 80 per cent of physicians are using an EMR in their practice in some capacity; it is unknown how many are using the full capability of the EMR.23

THE HQCA PRIMARY CARE MEASUREMENT INITIATIVE 9
THE HQCA PRIMARY CARE MEASUREMENT INITIATIVE
In 2010, the HQCA embarked on a primary care measurement initiative using administrative data to determine what could be learned about the impact of PCNs on the health system. The initiative consisted of three measurement activities:
§ Comparison of PCN to non-‐PCN patients on characteristics known to influence healthcare service utilization.
§ Comparison of healthcare service utilization by patients before and after their involvement with a PCN.
§ Comparison of patients’ healthcare service utilization rates between PCNs which had been in place for at least three years by the end of the 2009-‐10 fiscal year.
Methods overview
An overview of the methods for the three measurement activities in this initiative is provided below. A more detailed methodology can be found in Appendix A. Additional information is available upon request from the HQCA.
Comparison of PCN to non-PCN patients
Using data from the 2009-‐10 fiscal year, patients linked to a PCN were compared to patients not linked to a PCN on the following characteristics known to influence healthcare service utilization:
§ age24,25
§ gender26,27
§ treated prevalence of chronic conditions and mental illness
§ burden of illness28,29 (patients were assigned a classification score based on 3M’s clinical risk grouper)30 (Appendix G)
§ degree of attachment (an HQCA-‐developed measure that was used as a proxy for relational continuity between a patient and a single most responsible FP)1,5,6,7
In Alberta, few FPs have validated patient lists and therefore patients were linked to a PCN using administrative data. Patients were linked to a PCN by assigning them to an FP using a decision algorithm (Appendix B) to determine the FP most likely to be their main primary care provider. They were then linked to a PCN based on information from Alberta Health about which PCN the FP worked in.
Comparison of healthcare service utilization by patients before and after their involvement with a PCN
This analysis focused on the patients linked with the 19 PCNs that had been in operation for 36 months or more by the end of the 2009-‐10 fiscal year (1,749,947 patients). It examined the contribution of degree of attachment and burden of illness to utilization of selected healthcare services (FP visits, emergency department visits, hospitalizations) in the three years before and after the patients’ involvement with the PCN. It was assumed that an effect of the PCN would be most evident for patients who consistently saw the same FP for most of their FP visits

THE HQCA PRIMARY CARE MEASUREMENT INITIATIVE 10
Comparison of patients’ healthcare service utilization rates between PCNs
This analysis compared the 19 PCNs on patients’ utilization of selected healthcare services (FP visits, emergency department visits, hospitalizations) in the 36 months before and after the patient’s involvement with a PCN.
Findings
Throughout the findings, statistically significant results (p<0.05) are referenced as “significant”.
Comparison of PCN to non-PCN patients
Overall, there were significant differences found between PCN and non-‐PCN patients for all patient characteristics analysed: age, gender, burden of illness and degree of attachment. A summary of the findings is presented below. Figures illustrating the results can be found in Appendix C.
Age: PCN patients were significantly older than non-‐PCN patients, with an average age of 37.5 years compared to 34.0 years for non-‐PCN patients. The PCN group had more patients over 60 years of age (15.9% of PCN patients compared to 12.2% of non-‐PCN patients) and fewer patients less than 21 years of age (24.6% of PCN patients versus 32.2% of non-‐PCN patients).
Gender: Women comprised a significantly greater proportion of PCN patients (52.5%) compared to non-‐PCN patients (42.2%).
Burden of illness, chronic conditions and mental illness: Compared to the non-‐PCN group, there were significantly more PCN patients in the minor chronic condition and severe chronic condition categories. Compared to the non-‐PCN group, there were significantly more PCN patients with common chronic conditions and mental illnesses. The most frequent ten diagnoses were significantly different between the two groups.
Degree of attachment: PCN patients had a significantly higher degree of attachment to the FP assigned to them by the HQCA proxy panel algorithm than non-‐PCN patients. On average, PCN patients saw their assigned FP for 69.1% of all FP visits compared to 47.4% for non-‐PCN patients.
Comparison of healthcare service utilization by patients before and after their FP joined a PCN
Change in healthcare service utilization rates
There was a significant change in utilization of healthcare services in almost all patient groups after their involvement with a PCN (Appendix D). Emergency department visits (Figure 1) and hospitalizations (Figure 2) were reduced in most of the high-‐attached patient groups (patients who saw the same FP for at least 80% of their FP visits) but not for the low-‐attached patient groups (patients who saw the same FP for 50% or fewer of their FP visits). There was an increase in FP visits (Figure 3) in all patient groups.

HQCA PRIMARY CARE MEASUREMENT INITIATIVE 11
Figure 1 shows that in the three-‐year period after patients’ involvement with a PCN there was a significant reduction in ED visits for all high-‐attached patient groups compared to the three-‐year period before PCN involvement. There was a greater reduction in ED visits in the healthy and minor chronic condition groups compared to the severe chronic condition group.
Figure 1: Change in adjusted ED visits for PCN patients before and after their involvement with a
PCN
Note: Visit rates are adjusted (adj.) for age, gender.
Healthy High-‐
a,ached
Healthy Low-‐
a,ached
Minor chronic condi5on High-‐
a,ached
Minor chronic condi5on Low-‐
a,ached
Severe chronic condi5on High-‐
a,ached
Severe chronic condi5on Low-‐
a,ached Change in visits -‐16,000 12,000 -‐14,000 25,000 -‐5,000 64,000
-‐20,000
0
20,000
40,000
60,000
80,000
Chan
ge in ED Ad
j. Visits Per 100
,000
Pa7
ents

HQCA PRIMARY CARE MEASUREMENT INITIATIVE 12
Figure 2 shows that the number of hospitalizations decreased for patients in the healthy and minor chronic condition groups after their involvement with a PCN, with a significantly greater decrease in the high-‐attached patient groups. Hospitalizations for patients in the severe chronic conditions group increased, but the increase was significantly less for the high-‐attached as compared to the low-‐attached.
Figure 2: Change in adjusted hospitalizations for PCN patients before and after their involvement
with a PCN
Note: Hospitalization rates are adjusted (adj.) for age, gender.
Healthy High-‐
a,ached
Healthy Low-‐
a,ached
Minor chronic condi5on High-‐
a,ached
Minor chronic condi5on
Low a,ached
Severe chronic condi5on High-‐
a,ached
Severe chronic condi5on Low-‐
a,ached Change in Adj. Visits -‐5,000 -‐3,000 -‐4,000 -‐2,000 4,000 8,000
-‐7,500
-‐5,000
-‐2,500
0
2,500
5,000
7,500
10,000
Chan
ge in Adj. H
opsitaliza7
ons P
er 100
,000
Pa7
ents

HQCA PRIMARY CARE MEASUREMENT INITIATIVE 13
Figure 3 shows an increase in FP visits in all groups in the three year period after patients’ involvement with PCNs compared to the three year period before.
Figure 3: Change in adjusted FP visits for PCN patients before and after their involvement with a PCN
Note: Visit rates are adjusted (adj.) for age, gender.
Healthy High-‐
a,ached
Healthy Low-‐
a,ached
Minor chronic condi5on High-‐
a,ached
Minor chronic condi5on Low-‐
a,ached
Severe chronic condi5on High-‐
a,ached
Severe chronic condi5on Low-‐
a,ached Change in adj. visits 4,000 93,000 120,000 252,000 351,000 350,000
0
100,000
200,000
300,000
400,000
Chan
ge in Adj. FP Visits Per 100
,000
Pa7
ents
HQCA PRIMARY CARE MEASUREMENT INITIATIVE 14
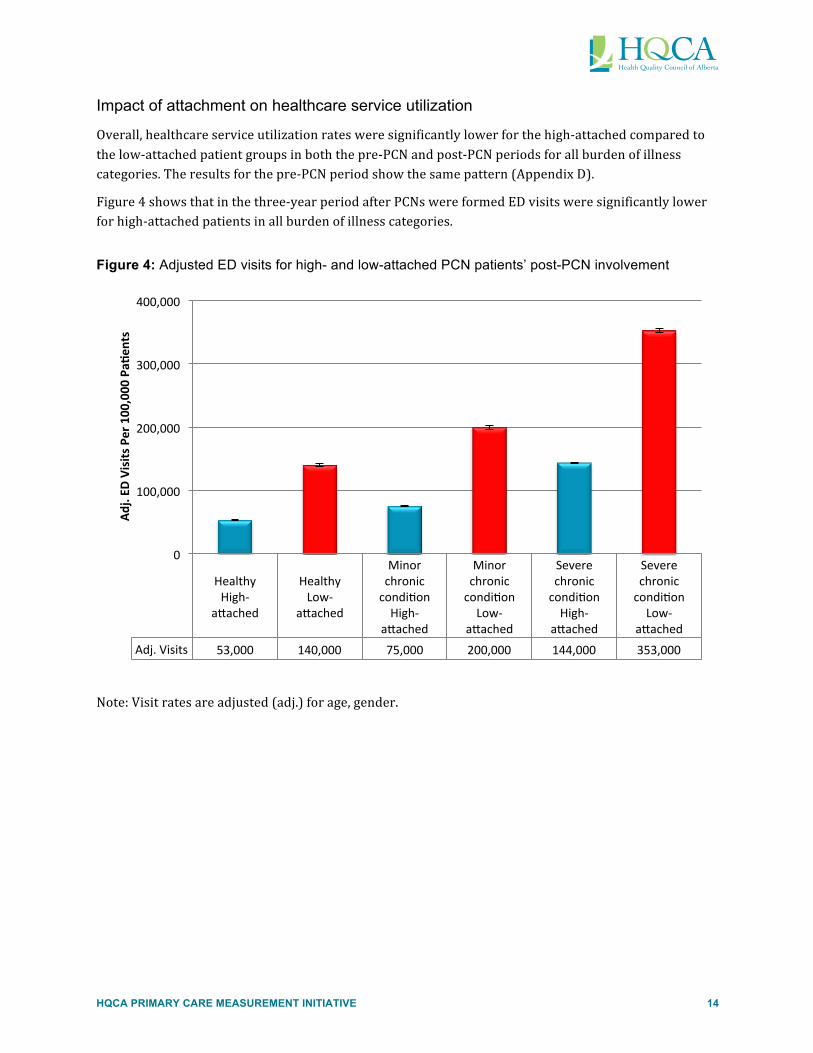
Impact of attachment on healthcare service utilization
Overall, healthcare service utilization rates were significantly lower for the high-‐attached compared to the low-‐attached patient groups in both the pre-‐PCN and post-‐PCN periods for all burden of illness categories. The results for the pre-‐PCN period show the same pattern (Appendix D).
Figure 4 shows that in the three-‐year period after PCNs were formed ED visits were significantly lower for high-‐attached patients in all burden of illness categories.
Figure 4: Adjusted ED visits for high- and low-attached PCN patients’ post-PCN involvement
Note: Visit rates are adjusted (adj.) for age, gender.
Healthy High-‐
a,ached
Healthy Low-‐
a,ached
Minor chronic condi5on High-‐
a,ached
Minor chronic condi5on Low-‐
a,ached
Severe chronic condi5on High-‐
a,ached
Severe chronic condi5on Low-‐
a,ached Adj. Visits 53,000 140,000 75,000 200,000 144,000 353,000
0
100,000
200,000
300,000
400,000
Adj. ED
Visits Per 100
,000
Pa7
ents

HQCA PRIMARY CARE MEASUREMENT INITIATIVE 15
Figure 5 shows that in the three year period after patients’ involvement with a PCN, there were fewer hospitalizations in the high-‐attached patient group in all burden of illness categories compared to the low-‐attached patient group.
Figure 5: Adjusted hospitalizations for high- and low-attached PCN patients’ post-PCN involvement
Note: Visit rates are adjusted (adj.) for age, gender.
Healthy High-‐
a,ached
Healthy Low-‐
a,ached
Minor chronic condi5on High-‐
a,ached
Minor chronic condi5on Low-‐
a,ached
Severe chronic condi5on High-‐
a,ached
Severe chronic condi5on Low-‐
a,ached Adj. visits 11,000 17,000 13,000 21,000 41,000 56,000
0
10,000
20,000
30,000
40,000
50,000
60,000
Adj. Ho
spita
liza7
ons P
er 100
,000
Pa7
ents

HQCA PRIMARY CARE MEASUREMENT INITIATIVE 16
Figure 6 shows that FP visits were lower overall for high-‐attached compared to low-‐attached patients in the three year period after PCNs were formed. This was due to significantly lower FP visit rates for high-‐attached patients in the healthy and minor chronic condition categories.
Figure 6: Adjusted FP visits for high- and low-attached PCN patients’ post-PCN involvement
Note: Rates are adjusted (adj.) for age, gender.
Healthy High-‐
a,ached
Healthy Low-‐
a,ached
Minor chronic condi5on High-‐
a,ached
Minor chronic condi5on Low-‐
a,ached
Severe chronic condi5on High-‐
a,ached
Severe chronic condi5on Low-‐
a,ached Adj. Visits 790,000 951,000 1,250,000 1,446,000 1,952,000 1,921,000
0
500,000
1,000,000
1,500,000
2,000,000
2,500,000
Adj. FP Visits Per 100
,000
pa7
ents

HQCA PRIMARY CARE MEASUREMENT INITIATIVE 17
Comparison of patients’ healthcare service utilization rates between PCNs
There was no consistent pattern among PCNs in how the healthcare service utilization rates of their patients changed in the periods before and after their involvement with a PCN (Table 1 and Appendix E). In addition, the change in utilization rates of patients for different health services varied within a PCN.
Table 1: Ascending rank order by PCN of the change in healthcare service utilization after patients’ involvement with a PCN
Family Physician Visits Emergency Department Visits Inpatient Visits
PCN Adj. avg difference PCN Adj. avg difference PCN Adj. avg difference
15 -‐1.03 19 -‐2.48 3 -‐0.02
11 -‐0.41 17 -‐0.10 17 -‐0.02
1 0.02 16 -‐0.03 7 -‐0.01
13 0.50 18 0.00 9 -‐0.01
7 0.82 8 0.01 10 -‐0.01
10 0.92 4 0.02 14 -‐0.01
3 0.97 7 0.02 2 0.00
12 0.97 10 0.04 8 0.00
9 1.01 9 0.05 16 0.00
4 1.08 14 0.06 4 0.01
16 1.15 2 0.07 5 0.01
2 1.41 6 0.07 6 0.01
19 1.42 1 0.23 12 0.01
18 1.46 12 0.24 13 0.01
5 1.49 3 0.28 18 0.01
14 1.70 5 0.32 11 0.02
8 1.82 13 0.50 15 0.02
6 2.01 15 0.66 19 0.03
17 12.43 11 3.00 1 0.04
Note: Rates are adjusted (adj.) for age, gender, burden of illness, and FP degree of attachment.

HQCA PRIMARY CARE MEASUREMENT INITIATIVE 18
Discussion
In 2009-‐10, the HQCA embarked on a primary care measurement initiative to determine the impact that PCNs might be having on healthcare service utilization using available administrative data. The key findings of this work to date are:
1. Patients who see the same FP for 80 per cent or greater of their primary care visits (high-‐attached patients) use less healthcare acute care services overall. This effect remains after adjusting for age and gender, is seen across all burden of illness categories, and was present before and after PCNs were formed. This finding is consistent with the research on relational continuity between an FP and patient.1,5,7
2. Acute care services (ED visits and hospitalizations) decreased in most patient populations after their involvement with a PCN, while visits to family physicians increased.
3. There is substantial variation between the PCNs studied in the utilization of healthcare services by their patients. It is not possible to account for differences between PCNs with the currently available data and therefore conclusions about PCN performance should not be drawn based only on a comparison of the healthcare service utilization rates of their patients. However, information about healthcare service utilization could be used by individual PCNs for improvement purposes.
4. PCN patients are significantly different from non-‐PCN patients on key characteristics known to influence healthcare service utilization (age, gender, burden of illness, degree of attachment to their FP). Any conclusions drawn about PCN performance based on a comparison between PCN and non-‐PCN patients may be inappropriate and misleading.
Further study of relational continuity between a patient and their family physician is needed to understand why differences in healthcare service utilization exist and whether actions can be taken to improve patients’ attachment of to a primary care provider. Additional research is needed to understand the relative importance of continuity with an FP and the PCN where the physician practices (longitudinal continuity), and where a patient may have ongoing relationships with other care providers to meet specific healthcare needs. It is not possible to separate the influence of the patient-‐provider relationship from the patient-‐PCN relationship with the currently available data.
It is not surprising there was variation among the PCNs in the pattern of healthcare service utilization rates of their patients. Each PCN is encouraged to work with local healthcare professionals to determine how best to meet the needs of the patient population it serves. With a simple aggregation of all PCN data the capability to identify and account for operational differences between PCNs, and the ability to effectively identify high versus low performers is lost. Further study of the influence of PCN structure and function on healthcare service utilization is required.
Limitations
In this measurement initiative, inferences made from analysis of administrative data suggest a positive effect of PCNs on healthcare service utilization by their patients, but they are not conclusive. While an attempt was made to control for some variables known to have an impact on healthcare service utilization (age, gender, burden of illness) it was impossible to control for other factors (some known, many not known) that could have affected patient outcomes and utilization of healthcare services over the period of study. Multiple factors determine the quantity and type of health services people use and
HQCA PRIMARY CARE MEASUREMENT INITIATIVE 19
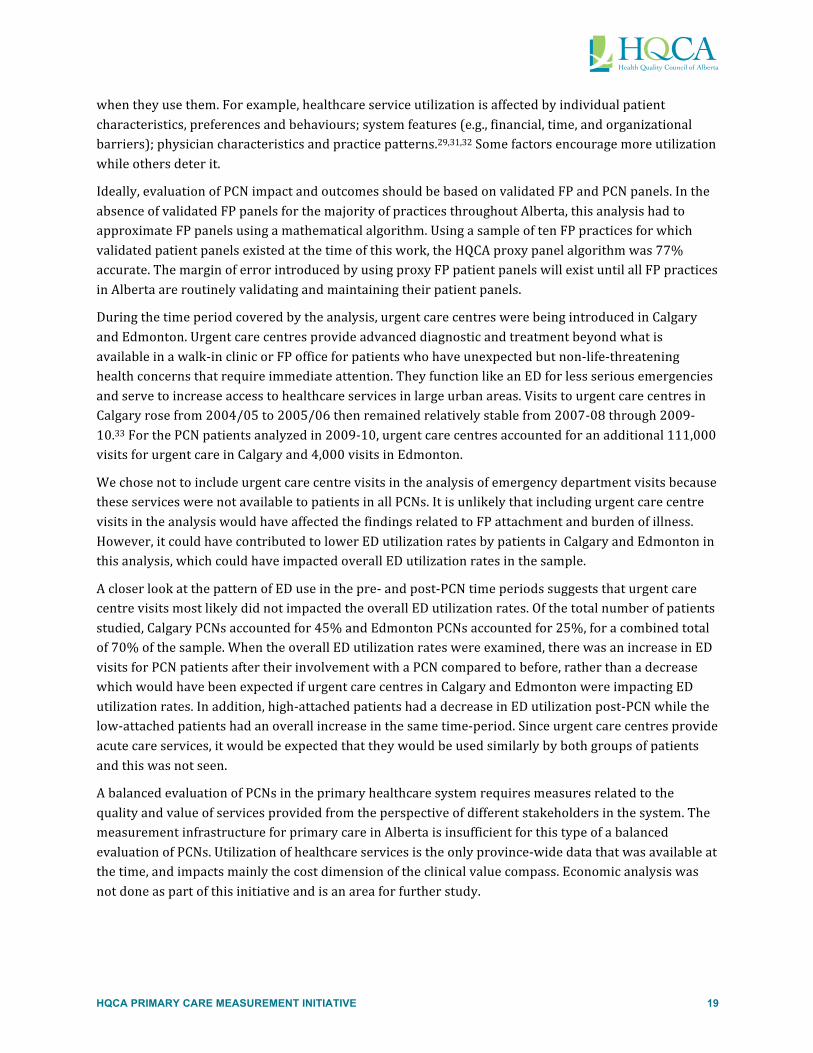
when they use them. For example, healthcare service utilization is affected by individual patient characteristics, preferences and behaviours; system features (e.g., financial, time, and organizational barriers); physician characteristics and practice patterns.29,31,32 Some factors encourage more utilization while others deter it.
Ideally, evaluation of PCN impact and outcomes should be based on validated FP and PCN panels. In the absence of validated FP panels for the majority of practices throughout Alberta, this analysis had to approximate FP panels using a mathematical algorithm. Using a sample of ten FP practices for which validated patient panels existed at the time of this work, the HQCA proxy panel algorithm was 77% accurate. The margin of error introduced by using proxy FP patient panels will exist until all FP practices in Alberta are routinely validating and maintaining their patient panels.
During the time period covered by the analysis, urgent care centres were being introduced in Calgary and Edmonton. Urgent care centres provide advanced diagnostic and treatment beyond what is available in a walk-‐in clinic or FP office for patients who have unexpected but non-‐life-‐threatening health concerns that require immediate attention. They function like an ED for less serious emergencies and serve to increase access to healthcare services in large urban areas. Visits to urgent care centres in Calgary rose from 2004/05 to 2005/06 then remained relatively stable from 2007-‐08 through 2009-‐10.33 For the PCN patients analyzed in 2009-‐10, urgent care centres accounted for an additional 111,000 visits for urgent care in Calgary and 4,000 visits in Edmonton.
We chose not to include urgent care centre visits in the analysis of emergency department visits because these services were not available to patients in all PCNs. It is unlikely that including urgent care centre visits in the analysis would have affected the findings related to FP attachment and burden of illness. However, it could have contributed to lower ED utilization rates by patients in Calgary and Edmonton in this analysis, which could have impacted overall ED utilization rates in the sample.
A closer look at the pattern of ED use in the pre-‐ and post-‐PCN time periods suggests that urgent care centre visits most likely did not impacted the overall ED utilization rates. Of the total number of patients studied, Calgary PCNs accounted for 45% and Edmonton PCNs accounted for 25%, for a combined total of 70% of the sample. When the overall ED utilization rates were examined, there was an increase in ED visits for PCN patients after their involvement with a PCN compared to before, rather than a decrease which would have been expected if urgent care centres in Calgary and Edmonton were impacting ED utilization rates. In addition, high-‐attached patients had a decrease in ED utilization post-‐PCN while the low-‐attached patients had an overall increase in the same time-‐period. Since urgent care centres provide acute care services, it would be expected that they would be used similarly by both groups of patients and this was not seen.
A balanced evaluation of PCNs in the primary healthcare system requires measures related to the quality and value of services provided from the perspective of different stakeholders in the system. The measurement infrastructure for primary care in Alberta is insufficient for this type of a balanced evaluation of PCNs. Utilization of healthcare services is the only province-‐wide data that was available at the time, and impacts mainly the cost dimension of the clinical value compass. Economic analysis was not done as part of this initiative and is an area for further study.

HQCA PRIMARY CARE MEASUREMENT INITIATIVE 20
Opportunities for improvement
This study identifies some limitations of the current measurement infrastructure for primary care, and primary healthcare, which represent opportunities for improvement. Building a more robust system of measurement for primary healthcare that can be used by all levels of the system (family physician, primary care networks, Alberta Health Services, Alberta Health) is of critical importance to guide patient care, program planning and evaluation and policy decisions in primary healthcare. Three major opportunities for improvement are identified below.
Panel management and validated patient panels
Panel management, and the establishment and maintenance of validated FP patient panels is a fundamental requirement for practice improvement in primary care as well as the foundation for a provincial primary healthcare measurement strategy. A validated patient panel process requires both the physician and patient to agree on who is the most responsible FP for the patient’s care. This process prompts the establishment of at least a tacit, if not explicit (some practices require patients to sign an agreement with their FP), social contract related to provision of healthcare.14 Maintaining a validated patient panel is part of an ongoing panel management process for the practice of verifying and documenting relationships with patients as patients die, move or change primary care providers. With a validated patient panel, the FPs and their respective PCNs would know which patients they are responsible for providing healthcare services. Inversely, patients would know who is responsible for meeting their primary care needs. The processes of establishing and maintaining a panel management process is challenging and time-‐consuming. There is growing recognition of the importance of panel management in Alberta, and most practices that have undertaken this process recognize its importance for patient care and practice improvement.15 Family physicians and their PCNs may require panel management education and training to establish and maintain robust validated patient panels.
The HQCA has found through other primary care measurement activities that an effective incentive for FP engagement in primary care measurement is their ability to obtain useful data about their patient panels. However, meaningful reports on primary care performance for FPs and PCNs require an accurate list of patients registered to a specific family physician (FP panel). The proxy panel created using an algorithm to assign patients to an FP is only a starting point; the reporting process and usefulness of reports to FPs about their patient panels would be improved by using a validated panel. In a verbal conversation with Steven Clelland, Director at Alberta AIM (November 2013), he pointed out that validated panels have also proven to be essential for practice improvement work through programs such as Alberta AIM.
Another important benefit of having validated patient panels is the ability to identify which Albertans do not have a primary care provider. This would enable primary healthcare service delivery organizations such as PCNs and family care clinics to find ways to connect Albertans with the healthcare services they need.
Electronic medical record (EMR)
At the FP practice and PCN levels, measurement for improvement in patient care and practice processes will require implementation of the full capabilities of an EMR. This has upstream implications to facilitate aggregation of data, such as minimizing the number of EMR systems in place in the province, ensuring compatibility of data fields, and establishing common metrics and data definitions. Some of the
HQCA PRIMARY CARE MEASUREMENT INITIATIVE 21
more mature PCNs have developed their own unique data infrastructure and measurement systems to assist with their program planning, implementation and evaluation work. However many other PCNs throughout the province have not had the capacity (knowledge, skills, or resources) to undertake this work. Common issues such as developing standard metrics and data definitions could be accomplished through a collaborative process among stakeholders currently engaged in primary healthcare measurement activities.
Measurement infrastructure for primary healthcare
Despite the considerable resources devoted to the collection of administrative healthcare data in Alberta, it remains challenging to generate actionable information about the primary healthcare system which can then be applied to evidence-‐based decision-‐making at different levels of the healthcare system. Much of the data that is relevant to primary care, and primary healthcare, is not designed or intended for evaluation purposes. Using indirect measures from administrative healthcare data makes it impossible to demonstrate causality or to make direct linkages to the PCN program at a provincial level, particularly when numerous programs and services were implemented during the period of measurement (e.g., electronic medical and health records investment; Towards Optimized Practice initiatives; the Access Improvement Measures (AIM) program; the Performance & Diligence Indicator program; alternative relationship plans; and, AHS chronic disease management programs). When direct measures of PCN performance and service quality are not available, it becomes necessary to cautiously approach PCN evaluation through the use of indirect measurement and inferential evidence as the HQCA has done.
A measurement infrastructure that allows for more direct measurement of the outcomes of interest to different stakeholders in the system is needed. While service utilization is an important system-‐level outcome because of its relationship to cost, it can be problematic due to the difficulty of discerning whether more or less service utilization is good and the contribution of multiple factors to that outcome. The usefulness and performance of a condition-‐specific intervention or process of care is best assessed using measures that directly reflect the desired patient and health system outcome.
The 2012 report of the Auditor General of Alberta made numerous recommendations related to improving the measurement infrastructure for primary healthcare for Alberta Health and AHS.17 Alberta Health needs to establish clear expectations and targets for PCN program objectives which will support AHS in defining goals and service delivery expectations related to its involvement in PCNs. In addition, Alberta Health needs to develop systems to evaluate and report performance of the PCN program overall as well as improve its systems to provide information and support to both AHS and PCNs that will allow them to meet their expectations for evaluation and reporting.
The HQCA has identified elements of a measurement infrastructure to support evaluation of the primary healthcare system at all levels. These elements are discussed below.
Measurement framework to support primary healthcare improvement
A critical factor in the ability to effectively evaluate the benefit of new patient programs and services is the capture of patient-‐specific program registry data (who received what service), as well as direct outcome measures that relate to the goals of the program or service for those patients. Measures need to consider the outcomes valued by different stakeholders as identified by the clinical value compass.21 In order to enable analysis and aggregation of program-‐specific data at various levels of the health system, outcome measures need to be standardized and incorporated into a measurement framework that

HQCA PRIMARY CARE MEASUREMENT INITIATIVE 22
supports continual improvement in primary healthcare. The Alberta Quality Matrix for Health provides a useful framework to guide evaluation activities and selection of measures for improvement to ensure that a balanced perspective of quality is maintained.
Measurement of health outcomes
The systematic measurement of primary healthcare quality begins by measuring its essential impact on health, more specifically the restoration or maintenance of functional health. Routinely capturing disease-‐specific and general health outcome measures makes it possible for performance to be tracked and compared for both similar and diverse primary healthcare interventions. Reliable health-‐related quality of life measures have been developed and are available in the public domain, for example EQ-‐5D and SF-‐36TM.34 At the front line, health outcome measures could help FPs and healthcare teams improve the care they give their patients. At a clinical and program level, this information is critical to the evaluation of innovations primary healthcare delivery and performance. At a system level, measurement of primary healthcare quality and health outcomes is essential to determining health service quality and value received for public expenditure on services.
Patient-level cost information
To determine the relative cost-‐effectiveness and efficiency of different programs and activities within the healthcare system, healthcare costs need to be attributable at the patient level and then linked to both healthcare service utilization and outcomes data at different levels of the health system (e.g., patient, clinic, PCN, primary healthcare system). Current efforts to standardize financial accounting practices throughout the healthcare system, and to establish the capacity and methods to calculate patient-‐level costs for all sectors of the system, including primary healthcare should continue. An economic analysis of PCNs should include patient-‐level cost information for improved estimations.
Service data for allied health professionals
Currently, healthcare services provided by healthcare professionals other than FPs are either not captured or are captured in a number of stand-‐alone databases. Primary healthcare increasingly involves multi-‐professional teams and care provided by non-‐physician healthcare providers. A cost-‐effective method to capture patient service data for care provided by non-‐physician healthcare professionals is needed in order to evaluate their contributions to patient outcomes and health service utilization within various models of primary healthcare deliver.

CONCLUSION 23
CONCLUSION
The HQCA set out to determine what could be learned about the impact of PCNs on Alberta’s health system using readily available data from administrative databases. The analysis was limited to utilization of key healthcare services – FP visits, ED visits and hospitalizations. Despite the limitations of using administrative data for this purpose and the assumptions and approximations that had to be made to analyze the data, five main findings are worth noting:
1. Physician attachment substantially impacts health service resource utilization. Overall, patients who consistently see the same family physician utilize less acute care services.
2. FP visits increased for all the patient populations examined, while acute care service utilization was reduced in most patient populations after their involvement with a PCN.
3. Conclusions about PCN performance should not be drawn based only on a comparison of the healthcare service utilization rates of their patients.
2. PCN patients are significantly different from non-‐PCN patients on key characteristics known to influence utilization of healthcare services. Any conclusions drawn about PCN performance based on a comparison between PCN and non-‐PCN patients could be inappropriate and misleading.
3. Province-‐wide data to measure the performance of the primary healthcare system in Alberta is lacking. Currently, the province-‐wide data that is available is insufficient to adequately assess aspects of performance other than utilization of healthcare services. Further work is required to understand the impact of PCNs on Alberta’s healthcare system.
In attempting to measure the impact of PCNs on Alberta’s health system, the HQCA uncovered a number of measurement issues in primary healthcare which need to be addressed in order to evaluate the evolution of primary care in Alberta. Improved measurement infrastructure at both the clinic level and PCN level, through implementation of the full capabilities of an EMR, is required for meaningful and useful evaluation of both local improvements in quality and safety of patient care as well as larger system impacts. The clinical value compass and the Alberta Quality Matrix for Health can both be used to develop a useful framework for evaluation that ensures all aspects of performance relevant to primary healthcare and the perspectives of all those involved in the health system are considered when making decisions about the future of primary healthcare in Alberta.


APPENDICES 24
APPENDICES

APPENDIX A: DETAILED METHODS 25
APPENDIX A: DETAILED METHODS
Comparison of PCN to non-PCN patients
Healthcare service utilization is known to be influenced by patient characteristics such as age,24,25 gender,26,27 burden of illness,26 and an ongoing relationship with a FP1,6. Using data from the 2009-‐10 fiscal year, patients linked to a PCN were compared to patients not linked to a PCN on the following characteristics known to influence healthcare service utilization:
§ age24,25
§ gender26,27
§ treated prevalence of chronic conditions and mental illness
§ burden of illness28,29(patients were assigned a classification score based on 3M’s clinical risk grouper)30 (Appendix G)
§ degree of attachment (an HQCA-‐developed measure that was used as a proxy for interpersonal continuity between a patient and a single most responsible FP)5,7
Creating a FP proxy patient panel
A FP’s panel is the group of patients with whom the FP has an implicit or explicit agreement for primary care services.9 It is challenging to define a patient panel because while some patients have a strong relationship with their FP who they see for the majority of their primary healthcare needs, others see multiple FPs according to access, convenience or other factors. It is common for patients to appear in the panels of multiple FPs and practice groups (e.g., PCNs), and these various care providers are not always aware of the role each other plays in the care of a specific patient. Ideally, FPs should validate their patient panels by confirming with each patient on their panel whether the patient believes the FP to be their main primary care provider.
In Alberta at the time of this initiative few FPs had validated patient panels. Therefore patients were linked to a PCN with administrative data using a ‘proxy panel’ algorithm created by the HQCA for analytical purposes (Appendix B). Using information from ten validated FP patient panels, the four criteria method used by AH (Appendix C) to link patients with a PCN was found to be 70% accurate in assigning patients to an FP panel. The HQCA algorithm uses six criteria and classified 77% of the patients on the validated panels correctly. Note that both the HQCA and AH methods of creating FP proxy panels rely on a mathematical assignment only -‐ patients are not aware of the assignment nor are they involved in confirming (validating) that the assignment to a FP is correct. Detailed information about the HQCA panel assignment algorithm is presented in Appendix B. Information about the AH four-‐cut method is presented in Appendix F.
Three years of physician claims data, from fiscal years 2007/08 to 2009/10, were used to create the FP proxy panels. The HQCA considered for the proxy panel only patients who were considered active in the province of Alberta according to the Alberta Health registry file over the period of analysis. For assignment to a proxy panel, an individual had to be considered active for the years 2007, 2008, 2009, and 2010. This included patients who were covered by the Alberta Healthcare Insurance Plan (AHCIP) on March 31st of the fiscal year end (i.e., 2007, 2008, etc.), and who were born before April 1, 2010.
APPENDIX A: DETAILED METHODS 26
Excluded were persons who died or who moved out of Alberta during the year and were still out of Alberta on March 31st of the fiscal year end, and/ or were born April 1st, 2010 or later.
Creating a PCN proxy patient panel
PCN proxy panels which linked patients to a PCN were created by aggregating the FP proxy patient panels for all FPs within a PCN based on information from AH about which FPs worked in a PCN. If physicians were in multiple PCNs, they were assigned to the last PCN they joined. Consequently, since FP patient panels are estimated, proxy panels of PCN and non-‐PCN patients are also approximations.
Creating a non-PCN proxy patient “panel”
Using information from AH, FPs not working within a PCN were considered non-‐PCN FPs. Patient panels from all non-‐PCN FPs were aggregated into a non-‐PCN patient “panel” for analysis of non-‐PCN patients as a group.
Comparison of patient characteristics
Using data from the 2009-‐10 fiscal year, the PCN and non-‐PCN patient groups were compared on the following characteristics known to influence healthcare service utilization. Multiple factors determine the quantity and type of healthcare services people use and when they use those services. Healthcare service utilization is affected by, for example, individual behaviours, system features (e.g., financial, time, and organizational barriers), practice patterns and physician characteristics. Some factors encourage more utilization, while others deter it. The HQCA could not control for all patient characteristics known to influence healthcare service utilization due to data limitations. Using the available data, the HQCA chose to include patient characteristics with theoretically based associations with healthcare service utilization. Degree of attachment (see below) was estimated using data over the same three-‐year period as that used to create the proxy panel (from 2007-‐08 to 2009-‐2010).
§ age24,25
§ gender26,27
§ treated prevalence of chronic conditions and mental illness
§ burden of illness28,29(patients were assigned a classification score based on 3M’s clinical risk grouper)30 (Appendix G)
§ degree of attachment (used as a proxy for interpersonal continuity between a patient and a single most responsible FP)5,7
Data source and description
Age and gender – Age and gender are known to influence health service utilization. As people age, they tend to use more FP and hospital services, and prescription medication. It has been calculated that for every year of age there is about a 1% per year increase to medical, hospital and pharmaceutical spending.24,25 Women use more healthcare services than men for a variety of reasons: gender specific health conditions; child-‐birth related issues; greater likelihood of seeking care for health prevention and illness; differences in health perceptions and the reporting of symptoms and illnesses; and higher rates of disease in women than in men; and, a longer life span on average.26,27 Age and gender information was abstracted from physician claims data or the AH registry when it could not be found in the claims data.

APPENDIX A: DETAILED METHODS 27
Treated prevalence of chronic conditions and mental illness – Chronic conditions and mental health illnesses (see below) increase health service utilization.28,29 Prevalence estimates were based on disease-‐specific diagnosis and treatment codes from physician claims data, hospital abstract and ambulatory (emergency department) abstract databases. The estimates of prevalence considered both inpatient diagnoses and outpatient diagnoses over a three-‐year period. Treated prevalence would be expected to correlate strongly with, but underestimate, the true prevalence of a condition.
§ Chronic conditions: The treated prevalence of chronic diseases listed in the AHS complex care plan template was used for this analysis and included hypertension, diabetes, chronic obstructive pulmonary disease, asthma, congestive heart failure, angina and ischemic heart disease.35 This information was taken from the clinical risk grouper (CRG) tool30 that is used in Alberta to classify individual patients according to the severity of illness and assess the projected cost to the healthcare system. Using diagnostic and procedural codes, the CRG tool assigns a code (episode disease category -‐ EDC) to each chronic and acute condition and then ranks the conditions in terms of severity. The HQCA aggregates the EDC codes to 267 conditions which is the basis for the prevalence estimates. Information on the CRG is provided in Appendix D. For each chronic disease of interest, the number of patients with the associated EDC code was counted.
§ Mental illness: The treated prevalence of common mental health conditions (Alzheimer’s disease and other dementias, attention deficit/hyperactivity disorder, bi-‐polar disorder, schizophrenia, depressive and/or other psychoses, acute stress and anxiety diagnoses) was reported. As above, the number of patients with the EDC code associated with each condition of interest was counted.
Top ten most common diagnoses – The top ten diagnoses for each of the PCN and non-‐PCN populations were calculated based on the most common EDC codes from the CRG for that population. The percentage of each population with the diagnosis was calculated as the number of cases diagnosed divided by the population of each panel (# cases/total # of patients).
Burden of illness – Patients with chronic health conditions comprise close to one-‐third of adults across a spectrum of age and income groups throughout Canada.29 Of these, one-‐third have multiple or co-‐morbid long-‐term health problems. Patients with a greater burden of illness represent a substantial and growing healthcare and economic burden to society. They use significantly more FP, specialist and nurse services; are more likely to receive home care services; and account for 70% of all hospital days throughout Canada.30
Patients were given a burden of illness classification score based on their CRG codes (Appendix G). They were also aggregated into one of three burden of illness categories using their CRG codes:
§ Healthy: patients with a CRG of 1 (healthy, no major condition)
§ Minor chronic condition: patients with a CRG of 3 (single minor chronic condition) and 4 (multiple minor chronic condition)
§ Severe chronic condition: patients with a CRG of 5 (single dominant or moderate chronic condition), 6 (pairs – multiple dominant or moderate chronic conditions) or 7 (triples – multiple dominant chronic conditions)

APPENDIX A: DETAILED METHODS 28
To focus the analysis on conditions most likely to be managed by a FP, CRG categories 2 (significant acute disease), 8 (dominate, metastatic and complicated malignancies) and 9 (catastrophic conditions) were not included in this analysis. The CRG distribution for PCN patients for 2009-‐10 is shown in Figure 7.
Figure 7: Clinical risk grouper (CRG) distribution for PCN patients in 2009-10
Degree of attachment – Degree of attachment is a measure developed by the HQCA to represent the extent to which a patient sees the same FP from one visit to another over time. It is a mathematical approximation of the continuity in the relationship between a FP and the patient.5,7 For this work attachment was defined as the percentage of the FP visits for which a patient saw the primary FP assigned using the proxy panel algorithm.
§ Low-‐attached: patients who saw the same FP for 50% or fewer of their FP visits.
§ Mid-‐attached: patients who saw the same FP for 51-‐79% of their FP visits.
§ High-‐attached: patients who saw the same FP for at least 80% of their FP visits.
Design of analysis
Analysis began by examining the raw data for all the variables. Using univariate analysis, the range of values, and the central tendency of the values for each variable in the data set were explored. Next bivariate analysis and correlations were conducted to help test simple hypotheses of association between the healthcare service utilization measures and the factors identified as determining the quantity and type of healthcare services people use. Linear regression modeling was used to adjust the utilization rates for known influences like age, gender, burden of illness, patient’s degree of attachment
1. Healthy no major
condition
2. Significant acute
3. Single minor
chronic
4. Multiple minor
chronic
5. Single dominant or moderate chronic
6. Pairs - Multiple
dominant / moderate chronic
7. Triples - Multiple
dominant chronic
8. Malignancies
9. Catastrophic
PCN 50.2 4.6 14.4 4.4 17.2 7.6 0.7 0.6 0.2
0
25
50
75
100
Per
cen
tag
e (%
)

APPENDIX A: DETAILED METHODS 29
to a physician, PCN or non-‐PCN patient, and differences amongst PCNs. The multivariate linear results informed the analysis of the low, medium and high-‐attached cut points using the derivatives of trigonometric functions. The regression results were standardized for presentation purposes rather than presenting the full models. Tests of significance were based on results from the multivariate modelling done using Stata 10. Statistical significance was based on a probability value of less than or equal to 0.05 (p ≤ 0.05).
Comparison of healthcare service utilization by patients before and after their involvement with a PCN
This evaluation focused on the contribution of degree of attachment and burden of illness to the utilization of selected healthcare services (FP visits, emergency department visits, hospitalizations) by patients in the three years before and after their involvement with a PCN.
Sample
The analysis was conducted on patients of the 19 PCNs that had been in operation for 36 months or more by the end of the 2009-‐10 fiscal year. The period of interest was a time frame of 36 months before and after a patient’s first FP visit following the corresponding PCN’s operational start date, therefore each patient had a different start date for their data collection period. For each PCN, an operational start date was recorded using information provided by AH and corroborated with information from the PCN’s annual report. For the 2009-‐10 fiscal year the number of active PCN patients in Alberta was 2,786,335. The 36-‐month values used in this analysis represent results for 62.8% of all patients linked to a PCN during this time (1,749,947).
Contributing patient factors
Degree of attachment – The analysis focused on comparing the healthcare service utilization rates of high-‐attached versus low-‐attached patients. It was assumed that an effect of the PCN would be most evident for patients who consistently saw the same FP for most of their FP visits. After accounting for burden of illness, 751,737 high-‐attached patients and 512,532 low-‐attached patients were included in the analysis. This represents 72.2% of the patients linked with a PCN during the study period.
Burden of illness – The influence of burden of illness was examined by comparing the healthcare service utilization rates of patients in the three burden of illness categories described above: healthy, minor chronic condition, severe chronic condition.
Healthcare service utilization
Family physician (FP) visits – FP visits were calculated from physician claims data (visits to physicians whose specialty was listed as “GP” -‐ general practitioner). For the purposes of the analysis, patients were limited to a maximum of one visit per day at facility types “POFF” (physician office), “AMBU” (ambulatory clinic), “LTC” (long term care) or facility data coded as ‘missing’ (field left blank).
Emergency Department (ED) visits – ED visits were calculated from the National Ambulatory Care Reporting System (NACRS), and Ambulatory Care Classification System (ACCS) data were used for visits prior to and including 2009-‐10. Visits to emergency mental health (MIS: 7131070) and urgent care centres (MIS: 71513) were excluded. Visits to urgent care centres were not included because these centres were available only in large urban centres at that time and were not an option for patients in most areas of the province.

APPENDIX A: DETAILED METHODS 30
Hospitalizations (inpatient visits) – Hospitalizations were calculated from the Discharge Abstract Database (DAD).
Design of analysis
Linear regression modeling was used to adjust the crude utilization rates for known influences of age and gender. Adjusted averages were calculated based on the regression results and were standardized to comparable populations. The adjusted average rate was rounded, and the rounded values were used to estimate adjusted visits to help contextualize the results; the adjusted visits were rounded down to the nearest one-‐thousand. Due to rounding protocols, not all calculations will be precise.
When comparing high versus low-‐attached patients by burden of illness, the populations were standardized by age and gender. Statistical significance is based on a probability value of less than or equal to 0.05 (p ≤ 0.05).
Comparison of patients’ healthcare service utilization rates between PCNs
Analysis was done to determine whether there was variation between the 19 PCNs in the healthcare service utilization patterns of their patients in the 36 months before and after their involvement with a PCN. Differences between PCNs may indicate that there are PCN factors that influence utilization rates of their patients.
Sample
The analysis was conducted on the same sample of 1,749,947 patients of the 19 PCNs that had been in operation for 36 months or more by the end of the 2009-‐10 fiscal year as described above.
Healthcare service utilization
The healthcare service utilization rates of the patients of the 19 PCNs were compared for FP visits, ED visits, and hospitalizations before and after their involvement with PCN. The period of interest was a time frame of 36 months before and after a patient’s first FP visit following the corresponding PCN’s operational start date.
Analytic methods
Linear regression modeling was used to adjust the crude utilization rates for known influences of age, gender, and degree of attachment. Adjusted averages were calculated based on the regression results and were standardized to comparable populations. The adjusted average rate was rounded and the rounded values were used to estimate adjusted visits to help contextualize the results; the adjusted visits were rounded down to the nearest one-‐thousand. Due to rounding protocols, not all calculations will be precise.
Burden of illness is based on the clinical risk grouper (CRG) which assesses and classifies individual patients according to the severity of illness and the projected costs to the healthcare system. In the multivariate linear modelling, burden of illness is adjusted for by including it either as a continuous variable or as a discrete variable. It was modelled as a continuous variable when the purpose was to account for this influence without needing to explain it. There was a wide enough range of values to reasonably treat the variable as continuous, and the differences between the scale items were determined to be reasonably equal and meaningful. When discussing the interacting influence of burden

APPENDIX A: DETAILED METHODS 31
of illness with other factors on utilization, it was modelled as a discrete variable for ease of explanation and interpretation.
Statistical significance is based on a probability value of less than or equal to 0.05 (p ≤ 0.05).

APPENDIX B: THE HQCA PANEL SELECTION-ALGORITHM 32
APPENDIX B: THE HQCA PANEL SELECTION ALGORITHM
Validated patient lists (VPLs) were not available for all family physicians (FP) and primary care networks (PCNs) taking part in the HQCA primary care measurement initiative. When validated patient lists from 10 FPs were compared to the proxy panels created for the same physicians using the Alberta Health four-‐cut method (Appendix F), it was found that the proxy panel was 70% accurate (sensitivity or true positive rate) in predicting the validated panel. The HQCA algorithm was developed to improve predictive accuracy of the proxy panel and takes into account additional criteria when linking patients and FPs.
Overall, the HQCA algorithm was able to predict 77% of the VPL patients correctly, which is an improvement on the four-‐cut method. The HQCA estimated panels were more sensitive for females as compared with males, due to a number of gender-‐linked fee codes. The algorithm is ordered so that the most accurate steps of the methodology are used to assign patients first (Table 2). Three years of data are used to assign a patient to an FP. A detailed description of the hierarchical criteria and their development follows. The algorithm is presented in Figure 8.
Table 2: Accuracy of the HQCA’s proxy panel selection algorithm criterion
Criterion Correct Incorrect Total Per cent accurate
1 3,101 333 3,434 90.3
2 8,633 580 9,213 93.7
3 12,165 1,277 13,442 90.5
4 5,579 763 6,342 88.0
5 15,158 2,654 17,812 85.1
6 12,005 5,807 17,812 67.4
Criterion 1 – Sole visits
The algorithm begins by looking at sole visits. If the patient visited only one FP over the three year period they were assigned to that FP. This is identical to Alberta Health’s four-‐cut methodology, and is an unavoidable initial step because there are no other FPs to choose from. When compared to the FP-‐patient validated panels, the sole visit criterion was found to be a fairly successful method of linking patients and FPs.
Criterion 2 – Frequency of procedure codes
For the next step of the algorithm, the CRG grouper was linked to patients’ FP claims records. The CRG identifies chronic conditions and overall health on a nine-‐point scale, and is used as an interacting factor in a number of the criteria within the algorithm. CRGs serve as a burden of illness and overall health status proxy measure.

APPENDIX B: THE HQCA PANEL SELECTION-ALGORITHM 33
Based on the nine point CRG scale, the HQCA found 11 procedure codes that were consistently excellent predictors of a visit to a primary care FP in the validated patient panels provided to the HQCA. These were:
09.43A -‐ Audiological evaluation -‐ pure tone audiometry 03.05UT -‐ Team conference 03.03B -‐ Prenatal visit 03.03C -‐ Post-‐partum visit 03.03E -‐ Nursing home periodic care once per calendar week 13.99BA -‐ Pap smear 03.04A -‐ Comprehensive visit/physical 03.01N -‐ Management of anticoagulant therapy 03.04J -‐ Development, documentation, and administration of comprehensive annual care plan for a patient with complex needs 03.05H -‐ Senior’s driver’s medical 03.05TX -‐ Team conference
Another code that worked well for predicting a primary care FP in all but the three healthiest categories of the CRG grouper was:
13.59A -‐ Intramuscular or subcutaneous injection
Rather than simply looking at the last physical examination or the last visit for any of these procedure codes, the HQCA examined the frequency of visits to a particular FP for any of the listed codes (including physical examination). In case of a tie in terms of the most visits to multiple doctors for any of these procedure codes, the tied FPs were carried forward and tie breakers were determined by subsequent criterion.
Criterion 3 – Frequency of diagnostic codes
The third criterion examined diagnostic codes linked to patient visits. Ten diagnostic codes were found that predicted the primary care FP with high accuracy across all categories of overall health. These diagnostic codes (ICD -‐ 9) were:
V22.1 -‐ Supervision of other normal pregnancy V20.2 -‐ Routine infant or child health check V70.0 -‐ Routine general medical examination at a healthcare facility V70 -‐ General medical examination 650 -‐ Normal delivery V76.2 -‐ Screening for malignant neoplasms of the cervix V24.0 -‐ Postpartum care and examination immediately after delivery V26.4 -‐ General counseling and advice on procreative management 401.1 -‐ Benign essential hypertension V72.3 -‐ Gynecological examination 289 -‐ Other diseases of blood and blood -‐ forming organs
The HQCA examined the frequency of visits with these codes to assign a primary care FP in this criterion. Ties were carried forward and subsequent criteria were used as tie-‐breakers.

APPENDIX B: THE HQCA PANEL SELECTION-ALGORITHM 34
Criterion 4 – Frequency of visits, excluding certain codes
The fourth criterion was a modified version of step two of Alberta Health’s four-‐cut methodology (i.e. the physician seen most often). Instead of looking at total frequency of visits, the HQCA excluded some relatively frequent diagnostic codes that were poor predictors of the primary FP. Looking at the interaction of the overall health status with these codes, the codes that were excluded for all CRG categories were:
462 -‐ Acute pharyngitis 463 -‐ Acute tonsillitis 682 -‐ Other cellulitis and abscess 465.9 -‐ Acute upper respiratory infections of unspecified site 873 -‐ Other open wound of head 599 -‐ Other disorders of urethra and urinary tract 381 -‐ Nonsuppurative otitis media and eustachian tube disorders 780.9 -‐ Other general symptoms 78.1 -‐ Application of external fixation device 724 -‐ Other and unspecified disorders of back V54 -‐ Other orthopaedic aftercare 959 -‐ Injury other and unspecified 820 -‐ Fracture of neck of femur 304 -‐ Drug dependence 296 -‐ Episodic mood disorders 460 -‐ Acute nasopharyngitis (common cold) V22 -‐ Normal pregnancy 486 -‐ Pneumonia organism unspecified 595 -‐ Cystitis
Codes that only worked for the five healthiest categories from the CRG grouper were also excluded. These were:
465 -‐ Acute upper respiratory infections of multiple or unspecified sites 466 -‐ Acute bronchitis and bronchiolitis 372 -‐ Disorders of conjunctiva V68.1 -‐ Issue of repeat prescriptions
Finally, there was one code that was excluded from all but the two healthiest categories from the CRG grouper. It was:
454 -‐ Varicose veins of lower extremities
FPs were assigned to patients based on the frequency of visits, excluding visits with diagnoses of the listed codes. As with the previous criteria, ties in this criterion were carried forward to later criteria.
Criterion 5 – Frequency of visits
The next criterion examined the frequency of all visits to a general practitioner with no codes excluded. This step was the same as step two of the Alberta Health four-‐cut methodology.
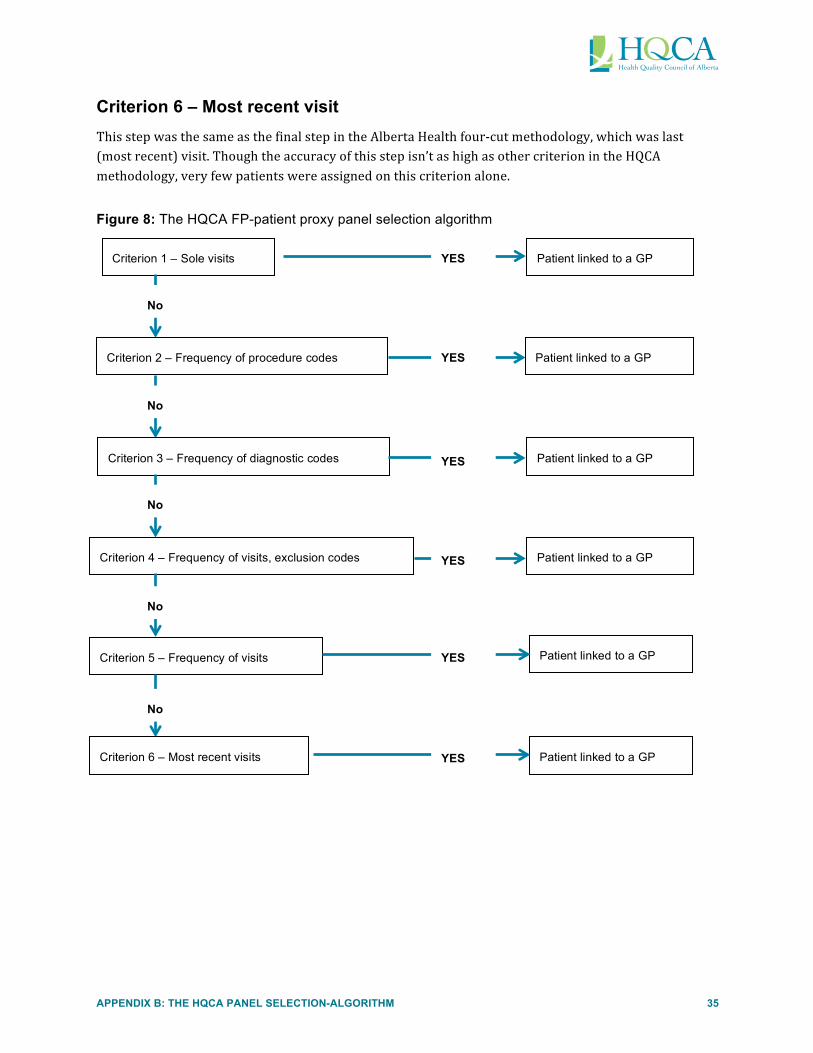
APPENDIX B: THE HQCA PANEL SELECTION-ALGORITHM 35
Criterion 6 – Most recent visit
This step was the same as the final step in the Alberta Health four-‐cut methodology, which was last (most recent) visit. Though the accuracy of this step isn’t as high as other criterion in the HQCA methodology, very few patients were assigned on this criterion alone.
Figure 8: The HQCA FP-patient proxy panel selection algorithm
Criterion 1 – Sole visits Patient linked to a GP YES
No
Criterion 2 – Frequency of procedure codes Patient linked to a GP YES
No
Criterion 3 – Frequency of diagnostic codes Patient linked to a GP YES
Criterion 4 – Frequency of visits, exclusion codes Patient linked to a GP YES
No
Criterion 5 – Frequency of visits
No
Patient linked to a GP YES
Criterion 6 – Most recent visits Patient linked to a GP
No
YES

< 1
ye
ar
1 to
10
11 to
20
21 to
30
31 to
40
41 to
50
51 to
60
61 to
70
71 to
80
81 to
90
91 to
10
0 >
100
PC
N
0.6
12.8
12
.4
14.9
14
.6
15.2
13
.7
8.2
4.8
2.5
0.4
0.0
Non
-PC
N
1.2
14.6
17
.1
14.7
13
.9
14.2
12
.1
6.8
3.6
1.6
0.2
0.0
0 5 10
15
20
Percentage (%)
APPENDIX C: COMPARISON OF PCN AND NON-PCN PATIENTS 36
APPENDIX C: COMPARISON OF PCN AND NON-PCN PATIENTS
Figure 9: Age distribution between PCN and non-PCN patients in 2009-10

1. Healthy
no major
condition
2. Significant acute
3. Single
minor
chronic
4. Multiple
minor
chronic
5. Single
dominant or
moderate
chronic
6. Pairs -
Multiple
dominant /
moderate
chronic
7. Triples -
Multiple
dominant
chronic
8. M
alignancies
9. C
atastrophic
PC
N
50.2 4.6
14.4 4.4
17.2 7.6
0.7 0.6
0.2
Non-P
CN
67.7
3.7 10.0
2.2 11.6
3.9 0.3
0.3 0.3
0
25
50
75
100 Percentage (%)
PC
N
Non-P
CN
He
althy M
inor C
hronic C
ondition
Se
vere
Ch
ronic C
ond
ition
APPENDIX C: COMPARISON OF PCN AND NON-PCN PATIENTS 37
Figure 10: Burden of illness distribution of PCN and non-PCN patients in 2009-10

Hyp
erte
nsio
n D
iabe
tes
Chr
onic
obs
truc
tive
pulm
onar
y di
seas
e A
sthm
a C
onge
stiv
e he
art
failu
re
Ang
ina
and
isch
emic
he
art d
isea
se
PC
N
15.9
5.
7 1.
8 7.
3 1.
3 2.
1
Non
-PC
N
10.5
4.
0 1.
0 4.
2 0.
6 1.
2
0 5 10
15
20
Percentage (%)
APPENDIX C: COMPARISON OF PCN AND NON-PCN PATIENTS 38
Figure 11: Distribution of selected chronic diseases in PCN and non-PCN patients in 2009-10
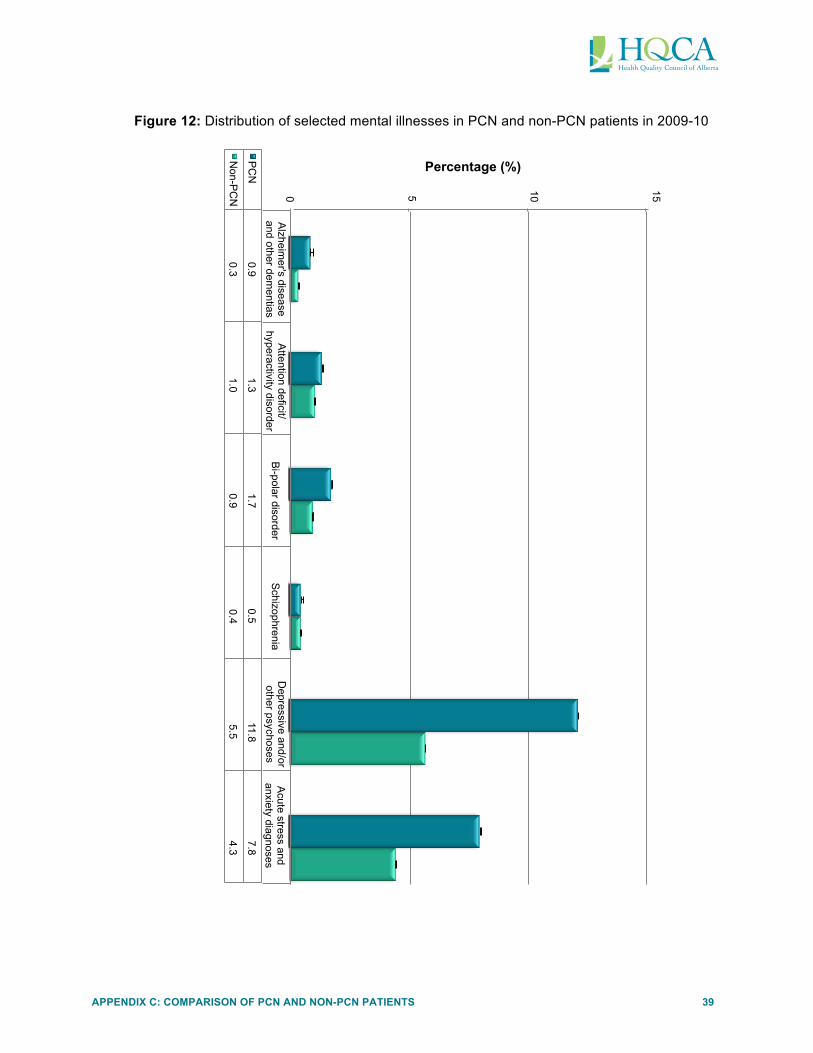
Alzheim
er's disease and other dem
entias A
ttention deficit/hyperactivity disorder
Bi-polar disorder
Schizophrenia
Depressive and/or
other psychoses A
cute stress and anxiety diagnoses
PC
N
0.9 1.3
1.7 0.5
11.8 7.8
Non-P
CN
0.3
1.0 0.9
0.4 5.5
4.3
0
5
10
15 Percentage (%)
APPENDIX C: COMPARISON OF PCN AND NON-PCN PATIENTS 39
Figure 12: Distribution of selected mental illnesses in PCN and non-PCN patients in 2009-10

Upp
er
resp
irato
ry
infe
ctio
ns
Infe
ctio
ns
Ski
n di
agno
ses
Acu
te jo
int
and/
or
mus
culo
skel
eta
l dia
gnos
es
Acu
te
resp
irato
ry
dise
ases
Sto
mac
h an
d in
test
inal
di
sord
ers
Oth
er in
jurie
s A
cute
gy
neco
logi
cal
diag
nose
s H
yper
tens
ion
Acu
te e
ar,
nose
, and
th
roat
di
agno
ses
PC
N
33.1
29
.5
24.1
23
.7
21.2
19
.2
17.9
16
.9
15.9
15
.6
Non
-PC
N
20.8
16
.9
14.4
13
.2
12.6
10
.8
10.7
7.
2
9.8
9.
3
0 5 10
15
20
25
30
35
Percentage (%)
APPENDIX C: COMPARISON OF PCN AND NON-PCN PATIENTS 40
Figure 13: Distribution of the most common aggregated diagnoses based on disease category codesin PCN and non-PCN patients in 2009-10n
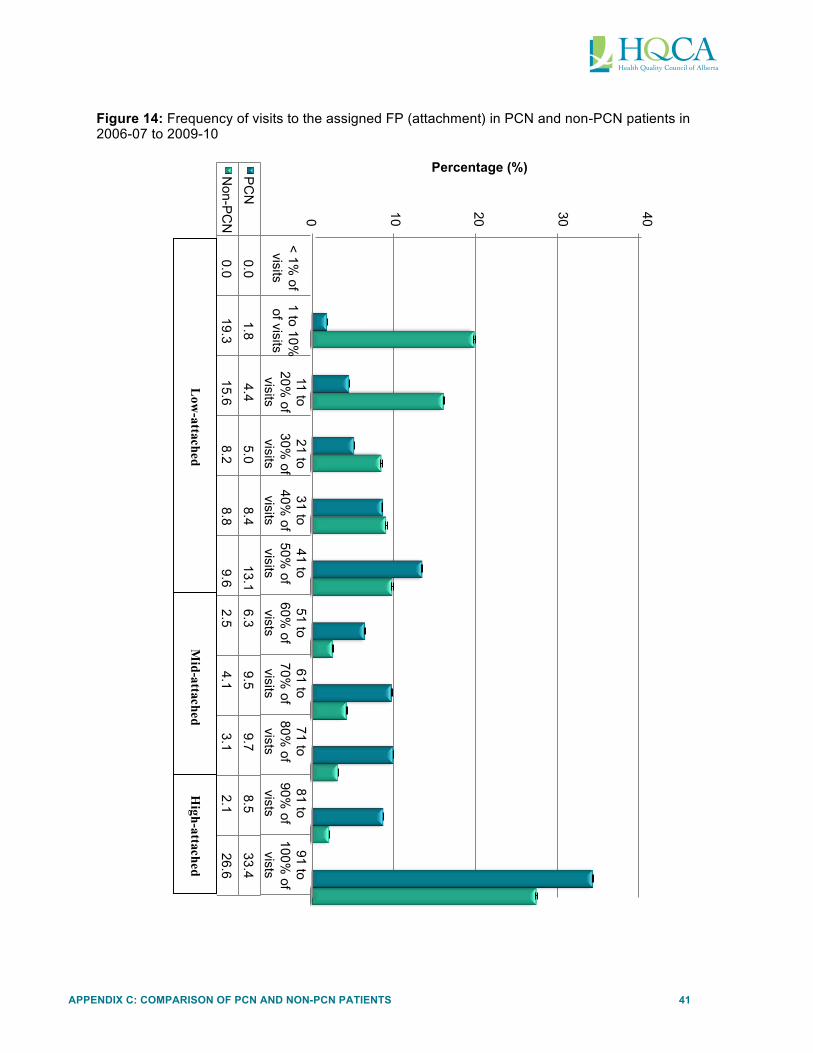
< 1%
of visits
1 to 10%
of visits
11 to 20%
of visits
21 to 30%
of visits
31 to 40%
of visits
41 to 50%
of visits
51 to 60%
of vists
61 to 70%
of visits
71 to 80%
of vists
81 to 90%
of vists
91 to 100%
of vists
PC
N
0.0 1.8
4.4 5.0
8.4 13.1
6.3 9.5
9.7 8.5
33.4
Non-P
CN
0.0
19.3 15.6
8.2 8.8
9.6 2.5
4.1 3.1
2.1 26.6
0
10
20
30
40 Percentage (%)
Low
-attached M
id-attached H
igh-attached
APPENDIX C: COMPARISON OF PCN AND NON-PCN PATIENTS 41
Figure 14: Frequency of visits to the assigned FP (attachment) in PCN and non-PCN patients in 2006-07 to 2009-10

APPENDIX D: HEALTHCARE SERVICE UTILIZATION RATES 42
APPENDIX D: HEALTHCARE SERVICE UTILIZATION RATES FOR HIGH- AND LOW-ATTACHED PCN PATIENTS BY BURDEN OF ILLNESS CATEGORY
Table 3: Family physician visits for high- and low-attached PCN patients by burden of illness category
Before PCN start date After PCN start date After – Before Difference
Observations Adj. Avg.
Lower 95% CI
Upper 95% CI
Adj. Avg.
Lower 95% CI
Upper 95% CI
Adj. Avg.
Lower 95% CI
Upper 95% CI
Healthy High-‐
attached 362,101 7.86 7.82 7.91 7.90 7.85 7.94 0.04 -‐0.01 0.07
Healthy Low-‐
attached 272,059 8.58 8.53 8.63 9.51 9.46 9.56 0.93* 0.88 0.97
Minor chronic condition High-‐
attached
159,923 11.30 11.24 11.36 12.50 12.43 12.56 1.20* 1.14 1.25
Minor chronic condition Low-‐
attached
102,478 11.94 11.87 12.02 14.46 14.39 14.54 2.52* 2.45 2.59
Severe chronic condition High-‐
attached
229,713 16.01 15.96 16.06 19.52 19.46 19.57 3.51* 3.46 3.56
Severe chronic condition Low-‐
attached
137,995 15.71 15.64 15.77 19.21 19.15 19.28 3.50* 3.45 3.57
Note: Rates are adjusted for age and gender. * Indicates a significant change (p<0.05). To estimate adjusted average number of visits, multiply adjusted average visit rates X number of observations.

APPENDIX D: HEALTHCARE SERVICE UTILIZATION RATES 43
Table 4: ED visits for high- and low-attached PCN patients by burden of illness category
Before PCN start date After PCN start date After – Before Difference
Observations Adj. Avg.
Lower 95% CI
Upper 95% CI
Adj. Avg.
Lower 95% CI
Upper 95% CI
Adj. Avg.
Lower 95% CI
Upper 95% CI
Healthy High-‐
attached 362,101 0.69 0.68 0.70 0.53 0.53 0.54 -‐0.16* -‐0.17 -‐0.15
Healthy Low-‐
attached 272,059 1.28 1.26 1.30 1.4 1.38 1.43 0.12* 0.10 0.14
Minor chronic condition High-‐
attached
159,923 0.89 0.88 0.91 0.75 0.74 0.76 -‐0.14* -‐0.16 -‐0.13
Minor chronic condition Low
attached
102,478 1.75 1.72 1.78 2.00 1.96 2.03 0.25* 0.22 0.28
Severe chronic condition High-‐
attached
229,713 1.49 1.48 1.50 1.44 1.43 1.45 -‐0.05* -‐0.06 -‐0.04
Severe chronic condition Low-‐
attached
137,995 2.89 2.87 2.92 3.53 3.50 3.56 0.64* 0.61 0.66
Note: Rates are adjusted for age and gender. * Indicates a significant change (p<0.05). To estimate adjusted average number of visits, multiply adjusted average visit rates X number of observations.

APPENDIX D: HEALTHCARE SERVICE UTILIZATION RATES 44
Table 5: Hospitalizations for high- and low-attached PCN patients by burden of illness category
Before PCN start date After PCN start date After – Before Difference
Observations Adj. Avg.
Lower 95% CI
Upper 95% CI
Adj. Avg.
Lower 95% CI
Upper 95% CI
Adj. Avg.
Lower 95% CI
Upper 95% CI
Healthy High-‐
attached 362,101 0.69 0.68 0.70 0.53 0.53 0.54 -‐0.16* -‐0.17 -‐0.15
Healthy -‐ Low-‐
attached 272,059 1.28 1.26 1.30 1.4 1.38 1.43 0.12* 0.10 0.14
Minor chronic condition High-‐
attached
159,923 0.89 0.88 0.91 0.75 0.74 0.76 -‐0.14* -‐0.16 -‐0.13
Minor chronic condition Low
attached
102,478 1.75 1.72 1.78 2.00 1.96 2.03 0.25* 0.22 0.28
Severe chronic condition High-‐
attached
229,713 1.49 1.48 1.50 1.44 1.43 1.45 -‐0.05* -‐0.06 -‐0.04
Severe chronic condition Low-‐
attached
137,995 2.89 2.87 2.92 3.53 3.50 3.56 0.64* 0.61 0.66
Note: Rates are adjusted for age and gender. * Indicates a significant change (p<0.05). To estimate adjusted average number of visits, multiply adjusted average visit rates X number of observations.


APPENDIX E: VARIATION BETWEEN PCNS IN HEALTHCARESERVICE UTILIZATION OF THEIR PATIENTS 45
APPENDIX E: VARIATION BETWEEN PCNS IN HEALTHCARE SERVICE UTILIZATION OF THEIR PATIENTS
Table 1: Family physician visits by PCN in ascending order by adjusted average change
Before PCN start date After PCN start date After – Before Difference
PCN Observations Adj. Average Lower CI Upper CI Adj. Average Lower CI Upper CI Adj. Average Lower CI Upper CI
15 15,731 9.77 9.60 9.95 8.75 8.55 8.94 -‐1.03 -‐1.19 -‐0.86
11 28,298 10.25 10.11 10.38 9.84 9.69 9.99 -‐0.41 -‐0.53 -‐0.28
1 25,548 10.95 10.81 11.09 10.97 10.82 11.13 0.02 -‐0.11 0.16
13 6,084 12.69 12.41 12.98 13.19 12.87 13.51 0.50 0.23 0.77
7 51,395 11.18 11.08 11.28 12.00 11.89 12.11 0.82 0.73 0.91
10 54,790 10.89 10.79 10.98 11.80 11.70 11.91 0.92 0.83 1.01
3 97,163 11.03 10.96 11.10 12.00 11.92 12.08 0.97 0.90 1.04
12 84,333 12.57 12.49 12.64 13.54 13.45 13.62 0.97 0.90 1.04
9 102,830 12.25 12.18 12.31 13.26 13.18 13.33 1.01 0.95 1.08
4 272,697 12.53 12.49 12.57 13.61 13.56 13.66 1.08 1.04 1.12
16 113,687 11.98 11.92 12.05 13.14 13.06 13.21 1.15 1.09 1.22
2 303,847 12.30 12.26 12.34 13.72 13.67 13.76 1.41 1.38 1.45
19 37,400 11.55 11.44 11.66 12.97 12.84 13.10 1.42 1.31 1.53
18 72,069 11.48 11.40 11.56 12.94 12.84 13.03 1.46 1.38 1.54
5 24,106 10.83 10.69 10.97 12.32 12.16 12.48 1.49 1.36 1.63
14 101,007 11.73 11.66 11.80 13.42 13.35 13.50 1.70 1.63 1.76
8 139,489 12.27 12.21 12.33 14.09 14.02 14.16 1.82 1.76 1.87
6 147,879 11.55 11.50 11.61 13.57 13.50 13.63 2.01 1.96 2.07
17 75,576 0.07 -‐0.01 0.15 12.50 12.41 12.59 12.43 12.35 12.51
Note: Rates are adjusted for age, gender, burden of illness, and FP degree of attachment.


APPENDIX E: VARIATION BETWEEN PCNS IN HEALTHCARESERVICE UTILIZATION OF THEIR PATIENTS 46
Table 2: Emergency department visits by PCN in ascending order of adjusted average change
Before PCN start date After PCN start date After – Before Difference
PCN Observations Adj. Average Lower CI Upper CI Adj. Average Lower CI Upper CI Adj. Average Lower CI Upper CI
19 37,400 2.52 2.48 2.55 0.04 -‐0.01 0.09 -‐2.48 -‐2.53 -‐2.43
17 75,576 1.28 1.25 1.31 1.18 1.15 1.22 -‐0.10 -‐0.13 -‐0.06
16 113,687 0.68 0.66 0.70 0.65 0.62 0.67 -‐0.03 -‐0.06 -‐0.01
18 72,069 1.94 1.91 1.97 1.94 1.91 1.98 0.00 -‐0.03 0.04
8 139,489 1.03 1.01 1.05 1.04 1.01 1.06 0.01 -‐0.02 0.03
4 272,697 0.76 0.74 0.77 0.78 0.76 0.80 0.02 0.01 0.04
7 51,395 1.15 1.12 1.19 1.17 1.13 1.21 0.02 -‐0.02 0.06
10 54,790 2.02 1.99 2.05 2.06 2.02 2.10 0.04 0.00 0.08
9 102,830 1.18 1.16 1.21 1.23 1.20 1.26 0.05 0.02 0.08
14 101,007 1.63 1.60 1.65 1.69 1.66 1.72 0.06 0.04 0.10
2 303,847 0.73 0.72 0.74 0.80 0.78 0.82 0.07 0.06 0.09
6 147,879 1.92 1.90 1.94 1.99 1.97 2.02 0.07 0.05 0.10
1 25,548 3.04 3.00 3.09 3.27 3.21 3.33 0.23 0.17 0.29
12 84,333 1.90 1.87 1.93 2.14 2.11 2.17 0.24 0.21 0.27
3 97,163 2.02 1.99 2.04 2.30 2.27 2.34 0.28 0.26 0.32
5 24,106 1.87 1.82 1.91 2.19 2.13 2.25 0.32 0.27 0.38
13 6,084 3.20 3.10 3.29 3.70 3.58 3.83 0.50 0.39 0.63
15 15,731 3.69 3.63 3.75 4.35 4.27 4.42 0.66 0.58 0.73
11 28,298 3.70 3.65 3.74 6.70 6.65 6.76 3.00 2.95 3.06
Note: Rates are adjusted for age, gender, burden of illness, and FP degree of attachment.


APPENDIX E: VARIATION BETWEEN PCNS IN HEALTHCARESERVICE UTILIZATION OF THEIR PATIENTS 47
Table 3: Inpatient visits by PCN in ascending order of adjusted average change
Before PCN start date After PCN start date After – Before Difference
PCN Observations Adj. Average Lower CI Upper CI Adj. Average Lower CI Upper CI Adj. Average Lower CI Upper CI
7 51,395 0.25 0.25 0.26 0.24 0.24 0.25 -‐0.01 -‐0.02 0.00
9 102,830 0.22 0.22 0.23 0.22 0.21 0.22 -‐0.01 -‐0.01 0.00
10 54,790 0.26 0.26 0.27 0.25 0.25 0.26 -‐0.01 -‐0.02 0.00
14 101,007 0.32 0.32 0.33 0.32 0.31 0.32 -‐0.01 -‐0.01 0.00
3 97,163 0.28 0.27 0.28 0.26 0.26 0.27 -‐0.02 -‐0.02 -‐0.01
17 75,576 0.22 0.22 0.23 0.21 0.20 0.21 -‐0.02 -‐0.02 -‐0.01
2 303,847 0.22 0.22 0.23 0.23 0.22 0.23 0.00 0.00 0.01
8 139,489 0.23 0.22 0.23 0.23 0.22 0.23 0.00 0.00 0.00
16 113,687 0.21 0.21 0.22 0.21 0.21 0.22 0.00 -‐0.01 0.00
4 272,697 0.23 0.22 0.23 0.23 0.23 0.24 0.01 0.00 0.01
5 24,106 0.36 0.35 0.37 0.37 0.36 0.38 0.01 0.00 0.02
6 147,879 0.32 0.31 0.32 0.32 0.32 0.32 0.01 0.00 0.01
12 84,333 0.34 0.33 0.34 0.35 0.34 0.35 0.01 0.00 0.01
13 6,084 0.41 0.40 0.43 0.43 0.41 0.45 0.01 -‐0.01 0.04
18 72,069 0.25 0.25 0.26 0.27 0.26 0.27 0.01 0.01 0.02
11 28,298 0.48 0.47 0.49 0.50 0.49 0.51 0.02 0.01 0.03
15 15,731 0.36 0.35 0.37 0.38 0.37 0.39 0.02 0.01 0.04
19 37,400 0.29 0.28 0.30 0.32 0.31 0.32 0.03 0.02 0.04
1 25,548 0.39 0.38 0.40 0.42 0.41 0.43 0.04 0.03 0.05
Note: Rates are adjusted for age, gender, burden of illness, and FP degree of attachment.


APPENDIX F: FOUR-CUT METHOD FOR ASSIGNING PATIENTS TO A FP PANEL 48
APPENDIX F: FOUR-CUT METHOD FOR ASSIGNING PATIENTS TO A FP PANEL
Alberta Health developed the four-‐cut methodology for assigning patients to an FP panel. It is a mathematical assignment only -‐ patients are not aware of the assignment or involved in confirming (validating) that the assignment is correct in their opinion. The methodology results in an estimation of an FP patient panel calculated from physician claims data based on patterns of FP utilization by patients over a specified time period. The four criteria below are applied hierarchically until the patient is ‘assigned’ to an FP.
Step 1: The patient has visited only this single FP, or
Step 2: The FP seen most often by the patient, or
Step 3: If the patient has visited two or more FP with the same frequency, the FP who completed the patient’s last physician examination, or
Step 4: The FP visited last.
APPENDIX G: CLINICAL RISK GROUPER (CRG) CLASSIFICATION DESCRIPTIONS 49
APPENDIX G. CLINICAL RISK GROUPER (CRG) CLASSIFICATION DESCRIPTIONS
The Clinical Risk Grouper (CRG)30 is a proprietary tool developed by 3MTM and used in Alberta to classify individual patients according to the severity of illness and assess the projected cost to the healthcare system. The CRG tool is based on chronic and acute conditions that have been ranked in terms of severity, which in turn are based on diagnostic and procedural codes over a fixed period of time. Multiple codes from inpatient administrative data, the National Ambulatory Care Reporting System (NACRS), the Discharge Abstract Database (DAD), and Alberta physician claims databases are used to determine a CRG classification at the patient level. In its most aggregate form, the CRG can be reduced to nine levels which indicate the overall level of health of an individual. These levels range from “Healthy -‐ no major conditions” to “Catastrophic” which would indicate a health state which is close to death. The tenth level, death, was not used to produce the reports. CRG classification descriptions are provided below.

APPENDIX G: CLINICAL RISK GROUPER (CRG) CLASSIFICATION DESCRIPTIONS 50
CRG classification Description
CRG 1 – Healthy Defined as the absence of any chronic disease under active treatment or significant acute illness that places an individual at risk for the development of a chronic illness.
CRG 2 – History of significant acute disease Defined by the presence within the most recent six month period of one or more significant acute illnesses that places an individual at risk for the development of a chronic illness.
CRG 3 – Single minor chronic disease Defined by the presence of a single minor chronic disease under active treatment. Examples of Minor Chronic episode disease category (EDC) codes include Migraine (EDC 18), Chronic Hearing Loss (EDC 100), Chronic Thyroid Disease (EDC 446), and Depression (EDC 755).
CRG 4 – Minor chronic disease in multiple organ systems
Defined by the presence of two or more minor chronic diseases under active treatment.
CRG 5 – Single dominant or moderate chronic disease
Defined by the presence of a single dominate or moderate chronic disease under active treatment. Examples of dominant chronic EDCs include Spinal Bifida (EDC 64), Chronic Obstructive Pulmonary Disease and Brochiectasis (EDC 133), Congestive Heart Failure (EDC 179), Diabetes (EDC 424), Sickle Cell Anemia (EDC 606), and Schizophrenia (EDC 743).
Examples of Moderate Chronic EDCs include Epilepsy (EDC14), Asthma (EDC 138), Crystal Arthropathy (EDC 352), and Bi-‐Polar Disorder (EDC 747).
CRG 6 – Significant chronic disease in multiple organ systems
Defined by the presence of two or more chronic conditions, under active treatment, of which at least one is a dominant or moderate chronic disease.
CRG 7 – Dominant chronic disease in three or more organ systems
Defined by the presence of three or more dominant chronic illnesses or two dominate chronic illness with a selected moderate chronic illness, all under active treatment.
CRG 8 – Dominant, metastatic, and complicated malignancies
Defined by the presence of a malignancy that dominates the medical care required (e.g. brain malignancy) or a nondominate malignancy (e.g. prostrate malignancy) that is metastatic or complicated (e.g. requiring a bone marrow transplant).
CRG 9 – Catastrophic conditions Catastrophic conditions include long term dependency on a medical technology (e.g., dialysis, respirator, and TPN) and life-‐defining chronic diseases or conditions that dominate the medical care required (e.g., persistent vegetative state, cystic fibrosis, AIDS, and history of heart transplant).

REFERENCES 51
REFERENCES
1 Starfield B. Deconstructing primary care. In: Showstack J, Rothman AA, Hassmiller S. The Future of Primary Care. San Francisco: CA: Jossey-‐Bass; 2004. p. 61-‐88.
2 Alberta Health. Primary health care [Internet]. Edmonton, Alberta, Canada: Government of Alberta; 2013 [cited 2013 Nov 26]. Available from: http://www.health.alberta.ca/services/primary-‐health-‐care.html
3 Health Council of Canada. Health Care Renewal in Canada: Accelerating Change [Internet]. Ottawa, Ontario, Canada: Health Council of Canada; 2005 Jan [cited 2014 Jan 9]. Available from: http://healthcouncilcanada.ca/rpt_det.php?id=170
4 Starfield B. Contribution of primary care to health systems and health. Milbank Q. 2005;83(3):457-‐502.
5 Saultz J. Defining and measuring interpersonal continuity of care. Ann Fam Med. 2003;1:134-‐43.
6 Hollander MJ, Kadlec H, Hamdi R, Tessaro A. Increasing value for money in the Canadian healthcare system: new findings on the contribution of primary care services. Healthc Q. 2009;12(4):32-‐44.
7 Saultz JW, Lochner J. Interpersonal continuity of care and care outcomes: a critical review. Ann Fam Med. 2005;3(2):159-‐66.
8 Haggerty J, Reid RJ, Freeman GK, Starfield B, Adair CE, McKendry R. Continuity of care – a multidisciplinary review. BMJ. 2003;327:1219-‐21.
9 The College of Family Physicians of Canada. A vision for Canada: Family practice – the patient’s medical home [Internet]. Mississauga, Ontario, Canada: The College of Family Physicians of Canada; 2011 Sep [cited 2013 Dec 17]. Available from: http://www.cfpc.ca/uploadedFiles/Resources/Resource_Items/PMH_A_Vision_for_Canada.pdf
10 Fontaine P, Flottemesch TJ, Solberg LI, Asche SE. Is consistent primary care within a patient-‐centred medical home related to utilization patterns and costs? JACM. 2011 Mar;34(1):10-‐19.
11 Flottemesch TJ, Fontaine P, Asche SE, Solberg LI. Relationship of clinic medical home scores to health care costs. JACM. 2011;34(1):78-‐89.
12 Rosenthal TC. The medical home: growing evidence to support a new approach to primary care. J. Am. Board Fam. Med. 2008;21:427-‐440.
13 The College of Family Physicians of Canada. Best advice: patient rostering in family practice [Internet]. Mississauga, Ontario, Canada: The College of Family Physicians of Canada; 2012 Nov [cited 2014 Feb 20]. Available from: http://www.cfpc.ca/uploadedFiles/Health_Policy/CFPC_Policy_Papers_and_Endorsements/CFPC_Policy_Papers/BestAdvice_RosteringFINALOct30.pdf
REFERENCES 52
14 Toward Optimized Practice. Guide to Panel Identification. For Alberta primary care [Internet]. Edmonton, Alberta, Canada: Toward Optimized Practice; Feb 2014 [cited 2014 Mar 10]. Available from: http://www.topalbertadoctors.org/home/ 15 Health Quality Council of Alberta. Symposium: using panel management to improve healthcare practice and patient outcomes [Internet]. Calgary, Alberta, Canada: Health Quality Council of Alberta; 2013 [cited 2014 Feb 25]. Available from: http://www.hqca.ca/index.php?id=289
16 Alberta Health and Wellness, Alberta Medical Association and Regional Health Authorities. Master agreement regarding the tri-‐lateral relationship and budget management process for strategic physician agreements [Internet]. Edmonton, Alberta, Canada: Government of Alberta; 2003 Apr [cited 2013 Dec 17]. Available from: http://www.health.alberta.ca/documents/Trilateral-‐agreement-‐2004.pdf
17 Saher MN. Report of the Auditor General of Alberta [Internet]. Edmonton, Alberta, Canada: Auditor General Alberta; 2012 Jul [cited 2013 Dec 17]. Available from: http://www.oag.ab.ca/webfiles/reports/OAGJuly2012report.pdf
18 Alberta AIM. What is Alberta AIM? [Internet]. 2005. [cited 2014 January 9]. Available from: http://www.albertaaim.ca/index.php/about-‐aim/what-‐is-‐alberta-‐aim
19 Alberta Health. Family Care Clinics [Internet]. Edmonton, Alberta, Canada: Government of Alberta; 2013 June [cited 2014 Jan 9]. Available from: http://www.health.alberta.ca/services/family-‐care-‐clinics.html
20 Starfield B. A framework for measuring primary care. In: Primary Care: Balancing Health Needs, Services and Technology. New York: Oxford University Press; 1998. p. 19-‐34.
21 Nelson EC, Mohr JJ, Batalden PB, Plume SK. Improving health care, Part 1: The clinical value compass. Joint Comm J Qual Improv. 1996;22(4):243-‐58.
22 Ludwick DA, Doucette J. The implementation of operational processes for the Alberta electronic health record: lessons for electronic medical record adoption in primary care [Internet]. ElectronicHealthcare. 2009 Mar [cited 2013 Dec 17];7(4):107-‐11. Available from: http://www.longwoods.com/content/20570
23College of Physicians & Surgeons of Alberta, The Messenger. EMR Forum: EMR as a standard of practice? [Internet] College of Physicians & Surgeons of Alberta; 2013 May 2 [cited 2013 Dec 17]. Available from: http://www.cpsa.ab.ca/Resources/the-‐messenger/EMRForum/emr-‐forum/2013/05/02/emr-‐as-‐a-‐standard-‐of-‐practice-‐
24 Vegda K, Nie JX, Wang L, Tracy CS, Moineddin R, Upshur REG. Trends in health services utilization, medication use, and health conditions among older adults: a 2-‐year retrospective chart review in a primary care practice [Internet]. BMC Health Serv Res. 2009 [cited 2014 Jan 15];9(217). Available from: http://www.biomedcentral.com/1472-‐6963/9/217
25 Morgan S, Cunningham C. Population aging and the determinates of healthcare expenditures: the case of hospital, medical and pharmaceutical care in British Columbia, 1996 to 2006. Healthcare Policy 2011; 7(1):68-‐79.
REFERENCES 53
26 Bertaksi KD, Azari R, Helms J, Callahan E, Robbins JA. Gender differences in the utilization of health care Services[Internet]. J Fam Practice. 2000 [cited 2014 Jan 15];49(2). Available from: http://www.jfponline.com/purls/Pages.asp?AID=2450
27 Mustard CA, Kaufert P, Kozyrskyi A, Mayer T. Sex differences in the use of health care services. N Engl J Med. 1998; 338:1678-‐1683.
28 Health Council of Canada. Health Care Renewal in Canada: Measuring Up? [Internet]. Toronto, Ontario, Canada: Health Council of Canada; 2007 Feb [cited 2013 Dec 17]. Available from: http://www.healthcouncilcanada.ca/rpt_det.php?id=168
29 Anderson R, Newman JF. Societal and individual determinants of medical care utilization in the United States. Milbank Q. 2005;83(4):1-‐28.
30 3M Health Information Systems. Clinical Risk Grouping Software Definitions Manual, Update for v1.8. Wallingford, CT: 3M Company; 2010. 31 Dutton D. Financial, organizational and professional factors affecting health care utilization. Soc Sci Med. 1989;23(7):721-‐735.
32 Canadian Institute for Health Information. National physician database, 2010-‐2011 – data release [Internet]. Ottawa, Ontario, Canada: Canadian Institute for Health Information; 2013 [cited 2014 Jan 15]. Available from: https://secure.cihi.ca/estore/productFamily.htm?locale=en&pf=PFC2032
33 Health Quality Council of Alberta. Review of the quality of care and safety of patients requiring access to emergency department care and cancer surgery and the role and process of physician advocacy [Internet]. Calgary, Alberta, Canada: The Health Quality Council of Alberta; 2012 Feb [cited 2014 February 20]. Available from: http://hqca.ca/assets/files/EDCAP%20FINAL%20REPORT.pdf
34 Fryback R. D. et al. U.S. Norms for six generic health-‐related quality-‐of-‐life indexes from the national health measurement study[Internet]. Med Care. 2007 Dec [cited 2014 Feb]; 45(12). Available from: http://www.ncbi.nlm.nih.gov/pmc/articles/PMC2647803/
35 Alberta Health Services. Team Based Care Planning Working Group. Self-‐management and complex care planning workbook. Edmonton, Alberta, Canada: Alberta Health Services; 2010.

Suggested Citation:Health Quality Council of Alberta. Primary Care Measurement Initiative. Calgary, Alberta, Canada: Health Quality Council of Alberta; March 2014.

210, 811 – 14 Street NW Calgary, Alberta, Canada T2N 2A4
T: 403.297.8162 F: 403.297.8258 E: [email protected] www.hqca.ca