Embed Size (px)
Citation preview

INNOVA Research Journal, ISSN 2477-9024
(Septiembre, 2016). Vol. 1, No.9 pp. 96-113 DOI: https://doi.org/10.33890/innova.v1.n9.2016.98
URL: http://revistas.uide.edu.ec/index.php/innova/index Correo: [email protected]
Revista de la Universidad Internacional del Ecuador. URL: https://www.uide.edu.ec/ 98
Primary education in Nigeria at a glance: statistical overview of the subsector
Resumen de la educación primaria en Nigeria: panorama estadístico del
subsector
Andrés Alberto Chávez Eras
Universidad Internacional del Ecuador, Ecuador
Autor para correspondencia: [email protected]
Fecha de recepción: 30 de Agosto de 2016 - Fecha de aceptación: 28 de Septiembre de 2016
Resumen
El siguiente estudio se enfoca en la educación primaria en Nigeria. Primeramente analizaremos los
antecedentes políticos, económicos y sociales del país. Para con esto, poder tener un mejor
entendimiento del sistema educativo. Se analizara los problemas con las finanzas, acceso y calidad
de la educación.
Palabras claves: sistema educativo; áfrica; calidad educación
Abstract
The following study focuses on primary education in Nigeria. First we analyze the political,
economic and social history of the country. For this, to have a better understanding of the education
system. problems with finances, access and quality of education are analyzed.
Key words: education system; africa; quality education

INNOVA Research Journal 2016, Vol 1, No. 9, pp. 98-113
Revista de la Universidad Internacional del Ecuador. URL: https://www.uide.edu.ec/ 99
Introduction
Nigeria is the most populated country in Africa, with an estimated 174,507,539 people as
of July 2013. Within this population, there are over 250 ethnic groups and 500 languages.
Political Indicators
Nigeria adopted a new constitution in 1999 that transitioned the country from military
rule to a civilian government (Federal Republic of Nigeria, 2013). Now, the Federal Republic of
Nigeria is a federal constitutional republic similar to the United States, with executive,
legislative, and judicial branches. General elections are held every four years to choose a
president (Federal Republic of Nigeria, 2013). Despite the official government setup, Nigeria’s
scores on the Democracy Index indicate that the country is still far from functioning as a
democracy, as seen in Table 1. All scores are out of a possible 10.0 (Philip & Ojeka, 2011).
Table 1 Democracy Index for Nigeria Year Rank Overall
Score
Electoral
Process and
Participation
Functioning
of
Government
Political
Participation
Political
Culture
Civil
Liberties
2006 124 3.52 3.08 1.86 4.44 4.38 3.82
2008 124 3.53 2.92 3.21 3.33 4.38 3.82
2010 123 3.47 3.83 3.21 3.33 3.13 3.82
Note. From “Democracy and Development: An Appraisal of Nigeria’s Position in the Democracy Index” by C.
Philip & S. Ojeka, 2011, Research Journal of Finance and Accounting 2(2), p.4.
According to the Corruption Perceptions Index, Nigeria ranks 137 out of 176 countries,
with a score of 27 out of 100. People perceive the police and political parties to be the most
corrupted institutions (Transparency International, 2013).
Economic Indicators
GDP per capita in Nigeria increased to 1,555.41 (US$) in 2012. However, external debt
stocks have risen as well. Nigeria was forgiven $30 billion of debt in 2006, but has continued to
accumulate debt since that time and had external debt stocks of $13,108 billion in 2011 (World
Bank, 2013).
In recent years, the amount of aid that Nigeria has received for education has increased
significantly. As shown in Table 2, the amount received in 2010 was almost five times that
which was received in 2002-2003.
Table 2 Total Aid to Education Constant 2010 US$ millions
2002–2003 annual average 2009 2010
35 133 165
Note. From EFA Global Monitoring Report 2012: YOUTH AND SKILLS Putting education to work p.402, by
UNESCO, 2012, Paris: UNESCO.
INNOVA Research Journal 2016, Vol 1, No. 9, pp. 98-113
Revista de la Universidad Internacional del Ecuador. URL: https://www.uide.edu.ec/ 100
Table 3 shows the facts about the wellbeing of Nigeria’s people. Over half of the
population lives in absolute poverty, a significant percentage of people live in unsanitary
conditions, and the life expectancy rate is much lower than that of developed nations.
Additionally, only half of the population is literate.
Table 3 Nigeria Poverty Indicators Poverty Indicator 2011
Life expectancy at birth 53yrs
% of pop with access to improved water 58%*
% of pop with access to improved sanitation 31%*
% of pop with access to electricity* 51%
Living in absolute poverty 60.9%*
Children under 5 underweight 26.7**
Literacy 50.4%
(72.1%male)
(50.4% female)
Unemployment rate 21% est.
Note. From Poverty in Nigeria, Noble Mission Organization, 2013 *2010, **2008
Social Development
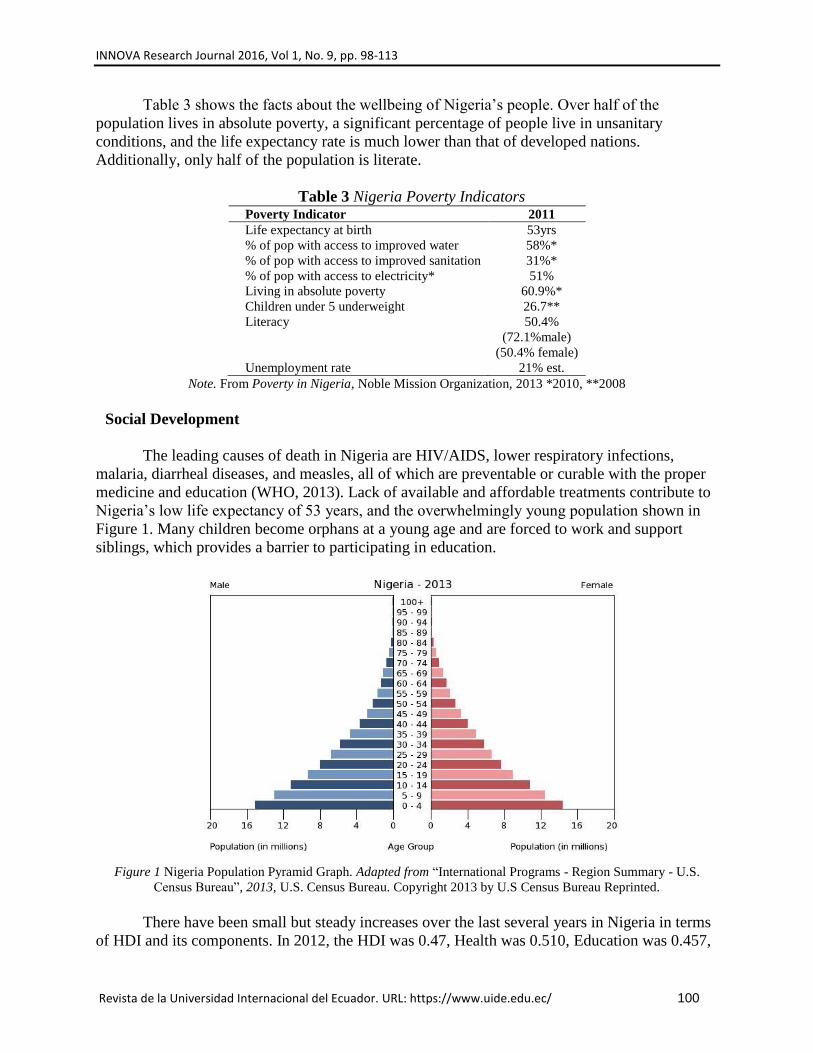
The leading causes of death in Nigeria are HIV/AIDS, lower respiratory infections,
malaria, diarrheal diseases, and measles, all of which are preventable or curable with the proper
medicine and education (WHO, 2013). Lack of available and affordable treatments contribute to
Nigeria’s low life expectancy of 53 years, and the overwhelmingly young population shown in
Figure 1. Many children become orphans at a young age and are forced to work and support
siblings, which provides a barrier to participating in education.
Figure 1 Nigeria Population Pyramid Graph. Adapted from “International Programs - Region Summary - U.S.
Census Bureau”, 2013, U.S. Census Bureau. Copyright 2013 by U.S Census Bureau Reprinted.
There have been small but steady increases over the last several years in Nigeria in terms
of HDI and its components. In 2012, the HDI was 0.47, Health was 0.510, Education was 0.457,

INNOVA Research Journal 2016, Vol 1, No. 9, pp. 98-113
Revista de la Universidad Internacional del Ecuador. URL: https://www.uide.edu.ec/ 101
and Income was 0.450 (HDR, 2013). As shown in Figure 2, gains in education have been the
slowest and have leveled off in recent years.
Figure 2. Trends in Nigeria’s HDI component indices 2005-2012. Adapted from “Human Development Report
2013 Nigeria” 2013, Human Development Report. (HDR). Copyright 2013 by Human Development Report.
Reprinted.
The Education System
The formal educational system in Nigeria presents various paths that students can take,
starting with secondary education. At 12 years of age, children start either junior secondary or
vocational enterprise institutions programs. If they attend the former, they receive a junior
secondary school certificate upon completion; if they attend the latter, they receive a certificate
of proficiency. At 15 years of age, students who have received a junior secondary school
certificate may attend either senior secondary or secondary technical schools programs. Less
than one-third of students who begin school in Nigeria go on to enroll in senior secondary school
(Nigerian Education Profile, 2013).
Then, at age 18, the number of options increases for those students who completed senior
secondary school and received either a West African senior school certificate or National
examinations council certificate. However, in order to proceed to a tertiary institution, students
must pass the Senior School Leaving Certificate; in 2010, 80% of students failed this certificate
due to inability to pass English and Mathematics, among other subjects (Nigerian Education
Profile, 2013). Students who are still deficient in some courses do have the opportunity to attend
classes that will allow them to later matriculate in a university. There are also short certificate
courses available that are oriented towards the labor market. Students may choose to enroll in
bachelor programs, college and polytechnic programs, teacher training schools, or the school of
nursing. Students who complete these programs may also be eligible to pursue further education,
such as master programs, the higher national diploma, or a doctorate program. There are no post-
secondary options available for students who complete vocational enterprise institutions
programs or secondary technical schools programs (see Appendix A and Appendix B for more
details).

INNOVA Research Journal 2016, Vol 1, No. 9, pp. 98-113
Revista de la Universidad Internacional del Ecuador. URL: https://www.uide.edu.ec/ 102
Table 4 presents the statistics for student enrollment in Nigeria. It is evident that although
both primary and secondary education are labeled as compulsory, there are far fewer students
participating in secondary education than those in primary education. The table also shows that
despite the 500 languages that are spoken in Nigeria, children are instructed in three local
languages at the beginning of their primary schooling, and then only in English after their third
year of primary education.
Table 4 Nigeria: Country and Education System Vital Stats Population 174.5 million
Language of Instruction English (Hausa, Ibo and Yoruba in the first 3 years of primary)
Compulsory Education Primary & Lower Secondary School (Grades 1-9)
Academic Year September to July
Number of Universities 128 (51 private)
Number of Students -Primary (6-12): 20,682,000
-Secondary (12-17): 9,057,000
-Tertiary (18+): 1,700,000
Lower Secondary Gross Enrollment Ratio 47%
Secondary Gross Enrollment Ratio 44%
Tertiary Gross Enrollment Ratio 10%
Note: From “An Overview of Education in Nigeria” by N. Clark & C. Ausukuya, 2013, World Education News &
Reviews, p.1.
The tracking system in Nigeria makes it difficult for many students to progress in the
education system. Those who enroll in vocational programs at age 12 have no opportunity to
receive the necessary certificates to one day participate in tertiary education. Much of these
students’ future is already decided from this young age, and it will be difficult for them to change
their course once they are set in this path. The same is true for those students that begin technical
programs at age 15 instead of attending senior secondary school.
Indicators for the Subsector
Education Finance
There is little reliable information available for financial expenditures in Nigeria. As one
researcher found, even in official reports by UNESCO and World Bank “educational expenditure
data for Nigeria are either totally omitted or are recorded for the Federal Government alone”
(Hinchliffe, 2002). Another author warned, with regards to studies in Nigeria, that “it is
important to remember that expenditure estimates are made on partial, often inadequate, data”
(World Bank, 2008). With that in mind, the following represents the most recent available data
from the region.
The federal budget for education decreased during the years of 2001-2004, but then began
to increase significantly in 2006. Despite this increase in the overall budget, federal education
allocation has failed to keep up with the growth that Nigeria has experienced in GDP. It has
actually declined over time from 1.8% in 2001 to 1.4% in 2007. The federal education budget,
however, has risen slightly, from constituting 10.7% of the total federal budget in 2001 to 12.5%
in 2007 (see Appendix C).

INNOVA Research Journal 2016, Vol 1, No. 9, pp. 98-113
Revista de la Universidad Internacional del Ecuador. URL: https://www.uide.edu.ec/ 103
Families contribute to the cost of education across all sectors. Table 5 shows the amount
of money that families from varying socioeconomic backgrounds pay for different aspects of
education, such as fees and books, as well as the percentage of families that pay for each
category. It is notable that 93% of even the poorest families in Nigeria have to pay some type of
expenditure for their children’s education. Although primary education is supposed to be
compulsory and free in Nigeria, almost half of the poorest families are still paying fees just so
their children can attend primary school.
Table 5 Expenditures in Primary School, by Level of per Capita Expenditures Quintile
and
Indicator
Fees
Parent-
Teacher
association
Uniforms
Book
and
supplies
Transportation
Room
and
Board
Other
Total
Amount spent (naira)
Poorest 1,193 221 469 517 721 1,413 319 1,807
II 1,566 179 585 539 1,169 1,910 618 2,217
III 1,690 270 526 731 1,866 1,376 671 2,671
IV 2,403 390 637 932 1,908 1,781 827 3,814
Richest 5,351 442 817 1,354 2,999 3,089 1,590 7,718
Percentage paying
Poorest 46 53 75 76 7 10 28 93
II 45 53 75 81 8 8 30 95
III 49 55 77 82 12 9 34 96
IV 50 56 79 85 17 14 40 95
Richest 67 53 81 85 22 13 44 96
Total 51 54 77 82 13 11 35 95
Note. From “Nigeria A Review of the Costs and Financing of Public Education” by World Bank, 2008, Human
Development Unit Africa Region, 2, p.117.
Teachers in Nigeria are paid different amounts depending on the states in which they
teach. Table 6 shows that there is a significant gap between these wages, ranging from 151,000
naira in Kaduna to 518,000 naira in Lagos. This difference equals approximately $2,295 in US
currency, and shows that teachers in some states make less than one-third of teachers in another.
Table 6 Average Annual Pay for Public Primary and teachers in SEPER States, 2005/06 Annual Pay (naira
thousand rounded)
As a percent of state per capital
household expenditure
As a percent of per capital
national GDP
State
Borno 266 721 244
Cross
River
196 529 180
Enugu 304 613 279
FCT 307 728 282
Jigawa 155 899 142
Kaduna 151 332 139
Kano 153 385 140
Kwara 201 893 185
Lagos 518 1,374 476
Note. From “Nigeria A Review of the Costs and Financing of Public Education” by World Bank, 2008, Human
Development Unit Africa Region, 2, p.102.
Access to Education
INNOVA Research Journal 2016, Vol 1, No. 9, pp. 98-113
Revista de la Universidad Internacional del Ecuador. URL: https://www.uide.edu.ec/ 104
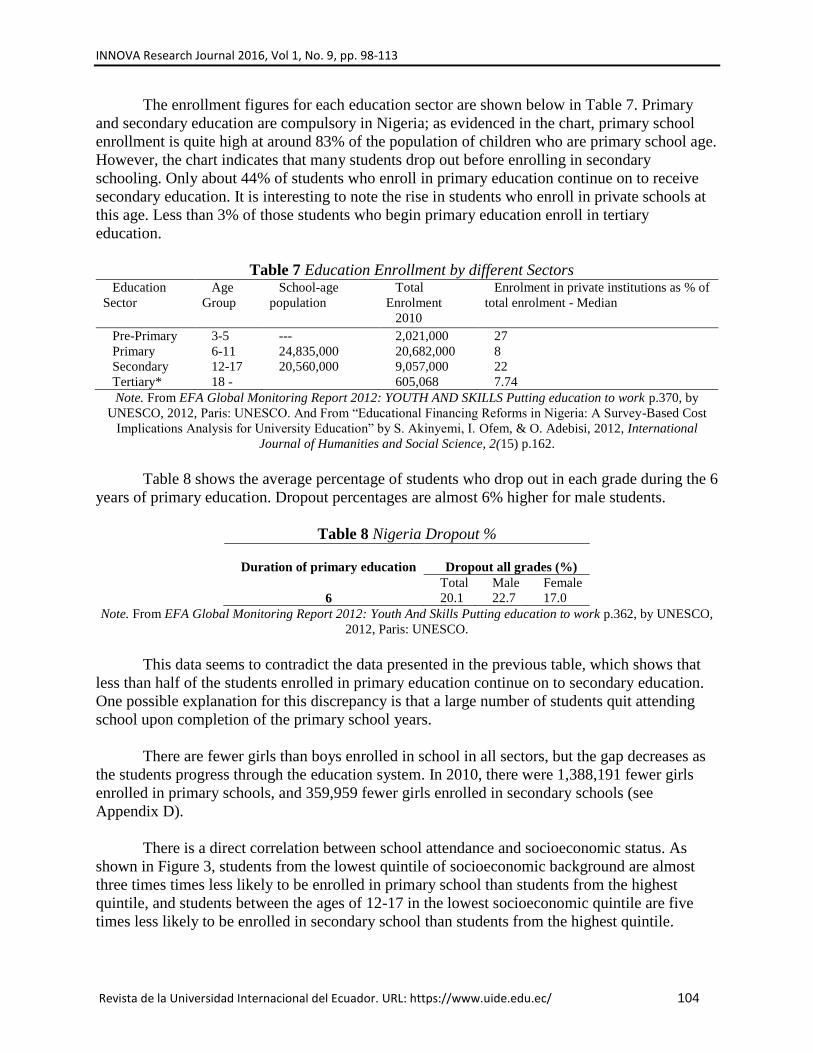
The enrollment figures for each education sector are shown below in Table 7. Primary
and secondary education are compulsory in Nigeria; as evidenced in the chart, primary school
enrollment is quite high at around 83% of the population of children who are primary school age.
However, the chart indicates that many students drop out before enrolling in secondary
schooling. Only about 44% of students who enroll in primary education continue on to receive
secondary education. It is interesting to note the rise in students who enroll in private schools at
this age. Less than 3% of those students who begin primary education enroll in tertiary
education.
Table 7 Education Enrollment by different Sectors Education
Sector
Age
Group
School-age
population
Total
Enrolment
2010
Enrolment in private institutions as % of
total enrolment - Median
Pre-Primary 3-5 --- 2,021,000 27
Primary 6-11 24,835,000 20,682,000 8
Secondary 12-17 20,560,000 9,057,000 22
Tertiary* 18 - 605,068 7.74
Note. From EFA Global Monitoring Report 2012: YOUTH AND SKILLS Putting education to work p.370, by
UNESCO, 2012, Paris: UNESCO. And From “Educational Financing Reforms in Nigeria: A Survey-Based Cost
Implications Analysis for University Education” by S. Akinyemi, I. Ofem, & O. Adebisi, 2012, International
Journal of Humanities and Social Science, 2(15) p.162.
Table 8 shows the average percentage of students who drop out in each grade during the 6
years of primary education. Dropout percentages are almost 6% higher for male students.
Table 8 Nigeria Dropout %
Duration of primary education
Dropout all grades (%)
Total Male Female
6 20.1 22.7 17.0
Note. From EFA Global Monitoring Report 2012: Youth And Skills Putting education to work p.362, by UNESCO,
2012, Paris: UNESCO.
This data seems to contradict the data presented in the previous table, which shows that
less than half of the students enrolled in primary education continue on to secondary education.
One possible explanation for this discrepancy is that a large number of students quit attending
school upon completion of the primary school years.
There are fewer girls than boys enrolled in school in all sectors, but the gap decreases as
the students progress through the education system. In 2010, there were 1,388,191 fewer girls
enrolled in primary schools, and 359,959 fewer girls enrolled in secondary schools (see
Appendix D).
There is a direct correlation between school attendance and socioeconomic status. As
shown in Figure 3, students from the lowest quintile of socioeconomic background are almost
three times times less likely to be enrolled in primary school than students from the highest
quintile, and students between the ages of 12-17 in the lowest socioeconomic quintile are five
times less likely to be enrolled in secondary school than students from the highest quintile.

INNOVA Research Journal 2016, Vol 1, No. 9, pp. 98-113
Revista de la Universidad Internacional del Ecuador. URL: https://www.uide.edu.ec/ 105
Appendix E shows more detail about how these inequities are spread across residence, region,
and gender.
Figure 3 Primary and Secondary Net Attendance Ratio, by Economic Status Quintile Note. From Nigeria
Demographic and Health Survey (DHS) EdData Profile 1990, 2003, and 2008: Education Data for Decision-
Making. 2011 p.57-58, by National Population Commission (Nigeria) and RTI International, 2011, Washington, DC:
National Population Commission and RTI International.
Quality of Education
Over the last 20 years, there has been an increase in teachers in Nigeria, which has
resulted in a decreased pupil/teacher ratio, as can be seen in Table 9. This is a positive change
that can lead to increased quality of education, but it is not enough. The 2010 ratio of 36 students
per teacher is still quite high.
Table 9 Pupil-Teacher Ratio Teaching Staff Pupil/teacher ratio
1990 2010 1990 2010
432000 574000 41 36
Note. From EFA Global Monitoring Report 2012: Youth And Skills Putting education to work p.378, by UNESCO,
2012, Paris: UNESCO.
The percentage of qualified teachers in the workforce varies greatly by state in Nigeria.
As seen in Table 10, there is an extremely low percentage of qualified teachers working in the
rural areas of the Federal Capital Territory, whereas a fairly high percentage of teachers are
qualified in the urban areas of the same region. Jigawa has the lowest overall percentages of
qualified teachers, while Enugu and Lagos have the overall highest. As shown earlier in this
paper in Table 6, teachers in Jigawa are among those who earn the least amount of money in
Nigeria, and teachers in Enugu and Lagos make significantly more. This is an indication that
students who live in poorer areas are less likely to be instructed by qualified teachers.
Table 10 Qualified Primary Schoolteachers in Select States, by Location 2005 Primary
State and gender Rural Urban
Borno
Female 41 47
Male 30 34
Cross River
Female 42 63
Male 46 53
Enugu
3051
71 78 82
1227
4459
73
Lowest Second Middle Fourth Highest
Primary Secondary
INNOVA Research Journal 2016, Vol 1, No. 9, pp. 98-113
Revista de la Universidad Internacional del Ecuador. URL: https://www.uide.edu.ec/ 106
Female 66 82
Male 61 69
FCT
Female 10 90
Male 17 72
Jigawa
Female 21 22
Male 17 32
Lagos
Female 66 69
Male 53 53
Note. From “Nigeria A Review of the Costs and Financing of Public Education” by World Bank, 2008, Human
Development Unit Africa Region, 2, p.179.
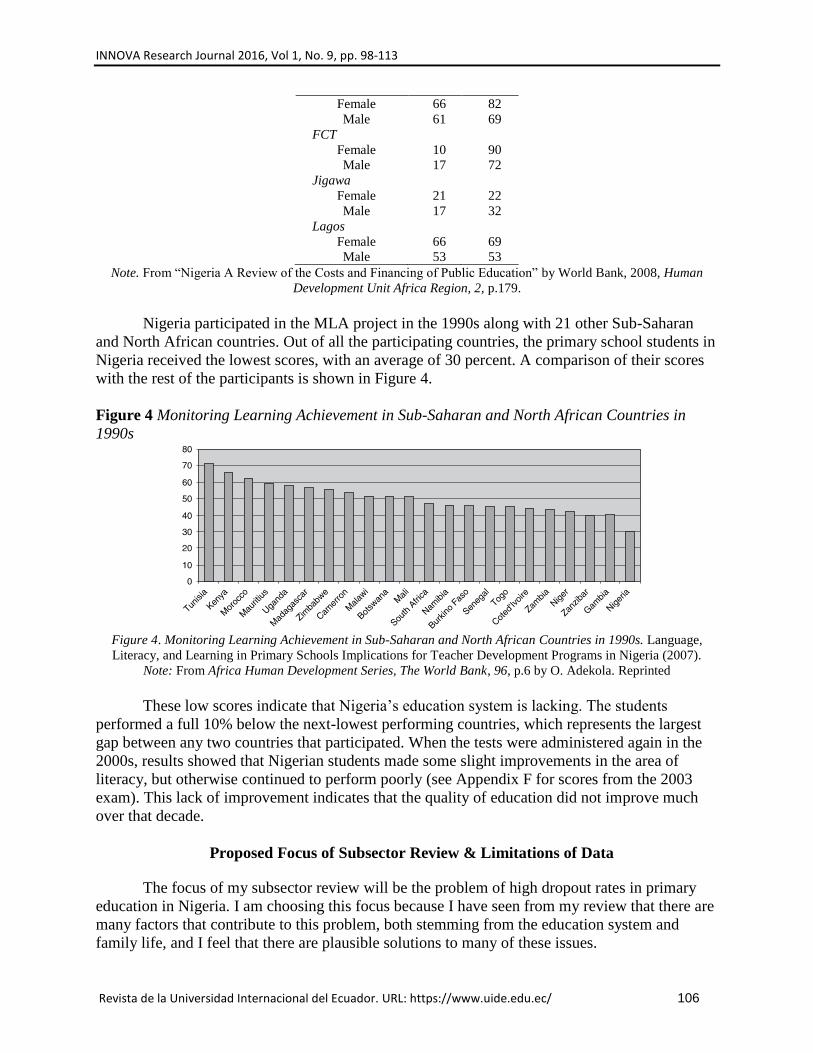
Nigeria participated in the MLA project in the 1990s along with 21 other Sub-Saharan
and North African countries. Out of all the participating countries, the primary school students in
Nigeria received the lowest scores, with an average of 30 percent. A comparison of their scores
with the rest of the participants is shown in Figure 4.
Figure 4 Monitoring Learning Achievement in Sub-Saharan and North African Countries in
1990s
Figure 4. Monitoring Learning Achievement in Sub-Saharan and North African Countries in 1990s. Language,
Literacy, and Learning in Primary Schools Implications for Teacher Development Programs in Nigeria (2007).
Note: From Africa Human Development Series, The World Bank, 96, p.6 by O. Adekola. Reprinted
These low scores indicate that Nigeria’s education system is lacking. The students
performed a full 10% below the next-lowest performing countries, which represents the largest
gap between any two countries that participated. When the tests were administered again in the
2000s, results showed that Nigerian students made some slight improvements in the area of
literacy, but otherwise continued to perform poorly (see Appendix F for scores from the 2003
exam). This lack of improvement indicates that the quality of education did not improve much
over that decade.
Proposed Focus of Subsector Review & Limitations of Data
The focus of my subsector review will be the problem of high dropout rates in primary
education in Nigeria. I am choosing this focus because I have seen from my review that there are
many factors that contribute to this problem, both stemming from the education system and
family life, and I feel that there are plausible solutions to many of these issues.

INNOVA Research Journal 2016, Vol 1, No. 9, pp. 98-113
Revista de la Universidad Internacional del Ecuador. URL: https://www.uide.edu.ec/ 107
Some of the deficiencies in the education system that contribute to this problem are an
insufficient amount of teachers, a lack of qualified teachers, required expenses that many
families in poverty cannot afford, and instruction in a language (English) that children do not
understand. These problems are more complex than they initially appear, and addressing them
will obviously require collaboration with local stakeholders, but there are several possible ways
to address these obstacles. These might include policies that would raise teacher salaries and
provide incentives for teachers to become qualified. It may also be feasible to decrease the cost
of education for families by eliminating school fees and providing textbooks free of charge.
Additionally, policies regarding language of instruction could be altered in order to allow for
more classes to be taught in students’ native languages so that they feel more confident to
succeed.
There are issues in Nigerian family life that contribute to the dropout rate as well. The life
expectancy in Nigeria is only 53, so many children become orphans at a young age and are
unable to continue their education. Additionally, with over half of the population living in
extreme poverty, many families need their children to work and are unable to spare this extra
income by sending them to school. Some possible solutions to these issues include improving
access to health care and medicine in the country, as well as sanitary living conditions, so that
the life expectancy can be increased. Also, there could be some changes made to the education
system that would give poor families financial incentives to send their children to school, so that
eventually they can become empowered to break the cycle of poverty through their education.
There is limited data available regarding budgets and finances in Nigeria, so it will be
difficult to determine how the government can reallocate funds to address the issues that I have
mentioned in this section. Most of the available data refer only to estimates rather than actual
figures, and it is therefore unlikely that I will be able to present a clear picture of how the country
is currently using its funds to support education, health reforms, and families in poverty.
Bibliography
Adekola, O. (2007). Language, Literacy, and Learning in Primary Schools Implications for
Teacher Development Programs in Nigeria. Africa Human Development Series, The World
Bank 96, 1-78. Retrieve October 4, 2013 from
https://openknowledge.worldbank.org/handle/10986/6737
Akinyemi S., Ofem I. B., and Adebisi O. (2012) Educational Financing Reforms in Nigeria: A
Survey-Based Cost Implications Analysis for University Education , International Journal
of Humanities and Social Science, 2(15) 155-165.
Clark, N., & Ausukuya, C. (2013) World Education News & Reviews (WENR). An Overview of
Education in Nigeria. Retrieved October 20, 2013, from http://wenr.wes.org/2013/07/an-
overview-of-education-in-nigeria/
Federal Republic of Nigeria. (2013). About Nigeria. Retrieved October 18, 2013, from
www.nigeria.gov.ng/2012-10-29-11-05-46

INNOVA Research Journal 2016, Vol 1, No. 9, pp. 98-113
Revista de la Universidad Internacional del Ecuador. URL: https://www.uide.edu.ec/ 108
Hinchliffe, K. (2002). Public Expenditures on Education in Nigeria: Issues, Estimates and Some
Implications Keith Hinchliffe Africa Region. Abuja: Human Development Sector Africa
Region The World Bank. Retrieve October 4, 2013 from http://siteresources.worldbank.org/
AFRICAEXT/Resources/no_29.pdf
Human Development Report. (HDR). (2013). Human Development Report 2013 Nigeria.
Retrieved October 17, 2013, from hdrstats.undp.org/images/explanations/NGA.pdf
Mamedu, A., & Wetheridge, L. (2013). Transforming education for girls in Nigeria: Endline
research summary report. Abuja: ActionAid.
National Population Commission (Nigeria) and RTI International. (2011). Nigeria Demographic
and Health Survey(DHS) EdData Profile 1990, 2003, and 2008: Education Data for
Decision-Making. 2011. Washington, DC: National Population Commission and RTI
International.
Nigerian Education Profile - United States Diplomatic Mission to Nigeria. (2013). United States
Diplomatic Mission to Nigeria. Retrieved October 20, 2013, from
http://nigeria.usembassy.gov/nigeria_education_profile.html
Noble Mission Organization. (2013). Poverty in Nigeria. Retrieved October 20, 2013, from
http://www.noblemissions.org/index.php/program-news/21-poverty-in-nigeria
Onyukwu, J. (2012). World Education News & Reviews (WENR). The Educational System of
Nigeria. Retrieved October 20, 2013, from http://wenr.wes.org/2011/08/wenr-julyaugust-
2011-practical-information/
Philip, C. O., & Ojeka, S. A. (2011). Democracy and Development: An Appraisal of Nigeria’s
Position in the Democracy Index. Research Journal of Finance and Accounting, 2(2), 1-6.
Transparency International. (2013). Transparency International. Retrieved October 18, 2013,
from www.transparency.org/country#NGA
U.S. Census Bureau. (2013). International Programs - Region Summary - U.S. Census Bureau.
Retrieved October 20, 2013, from
http://www.census.gov/population/international/data/idb/region.php?N=%20Results%20&
T=12&A=separate&RT=0&Y=2013&R=-1&C=NI
UNESCO. (2012). EFA Global Monitoring Report 2012: Youth And Skills Putting education to
work. Paris: UNESCO. Retrieve October 4, 2013 from
http://unesdoc.unesco.org/images/0021/ 002180/218003e.pdf
UNESCO. (2013). UNESCO Institute for Statistic. Isced Mappings . Retrieved October 20, 2013,
from http://www.uis.unesco.org/Education/ISCEDMappings/Pages/default.aspx

INNOVA Research Journal 2016, Vol 1, No. 9, pp. 98-113
Revista de la Universidad Internacional del Ecuador. URL: https://www.uide.edu.ec/ 109
World Bank. (2008). Nigeria A Review of the Costs and Financing of Public Education. World
Bank - Human Development Unit Africa Region, 2, 1-190.
World Bank. (2013). International Debt Statistics 2013. Washington, D.C.: World Bank.
World Health Organization (WHO). (2012). WHO Nigeria. WHO African Region: Nigeria.
Retrieved October 18, 2013, from
www.who.int/entity/healthinfo/statistics/bodgbddeathdalyestimates.xis

INNOVA Research Journal 2016, Vol 1, No. 9, pp. 98-113
Revista de la Universidad Internacional del Ecuador. URL: https://www.uide.edu.ec/ 110
Appendix A
Nigeria ISCED Mapping
Note. From ISCED MAPPINGS, UNESCO Institute for Statistic, by UNESCO, 2013.
Nig
eri
a_
ISC
ED
_m
ap
pin
g.x
lsP
ag
e 1
/2
Sch
oo
l Ye
ar
refe
ren
ce:
20
10
AB
CD
EF
GI
JK
LM
IDN
am
e o
f th
e e
du
ca
tio
n
pro
gra
mm
e
Min
imu
m e
ntr
an
ce
req
uir
em
en
ts
Ma
in d
iplo
mas
, q
uali
fic
ati
on
s
or
ce
rtif
ica
tes
aw
ard
ed
at
en
d
of
pro
gra
mm
e
Theoretical entrance
age
Theoretical duration
(in years)
Is t
he
pro
gra
mm
e
pa
rt o
f
Co
mp
uls
ory
Ed
uc
ati
on
?
ISCED97
programme
destination
Pro
gra
mm
e
ori
en
tati
on
or
Po
sit
ion
in
Na
tio
na
l S
tru
ctu
re
Theoretical entrance
age
Theoretical duration
No
tes
1P
re-p
rim
ary
ed
uca
tion
3 y
ears
old
na
33
NP
re-p
rim
ary
ed
uca
tion
0na
na
33
2P
rim
ary
ed
uca
tion
6 y
ears
old
Pri
ma
ry s
cho
ol l
ea
vin
g
exa
min
atio
n6
6Y
Pri
ma
ry e
du
catio
n1
na
na
66
3Ju
nio
r se
con
dary
Com
ple
tion
of p
rim
ary
ed
uca
tion
Jun
ior
seco
nd
ary
sch
oo
l
cert
ifica
te12
3Y
AG
4V
oca
tion
al e
nte
rprise
inst
itutio
ns
pro
gra
mm
es
Com
ple
tion
of p
rim
ary
ed
uca
tion
Ce
rtifi
cate
of
pro
ficie
ncy
12
2-3
YC
V
5S
en
ior
seco
nda
ryJu
nio
r se
con
da
ry s
cho
ol
cert
ifica
te
We
st A
fric
an
se
nio
r sc
ho
ol
cert
ifica
te (
WA
SS
C)
or
Na
tion
al e
xam
ina
tion
s co
unci
l
(NE
CO
) ce
rtifi
cate
15
3N
AG
We
st A
fric
an
se
nio
r sc
ho
ol c
ert
ifica
te
(WA
SS
C)
is a
wa
rde
d b
y th
e W
est
Afr
ica
n
Exa
min
atio
ns
Co
un
cil (
WA
EC
)
6S
eco
nda
ry t
ech
nic
al
sch
oo
ls p
rog
ram
me
sJu
nio
r se
con
da
ry c
ert
ifica
te
Na
tion
al b
usi
ness
an
d
tech
nic
al e
du
catio
n b
oard
(NA
BT
EB
) exa
min
atio
n
15
3N
BV
7
Inte
rim
join
t m
atr
icu
latio
n
bo
ard
(IJ
MB
) A
- le
vel
cours
e
WA
SS
C o
r N
EC
O c
ert
ifica
teIJ
MB
ce
rtifi
cate
18
1-2
NA
G18
1-2
Co
mm
on
in t
he N
ort
he
rn p
art
of
Nig
eri
a t
o
ass
ist
stud
en
ts w
ho
ma
y b
e d
efic
ien
t in
so
me
sub
ject
are
as
to jo
in t
he
un
ive
rsity
. T
his
pro
gra
mm
e d
oe
s n
ot
rep
lace
WA
SS
C o
r
NE
CO
ce
rtifi
cate
pro
gra
mm
es.
8C
ert
ifica
te c
ou
rse
sW
AS
SC
or
NE
CO
ce
rtifi
cate
Ce
rtifi
cate
of
pro
ficie
ncy
(in
seve
ral f
ield
s)18
0.5
-1N
BV
18
0.5
-1
Very
sh
ort
du
ratio
n (
6 m
onth
s to
on
e y
ea
r).
Usu
ally
lab
our
ma
rke
t ori
en
ted
. T
his
pro
gra
mm
e is
ab
ou
t to
be
ph
ase
d o
ut.
It
is
still
in a
pp
lica
tion
in a
ve
ry s
ma
ll n
um
be
r o
f
ed
uca
tion
inst
itutio
ns.
9B
ach
elo
r p
rogra
mm
e
WA
SS
C, N
EC
O c
ert
ifica
te,
NA
BT
EB
ce
rtifi
cate
, IJ
MB
+
Un
ifie
d t
ert
iary
ma
tric
ula
tion
exa
min
atio
n (
UT
ME
)
Ba
che
lor
de
gre
e18
4N
First
de
gre
e18
4
Ba
che
lor
in S
cie
nce
s, in
Ed
uca
tion
, in
Tech
nolo
gy.
UT
ME
is c
om
pu
lso
ry a
nd
is
req
uire
d in
ad
diti
on
to
WA
SS
C o
r N
EC
O. T
he
exa
m g
ran
ts a
cce
ss t
o t
he
3 d
iffere
nt
pro
gra
mm
es
tha
t exi
st a
t te
rtia
ry le
vels
in th
e
cou
ntr
y (N
CE
, N
atio
na
l dip
lom
a a
nd
th
e
Un
ive
rsity
).
10
Ma
ste
r pro
gra
mm
es
Ba
che
lor
Ma
ste
r de
gre
e22
1-2
NS
eco
nd
de
gre
e22
1-2
Th
e p
rog
ram
me
ca
n b
e o
ne
or
two
ye
ars
.
11N
atio
na
l dip
lom
a (
ND
)W
AS
SC
or
NE
CO
ce
rtifi
cate
+ U
TM
EN
atio
nal d
iplo
ma
18
2N
2C
olle
ge
an
d p
oly
tech
nic
pro
gra
mm
es.
12
Nig
eri
an
ce
rtifi
cate
in
ed
uca
tion
(N
CE
)
WA
SS
C o
r N
EC
O c
ert
ifica
te
or
Tea
che
r ce
rtifi
cate
gra
de
2 +
UT
ME
Nig
eri
an
ce
rtifi
cate
in
ed
uca
tion
18
3N
Th
e T
ea
che
r ce
rtifi
cate
(T
C)
wa
s a
wa
rde
d in
the p
ast
by
the
te
ach
er
tra
inin
g s
choo
ls
(ph
ase
d o
ut
now
). T
C g
rad
e 2
is n
ow
con
side
red
an
eq
uiv
ale
nt to
WA
SS
C o
r
NE
CO
whic
h is
co
mp
letio
n o
f se
nio
r
seco
nd
ary
.
13
Sch
oo
l of
Nu
rsin
gW
AS
SC
or
NE
CO
ce
rtifi
cate
Re
gis
tere
d n
urs
ing
ce
rtifi
cate
18
3N
Eq
uiv
ale
nt to
a H
igh
er
na
tion
al d
iplo
ma
to
take
on
a B
ach
elo
r o
f N
urs
ing
(IS
CE
D 5
A).
14
Hig
he
r n
atio
na
l dip
lom
a
(HN
D)
Natio
nal d
iplo
ma
Hig
he
r na
tion
al d
iplo
ma
20
2N
Se
con
d
qu
alif
ica
tion
20
2C
olle
ge
an
d p
oly
tech
nic
pro
gra
mm
es.
15
Ph
DM
ast
er
Do
cto
ral d
eg
ree
23
3+
NS
eco
nd
sta
ge
of
tert
iary
edu
catio
n6
na
na
23
3+
G =
Ge
ne
ral
P =
Pre
-vo
catio
na
l
V =
Vo
catio
na
l
na
= n
ot
ap
plic
able
A,
B,
C =
De
stin
atio
n c
ate
go
rie
s
N.B
: T
he
ma
pp
ings
pre
sen
t th
e c
orr
esp
on
de
nce
betw
ee
n th
e n
atio
na
l str
uct
ure
an
d t
he
inte
rna
tion
al f
ram
ew
ork
(IS
CE
D).
To
pro
du
ce in
tern
atio
na
lly c
om
pa
rab
le in
dic
ato
rs,
the
UIS
ca
lcu
late
s
pa
rtic
ipa
tion
ind
ica
tors
fo
r IS
CE
D le
vels
0-3
, b
ase
d o
n t
he
entr
ance
ag
e a
nd d
ura
tion
pre
sen
ted in
co
lum
ns
K a
nd L
(IS
CE
D),
wh
ich
ma
y b
e d
iffere
nt
fro
m c
olu
mn
s E
an
d F
(n
atio
nal).
Fo
r te
rtia
ry e
du
catio
n,
how
eve
r, U
IS u
ses
a s
tan
da
rd f
orm
ula
to c
alc
ula
te t
he
ind
ica
tor
for
gro
ss e
nro
lme
nt ra
tio (
GE
R),
wh
ich
use
s a
po
pu
latio
n o
f th
e a
ge
-gro
up
co
rre
spo
nd
ing t
o f
ive
yea
rs f
ollo
win
g o
n f
rom
th
e s
eco
nd
ary
sch
oo
l le
avi
ng
ag
e (
e.g
. If t
he
en
din
g o
f se
con
da
ry e
du
catio
n is
17
, th
en
th
e a
ge
-gro
up
use
d f
or
the
te
rtia
ry G
ER
will
be
18
-22).
ISC
ED
97 l
ev
el
H
Nig
eri
a I
SC
ED
Ma
pp
ing
12
3
15
3
Lo
we
r se
con
da
ry
ed
uca
tion
2
Upp
er
seco
nda
ry
ed
uca
tion
3
3
A B
First
qu
alif
ica
tion
18
Po
st-s
eco
nd
ary
no
n-t
ert
iary
ed
uca
tion
4
First
sta
ge
of
tert
iary
ed
uca
tion
5
Na
tio
na
l
ISC
ED

INNOVA Research Journal 2016, Vol 1, No. 9, pp. 98-113
Revista de la Universidad Internacional del Ecuador. URL: https://www.uide.edu.ec/ 111
Appendix B
Education System and Qualification Structure
Note. From The Educational System of Nigeria, by J. Onyukwu, 2012, World Education News & Reviews (WENR)
Appendix C
Federal Government and ETF Allocations to Education, 2001-07 real 2006 naira, billions, unless
otherwise noted
Indicator 2001 2002 2003 2004 2005 2006 2007
Total federal
education budget
allocation
176.6 150.7 143.0 126.4 168.2 215.2 230.6

INNOVA Research Journal 2016, Vol 1, No. 9, pp. 98-113
Revista de la Universidad Internacional del Ecuador. URL: https://www.uide.edu.ec/ 112
Education Trust
Fund
17.7 31.2 14.2 14.2 24.3 23.7 -
Total federation
allocation to
education
194.3 181.9 157.2 140.6 192.5 238.9 -
Total federal
government budgeta
1,648.5 1,748.8 1,237.1 1,217.2 1,430.0 1627.1 1,849.2
GDP 10,082.5 9,422.4 11,051.1 12,214.7 14,059.9 15,260.7 16,691.0
Total federal
education budget as
a percent of total
budget
10.7 8.6 11.6 10.4 11.8 13.2 12.5
Total federal
education allocation
as a percent of total
budget and
Education Trust
Fund
11.7 10.2 12.6 11.4 13.2 14.5 -
Total federal
government
allocation to
education as a
percent of GDP
1.8 1.6 1.3 1.0 1.2 1.4 1.4
Total federation
allocation to
education as a
percent of GDP
1.9 1.9 1.4 1.2 1.4 1.6 -
Note. From “Nigeria A Review of the Costs and Financing of Public Education” by World Bank, 2008, Human
Development Unit Africa Region, 2, p.117.
Appendix D
National enrolment in public primary and junior secondary schools over time
Primary Schools Junior Secondary Year Male Female Male Female
2007 11,086,997 9,382,398 1,688,295 1,310,077
2008 10,252,000 8,728,395 1,899,060 1,552,018
2009 10,154,860 8,663,684 2,081,305 1,676,788
2010 10,215,179 8,826,988 2,260,585 1,864,626
Note. From Transforming education for girls in Nigeria: Endline research summary report. P.7, by A. Mamedu &
L. Wetheridg, 2013, Abuja: ActionAid.
Appendix E
Primary school net and gross attendance ratios
Primary net attendance ratios (NAR), gross attendance ratios (GAR), and the gender parity index
(GPI) for the de jure household population age 5–24, by sex, according to background characteristics,
2008 NDHS
Background Characteristics Net Attendance Ratio (NAR) Gross Attendance Ratio
(GAR)
Gender
Parity
Index Male Female Total Male Female Total
Residence

INNOVA Research Journal 2016, Vol 1, No. 9, pp. 98-113
Revista de la Universidad Internacional del Ecuador. URL: https://www.uide.edu.ec/ 113
Urban 75.7 73.0 74.4 101.4 96.7 99.0 0.95
Rural 58.5 52.2 55.4 85.0 73.6 79.3 0.87
Region
North Central 67.7 65.2 66.4 99.5 92.8 96.1 0.93
North East 43.5 38.0 40.8 64.7 53.3 59.0 0.82
North West 46.7 35.5 41.0 68.2 48.9 58.5 0.72
South East 80.3 80.0 80.1 112.5 112.1 112.3 1.00
South South 79.3 79.9 79.6 110.7 111.7 111.2 1.01
South West 90.2 78.0 79.1 105.4 101.9 103.6 0.97
Economic status quintile
Lowest 34.0 26.7 30.5 52.7 40.1 46.4 0.76
Second 55.4 47.5 51.4 83.8 68.6 76.2 0.82
Middle 73.9 68.1 71.1 106.6 97.1 101.8 0.91
Fourth 79.9 76.3 78.1 109.2 103.1 106.1 0.94
Highest 82.1 81.0 81.6 103.5 101.9 102.7 0.98
Total 63.5 58.4 61.0 89.8 80.5 85.1 0.90
Note. From Nigeria Demographic and Health Survey (DHS) EdData Profile 1990, 2003, and 2008: Education Data
for Decision-Making. 2011 p.58, by National Population Commission (Nigeria) and RTI International, 2011,
Washington, DC: National Population Commission and RTI International.
Appendix F
UBEC National Assessment of Learning Achievement in Grades 4, 5, and 6 in 2003 Grade 4 Grade 5 Grade 6
English language 25 25 21
Mathematics 37 37 36
Primary Science 40 39 40
Social Studies 25 26 21
Note: From “Language, Literacy, and Learning in Primary Schools Implications for Teacher Development
Programs in Nigeria” by O. Adekola, 2007, Africa Human Development Series, The World Bank, 96, p.7.