Embed Size (px)
Citation preview

th break.
Primary vs. Interval Cytoreduction: Which is Best?
Thomas J. Herzog, MD Paul & Carolyn Flory Endowed Professor
Deputy Director, UC Cancer Institute Vice Chair Quality & Safety, Dept Ob/Gyn
University of Cincinnati

Disclosures • Scientific Advisory Boards:
• AZ, Caris, Clovis, Genentech, GSK/Tesaro, J & J,Merck

th break.
A Front-line Treatment Controversy:
• “When” should we surgicallytreat Front-line disease & thus“what” is the role ofneoadjuvant chemotherapy?
Email questions to Dr. Wendel Naumann at [email protected] for discussion during the break.
Diagnosis
Chemo #1
Evaluation / Surveillance Progression
Chemo #2 Chemo #3+
Supportive Care
+/- Maintenance
Cure
Evaluation Progression
Treatment Paradigm
Symptoms
Primary PFS (12-28 mos)
Recurrence Rx (12-38 mos)
+/- Maintenance
10 Surgery / Staging
z

Email questions to Dr. Wendel Naumann at [email protected] for discussion during the break.
Treatment Paradigm
Primary PFS
(12-28 mos)
Recurrence Rx (12-38 mos)
Diagnosis
Chemo #1
Evaluation / Surveillance Progression
Chemo #2 Chemo #3+
Supportive Care
+/- Maintenance
Cure
Evaluation Progression
Symptoms
Surgery / Staging
+/- Maintenance
HIPEC ?
Neoadjuvant

EORTC 55971: Neoadjuvant Chemotherapy
Stage IIIC/IV Ovary
Peritoneal Fallopian tube
Primary cytoreductive Maximal effort
Open: 9/21/98 Accrual: 670 pts (632 eval)
Chemotherapy Taxane (paclitaxel or docetaxel) Platin (cisplatin or carboplatin)
Neoadjuvant: Primary
Chemotherapy x 3 cycles
62% had Lesions > 10 CM
Vergote, I. N Eng J Med, 2010
R A N D O M I Z E

0 2 4 6 80
10
20
30
40
50
60
70
80
90
100
O N Number of patients at risk :259 361 183 68 16 2251 357 191 56 11 1
urgery
(years)10
TreatmentUpfront debulkings Neoadjuvant chemotherapy
Overall survival
EORTC 55971: Neoadjuvant Chemotherapy
Vergote N Eng J Med, 2010
PDS: 29 months IDS: 30 months HR: 0.98 (0.85, 1.14)
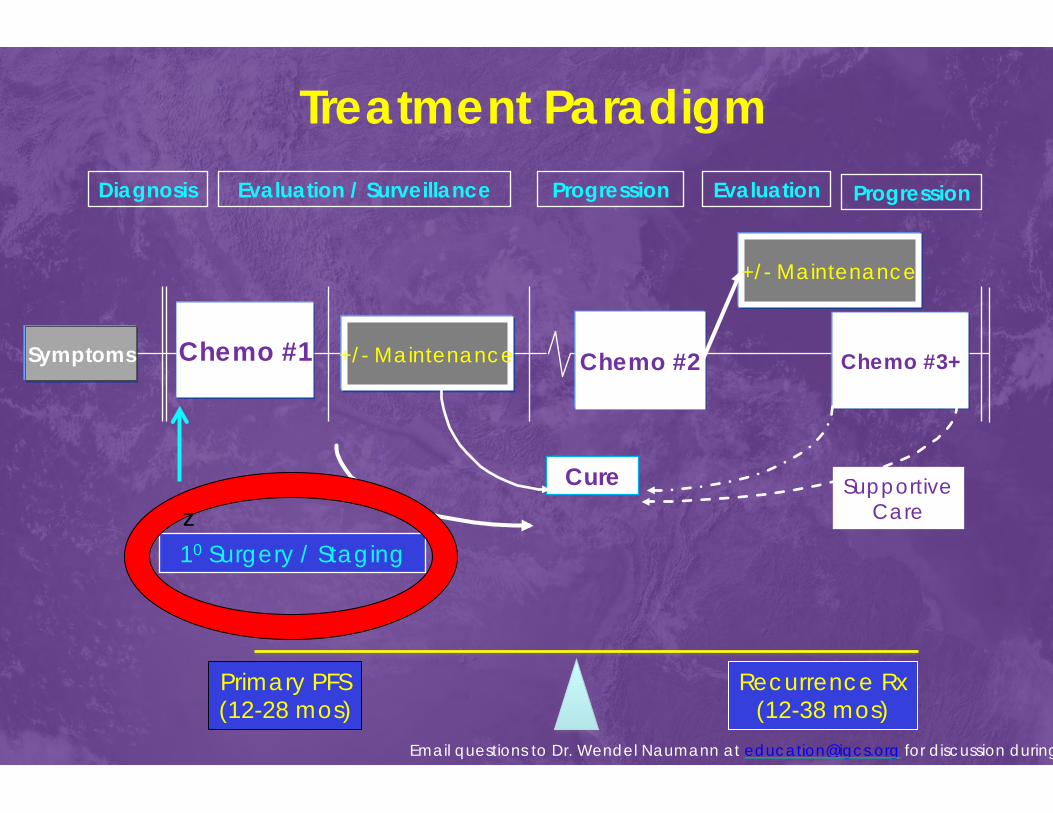
EORTC 55971: 1o Cytoreduction vs. Neoadjuvant & Interval Cytoreduction
Primary Cytoreduction
Interval + Neoadjuvant
< 1 cm residual 42% 81%
R-0 20% 52%
Death (< 28d) 2.5% 0.7%
Gr ¾ Hemorrhage 7.4% 4.1% Infection 8.1% 1.7% VTE 2.6% 0% QOL QLQ-C30 NS Difference
Vergote N Eng J Med, 2010

Optimal Resection after Neoadjuvant Chemotherapy
PDS NACT
% HR Median OS % HR Median
OS
No Residual 20% 1.00 45.0
(34.4-53.6) 52% 1.11 (0.82-1.51)
38.2 (32.7-44.0)
Optimal 24% 1.37 (0.97-1.93
32.3 (26.9-37.4) 30% 1.73
(1.25-2.40) 27.0
(24.3-31.7)
Suboptimal 55% 1.87 (1.39-2.50)
25.7 (21.6-28.6) 18% 1.71
(1.19-2.46) 25.5
(19.9-31.9)
Vergote I, NEJM 363(10):942 (Supp.), 2010

Ph III CHORUS Trial: Chemo or Upfront Surgery
Presumed Stage III/IV Ovary, PP,
Fallopian tube CA125: CEA > 25
Primary cytoreduction
Chemo x 3
Chemo x 6
Interval Cytored
Chemo x 3
Bx
N = 276
N = 274
Kehoe, S. Lancet, 2015
34%- Tumor > 10 cm
RCOG
R A N D O M I Z E
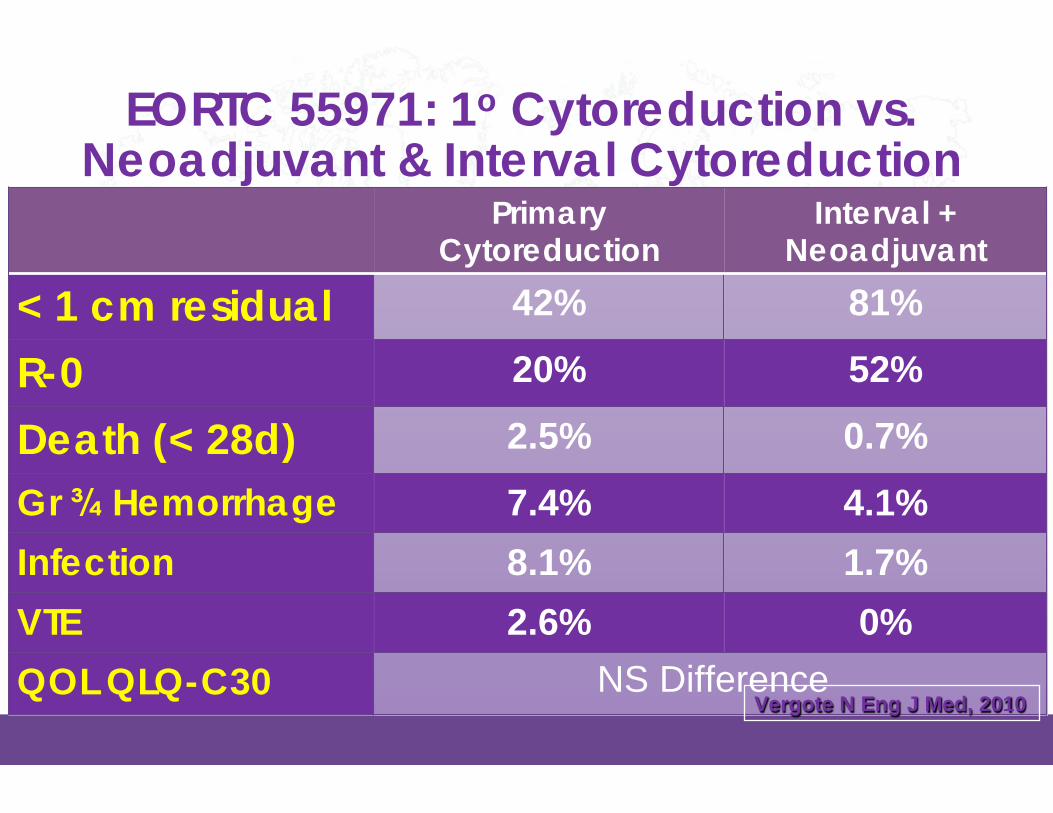
CHORUS Results
PDS: 22.6 months IDS: 24.1 months HR: 0.87 (0.72, 1.05)
Kehoe, S. Lancet, 2015

CHORUS: 1o Cytoreduction vs. Neoadjuvant & Interval
Cytoreduction Primary Cytoreduc*on Interval+
Neoadjuvant
< 1 cm residual 41% 73% R-0 17% 39% Death (< 28d) 6% 0.3% Any Gr ¾ Event 24% 14% Infection 6% 3% VTE 2% 0% QOL QLQ-C30 NS Difference
Kehoe, S. Lancet, 2015

SCORPION trial
Stage IIIC / IV
Fagotti Score ≥ 8 at laparoscopy
Paclitaxel 175 mg/m2 Carbo AUC 6 x 8 cycles
Interval Surgery
Optimal cyto (93%)
Maximal Cytoreductive Effort
Primary Chemotherapy with Paclitaxel and Carboplatin AUC 6
R A N D O M I Z E
1° - PFS Superiority of NACT & morbidity 2° - OS and QOL
n=84
n=87
Median F/U = 42 months 80% reached PFS 43% reached OS
Fagotti A, J Clin Oncol 36, 2018 (suppl; abstr 5516)
Optimal cyto (100%)
Operative Mortality = 8%

SCORPION Trial
Fagotti A, SGO 2019

SCORPION Trial
Fagotti A, SGO 2019 9

SCORPION Trial
Fagotti A, SGO 2019
Optimal
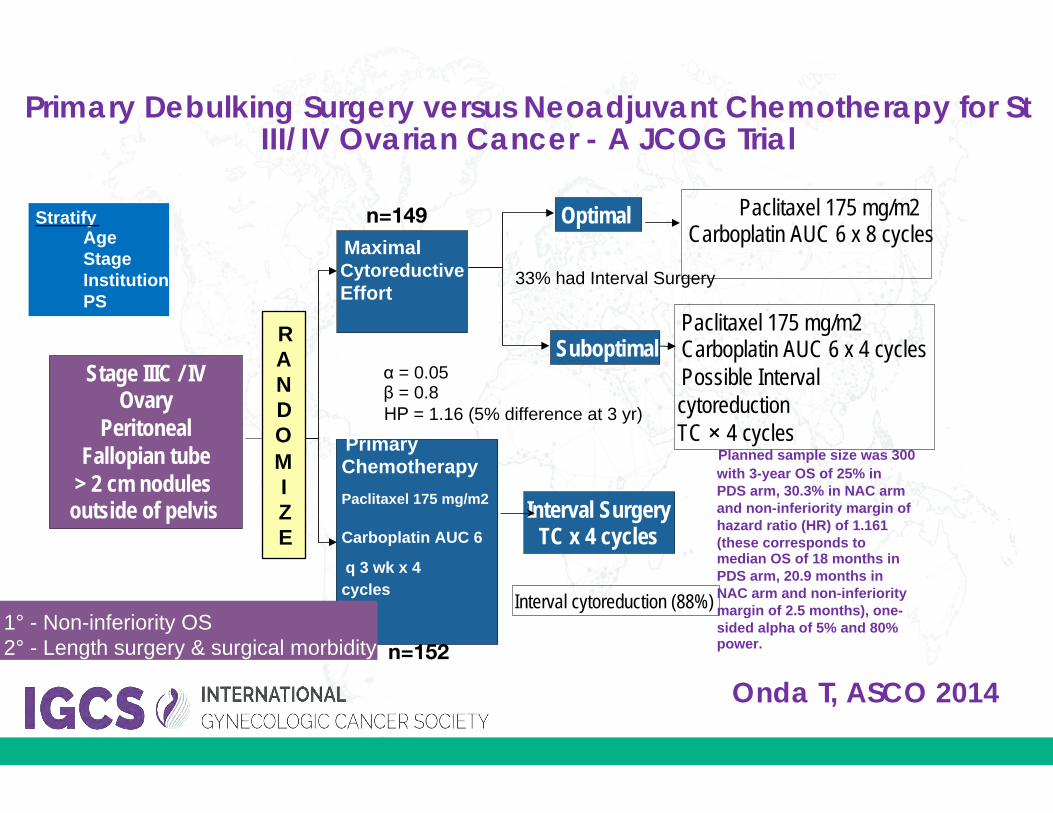
Suboptimal Paclitaxel 175 mg/m2 Carboplatin AUC 6 x 4 cycles Possible Interval cytoreduction TC × 4 cycles
Interval Surgery TC x 4 cycles
Interval cytoreduction (88%)
Maximal Cytoreductive Effort
Primary Chemotherapy Paclitaxel 175 mg/m2
Carboplatin AUC 6
q 3 wk x 4 cycles
RANDOMIZE
α = 0.05 β = 0.8 ΗΡ = 1.16 (5% difference at 3 yr)
33% had Interval Surgery
Paclitaxel 175 mg/m2 Carboplatin AUC 6 x 8 cycles
Planned sample size was 300 with 3-year OS of 25% in PDS arm, 30.3% in NAC arm and non-inferiority margin of hazard ratio (HR) of 1.161 (these corresponds to median OS of 18 months in PDS arm, 20.9 months in NAC arm and non-inferiority margin of 2.5 months), one-sided alpha of 5% and 80% power.
n=149
n=152
Primary Debulking Surgery versus Neoadjuvant Chemotherapy for St III/IV Ovarian Cancer - A JCOG Trial
StratifyAgeStageInstitutionPS
Stage IIIC / IV Ovary
Peritoneal Fallopian tube
> 2 cm nodulesoutside of pelvis
Onda T, ASCO 2014
1° - Non-inferiority OS 2° - Length surgery & surgical morbidity
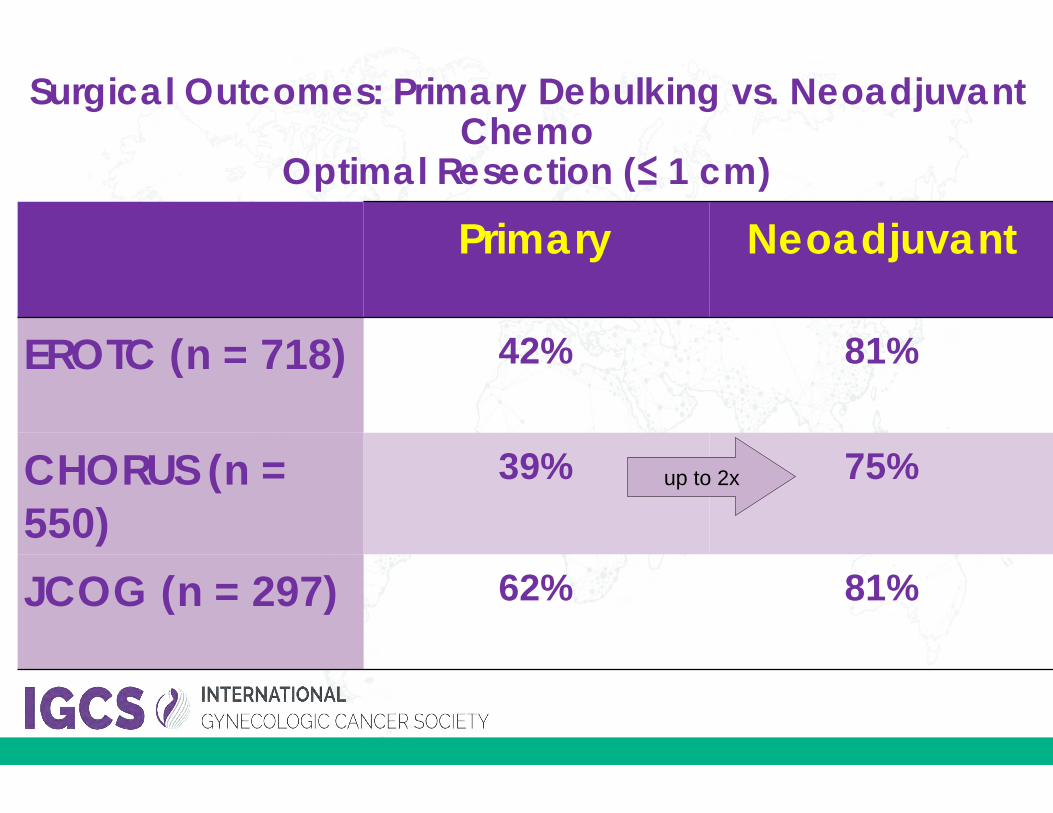
Primary Neoadjuvant
EROTC (n = 718) 42% 81%
CHORUS (n = 550)
39% 75%
JCOG (n = 297) 62% 81%
up to 2x
Surgical Outcomes: Primary Debulking vs. Neoadjuvant Chemo
Optimal Resection (≤ 1 cm)
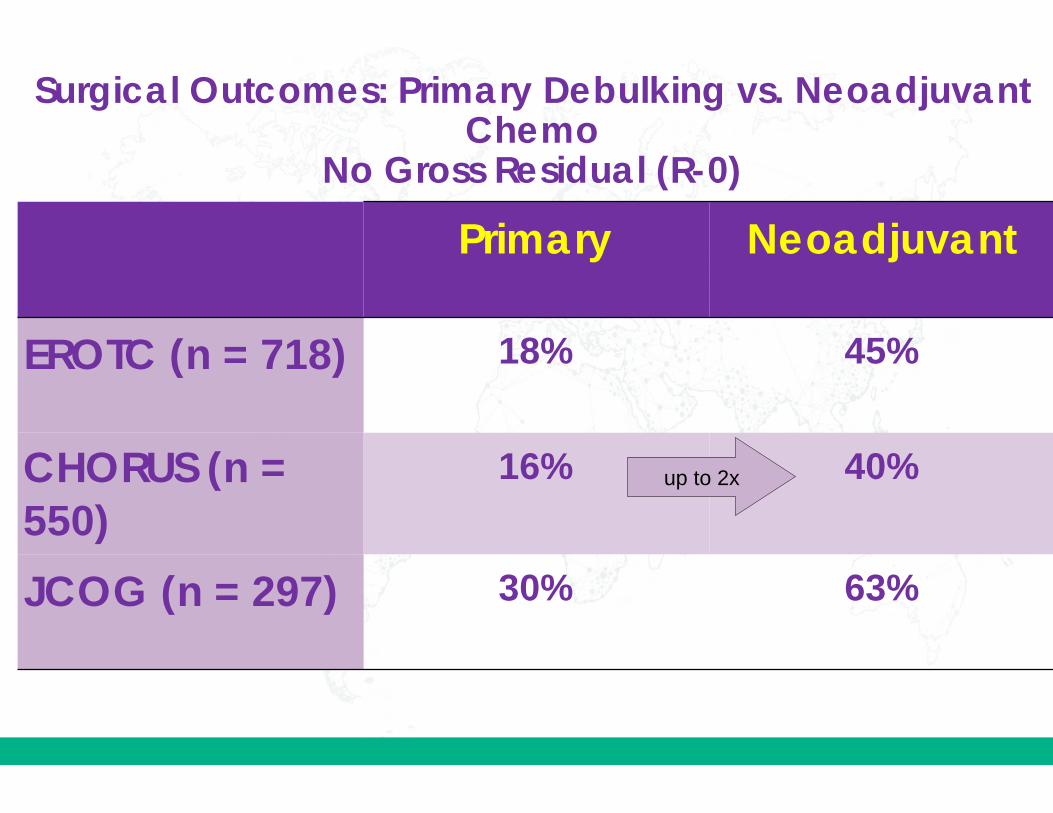
Primary Neoadjuvant
EROTC (n = 718) 18% 45%
CHORUS (n = 550)
16% 40%
JCOG (n = 297) 30% 63%
up to 2x
Surgical Outcomes: Primary Debulking vs. Neoadjuvant Chemo
No Gross Residual (R-0)

Primary Neoadjuvant
Permanent Colostomy
24% 6%
Reop for Complication
21% 3%
Surgical Time 276% 211%
Surgical Outcomes: Primary Debulking vs. Neoadjuvant Chemo
Onda T, Exp Rev Anticancer Ther ;11(7):1055, 2011

PFS OS
Design 1° n PDS NACT HR PDS NACT HR
EROTC Non-
inferiorty (0.80)
OS 718 12 12
1.01 (0.89-1.16
) 29 30 0.98
(0.84-1.13)
CHORUS Non-
inferiorty (0.85)
OS 550 10 12
0.90 (0.75-1.07
) 23 25 0.87
(0.72-1.06)
JCOG Non-
Inferiorly (0.86)
OS 301 15 16
0.99 (0.74-1.26
) 49 44 1.05
0.84-1.33
SCORPION Superiority PFS 171 15 14
1.06 (0.77-1.46
) 41 NR -
PDS vs NACT: Randomized Trials

Cost Comparison PDS vs. Neoadjuvant
Rowland, M. AJOG 2015

Cost Comparison PDS vs. Neoadjuvant in Advanced Stage Ovary & > 65 yo
Rowland, M. AJOG 2015
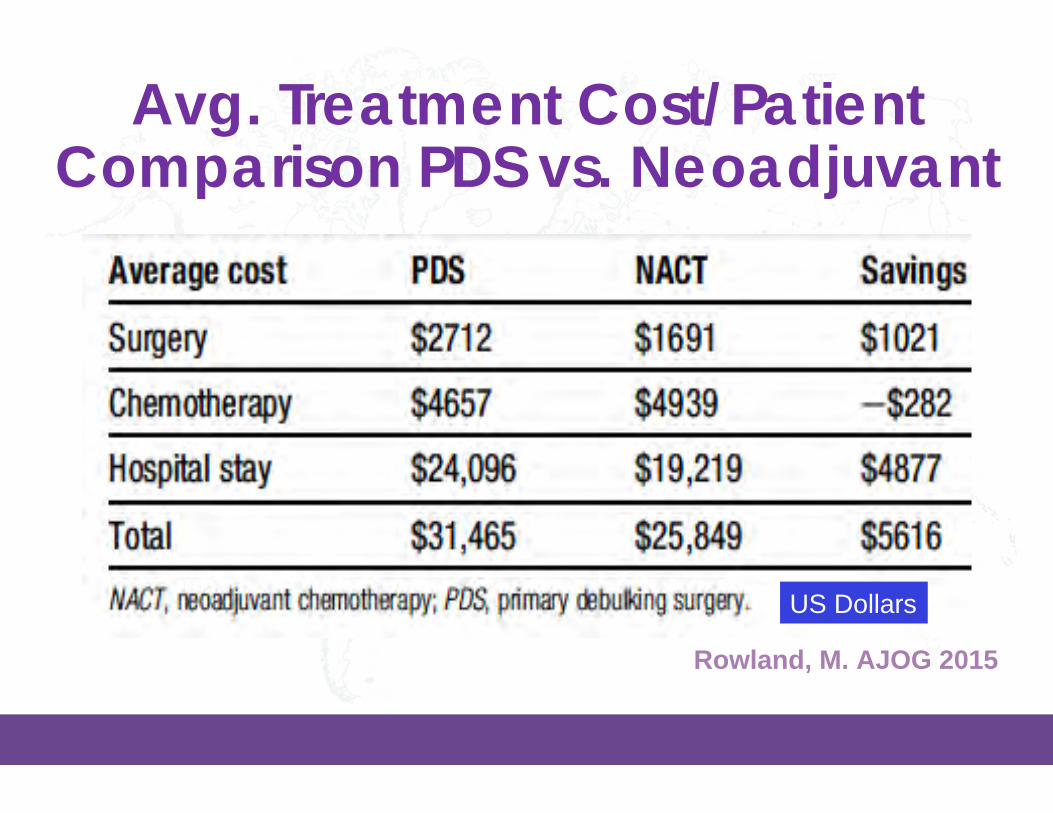
Avg. Treatment Cost/Patient Comparison PDS vs. Neoadjuvant
Rowland, M. AJOG 2015
US Dollars

Predictors of Suboptimal (> 1 cm) Cytoreduction
Criteria (Mul*variateAnalysis)
OR 95% CI p = PredValuescore
Age > 60 1.32 1.06-1.63 0.01 1 CA-125 > 500 1.47 1.28-1.69 < 0.001 1 SAS 3-4 3.23 1.76-5.91 < 0.001 3 Retro LN > 1maboverenalhilum 1.59 1.58-1.60 < 0.001 1 Diffuse bowel thickening 1.87 1.86-1.87 < 0.001 1 Perispleniclesion>1cm 2.27 1.7-3.03 < 0.001 2 SM bowel mesentery lesion 2.28 1.08-4.8 0.03 2 Root SMA lesion > 1cm 2.4 1.34-4.32 0.003 2 Lesser sac lesion > 1 cm 4.61 4.39-4.84 < 0.001 4
Suidan, R. Gyn Onc 2014 N = 350 St III/IV; 10 Cyto; Prospective

Predictors of Suboptimal (> 1 cm) Cytoreduction
Predic*veValueScore
N=(%)
Op*mal Subopt SubOptRate
0 22/349(6%) 21 1 5%
1-2 79/349(23%) 71 8 10%
3-4 109/349(31%) 91 18 17%
4-5 85/349(24%) 56 29 34%
5-6 31/349(9%) 15 16 52%
6-7 23/349(7%) 6 17 74% Suidan, R. Gyn Onc 2014 N = 350 St III/IV; 10 Cyto; Prospective

• MIS was completed without conversion in 44/53 patients (83%) but 47%required hand port/mini-lap
• 10% of pts had a complete pathologic response to NACT (13% MIS & 8% Lap,p=0.494)
NACT Facilitates MIS
MIS Open Surgery
R0 32 (60.4%) 43 (44.3%)
Optimal 19 (35.9%) 41 (42.3%)
Suboptimal 2 (3.8%) 13 (13.4%)
p = 0.07
96% 87%
Drury L, Gynecol Oncol 149(3):620, 2018
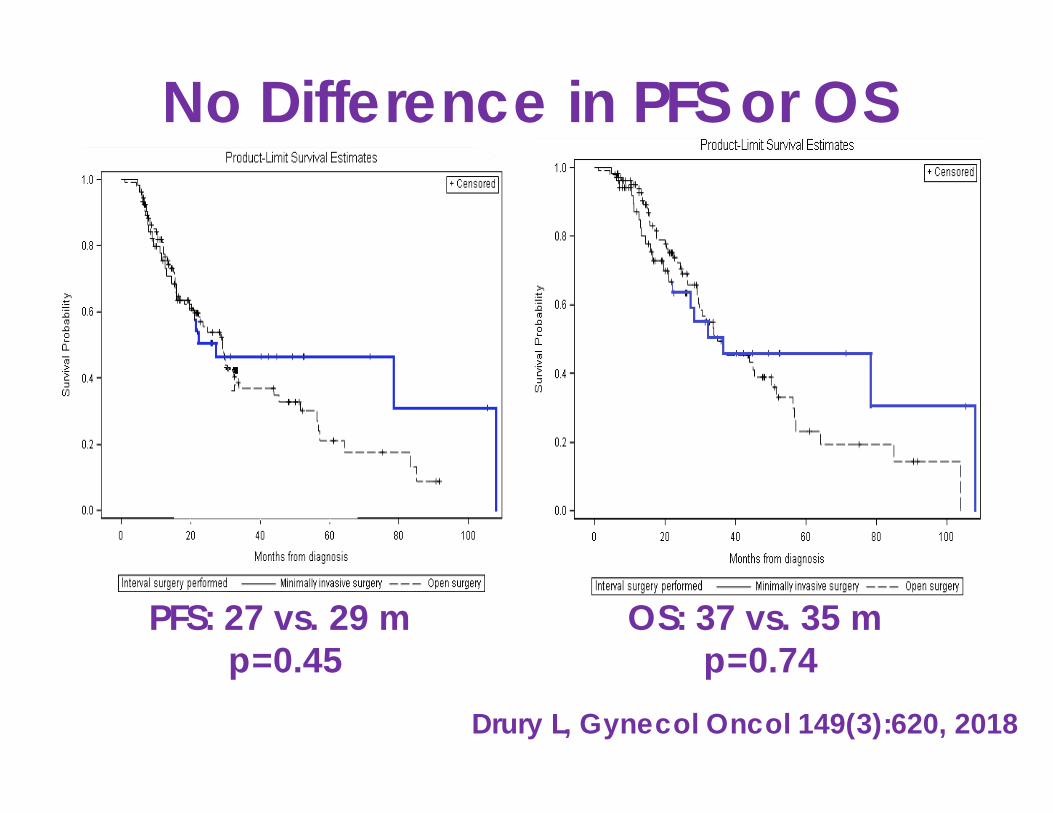
No Difference in PFS or OS
PFS: 27 vs. 29 m p=0.45
OS: 37 vs. 35 m p=0.74
Drury L, Gynecol Oncol 149(3):620, 2018
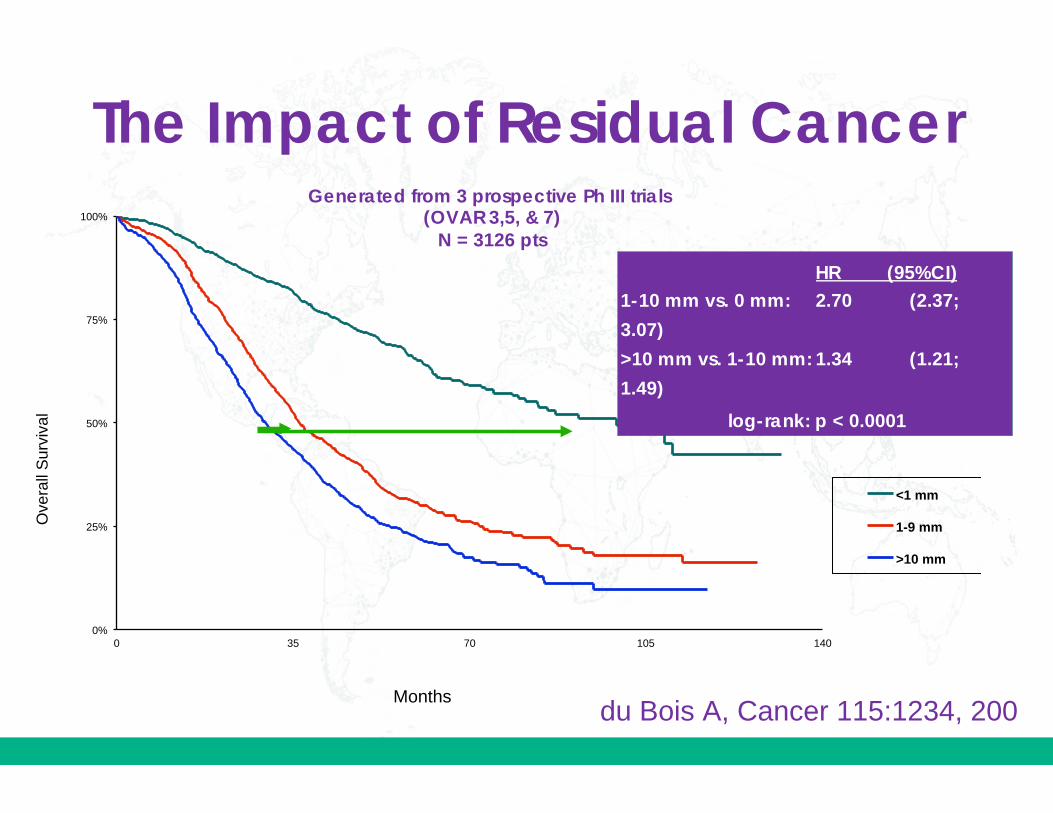
0%
25%
50%
75%
100%
0 35 70 105 140
<1 mm
1-9 mm
>10 mm
Ove
rall
Surv
ival
HR (95%CI) 1-10 mm vs. 0 mm: 2.70 (2.37;
3.07)
>10 mm vs. 1-10 mm: 1.34 (1.21;
1.49)
log-rank: p < 0.0001
Generated from 3 prospective Ph III trials (OVAR 3,5, & 7)
N = 3126 pts
du Bois A, Cancer 115:1234, 200Months
The Impact of Residual Cancer
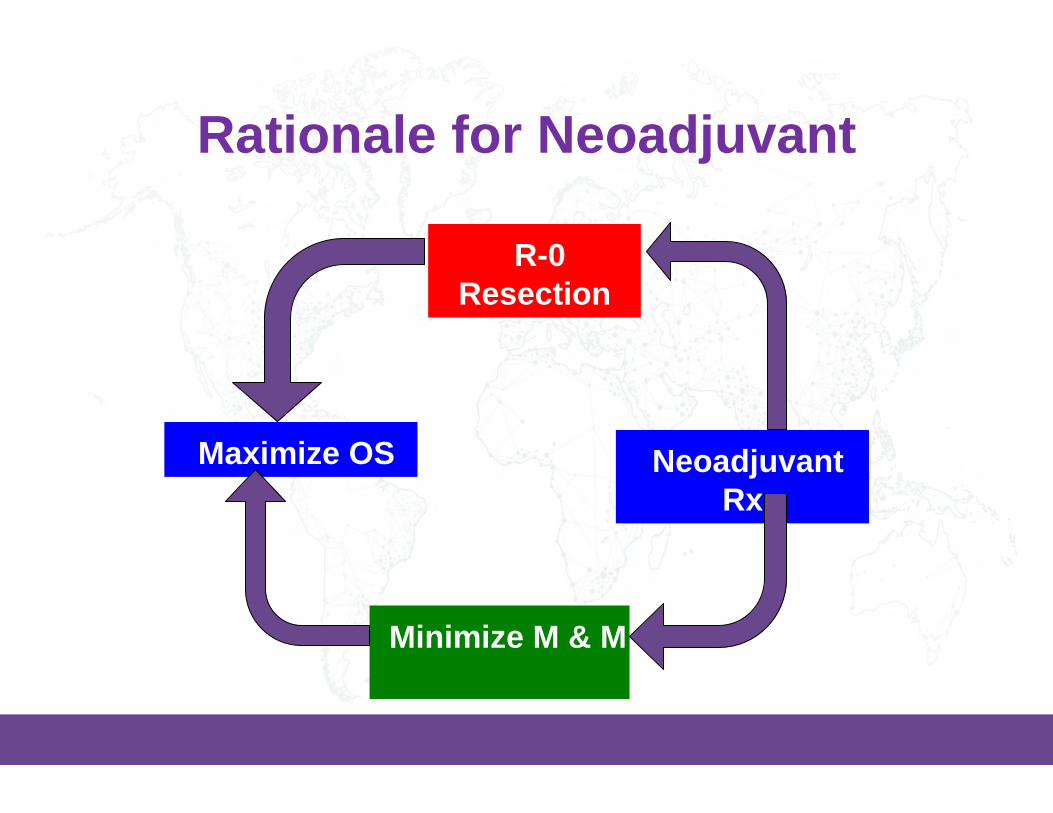
Rationale for Neoadjuvant
R-0Resection
Minimize M & M
Maximize OS Neoadjuvant Rx

Rationale for Neoadjuvant
R-0Resection
Minimize M & M
Maximize OS Neoadjuvant Rx

So Who Would Potentially Benefit from Neoadjuvant?
Medically Unfit -Morbidity scoring; Age
Research -New Approval Pathway
pCR -Target engagement
UnresectableDisease -Ascites
-CA-125 > 500 -Radiographic -Laparoscopic
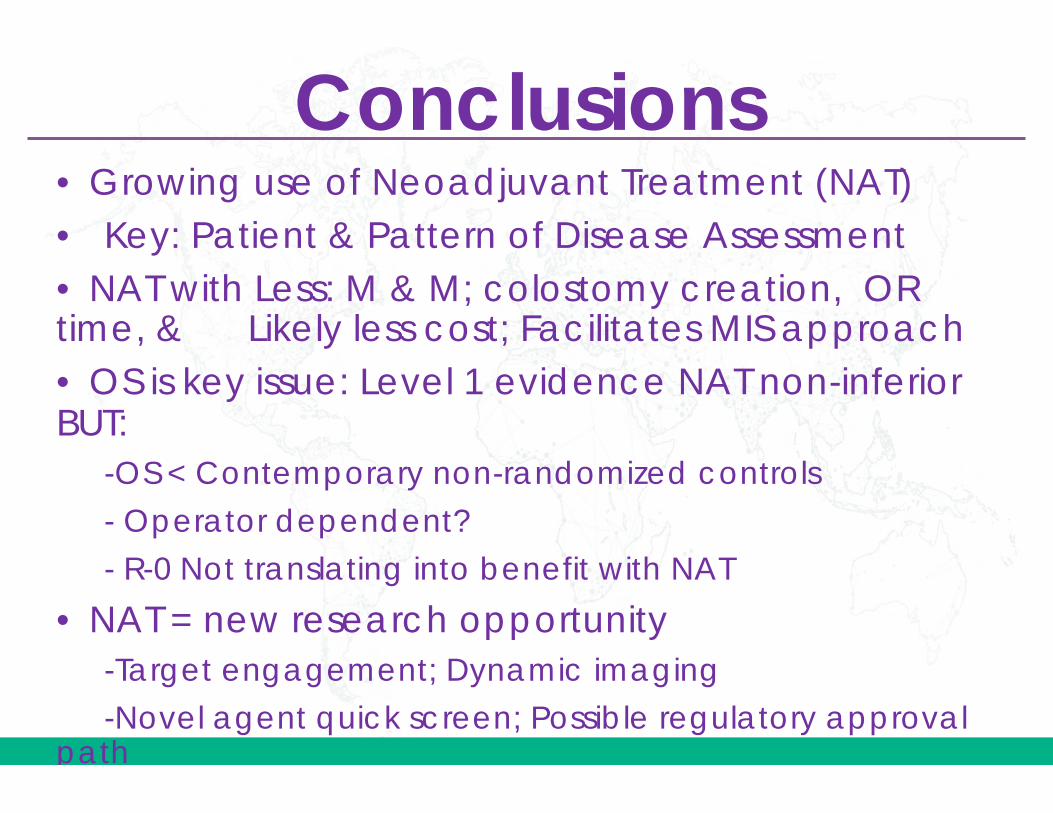
Conclusions • Growing use of Neoadjuvant Treatment (NAT)• Key: Patient & Pattern of Disease Assessment• NAT with Less: M & M; colostomy creation, ORtime, & Likely less cost; Facilitates MIS approach • OS is key issue: Level 1 evidence NAT non-inferiorBUT:
-OS < Contemporary non-randomized controls
- Operator dependent?
- R-0 Not translating into benefit with NAT
• NAT = new research opportunity-Target engagement; Dynamic imaging
-Novel agent quick screen; Possible regulatory approvalpath

Grazie
Obrigado
Merci
ThankYou!
Spasiba
Gracias
Toa Chie
Khawp khun
Teşekkür
Ederim
![Interval Notation: ], not interval notationpgrant.weebly.com/uploads/2/3/2/7/23274454/6.3b_interval_notation.… · •Interval Notation: Uses different brackets to indicate an interval](https://img.pdfslide.net/doc/110x75/5f8344624904df613146ef90/interval-notation-not-interval-ainterval-notation-uses-different-brackets.jpg)