Embed Size (px)
Citation preview

Primer
Basics of LC/MS


ContentsWhy Liquid Chromatography/Mass Spectrometry? 4
Instrumentation 6Ion Sources 6
Electrospray ionization 7Atmospheric pressure chemical ionization 8Atmospheric pressure photoionization 9
Mass Analyzers 10Quadrupole 10Time-of-flight 11Ion trap 11Fourier transform-ion cyclotron resonance (FT-ICR) 12
Collision-Induced Dissociation and Multiple-Stage MS 13CID in single-stage MS 14CID and multiple-stage MS 14
Adapting LC Methods 16Sample preparation 17Ionization chemistry 17
Capillary LC/MS and CE/MS 19
Applications 20Molecular Weight Determination 20
Differentiation of similar octapeptides 20Determining the molecular weight of green fluorescent protein 21
Structural Determination 22Structural determination of ginsenosides using MSn analysis 22
Pharmaceutical Applications 24Rapid chromatography of benzodiazepines 24Detection of degradation products for salbutamol 24Identification of bile acid metabolites 25
Biochemical Applications 26Rapid protein identification using capillary LC/MS/MS and database searching 26
Clinical Applications 28High-sensitivity detection of trimipramine and thioridazine 28
Food Applications 28Identification of aflatoxins in food 28Determination of vitamin D3 in poultry feed supplements using MS3 30
Environmental Applications 32Detection of phenylurea herbicides 32Detection of low levels of carbaryl in food 32
CE/MS Applications 34Analysis of peptides using CE/MS/MS 34

4
Why Liquid Chromatography/Mass Spectrometry?
Liquid chromatography is a fundamentalseparation technique in the life sciences and related fields of chemistry. Unlike gaschromatography, which is unsuitable for nonvolatile and thermally fragile molecules,liquid chromatography can safely separate a very wide range of organic compounds, from small-molecule drugmetabolites to peptides and proteins.
Traditional detectors for liquid chromatography include refractive index,electrochemical, fluores-cence, and ultraviolet-visible (UV-Vis) detectors. Some of these generate two-dimensional data; that is, data representing signalstrength as a function of time. Others, includingfluorescence and diode-array UV-Vis detectors,generate three-dimensionaldata. Three-dimensional data include not only signalstrength but spectral data for each point in time.
Mass spectrometers also generate three-dimensional data. In addition to signal strength, they generate mass spectral data that can provide valuable informationabout the molecular weight, structure, identity, quantity, and purity of a sample. Mass spectral data add specificity thatincreases confidence in the results of bothqualitative and quantitative analyses.
CH2CH2CH2NHCOCH3CH2CH2CH2OHCH2CH2CH(NH2)COOH
R
% R
el. A
bund
ance
% R
el. A
bund
ance
m/z
Figure 1. Two-dimensional abundance data and three-dimensional mass spectral data from a mass spectrometer

5
Some mass spectrometers have the ability toperform multiple steps of mass spectrometryon a single sample. They can generate a mass spectrum, select a specific ion from that spectrum, fragment the ion, and generateanother mass spectrum; repeating the entirecycle many times. Such mass spectrometerscan literally deconstruct a complex moleculepiece by piece until its structure is determined.
For most compounds, a mass spectrometer ismore sensitive and far more specific than all other LC detectors. It can analyze compoundsthat lack a suitable chromophore. It can alsoidentify components in unresolved chromato-graphic peaks, reducing the need for perfectchromatography.
Mass spectral data complements data fromother LC detectors. While two compounds may have similar UV spectra or similar massspectra, it is uncommon for them to have both.The two orthogonal sets of data can be used to confidently identify, confirm, and quantifycompounds.
400000
800000
1200000
MS TIC
2000
4000m/z 648
min.5 10 15 20 25 30 35 40
100
200
300
m/z 1325
4000
8000
12000
m/z 376
Figure 2. Identification of three components in a chromatographically unresolved peak

6
Instrumentation
Mass spectrometers work by ionizing mole-cules and then sorting and identifying the ionsaccording to their mass-to-charge (m/z) ratios.Two key components in this process are theion source, which generates the ions, and themass analyzer, which sorts the ions. Severaldifferent types of ion sources are commonlyused for LC/MS. Each is suitable for differentclasses of compounds. Several different typesof mass analyzers are also used. Each hasadvantages and disadvantages depending onthe type of information needed.
Ion Sources
Much of the advancement in LC/MS over thelast ten years has been in the development of ion sources and techniques that ionize theanalyte molecules and separate the resultingions from the mobile phase.
Earlier LC/MS systems used interfaces thateither did not separate the mobile phase
molecules from the analyte molecules (directliquid inlet, thermospray) or did so before ion-ization (particle beam). The analyte moleculeswere then ionized in the mass spectrometerunder vacuum, often by traditional electronionization. These approaches were successfulonly for a very limited number of compounds.
The introduction of atmospheric pressureionization (API) techniques greatly expandedthe number of compounds that can be suc-cessfully analyzed by LC/MS. In atmosphericpressure ionization, the analyte molecules are ionized first, at atmospheric pressure. The analyte ions are then mechanically and electrostatically separated from neutralmolecules. Common atmospheric pressureionization techniques are:
• Electrospray ionization (ESI)• Atmospheric pressure chemical ionization
(APCI)• Atmospheric pressure photoionization (APPI)
Mol
ecul
ar W
eigh
t
Polarity
1000
100,000
10,000
Nonpolar Very Polar
100
10
Electrospray Ionization
APCIAPPI
Figure 3. Applications of variousLC/MS ionization techniques

7
Electrospray ionization
Electrospray relies in part on chemistry to gen-erate analyte ions in solution before the analytereaches the mass spectrometer. The LC eluentis sprayed (nebulized) into a chamber at atmos-pheric pressure in the presence of a strongelectrostatic field and heated drying gas.
The electrostatic field causes further dissociation of the analyte molecules. The heated drying gas causes the solvent in the droplets to evaporate. As the dropletsshrink, the charge concentration in thedroplets increases. Eventually, the repulsiveforce between ions with like charges exceeds the cohesive forces and ions are ejected(desorbed) into the gas phase. These ions are attracted to and pass through a capillarysampling orifice into the mass analyzer.
Some gas-phase reactions, mostly protontransfer and charge exchange, can also occur between the time ions are ejected from the droplets and the time they reach the mass analyzer.
Electrospray is especially useful for analyzinglarge biomolecules such as proteins, peptides,
and oligonucleotides,but can also analyzesmaller moleculeslike benzodiaze-pines and sulfatedconjugates.
Large moleculesoften acquire morethan one charge.Thanks to thismultiple charging,electrospray can be used to analyzemolecules as largeas 150,000 u even
though the mass range (or more accuratelymass-to-charge range) for a typical LC/MSinstruments is around 3000 m/z. For example:
100,000 u / 10 z = 1,000 m/z
When a large molecule acquires many charges,a mathematical process called deconvolution is often used to determine the actual molecularweight of the analyte.
Analyte ion ejectedEvaporation
+++
+ + +++
+++
-- -- -- +++++++
++++-- -- -- +++++++
++++-- -- --
+++ +
++ ----
+
Dielectric capillary entrance
Nebulizer gas
Solvent spray
Ions
+ + + + + + + +
++
+
+
+
++
Heated nitrogen drying gas
+ +
Figure 4. Electrospray ion source
Figure 5. Desorption of ions from solution

8
Atmospheric pressure
chemical ionization
In APCI, the LC eluent is sprayed through a heated (typically 250°C – 400°C) vaporizer at atmospheric pressure. The heat vaporizesthe liquid. The resulting gas-phase solventmolecules are ionized by electrons dischargedfrom a corona needle. The solvent ions thentransfer charge to the analyte moleculesthrough chemical reactions (chemical ioniza-tion). The analyte ions pass through a capillarysampling orifice into the mass analyzer.
APCI is applicable to a wide range of polar and nonpolar molecules. It rarely results inmultiple charging so it is typically used formolecules less than 1,500 u. Due to this, and because it involves high temperatures,APCI is less well-suited than electrospray for analysis of large biomolecules that may be thermally unstable. APCI is used withnormal-phase chromatography more often than electrospray is because the analytes areusually nonpolar.
+ + + + + + ++ +
Drying gas
Capillary
Coronadischarge needle
Vaporizer (heater)
Nebulizer (sprayer)
HPLC inlet
Nebulizing gas
+
++
+
++
Figure 6. APCI ion source

9
APPI is applicable to many of the samecompounds that are typically analyzed by APCI. It shows particular promise in two applications, highly nonpolar compounds and low flow rates (<100 µl/min), where APCIsensitivity is sometimes reduced.
In all cases, the nature of the analyte(s) and the separation conditions have a stronginfluence on which ionization technique:electrospray, APCI, or APPI, will generate the best results. The most effective techniqueis not always easy to predict.
Atmospheric pressure photoionization
Atmospheric pressure photoionization (APPI)for LC/MS is a relatively new technique. As in APCI, a vaporizer converts the LC eluent tothe gas phase. A discharge lamp generatesphotons in a narrow range of ionizationenergies. The range of energies is carefullychosen to ionize as many analyte molecules as possible while minimizing the ionization of solvent molecules. The resulting ions passthrough a capillary sampling orifice into themass analyzer.
+ + + + + + ++ +
+
++
Drying gas
Capillary
UV lamp
Vaporizer (heater)
Nebulizer (sprayer)
HPLC inlet
Nebulizing gas
+hv
++
Figure 7. APPI ion source

10
Mass Analyzers
Although in theory any type of mass analyzercould be used for LC/MS, four types:
• Quadrupole• Time-of-flight• Ion trap• Fourier transform-ion cyclotron resonance
(FT-ICR or FT-MS)
are used most often. Each has advantages anddisadvantages depending on the requirementsof a particular analysis.
Quadrupole
A quadrupole mass analyzer consists of fourparallel rods arranged in a square. The analyteions are directed down the center of thesquare. Voltages applied to the rods generateelectromagnetic fields. These fields determinewhich mass-to-charge ratio of ions can pass
through the filter at a given time. Quadrupolestend to be the simplest and least expensivemass analyzers.
Quadrupole mass analyzers can operate in two modes:
• Scanning (scan) mode• Selected ion monitoring (SIM) mode
In scan mode, the mass analyzer monitors arange of mass-to-charge ratios. In SIM mode,the mass analyzer monitors only a few mass-to-charge ratios.
SIM mode is significantly more sensitive thanscan mode but provides information aboutfewer ions. Scan mode is typically used forqualitative analyses or for quantitation when all analyte masses are not known in advance.SIM mode is used for quantitation and monitor-ing of target compounds.
From ion source
To detector
m/z
time m/z
Abun
danc
e
m/z
Abun
danc
e
m/z
time
1 Scan
1 Scan
Mass Range
Discrete Masses
Scan
SIM
Figure 8. Quadrupole mass analyzer
Figure 9. The quadrupole mass analyzer can scan over a range
of mass-to-charge ratios or alternate between just a few

11
Time-of-flight
In a time-of-flight (TOF) mass analyzer, auniform electromagnetic force is applied to all ions at the same time, causing them toaccelerate down a flight tube. Lighter ions
Repeller Detector
From ion source
Accumulation
Ejection
Repeller Detector
Flight tube (field-free region)
Flight tube (field-free region)
m/z
Abun
danc
e
++
+
Figure 10. Time-of-flight mass analyzer
Accumulation
++
++ +
Ejection
++
+
m/z
Abun
danc
e
Figure 11. Ion trap mass analyzer
travel faster and arrive at the detector first, so the mass-to-charge ratios of the ions aredetermined by their arrival times. Time-of-flight mass analyzers have a wide mass range and can be very accurate in their mass measurements.
Ion trap
An ion trap mass analyzer consists of a circular ring electrode plus two end caps that together form a chamber. Ionsentering the chamber are “trapped” thereby electromagnetic fields. Another field can be applied to selectively eject ions from the trap.
Ion traps have the advantage of being ableto perform multiple stages of mass spec-trometry without additional mass analyzers.
12
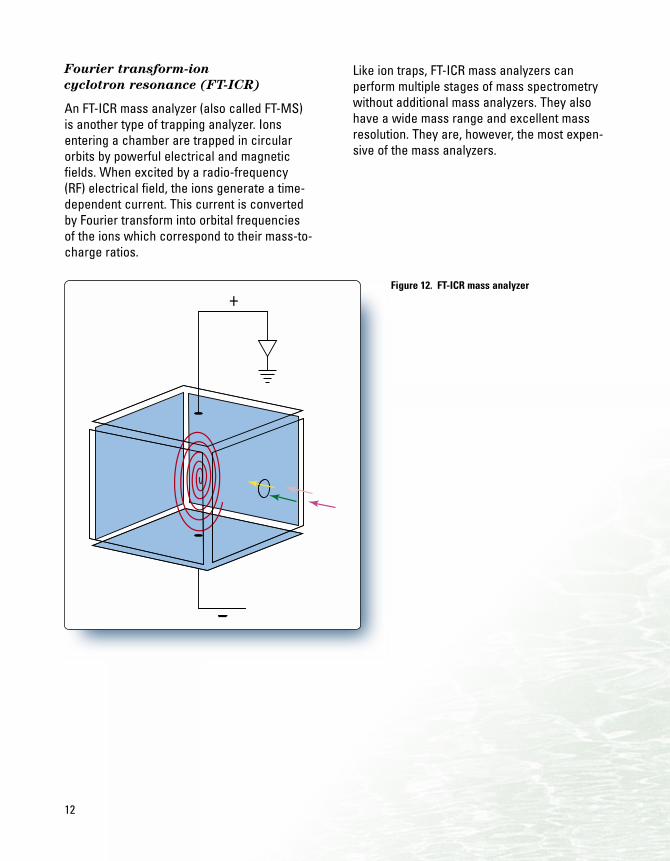
Fourier transform-ion
cyclotron resonance (FT-ICR)
An FT-ICR mass analyzer (also called FT-MS) is another type of trapping analyzer. Ionsentering a chamber are trapped in circularorbits by powerful electrical and magneticfields. When excited by a radio-frequency (RF) electrical field, the ions generate a time-dependent current. This current is convertedby Fourier transform into orbital frequencies of the ions which correspond to their mass-to-charge ratios.
Like ion traps, FT-ICR mass analyzers canperform multiple stages of mass spectrometrywithout additional mass analyzers. They alsohave a wide mass range and excellent massresolution. They are, however, the most expen-sive of the mass analyzers.
Figure 12. FT-ICR mass analyzer
+
13
m/z100 200 3000
20000
40000
60000 [M + H]+
[M + Na]+
80000
124
.1
186
.0
279
.1
156
.1
108
.2
301
.0
323
.0
213
.2
107
.1
280
.1
125
.1
187
.0
157
.1
NH
H2N
O
O N
N
CH3
CH3S
m/z 156
m/z 186
m/z 124
m/z 213
m/z 108
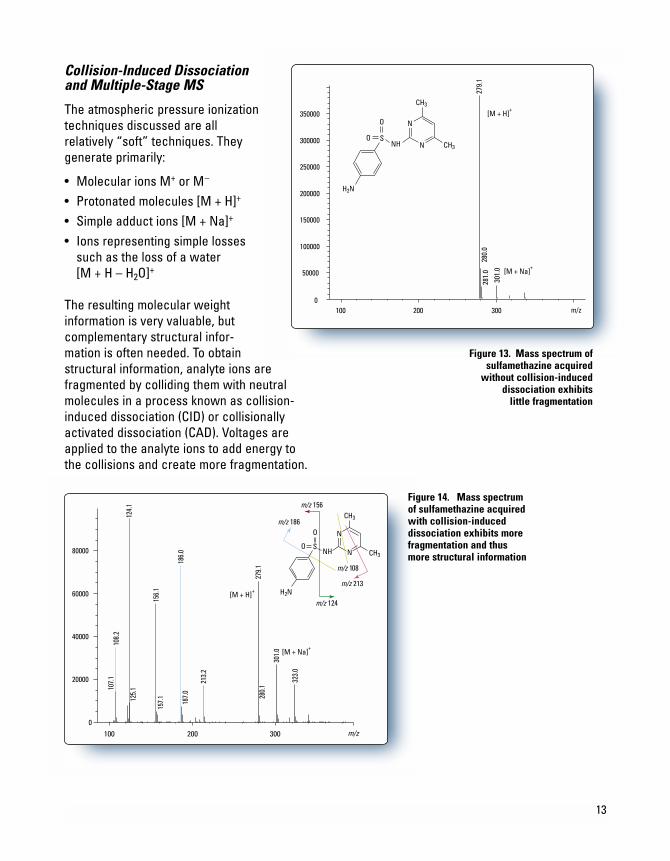
Figure 14. Mass spectrum of sulfamethazine acquiredwith collision-induceddissociation exhibits morefragmentation and thusmore structural information
Collision-Induced Dissociation and Multiple-Stage MS
The atmospheric pressure ionizationtechniques discussed are allrelatively “soft” techniques. Theygenerate primarily:
• Molecular ions M+ or M–
• Protonated molecules [M + H]+
• Simple adduct ions [M + Na]+
• Ions representing simple lossessuch as the loss of a water [M + H – H2O]+
The resulting molecular weightinformation is very valuable, butcomplementary structural infor-mation is often needed. To obtainstructural information, analyte ions arefragmented by colliding them with neutralmolecules in a process known as collision-induced dissociation (CID) or collisionallyactivated dissociation (CAD). Voltages areapplied to the analyte ions to add energy to the collisions and create more fragmentation.
m/z100 200 3000
50000
100000
150000
200000
250000
300000
350000
279
.1
301
.0
280
.0 2
81.0 [M + Na]
+
[M + H]+
SNH
H2N
O
O N
N
CH3
CH3
Figure 13. Mass spectrum of sulfamethazine acquired
without collision-induced dissociation exhibits
little fragmentation

14
CID in single-stage MS
CID is most often associated with multistagemass spectrometers where it takes placebetween each stage of MS filtering, but CIDcan also be accomplished in single-stagequadrupole or time-of-flight mass spectrome-ters. In single-stage mass spectrometers, CID takes place in the ion source and is thussometimes called source CID or in-source CID.Analyte (precursor) ions are accelerated andcollide with residual neutral molecules to yieldfragments called product ions.
The advantage of performing CID in single-stage instruments is their simplicity and relatively low cost. The disadvantage is thatALL ions present are fragmented. There is no way to select a specific precursor ion so there is no sure way to determine which
product ions came from which precursor ion.The resulting spectra may include mass peaksfrom background ions or coeluting compoundsas well as those from the analyte of interest.This tradeoff may be acceptable when analyz-ing relatively pure samples, but does not givegood results if chromatographic peaks are notwell resolved or background levels are high.
CID and multiple-stage MS
Multiple-stage MS (also called tandem MS orMS/MS or MSn) is a powerful way to obtainstructural information. In triple-quadrupole orquadrupole/quadrupole/time-of-flight instru-ments (see Figure 16), the first quadrupole isused to select the precursor ion. CID takesplace in the second stage (quadrupole or octopole), which is called the collision cell.
LC/MS
Q1CIDCapillarym/z
Abun
danc
e
Figure 15. In-sourceCID with a single-quadrupole massanalyzer
LC/MS/MS
Q1Capillary Q2 (CID) Q3
m/z
Abun
danc
e
Figure 16. MS/MS in a triple-quadrupole mass spectrometer

15
A major advantage of multiple-stage MS is its ability to use the first stage of MS todiscard nonanalyte ions. Sample cleanup and chromatographic separation becomemuch less critical. With relatively puresamples, it is quite common to do away with chromatographic separation altogetherand infuse samples directly into the massspectrometer to obtain product mass spectrafor characterization or confirmation.
The third stage (quadrupole or TOF) then generates a spectrum of the resulting product ions. It can also perform selected ion monitoring of only a few product ions when quantitating target compounds.
In ion trap and FT-ICR mass spectrometers, all ions except the desired precursor ion are ejected from the trap. The precursor ion is then energized and collided to generateproduct ions. The product ions can be ejected to generate a massspectrum, or a particular product ion can be retained and collided toobtain another set of product ions.This process can be sequentiallyautomated so that the mostabundant ion(s) from each stage of MS are retained and collided.This is a very powerful technique for determining the structure ofmolecules. It is also a powerfultechnique for obtaining peptidemass information that relates to the sequence of amino acids in a peptide.
Accumulation
A. B.
Nonprecursor ions ejected
+
+ ++
m/z
Abun
danc
e
D.C.
Collision Product ions ejected and detected
+ +
+
++
++
Figure 17. MS/MS in an ion trap mass spectrometer

16
Adapting LC Methods
Early LC/MS systems were limited by funda-mental issues like the amount of LC eluent themass spectrometer could accept. Significantchanges to LC methods were often required toadapt them to MS detectors.
Modern LC/MS systems are more versatile.Many mass spectrometers can accept flowrates of up to 2 ml/min. With minor modifica-tions, the same instruments can also generategood results at microliter and nanoliter flowrates. Ion sources with orthogonal (off-axis)nebulizers are more tolerant of nonvolatilebuffers and require little or no adjustment, even with differing solvent compositions andflow rates.
Changes to LC methods required for modernLC/MS systems generally involve changes insample preparation and solution chemistry to:
• Ensure adequate analyte concentration• Maximize ionization through careful
selection of solvents and buffers• Minimize the presence of compounds that
compete for ionization or suppress signalthrough gas-phase reactions
Figure 18. Salt deposits in this Agilent APCI ion source had little effect onperformance thanks to orthogonalspray orientation and robust ionsource design

• Use solvents that have low heats of vapor-ization and low surface tensions to enhanceion desorption
• Make sure that gas-phase reactions do not neutralize ions through proton transfer or ion pair reactions
If pH adjustments interfere with properchromatography, postcolumn modification of the solvent may be a good solution. This can improve MS response without compro-mising chromatography.
17
Sample preparation
Sample preparation generally consists ofconcentrating the analyte and removingcompounds that can cause background ions or suppress ionization. Examples of samplepreparation include:• On-column concentration to increase
analyte concentration• Desalting to reduce the sodium and
potassium adduct formation that commonly occurs in electrospray
• Filtration to separate a low-molecular-weight drug from proteinsin plasma, milk, or tissue
Ionization chemistry
Because formation of analyte ions in solution is essential to achievinggood electrospray results, carefulattention must be paid to propersolution chemistry. For electrospray:• Select more volatile buffers to
reduce the buildup of salts in the ion source
• Adjust solvent pH according to thepolarity of ions desired and the pHof the sample
pH 2.5pH 2.5
pH 6
+15
+14
+13
+12
+11
+10+9
+15
+14
+13
+12 +11
+10
+9
+8
pH 12
Figure 19. Effect of solvent pH on the abundance of multiply chargedions of the protein Lysozyme in electrospray mode

18
Solution chemistry is less critical for APCIoperation because ionization occurs in the gas phase, not the liquid phase, but solventselection can still have a significant effect onAPCI analyte signal response.
• Select more volatile solvents• Select solvents with a lower charge affinity
than the analyte• Protic solvents generally work better than
nonprotic solvents for positive ion mode• For negative ionization, solvents that readily
capture an electron must be used• Ammonium salts in the mobile phase can
cause ammonium adduct formation
Vaporizer temperature also affects APCI ionization results. The temperature must be hot enough to vaporize the solvent but not so hot as to cause thermal degradation of theanalyte molecules.
2 3 4 5 6 7 8 9 10 11 12 13 14 15 161
2 3 4 5 6 7 8 9 10 11 12 13 14 15 161
200˚C
400˚C
Figure 20. APCI analysis with an inadequate vaporizer temperature (200°C) yields poor results for some compounds compared to a more typical vaporizer temperature (400°C)
19
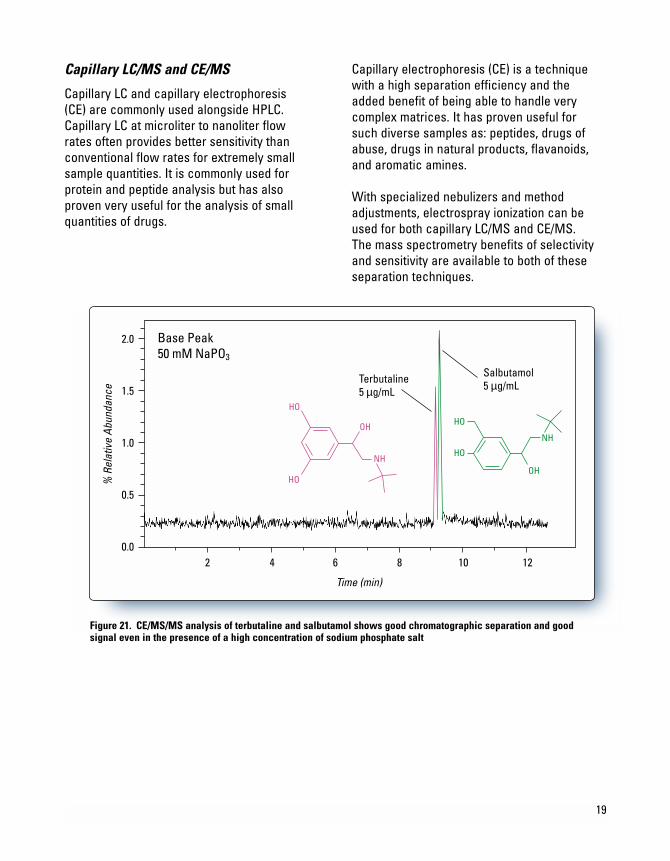
Capillary electrophoresis (CE) is a techniquewith a high separation efficiency and the added benefit of being able to handle verycomplex matrices. It has proven useful for such diverse samples as: peptides, drugs ofabuse, drugs in natural products, flavanoids,and aromatic amines.
With specialized nebulizers and methodadjustments, electrospray ionization can beused for both capillary LC/MS and CE/MS. The mass spectrometry benefits of selectivityand sensitivity are available to both of theseseparation techniques.
Capillary LC/MS and CE/MS
Capillary LC and capillary electrophoresis (CE) are commonly used alongside HPLC.Capillary LC at microliter to nanoliter flow rates often provides better sensitivity thanconventional flow rates for extremely smallsample quantities. It is commonly used forprotein and peptide analysis but has alsoproven very useful for the analysis of smallquantities of drugs.
2.0
1.5
1.0
0.5
0.02 4 6 8 10 12
HO
HO
OH
NH
HO
HO
OH
NH
Time (min)
% R
elat
ive
Abun
danc
e
Terbutaline5 µg/mL
Salbutamol5 µg/mL
Base Peak50 mM NaPO3
Figure 21. CE/MS/MS analysis of terbutaline and salbutamol shows good chromatographic separation and goodsignal even in the presence of a high concentration of sodium phosphate salt

20
Applications
LC/MS is suitable for many applications, frompharmaceutical development to environmentalanalysis. Its ability to detect a wide range of compounds with great sensitivity and speci-ficity has made it popular in a variety of fields.
Molecular Weight Determination
One fundamental application of LC/MS is the determination of molecular weights. Thisinformation is key to determining identity.
Differentiation of
similar octapeptides
Figure 22 shows the spectra of two peptideswhose mass-to-charge ratios differ by only 1 m/z. The only difference in the sequence is at the C-terminus where one peptide hasthreonine and the other has threonine amide.The smaller fragments are identical in the twospectra, indicating that large portions of thetwo peptides are very similar. The larger frag-ments contain the differentiating peptides.
0
20
40
60
80
100
858
.5
739
.3
880
.3
444
.2
576
.3
498
.2
841
.3
343
.1
397
.2
m/z400 600 800
0
20
40
60
80
100
857
.5 8
79.5
739
.3
840
.3
576
.3
444
.2
379
.1
Ala-Ser-Thr-Thr-Thr-Asn-Tyr-Thr
Ala-Ser-Thr-Thr-Thr-Asn-Tyr-Thr amide
Figure 22. Mass spectradifferentiating two verysimilar octapeptides

21
The upper part of the display in Figure 23shows the full scan mass spectrum of GFP. The pattern of mass spectral peaks is charac-teristic of a multiply charged analyte. Eachpeak represents the molecule with a differentnumber of charges. The lower display is adeconvoluted mass spectrum generated by the data system for the singly charged analyte.
Determining the molecular weight
of green fluorescent protein
Green fluorescent protein (GFP) is a 27,000-Dalton protein with 238 amino acids. It emits a green light when excited by ultraviolet light.
During electrospray ionization, GFP acquiresmultiple charges. This allows it to be analyzedby a mass spectrometer with a relativelylimited mass (mass-to-charge) range. Massdeconvolution is then used to determine the molecular weight of the protein.
1000 1500
100000
120000
20000
40000
60000
80000
726
.25
746
.15
767
.55
789
.95
839
.45
866
.45
895
.45
926
.15
959
.15
994
.85
103
2.95
107
4.15
111
8.85
116
7.55
122
0.45
127
8.75
134
2.65
141
3.25
157
9.65
26700 26800 26900 27000
200000
400000
600000
800000
1000000
Deconvoluted spectrumMW = 26828.84
Figure 23. Molecularweight determination
of green fluorescent protein by electro-
spray LC/MS

22
Structural Determination
Another fundamental application of LC/MS is the determination of information aboutmolecular structure. This can be in addition to molecular weight information or instead of molecular weight information if the identityof the analyte is already known.
Structural determination of
ginsenosides using MSn analysis
Ginseng root, a traditional Chinese herbalremedy, contains more than a dozenbiologically active saponins called ginseno-sides. Since most ginsenosides containmultiple oligosaccharide chains at differentpositions in the molecule, structural elucidationof these compounds can be quite complicated.
MSn analysis in an ion trap mass spectrometerpermits multiple stages of precursor ionisolation and fragmentation. This stepwisefragmentation permits individual fragmentationpathways to be followed and provides a greatdeal of structural information.
Figure 24 shows the full scan mass spectrumfrom a direct infusion of the ginsenoside Rb1.The most prominent feature is the sodiumadduct ion [M + Na]+ at m/z 1131.7. MS/MS of m/z 1131.7 yields a product ion at m/z 789.7corresponding to cleavage of a single glyco-sidic bond (Figure 25). Subsequent isolation and fragmentation of m/z 789.7 (Figure 26)yields two products: a more abundant ion atm/z 365.1 corresponding to loss of the oligo-saccharide chain (–Glc 2 –Glc), and a lessabundant ion at m/z 627.5 representing the loss of a deoxyhexose sugar.
m/z200 400 600 800 1000 1200
% R
elat
ive
Abun
danc
e
0
20
40
60
80
100 1131.7
[M + Na]+
m/z 1131.7
HO
OHOH
OHOH
HO
HO HO
HO
O O
O O
OH
OH
OH
OHOH
OH
OO
O
O
Figure 24. Full scan massspectrum of ginsenoside Rb1 showing primarilysodium adduct ions

23
Figure 26. Subsequentfull scan product ionspectrum (MS3) from
the ion at m/z 789.7
789.7
1131.7
MS/MS of 1131.7
365.2
m/z200 400 600 800 1000 1200
% R
elat
ive
Abun
danc
e
0
20
40
60
80
100
HO HO
OH
HO
OHO O
OO
OH
HO
OH
HO
OH
OHO O
OOOH
OH OHOH
[M + Na]+
m/z 1131.7
m/z 365.2
m/z 789.7
m/z200 300 400 500 600 700 800
% R
elat
ive
Abun
danc
e
0
20
40
60
80
100
HO
HO
O
O
O
O
OH
OH
OH
OH
OH
OH
Na+
m/z 627.5m/z 365.1
365.1
627.5
1131.7 789.7
Figure 25. Full scan product ion (MS/MS) spectrum from the sodiumadduct at m/z 1131.7
24
Pharmaceutical Applications
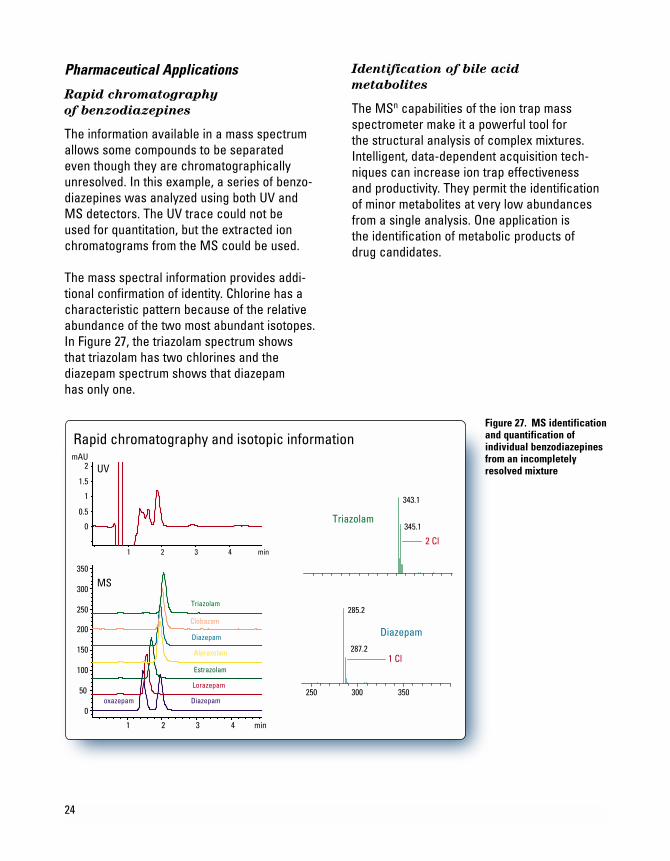
Rapid chromatography
of benzodiazepines
The information available in a mass spectrumallows some compounds to be separated even though they are chromatographicallyunresolved. In this example, a series of benzo-diazepines was analyzed using both UV andMS detectors. The UV trace could not be used for quantitation, but the extracted ionchromatograms from the MS could be used.
The mass spectral information provides addi-tional confirmation of identity. Chlorine has acharacteristic pattern because of the relativeabundance of the two most abundant isotopes.In Figure 27, the triazolam spectrum shows that triazolam has two chlorines and thediazepam spectrum shows that diazepam has only one.
Identification of bile acid
metabolites
The MSn capabilities of the ion trap massspectrometer make it a powerful tool for the structural analysis of complex mixtures.Intelligent, data-dependent acquisition tech-niques can increase ion trap effectiveness and productivity. They permit the identification of minor metabolites at very low abundancesfrom a single analysis. One application is the identification of metabolic products of drug candidates.
Rapid chromatography and isotopic information
min1 2 3 4
0
50
100
150
200
250
300
350
oxazepam Diazepam
Lorazepam
Estrazolam
Alprazolam
Diazepam
Clobazam
Triazolam
343.1
345.1
250 300 350
285.2
287.2
Triazolam
Diazepam
2 Cl
1 Cl
min1 2 3 4
mAU
0
0.5
1
1.5
2
MS
UV
Figure 27. MS identificationand quantification ofindividual benzodiazepinesfrom an incompletelyresolved mixture

25
corresponding to a predicted minor metabolite(cholic acid) that eluted at 9.41 minutes. Thefull scan MS/MS product spectrum (Figure 28C)from the ion at m/z 407 confirms the identity.
Significant time was saved because theconfirming MS/MS product ion spectra wereacquired automatically in the same run as thefull scan MS data.
This example uses the in vitro incubation of the bile acid deoxycholic acid with rat livermicrosomes to simulate metabolism of a drug candidate. Intelligent, data-dependentacquisition was used to select the two mostabundant, relevant ions in each MS scan.These precursor ions were automaticallyfragmented and full scan product ion spectra collected.
Figure 28A shows the base peak chromato-gram. Figure 28B shows the extracted ionchromatogram of the [M-H]– ion at m/z 407
m/z 407
9.41
0
1
2
3
4
2 4 6 8 10 12 14
0
1
2
3
5
4
2 4 6 8 10 12 14
10.24
11.64
12.01
12.28
13.490.77
MinorMetabolite
Base Peak:m/z 150–500
MS/MS of 407at 9.41 min
289.5 343.4
389.5325.3
100 200 300 400 500 m/z0
20
40
60
80
100
Cholic Acid
H H
H
OH OH
OHOH
H
H
O
H
A
B
C
Figure 28. Identification of a minormetabolite of deoxycholic acidthrough MS/MS

26
Biochemical Applications
Rapid protein identification
using capillary LC/MS/MS
and database searching
Traditional methods of protein identificationgenerally require the isolation of individualproteins by two-dimensional gel electro-phoresis. The combination of capillaryLC/MS/MS with intelligent, data-dependentacquisition and probability-based databasesearching makes it possible to rapidly identifyas many as 100 proteins in a single analysis.
In this example, a capillary LC and ion trapmass spectrometer were used to acquire data from a mixture of five tryptically digestedproteins at a concentration of 1 pmol/µl each(Figure 29). Using intelligent, automated data-dependent acquisition, a full scan product ion (MS/MS) spectrum was acquire from themost abundant relevant ion in each mass scanthroughout the entire run. All MS and MS/MSdata were acquire from a single analysis.
Base Peak: m/z 150–2000
0.0
0.2
0.4
0.6
0.8
Intens.x107
4.43
11.75
13.43
14.43
17.55
18.39
21.0920.59
22.35
30.37
31.37
5 10 15 20 25 30 35 Time [min]
Figure 29. Base peak chromatogram generated from 1 pmol total material injected on column

381.3 569.3
670.4
856.5
769.5
971.6
1157.51271.5
1386.7
ObservedMS/MS of m/z 807.2
0
20
40
60
80
100
200 600 1000 1400 1800 m/z
% R
elat
ive
Abu
ndan
ce
27
Protein identification was accomplished using MASCOT software that correlated theuninterpreted MS/MS data with sequences in a database. Figure 30 demonstrates theexcellent match between the observed MS/MS spectrum from the most abundant ion (m/z 807.2) in the chromatographic peak at 17.55 minutes and the theoretical y-ionseries predicted for a tryptic peptide fromhuman apolipoprotein, one of the proteins inthe sample mixture.
Y(12
)
Y(10
)
Y(11
)
Y(9)
Y(8)
Y(7)
Y(6)
Y(5)
Y(3)
Theoretical
LLDNWDSVTSTFSK
400 600 800 1000 1200 1400
1386.6
971.5
856.4
1157.5 1271.6769.4
670.3569.3381.2
Figure 30. Full scan MS/MS spectra from the doubly charged parent ion m/z 807.2 and the matching theoreticalsequence identified by database searching

28
Clinical Applications
High-sensitivity detection of
trimipramine and thioridazine
For most compounds, MS is more sensitivethan other LC detectors. Trimipramine is a tricyclic antidepressant with sedativeproperties. Thioridazine is a tranquilizer. Figure 31 shows these compounds in a urineextract at a level that could not be detected by UV. To get the maximum sensitivity from a single-quadrupole mass spectrometer, theanalysis was done by selected ion monitoring.
Food Applications
Identification of aflatoxins in food
Aflatoxins are toxic metabolites produced infoods by certain fungi. Figure 32 shows thetotal ion chromatogram from a mixture of fouraflatoxins. Even though they are structurallyvery similar, each aflatoxin can be uniquelyidentified by its mass spectrum (Figure 33).
mAU
0
200
0
80000
0
40000
0
20000
min1 2 3 4 5 60
8000
Trimipramine
Thioridazine
UV280 nm
EICm/z 295
EICm/z 100
EICm/z 126
EICm/z 371
Trimipramine
Thioridazine
Figure 31. Trimipramine andthioridazine in a urine extract

29
Scan of 2 ng
6.00 8.00 10.00 12.00 14.00 16.00 18.00
40000
80000
120000
160000
200000
1 23
4
1) Aflatoxin G2
2) Aflatoxin G1
3) Aflatoxin B2
4) Aflatoxin B1
TIC
Figure 32. Total ionchromatogram of a mixture of aflatoxins
120 160 200 240 280 320
50
90
285
Aflatoxin B1
335[M+Na]+
313[M+H]+
O
OCH3OO
O
O
120 160 200 240 280 320 360
50
90 Aflatoxin G2
353[M+Na]+
331 [M+H]+
313[M-OH]+
OO
O O
O O
OCH3
120 160 200 240 280 320 360
50
90
329[M+H]
243 283
Aflatoxin G1
351[M+Na]+
311[M-OH]+
+
OO
O O
O O
OCH3
120 160 200 240 280 320
50
90
287
Aflatoxin B2O
OCH3OO
O
O
315[M+H]+
337[M+Na]+
Figure 33. Unique mass spectra
allow positive identification
of structurally similar aflatoxins

30
Determination of vitamin D3 in
poultry feed supplements using MS3
Vitamin D is an essential constituent in humanand animal nutrition. Livestock diets deficientin vitamin D can cause growth abnormalities.
Traditional GC/MS analysis methods for vitamin D3 in feed extracts require extensiveand time-consuming sample preparation andderivatization prior to analysis. Atmosphericpressure chemical ionization with ion trapdetection provides a sensitive analyticalmethod without the need for extensive sample
preparation and derivatization. Further, themultiple-stage MS capability of the ion trapeliminates the need for chromatographicseparation, greatly speeding analyses.
Flow injection analysis of a poultry feed extract yields a peak at m/z 385 suggesting the presence of vitamin D3. Isolation and fragmentation of the precursor ion at m/z 385 is inconclusive. The full scan product ionspectrum shows a prominent peak at m/z 367representing the loss of a single water mole-cule but little other fragmentation (Figure 34).
199.3 219.0 255.2 287.3
m/z 367
325.4
367.4
m/z
% R
elat
ive
Abun
danc
e
0
20
40
60
80
100
150 200 250 300 350 400 450 500
H
[M+H]+ – H2O
HO
Poultry Feed ExtractMS2
m/z 385 →
Figure 34. Full scan MS/MS product ion spectrum from the precursor ion at m/z 385 showing primarilythe nonspecific loss of a water molecule

31
match with a similar analysis of a purestandard (Figure 35B) and conclusivelyconfirms the presence of vitamin D3.
Isolation and fragmentation of the ion at m/z 367 yields a full scan MS3 spectrum (Figure 35A) rich in structurally specific product ions. This spectrum is an excellent
158.6
185.0
213.0
255.2
271.1
325.5
Pure StandardVitamin D3MS3
m/z 385 → 367 →
349.2 367.6
241.3
285.3
227.2
0
20
40
60
80
100
150 200 250 300 350 400 500
m/z
% R
elat
ive
Abun
danc
e
B
Poultry Feed ExtractMS3
m/z 385 → 367 →
185.0213.1
255.1
285.4311.2
353.2
241.2
271.1325.5
227.2
158.5
0
20
40
60
80
100
150 200 250 300 350 400 500
m/z
% R
elat
ive
Abun
danc
e
A
Figure 35. Full scan MS3 product ion spectra show much more structural information

32
Environmental Applications
Detection of phenylurea herbicides
Many of the phenylurea herbicides are verysimilar and difficult to distinguish with a UVdetector (Figure 36). Monuron and diuron haveone benzene ring and differ by a single chlorine.Chloroxuron has two chlorines and a secondbenzene ring attached to the first by an oxygen.The UV-Vis spectra are similar for diuron andmonuron, but different for chloroxuron. Whenanalyzed using electrospray ionization on anLC/MS system, each compound has a uniquelyidentifiable mass spectrum.
Detection of low levels
of carbaryl in food
Pesticides in foods and beverages can be asignificant route to human exposure. Analysisof the carbamate pesticide carbaryl in extractsof whole food by ion trap LC/MS/MS provedmore specific than previous analyses by HPLCfluorescence and single-quadrupole massspectrometry. The protonated carbaryl mole-cule (m/z 202) was detected in full scan modeusing positive ion electrospray. A product ion
UV shows class; MS identifies species
nm
Norm.
200 250 300 350
0
100
200
300
400
500
min5 10 15 20 25
mAU
0
20
40
60
80
100
**
*
233.1
199.2
100 200 300 400 500
291.2Chloroxuron
Diuron
Monuron
Figure 36. Chromato-gram of phenylureaherbicide with UV and MS spectra

33
Ion trap analysis was more sensitive than pre-vious analysis using a single-quadrupole massspectrometer operating in scanning mode andmore sensitive than fluorescence detection.
Ion trap LC/MS/MS also con-firmed false positives in the HPLC fluorescence analysiscaused by a coeluting compound.Based on the MS/MS spectrumof the coeluting compound, apossible structure was assignedas shown in Figure 38.
at m/z 145 (Figure 37) generated by collision-induced dissociation provided confirmation ofcarbaryl and was used for subsequent quanti-tative analysis.
Abu
ndan
ce
100
80
60
40
20
0
100 125 150 175 200 225 250 275
m/z
145 m/z
[M + H]+
202
O C = 202
O
NH
CH3 H+
M
145+H
Carbaryl
O+H H
Figure 37. Full scan product ion spectrumgenerated by collision-induced dissociation of the [M + H]+ carbaryl ion at m/z 202
Abu
ndan
ce100
80
60
40
20
0
60 80 100 120 140 160 200180 220
m/z
O
NH
+
H
O C2H4N
NH
O+
86
145
214O C2H4N
NH
O
+H
C
O
NH C2H5
145mw 213
86
Figure 38. Full scan product ion spectrum of coelutingcompound that produced false positives in HPLCfluorescence analysis

CE/MS Applications
Analysis of peptides using CE/MS/MS
Capillary electrophoresis (CE) is a powerfulcomplement to liquid chromatography. Different selectivity and higher chromato-graphic resolution are its biggest advantageswhen analyzing clean samples such as
synthetic peptides. When analyzing ppm-levelsof analytes in complex matrices, minimalsample preparation and short analysis timesenable high throughput.
CE/MS with an ion trap mass spectrometer isdemonstrated using a standard peptide mix. The data-dependent acquisition capability of
the ion trap triggersMS/MS on the mostintense ion in each MS scan. Figure 39shows total ion electro-pherogram (TIE) and thebase peak electrophero-gram (BPE). Drops in the TIE indicate whereMS/MS spectra wereacquired automatically.The averaged massspectrum of peak 4(Figure 40) shows asingly charged mole-cule with m/z of 574.3. This is confirmed as Met-enkephalin (molecular weight 573.7)by the examination of the MS/MS massspectrum. The MS/MSspectrum shows all of the b- and y-seriesfragments within thescan range as well as fragments from other series.
TIE, All ±
BPE 200-1350, All MS ±
8.50 9.00 9.50 10.00 10.50 Time [min]
0.0
0.5
[x107]
0.0
2.0
1.0
Intensity
[x106]4.0
1
432
MS
MS/MS
Figure 39. Total ion electropherogram (top) and base peak electropherogram (bottom) of a standard peptide mixture
239.1
493.1
[M+H]+574.3
812.1 1147.20
2
4
200 400 600 800 1000 [m/z]
574.3
575.2576.2
0
4
Intensity[x105]
570 574 578
232.9 262.10
2
4
6
Intensity[x105]
Intensity[x104]
225 275 325 375
b2221.0
b3278.1
y2297.1
x2323.1
y3354.2
x3380.1
a4397.2
b4425.2
y4411.1
[m/z]
Figure 40. Full scan mass spec-trum (top) and MS/MS spectrum(bottom) of Met-enkephalin frompeak 4 of the electropherogram
34


www.agilent.com/chem
Copyright © 2001Agilent Technologies
Information, descriptions and specificationsin this publication are subject to changewithout notice.
All rights reserved. Reproduction, adaptationor translation without prior written permis-sion is prohibited, except as allowed under the copyright laws.
Printed in the U.S.A. February 15, 20015988-2045EN