Embed Size (px)
Citation preview
AUGUST 2010 491
American Journal of Education 116 (August 2010)� 2010 by The University of Chicago. All rights reserved.0195-6744/2010/11604-0002$10.00
Principal’s Time Use and School Effectiveness
EILEEN LAI HORNG, DANIEL KLASIK, and SUSANNA LOEBStanford University
School principals have complex jobs. To better understand the work lives ofprincipals, this study uses observational time use data for all high school principalsin one district. This article examines the relationship between the time principalsspent on different types of activities and school outcomes, including studentachievement, teacher and parent assessments of the school, and teacher satis-faction. We find that time spent on organization management activities is as-sociated with positive school outcomes, whereas day-to-day instruction activitiesare marginally or not at all related to improvements in student performanceand often have a negative relationship with teacher and parent assessments.
Introduction
Principals can play critical roles in the development of high-quality schools(see Darling-Hammond et al. 2007; EdSource 2008; Knapp et al. 2003; Wal-lace Foundation 2007). While only a small body of research links principalsdirectly to student achievement (Branch et al. 2008; Hallinger and Heck 1996),a much larger research base documents principals’ effects on school operations,through motivating teachers and students, identifying and articulating visionand goals, developing high performance expectations, fostering communica-tion, allocating resources, and developing organizational structures to supportinstruction and learning (Knapp et al. 2006; Lee et al. 1993; Leithwood etal. 2004). Principals also affect the instructional quality of schools through therecruitment, development, and retention of teachers (Harris et al. 2010).
While the importance of the principal for school operations is widely ac-knowledged, surprisingly little is known about what principals do on a day-to-day basis and how this varies across schools. Previous research on principal’stime use can be grouped into two broad categories: ethnographic studies andself-report studies—each with their own benefits and limitations. Ethnographicstudies allow for depth and detail but generally include observations of only
Electronically published June 9, 2010
Principal’s Time Use
492 American Journal of Education
a few principals and are consequently unable to generalize to a larger pop-ulation of schools or to empirically link principal’s time use to school outcomes(Martin and Willower 1981; Morris et al. 1984; Wolcott 1973). Self-reportresearch, usually conducted with surveys, allows for large samples but oftensacrifices depth and perhaps accuracy. These studies are likely to be susceptibleto self-reporting and memory biases (Andrews et al. 1986; Andrews and Soder1987; Brewer 1993; Eberts and Stone 1988; Erickson and Reller 1978; Mar-tinko and Gardner 1990).
Recent advances in self-report data collection methods, such as end-of-the-day logs and experience sampling methods (ESM), have reduced some of thesepotential biases (Goldring et al. 2008; Scott et al. 1990). For example, Spillaneet al. (2007) employed ESM by paging principals up to 15 times a day onportable handheld devices for six consecutive days. Each time they were paged,principals filled out a short survey asking questions about what they weredoing, who they were with, and where they were. The real-time nature ofthis method eliminates the possibility that principals forget or misremembertheir daily activities. The method, however, still suffers from the potentialbiases inherent in self-reporting. An additional drawback to ESM is that thesurveys take time to complete and are thus necessarily limited in their scopeso as not to overly disrupt the principal’s work day.
The study reported in this article draws on the strengths of these two typesof research. Similar to the methodology of ethnographic studies, trained re-searchers observed principals and recorded their time use to eliminate biasassociated with self-reports and to allow for more detailed description of timeuse than is usually possible in surveys. Similar to self-report data, the data forthis study cover the activities and locations of a large number of principals
EILEEN LAI HORNG directs the School Leadership Research project at theInstitute for Research on Education Policy and Practice (IREPP). Her researchinterests focus on the career paths of principals and teachers, district policiesthat affect the distribution of human resources across schools, and the impactof educator characteristics and mobility patterns on student outcomes. DANIEL
KLASIK is a doctoral candidate in the Administration and Policy Analysisprogram at Stanford University’s School of Education. His research interestsare primarily focused on issues related to higher education access. SUSANNA
LOEB is a professor of education at Stanford University, director of the Institutefor Research on Education Policy and Practice (IREPP), and a codirector ofPolicy Analysis for California Education (PACE). Her research interests centeron teacher policy—how teachers’ preferences affect teaching quality distri-bution, preservice coursework requirements affect teacher candidate quality,and reforms affect teachers’ career decisions—as well as school leadership.
Horng, Klasik, and Loeb
AUGUST 2010 493
and so do not have the small-sample limitations of ethnographic studies. Spe-cifically, a team of researchers shadowed 65 principals in Miami-Dade CountyPublic Schools (M-DCPS), each over the course of a full school day, andcollected detailed information on time use at five-minute intervals. They col-lected time use data from all 41 high school principals in the district and alsofrom a sample of 12 elementary and 12 middle school principals for com-parison. The scale of the data collection is large enough to allow for explicitmodeling of the links between principal’s actions and school outcomes.
With these data we seek to answer four broad questions:
1. What do principals do?2. Where do principals spend their time?3. How do principals’ roles vary by school characteristics?4. How are variations in principals’ actions reflected in measurable school
outcomes?
The school outcomes that we examine include student test performance aswell as measures of a school’s educational environment. In what follows, wedescribe our data and methods and then present the results. The final sectiondiscusses the implications of the findings, limitations of the study, and directionsfor future research.
Data and Method
Data for this study come primarily from observational time use data that wecollected from Miami–Dade County Public Schools (M-DCPS). We link in-formation from district school climate surveys of teachers and parents, surveysthat we administered to all teachers in the district, and district administrativedata on schools, staff, and students to this data. We use these data to createmeasures of the following:
• Principal’s time spent on each of 43 tasks and six aggregate taskcategories.
• Principal’s time in each of five locations.• School-level student achievement and student achievement gains in mul-
tiple years.• Teachers’ assessments of the school.• Teachers’ satisfaction in general and at their current school.• Parents’ assessments of the school.• Characteristics of teachers, principals, and schools to serve as controls
in the models.
Principal’s Time Use
494 American Journal of Education
In what follows, we describe each of our data sources.
Time Use Observational Data
The opportunity to observe principals in Miami-Dade, one of the country’slargest and most diverse school districts, allowed us to analyze a large numberof principals across varying school environments but within the same districtcontext.1 As described above, we observed 65 principals in M-DCPS, includingthe leaders of all 41 high schools and a sample of 12 elementary schools and12 middle schools.2
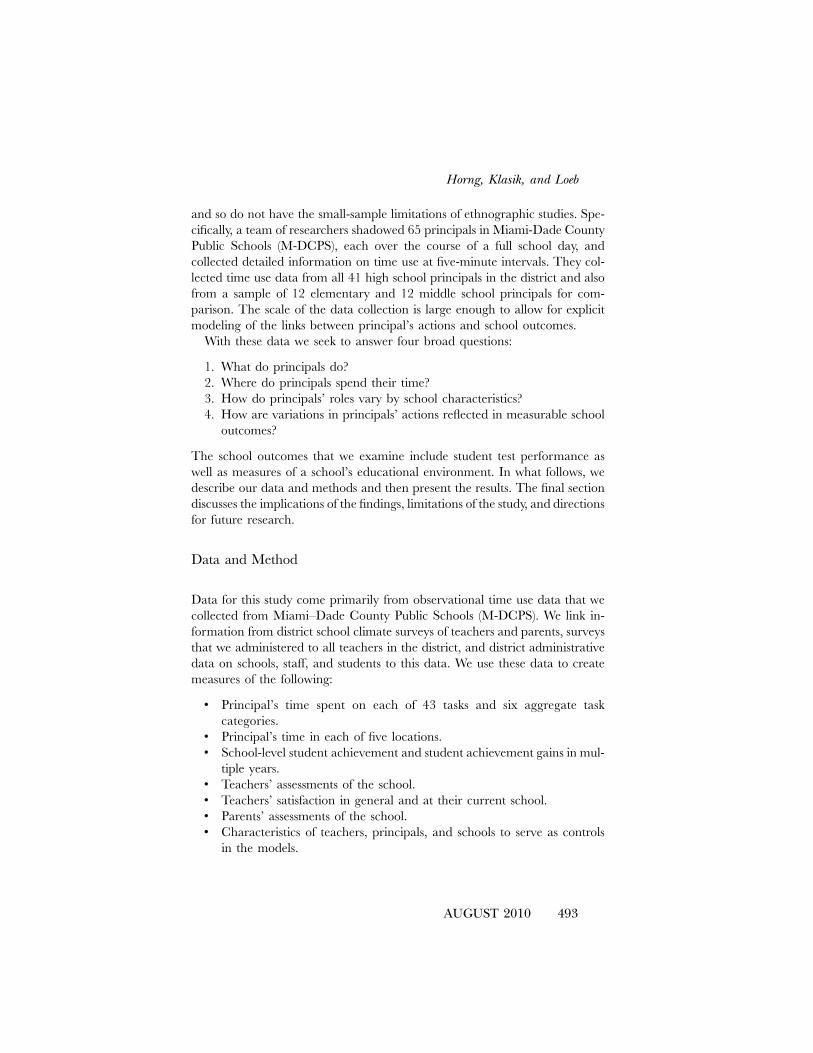
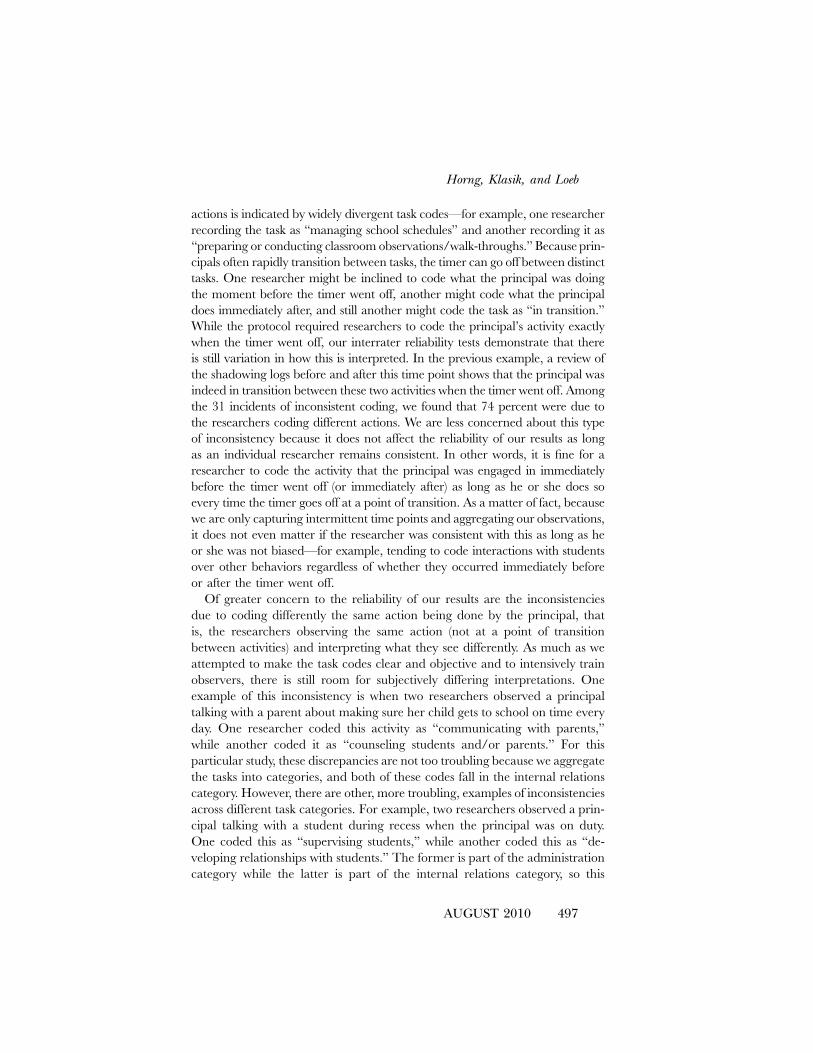
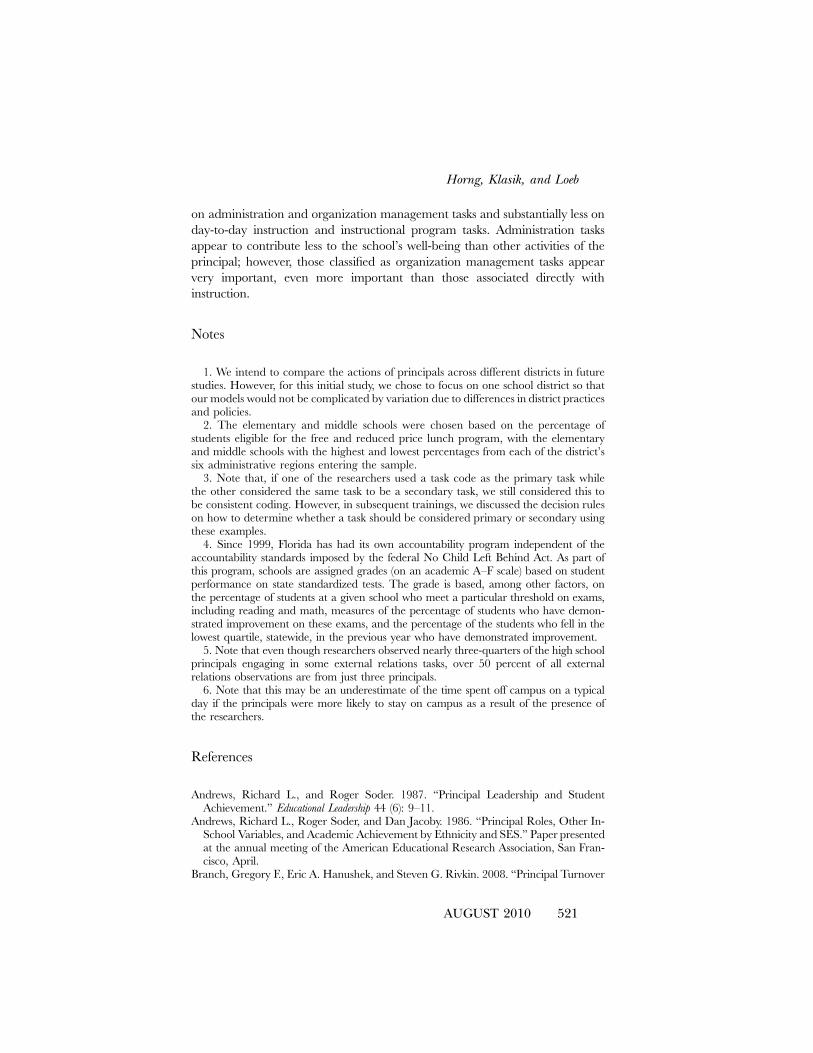
We coded principal’s actions as one of a list of 43 tasks, as shown in figure1. We populated our list of task codes based on the broad categories forprincipal’s duties described by Spillane et al. (2007). These four categorieswere administrative (e.g., managing budgets, managing personnel), instruction and
curriculum (e.g., observing classroom instruction, planning curricula), professional
growth (e.g., receiving coaching, studying effective practices), and fostering re-
lationships (e.g., interacting socially). Given that we were directly observingprincipals and not asking the principals to take time to fill out surveys, asSpillane et al. did, we were able to add substantially more specificity to thistask list. We expanded the task list through consultation with principals anddistrict leadership in multiple states and then refined our expanded list throughpilot shadowing of principals in local schools.
It would be impractical to include 43 separate tasks in our models. Becauseof this, we aggregate tasks into six task categories: administration, organization
management, day-to-day instruction, instructional program, internal relations, and external
relations. Figure 1 describes the individual tasks that comprise each task category.The groupings of tasks into these categories are based on analyses conductedin another study that is part of the same research project. In that prior study,Grissom and Loeb (2009) use factor analysis of principals’ self-ratings of ef-fectiveness on the same set of tasks to distinguish five task categories. For thisstudy, we made a further distinction in one of those categories, instructionalmanagement, by separating day-to-day instruction tasks from instructionalprogram tasks. We made this distinction because the conceptual differencebetween principal work related to day-to-day instruction and the broadermanagement of a school’s instructional program is substantial enough to war-rant separate consideration. All observations analyzed in this study occurredduring one week in April 2008, which, within the district’s calendar, was thesecond week after spring break. Researchers shadowed principals for an entireschool day, starting roughly 30 minutes before the start of school and endingwhen students were released at the end of the day. In both a conference callbefore the visit and a briefing immediately prior to the shadowing, principals
FIG
.1.
Prin
cipa
ls’tim
eus
eca
tego
ries
Principal’s Time Use
496 American Journal of Education
were instructed to ignore the researcher and not make any alterations to theirusual routine on account of the researcher’s presence. Researchers recordedprincipals’ tasks throughout the day at five-minute intervals. At each obser-vation, researchers coded the task of the principal, the location of the principal,with whom the principal was interacting, and the nature of the activity (e.g.,phone call, scheduled meeting). In cases where multiple codes were relevant,the more specific code was entered as the primary task, with other relevantcodes listed as secondary activities. We examine only primary task codes inthis study. Since we only use one task code per observation for this study, thepercent of observations is likely to be a good proxy for the percent of time aprincipal spends on a given task. In other words, our measure of principal’stime use is the average percent of times the principals are observed engagingin particular tasks. In cases where a researcher was unsure of which code touse in a particular situation, the instance was discussed with the larger groupof researchers during a daily debriefing until a consensus was reached onwhich code to use. Most analyses in this study use the 3,607 high schoolprincipals’ time use observations. Elementary and middle school observationsprovide comparisons for the high school data where noted.
A note on the reliability of the time use observations.—The 14 researchers whoconducted observations of the principals were trained on how to conductthe observations and how to differentiate among the principal’s tasks. Thetraining placed particular emphasis on consistent decision rules, such as howto code tasks for which multiple codes might apply. As one example, anobservation of a principal leading a staff meeting about standardized testingmight be coded as “utilizing staff meetings” or “preparing and implementingstandardized tests.” The decision rule that applies to this case is to prioritizethe specific content over the more general context—in other words, theprimary task is “preparing and implementing standardized tests” and thesecondary task is “utilizing staff meetings.” In addition to participating inthese training sessions, the researchers conducted practice observations inpairs at local schools.
We used the practice observations in local schools to test interrater reliability.We randomly assigned researchers to observe principals in pairs. Seven pairsof researchers observed local principals for three hours. The researchers shareda timer but independently completed their shadowing logs. We calculated aconsistency rate for each pair of researchers as the percentage of observationsfor which their task codes were the same.3 On average, the researchers had an85 percent consistency rate. The individual pairs of researchers had consistencyrates ranging from 69 to 94 percent. We closely reviewed the incidents ofinconsistent coding and distinguished two types of inconsistencies: (1) codingdifferent actions performed by the principal and (2) coding differently the sameaction performed by the principal. An inconsistency due to coding different
Horng, Klasik, and Loeb
AUGUST 2010 497
actions is indicated by widely divergent task codes—for example, one researcherrecording the task as “managing school schedules” and another recording it as“preparing or conducting classroom observations/walk-throughs.” Because prin-cipals often rapidly transition between tasks, the timer can go off between distincttasks. One researcher might be inclined to code what the principal was doingthe moment before the timer went off, another might code what the principaldoes immediately after, and still another might code the task as “in transition.”While the protocol required researchers to code the principal’s activity exactlywhen the timer went off, our interrater reliability tests demonstrate that thereis still variation in how this is interpreted. In the previous example, a review ofthe shadowing logs before and after this time point shows that the principal wasindeed in transition between these two activities when the timer went off. Amongthe 31 incidents of inconsistent coding, we found that 74 percent were due tothe researchers coding different actions. We are less concerned about this typeof inconsistency because it does not affect the reliability of our results as longas an individual researcher remains consistent. In other words, it is fine for aresearcher to code the activity that the principal was engaged in immediatelybefore the timer went off (or immediately after) as long as he or she does soevery time the timer goes off at a point of transition. As a matter of fact, becausewe are only capturing intermittent time points and aggregating our observations,it does not even matter if the researcher was consistent with this as long as heor she was not biased—for example, tending to code interactions with studentsover other behaviors regardless of whether they occurred immediately beforeor after the timer went off.
Of greater concern to the reliability of our results are the inconsistenciesdue to coding differently the same action being done by the principal, thatis, the researchers observing the same action (not at a point of transitionbetween activities) and interpreting what they see differently. As much as weattempted to make the task codes clear and objective and to intensively trainobservers, there is still room for subjectively differing interpretations. Oneexample of this inconsistency is when two researchers observed a principaltalking with a parent about making sure her child gets to school on time everyday. One researcher coded this activity as “communicating with parents,”while another coded it as “counseling students and/or parents.” For thisparticular study, these discrepancies are not too troubling because we aggregatethe tasks into categories, and both of these codes fall in the internal relationscategory. However, there are other, more troubling, examples of inconsistenciesacross different task categories. For example, two researchers observed a prin-cipal talking with a student during recess when the principal was on duty.One coded this as “supervising students,” while another coded this as “de-veloping relationships with students.” The former is part of the administrationcategory while the latter is part of the internal relations category, so this
Principal’s Time Use
498 American Journal of Education
interrater inconsistency does affect the reliability of our results. Of the eightincidents of inconsistent coding due to coding the same behavior of a principaldifferently, only three crossed over different task categories. This representsonly 1 percent of all the observations in our interrater reliability tests.
Teacher and Parent Surveys
To better understand teachers’ and parents’ perceptions of the school’s edu-cational environment, we draw upon three surveys: a district-administeredschool climate survey for staff, a district-administered school climate surveyfor parents, and our own survey of teachers in the district. The school climatesurveys were designed by the district and have been administered annually inJanuary or February since 1998–99. They provide information about staffand parent perceptions of the school. In January and February 2008, thedistrict distributed the surveys to 26,100 staff and 83,700 parents. The responserates were 74 percent for the staff and 43 percent for the parents.
We also surveyed teachers in M-DCPS in May 2008. This survey askedteachers about the teaching and learning environment of their school, the roleof their current principal, how appealing different aspects of the principalshipare to them, how prepared they feel to take on school leadership responsi-bilities, their future plans, and their preferences for different school charac-teristics. We administered surveys to all teachers in the district and offeredcash prizes through a raffle for the teachers who completed the survey. Ul-timately, 15,842 teachers responded, representing 83 percent of all teachersin the district. For this article we examine the responses to questions on teachersatisfaction, one assessing overall satisfaction with teaching and the other as-sessing satisfaction at the current school.
Administrative Data
We merge the survey data and our data from the observation of the principalswith administrative data provided by M-DCPS. These data include schooldemographic variables, such as enrollment; the principal’s tenure at a school;and school performance based on the state’s accountability system. We obtaininformation on each school’s population of minority students as well as onthe number of students eligible for the free and reduced price lunch programfrom the National Center for Education Statistics’s common core of data.
Horng, Klasik, and Loeb
AUGUST 2010 499
Method
This article asks four questions: What do principals do? Where do principalsspend their time? How do principals’ roles vary by school characteristics? Howare variations in principals’ actions reflected in measurable school outcomes?The first three questions are descriptive. To answer them, we describe theaverage percent of time principals spent on each task as well as on the sixaggregated task categories. We then describe where principals completed thesetasks and compare the time use data across principals and schools with differentcharacteristics. For these analyses, we use percent of time spent on a taskinstead of the number of minutes because observations represent an instan-taneous sampling of a principal’s actions rather than an accounting of theactual amount of time spent on a task. However, because all principals wereobserved for approximately the same length of time, percent of time on taskand amount of time spent on task are similar measures.
The final question (How are variations in principals’ actions reflected inmeasurable school outcomes?) is trickier to answer. Any observed relationshipbetween school performance and the principal’s actions may be causal, butthe causality may work in either direction or the relationship may be a spuriousone; that is, more and less effective schools might differ in other ways thatmask the true relationship between their principals’ time use and outcomes.For example, it may be that when principals spend less time on administrationtasks, students have higher achievement, or it may be that when students arehigh achieving, principals do not need to spend as much time on adminis-tration tasks. Alternatively, it may be that lower student achievement reflectscharacteristics of the school context, such as the extent and type of studentbehavioral issues, which necessitate principals spending more time on admin-istration tasks (e.g., student discipline). To begin to unpack this final researchquestion, including taking into account potential confounding relationships,we examine the relationships between principal’s time use and school outcomesin a multivariate framework.
We run a series of regressions to investigate the relationships between prin-cipal’s time use as reflected by the percent time spent on each of the sixaggregated task categories and several school outcomes, while controlling forother characteristics of the school and the principal. All regression analysestake roughly the same form, with school performance as a function of timeuse and other controls. Because the proportion of time use across the categoriessums to 100 percent, we omit administration tasks as the reference category.We use four types of school-level outcome measures: student achievement,teacher assessments of the school, teacher satisfaction, and parent assessmentsof the school.
Principal’s Time Use
500 American Journal of Education
We run approximately the same five specifications for each outcome var-iable. The first specification contains only the percent of time principals spendon each of the task categories. The second specification adds school-levelcontrols, including school size, percent minority enrollment, percent of studentsqualifying for the free and reduced price lunch program, and whether theschool falls within the district’s “school improvement zone” (as these schoolshad special resources directed toward them). The third specification adds avariable for the principal’s experience (in months) at their current school. Thefourth specification accounts for change in the outcome variable by adding acontrol for the level of the outcome variable in a prior school year. We usea three-year lag in order to capture change over more than one year. Whendata for prior years are not available, we use the school accountability gradeas a control instead. Finally, because we are wary of stressing a model thatuses so many predictor variables relative to the effective size of our sample,after noting that most of our control variables are statistically insignificant,we run a “concise” specification for each dependent variable with only percentof time spent on task category and controls for past school outcomes. Ingeneral, these reduced models confirm the trends seen in the fully specifiedmodels.
Student achievement.—We model student achievement based on Florida’s ac-countability system.4 Our first set of models looks at principal’s time use inrelation to the school’s 2007–8 accountability grade on an academic A–Fscale. We use ordered probit regressions for these models because school gradescreate an ordinal variable in which the distance between each level is notnecessarily the same. For example, it might be more difficult for a school tomove from an F to a D than from a B to an A. The last two model specifications(a full model and a concise one) include controls for the school grade threeyears prior.
As an alternative to a school’s accountability grade, we use the 2007–8 rawscore of the school’s accountability points earned, that is, the sum of the com-ponent scores that comprise the school grade. These data have the benefit ofproviding a continuous outcome variable on which we are able to run ordinaryleast squares (OLS) regression models that are easier to interpret than orderedprobit models. We similarly model school-level student performance gains byadding a control for performance three years prior on this same measure.
Teacher assessments of the school.—In addition to affecting student performance,a principal’s actions may affect school performance in ways better measuredby teachers’ assessments of the school than by accountability grades. To es-timate the relationship between a principal’s time use and the school edu-cational environment, we link the principal observation data to teachers’ re-sponses on the district’s school climate survey.
Horng, Klasik, and Loeb
AUGUST 2010 501
The district climate survey asks teachers the extent to which they agreewith the following three statements: “At my school I feel safe and secure”; “Ibelieve children at my school are receiving a good education”; and “Theoverall climate or atmosphere at my school is positive and helps studentslearn.” We run OLS regressions on the percent of teachers in a school whoagree or strongly agree with each of these statements about the school’s ed-ucational environment. We run these outcome variables against the usualsequence of controls: the first specification includes only the percentage oftime principals spent on the task categories with no controls, the secondincludes school control variables, the third adds principal’s experience, andthe fourth includes a control for the percent of staff who agreed with the samestatement three years prior. The final specification represents a concise modelwith only task category time use and the percentage of staff who previouslyagreed with the statement.
Teacher satisfaction.—Another indicator of a positive educational environmentis teacher satisfaction. We run logistic regressions modeling whether a teacheris satisfied with teaching in general and with teaching at their current school.Because these data are at the teacher level, we cluster the standard errors atthe school level to account for the hierarchical nature of the data. We runfive models similar to those described above. However, since we do not haveprior survey data for our teacher survey, we control for school accountabilitygrade instead of prior survey responses in order to distinguish the relationshipbetween the principal’s time use and teachers’ satisfaction from the relationshipbetween the principal’s time use and school grade. For brevity, we only presentand discuss the results of the last two specifications—the full and concisemodels—in this article.
Parent assessments of the school.—A principal’s effectiveness may also be re-flected in parents’ assessments of the school. We link our time use data todistrict surveys of school climate that asked parents the extent to which theyagree with the following three statements: “My child’s school is safe andsecure”; “My child is getting a good education at this school”; and “Theoverall climate or atmosphere at my child’s school is positive and helps mychild learn.” Our outcome represents the percent of parents who agreed orstrongly agreed with this statement for the 2007–8 school year. We run theseparent assessment variables against the usual sequence of controls: the firstspecification includes only the percentage of time principals spent on giventask categories with no controls, the second includes school control variables,the third adds principal’s experience, and the fourth adds controls for thesame measure three years prior. Finally, we run a concise model with onlytask category time use and parents’ prior assessment of the school. Again, forbrevity we present and discuss only the last two specifications in this article.
Principal’s Time Use
502 American Journal of Education
FIG. 2
Results
What Principals Do
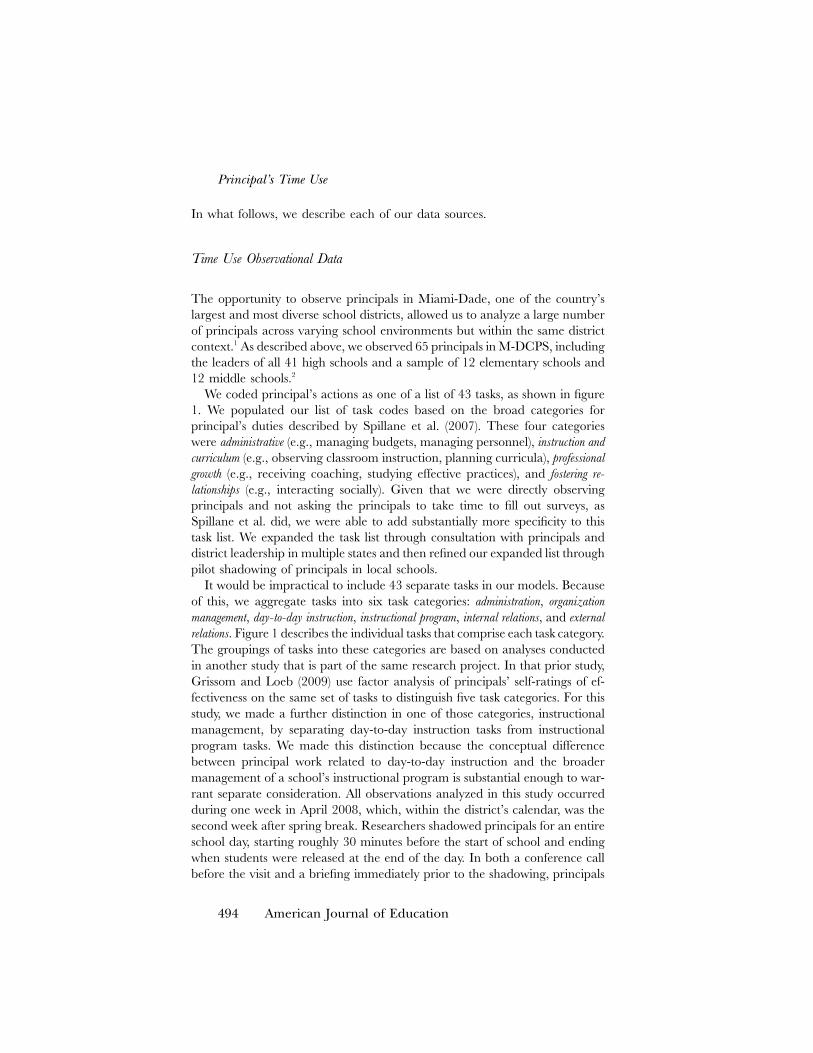
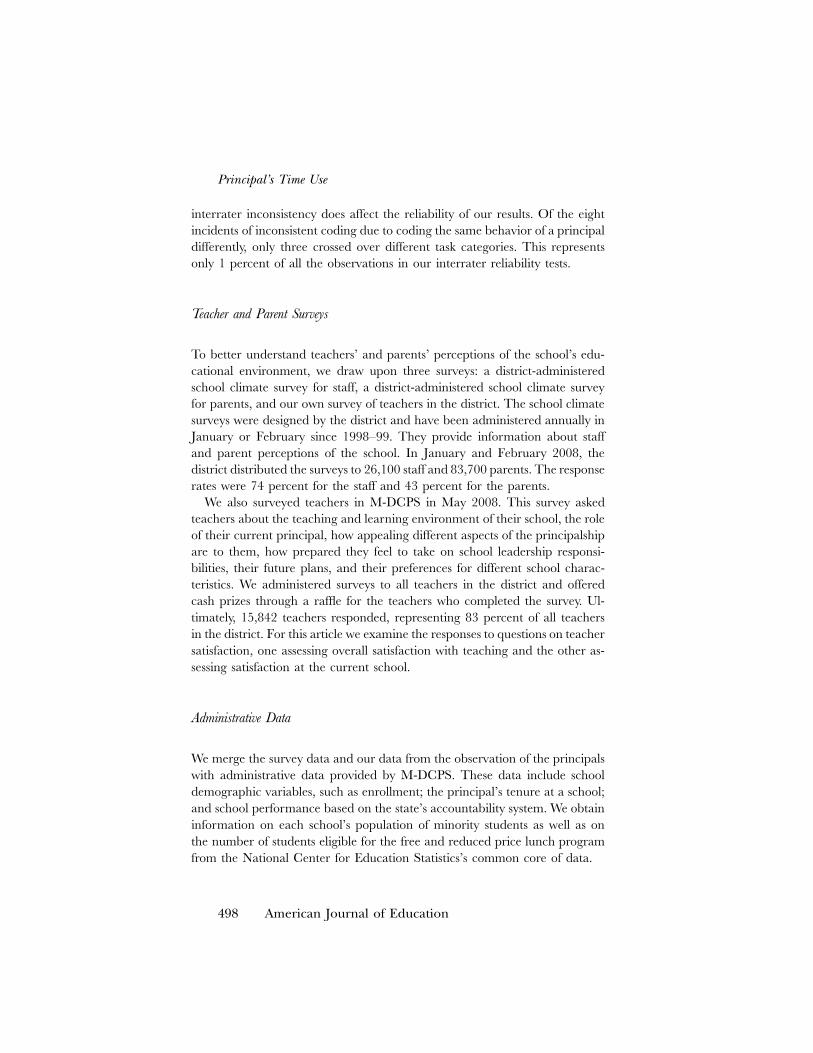
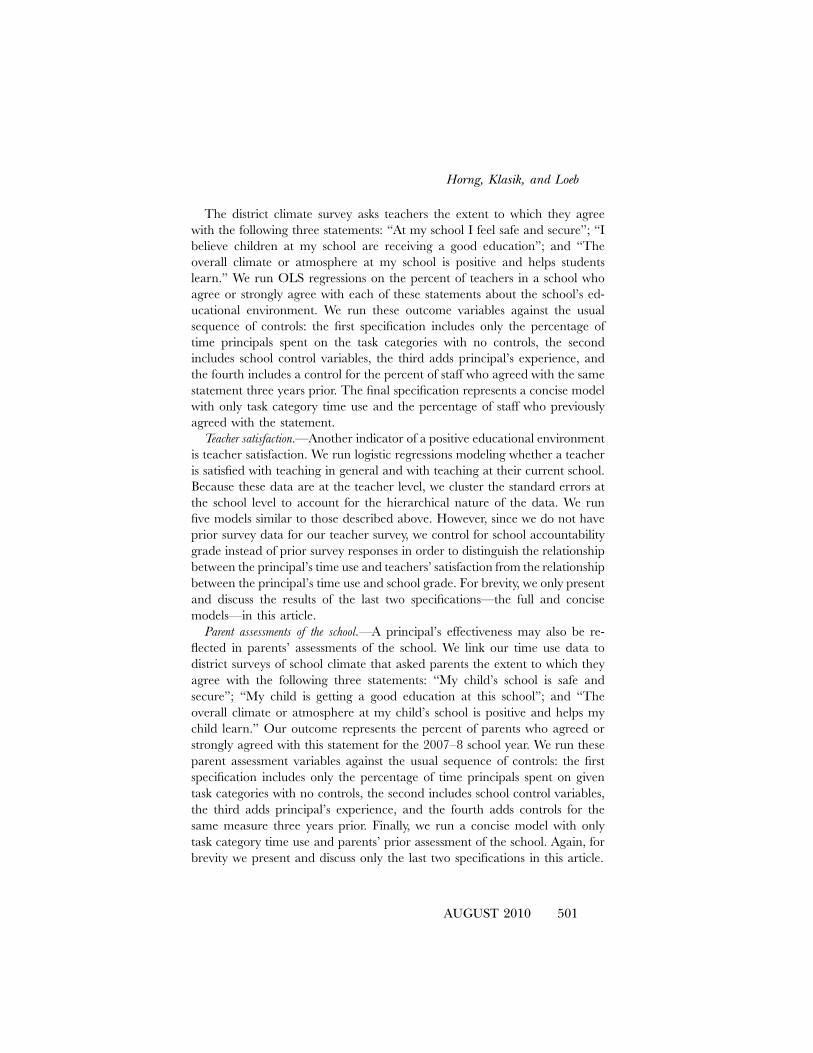
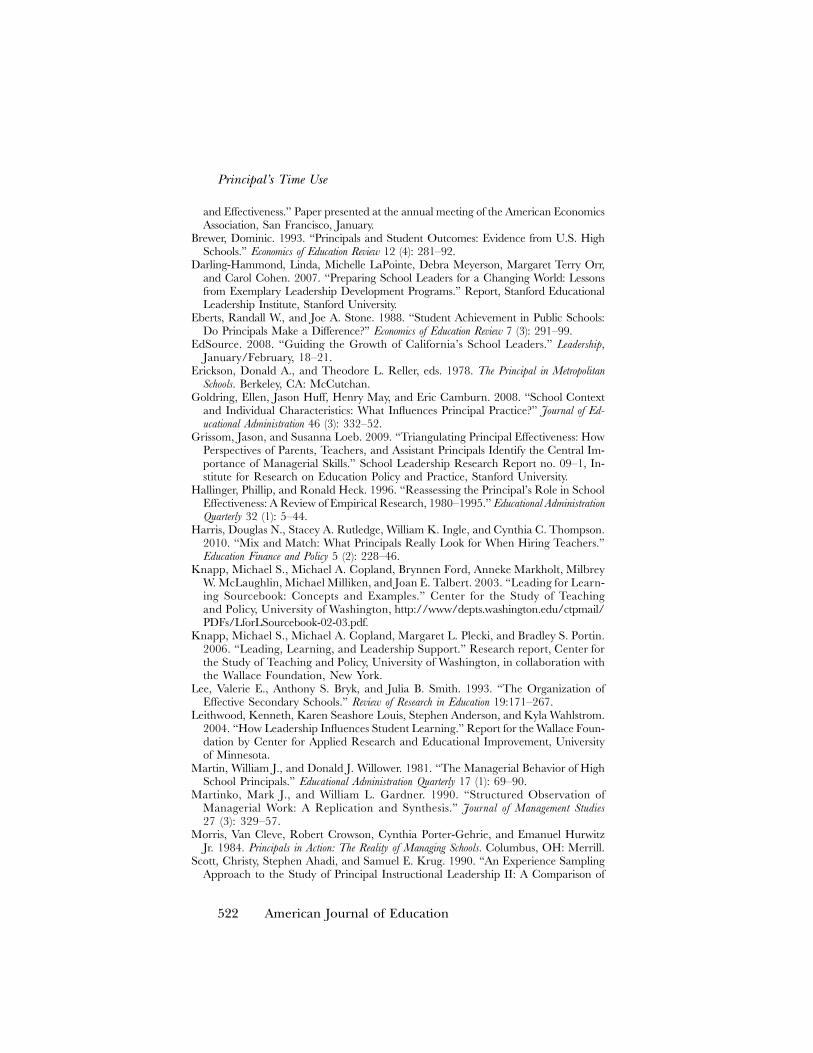
Our analyses begin with a description of how principals spend their timeduring the school day. Figure 2 describes the distribution of principals’ timeacross the six task categories, as the average percent of the school day principalsdevoted to the given category. On average, principals spent the most time onadministration activities to keep the school running smoothly, such as man-aging student discipline and fulfilling compliance requirements, accountingfor about 30 percent of the school day. They spent just over a fifth of the dayon organization management tasks, such as managing budgets and staff andhiring personnel. On average, they spent 15 percent of their time on theinternal relations tasks, such as developing relationships with students andinteracting socially with staff, and 5 percent on the external relations tasks,such as fundraising. Principals appear to devote the least total amount of timeto instruction-related activities, including day-to-day instruction tasks (6 per-cent) and more general instructional program responsibilities (7 percent). Day-to-day instruction includes activities such as conducting classroom visits andinformally coaching teachers, while instructional program includes activitiessuch as evaluating the curriculum and planning professional development.Close to a fifth of all observations did not fit well into any of these six broad
Horng, Klasik, and Loeb
AUGUST 2010 503
task categories. These observations included the principal taking “personaltime” (e.g., eating lunch, using the restroom), interacting with the researcher,or in transition between activities.
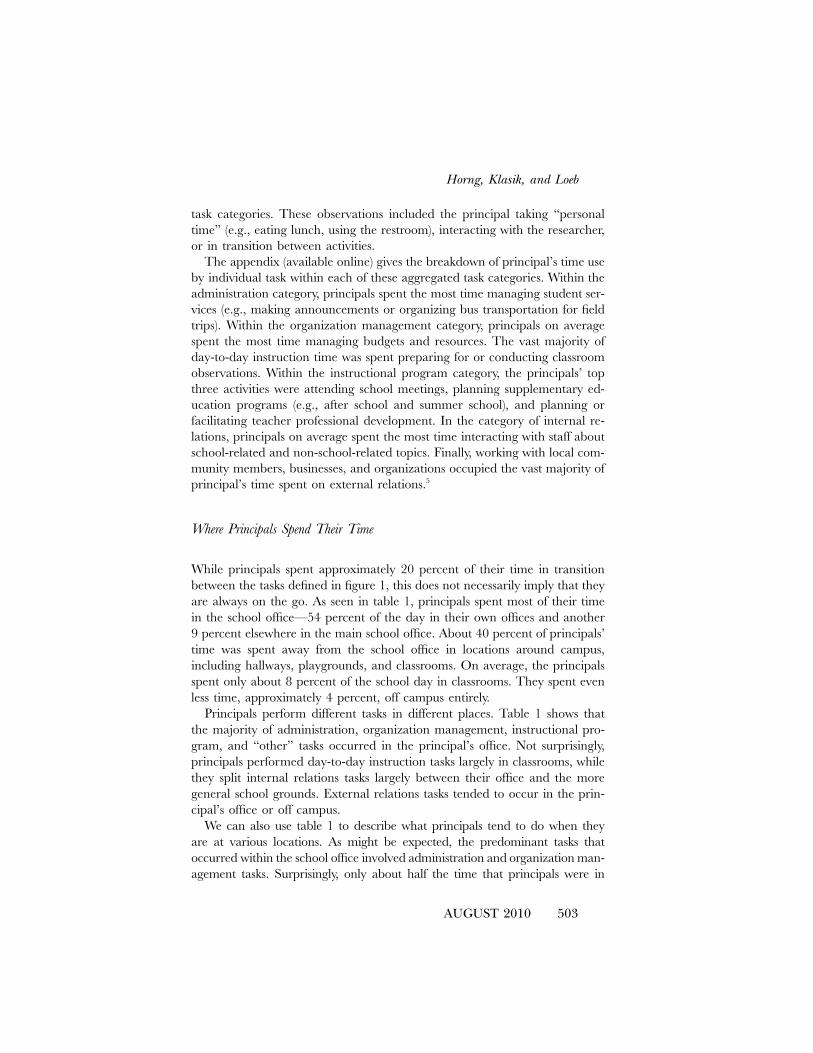
The appendix (available online) gives the breakdown of principal’s time useby individual task within each of these aggregated task categories. Within theadministration category, principals spent the most time managing student ser-vices (e.g., making announcements or organizing bus transportation for fieldtrips). Within the organization management category, principals on averagespent the most time managing budgets and resources. The vast majority ofday-to-day instruction time was spent preparing for or conducting classroomobservations. Within the instructional program category, the principals’ topthree activities were attending school meetings, planning supplementary ed-ucation programs (e.g., after school and summer school), and planning orfacilitating teacher professional development. In the category of internal re-lations, principals on average spent the most time interacting with staff aboutschool-related and non-school-related topics. Finally, working with local com-munity members, businesses, and organizations occupied the vast majority ofprincipal’s time spent on external relations.5
Where Principals Spend Their Time
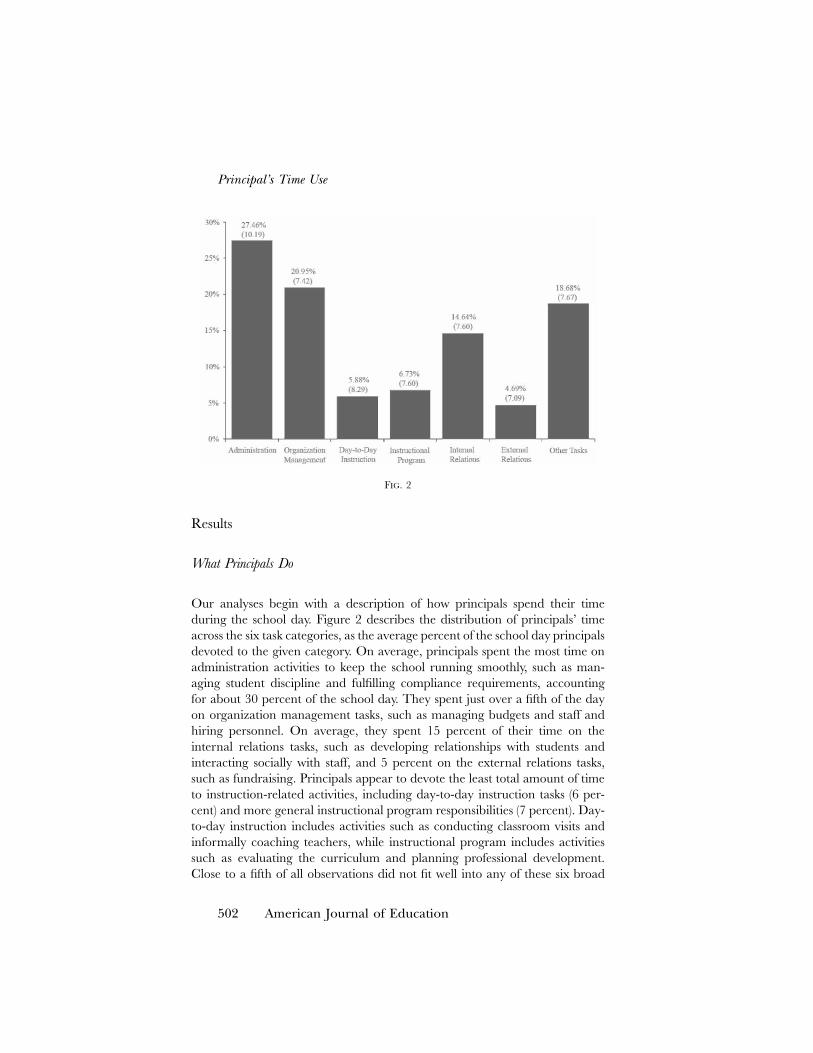
While principals spent approximately 20 percent of their time in transitionbetween the tasks defined in figure 1, this does not necessarily imply that theyare always on the go. As seen in table 1, principals spent most of their timein the school office—54 percent of the day in their own offices and another9 percent elsewhere in the main school office. About 40 percent of principals’time was spent away from the school office in locations around campus,including hallways, playgrounds, and classrooms. On average, the principalsspent only about 8 percent of the school day in classrooms. They spent evenless time, approximately 4 percent, off campus entirely.
Principals perform different tasks in different places. Table 1 shows thatthe majority of administration, organization management, instructional pro-gram, and “other” tasks occurred in the principal’s office. Not surprisingly,principals performed day-to-day instruction tasks largely in classrooms, whilethey split internal relations tasks largely between their office and the moregeneral school grounds. External relations tasks tended to occur in the prin-cipal’s office or off campus.
We can also use table 1 to describe what principals tend to do when theyare at various locations. As might be expected, the predominant tasks thatoccurred within the school office involved administration and organization man-agement tasks. Surprisingly, only about half the time that principals were in
Principal’s Time Use
504 American Journal of Education
TABLE 1
Principal’s Time Use by Location (%)
Principal’sOffice
MainOffice Classroom
SchoolGrounds
OffCampus Total
Administration 53.5 11.8 2.8 30.7 1.3 100.028.7 36.2 10.1 36.1 8.4 28.8
Organizationmanagement 65.0 8.1 3.9 21.7 1.4 100.0
25.7 18.2 10.5 18.8 6.5 21.3Day-to-day
instruction 14.3 2.9 71.9 11.0 .0 100.01.6 1.8 54.5 2.7 .0 6.0
Instructionalprogram 74.5 6.5 12.2 6.9 .0 100.0
9.8 4.9 10.8 2.0 .0 7.1Internal relations 43.0 12.3 6.0 34.9 3.8 100.0
12.2 19.8 11.6 21.6 12.9 15.2External relations 53.2 5.8 .0 6.9 34.1 100.0
4.9 3.0 .0 1.4 38.1 5.0Other 55.0 9.1 1.2 25.7 9.1 100.0
17.1 16.1 2.5 17.5 34.2 16.7Total 53.7 9.4 7.9 24.5 4.4 100.0
100.0 100.0 100.0 100.0 100.0 100.0
NOTE.—The top number is the row percentage, and the bottom number is the columnpercentage.
classrooms was dedicated to day-to-day instruction tasks, such as observing orcoaching teachers. The other half was divided nearly evenly among adminis-tration, organization management, instructional program, and internal relationstasks. No other location demonstrates such diversity of tasks, suggesting thatprincipals are most likely to multitask while visiting classrooms. During thequarter of their day when principals were not in the school office or classrooms,they tended to engage in administration tasks—such as dealing with studentdiscipline issues—and internal relations tasks, primarily building relationshipswith students. In the rare cases (on average, 4 percent of the time) that principalsleft campus, their time was most frequently spent on external relations tasks,such as working with community members and the school district to obtainresources for the school and attending off-campus meetings.6
Differences in Principal’s Time Use across Schools and Principals
Principals may behave differently in different school contexts. Moreover, schoolswith certain characteristics may be able to attract principals who engage in
Horng, Klasik, and Loeb
AUGUST 2010 505
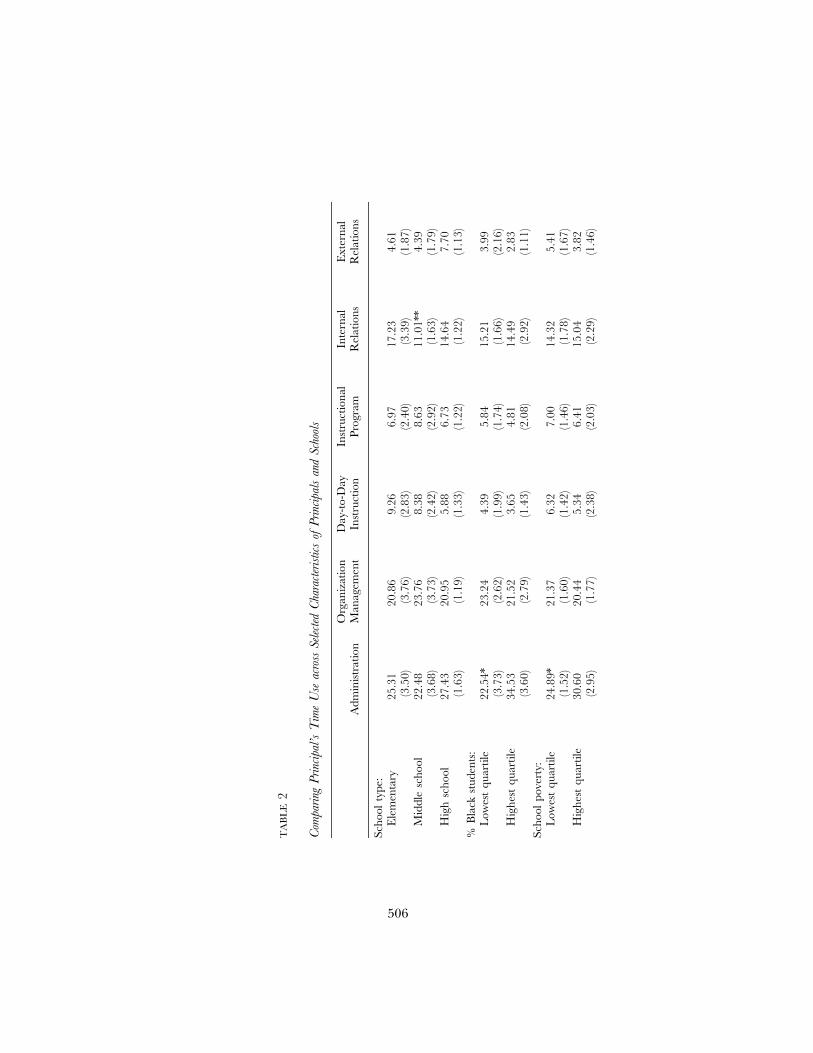
certain activities more than others, particularly if those activities are related toperceptions of the principal’s effectiveness. Consequently, we may see systematicdifferences in the actions of principals among schools. Similarly, principals maychange their profile of actions as they gain more experience or their choice ofactions may differ based on their personal background characteristics. For thisanalysis, we compare schools by school level (i.e., elementary, middle, or highschool), proportion of students eligible for the free and reduced price lunchprogram, and proportion of students who are black. We also compare principalsby gender and experience.
Table 2 demonstrates that, on average, principals of elementary, middle,and high schools spent their days similarly distributed among the six aggregatetask categories. Few of the differences across the school levels are statisticallysignificant, though our sample size is quite small for detecting significant effects.Table 2 also describes differences in principal’s actions by school poverty leveland the proportion of minority students. We use free and reduced price lunchprogram eligibility as a proxy for student poverty and categorize schools byquartile, comparing the 25 percent of high schools with the highest concen-tration of students in poverty with the 25 percent of high schools with thelowest concentration in the district. We similarly compare schools in the topand bottom quartile of all high schools in the district by percentage of blackstudents. Generally, the activities of principals appear similar across thesegroups, and the differences are not significant at the 5 or 10 percent levels.The one exception is that principals in schools with a high percentage of blackstudents and principals in high-poverty schools spent marginally significantlymore of their day on administration tasks than their counterparts in low-minority and low-poverty schools. These differences might reflect differencesin school needs as the administration category captures many of the studentdiscipline–related tasks that a principal performs.
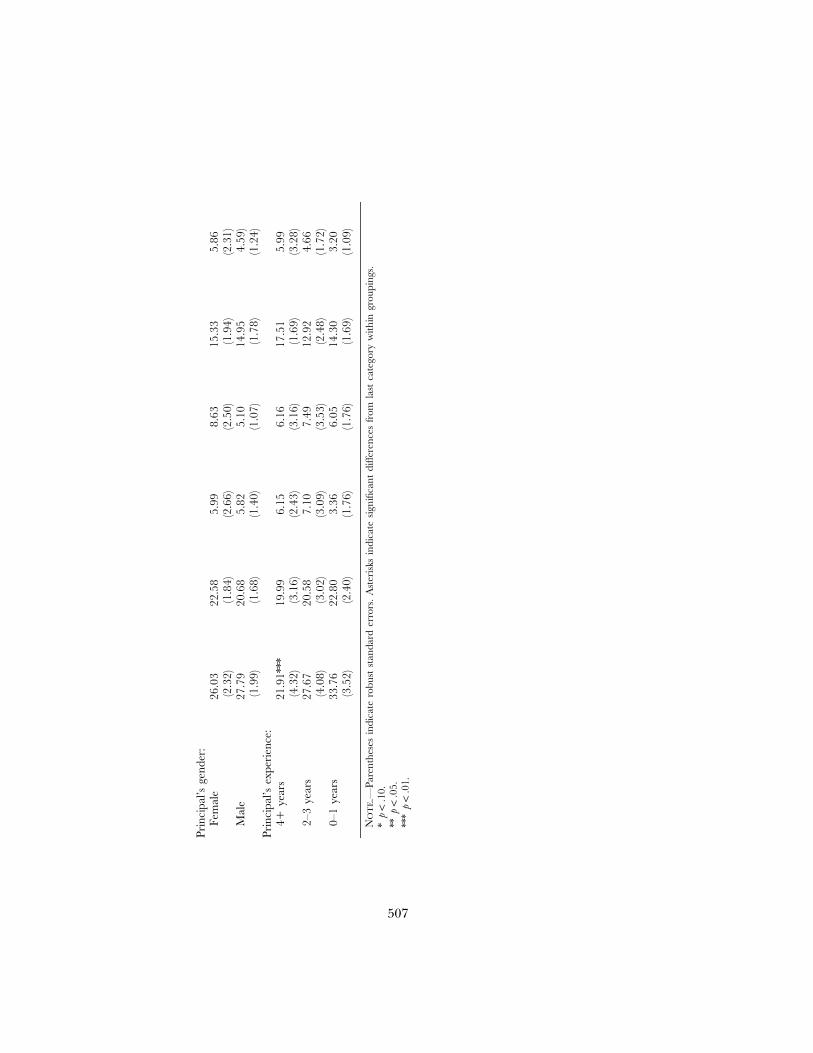
Finally, table 2 shows time use by principal’s gender and experience. Ofthe high school principals we observed, roughly 45 percent were female. Wesee no notable differences in actions performed based on the principal’s gender.Differences based on the number of years a principal had worked at theircurrent school are small as well. The one notable exception to this is that theamount of time that principals spent on administration tasks is substantiallylower among principals with at least two years of experience at their currentschool. New principals spent about 34 percent of their time on administrationtasks. However, principals who had been leading their schools for at least fouryears spent only 22 percent of their day on these tasks. No other task categoryshows significant changes with principal’s experience at their current school.Overall, we find relatively little systematic variation in principal’s time use bymeasured characteristics of schools or principals.
506
TA
BL
E2
Com
pari
ngP
rinc
ipal
’sT
ime
Use
acro
ssSe
lect
edC
hara
cter
istic
sof
Pri
ncip
als
and
Scho
ols
Adm
inis
trat
ion
Org
aniz
atio
nM
anag
emen
tD
ay-t
o-D
ayIn
stru
ctio
nIn
stru
ctio
nal
Prog
ram
Inte
rnal
Rel
atio
nsE
xter
nal
Rel
atio
ns
Scho
olty
pe:
Ele
men
tary
25.3
120
.86
9.26
6.97
17.2
34.
61(3
.50)
(3.7
6)(2
.83)
(2.4
0)(3
.39)
(1.8
7)M
iddl
esc
hool
22.4
823
.76
8.38
8.63
11.0
1**
4.39
(3.6
8)(3
.73)
(2.4
2)(2
.92)
(1.6
3)(1
.79)
Hig
hsc
hool
27.4
320
.95
5.88
6.73
14.6
47.
70(1
.63)
(1.1
9)(1
.33)
(1.2
2)(1
.22)
(1.1
3)%
Bla
ckst
uden
ts:
Low
est
quar
tile
22.5
4*23
.24
4.39
5.84
15.2
13.
99(3
.73)
(2.6
2)(1
.99)
(1.7
4)(1
.66)
(2.1
6)H
ighe
stqu
artil
e34
.53
21.5
23.
654.
8114
.49
2.83
(3.6
0)(2
.79)
(1.4
3)(2
.08)
(2.9
2)(1
.11)
Scho
olpo
vert
y:L
owes
tqu
artil
e24
.89*
21.3
76.
327.
0014
.32
5.41
(1.5
2)(1
.60)
(1.4
2)(1
.46)
(1.7
8)(1
.67)
Hig
hest
quar
tile
30.6
020
.44
5.34
6.41
15.0
43.
82(2
.95)
(1.7
7)(2
.38)
(2.0
3)(2
.29)
(1.4
6)
507
Prin
cipa
l’sge
nder
:Fe
mal
e26
.03
22.5
85.
998.
6315
.33
5.86
(2.3
2)(1
.84)
(2.6
6)(2
.50)
(1.9
4)(2
.31)
Mal
e27
.79
20.6
85.
825.
1014
.95
4.59
)(1
.99)
(1.6
8)(1
.40)
(1.0
7)(1
.78)
(1.2
4)Pr
inci
pal’s
expe
rien
ce:
4�ye
ars
21.9
1***
19.9
96.
156.
1617
.51
5.99
(4.3
2)(3
.16)
(2.4
3)(3
.16)
(1.6
9)(3
.28)
2–3
year
s27
.67
20.5
87.
107.
4912
.92
4.66
(4.0
8)(3
.02)
(3.0
9)(3
.53)
(2.4
8)(1
.72)
0–1
year
s33
.76
22.8
03.
366.
0514
.30
3.20
(3.5
2)(2
.40)
(1.7
6)(1
.76)
(1.6
9)(1
.09)
NO
TE.—
Pare
nthe
ses
indi
cate
robu
stst
anda
rder
rors
.A
ster
isks
indi
cate
sign
ifica
ntdi
ffere
nces
from
last
cate
gory
with
ingr
oupi
ngs.
*p
!.1
0.**
p!
.05.
***
p!
.01.
Principal’s Time Use
508 American Journal of Education
FIG. 3. Principal’s time use by school accountability grade
Principal’s Time Use and Measures of School Effectiveness
Ultimately, we would like to know how principal’s time use affects schooloutcomes, that is, what makes some principals more effective than others. Asingle measure of school success is likely to be limited. For example, gains instudent test scores may reflect the actions of the school leadership, but thesechanges may take time to manifest and also may be difficult to measure if,for example, student mobility is high. As a result, it is worth comparingprincipal’s actions to a range of school outcomes while controlling for otherschool characteristics. In our analysis, we use four types of school effectivenessmeasures: student achievement on state standardized tests, teachers’ assess-ments of the school, teacher satisfaction, and parents’ assessments of the school.
Principal’s Time Use and Student Performance
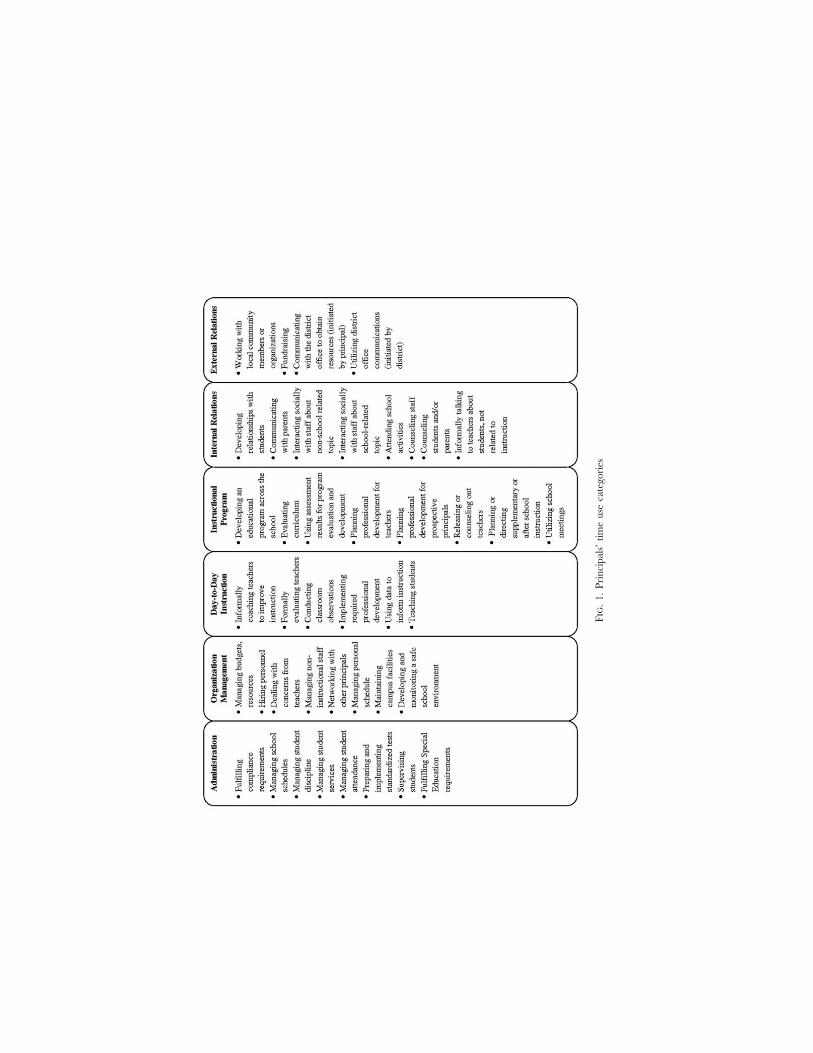
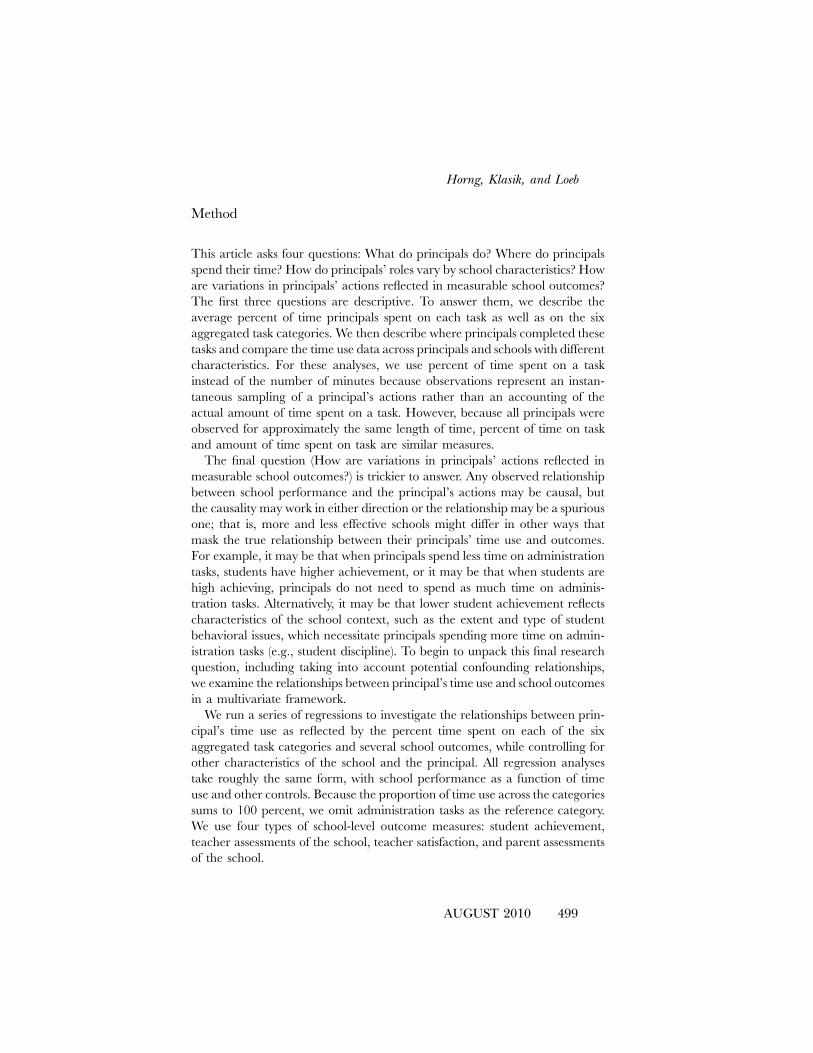
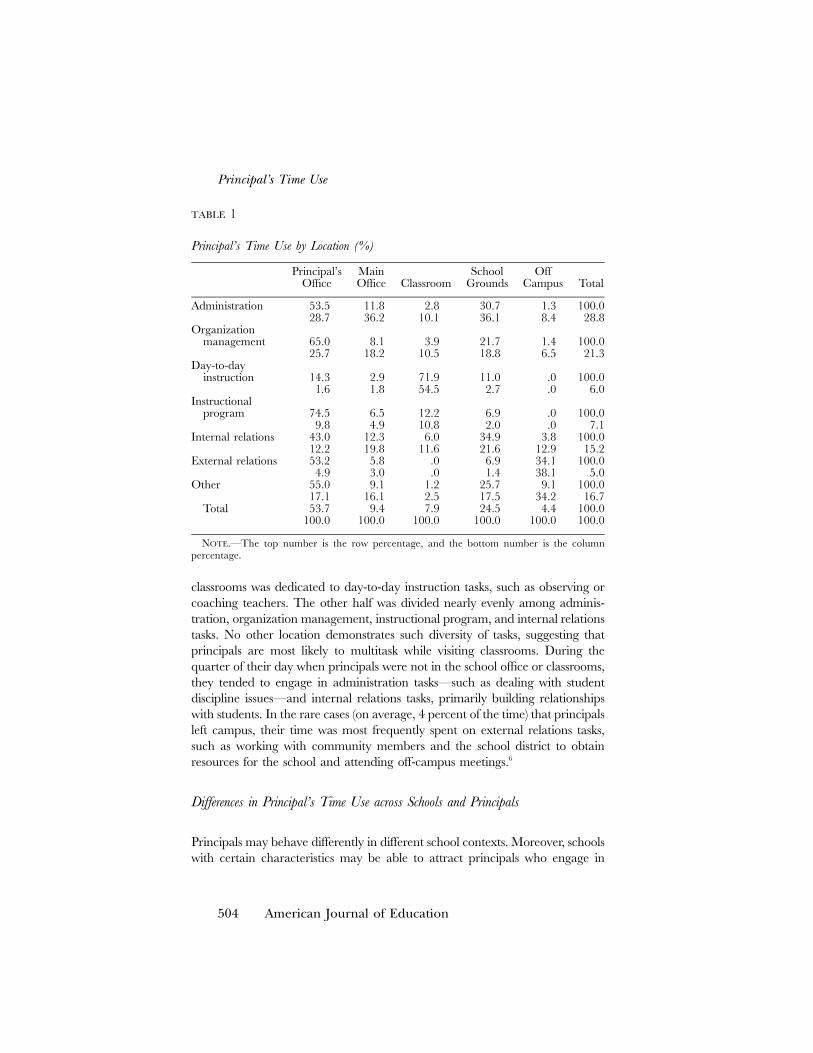
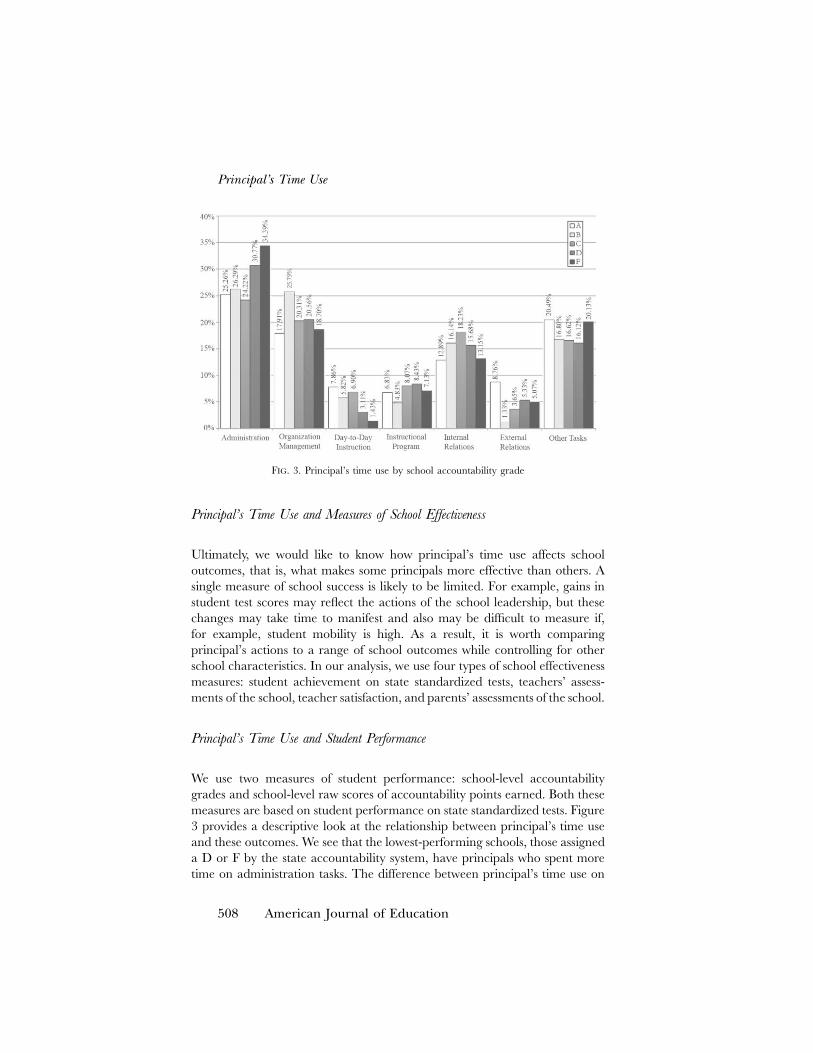
We use two measures of student performance: school-level accountabilitygrades and school-level raw scores of accountability points earned. Both thesemeasures are based on student performance on state standardized tests. Figure3 provides a descriptive look at the relationship between principal’s time useand these outcomes. We see that the lowest-performing schools, those assigneda D or F by the state accountability system, have principals who spent moretime on administration tasks. The difference between principal’s time use on
Horng, Klasik, and Loeb
AUGUST 2010 509
administration tasks at A and F schools is significant at the 1 percent level.We see the opposite trend with respect to time spent on day-to-day instructiontasks. That is, principals in schools with higher accountability grades spentmore time on day-to-day instruction tasks than those in schools with lowergrades. This difference is significant at the level. Interestingly, we dop ! .05not see the same trend in time spent on broader instructional program tasks—the frequency with which principals engage in these tasks remains fairly con-sistent across schools by accountability grade. Principals in A and F schoolslook similar in terms of their time spent on internal relations, though bothtypes of schools engage in these activities less than schools that had receiveda grade of C. We also find that external relations activities occur almost entirelyat A schools.
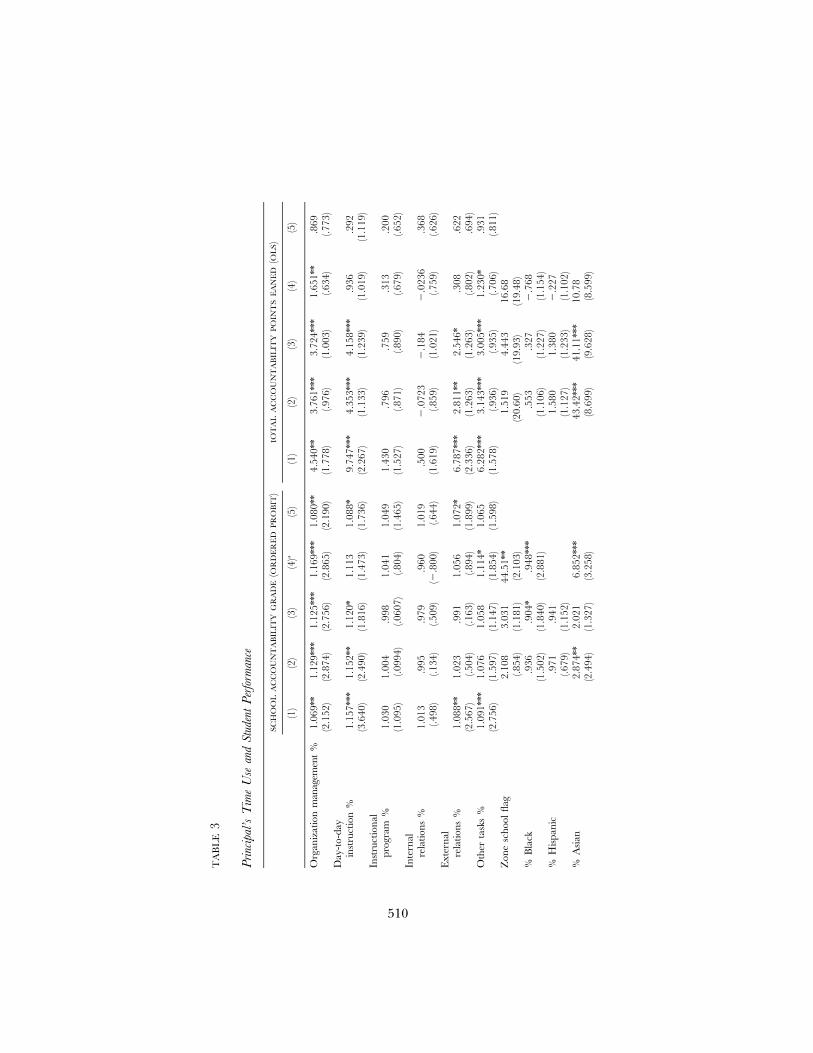
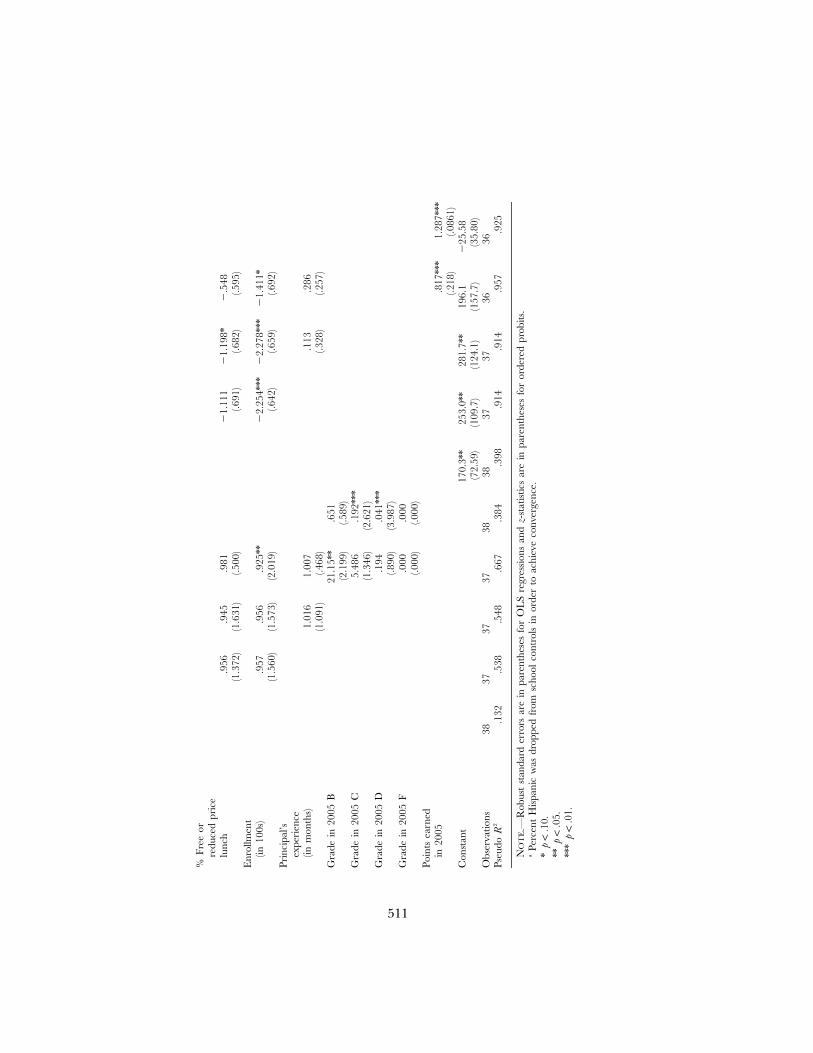
Table 3 presents the regression analyses using our two measures of schooleffectiveness based on student achievement. The first set of columns presentthe results of the five specifications of the order probit regressions with schoolgrade in 2007–8 as the outcome. The second set of columns present the resultsof the five specifications of the OLS regressions with total accountability pointsearned in 2007–8 as the outcome. In both sets of analyses, student performancegains are modeled by including a control for prior student achievement inthe fourth and fifth specifications.
The results of the ordered probit and OLS regressions are very similar. Inthe simple models only considering principal’s time use (specification 1), timespent on organization management, day-to-day instruction, external relations,and “other” tasks (relative to the omitted time spent on administration tasks)are significantly related to student performance in the same school year. Thatis, principals at higher-performing schools spent more time on organizationmanagement, day-to-day instruction, external relations, and “other” tasks. Aspreviously discussed, this relationship may be a spurious one. For example,principals at higher-performing schools may have more time to spend on thesetasks relative to administration tasks because they have fewer student behaviorissues or because they are more efficient at completing administration tasksdue to greater leadership experience. To detect such spurious relationships,we include multiple controls in the models. When controls for school char-acteristics and principal’s experience are added (specifications 2 and 3), timespent on external relations and “other” tasks remain significant in the OLSregression models but not the ordered probit models. Only time spent onorganization management and day-to-day instruction tasks consistently remainsignificant. However, the causal direction between principal’s time use andstudent performance is still not clear—students could have higher achievementwhen their principals spend more time on day-to-day instruction and organ-ization management tasks (relative to administration tasks) or principals athigh-performing schools could simply have more time to dedicate to these
510
TA
BL
E3
Pri
ncip
al’s
Tim
eU
sean
dSt
uden
tP
erfo
rman
ce
SCH
OO
LA
CC
OU
NT
AB
ILIT
YG
RA
DE
(OR
DE
RE
DP
RO
BIT
)tO
TA
LA
CC
OU
NT
AB
ILIT
YP
OIN
TS
EA
NE
D(O
LS)
(1)
(2)
(3)
(4)a
(5)
(1)
(2)
(3)
(4)
(5)
Org
aniz
atio
nm
anag
emen
t%
1.06
9**
1.12
9***
1.12
5***
1.16
9***
1.08
0**
4.54
0**
3.76
1***
3.72
4***
1.65
1**
.869
(2.1
52)
(2.8
74)
(2.7
56)
(2.8
65)
(2.1
90)
(1.7
78)
(.976
)(1
.003
)(.6
34)
(.773
)D
ay-t
o-da
yin
stru
ctio
n%
1.15
7***
1.15
2**
1.12
0*1.
113
1.08
8*9.
747*
**4.
353*
**4.
158*
**.9
36.2
92(3
.640
)(2
.490
)(1
.816
)(1
.473
)(1
.736
)(2
.267
)(1
.133
)(1
.239
)(1
.019
)(1
.119
)In
stru
ctio
nal
prog
ram
%1.
030
1.00
4.9
981.
041
1.04
91.
430
.796
.759
.313
.200
(1.0
95)
(.099
4)(.0
607)
(.804
)(1
.465
)(1
.527
)(.8
71)
(.890
)(.6
79)
(.652
)In
tern
alre
latio
ns%
1.01
3.9
95.9
79.9
601.
019
.500
�.0
723
�.1
84�
.023
6.3
68(.4
98)
(.134
)(.5
09)
(�.8
00)
(.644
)(1
.619
)(.8
59)
(1.0
21)
(.759
)(.6
26)
Ext
erna
lre
latio
ns%
1.08
8**
1.02
3.9
911.
056
1.07
2*6.
787*
**2.
811*
*2.
546*
.308
.622
(2.5
67)
(.504
)(.1
63)
(.894
)(1
.899
)(2
.336
)(1
.263
)(1
.263
)(.8
02)
.694
)O
ther
task
s%
1.09
1***
1.07
61.
058
1.11
4*1.
065
6.28
2***
3.14
3***
3.00
5***
1.23
0*.9
31(2
.756
)(1
.597
)(1
.147
)(1
.854
)(1
.598
)(1
.578
)(.9
36)
(.935
)(.7
06)
(.811
)Z
one
scho
olfla
g2.
108
3.03
144
.51*
*1.
519
4.44
316
.68
(.854
)(1
.181
)(2
.103
)(2
0.60
)(1
9.93
)(1
9.48
)%
Bla
ck.9
36.9
04*
.948
***
.553
.327
�.7
68(1
.502
)(1
.840
)(2
.881
)(1
.106
)(1
.227
)(1
.154
)%
His
pani
c.9
71.9
411.
580
1.38
0�
.227
(.679
)(1
.152
)(1
.127
)(1
.233
)(1
.102
)%
Asi
an2.
874*
*2.
021
6.85
2***
43.4
2***
41.1
1***
10.7
8(2
.494
)(1
.327
)(3
.258
)(8
.699
)(9
.628
)(8
.599
)
511
%Fr
eeor
redu
ced
pric
elu
nch
.956
.945
.981
�1.
111
�1.
198*
�.5
48(1
.372
)(1
.631
)(.5
00)
(.691
)(.6
82)
(.595
)E
nrol
lmen
t(in
100s
).9
57.9
56.9
25**
�2.
254*
**�
2.27
8***
�1.
411*
(1.5
60)
(1.5
73)
(2.0
19)
(.642
)(.6
59)
(.692
)Pr
inci
pal’s
expe
rien
ce(in
mon
ths)
1.01
61.
007
.113
.286
(1.0
91)
(.468
)(.3
28)
(.257
)G
rade
in20
05B
21.1
5**
.651
(2.1
99)
(.589
)G
rade
in20
05C
5.48
6.1
92**
*(1
.346
)(2
.621
)G
rade
in20
05D
.194
.041
***
(.890
)(3
.987
)G
rade
in20
05F
.000
.000
(.000
)(.0
00)
Poin
tsea
rned
in20
05.8
17**
*1.
287*
**(.2
18)
(.086
1)C
onst
ant
170.
3**
253.
0**
281.
7**
196.
1�
25.5
8(7
2.59
)(1
09.7
)(1
24.1
)(1
57.7
)(3
5.80
)O
bser
vatio
ns38
3737
3738
3837
3736
36Ps
eudo
2R
.132
.538
.548
.667
.384
.398
.914
.914
.957
.925
NO
TE.—
Rob
ust
stan
dard
erro
rsar
ein
pare
nthe
ses
for
OL
Sre
gres
sion
san
dz-
stat
istic
sar
ein
pare
nthe
ses
for
orde
red
prob
its.
aPe
rcen
tH
ispa
nic
was
drop
ped
from
scho
olco
ntro
lsin
orde
rto
achi
eve
conv
erge
nce.
*p
!.1
0.**
p!
.05.
***
p!
.01.
Principal’s Time Use
512 American Journal of Education
tasks. To investigate the possible direction of causality, we model student per-formance gains instead of levels by including controls for prior student achieve-ment (specification 4). While we still cannot definitively demonstrate causality,this allows us to explore whether principal’s time use is associated with changesin student achievement over time. In both the ordered probit and OLS re-gression full models, which include controls for prior student performance,only time spent on organization management tasks remains significant.
Because our sample size may not be adequate for models with so manycontrol variables, we also run concise models (specification 5), which includecontrols for prior student performance but remove controls for school char-acteristics and principal’s experience. In these concise models, time spent onday-to-day instruction tasks is only marginally associated with improvementin school grades and not significantly related to changes in the total numberof accountability points a school earned. In other words, principal’s time spenton day-to-day instruction tasks is a significant and positive predictor of studentperformance until we control for past performance. This suggests that, whiletime spent on day-to-day instruction tasks is associated with high-performingschools, it is not necessarily associated with improving schools. In contrast,time spent on organization management activities has a significant and positiverelationship with both types of student performance outcomes—school gradeand total number of accountability points—even when controls for prior schoolperformance are added, suggesting that principal’s time spent on organizationmanagement tasks is positively associated with both student performance andgains in student performance.
Principal’s Time Use and Teacher Assessments of the School
Principals might affect student outcomes by influencing the school teachingand learning environment. One way to measure the educational environmentis through teachers’ perceptions as reported on a survey. Table 4 presents theresults of our OLS regression analyses of the following three items from thedistrict school climate survey: “At my school I feel safe and secure”; “I believechildren at my school are receiving a good education”; and “The overallclimate or atmosphere at my school is positive and helps students learn.” Theoutcome is the percent of teachers in the school who agreed with the statement.We present the results for the full and concise model specifications for eachof these items.
Principal’s time spent on organization management (relative to adminis-tration) tasks is significantly and positively associated with the teachers’ as-sessment of the school educational environment in almost all models. To alesser extent, the proportions of time spent on instructional program and
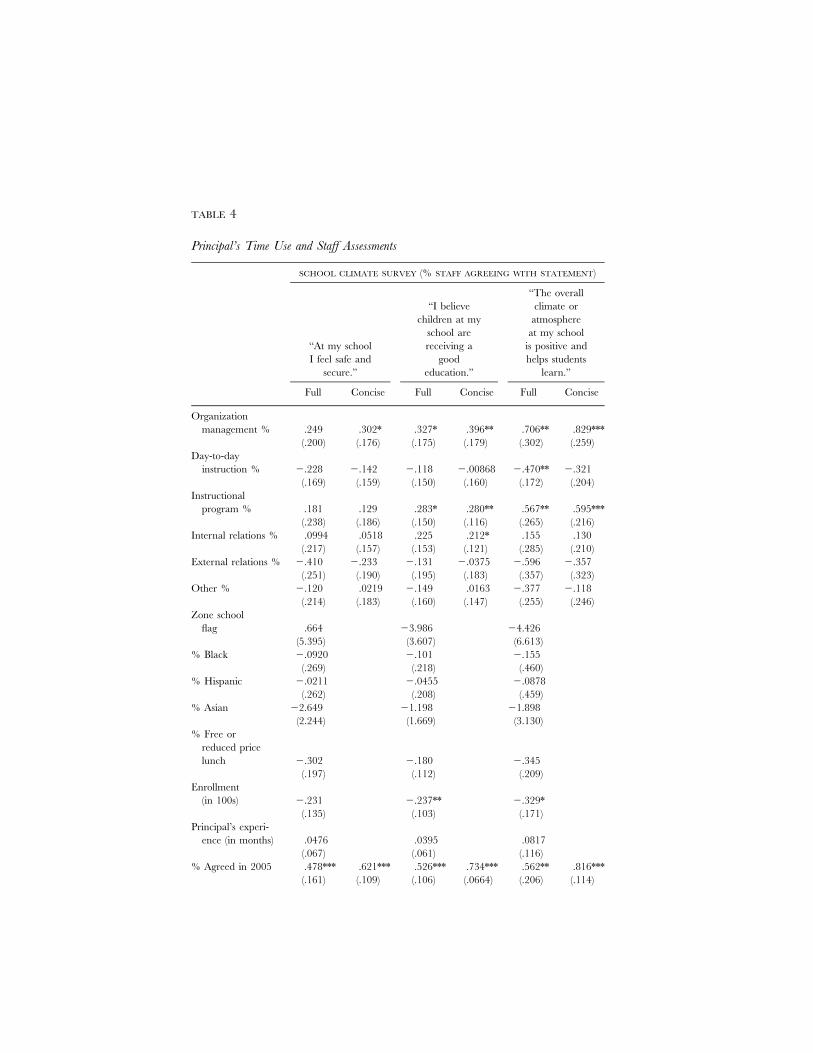
TABLE 4
Principal’s Time Use and Staff Assessments
SCHOOL CLIMATE SURVEY (% STAFF AGREEING WITH STATEMENT)
“At my schoolI feel safe and
secure.”
“I believechildren at my
school arereceiving a
goodeducation.”
“The overallclimate or
atmosphereat my school
is positive andhelps students
learn.”
Full Concise Full Concise Full Concise
Organizationmanagement % .249 .302* .327* .396** .706** .829***
(.200) (.176) (.175) (.179) (.302) (.259)Day-to-day
instruction % �.228 �.142 �.118 �.00868 �.470** �.321(.169) (.159) (.150) (.160) (.172) (.204)
Instructionalprogram % .181 .129 .283* .280** .567** .595***
(.238) (.186) (.150) (.116) (.265) (.216)Internal relations % .0994 .0518 .225 .212* .155 .130
(.217) (.157) (.153) (.121) (.285) (.210)External relations % �.410 �.233 �.131 �.0375 �.596 �.357
(.251) (.190) (.195) (.183) (.357) (.323)Other % �.120 .0219 �.149 .0163 �.377 �.118
(.214) (.183) (.160) (.147) (.255) (.246)Zone school
flag .664 �3.986 �4.426(5.395) (3.607) (6.613)
% Black �.0920 �.101 �.155(.269) (.218) (.460)
% Hispanic �.0211 �.0455 �.0878(.262) (.208) (.459)
% Asian �2.649 �1.198 �1.898(2.244) (1.669) (3.130)
% Free orreduced pricelunch �.302 �.180 �.345
(.197) (.112) (.209)Enrollment
(in 100s) �.231 �.237** �.329*(.135) (.103) (.171)
Principal’s experi-ence (in months) .0476 .0395 .0817
(.067) (.061) (.116)% Agreed in 2005 .478*** .621*** .526*** .734*** .562** .816***
(.161) (.109) (.106) (.0664) (.206) (.114)
Principal’s Time Use
514 American Journal of Education
TABLE 4 (Continued )
SCHOOL CLIMATE SURVEY (% STAFF AGREEING WITH STATEMENT)
“At my schoolI feel safe and
secure.”
“I believechildren at my
school arereceiving a
goodeducation.”
“The overallclimate or
atmosphereat my school
is positive andhelps students
learn.”
Full Concise Full Concise Full Concise
Constant 67.24** 24.70* 52.84** 9.005 59.55* �4.667(24.35) (12.20) (21.29) (7.082) (31.62) (13.36)
Observations 39 39 39 39 39 39Pseudo 2R .715 .657 .853 .797 .786 .710
NOTE.—Robust standard errors are in parentheses.* p ! .10.** p ! .05.*** p ! .01.
internal relations tasks are also significantly and positively associated withteachers’ agreement with the statements. In contrast, time spent on externalrelations tasks demonstrate no significant relationship with teachers’ assess-ments of the school climate. Day-to-day instruction tasks appear, if anything,to be negatively related to teachers’ perceptions, though this negative rela-tionship is only significant in one of the models.
Principal’s Time Use and Teacher Satisfaction
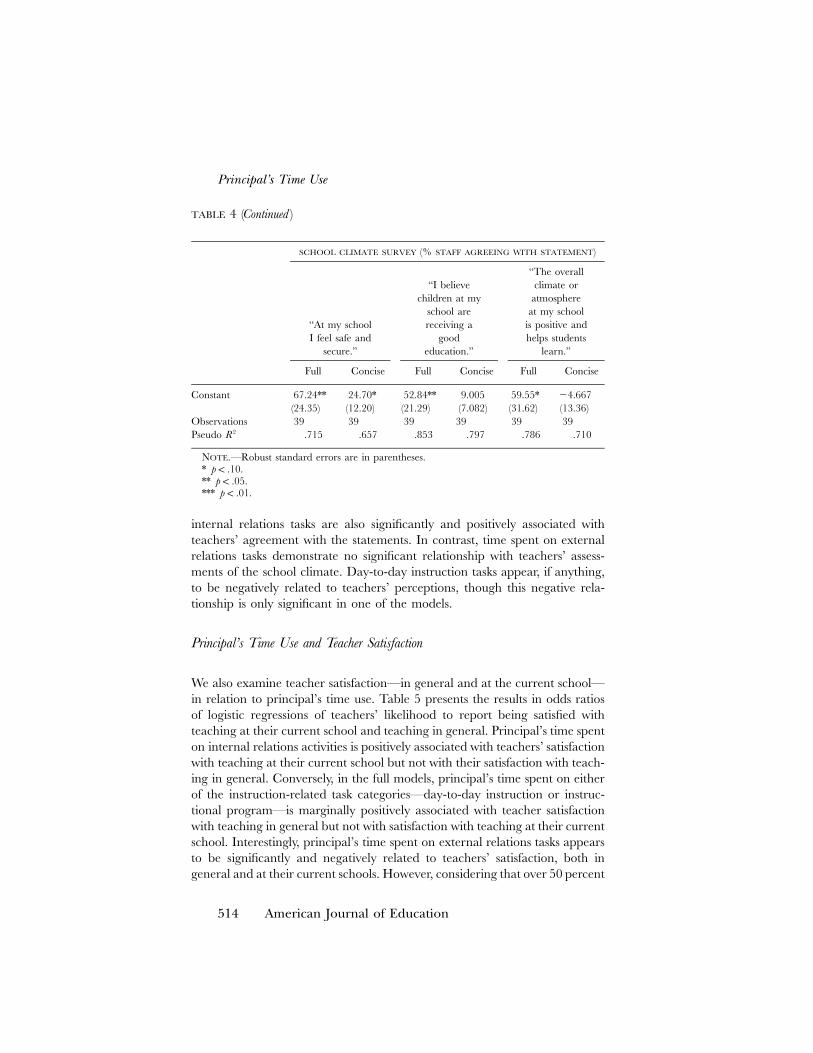
We also examine teacher satisfaction—in general and at the current school—in relation to principal’s time use. Table 5 presents the results in odds ratiosof logistic regressions of teachers’ likelihood to report being satisfied withteaching at their current school and teaching in general. Principal’s time spenton internal relations activities is positively associated with teachers’ satisfactionwith teaching at their current school but not with their satisfaction with teach-ing in general. Conversely, in the full models, principal’s time spent on eitherof the instruction-related task categories—day-to-day instruction or instruc-tional program—is marginally positively associated with teacher satisfactionwith teaching in general but not with satisfaction with teaching at their currentschool. Interestingly, principal’s time spent on external relations tasks appearsto be significantly and negatively related to teachers’ satisfaction, both ingeneral and at their current schools. However, considering that over 50 percent
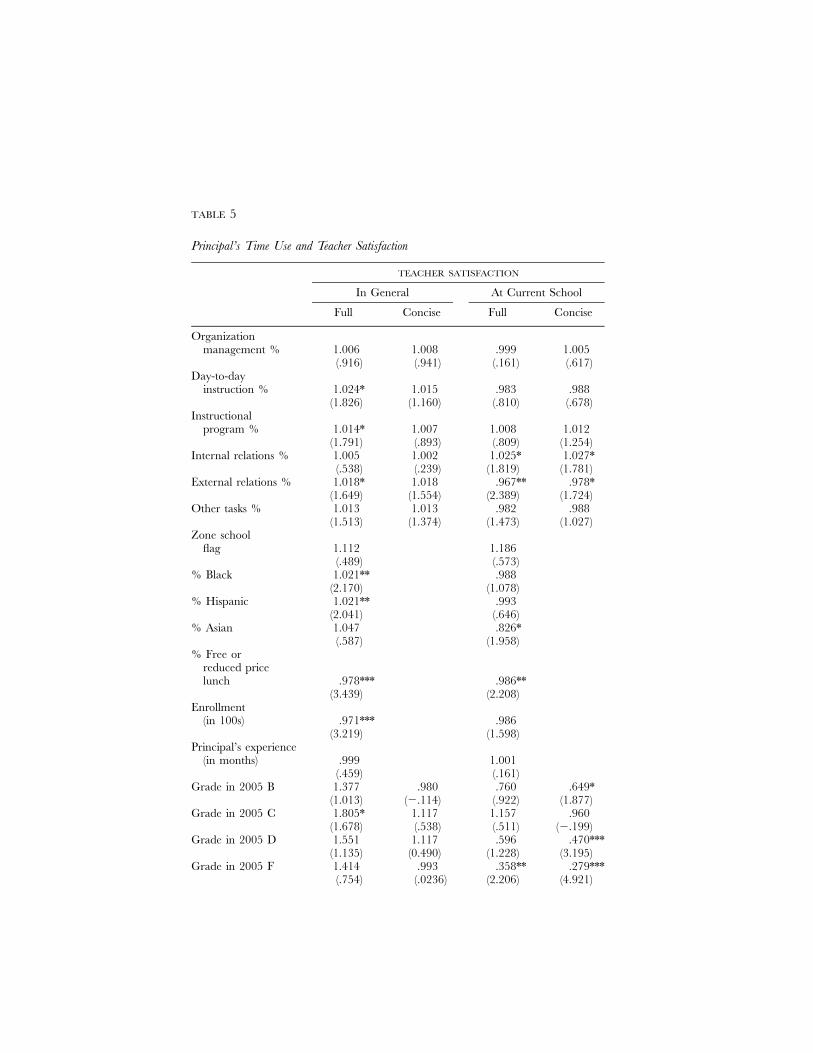
TABLE 5
Principal’s Time Use and Teacher Satisfaction
TEACHER SATISFACTION
In General At Current School
Full Concise Full Concise
Organizationmanagement % 1.006 1.008 .999 1.005
(.916) (.941) (.161) (.617)Day-to-day
instruction % 1.024* 1.015 .983 .988(1.826) (1.160) (.810) (.678)
Instructionalprogram % 1.014* 1.007 1.008 1.012
(1.791) (.893) (.809) (1.254)Internal relations % 1.005 1.002 1.025* 1.027*
(.538) (.239) (1.819) (1.781)External relations % 1.018* 1.018 .967** .978*
(1.649) (1.554) (2.389) (1.724)Other tasks % 1.013 1.013 .982 .988
(1.513) (1.374) (1.473) (1.027)Zone school
flag 1.112 1.186(.489) (.573)
% Black 1.021** .988(2.170) (1.078)
% Hispanic 1.021** .993(2.041) (.646)
% Asian 1.047 .826*(.587) (1.958)
% Free orreduced pricelunch .978*** .986**
(3.439) (2.208)Enrollment
(in 100s) .971*** .986(3.219) (1.598)
Principal’s experience(in months) .999 1.001
(.459) (.161)Grade in 2005 B 1.377 .980 .760 .649*
(1.013) (�.114) (.922) (1.877)Grade in 2005 C 1.805* 1.117 1.157 .960
(1.678) (.538) (.511) (�.199)Grade in 2005 D 1.551 1.117 .596 .470***
(1.135) (0.490) (1.228) (3.195)Grade in 2005 F 1.414 .993 .358** .279***
(.754) (.0236) (2.206) (4.921)
Principal’s Time Use
516 American Journal of Education
TABLE 5 (Continued )
TEACHER SATISFACTION
In General At Current School
Full Concise Full Concise
Constant 3.479 4.741*** 88.26*** 8.516***(1.381) (2.641) (3.490) (3.290)
Observations 4,228 4,272 4,203 4,247Pseudo 2R .010 .002 .041 .035
NOTE.—Odds ratios with z-statistics in parentheses.* p ! .10.** p ! .05.*** p ! .01.
of the external relations observations were from only three principals, theseresults may not be generalizable.
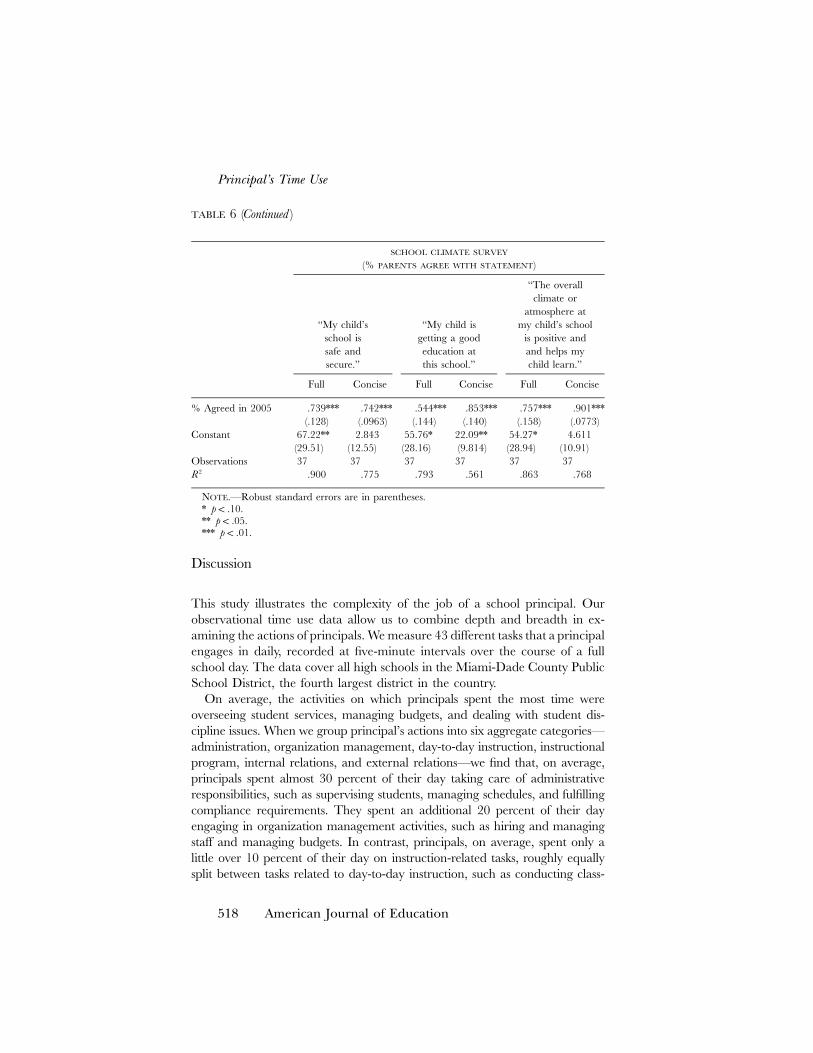
Principal’s Time Use and Parent Assessments of the School
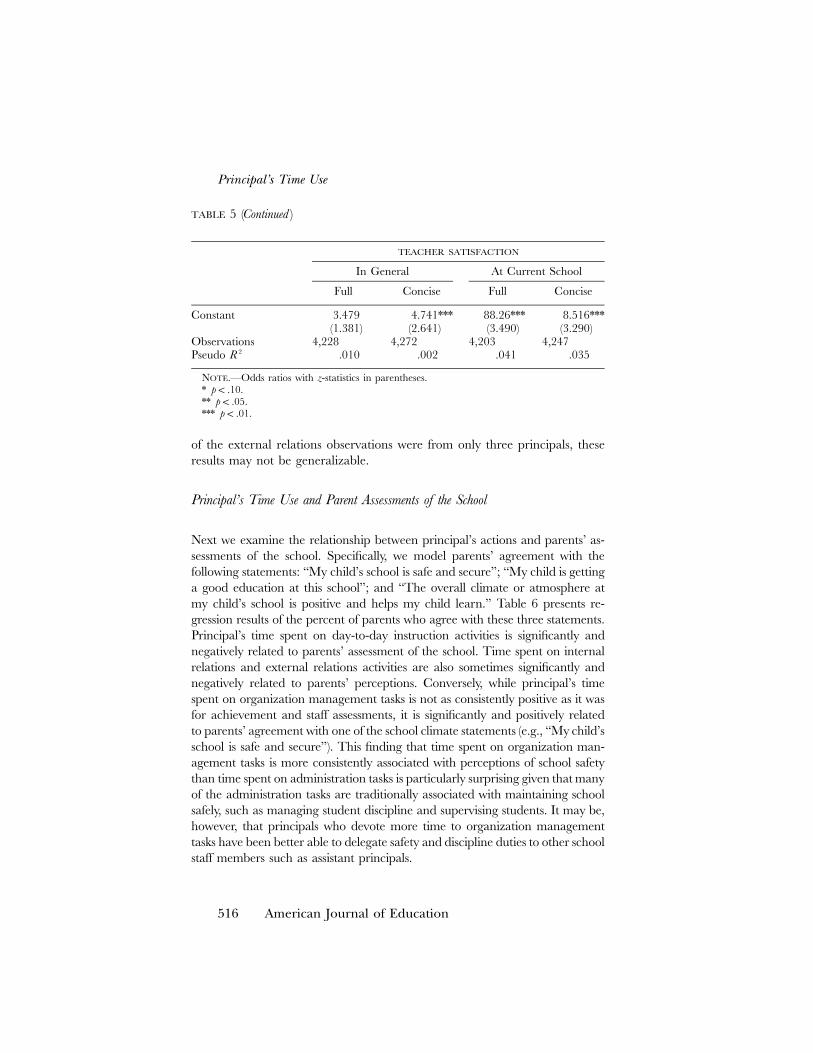
Next we examine the relationship between principal’s actions and parents’ as-sessments of the school. Specifically, we model parents’ agreement with thefollowing statements: “My child’s school is safe and secure”; “My child is gettinga good education at this school”; and “The overall climate or atmosphere atmy child’s school is positive and helps my child learn.” Table 6 presents re-gression results of the percent of parents who agree with these three statements.Principal’s time spent on day-to-day instruction activities is significantly andnegatively related to parents’ assessment of the school. Time spent on internalrelations and external relations activities are also sometimes significantly andnegatively related to parents’ perceptions. Conversely, while principal’s timespent on organization management tasks is not as consistently positive as it wasfor achievement and staff assessments, it is significantly and positively relatedto parents’ agreement with one of the school climate statements (e.g., “My child’sschool is safe and secure”). This finding that time spent on organization man-agement tasks is more consistently associated with perceptions of school safetythan time spent on administration tasks is particularly surprising given that manyof the administration tasks are traditionally associated with maintaining schoolsafely, such as managing student discipline and supervising students. It may be,however, that principals who devote more time to organization managementtasks have been better able to delegate safety and discipline duties to other schoolstaff members such as assistant principals.
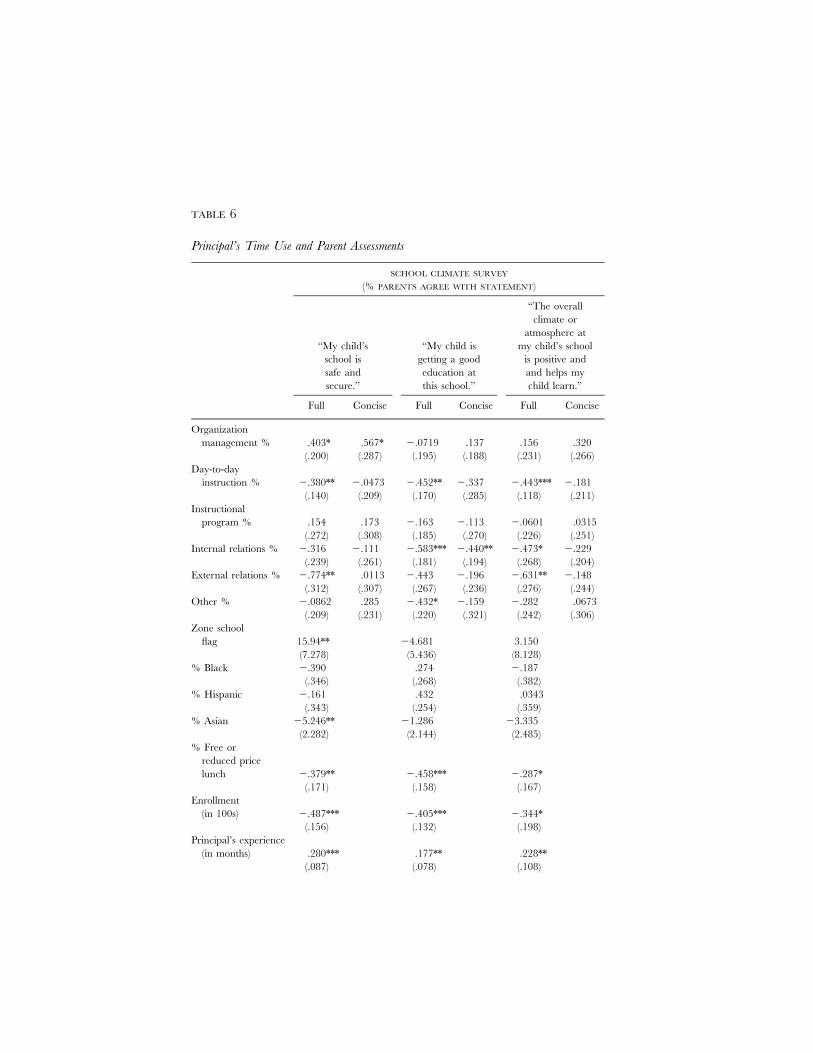
TABLE 6
Principal’s Time Use and Parent Assessments
SCHOOL CLIMATE SURVEY
(% PARENTS AGREE WITH STATEMENT)
“My child’sschool issafe andsecure.”
“My child isgetting a goodeducation atthis school.”
“The overallclimate or
atmosphere atmy child’s school
is positive andand helps mychild learn.”
Full Concise Full Concise Full Concise
Organizationmanagement % .403* .567* �.0719 .137 .156 .320
(.200) (.287) (.195) (.188) (.231) (.266)Day-to-day
instruction % �.380** �.0473 �.452** �.337 �.443*** �.181(.140) (.209) (.170) (.285) (.118) (.211)
Instructionalprogram % .154 .173 �.163 �.113 �.0601 .0315
(.272) (.308) (.185) (.270) (.226) (.251)Internal relations % �.316 �.111 �.583*** �.440** �.473* �.229
(.239) (.261) (.181) (.194) (.268) (.204)External relations % �.774** .0113 �.443 �.196 �.631** �.148
(.312) (.307) (.267) (.236) (.276) (.244)Other % �.0862 .285 �.432* �.159 �.282 .0673
(.209) (.231) (.220) (.321) (.242) (.306)Zone school
flag 15.94** �4.681 3.150(7.278) (5.436) (8.128)
% Black �.390 .274 �.187(.346) (.268) (.382)
% Hispanic �.161 .432 .0343(.343) (.254) (.359)
% Asian �5.246** �1.286 �3.335(2.282) (2.144) (2.485)
% Free orreduced pricelunch �.379** �.458*** �.287*
(.171) (.158) (.167)Enrollment
(in 100s) �.487*** �.405*** �.344*(.156) (.132) (.198)
Principal’s experience(in months) .280*** .177** .228**
(.087) (.078) (.108)
Principal’s Time Use
518 American Journal of Education
TABLE 6 (Continued )
SCHOOL CLIMATE SURVEY
(% PARENTS AGREE WITH STATEMENT)
“My child’sschool issafe andsecure.”
“My child isgetting a goodeducation atthis school.”
“The overallclimate or
atmosphere atmy child’s school
is positive andand helps mychild learn.”
Full Concise Full Concise Full Concise
% Agreed in 2005 .739*** .742*** .544*** .853*** .757*** .901***(.128) (.0963) (.144) (.140) (.158) (.0773)
Constant 67.22** 2.843 55.76* 22.09** 54.27* 4.611(29.51) (12.55) (28.16) (9.814) (28.94) (10.91)
Observations 37 37 37 37 37 372R .900 .775 .793 .561 .863 .768
NOTE.—Robust standard errors are in parentheses.* p ! .10.** p ! .05.*** p ! .01.
Discussion
This study illustrates the complexity of the job of a school principal. Ourobservational time use data allow us to combine depth and breadth in ex-amining the actions of principals. We measure 43 different tasks that a principalengages in daily, recorded at five-minute intervals over the course of a fullschool day. The data cover all high schools in the Miami-Dade County PublicSchool District, the fourth largest district in the country.
On average, the activities on which principals spent the most time wereoverseeing student services, managing budgets, and dealing with student dis-cipline issues. When we group principal’s actions into six aggregate categories—administration, organization management, day-to-day instruction, instructionalprogram, internal relations, and external relations—we find that, on average,principals spent almost 30 percent of their day taking care of administrativeresponsibilities, such as supervising students, managing schedules, and fulfillingcompliance requirements. They spent an additional 20 percent of their dayengaging in organization management activities, such as hiring and managingstaff and managing budgets. In contrast, principals, on average, spent only alittle over 10 percent of their day on instruction-related tasks, roughly equallysplit between tasks related to day-to-day instruction, such as conducting class-
Horng, Klasik, and Loeb
AUGUST 2010 519
room observations, and those related to the broader instructional program, likeimplementing professional development for teachers.
The relatively little time principals devoted to instruction is somewhat sur-prising given the research and district emphases on the principals as the in-structional leader of the school. While time on task may not be the best measureof the importance a principal places on an activity, as some tasks may requiremore time to complete just by their nature rather than their status, the fact thatthe principals spent only about 10 percent of their time engaged in instruction-related activities points to the potential importance of other tasks in the workof principals. Administration tasks, such as filling compliance requirements andmanaging school schedules and student services, require a substantial amountof time from all principals, though some principals manage these tasks in lesstime than others.
The heart of the analyses in this article examines the relationship betweenthe time principals spent on different types of activities and school outcomes,including student achievement, staff assessment of the school learning envi-ronment, teacher satisfaction, and parent assessment of the school. The resultsshow that time on organization management activities is associated with pos-itive school outcomes. In particular, schools in which principals spent moretime on organization management relative to administration activities haveseen greater gains in student test performance over the past three years. Schoolstaff are also more likely to rate the climate as positive and improving (i.e.,controlling for a prior year’s measure), and parents are more likely to perceivethe school as safe and secure.
In contrast, day-to-day instruction activities are marginally or not at all relatedto improvements in student performance, and they often have a negative re-lationship with teacher and parent assessments of the school. For example, themore time principals spent on day-to-day instruction activities, such as con-ducting classroom observations, the less likely teachers and parents were to feelthe school climate is positive and contributes to student learning. It may be thatteachers feel that visits by principals are intrusions into the classroom that tendto harm rather than promote a positive learning environment. Alternatively,principals who spent more time on day-to-day instruction simply may havesacrificed other activities that are important for a well-functioning school.
The lack of positive effects for day-to-day instruction does not necessarilyimply that a focus of instructional leadership is misguided. First, our resultsshow merit to principals devoting time to develop the school’s broader in-structional program. Time spent on instructional program activities is posi-tively associated with the staffs’ perceptions of the school’s educational envi-ronment and teachers’ satisfaction with teaching in general. More importantly,organization management activities are central to instructional leadership de-fined broadly. For example, hiring personnel, an organization management
Principal’s Time Use
520 American Journal of Education
task, may be the most influential role principals have in the instructionalpractices of their schools. Nonetheless, this article does provide some evidencethat a single-minded focus on principals as instructional leaders operationalizedthrough direct contact with teachers (e.g., classroom visits) may be detrimentalif it forsakes the important role of principals as organizational leaders.
The results in this article are clearly not definitive. We are studying onedistrict at one point in time in a nonexperimental setting. As such, the bestwe can do in modeling the association between principal’s actions and schooloutcomes is to control for the limited number of school characteristics thesample size will allow. While our controls for prior measures of the outcomevariable enable us to account for some unobserved school characteristics thatare constant over time, the approach is still not ideal for causal analysis.
In addition, while our data provide an unprecedented ability to examinethe daily activities of principals, they have a number of limitations. First, theyare limited by the fact that we gathered them during one week of one schoolyear in one school district. In future work, we would like to measure theprincipals’ actions at multiple times of the year to see how their roles changethroughout the academic cycle as well as to better understand the variationacross principals and over time. Additionally, we would like to compare theresults for M-DCPS with similar data in other large urban districts. We haverecently collected data in two other districts that will help us to understandthe extent to which the results presented here are generalizable to other districtcontexts. Second, our data collection was based on silent shadowing of prin-cipals to minimize disruption of a principal’s typical day, that is, researcherstried to minimize their interactions with the principals until a debriefing atthe end of the day. Debriefings with principals allowed the researchers to gainsome insights into the motivations of principals; however, our understandingof the principals’ intentions is limited. While we can report what principalsdo, we have little sense of why principals do what they do, and thus we arelikely missing possible explanations for the patterns we find. In addition, thislack of information may lead us to miscode tasks in some instances. Forexample, a researcher may have interpreted a principal’s informal conversationwith a teacher about a student as developing their relationship, whereas theprincipal may have intended for it to be an informal coaching opportunity.Finally, the relationships we observe between principal’s time use and schooleffectiveness are limited to the range of time use we observe. For example,we cannot say anything about the efficacy of principals who spend 75 percentof their time engaging in organization management activities because no prin-cipal in our sample did. Any benefits related to performing these tasks anddetriments related to engaging in administrative tasks are likely to have limits.
In summary, this article represents one of the first large-scale observationalstudies of principal’s time use. We find that principals spend much of their day
Horng, Klasik, and Loeb
AUGUST 2010 521
on administration and organization management tasks and substantially less onday-to-day instruction and instructional program tasks. Administration tasksappear to contribute less to the school’s well-being than other activities of theprincipal; however, those classified as organization management tasks appearvery important, even more important than those associated directly withinstruction.
Notes
1. We intend to compare the actions of principals across different districts in futurestudies. However, for this initial study, we chose to focus on one school district so thatour models would not be complicated by variation due to differences in district practicesand policies.
2. The elementary and middle schools were chosen based on the percentage ofstudents eligible for the free and reduced price lunch program, with the elementaryand middle schools with the highest and lowest percentages from each of the district’ssix administrative regions entering the sample.
3. Note that, if one of the researchers used a task code as the primary task whilethe other considered the same task to be a secondary task, we still considered this tobe consistent coding. However, in subsequent trainings, we discussed the decision ruleson how to determine whether a task should be considered primary or secondary usingthese examples.
4. Since 1999, Florida has had its own accountability program independent of theaccountability standards imposed by the federal No Child Left Behind Act. As part ofthis program, schools are assigned grades (on an academic A–F scale) based on studentperformance on state standardized tests. The grade is based, among other factors, onthe percentage of students at a given school who meet a particular threshold on exams,including reading and math, measures of the percentage of students who have demon-strated improvement on these exams, and the percentage of the students who fell in thelowest quartile, statewide, in the previous year who have demonstrated improvement.
5. Note that even though researchers observed nearly three-quarters of the high schoolprincipals engaging in some external relations tasks, over 50 percent of all externalrelations observations are from just three principals.
6. Note that this may be an underestimate of the time spent off campus on a typicalday if the principals were more likely to stay on campus as a result of the presence ofthe researchers.
References
Andrews, Richard L., and Roger Soder. 1987. “Principal Leadership and StudentAchievement.” Educational Leadership 44 (6): 9–11.
Andrews, Richard L., Roger Soder, and Dan Jacoby. 1986. “Principal Roles, Other In-School Variables, and Academic Achievement by Ethnicity and SES.” Paper presentedat the annual meeting of the American Educational Research Association, San Fran-cisco, April.
Branch, Gregory F., Eric A. Hanushek, and Steven G. Rivkin. 2008. “Principal Turnover
Principal’s Time Use
522 American Journal of Education
and Effectiveness.” Paper presented at the annual meeting of the American EconomicsAssociation, San Francisco, January.
Brewer, Dominic. 1993. “Principals and Student Outcomes: Evidence from U.S. HighSchools.” Economics of Education Review 12 (4): 281–92.
Darling-Hammond, Linda, Michelle LaPointe, Debra Meyerson, Margaret Terry Orr,and Carol Cohen. 2007. “Preparing School Leaders for a Changing World: Lessonsfrom Exemplary Leadership Development Programs.” Report, Stanford EducationalLeadership Institute, Stanford University.
Eberts, Randall W., and Joe A. Stone. 1988. “Student Achievement in Public Schools:Do Principals Make a Difference?” Economics of Education Review 7 (3): 291–99.
EdSource. 2008. “Guiding the Growth of California’s School Leaders.” Leadership,January/February, 18–21.
Erickson, Donald A., and Theodore L. Reller, eds. 1978. The Principal in MetropolitanSchools. Berkeley, CA: McCutchan.
Goldring, Ellen, Jason Huff, Henry May, and Eric Camburn. 2008. “School Contextand Individual Characteristics: What Influences Principal Practice?” Journal of Ed-ucational Administration 46 (3): 332–52.
Grissom, Jason, and Susanna Loeb. 2009. “Triangulating Principal Effectiveness: HowPerspectives of Parents, Teachers, and Assistant Principals Identify the Central Im-portance of Managerial Skills.” School Leadership Research Report no. 09–1, In-stitute for Research on Education Policy and Practice, Stanford University.
Hallinger, Phillip, and Ronald Heck. 1996. “Reassessing the Principal’s Role in SchoolEffectiveness: A Review of Empirical Research, 1980–1995.” Educational AdministrationQuarterly 32 (1): 5–44.
Harris, Douglas N., Stacey A. Rutledge, William K. Ingle, and Cynthia C. Thompson.2010. “Mix and Match: What Principals Really Look for When Hiring Teachers.”Education Finance and Policy 5 (2): 228–46.
Knapp, Michael S., Michael A. Copland, Brynnen Ford, Anneke Markholt, MilbreyW. McLaughlin, Michael Milliken, and Joan E. Talbert. 2003. “Leading for Learn-ing Sourcebook: Concepts and Examples.” Center for the Study of Teachingand Policy, University of Washington, http://www/depts.washington.edu/ctpmail/PDFs/LforLSourcebook-02-03.pdf.
Knapp, Michael S., Michael A. Copland, Margaret L. Plecki, and Bradley S. Portin.2006. “Leading, Learning, and Leadership Support.” Research report, Center forthe Study of Teaching and Policy, University of Washington, in collaboration withthe Wallace Foundation, New York.
Lee, Valerie E., Anthony S. Bryk, and Julia B. Smith. 1993. “The Organization ofEffective Secondary Schools.” Review of Research in Education 19:171–267.
Leithwood, Kenneth, Karen Seashore Louis, Stephen Anderson, and Kyla Wahlstrom.2004. “How Leadership Influences Student Learning.” Report for the Wallace Foun-dation by Center for Applied Research and Educational Improvement, Universityof Minnesota.
Martin, William J., and Donald J. Willower. 1981. “The Managerial Behavior of HighSchool Principals.” Educational Administration Quarterly 17 (1): 69–90.
Martinko, Mark J., and William L. Gardner. 1990. “Structured Observation ofManagerial Work: A Replication and Synthesis.” Journal of Management Studies27 (3): 329–57.
Morris, Van Cleve, Robert Crowson, Cynthia Porter-Gehrie, and Emanuel HurwitzJr. 1984. Principals in Action: The Reality of Managing Schools. Columbus, OH: Merrill.
Scott, Christy, Stephen Ahadi, and Samuel E. Krug. 1990. “An Experience SamplingApproach to the Study of Principal Instructional Leadership II: A Comparison of
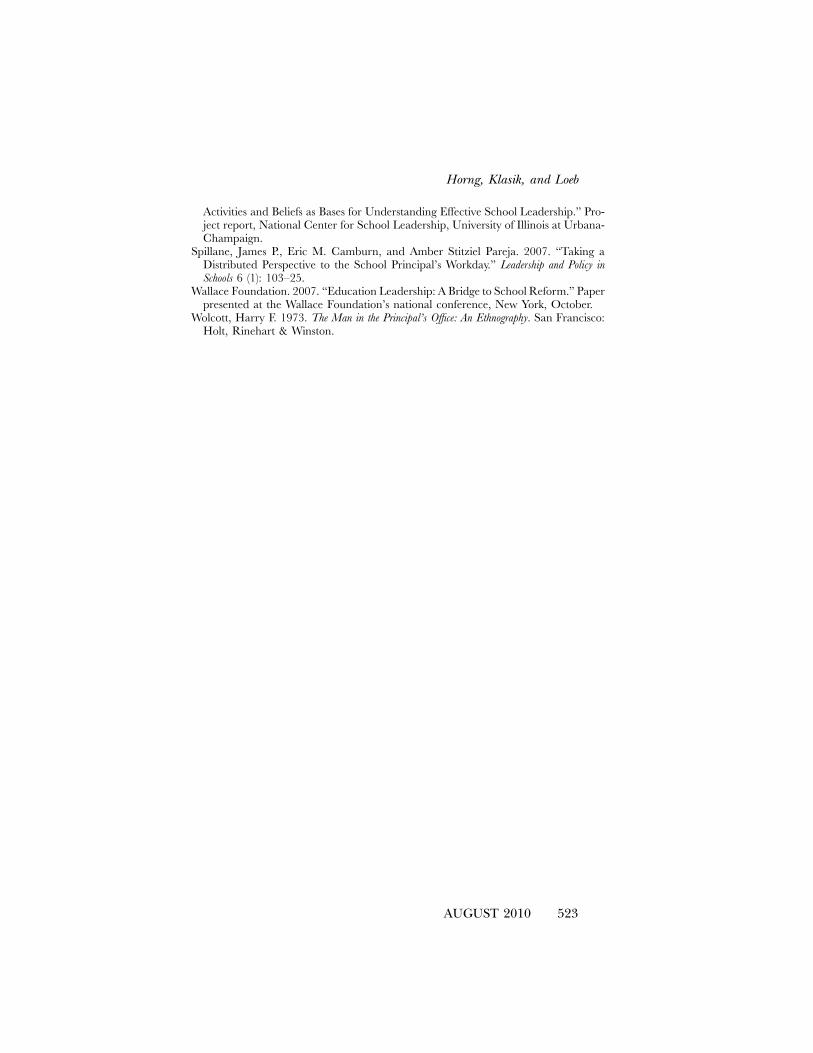
Horng, Klasik, and Loeb
AUGUST 2010 523
Activities and Beliefs as Bases for Understanding Effective School Leadership.” Pro-ject report, National Center for School Leadership, University of Illinois at Urbana-Champaign.
Spillane, James P., Eric M. Camburn, and Amber Stitziel Pareja. 2007. “Taking aDistributed Perspective to the School Principal’s Workday.” Leadership and Policy inSchools 6 (1): 103–25.
Wallace Foundation. 2007. “Education Leadership: A Bridge to School Reform.” Paperpresented at the Wallace Foundation’s national conference, New York, October.
Wolcott, Harry F. 1973. The Man in the Principal’s Office: An Ethnography. San Francisco:Holt, Rinehart & Winston.