Embed Size (px)
Citation preview
Principles and Practice of Mass Isotopomeric MultiOrdinate Spectral
Analysis (MIMOSA) to Assess Metabolic Flux"
Richard G. Kibbey M.D., Ph.D. Associate Professor
Departments of Internal Medicine and Cellular & Molecular Physiology Yale University School of Medicine
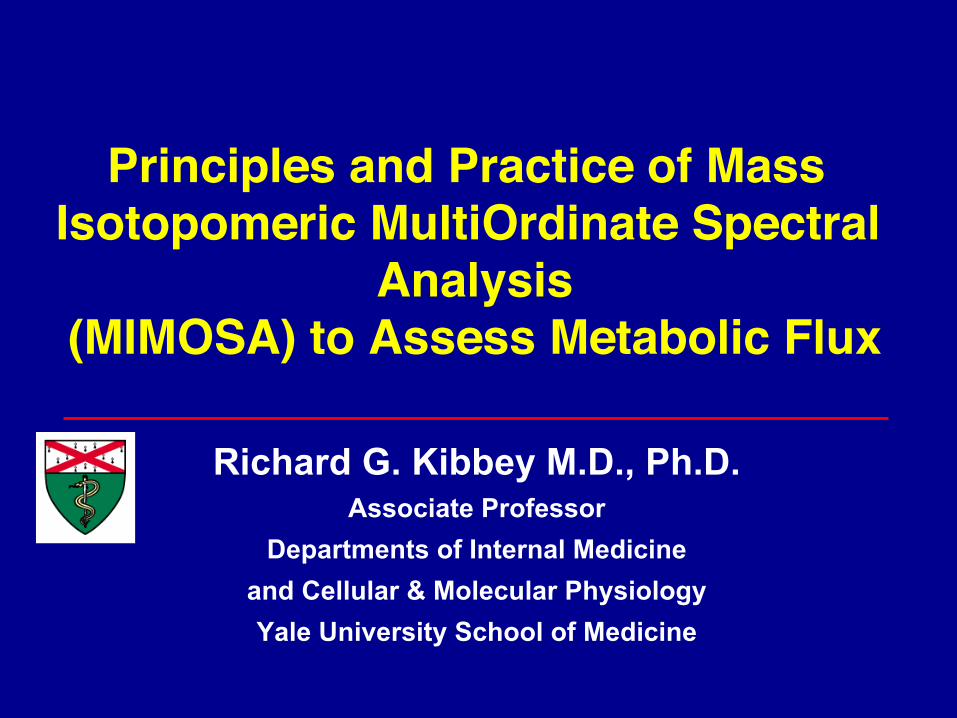
What is wrong with my metabolism??!?
TCA rate RPM x10000
1 2
3 4 5 6
7
8 9
6.5

The KREBS Cycle

Glucose
Glucose
Pyruvate
TCAADPATP
K+
2+Ca
[Ca]2+ i
GLUT
VDCC
ATPK
Canonical Insulin Secretion
OXPHOS
InsulinRelease
SCS-GTP
cytoplasm
mitochondria
Canonical Insulin Secretion
CO2
NADH
NADPH
O2
GK
HHF6(GLUD1)
CongenitalHypoglycemia

MIMOSAwasdevelopedtoreconcileinconsistanciesinstableisotopeanalysis
HowtomeasureglucoseoxidaNonininsulinsecreNngcells?
[U-13C6]Glucose
Citrate
Glutamate
Acetyl-CoA
0 80 160 2400
20
40
60
80
100
Time (min)
13C
- En
richm
ent (
%)
PEP M+3 Glutamate M+2
?

Mitochondria
NNNN
N N
N
N
NPPPGluco
Kinase
PP
P PPPP
Aldolase
PyruvateCarboxy-lase
CitrateSynthase
Isocitratedehydro-genase
TransAminase
Fumarase
SuccinylCoA
Synthetase
OGDH
PPEPCK
PyruvateKinase
GlycolysisPyruvateDehydro-genase

Mitochondria
NNNN
N N
N
N
NPPP
PP
P PPPP
P
Glycolysis
GlucoKinase
Aldolase
Fumarase
PyruvateCarboxy-lase
PEPCK
PyruvateKinase
PyruvateDehydro-genase
CitrateSynthase
Isocitratedehydro-genase
TransAminase
OGDH
SuccinylCoA
Synthetase

Concentration-Based Flux Measurements
Concentration ≠ Flux
MetaboliteX

Isotope Enrichment-Based Flux Measurements
40% Enriched 25% Enriched
Enrichment ≠ Flux

Steadystateenrichments≠fluxProductEnrichmentdependsonprecursorenrichment
0
50
100
Time
13C
(%)
fA (V)
fB (V)0
50
100
Time
13C
(%)
fA (4V)
fB (4V)0
50
100
Time
13C
(%)
fA (V/2)
fB (V/2)
A BVV V
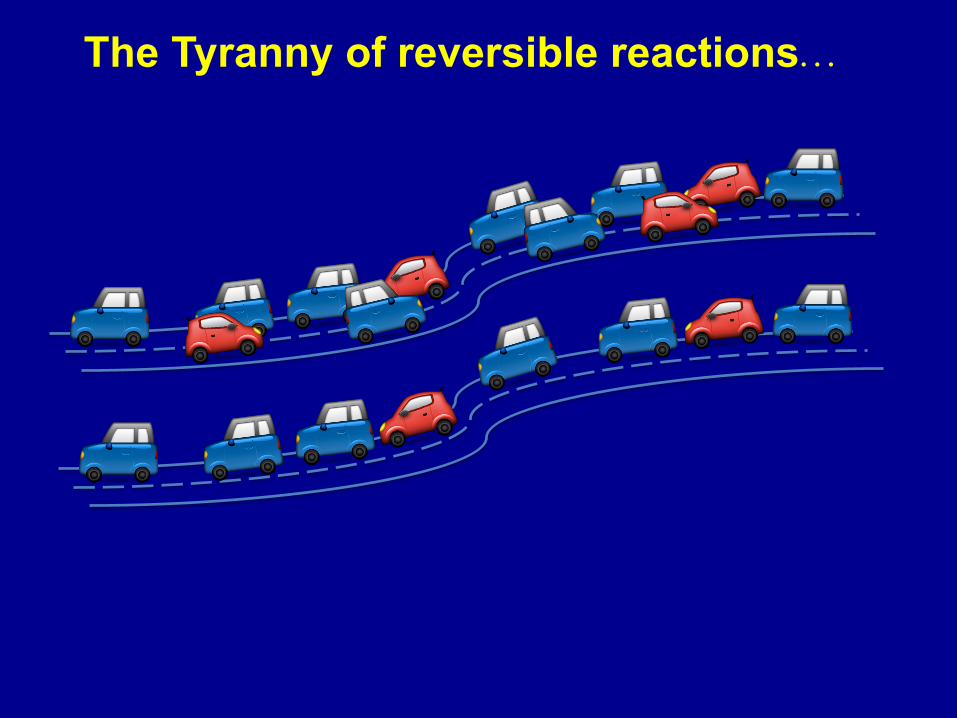
The Tyranny of reversible reactions…
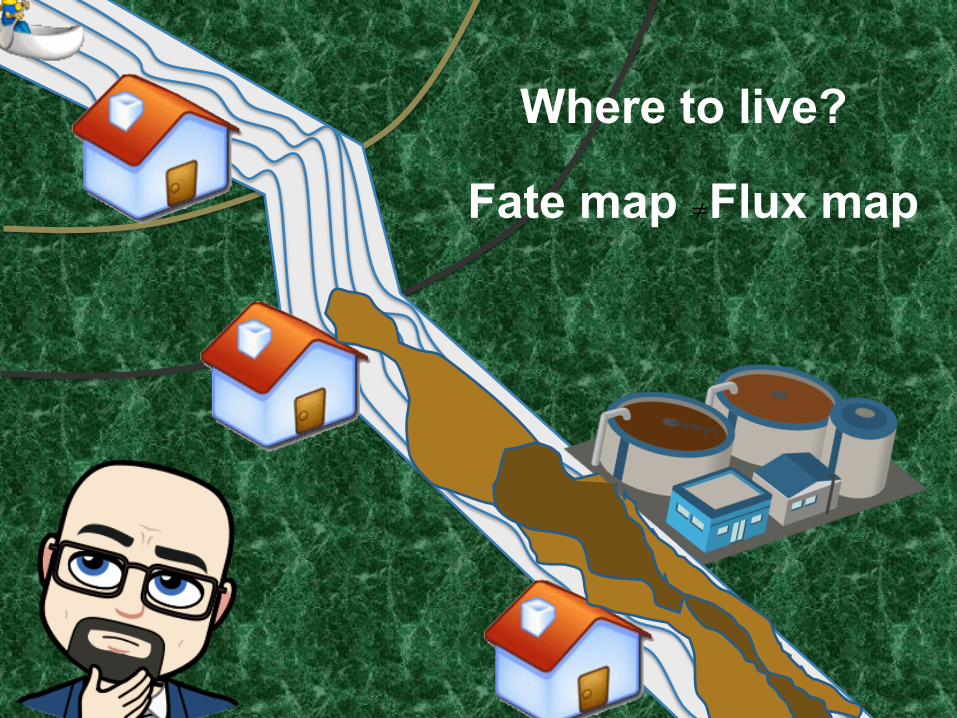
Where to live?
Fate map ≠Flux map
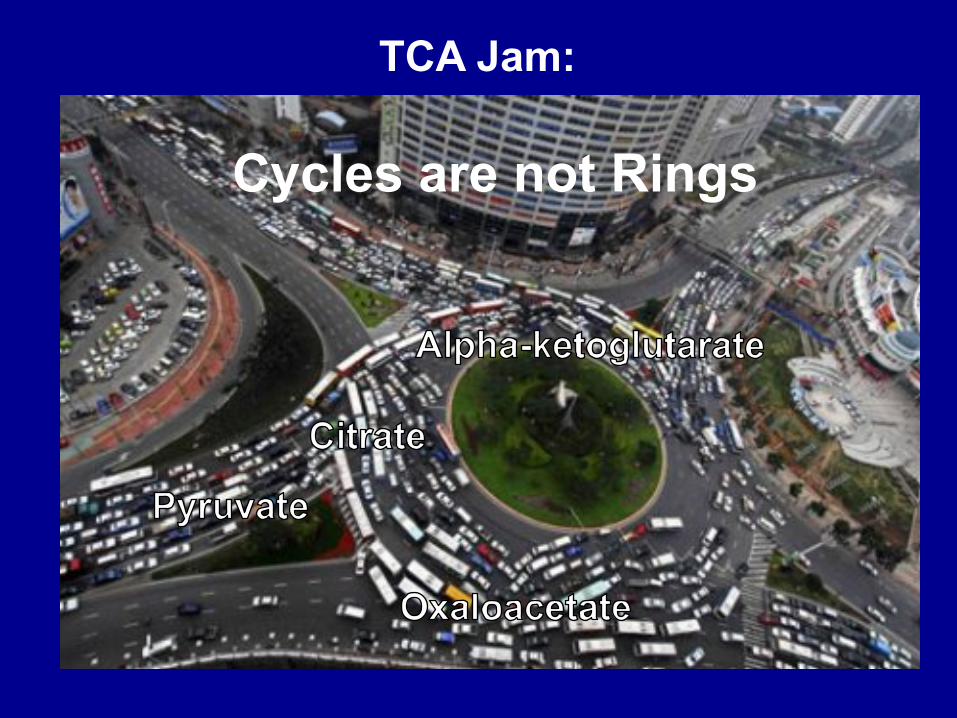
TCA Jam:
Cycles are not Rings

MIMOSA Platform MIMOSA • Mass • Isotopomer • Multi • Ordinate • Spectral • Analysis
Resource
Integrated, Step-Wise, Mass-Isotopomeric FluxAnalysis of the TCA Cycle
Graphical Abstract
Highlightsd LC-MS/MS positional 13C-enrichment for steady-state and
dynamic flux analysis
d Intersecting metabolic fluxes are disentangled by
deciphering citrate isotopomers
d Comprehensive precursor/product positional 13C-label
transfer analysis
d Quantitative mitochondrial oxidative, anaplerotic, cycling,
and exchange rates
Authors
Tiago C. Alves, Rebecca L. Pongratz,
Xiaojian Zhao, ..., Gary W. Cline,
Graeme Mason, Richard G. Kibbey
In BriefQuantitative assessment of intracellular
metabolism requires measuring the
enzyme-to-enzyme flow of metabolites.
Mitochondria have multiple nodes where
metabolites intersect, scramble, and
diverge, complicating isotope labeling.
Alves et al. use LC-MS/MS to decipher
step-wise position-specific transfer of13C coming from glucose into subsequent
metabolites through glycolysis and
around the TCA cycle.
Alves et al., 2015, Cell Metabolism 22, 1–12November 3, 2015 ª2015 Elsevier Inc.http://dx.doi.org/10.1016/j.cmet.2015.08.021
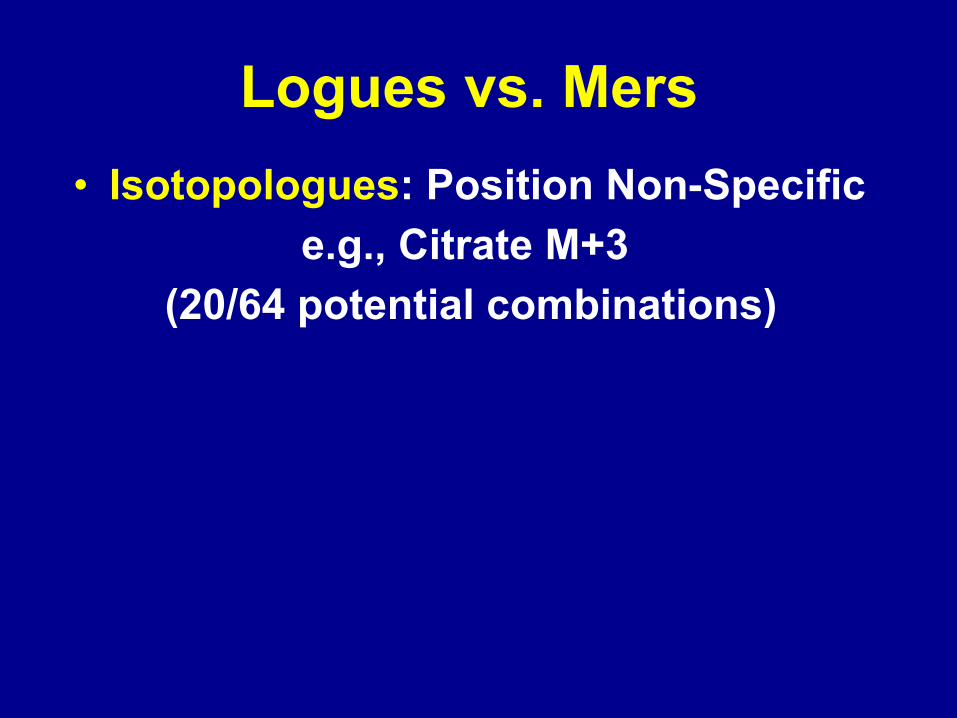
Logues vs. Mers • Isotopologues: Position Non-Specific
e.g., Citrate M+3 (20/64 potential combinations)
• Isotopomer: Position Specific
�
Figure S4 – Characterization of citrate isotopomers. (A) Parent/daughter distribution of the
citrate fragments for M+2, M+3, M+4 and M+5. (B) Citrate isotopomers generated by reverse
ICDH.
������� �������
�� ��
�����������
������� ������� �������
������� ������� ������� ������� �������
�� ��
����
�� ��
�� ��
�� ��
����
�� �
�� �
����
�� ��
�� ��
����� ����� ����������� ��
��� �
���� ���� ����������������
��������������
����� ����� ����� �������������
�������������
����� ����� ��������������
����������������
��������������
A
B
8 species Oxidative Anaplerotic 3 families

Pyruvate Citrate
PDH 123645a
OAA
PCCS IDHTCA
h
c
j
g
f’
b’
Citrate
CitrateOAA
Glutamate
GlutamateOAA
IDHTCA
Glutamate
CS12345
b
f
i
d
e
k
21
34
OAA
IDH TCA IDH TCA TCACS IDH
Citrate Glutamate OAA
Citrate
Glutamate
OAAGlucose
Metabolism of glucose

Position from MS/MS data
1 2 3 4 5
4 5 1 2 3
+
Originated from Acetyl-CoA Detected by MS
Originated from OAA
M+0 M+1 M+2 M+3 M+4 M+5
146/41 147/41 147/42 148/41 148/42 148/43 149/41 149/42 149/43 150/42 150/43 151/43

aspartate
OAA
malate
citrate
α-ketoglutarate glutamate
succinate
AcCoA
pyruvateβ-oxidation
Φ
MIMOSA: Leveraging Position

Mapping Substrate Flows
Φ PAc
Φ AcCitΦ C
itGΦ GSΦ S
MΦ M
OΦ O
Cit'Φ O
P0.00
0.25
0.50
0.75
1.00
1.25* **
Glutamate(Succinate(
Malate(
OAA(
Aspartate((D)(
Acetyl7CoA(
Pyruvate(ΦPAc%
Citrate(
ΦAcCit%
ΦCitG%
ΦGS%
ΦSM%
ΦMOD%
ΦMO%
ΦOCit’%
ΦOP%
Alves et al. Cell Metabolism 2015
!
!
Supplemental Figure S2 related to Figure 3– Steady State (Φ) Analysis. Steady-state precursor-product relationships between the metabolic intermediates involved in the PC, PDH and TCA cycle reactions. The equations describing these relationships are shown in Supplemental Table S2. The (*) represents the relationship with the highest enrichments and therefore is used as a reference within a group of equivalent relationships. A red dashed line was drawn to facilitate that comparison. ! !
PAc PAcCit PAcCitG AcCit AcCitG0.0
0.5
1.0
1.5
Φ
0.990.79
0.42
0.80
0.42
CitG (1) CitG (2) CitG (3) CitG (4) CitG (5) CitG (6) CitG (7)0.0
0.2
0.4
0.6
0.8
1.0
Φ
0.53 0.450.56
0.760.68
0.350.52
GS0.0
0.5
1.0
1.5
Φ
CitS(1) CitS(2) CitS(3) CitS(4)0.0
0.2
0.4
0.6
0.8
1.0
Φ0.53 0.47
0.59 0.54***
SM(1) SM(2) SM(3)0.0
0.5
1.0
1.5
Φ
1.080.82 1.00***
PO POD(1) POD(2) POM POC0.0
0.1
0.2
0.3
0.4
0.5
Φ
0.17
0.350.32
0.210.14
*** **
CitSM(1) CitSM(2) CitSM(3)0.0
0.2
0.4
0.6
0.8
1.0
Φ
0.50 0.48 0.55
SMOD(1) SMOD(2) SMOD(3)0.0
0.5
1.0
1.5
Φ
1.281.03 1.21**
aspartate'(D)'
OAA'
malate'
citrate'
α�ketoglutarate''''''''''
glutamate'
succinate'
AcCoA'
pyruvate'β9oxida<on'
ΦPAc'
ΦPCit'
ΦAcCG'
ΦPAcCG'
ΦAcCit'aspartate'(D)'
OAA'
malate'
citrate'
α�ketoglutarate''''''''''
glutamate'
succinate'
AcCoA'
pyruvate'β9oxida<on'
ΦPOD192'
ΦPOM'ΦPOCit'
ΦPO'
aspartate'(D)'
OAA'
malate'
citrate'
α�ketoglutarate''''''''''
glutamate'
succinate'
AcCoA'
pyruvate'β9oxida<on'
ΦCitG'
ΦCitS'
ΦCitM'
aspartate'(D)'
OAA'
malate'
citrate'
α�ketoglutarate''''''''''
glutamate'
succinate'
AcCoA'
pyruvate'β9oxida<on'
ΦGS'
ΦSM'
ΦSMOD'
aspartate'(D)'
OAA'
malate'
citrate'
α�ketoglutarate''''''''''
glutamate'
succinate'
AcCoA'
pyruvate'β9oxida<on'
ΦDO' ΦDOCit'
ΦMOD' ΦMOCit'
ΦOCit'
ΦMO'
MO(1) MO(2) MO(3) MO(4)0.0
0.2
0.4
0.6
0.8
1.0
Φ
0.87 0.890.80 0.85
DO(1) DO(2) DO(3) DO(4)0.0
0.2
0.4
0.6
0.8
1.0
Φ
0.74 0.66 0.65 0.71
OC(1) OC(2) OC(3)0.0
0.2
0.4
0.6
0.8
1.0
Φ
0.79 0.84 0.79
MOC(1) MOC(2) MOC(3)0.0
0.2
0.4
0.6
0.8
1.0
Φ
0.690.75
0.63
DOC(1) DOC(2) DOC(3)0.0
0.2
0.4
0.6
0.8
1.0
Φ
0.58 0.56 0.51
OP MP DP0.0
0.2
0.4
0.6
0.8
1.0
Φ
0.25 0.22 0.17
(PEP)
Φ CitG1* Citrate glutamate
Φ CitG2 Citrate glutamate
Φ CitG3 Citrate glutamate
Φ CitG4 Citrate glutamate
Φ CitG5 Citrate glutamate
Φ CitG6 Citrate glutamate
Φ POCit Citrate
Φ CitG7 Citrate glutamate
Cita,d, f ,h,i, j∑ GlutC4,5+2∑
[U −13 C5 ]GlutamateCit h2+i4+ j
!
"#
$
%&
GlutC1,2,3+3∑Cit g+ h+ c
2+(i+ e)4
+ j!
"#
$
%&
Cit c2+e4+ g
!
"#
$
%& [1, 2,3−13 C3]Glutamate
Cit b+ f2
+h+ c4
+3(i+ e)4
!
"#
$
%& Glut
C1,2,3+2∑
Cit b+ f2
+3d4+32(192 / 68)
!
"#
$
%& Glut
C1,2,3+1∑
Cit( (b,c,d,e, f ,g,h, i, j, 32(192 / 68)))∑ Glut
C1,2,3+1∑ + GlutC1,2,3+2∑ + Glut
C1,2,3+3∑

0 1 20
1
2
VPC/VCS(Model Input)
V PC/V
CS
(Cal
cula
ted
Out
put)
Φ(5)
Φ(6)
= " + 3 "%&%'((*+)" + 3 *-./0%'( − " + 3 "%&%'((*+)
= " +3 "%&%'(" + 3 )*+,-%'(
= " +3 "%&%'((*+)" + 3 *-./0%'(
= " +3 "%&%'(" + 2 *+',%'(
Φ(2)
Φ(3) = " + 3 "%&%'( − " + 3 *+,,-.%'(" + 3 /01+2%'(
= " + 3 %&'()'*+ " + 5 %&'()'*" + 3 ,-(./)'*
Φ(1)
Φ(4)
Succinate
Pyruvate
Malate
Acetyl-CoAVPC
VME
VCSVPEPCK
M+3(PC)
M+3(Succinate)
Calculated vs. Actual Pyruvate Carboxylase
Isotopomers vs. Isotopologues

Alves et al. Cell Metabolism 2015
0 80 160 2400
20
40
60
80
100
APE
(%)
Time (min)PDH Label (Σ Cit a,f,i,d,h,j) PC Label (Σ Cit h,c)
PDH
PC
Change of Perspective
Pyruvate Oxidation Pyruvate Carboxylation
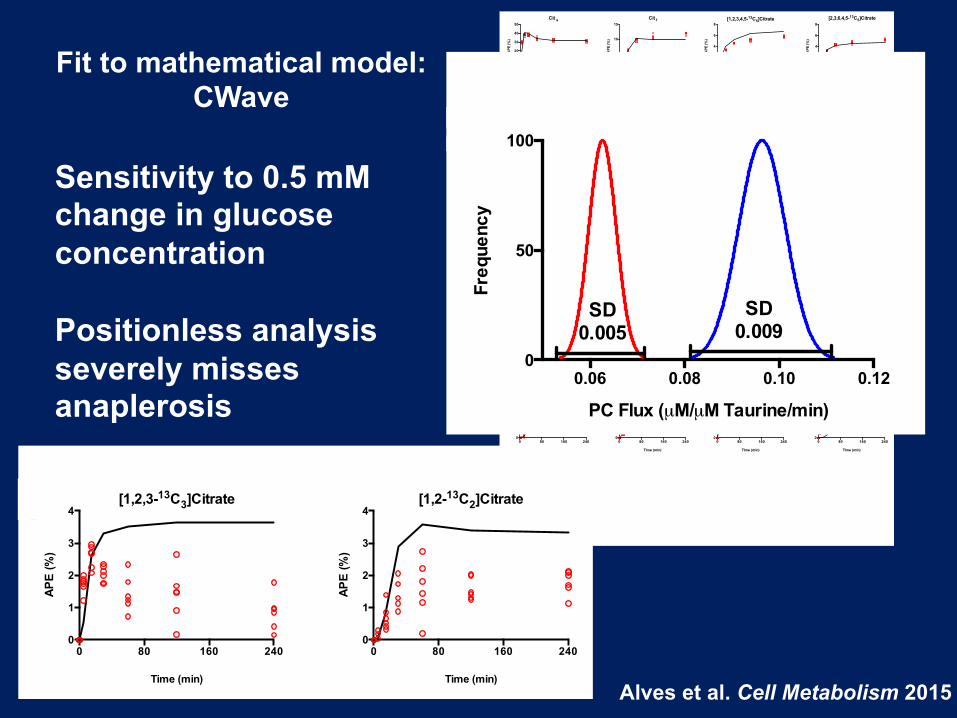
Fit to mathematical model: CWave
0 80 160 2400
10
20
30
40
50Cit a
Time (min)
APE
(%)
0 80 160 2400.0
0.5
1.0
1.5
2.0[1,3,6,4,5-13C5]Citrate
Time (min)
APE
(%)
0 80 160 2400
10
20
30
40
50
Time (min)
APE
(%)
Glutamate Total C45
0 80 160 2400
5
10
15
Time (min)
APE
(%)
[U-13C4]Succinate
0 80 160 2400
5
10
15
Time (min)
APE
(%)
Cit f
0 80 160 2400
1
2
3
4
5[U-13C6]Citrate
Time (min)
APE
(%)
0 80 160 2400
5
10
15
20
25
Time (min)
APE
(%)
Succinate M+2
0 80 160 2400
2
4
6
8[1,2,3,4,5-13C5]Citrate
Time (min)
APE
(%)
0 80 160 2400
20
40
60
80
Time (min)
APE
(%)
Cit a, f, i, d, h, j
0 80 160 2400
1
2
3
Time (min)
APE
(%)
[2,3,4-13C3]Succinate
0 80 160 2400
2
4
6
8[2,3,6,4,5-13C5]Citrate
Time (min)
APE
(%)
0 80 160 2400
10
20
30
Time (min)
APE
(%)
[4,5-13C2]Glutamate
0 80 160 2400
2
4
6
8
10
Time (min)
APE
(%)
[(1,2,3)(1,3,4)(1,2,4)-13C3]Succinate
0 80 160 2400
10
20
30
Time (min)
APE
(%)
Malate M+2
0 80 160 2400
5
10
15
Time (min)
APE
(%)
[1,2,3-13C3]Malate
0 80 160 2400
1
2
3
Time (min)
APE
(%)
[1,2,4-13C3]Malate
0 80 160 2400
2
4
6
8
10
Time (min)
APE
(%)
[U-13C4]Malate
0 80 160 2400
10
20
30
Time (min)
APE
(%)
OAA M+2
0 80 160 2400
5
10
15
Time (min)
APE
(%)
[1,2,3-13C3]OAA
0 80 160 2400
1
2
3
4
Time (min)
APE
(%)
[1,2,4-13C3]OAA
0 80 160 2400
2
4
6
8
10
Time (min)
APE
(%)
[U-13C4]OAA
Alves et al. Cell Metabolism 2015
Sensitivity to 0.5 mM change in glucose concentration Positionless analysis severely misses anaplerosis
!
!
!
!0 80 160 240
0
1
2
3
4[1,2,3-13C3]Citrate
Time (min)
AP
E (%
)
0 80 160 2400
1
2
3
4
Time (min)
AP
E (%
)
[1,2-13C2]Citrate
Isotopomer Fit Isotopologue Fit0.00
0.02
0.04
0.06
0.08
V Lip_ d
il (µ
M / µM
Tau
rine
/ min
)
VLip_dil / VCS = 20%
PDH CS PC0.0
0.1
0.2
0.3
0.4
µM
/ µ
M T
aurin
e / m
in
Isotopomer FitIsotopologue Fit
0 80 160 2400
2
4
6
8
Pyruvate M+2
Time (min)
APE
(%)
Isotopologue FitIsotopomer Fit
!!!!
0 80 160 2400
10
20
30
40
50Citrate M+2
Time (min)
APE
(%)
0 80 160 2400
1
2
3
4
5Citrate M+6
Time (min)
APE
(%)
0 80 160 2400
2
4
6
8Glutamate M+5
Time (min)
APE
(%)
0 80 160 2400
10
20
30Malate M+2
Time (min)
APE
(%)
0 80 160 2400
5
10
15Citrate M+3
Time (min)
APE
(%)
0 80 160 2400
10
20
30Glutamate M+2
Time (min)
APE
(%)
0 80 160 2400
5
10
15
20
25Succinate M+2
Time (min)
APE
(%)
0 80 160 2400
10
20
30Malate M+3
Time (min)
APE
(%)
0 80 160 2400
5
10
15
20Citrate M+4
Time (min)
APE
(%)
0 80 160 2400
5
10
15Glutamate M+3
Time (min)
APE
(%)
0 80 160 2400
5
10
15Succinate M+3
Time (min)
APE
(%)
0 80 160 2400
2
4
6
8
10Malate M+4
Time (min)A
PE (%
)
0 80 160 2400
5
10
15Citrate M+5
Time (min)
APE
(%)
0 80 160 2400
5
10
15Glutamate M+4
Time (min)
APE
(%)
0 80 160 2400
5
10
15Succinate M+4
Time (min)
APE
(%)
A
B C D E F
0.06 0.08 0.10 0.120
50
100
PC Flux (µM/µM Taurine/min)
Freq
uenc
y
Isotopologue FitIsotopomer Fit
SD0.009
SD0.005
G
Supplemental Figure S5 related to Figure 5 – Comparison between the use of isotopologue and isotopomer data in the CWave model for flux calculation. (A) Fit curves of the isotopologue target data for citrate, glutamate, succinate and malate from INS-1 cells incubated with 9mM [U-13C6]glucose. The red open circles correspond to the enrichment data measured. The black lines correspond to the enrichments fit by the model. (B) !!"# calculated using the isotopomer and isotopologue data. (C-D) Examples of isotopomer fits that results from unlabeled acetyl-CoA: (C) [1,2,3-13C3]citrate and (D) [1,2-13C2]citrate. (E) PDH, PC and CS fluxes calculated using isotopomer and isotopologue data. (F) Prediction of M+2 pyruvate enrichments using the isotopomer (red line) and isotopologue data (green line). The blue circles correspond to the measured data. (G) PC flux values calculated by CWave using the isotopomer (red line) and isotopologue data (green line) and their respective standard deviation of the distribution.
!
!
!
!0 80 160 240
0
1
2
3
4[1,2,3-13C3]Citrate
Time (min)
AP
E (%
)
0 80 160 2400
1
2
3
4
Time (min)
AP
E (%
)
[1,2-13C2]Citrate
Isotopomer Fit Isotopologue Fit0.00
0.02
0.04
0.06
0.08
V Lip_ d
il (µ
M / µM
Tau
rine
/ min
)
VLip_dil / VCS = 20%
PDH CS PC0.0
0.1
0.2
0.3
0.4
µM
/ µ
M T
aurin
e / m
in
Isotopomer FitIsotopologue Fit
0 80 160 2400
2
4
6
8
Pyruvate M+2
Time (min)
APE
(%)
Isotopologue FitIsotopomer Fit
!!!!
0 80 160 2400
10
20
30
40
50Citrate M+2
Time (min)
APE
(%)
0 80 160 2400
1
2
3
4
5Citrate M+6
Time (min)
APE
(%)
0 80 160 2400
2
4
6
8Glutamate M+5
Time (min)
APE
(%)
0 80 160 2400
10
20
30Malate M+2
Time (min)
APE
(%)
0 80 160 2400
5
10
15Citrate M+3
Time (min)
APE
(%)
0 80 160 2400
10
20
30Glutamate M+2
Time (min)
APE
(%)
0 80 160 2400
5
10
15
20
25Succinate M+2
Time (min)
APE
(%)
0 80 160 2400
10
20
30Malate M+3
Time (min)
APE
(%)
0 80 160 2400
5
10
15
20Citrate M+4
Time (min)
APE
(%)
0 80 160 2400
5
10
15Glutamate M+3
Time (min)
APE
(%)
0 80 160 2400
5
10
15Succinate M+3
Time (min)
APE
(%)
0 80 160 2400
2
4
6
8
10Malate M+4
Time (min)
APE
(%)
0 80 160 2400
5
10
15Citrate M+5
Time (min)
APE
(%)
0 80 160 2400
5
10
15Glutamate M+4
Time (min)
APE
(%)
0 80 160 2400
5
10
15Succinate M+4
Time (min)
APE
(%)
A
B C D E F
0.06 0.08 0.10 0.120
50
100
PC Flux (µM/µM Taurine/min)
Freq
uenc
y
Isotopologue FitIsotopomer Fit
SD0.009
SD0.005
G
Supplemental Figure S5 related to Figure 5 – Comparison between the use of isotopologue and isotopomer data in the CWave model for flux calculation. (A) Fit curves of the isotopologue target data for citrate, glutamate, succinate and malate from INS-1 cells incubated with 9mM [U-13C6]glucose. The red open circles correspond to the enrichment data measured. The black lines correspond to the enrichments fit by the model. (B) !!"# calculated using the isotopomer and isotopologue data. (C-D) Examples of isotopomer fits that results from unlabeled acetyl-CoA: (C) [1,2,3-13C3]citrate and (D) [1,2-13C2]citrate. (E) PDH, PC and CS fluxes calculated using isotopomer and isotopologue data. (F) Prediction of M+2 pyruvate enrichments using the isotopomer (red line) and isotopologue data (green line). The blue circles correspond to the measured data. (G) PC flux values calculated by CWave using the isotopomer (red line) and isotopologue data (green line) and their respective standard deviation of the distribution.

Succinate
MalateαKG
Pyruvate
PEP
OAA
Acetyl-CoA
Citrate
VPDH
VPC
VME
VPK
VCS
VICDH
GlutamateVX
Vβ-OxidaNon
VPEPCK
Glutamine
VGlutaminase
VLipogenesis
MIMOSAMassIsotopomerMul?-OrdinateSpectralAnalysis
[U-13C6]Glucose
Alvesetal,CellMetab2015
VSDH
Malonyl-CoA
Fa]yAcids

PyruvateCarboxylase(PC)isthemostresponsivefluxtochangesinglucoseconcentraNonsinINS-1
Alvesetal,CellMetab2015
G2.5 G5 G7 G90.0
0.1
0.2
0.3
Flux
es
(µM
/ µM
Tau
rine
/ min
)
VPDH
VCS
VPC
Vβ-Ox
VICDH
G2.5 G5 G7 G90
100
200
300
400
500
Insu
lin (n
g/hr
/mg
prot
ein)
P < 0.05
P < 0.001
0 1 2 3 40
20
40
60
80
100
Insulin (Normalized to G2.5)
Flux
es (N
orm
aliz
ed to
G2.
5)
VPDHR2 = 0.968
VPCR2 = 0.957
MIMOSA Workflow
Integration (MS/MS)
P/D Natural Abundance
Isotopomer Deconvolvement
Φ (Steady state) ν (dynamic)
http://elucidata.io/el-maven

Caveat Emptor • Concentration ≠Flux • Enrichment ≠Flux • Fate map ≠Flux map • Cycles ≠Rings • Steady State ≠ Kinetic • Exponential fit ≠ single point • TCA turns more than once • Reversible reactions matter • Location, Location, Location • MIMOSA: not just for brunch

MIMOSA:highsensiNvityofmassspectrometrywiththeposiNonspecificityof13C-labeling
SuccinateMalate
αKG
Pyruvate
PEP
OAA
Acetyl-CoA
Citrate
VCS
RawMassSpec
M+2M+3M+4M+5M+6 vs
PCLabel TCALabel
vs
PDHLabeledAcetyl-CoA UnlabeledAcetyl-CoA
1stturnTCA 2ndturnTCA
vs
Glucose

THANK YOU!! • Abudukadier Abulizi • Tiago Alves • Rebecca Cardone • Gary Cline • Joelle Hillion • Selin Isguven • Sean Jesinkey • Anila Madiraju • Graeme Mason • Rachel Perry • Raaisa • Doug Rothman • Stephan Siebel • Gerald Shulman • Romana Stark • Bei Wang • OrLando Yarbarough • Xiaojian Zhao • Lingjun Ma
TCA rate RPM x10000
1 2
3 4 5 6
7
8 9
6.5
www.elucidata.io
Thank YouAbhishek Jha