Embed Size (px)
Citation preview
RCC LIPI
?
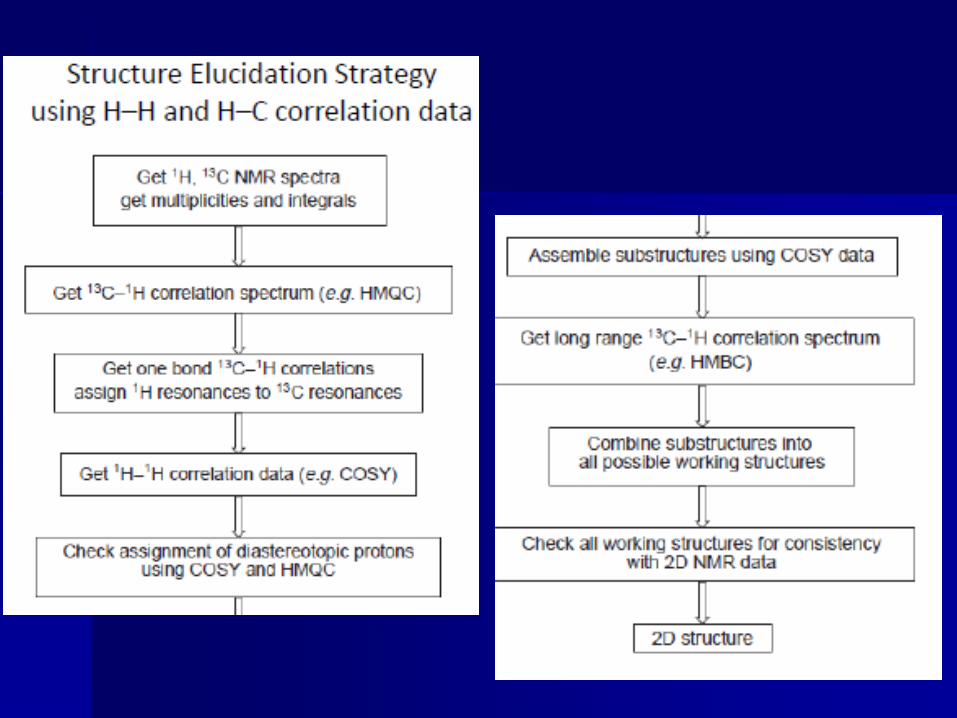
PRINSIP DAN STRATEGI ELUSIDASI STRUKTUR
1D NMR
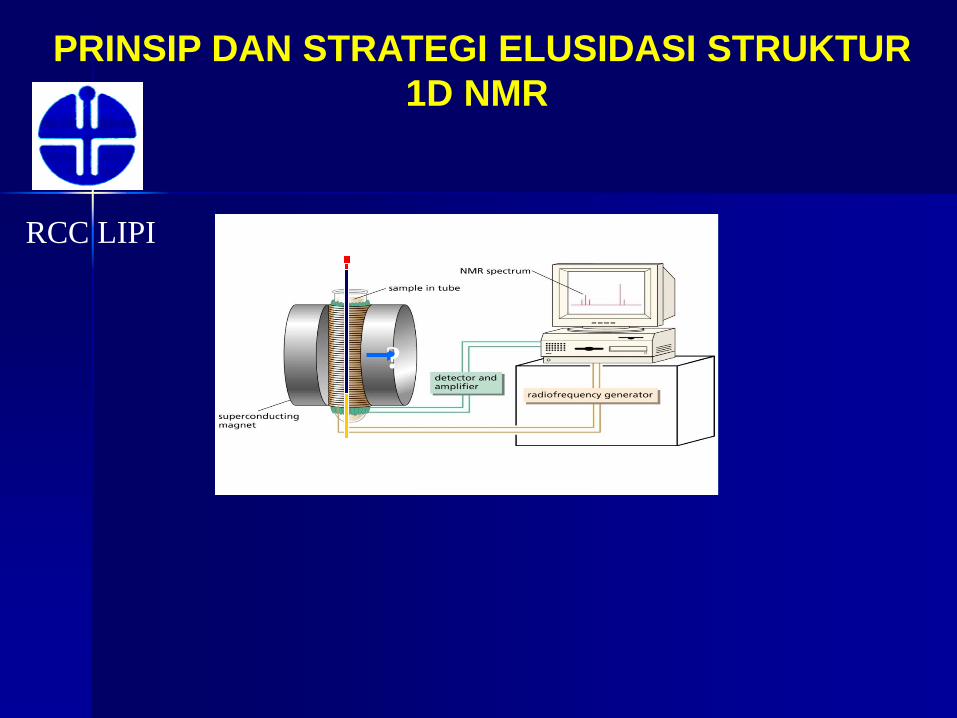
•Mass Spectrum : MW (M+), Formulae, Fragmentation
• FT-IR : Functional group (-OH, -C=O, -COOR, Ar, -C=C-)
•Spectroscopy NMR :Chemical Shift information provides a clue about the
electronic environment of the nucleus (spin-spin splitting between one
nucleus)
• Identification of species : genus/spesies,
• Chemical constents : flavonoiid, xanthone, saponin, etc
• Searching data base (Constituents), Chemical shift prediction (ChemDraw)
OOO
H
H
5.96
7.09
7.19
6.72
6.72
7.19
3.73
4.19 1.30
ChemNMR Prediction Result:
OOO
117.6
165.0
142.8
127.2
127.2
114.0
161.2
114.0
127.2
56.0
59.6 13.7ChemNMR Prediction Result:
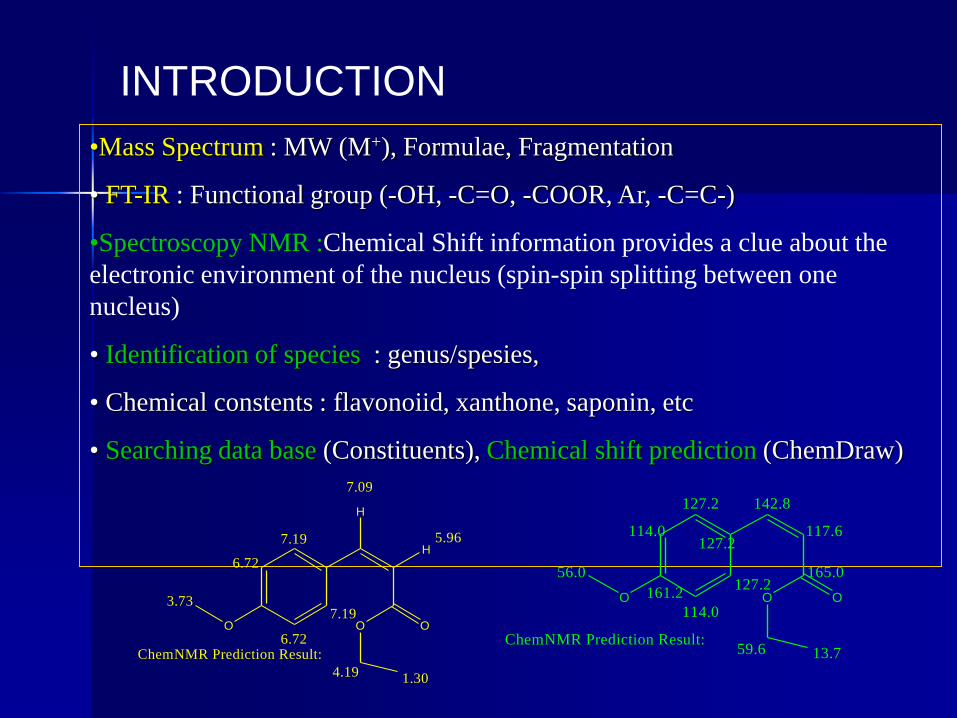
INTRODUCTION
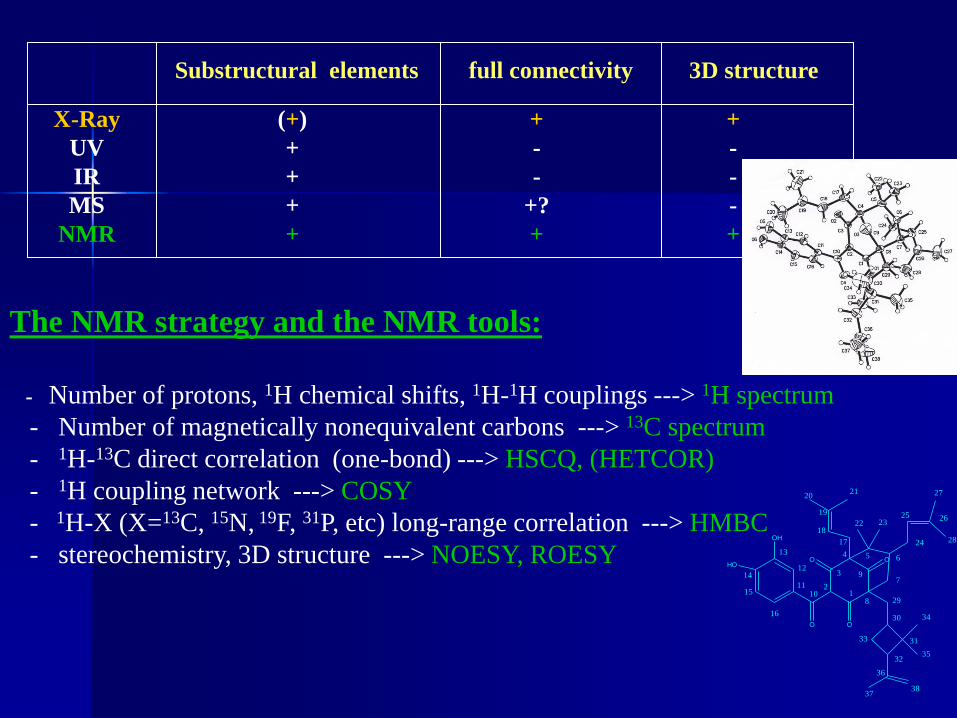
Substructural elements full connectivity 3D structure
X-Ray
UV
IR
MS
NMR
+
-
-
-
+
+
-
-
+?
+
(+)
+
+
+
+
The NMR strategy and the NMR tools:
- Number of protons, 1H chemical shifts, 1H-1H couplings ---> 1H spectrum
- Number of magnetically nonequivalent carbons ---> 13C spectrum
- 1H-13C direct correlation (one-bond) ---> HSCQ, (HETCOR)
- 1H coupling network ---> COSY
- 1H-X (X=13C, 15N, 19F, 31P, etc) long-range correlation ---> HMBC
- stereochemistry, 3D structure ---> NOESY, ROESY O O
O O
HO
OH
12
3
4 5 6
7
8
9
1011
12
13
14
15
16
17
18
19
2021
22 23
24
25 26
27
28
29
30
31
32
33
36
34
35
3837
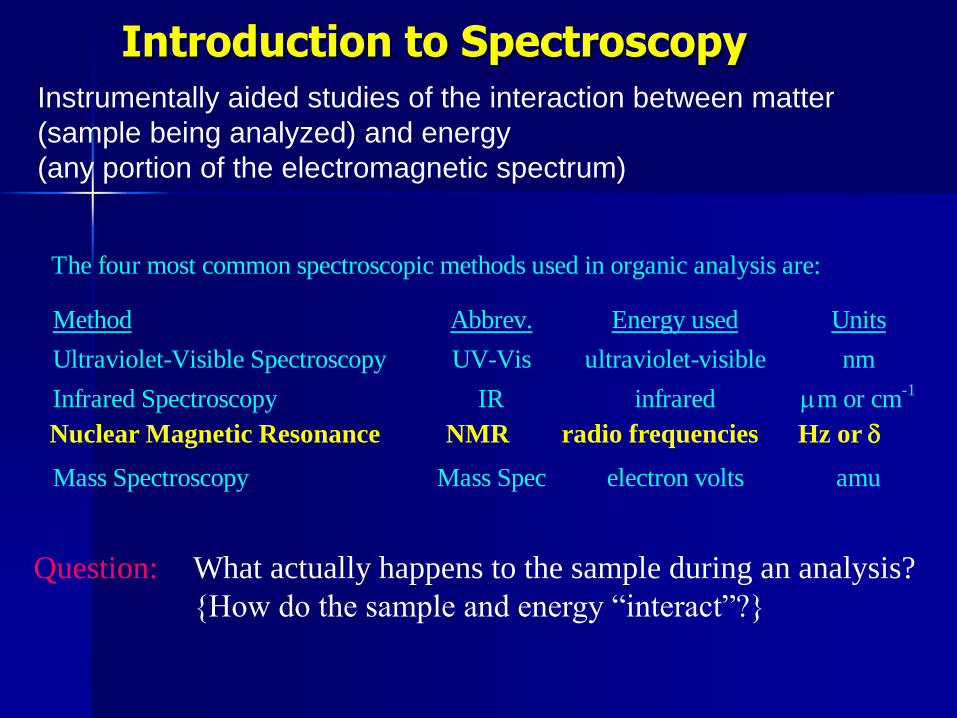
Introduction to Spectroscopy
Instrumentally aided studies of the interactions between matter (sample being
analyzed) and energy (any portion of the electromagnetic spectrum, EMS)
The four most common spectroscopic methods used in organic analysis are:
Method Abbrev. Energy used Units
Ultraviolet-Visible Spectroscopy UV-Vis ultraviolet-visible nm
Infrared Spectroscopy IR infrared m or cm-1
Mass Spectroscopy Mass Spec electron volts amu
What actually happens to the sample during an analysis?
{How do the sample and energy “interact”?}
Question:
Nuclear Magnetic Resonance NMR radio frequencies Hz or d
Instrumentally aided studies of the interaction between matter
(sample being analyzed) and energy
(any portion of the electromagnetic spectrum)
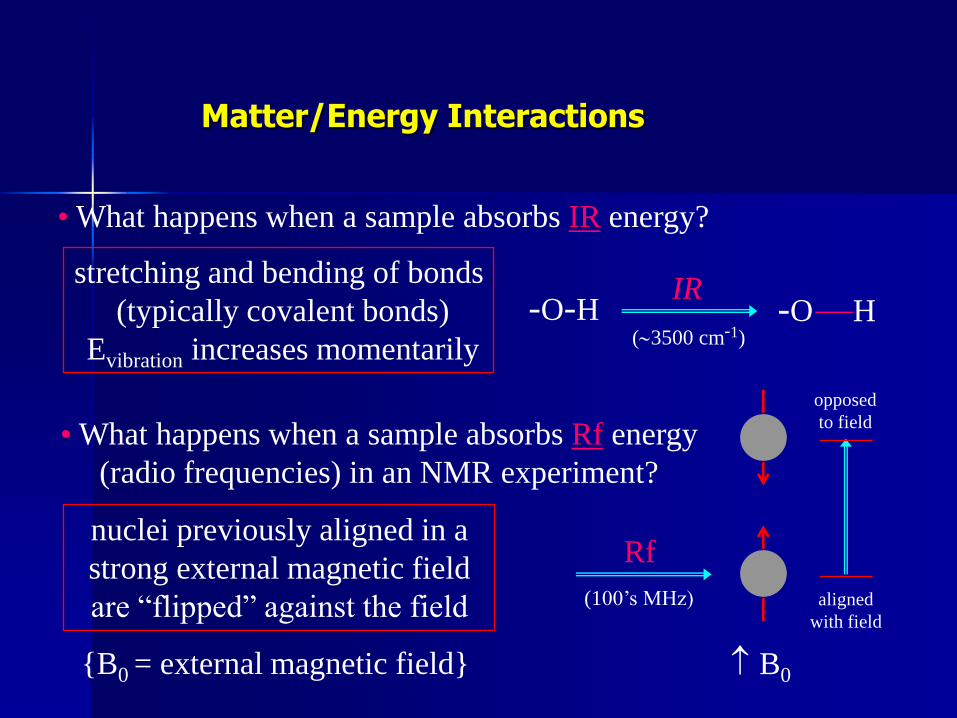
Matter/Energy Interactions
• What happens when a sample absorbs IR energy?
stretching and bending of bonds
(typically covalent bonds)
Evibration increases momentarily
IR -O-H -O
(3500 cm-1)
—H
• What happens when a sample absorbs Rf energy
(radio frequencies) in an NMR experiment?
nuclei previously aligned in a
strong external magnetic field
are “flipped” against the field
Rf
(100’s MHz) aligned
with field
opposed
to field
{B0 = external magnetic field} B0
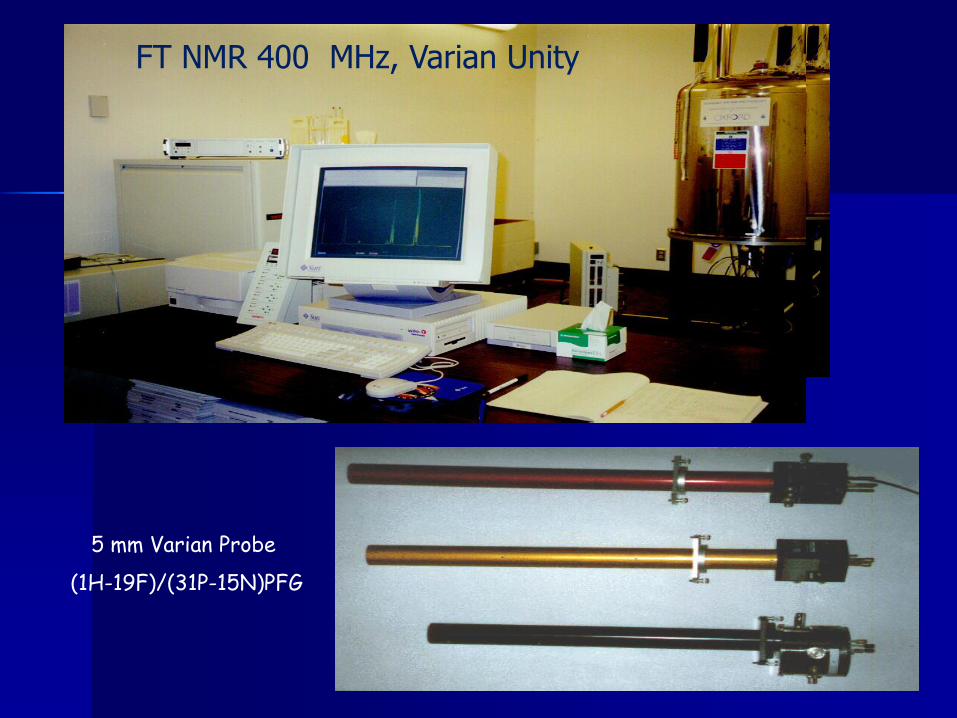
5 mm Varian Probe
(1H-19F)/(31P-15N)PFG
FT NMR 400 MHz, Varian Unity
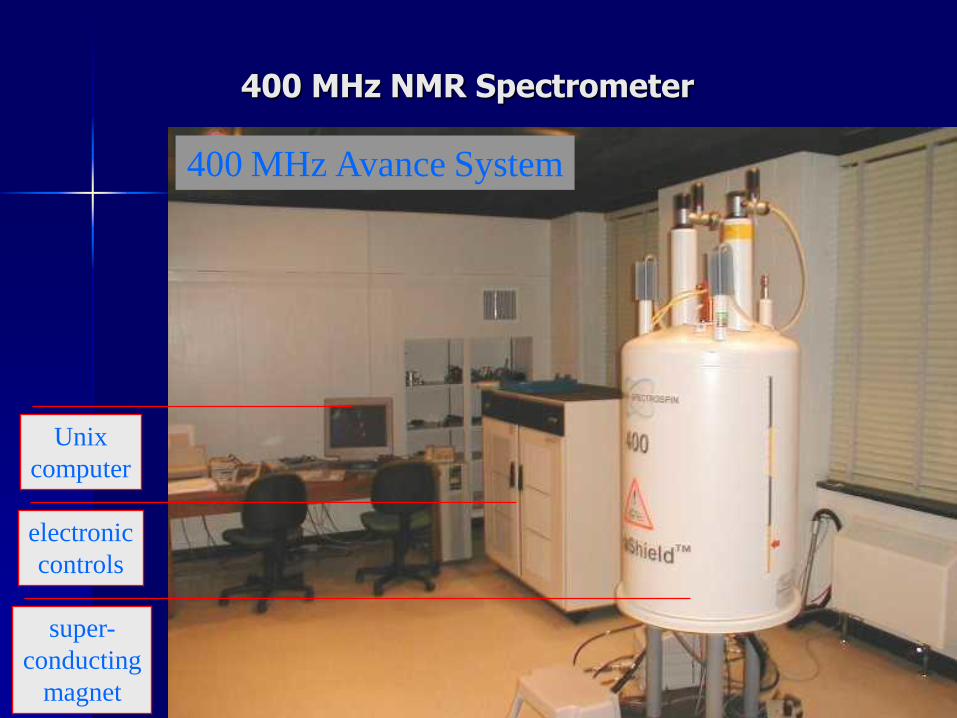
400 MHz NMR Spectrometer
400 MHz Avance System
Unix
computer
electronic
controls
super-
conducting
magnet
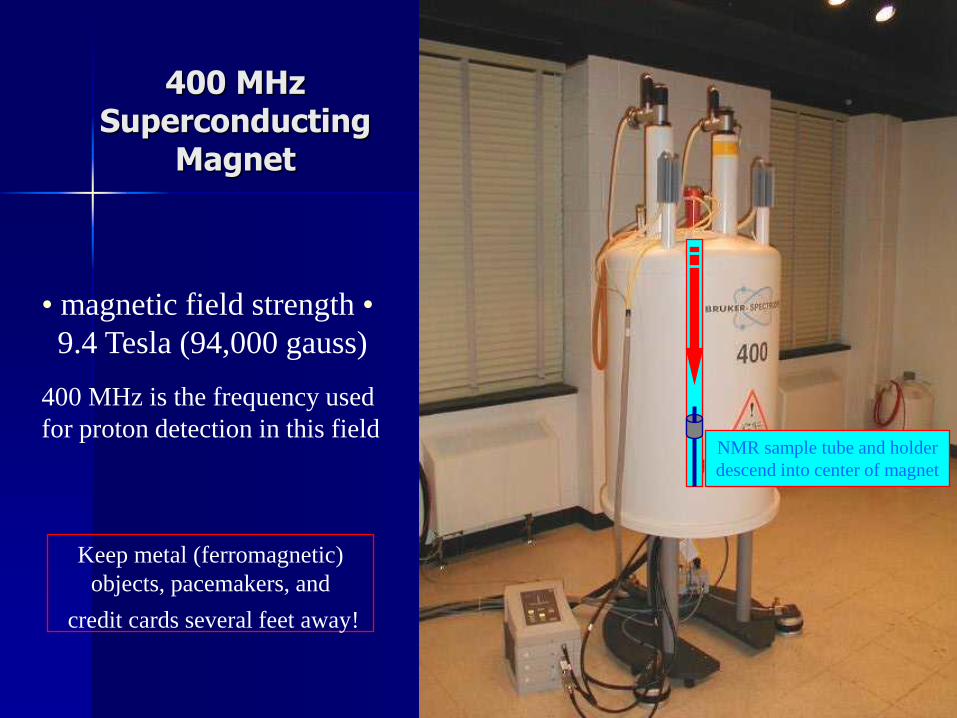
400 MHz Superconducting
Magnet
• magnetic field strength •
9.4 Tesla (94,000 gauss)
400 MHz is the frequency used
for proton detection in this field NMR sample tube and holder
descend into center of magnet
Keep metal (ferromagnetic)
objects, pacemakers, and
credit cards several feet away!
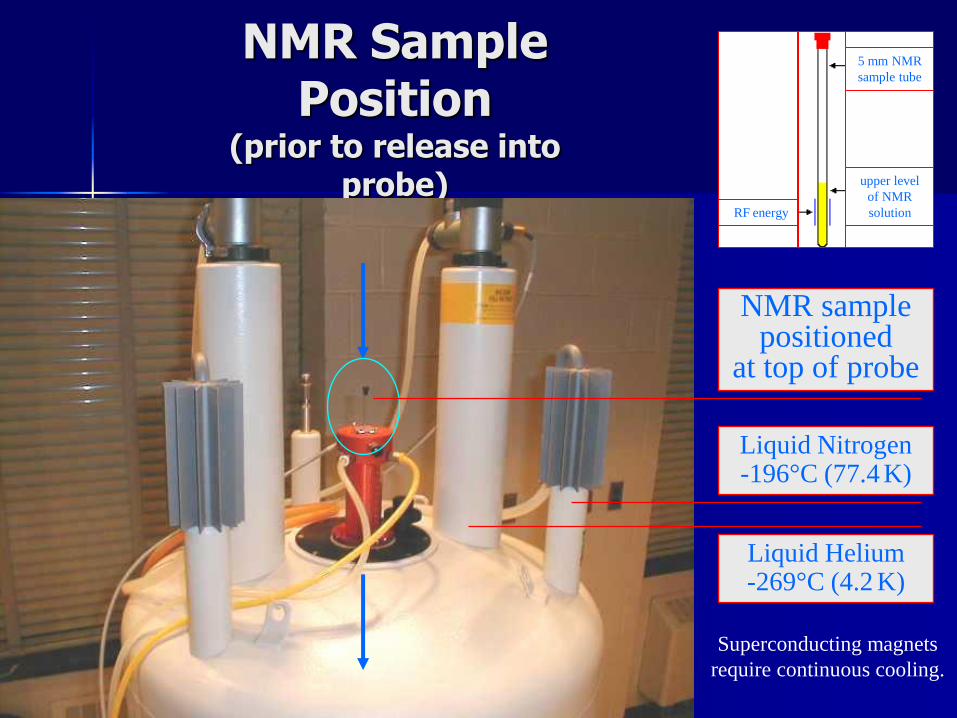
NMR Sample Position
(prior to release into probe)
Liquid Helium -269°C (4.2 K)
Liquid Nitrogen -196°C (77.4 K)
NMR sample positioned
at top of probe
Superconducting magnets
require continuous cooling.
5 mm NMR
sample tube
RF energy
upper level
of NMR
solution
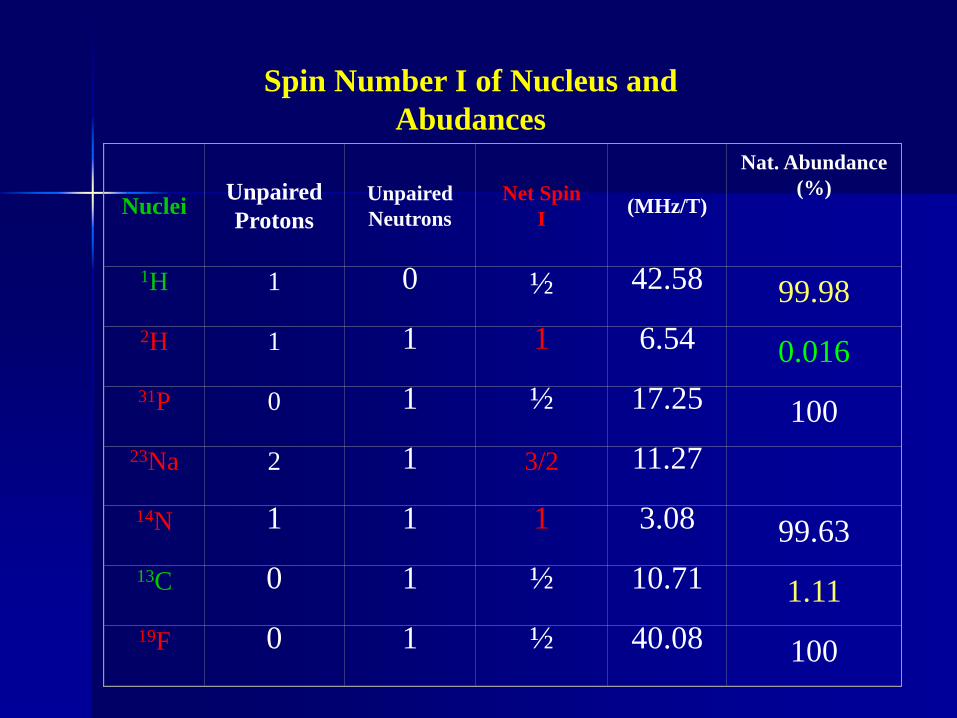
Spin Number I of Nucleus and
Abudances
Nuclei Unpaired
Protons
Unpaired
Neutrons
Net Spin
I (MHz/T)
Nat. Abundance
(%)
1H
1
0
½
42.58
99.98
2H
1
1
1
6.54
0.016
31P
0
1
½
17.25
100
23Na
2
1
3/2
11.27
14N
1
1
1
3.08
99.63
13C
0
1
½
10.71
1.11
19F
0
1
½
40.08
100
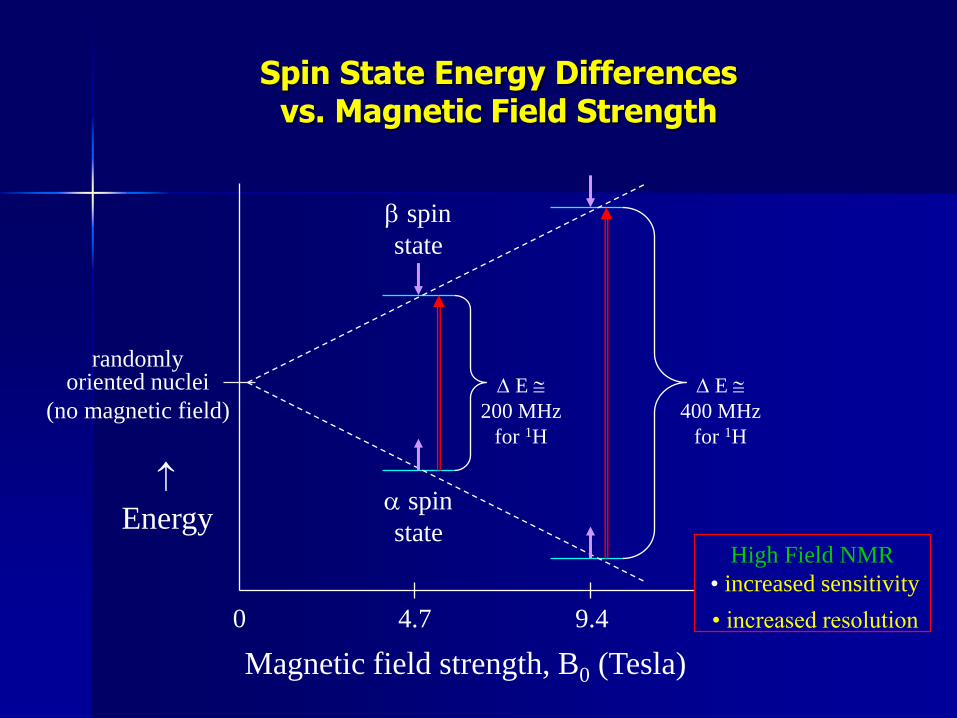
Spin State Energy Differences vs. Magnetic Field Strength
0 4.7 9.4
Energy
Magnetic field strength, B0 (Tesla)
E
200 MHz
for 1H
a spin
state
b spin
state
E
400 MHz
for 1H
High Field NMR
• increased sensitivity
• increased resolution
randomly oriented nuclei
(no magnetic field)
OHO
O O
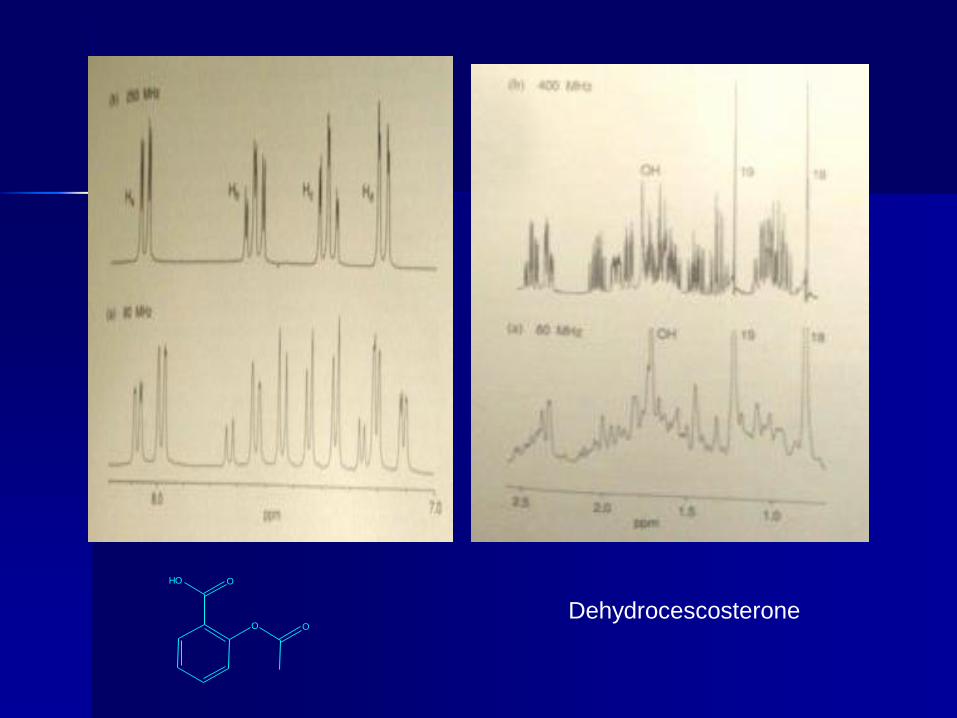
Dehydrocescosterone

Chapter 13 17
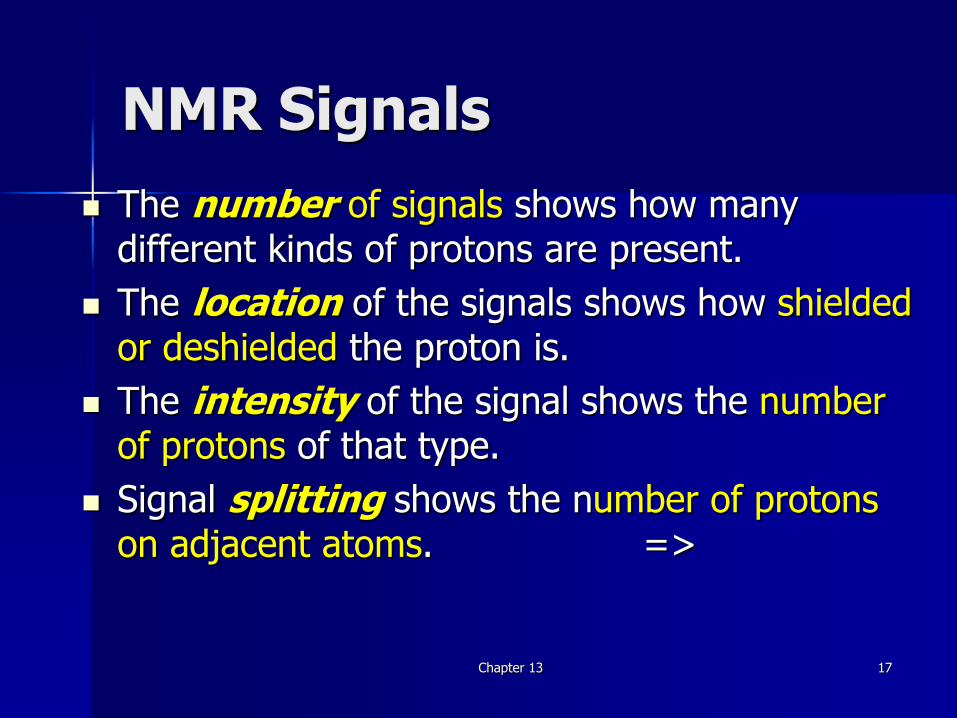
NMR Signals
The number of signals shows how many different kinds of protons are present.
The location of the signals shows how shielded or deshielded the proton is.
The intensity of the signal shows the number of protons of that type.
Signal splitting shows the number of protons on adjacent atoms. =>
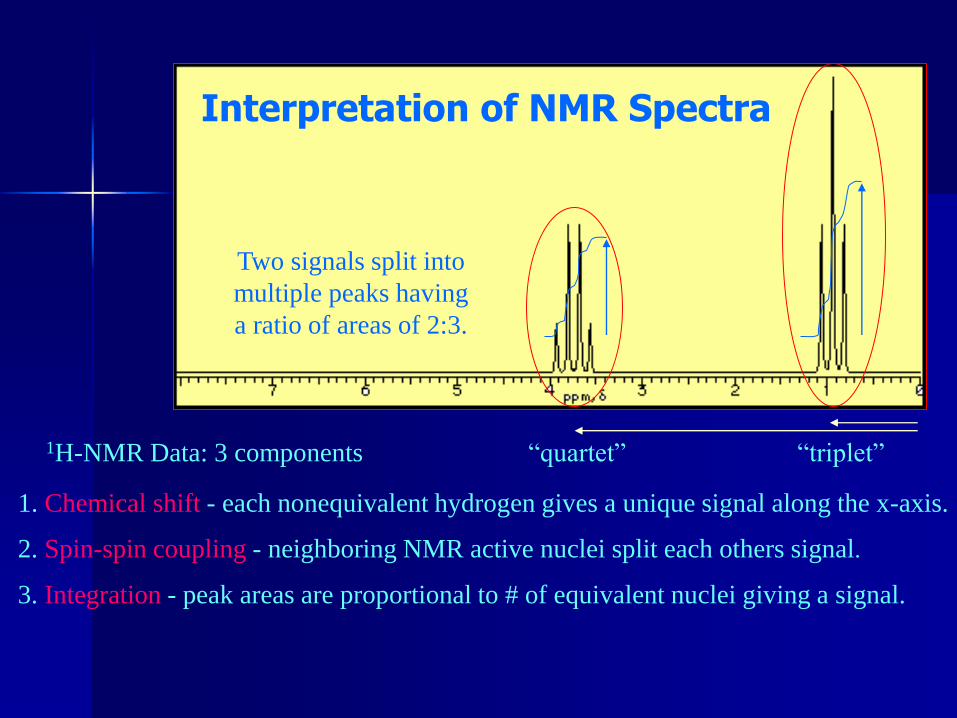
1. Chemical shift - each nonequivalent hydrogen gives a unique signal along the x-axis.
1H-NMR Data: 3 components
2. Spin-spin coupling - neighboring NMR active nuclei split each others signal.
3. Integration - peak areas are proportional to # of equivalent nuclei giving a signal.
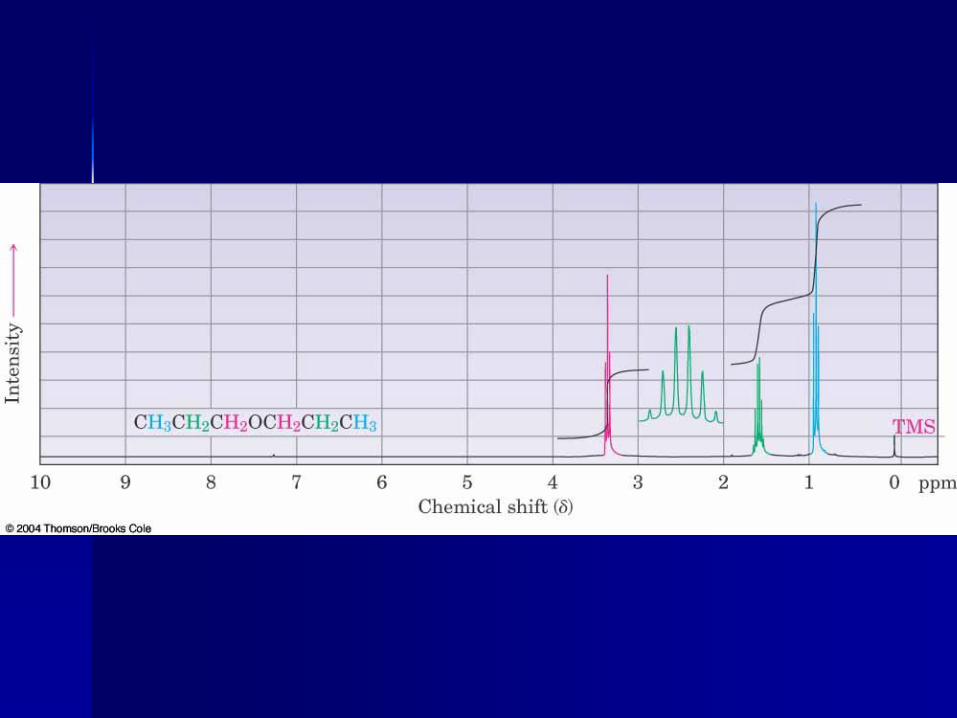
Interpretation of NMR Spectra
Two signals split into
multiple peaks having
a ratio of areas of 2:3.
“quartet” “triplet”
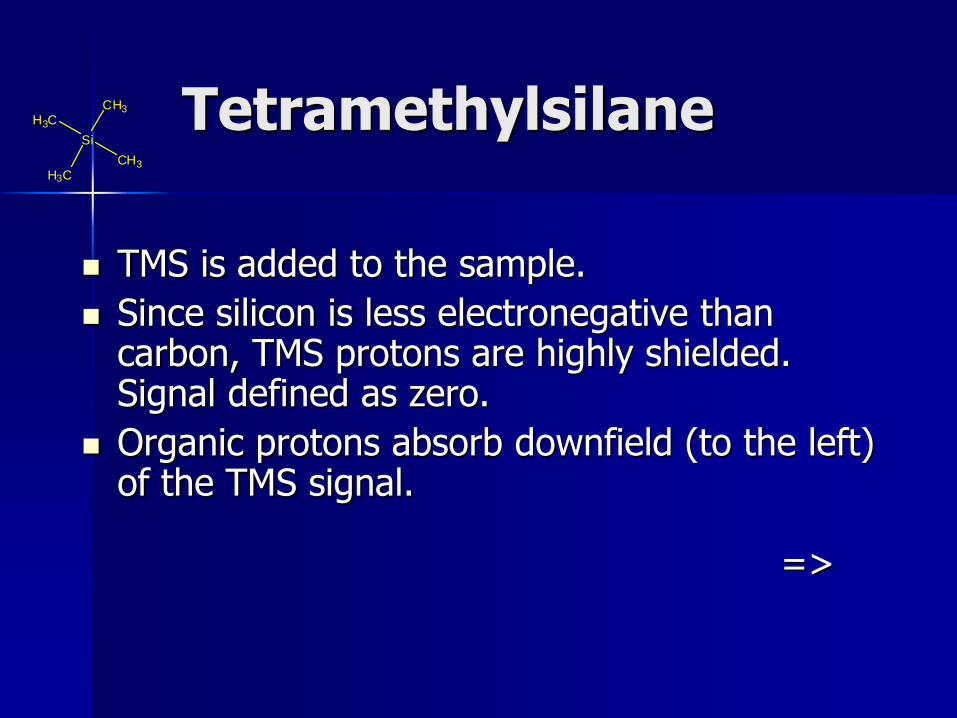
Tetramethylsilane
TMS is added to the sample.
Since silicon is less electronegative than carbon, TMS protons are highly shielded. Signal defined as zero.
Organic protons absorb downfield (to the left) of the TMS signal. =>
Si
H3C
H3C
CH3
CH3
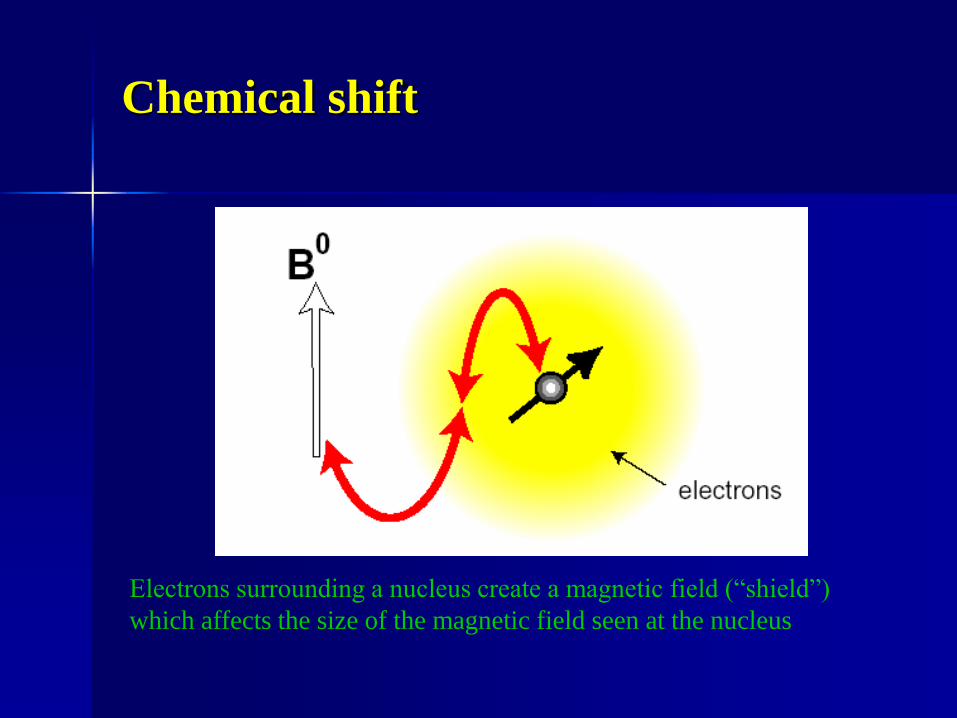
Chemical shift
Electrons surrounding a nucleus create a magnetic field (“shield”)
which affects the size of the magnetic field seen at the nucleus
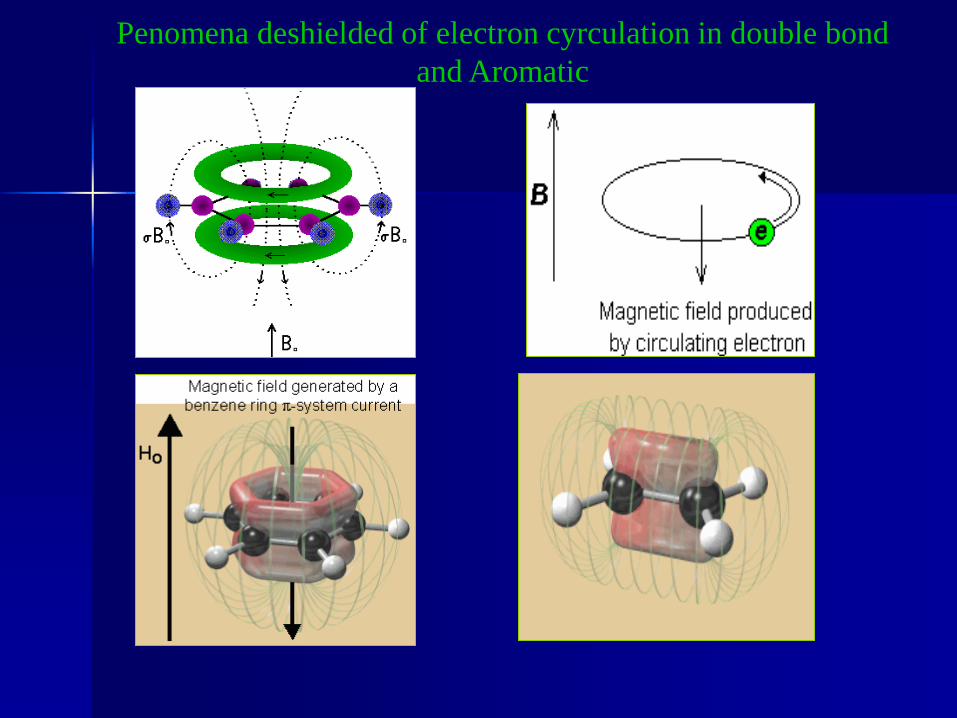
Penomena deshielded of electron cyrculation in double bond
and Aromatic
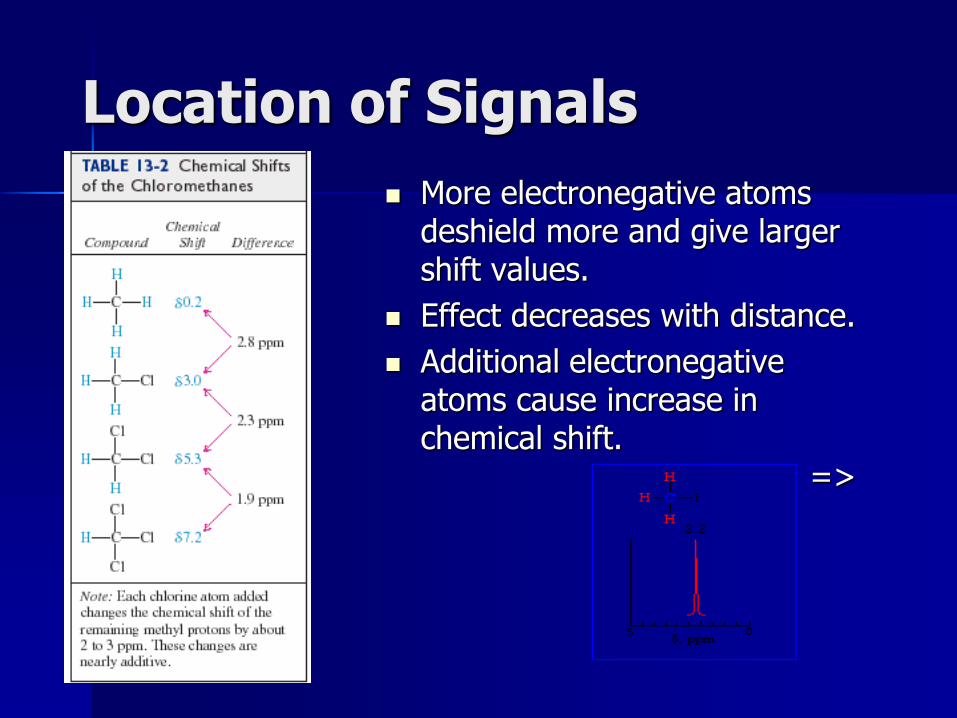
Location of Signals
More electronegative atoms deshield more and give larger shift values.
Effect decreases with distance.
Additional electronegative atoms cause increase in chemical shift. =>
Chapter 13 23
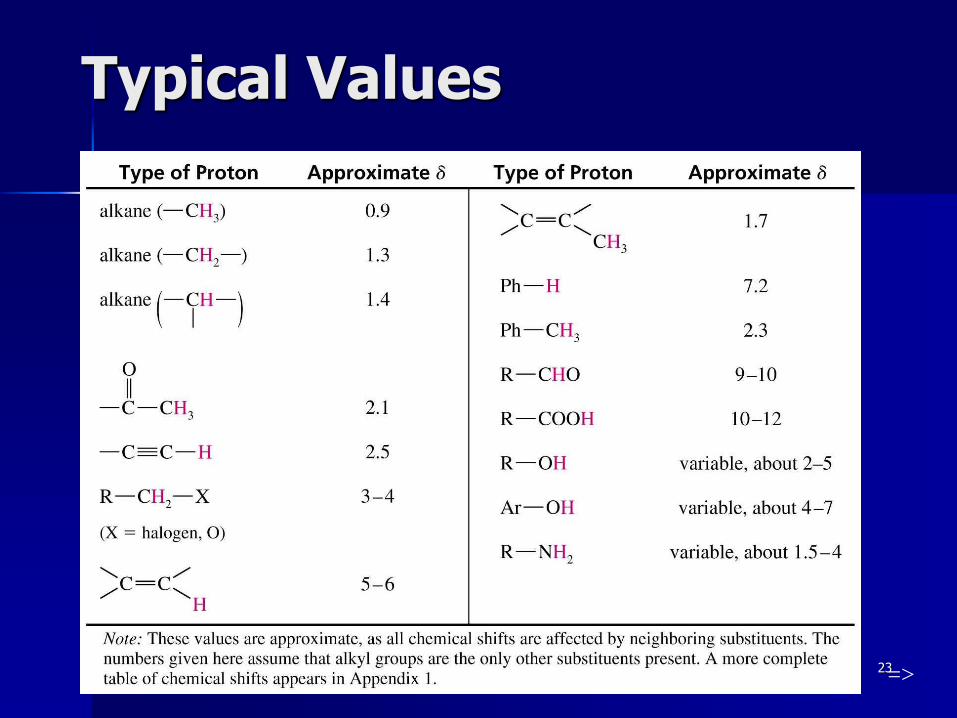
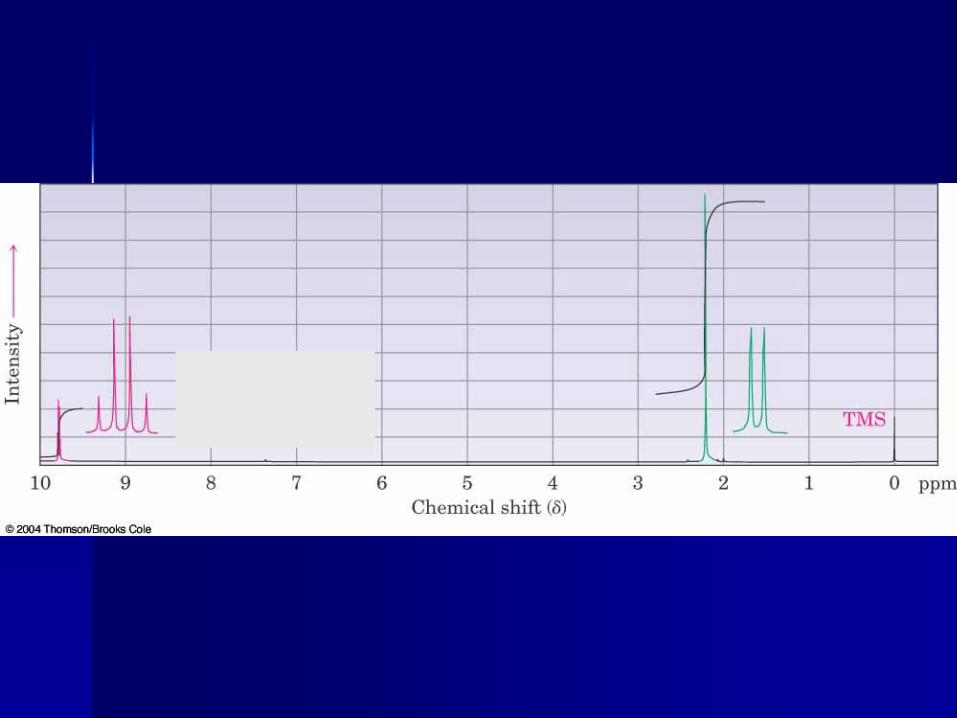
Typical Values
=>
O-H and N-H Signals
Chemical shift depends on concentration.
Hydrogen bonding in concentrated solutions deshield the protons, so signal is around d 3.5 for N-H and d 4.5 for O-H.
Proton exchanges between the molecules broaden the peak.
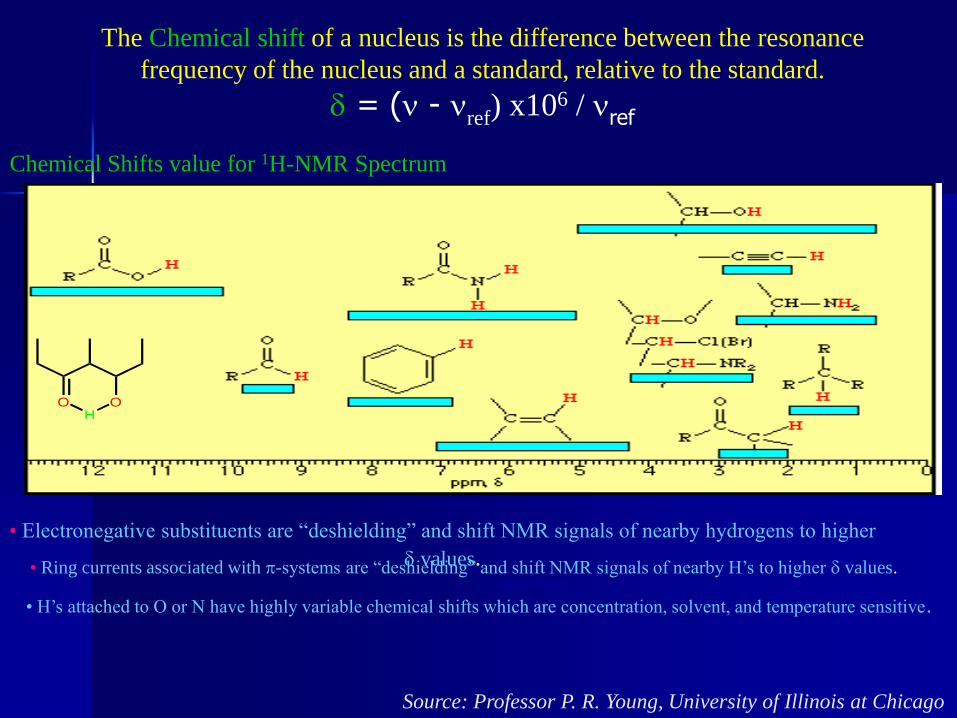
The Chemical shift of a nucleus is the difference between the resonance
frequency of the nucleus and a standard, relative to the standard.
d = (n - nref) x106 / nref
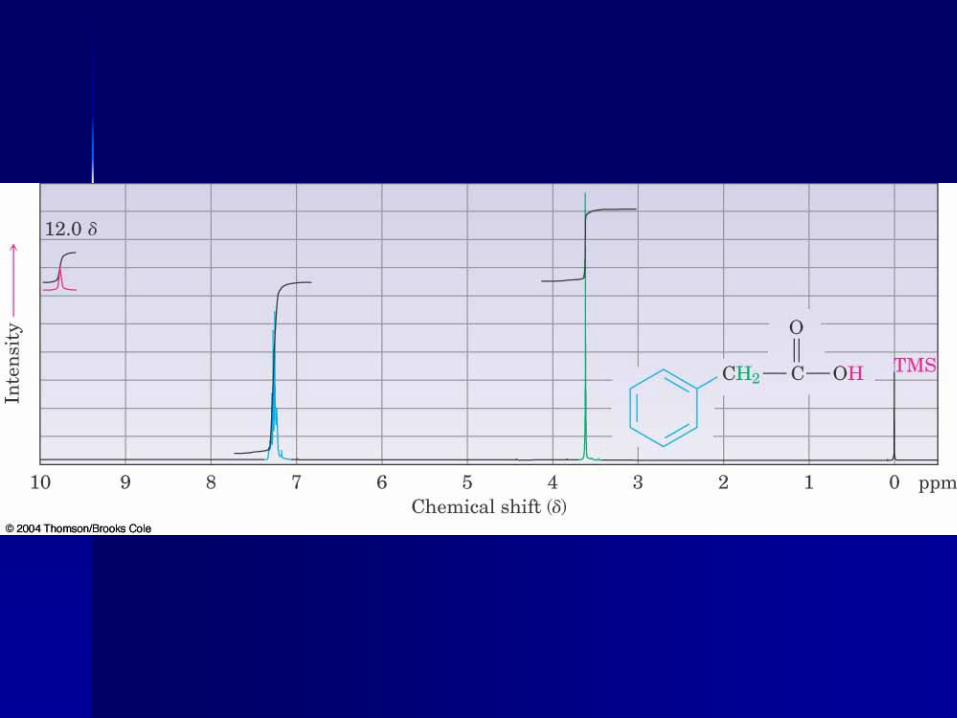
O OH
Chemical Shifts value for 1H-NMR Spectrum
Downfield
• Electronegative substituents are “deshielding” and shift NMR signals of nearby hydrogens to higher
d values.
• Ring currents associated with p-systems are “deshielding” and shift NMR signals of nearby H’s to higher d values.
• H’s attached to O or N have highly variable chemical shifts which are concentration, solvent, and temperature sensitive.
Source: Professor P. R. Young, University of Illinois at Chicago
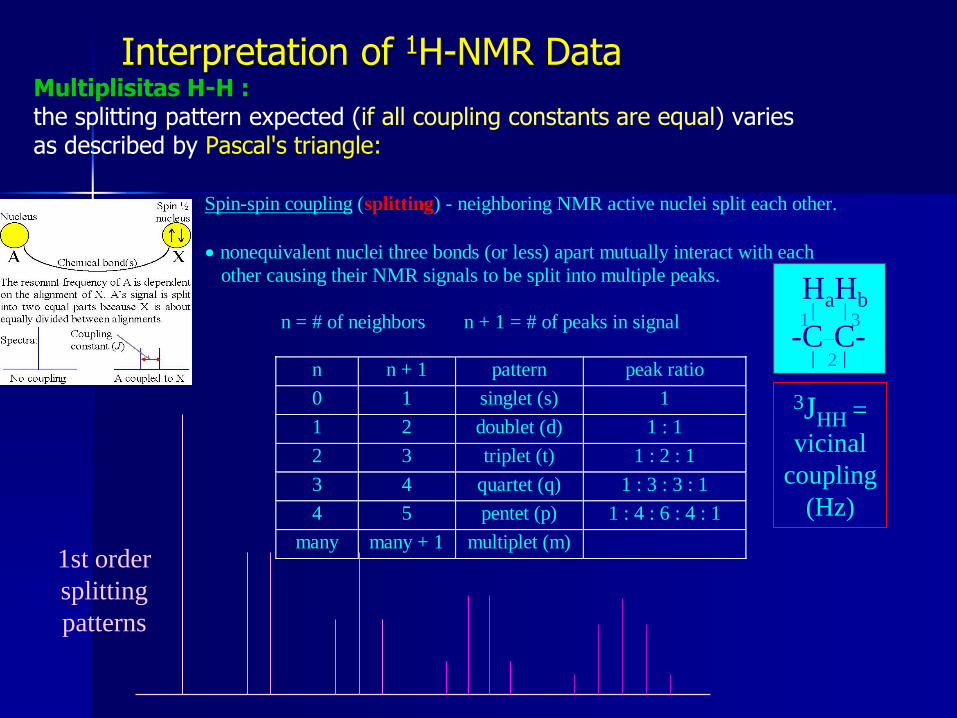
Interpretation of 1H-NMR Data Multiplisitas H-H : the splitting pattern expected (if all coupling constants are equal) varies as described by Pascal's triangle:
Spin-spin coupling (splitting) - neighboring NMR active nuclei split each other.
nonequivalent nuclei three bonds (or less) apart mutually interact with each
other causing their NMR signals to be split into multiple peaks.
n = # of neighbors n + 1 = # of peaks in signal
n n + 1 pattern peak ratio
0 1 singlet (s) 1
1 2 doublet (d) 1 : 1
2 3 triplet (t) 1 : 2 : 1
3 4 quartet (q) 1 : 3 : 3 : 1
4 5 pentet (p) 1 : 4 : 6 : 4 : 1
many many + 1 multiplet (m)
HaHb | |
-C—C- | |
3JHH =
vicinal
coupling
(Hz)
1st order
splitting
patterns
1
2
3
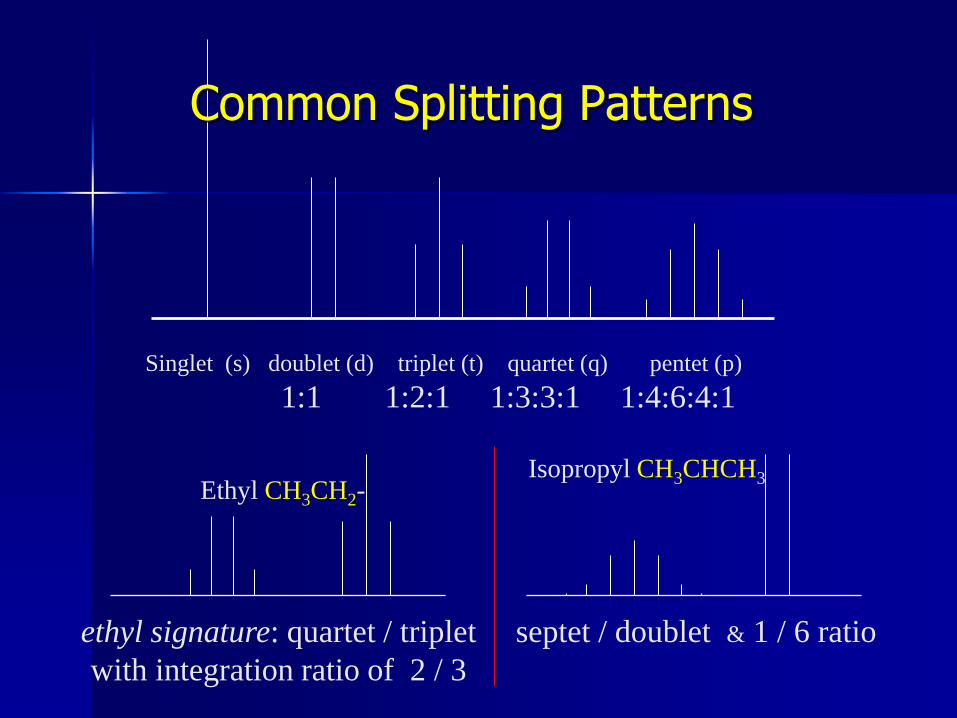
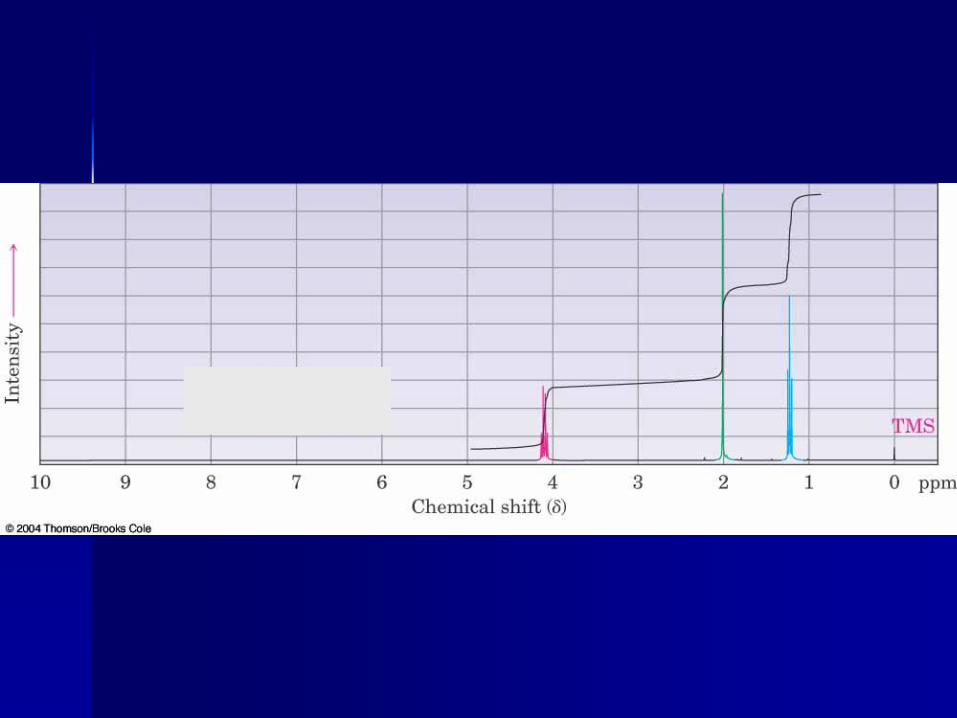
Ethyl CH3CH2- Isopropyl CH3CHCH3
Singlet (s) doublet (d) triplet (t) quartet (q) pentet (p)
1:1 1:2:1 1:3:3:1 1:4:6:4:1
Common Splitting Patterns
ethyl signature: quartet / triplet
with integration ratio of 2 / 3
septet / doublet & 1 / 6 ratio
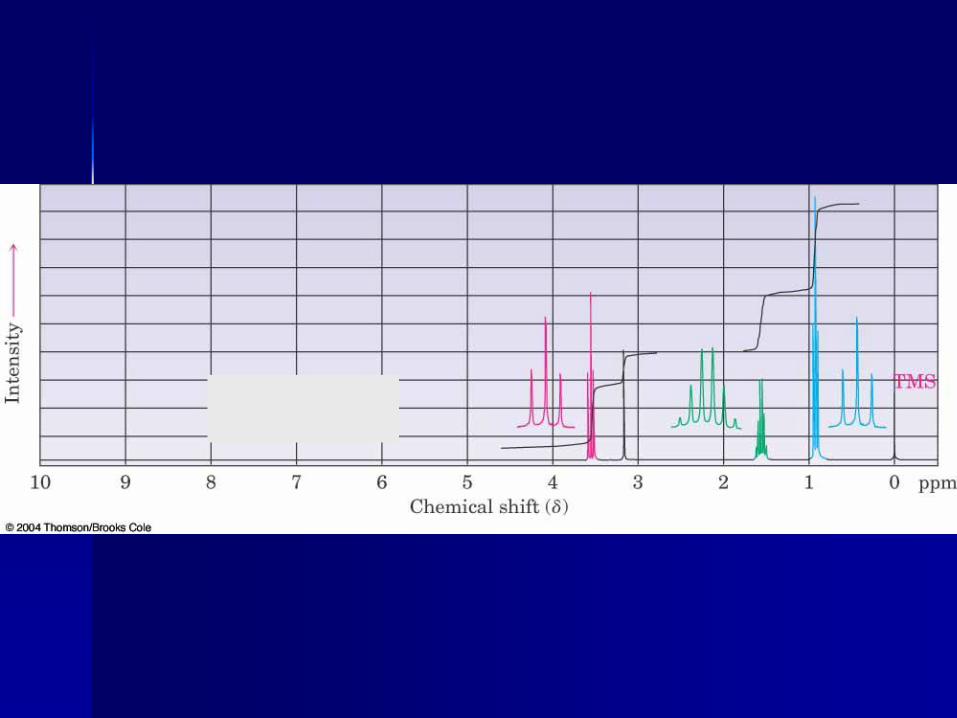

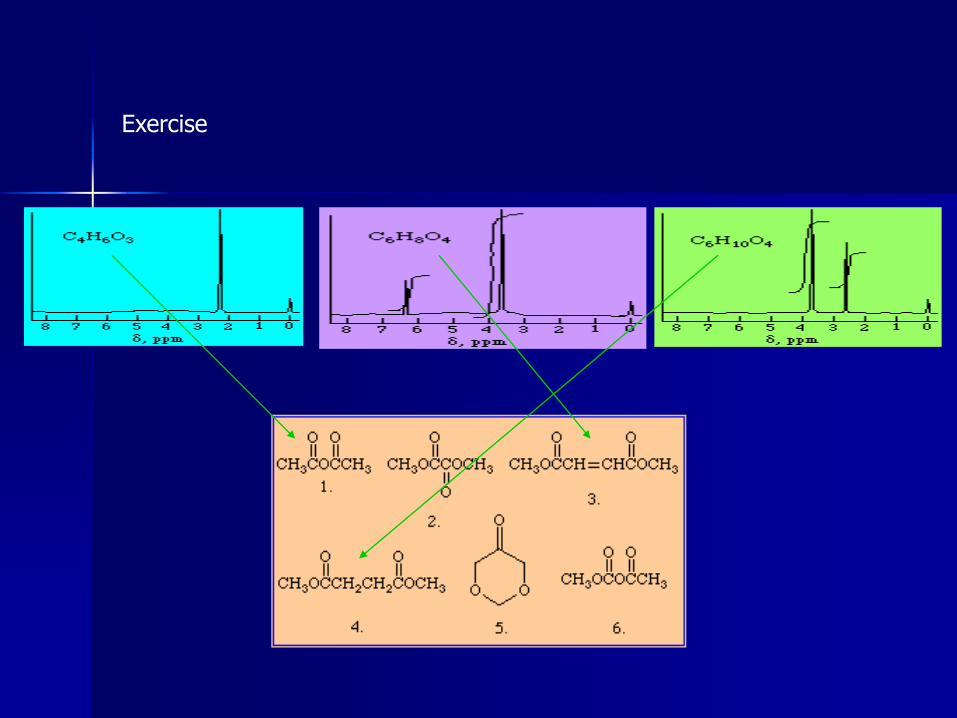
Exercise
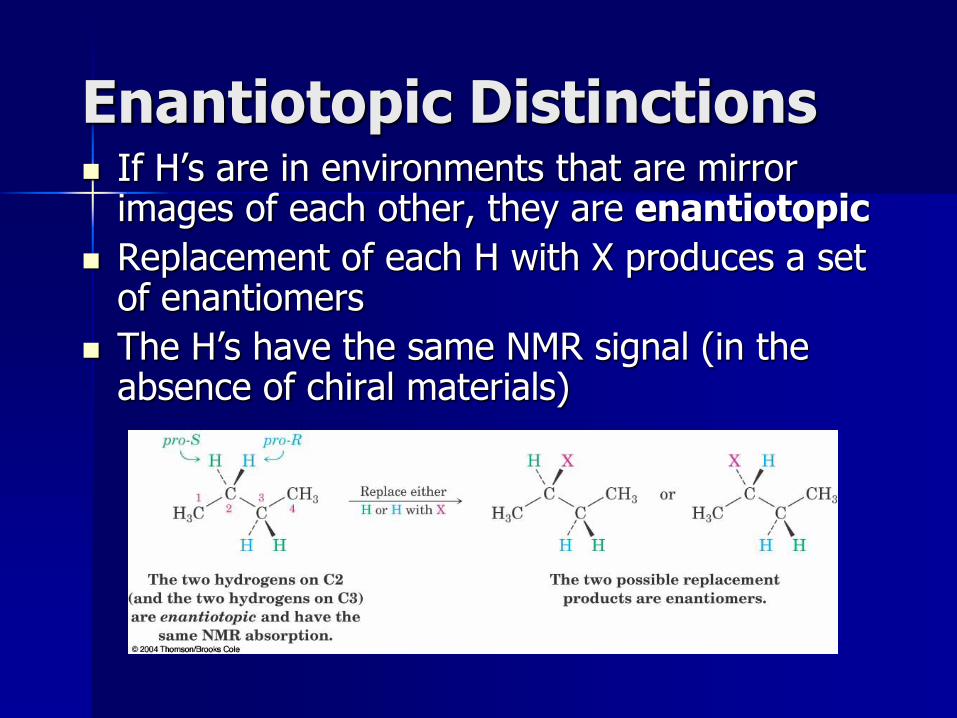
Enantiotopic Distinctions If H’s are in environments that are mirror
images of each other, they are enantiotopic
Replacement of each H with X produces a set of enantiomers
The H’s have the same NMR signal (in the absence of chiral materials)
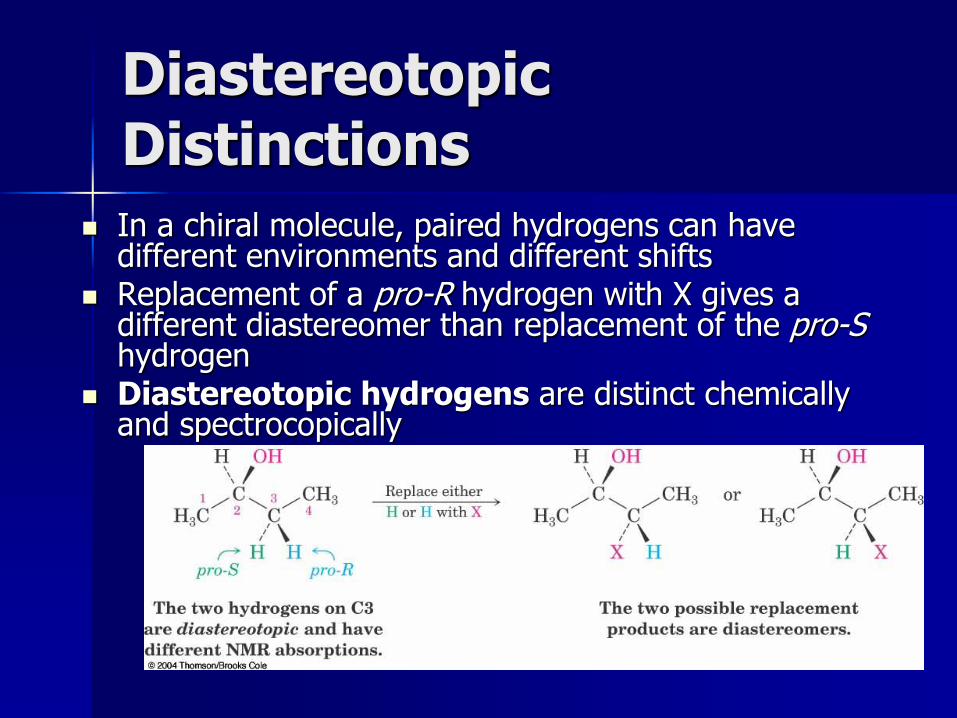
Diastereotopic Distinctions
In a chiral molecule, paired hydrogens can have different environments and different shifts
Replacement of a pro-R hydrogen with X gives a different diastereomer than replacement of the pro-S hydrogen
Diastereotopic hydrogens are distinct chemically and spectrocopically
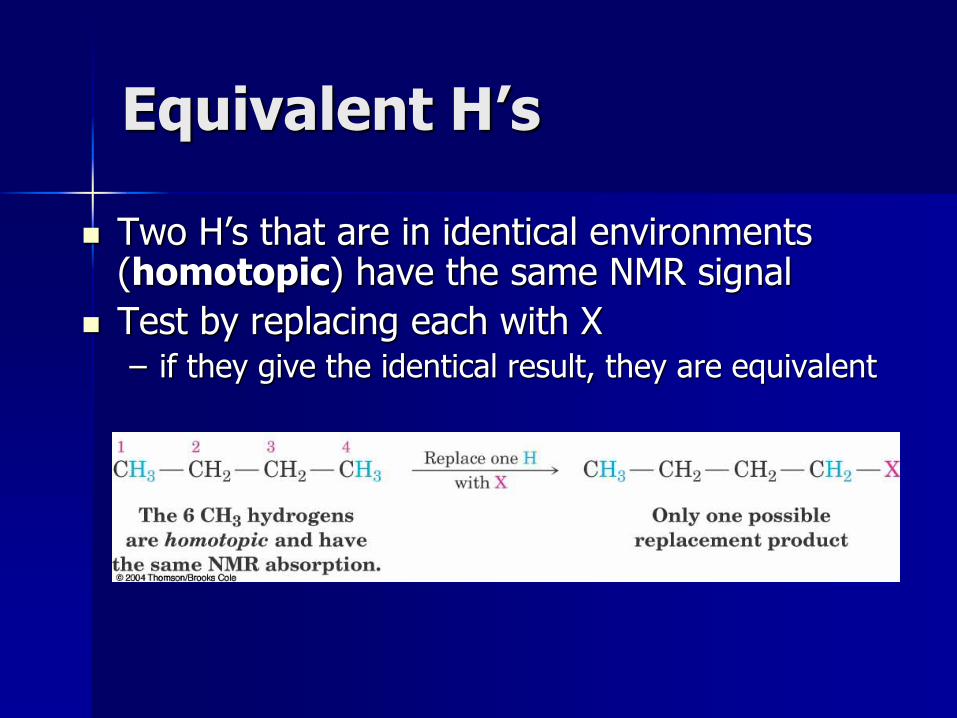
Equivalent H’s
Two H’s that are in identical environments (homotopic) have the same NMR signal
Test by replacing each with X – if they give the identical result, they are equivalent
O
CH3
H
H
H
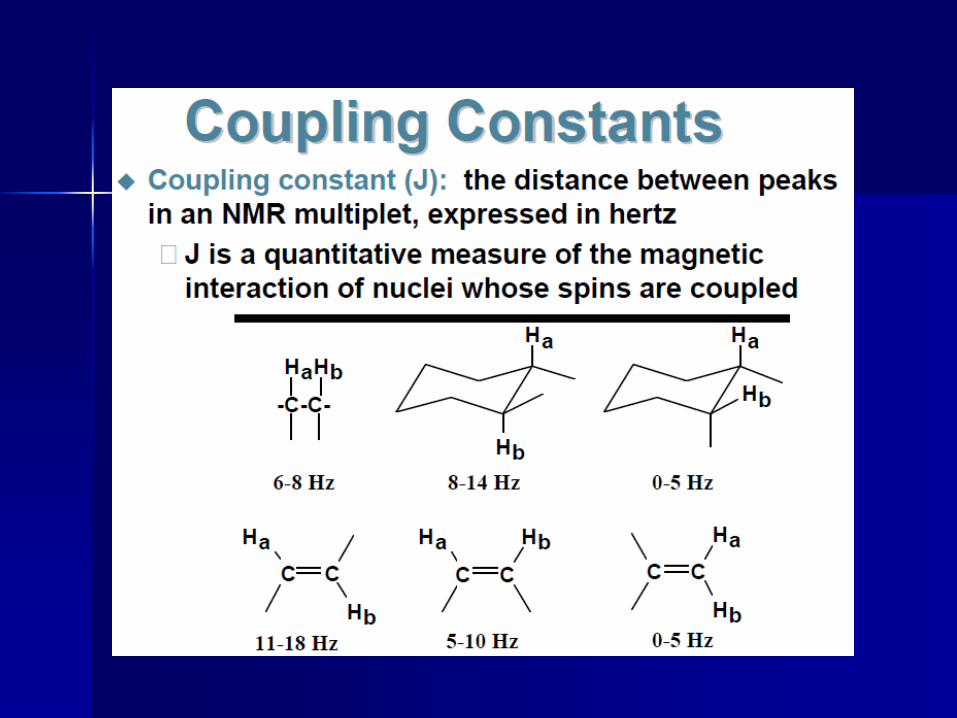
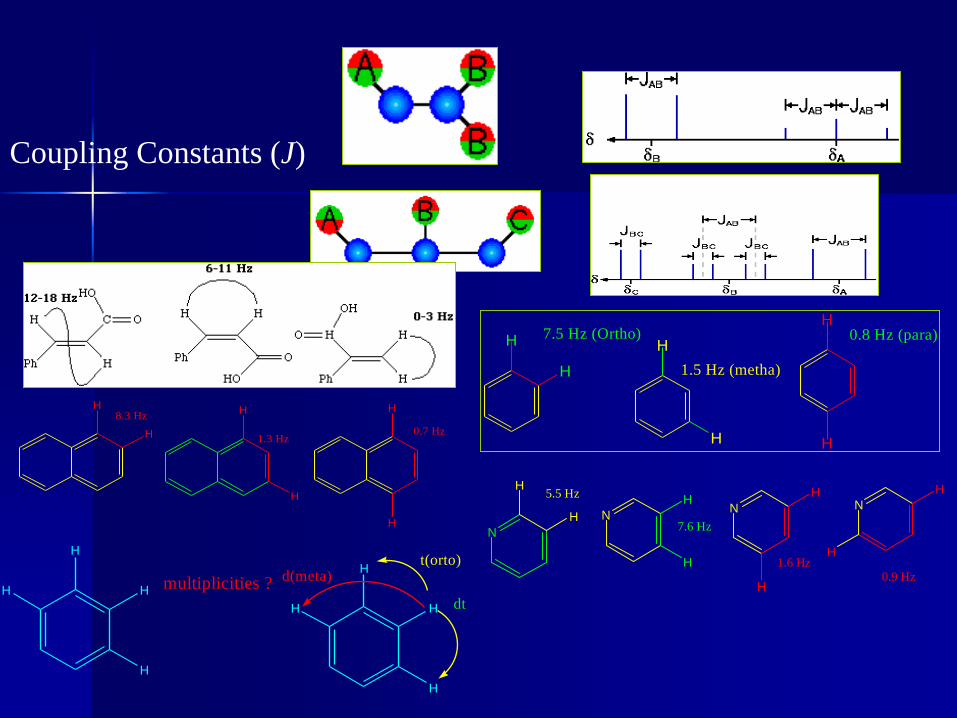
Coupling Constants (J)
H
H
H
H
H H
7.5 Hz (Ortho)
1.5 Hz (metha)
0.8 Hz (para)
H
H
H H
H
H
8.3 Hz
1.3 Hz0.7 Hz
N
H
H NN
5.5 Hz H
H
1.6 Hz
H
H
7.6 Hz
N
H
0.9 Hz
H
H
H H
H
dt
t(orto)d(meta)
H
H H
H
multiplicities ?
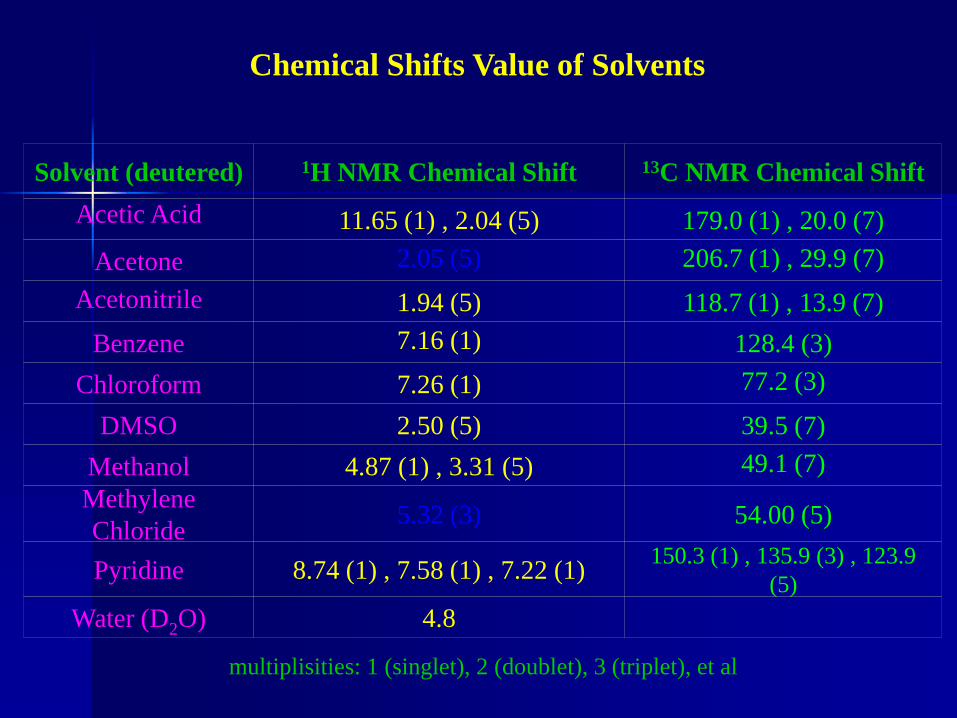
Chemical Shifts Value of Solvents
Solvent (deutered) 1H NMR Chemical Shift 13C NMR Chemical Shift
Acetic Acid
11.65 (1) , 2.04 (5)
179.0 (1) , 20.0 (7)
Acetone
2.05 (5)
206.7 (1) , 29.9 (7)
Acetonitrile
1.94 (5)
118.7 (1) , 13.9 (7)
Benzene
7.16 (1)
128.4 (3)
Chloroform
7.26 (1)
77.2 (3)
DMSO
2.50 (5)
39.5 (7)
Methanol
4.87 (1) , 3.31 (5)
49.1 (7)
Methylene
Chloride
5.32 (3)
54.00 (5)
Pyridine
8.74 (1) , 7.58 (1) , 7.22 (1)
150.3 (1) , 135.9 (3) , 123.9
(5)
Water (D2O)
4.8
multiplisities: 1 (singlet), 2 (doublet), 3 (triplet), et al
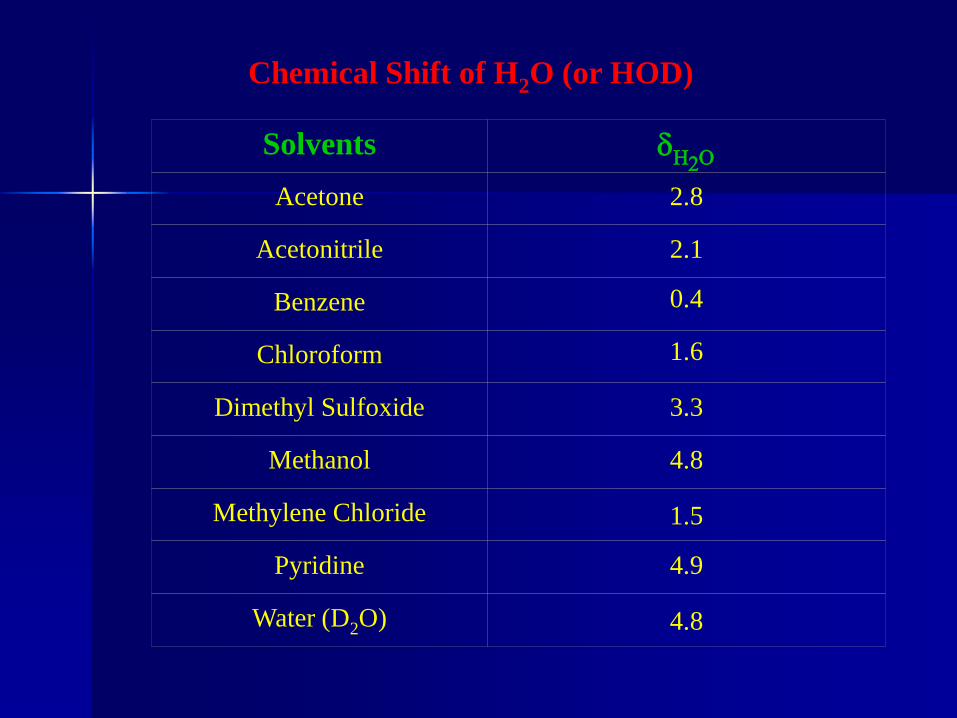
Chemical Shift of H2O (or HOD)
Solvents
dH2O
Acetone
2.8
Acetonitrile
2.1
Benzene
0.4
Chloroform
1.6
Dimethyl Sulfoxide
3.3
Methanol
4.8
Methylene Chloride
1.5
Pyridine
4.9
Water (D2O)
4.8
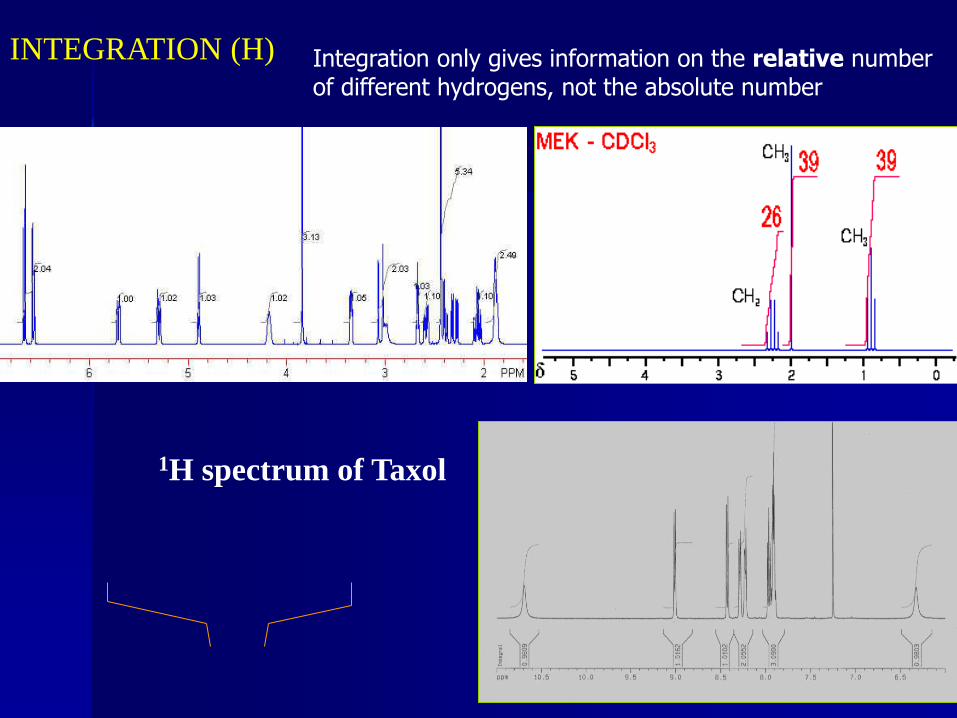
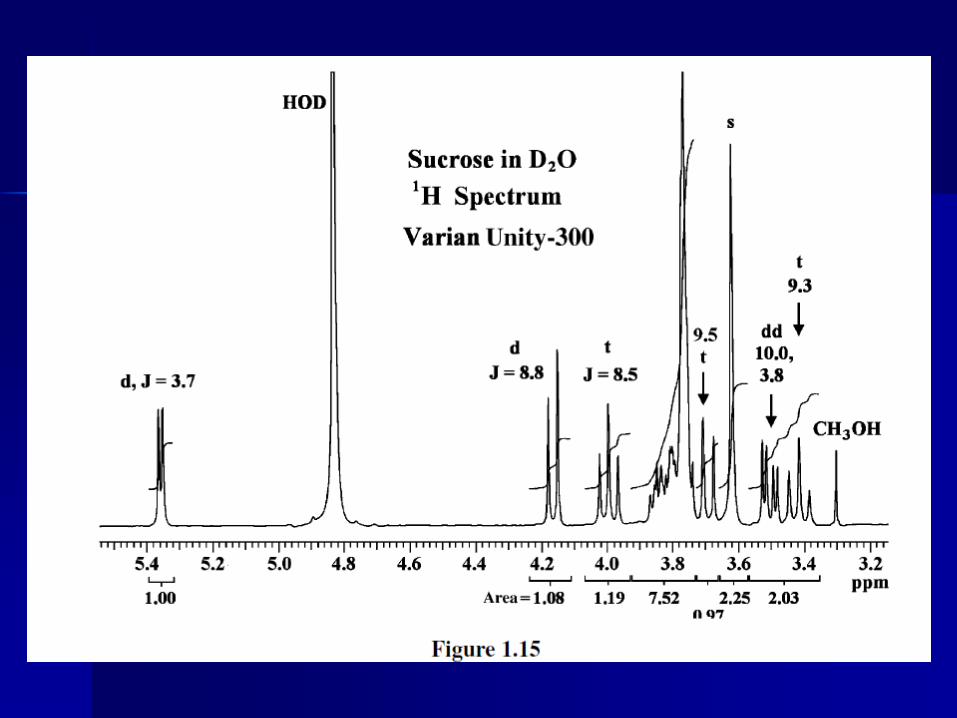
INTEGRATION (H)
1H spectrum of Taxol
Integration only gives information on the relative number of different hydrogens, not the absolute number
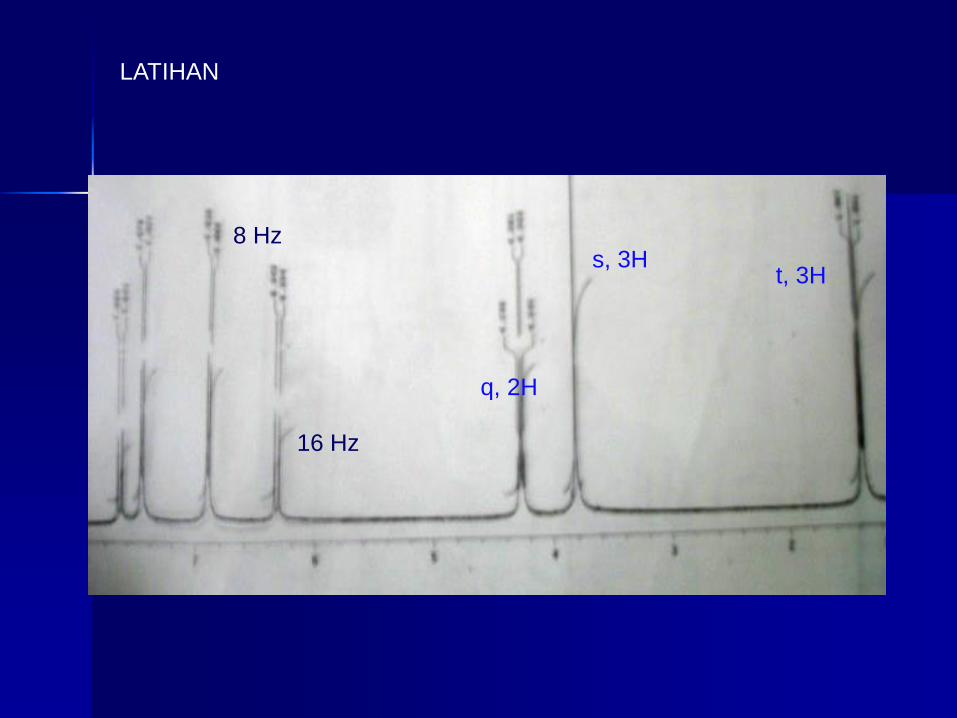
LATIHAN
8 Hz
16 Hz
q, 2H
t, 3H s, 3H
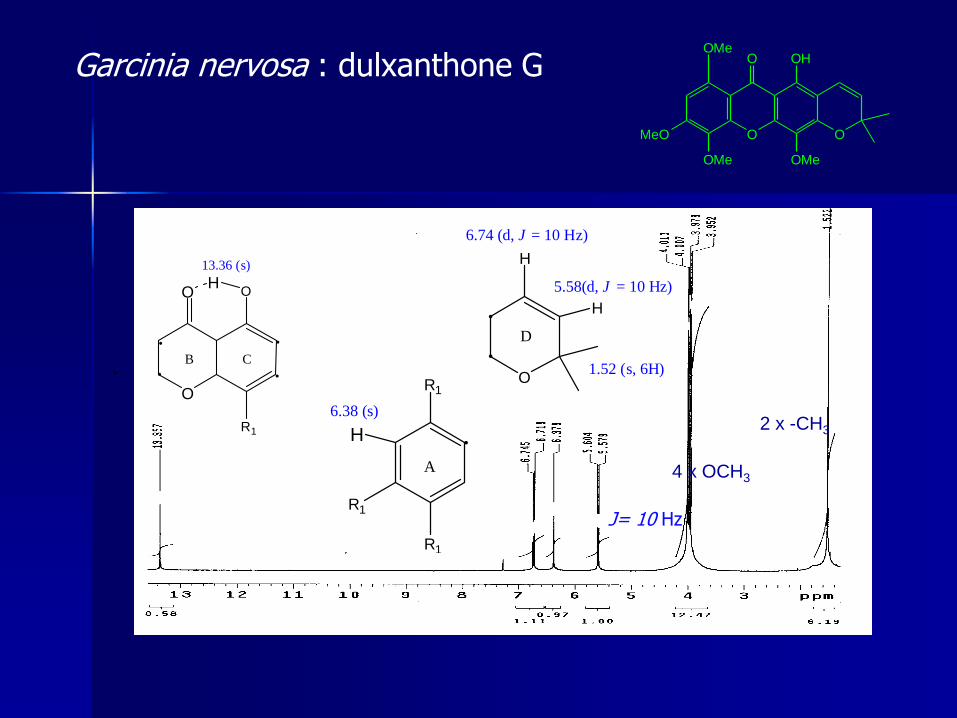
O
O
O
OH
OMe
MeO
OMe
OMe
Garcinia nervosa : dulxanthone G
J= 10 Hz
R1
H
R1
R1
A
6.38 (s)O
O OH
R1
13.36 (s)
B C
O
H
H
5.58(d, J = 10 Hz)
6.74 (d, J = 10 Hz)
D
1.52 (s, 6H)
2 x -CH3
4 x OCH3
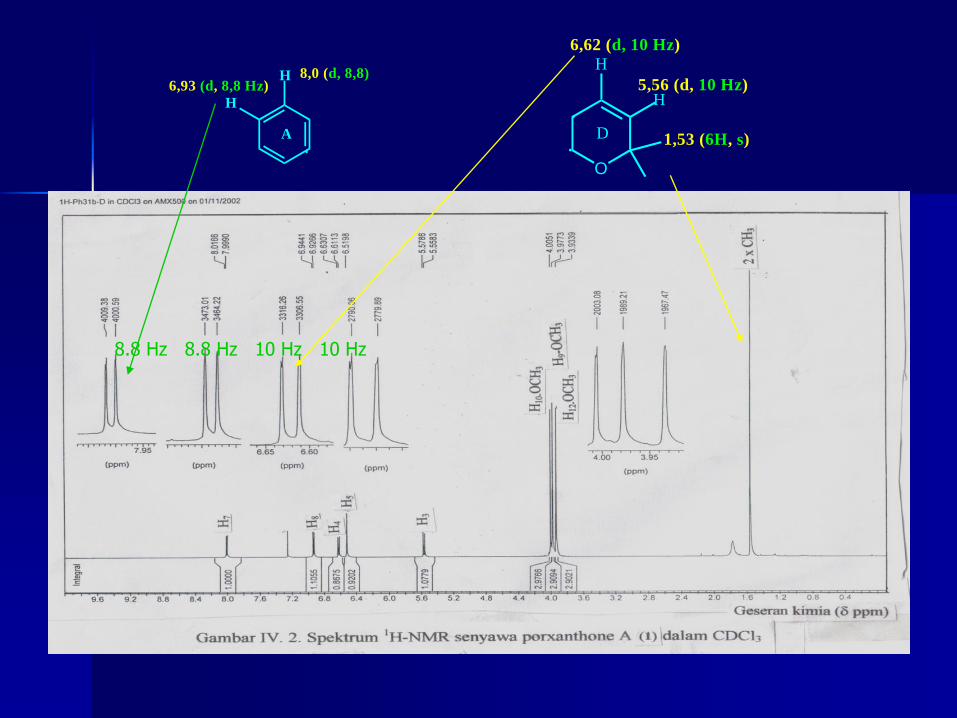
A
H
H
6,93 (d, 8,8 Hz)8,0 (d, 8,8)
.
8.8 Hz 8.8 Hz 10 Hz 10 Hz
O
D
H
H
6,62 (d, 10 Hz)
5,56 (d, 10 Hz)
1,53 (6H, s)
.
.
HO
H
O
OHH
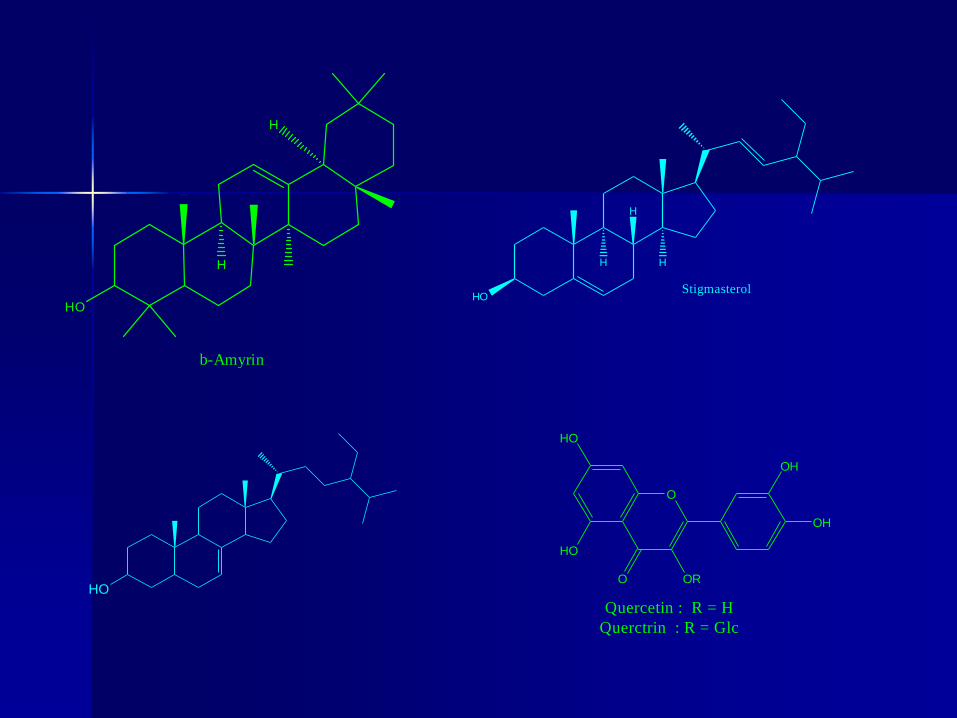
Oleanolic acid
Catechin
H
HO
H
b-Amyrin
HO
H
H
H
Stigmasterol
ORO
HO
HO
O
OH
OH
Quercetin : R = H
Querctrin : R = Glc
HO
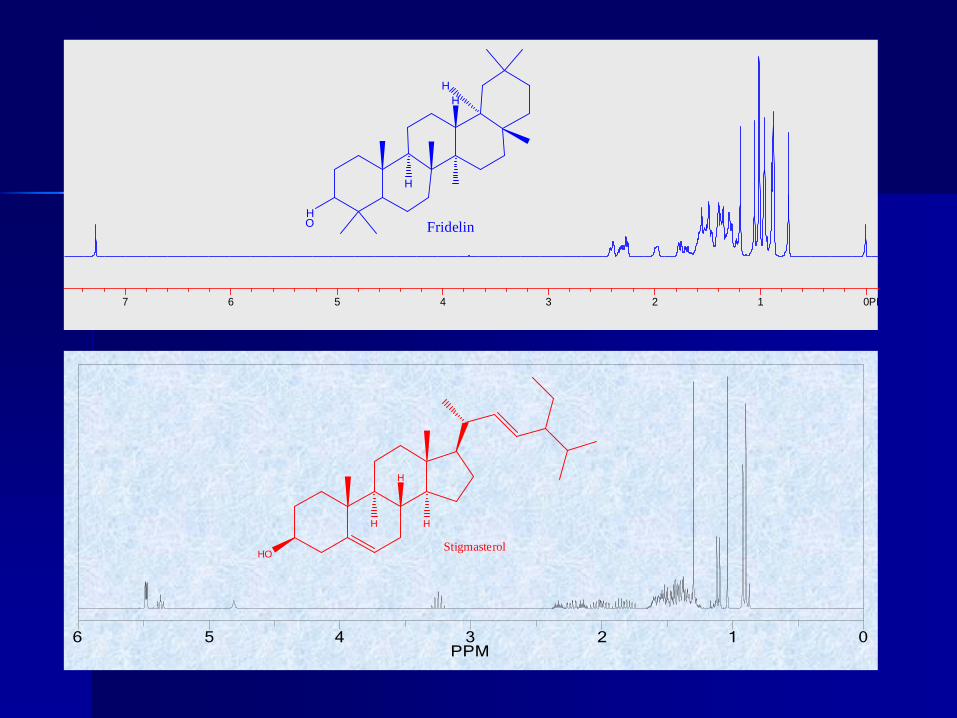
Kar-C1 in CDCl3
7
.27
5
2
.39
3
2
.27
0
1
.97
2
1
.77
3
1
.74
8
1
.56
5
1
.55
7
1
.55
1
1
.50
8
1
.48
8
1
.39
7
1
.37
8
1
.35
6
1
.35
2
1
.29
5
1
.27
3
1
.18
6
1
.05
5
1
.01
1
1
.00
8
0
.96
1
0
.89
3
0
.87
9
0
.87
6
0
.73
2
0
.00
7
7 6 5 4 3 2 1 0PPM
H
H
HO
H
Fridelin
0123456PPM
HO
H
H
H
Stigmasterol
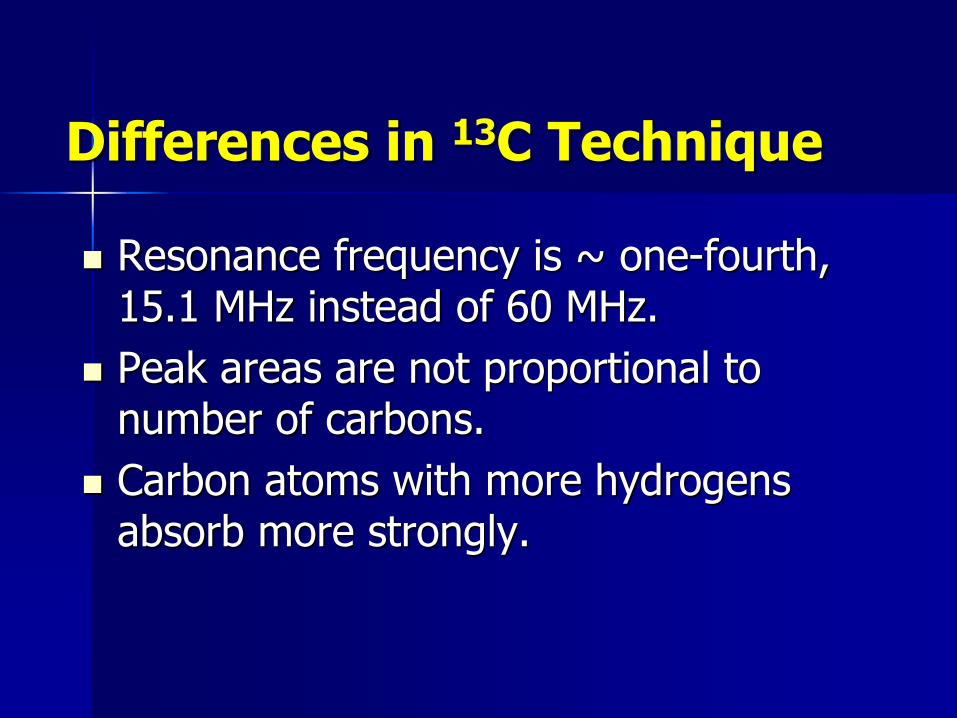
Differences in 13C Technique
Resonance frequency is ~ one-fourth, 15.1 MHz instead of 60 MHz.
Peak areas are not proportional to number of carbons.
Carbon atoms with more hydrogens absorb more strongly.
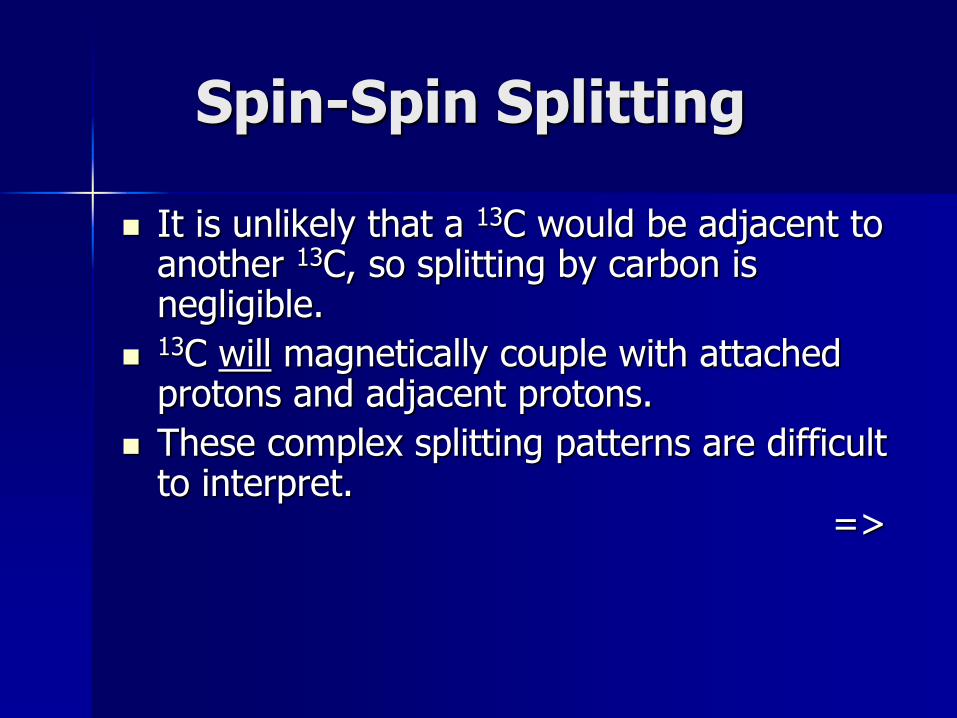
Spin-Spin Splitting
It is unlikely that a 13C would be adjacent to another 13C, so splitting by carbon is negligible.
13C will magnetically couple with attached protons and adjacent protons.
These complex splitting patterns are difficult to interpret. =>
Proton Spin Decoupling
To simplify the spectrum, protons are continuously irradiated with “noise,” so they are rapidly flipping.
The carbon nuclei see an average of all the possible proton spin states.
Thus, each different kind of carbon gives a single, unsplit peak. =>
Off-Resonance Decoupling
13C nuclei are split only by the protons attached directly to them.
The N + 1 rule applies: a carbon with N number of protons gives a signal with N + 1 peaks. =>
Interpreting 13C NMR
The number of different signals indicates the number of different kinds of carbon.
The location (chemical shift) indicates the type of functional group.
The peak area indicates the numbers of carbons (if integrated).
The splitting pattern of off-resonance decoupled spectrum indicates the number of protons attached to the carbon. =>
Chapter 13 57
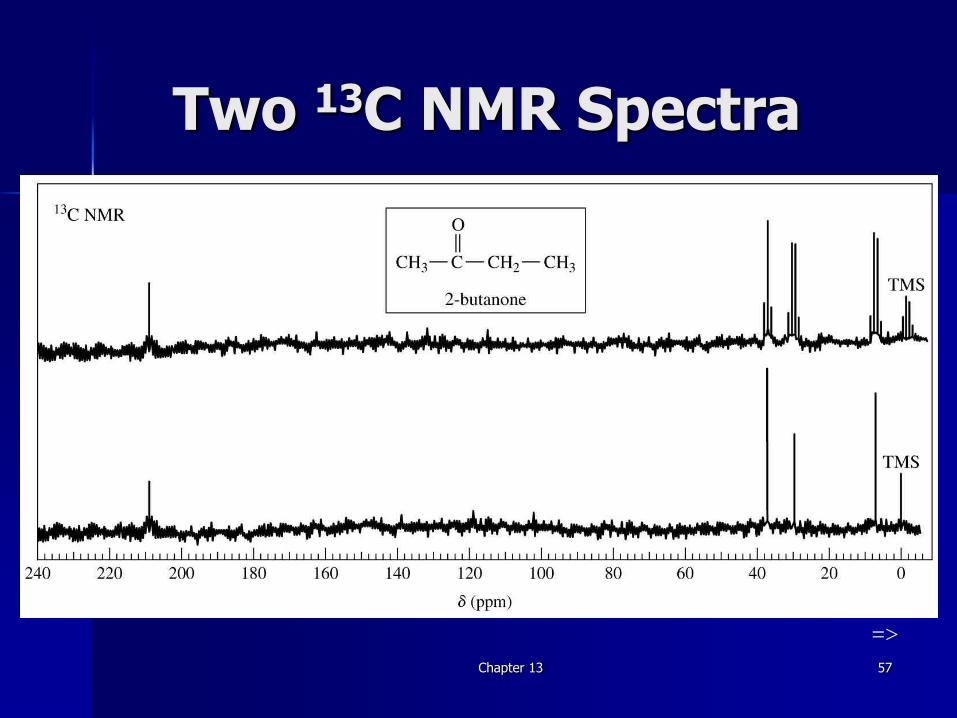
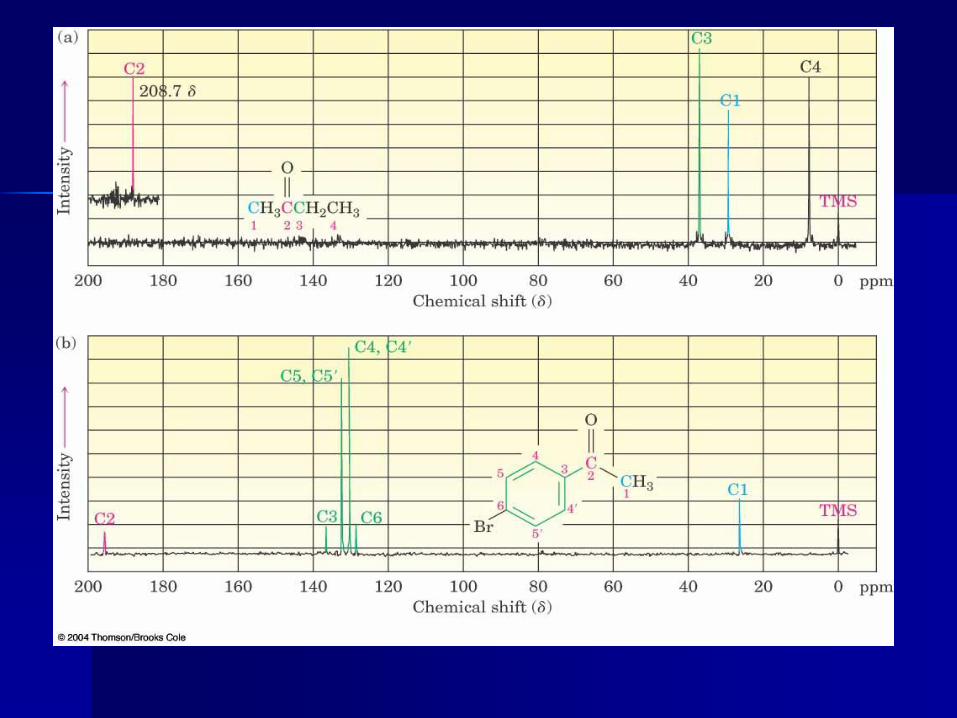
Two 13C NMR Spectra
=>
Chapter 13 58
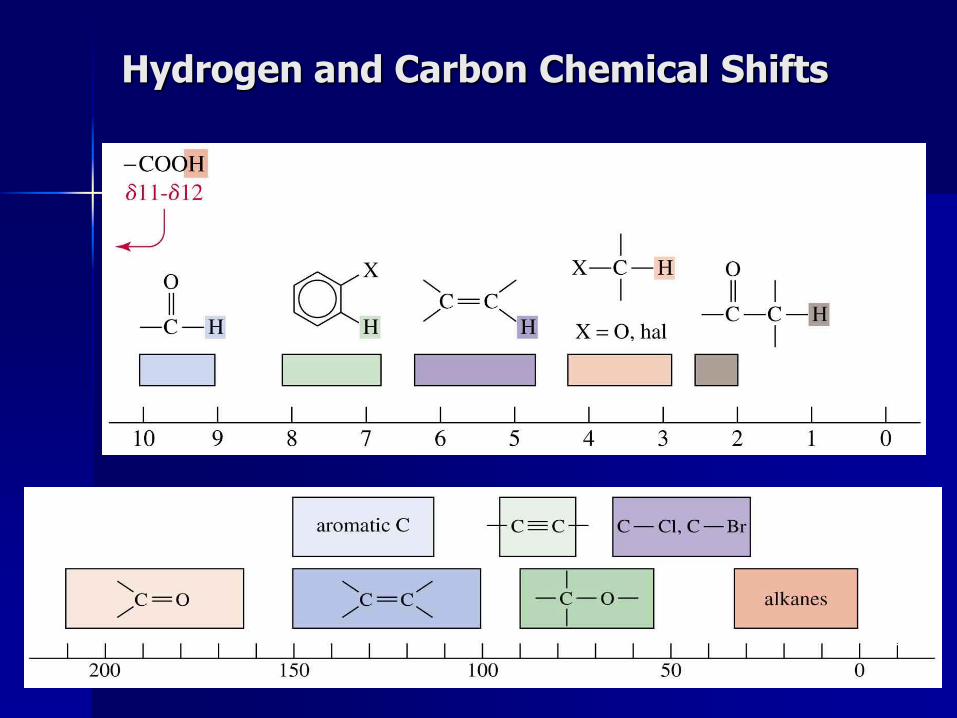
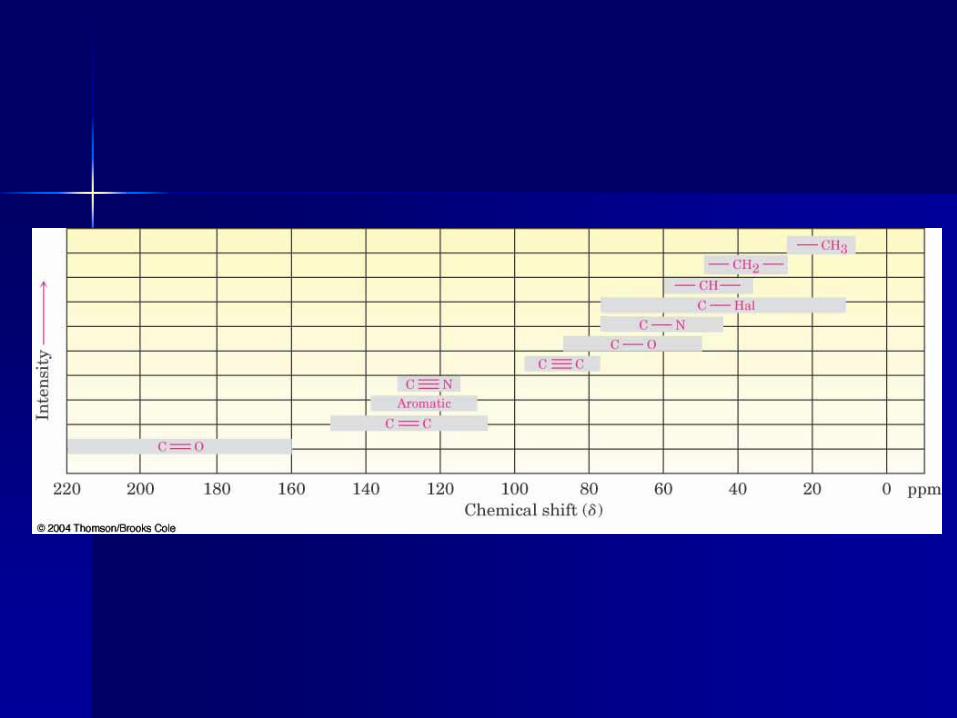
Hydrogen and Carbon Chemical Shifts
=>
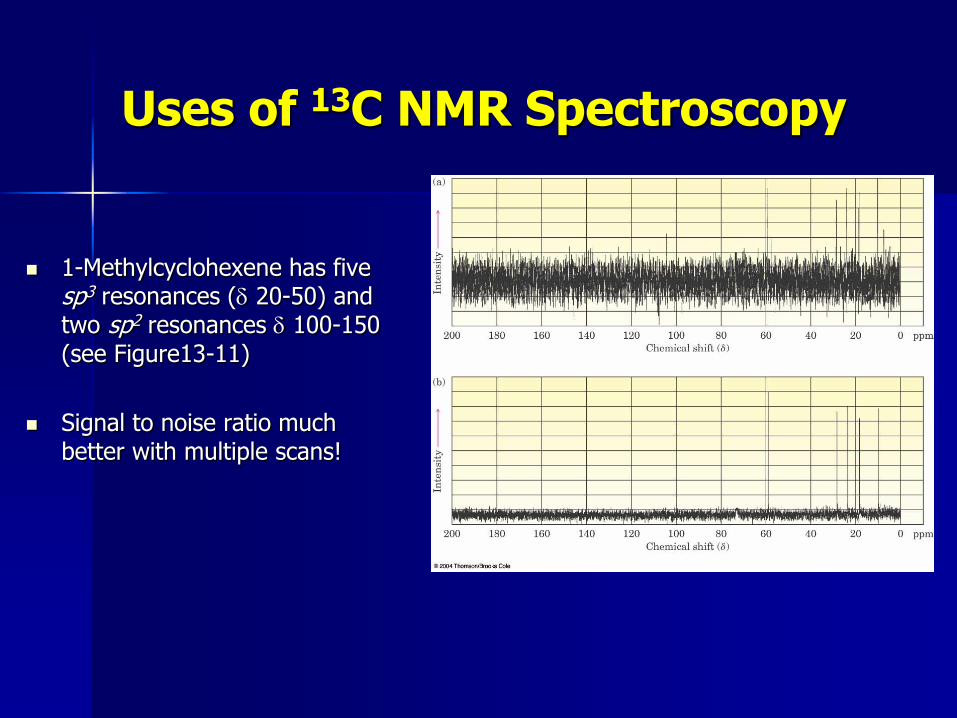
Uses of 13C NMR Spectroscopy
1-Methylcyclohexene has five sp3 resonances (d 20-50) and two sp2 resonances d 100-150 (see Figure13-11)
Signal to noise ratio much better with multiple scans!
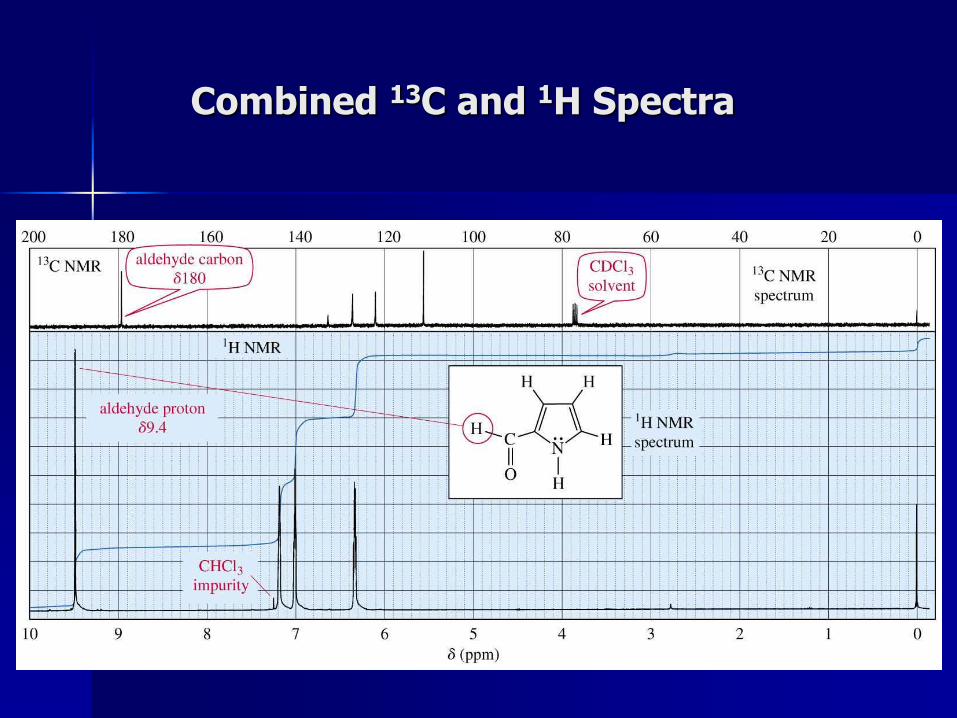
Combined 13C and 1H Spectra
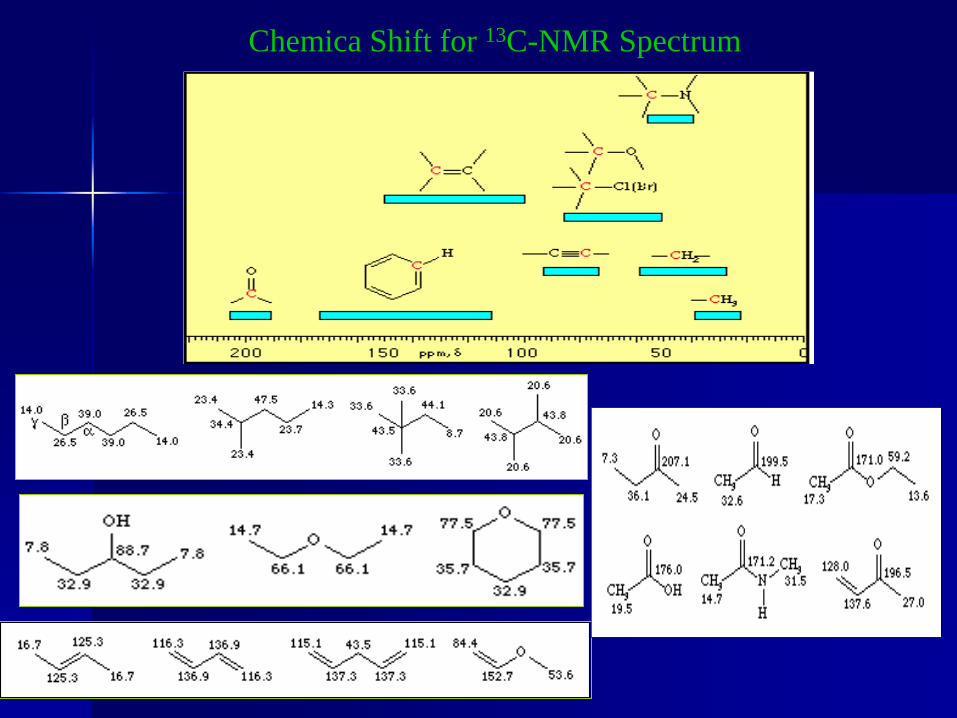
Chemica Shift for 13C-NMR Spectrum
13C spectrum of Taxol
Experimental time: 14h
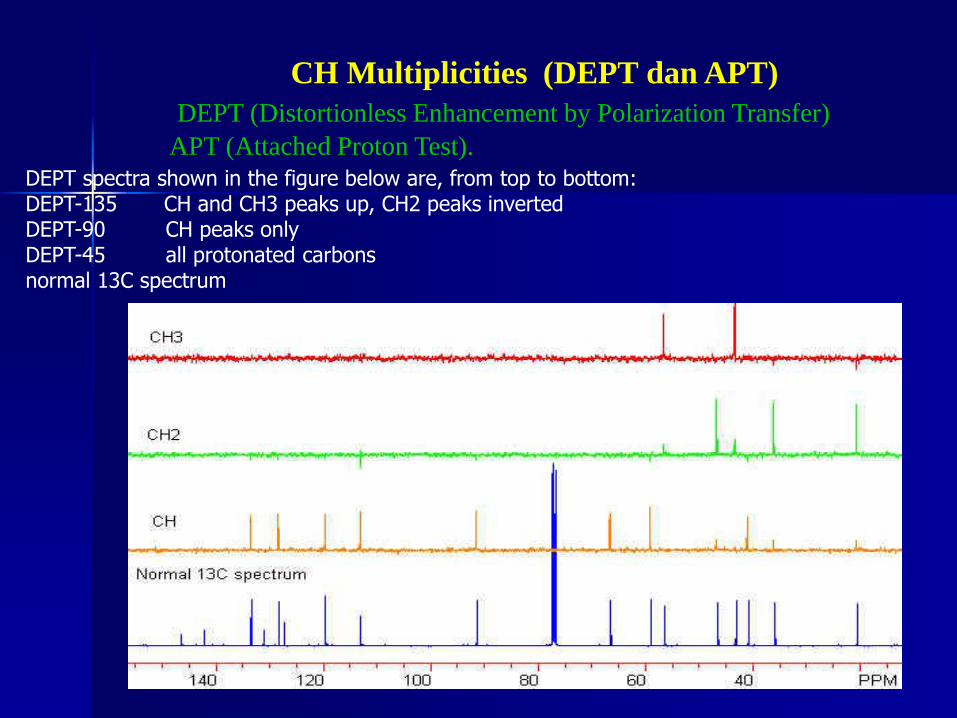
CH Multiplicities (DEPT dan APT)
DEPT (Distortionless Enhancement by Polarization Transfer)
APT (Attached Proton Test). DEPT spectra shown in the figure below are, from top to bottom:
DEPT-135 CH and CH3 peaks up, CH2 peaks inverted DEPT-90 CH peaks only DEPT-45 all protonated carbons normal 13C spectrum
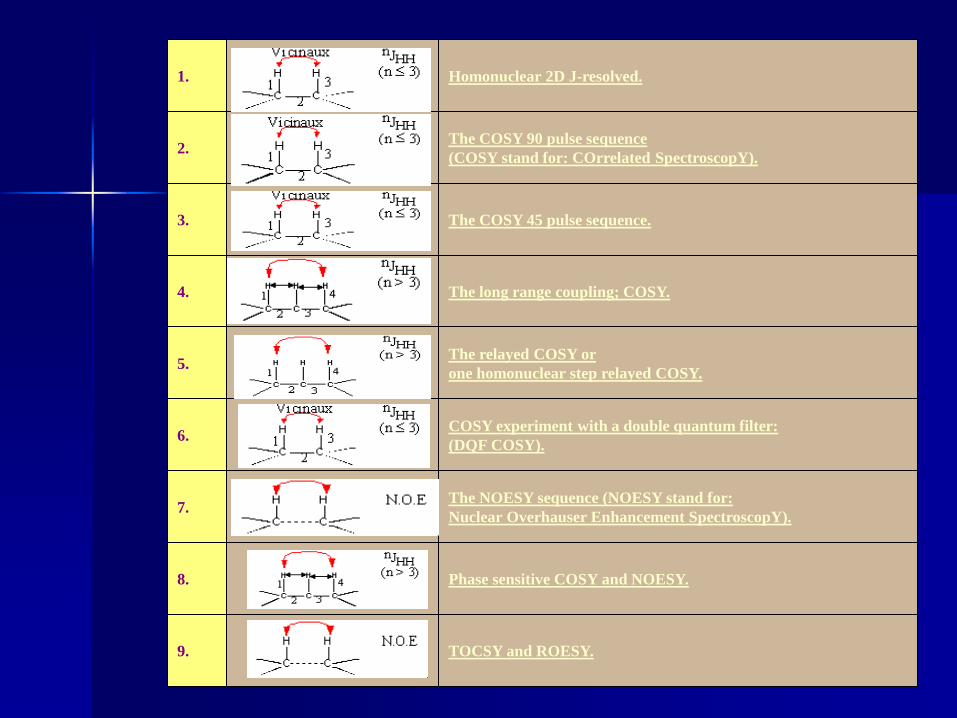
1. Homonuclear 2D J-resolved.
2. The COSY 90 pulse sequence
(COSY stand for: COrrelated SpectroscopY).
3. The COSY 45 pulse sequence.
4. The long range coupling; COSY.
5. The relayed COSY or
one homonuclear step relayed COSY.
6. COSY experiment with a double quantum filter:
(DQF COSY).
7. The NOESY sequence (NOESY stand for:
Nuclear Overhauser Enhancement SpectroscopY).
8. Phase sensitive COSY and NOESY.
9. TOCSY and ROESY.
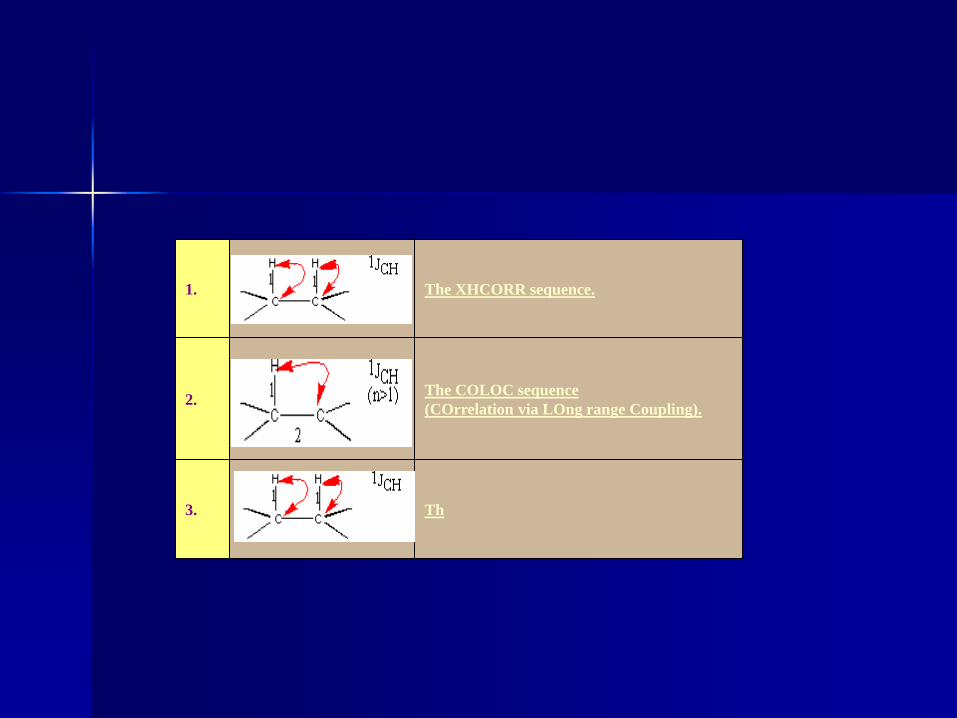
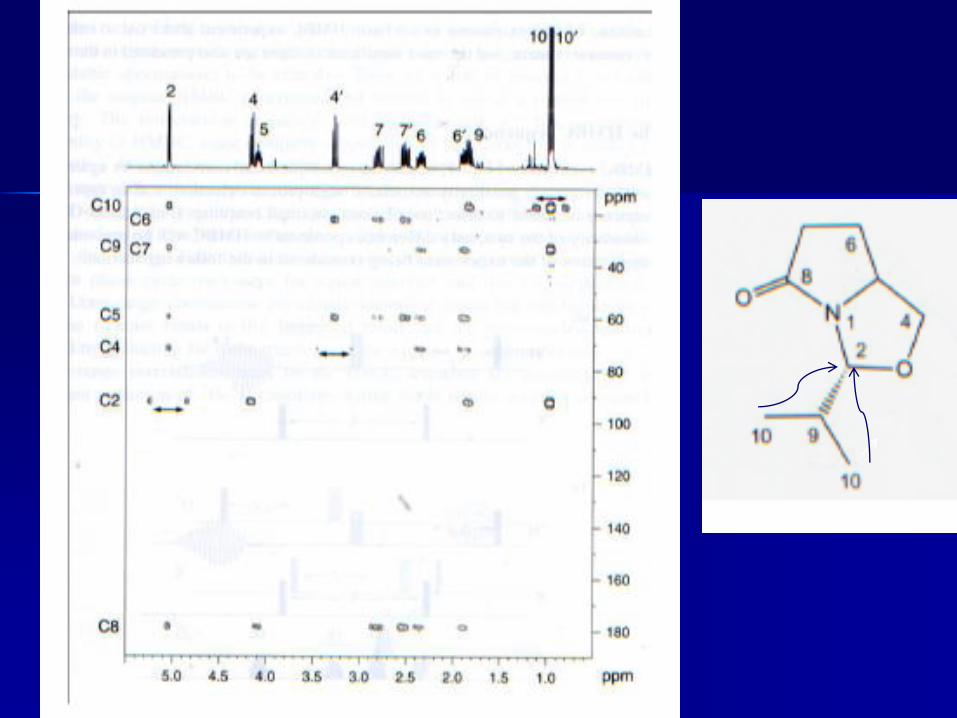
1. The XHCORR sequence.
2. The COLOC sequence
(COrrelation via LOng range Coupling).
3. Th
C2
C1
C3
C4
C6
C5
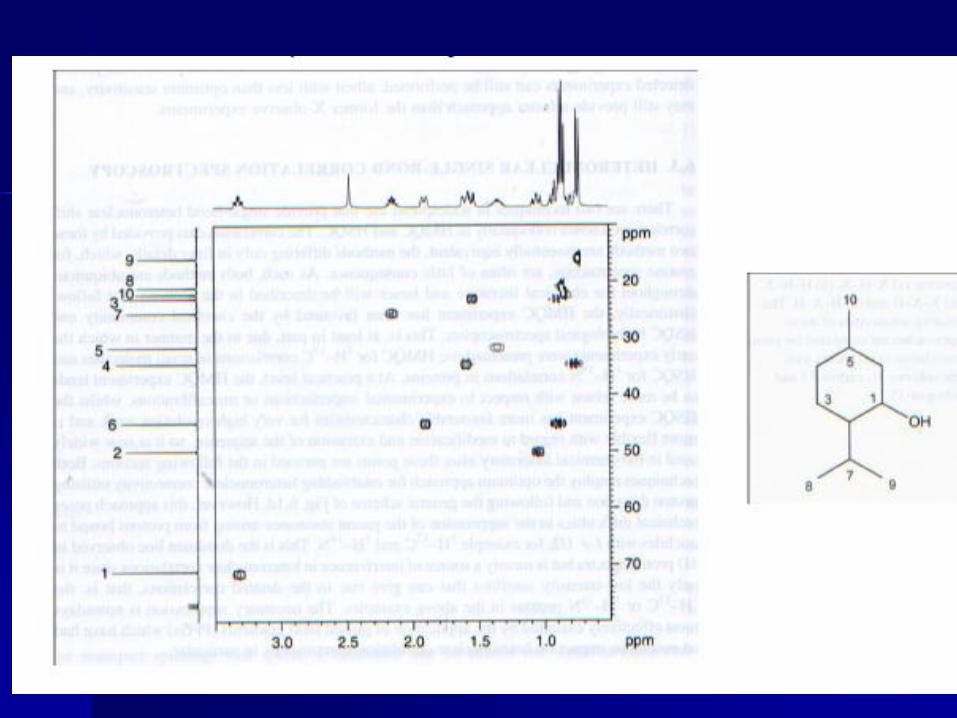
H6 H3 H2 H5b H1 H5a H4
1H chemical shifts
C1
3 c
hem
ica
l sh
ifts
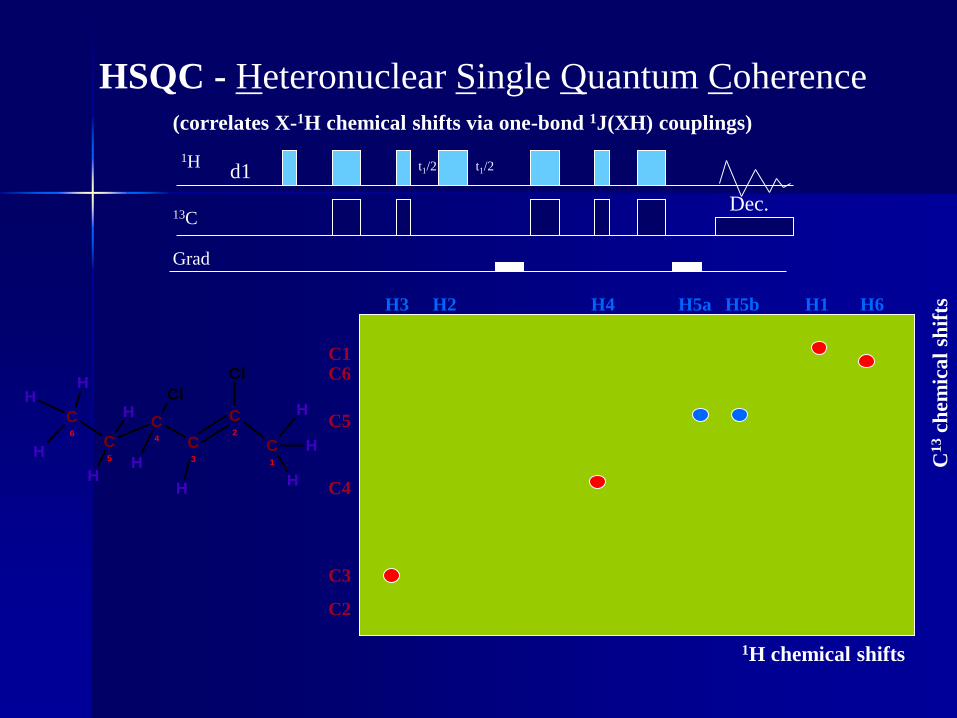
HSQC - Heteronuclear Single Quantum Coherence
C6
C5
C4 C
3
C2
C1
Cl
Cl
H
HH
H
H
H
H
H
H
H
(correlates X-1H chemical shifts via one-bond 1J(XH) couplings)
1H
Grad
t1/2 d1 t1/2
13C Dec.
Gradient HSQC spectrum of Taxol
nt=1 per increment
256 complex points in F1
exp. time=15 min
Gradient HSQC spectrum of Taxol (expansion #2)
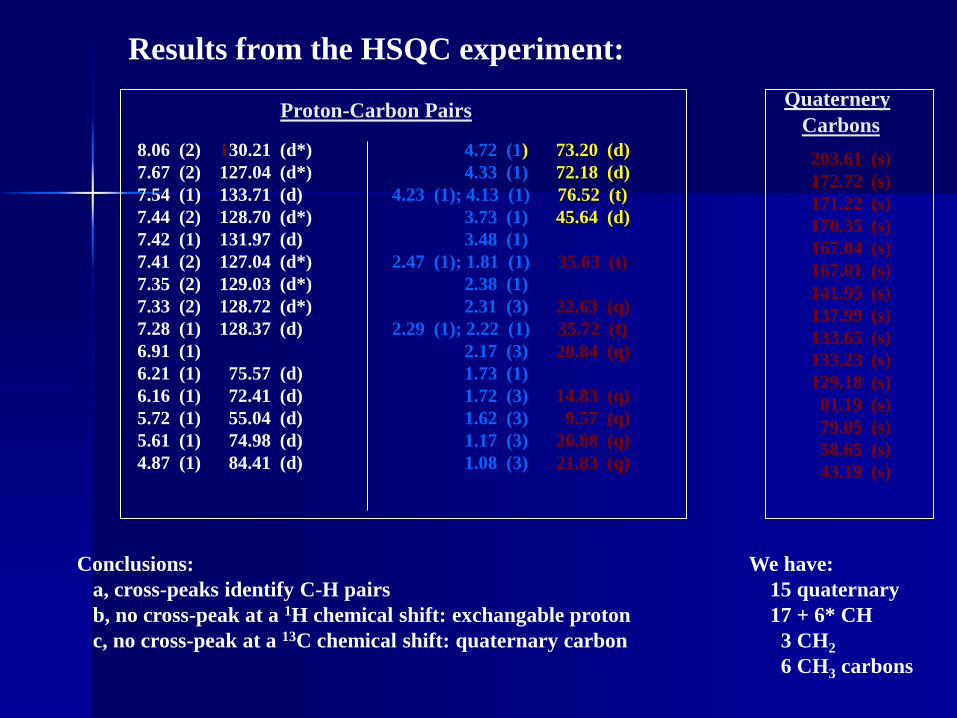
8.06 (2) 130.21 (d*)
7.67 (2) 127.04 (d*)
7.54 (1) 133.71 (d)
7.44 (2) 128.70 (d*)
7.42 (1) 131.97 (d)
7.41 (2) 127.04 (d*)
7.35 (2) 129.03 (d*)
7.33 (2) 128.72 (d*)
7.28 (1) 128.37 (d)
6.91 (1)
6.21 (1) 75.57 (d)
6.16 (1) 72.41 (d)
5.72 (1) 55.04 (d)
5.61 (1) 74.98 (d)
4.87 (1) 84.41 (d)
4.72 (1) 73.20 (d)
4.33 (1) 72.18 (d)
4.23 (1); 4.13 (1) 76.52 (t)
3.73 (1) 45.64 (d)
3.48 (1)
2.47 (1); 1.81 (1) 35.63 (t)
2.38 (1)
2.31 (3) 22.63 (q)
2.29 (1); 2.22 (1) 35.72 (t)
2.17 (3) 20.84 (q)
1.73 (1)
1.72 (3) 14.83 (q)
1.62 (3) 9.57 (q)
1.17 (3) 26.88 (q)
1.08 (3) 21.83 (q)
Proton-Carbon Pairs
203.61 (s)
172.72 (s)
171.22 (s)
170.35 (s)
167.04 (s)
167.01 (s)
141.95 (s)
137.99 (s)
133.65 (s)
133.23 (s)
129.18 (s)
81.19 (s)
79.05 (s)
58.65 (s)
43.19 (s)
Quaternery
Carbons
Results from the HSQC experiment:
Conclusions:
a, cross-peaks identify C-H pairs
b, no cross-peak at a 1H chemical shift: exchangable proton
c, no cross-peak at a 13C chemical shift: quaternary carbon
We have:
15 quaternary
17 + 6* CH
3 CH2
6 CH3 carbons
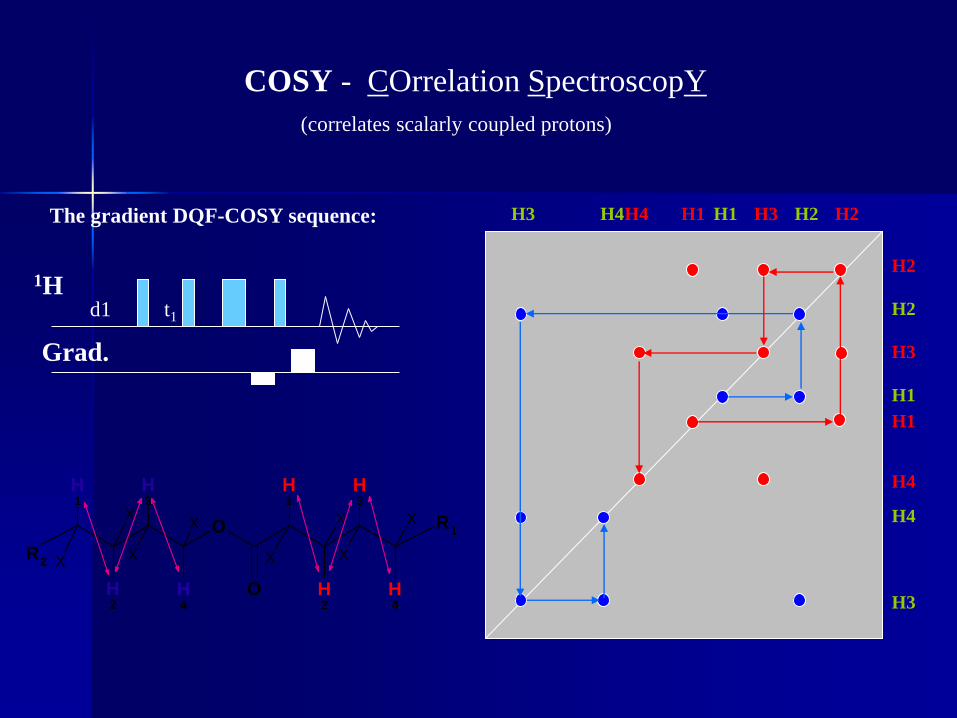
COSY - COrrelation SpectroscopY
X
H1
R2
O R1
OH2
H3
H4
H1
H2
H3
H4
XX
X
X
X X
X
H1
H2
H3
H4
H1 H2 H3 H4 H4
H4
H3
H3
H1
H1
H2
H2
(correlates scalarly coupled protons)
Grad.
1H t1 d1
The gradient DQF-COSY sequence:
X
N H
O
O H
H
H
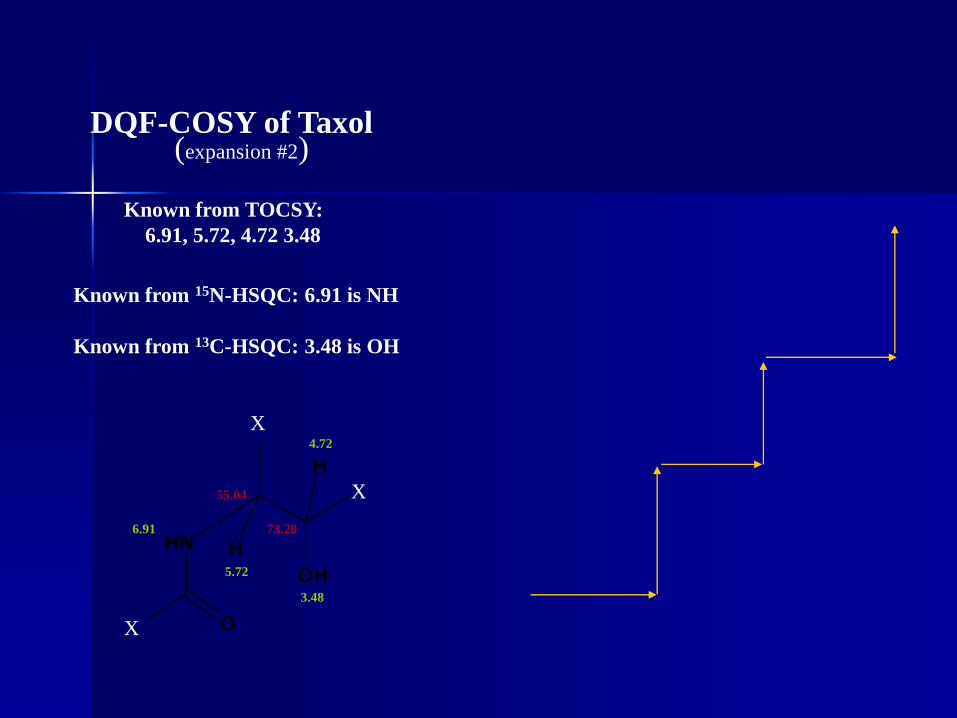
6.91
5.72
3.48
4.72
55.04
73.20
X
X
DQF-COSY of Taxol (expansion #2)
Known from TOCSY:
6.91, 5.72, 4.72 3.48
Known from 15N-HSQC: 6.91 is NH
Known from 13C-HSQC: 3.48 is OH
C6
C5
C4 C
3
C2
C1
Cl
Cl
H
HH
H
H
H
H
H
H
H
H6 H3 H2 H5b H1 H5a H4
1H chemical shifts
C2
C1
C3
C4
C6
C5
C1
3 c
hem
ica
l sh
ifts
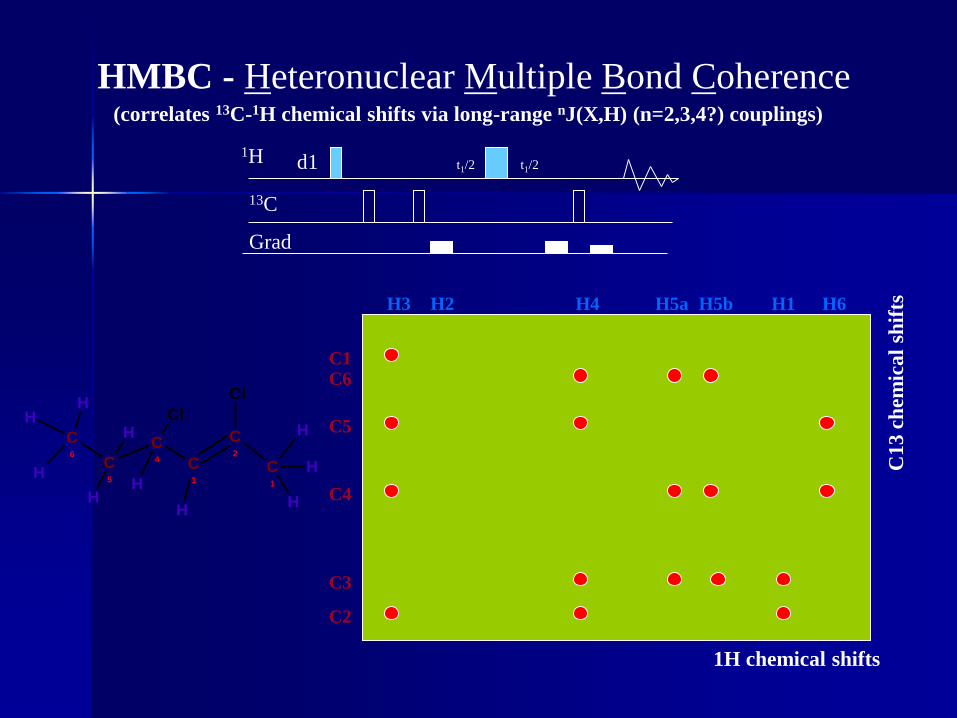
HMBC - Heteronuclear Multiple Bond Coherence (correlates 13C-1H chemical shifts via long-range nJ(X,H) (n=2,3,4?) couplings)
1H
Grad
d1 t1/2 t1/2
13C
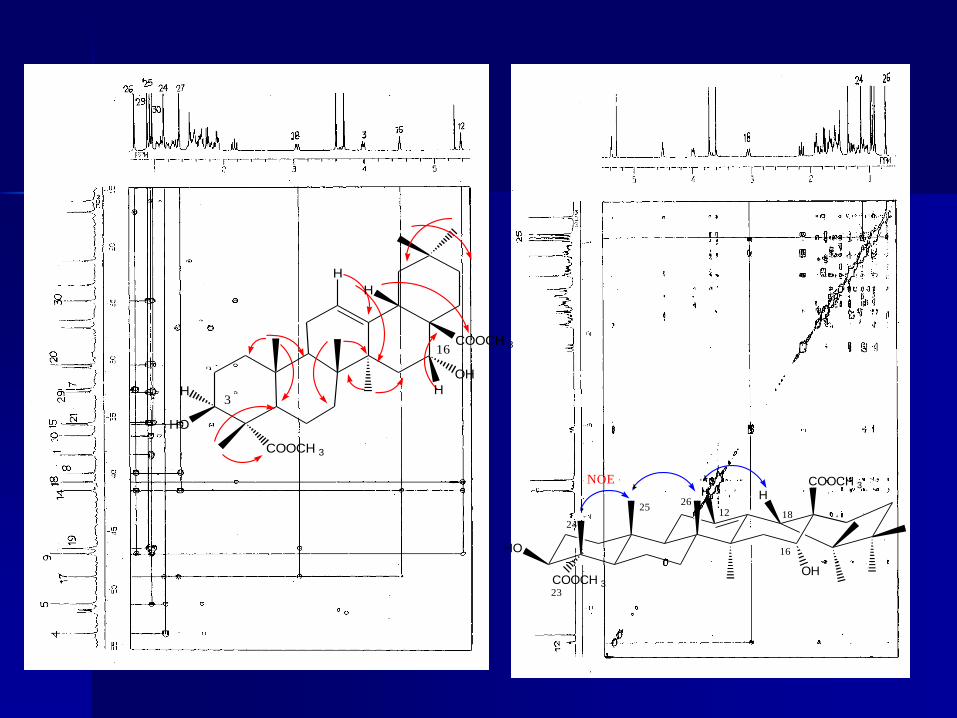
HO
COOCH 3
H
COOCH 3
OH
H
H H3
16
HO
HH
COOCH 3
OH
COOCH 3
12 18
23
24
2526
16
NOE

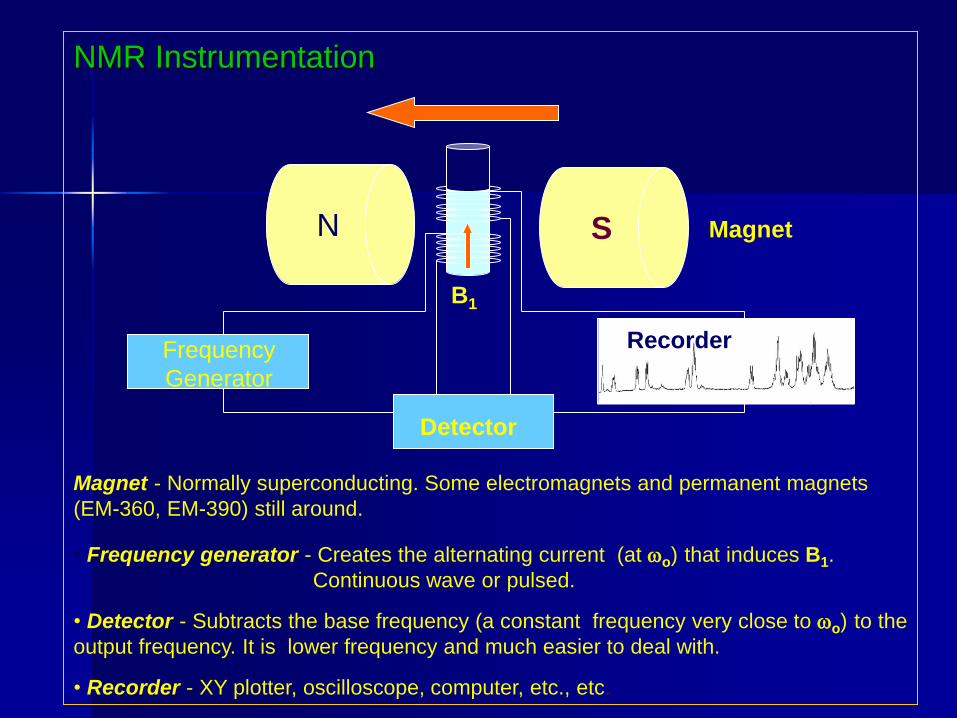
NMR Instrumentation
Magnet - Normally superconducting. Some electromagnets and permanent magnets
(EM-360, EM-390) still around.
• Frequency generator - Creates the alternating current (at wo) that induces B1.
Continuous wave or pulsed. • Detector - Subtracts the base frequency (a constant frequency very close to wo) to the
output frequency. It is lower frequency and much easier to deal with. • Recorder - XY plotter, oscilloscope, computer, etc., etc.
N S
Bo
B1
Detector
Frequency
Generator
Recorder
Magnet
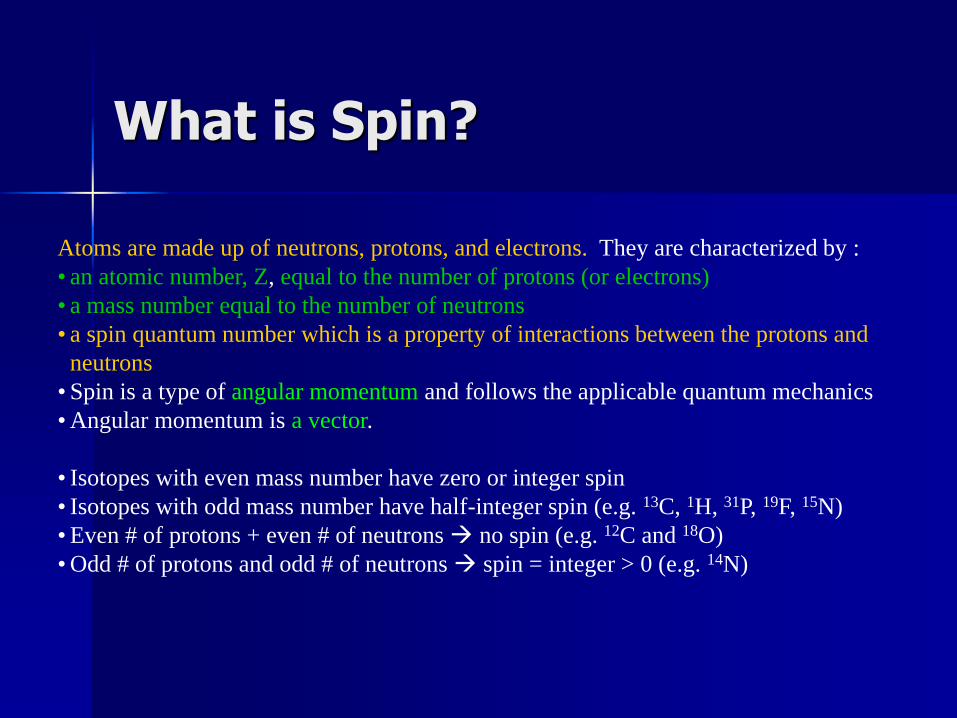
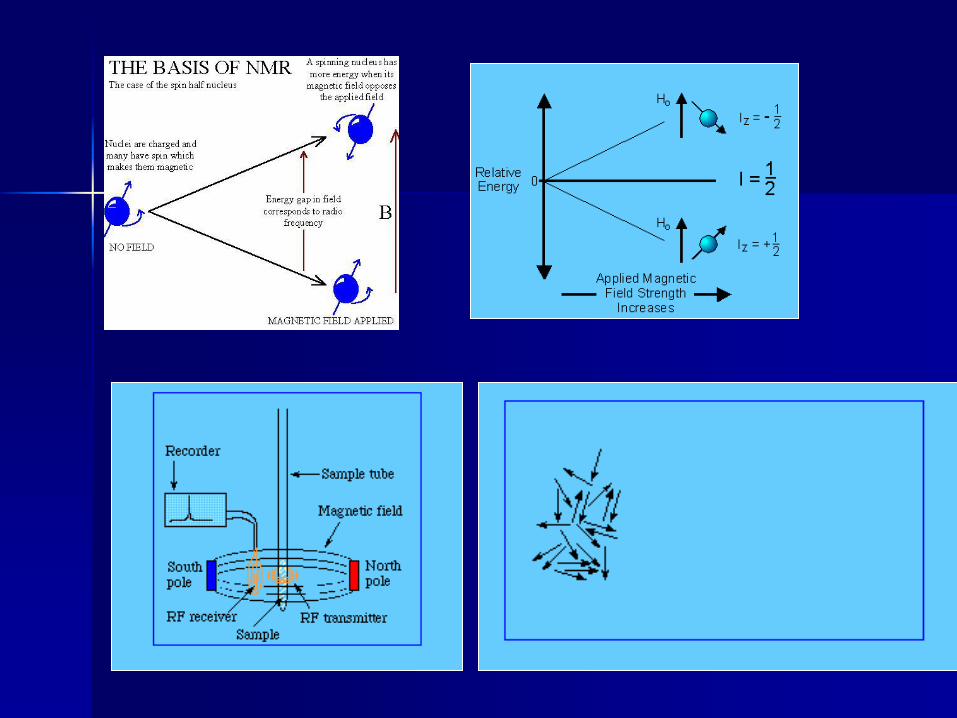
What is Spin?
Atoms are made up of neutrons, protons, and electrons. They are characterized by :
• an atomic number, Z, equal to the number of protons (or electrons)
• a mass number equal to the number of neutrons
• a spin quantum number which is a property of interactions between the protons and
neutrons
• Spin is a type of angular momentum and follows the applicable quantum mechanics
• Angular momentum is a vector.
• Isotopes with even mass number have zero or integer spin
• Isotopes with odd mass number have half-integer spin (e.g. 13C, 1H, 31P, 19F, 15N)
• Even # of protons + even # of neutrons no spin (e.g. 12C and 18O)
• Odd # of protons and odd # of neutrons spin = integer > 0 (e.g. 14N)
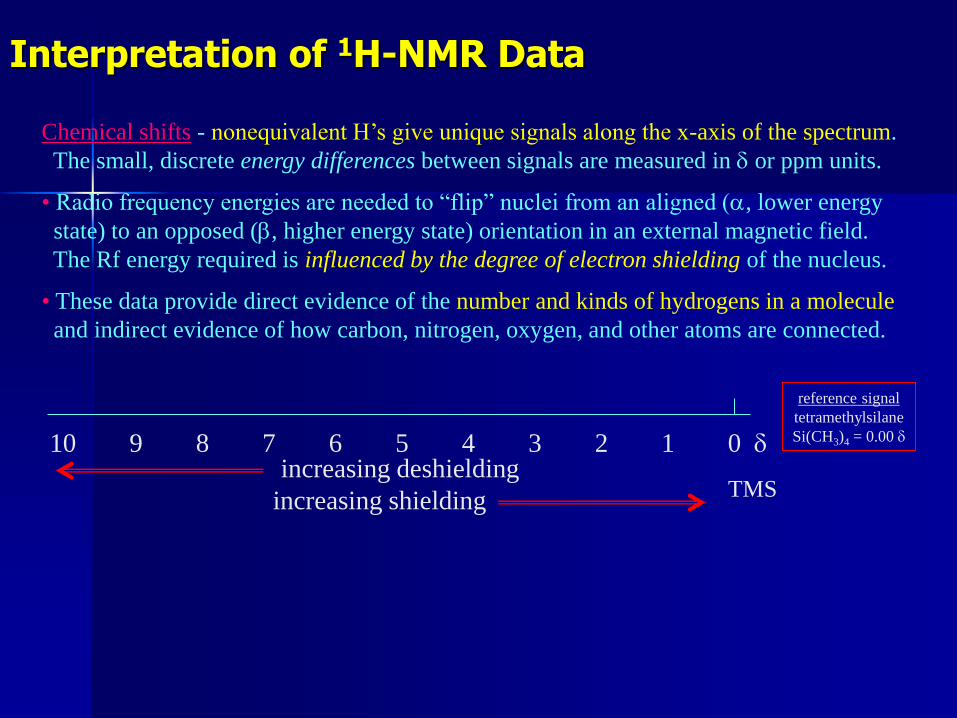
Interpretation of 1H-NMR Data
Chemical shifts - nonequivalent H’s give unique signals along the x-axis of the spectrum.
The small, discrete energy differences between signals are measured in d or ppm units.
• Radio frequency energies are needed to “flip” nuclei from an aligned (a, lower energy
state) to an opposed (b, higher energy state) orientation in an external magnetic field.
The Rf energy required is influenced by the degree of electron shielding of the nucleus.
• These data provide direct evidence of the number and kinds of hydrogens in a molecule
and indirect evidence of how carbon, nitrogen, oxygen, and other atoms are connected.
10 9 8 7 6 5 4 3 2 1 0 d
TMS
reference signal
tetramethylsilane
Si(CH3)4 = 0.00 d
increasing deshielding
increasing shielding