Embed Size (px)
Citation preview
NCES 2019-074 U.S. DEPARTMENT OF EDUCATION
Private School Universe Survey (PSS): Public-Use Data File User’s Manual for School Year 2017–18
Private School Universe Survey (PSS): Public-Use Data File User’s Manual for School Year 2017–18
AUGUST 2019
Stephen Broughman National Center for Education Statistics
Brian Kincel Jennifer Peterson U.S. Census Bureau
NCES 2019-074 U.S. DEPARTMENT OF EDUCATION
U.S. Department of Education Betsy DeVos Secretary
Institute of Education Sciences Mark Schneider Director
National Center for Education Statistics James L. Woodworth Commissioner
Sample Surveys Division Christopher Chapman Associate Commissioner
The National Center for Education Statistics (NCES) is the primary federal entity for collecting, analyzing, and reporting data related to education in the United States and other nations. It fulfills a congressional mandate to collect, collate, analyze, and report full and complete statistics on the condition of education in the United States; conduct and publish reports and specialized analyses of the meaning and significance of such statistics; assist state and local education agencies in improving their statistical systems; and review and report on education activities in foreign countries.
NCES activities are designed to address high-priority education data needs; provide consistent, reliable, complete, and accurate indicators of education status and trends; and report timely, useful, and high-quality data to the U.S. Department of Education, the Congress, the states, other education policymakers, practitioners, data users, and the general public. Unless specifically noted, all information contained herein is in the public domain.
We strive to make our products available in a variety of formats and in language that is appropriate to a variety of audiences. You, as our customer, are the best judge of our success in communicating information effectively. If you have any comments or suggestions about this or any other NCES product or report, we would like to hear from you. Please direct your comments to
NCES, IES, U.S. Department of Education Potomac Center Plaza 550 12th Street SW
Washington, DC 20202
August 2019
The NCES Home Page address is http://nces.ed.gov. The NCES Publications and Products address is http://nces.ed.gov/pubsearch.
This publication is only available online. To download, view, and print the report as a PDF file, go to the NCES Publications and Products address shown above.
Mention of trade names, commercial products, or organizations does not imply endorsement by the U.S. Government. Suggested Citation Broughman, S.P., Kincel, B., and Peterson, J. (2019). Private School Universe Survey (PSS): Public-Use Data File User’s Manual for School Year 2017–18 (NCES 2019-074). U.S. Department of Education. Washington, DC: National Center for Education Statistics. Content Contact Stephen P. Broughman (202) 245-8338 [email protected]
iv PSS: Public-Use Data File User’s Manual for School Year 2017–18
Contents Page
List of Tables ............................................................................................................................................... vi
I. Overview ................................................................................................................................................... 1 Purpose and Content of the Survey ........................................................................................................ 1 Content of the Manual ............................................................................................................................ 1
II. Frame Creation ......................................................................................................................................... 2 List Frame ............................................................................................................................................... 2 Area Frame ............................................................................................................................................. 2 Weighting ............................................................................................................................................... 3 Variance Estimation ............................................................................................................................... 3
Producing Replicate Weights ............................................................................................................ 3 Applying Replicate Weights .............................................................................................................. 4 Approximate Sampling Errors ........................................................................................................... 5
III. Data Collection ....................................................................................................................................... 7 Data Collection Procedures .................................................................................................................... 7
Mailings ............................................................................................................................................. 7 Nonresponse Follow-up ..................................................................................................................... 8 Interviewer Training .......................................................................................................................... 8 Efforts to increase Response Rates .................................................................................................... 8
Response Rates ....................................................................................................................................... 9 Unit Response Rate ........................................................................................................................... 9 Item Response Rates ........................................................................................................................ 15
IV. Data Preparation ................................................................................................................................... 17 Questionnaire Check-in and Data Capture ........................................................................................... 17 Computer Pre-Edit ................................................................................................................................ 17 Computer Edit ...................................................................................................................................... 17 Imputation ............................................................................................................................................ 18
Donor Imputation ............................................................................................................................ 18 Analyst Imputation .......................................................................................................................... 18 Imputation Flags .............................................................................................................................. 18
V. Guide to the Public-Use Data File and Code Book ................................................................................ 19 Categories of Variables ........................................................................................................................ 19 Composite Variables ............................................................................................................................ 20 Unique School Identifier ...................................................................................................................... 27
VI. User Notes and Cautions ...................................................................................................................... 28 Locale Code (Urbanicity) ..................................................................................................................... 28 Race/Ethnicity ...................................................................................................................................... 28
References ................................................................................................................................................... 29
Contents v
List of Appendixes Appendix Page
A. 2017–18 Private School Universe Survey Questionnaire ............................................................ A-1 B. List of Variables and Record Layout of the Tab-Delimited ASCII File of the
2017–18 PSS Public-Use Data ..................................................................................................... B-1 C. 2017–18 Private School Universe Survey Public-Use Codebook ............................................... C-1
vi PSS: Public-Use Data File User’s Manual for School Year 2017–18
List of Tables Table Page
1. Average PSS design effects (DEFF) and square root of the average design effects (DEFT) by selected school characteristics: 2017–18 ....................................................................... 6
2. PSS data collection time schedule: 2017–18 ................................................................................... 7
3. Number of responding and nonresponding schools, out-of-scope cases, and school response rate, by frame: 2017–18 ......................................................................................... 9
4. Summary of 2017–18 PSS nonresponse bias statistics .................................................................. 11
5. Base-weighted PSS school frame distribution, interviewed distribution, estimated bias, percent relative bias, standard errors, and t statistic, by affiliation membership and selected school characteristics: 2017–18 ............................................................ 12
6. Final weighted PSS school frame distribution, interviewed distribution, estimated bias, percent relative bias, standard errors, and t statistic, by affiliation membership and selected school characteristics: 2017–18 ............................................................ 14
7. PSS item response rates for private schools: 2017–18 .................................................................. 16
I. Overview 1
I. Overview The Private School Universe Survey (PSS) is conducted by the National Center for Education Statistics (NCES) on behalf of the U.S. Department of Education in order to collect basic information on American private elementary and secondary schools. PSS grew out of a proposal in 1988 to develop a private school data collection that would improve on the sporadic collection of private school data dating back to 1890 and improve on commercially available private school sampling frames. PSS was first collected in the 1989–90 school year, with data collections every 2 years since. The target population for PSS is all schools in the United States that are not supported primarily by public funds, provide classroom instruction for one or more of grades kindergarten through 12 (or comparable ungraded levels), and have one or more teachers. Organizations or institutions that provide support for homeschooling but do not provide classroom instruction are not included.
Purpose and Content of the Survey PSS is currently designed to generate biennial data on the total number of private schools, teachers, and students, and to build a universe of private schools to serve as a sampling frame for NCES sample surveys. Data collected included enrollment by grade, enrollment by student race/ethnicity and sex, number of high school graduates, number of teachers, program emphasis, existence and type of kindergarten program, school religious orientation or affiliation, association membership, number of days in the school year and length of the school day, and whether the school had a library media center. A copy of the 2017–18 PSS questionnaire is contained in appendix A.
Content of the Manual This Manual contains sections covering frame creation, data collection procedures and response rates, data preparation, guide to the public-use data file and codebook, and user notes and cautions. Information in the chapters is supported by material in the appendices. Appendix A contains a copy of the 2017–18 PSS questionnaire, appendix B contains the list of variables and record layout of the public-use tab-delimited ASCII file, and appendix C contains the 2017–18 PSS public-use codebook.
2 PSS: Public-Use Data File User’s Manual for School Year 2017–18
II. Frame Creation Since PSS attempts to include every private school in the United States, a universe list of private schools meeting the PSS definition (i.e., not supported primarily by public funds, providing classroom instruction for one or more of grades kindergarten through 12—or comparable ungraded levels, and having one or more teachers) must be created. Since 1983, NCES has used a dual frame approach for building the private school universe (Beller 1984). The dual frame consists of a list frame and an area frame. The combination of the list frame schools and additional schools identified in the area frame comprised the schools included in the 2017–18 PSS.
List Frame The list-building component was the primary means for improving coverage of private schools. The basis for the 2017–18 PSS list frame was the private schools from both the 2015–16 PSS list frame and the certainty portion1 of the 2015–16 area frame. In order to provide coverage of private schools founded since 2015 and to improve coverage of private schools existing in 2015, membership lists from 27 private school associations and religious denominations were received and processed. The departments of education from each of the 50 states and the District of Columbia were asked to provide lists of private schools, and 50 lists were received and processed. Additional private schools that submitted requests to NCES to be included in PSS were added to the list frame. Schools on private school association membership lists, the state lists, and the early childhood lists were compared to the base list, and any school that did not match a school on the base list was added to the private school universe list. The total number of private schools added by the 2017–18 list-building operation was 5,959 resulting in a total list frame of 40,563 schools.
Area Frame To identify private schools that might have been overlooked in the list-building component, a group of geographic areas was selected to be searched for private schools. The United States is divided by the Census Bureau into 2,062 primary sampling units (PSUs), each PSU consisting of a single county, independent city, or group of contiguous counties. The eight PSUs (Los Angeles and Orange Counties, California; Harris County, Texas; Cook County, Illinois; Queens and Kings Counties, New York; Miami-Dade County, Florida; and Philadelphia County, Pennsylvania) with the highest private school enrollment in the 2010 American Community Survey were included in the 2017–18 PSS area frame with certainty. One hundred and sixteen PSUs were selected by stratified random sampling from the 2,054 noncertainty PSUs.2 A total of 124 distinct PSUs (160 counties) were in the 2017–18 PSS area frame sample. Within each of these PSUs, the Census Bureau attempted to find all eligible private schools. A block-by-block listing of all private schools in a sample of PSUs was not attempted. Rather, Census Bureau Center staff created the frame by using such sources as online yellow pages (https://www.yellowpages.com/?re=yp), local Catholic dioceses, local education agencies, and local government offices. The Census Bureau also obtained a list of eligible private schools for area frame sample PSUs from the InfoUSA database.3 Once 1 Schools selected from the eight primary sampling units (PSUs) that are included with certainty each PSS administration (see "Area Frame" below). 2 The PSS sample PSUs were selected systematically with probabilities proportional to the square root of the 2010 American Community Survey PSU private school enrollment. 3 See http://www.infousa.com/.
II. Frame Creation 3
the area search lists were constructed, they were matched with the NCES private school universe list. Schools already on the universe list were deleted from the area frame. A total of 2,821 schools were added to the universe from the area frame.
Weighting The final weights are needed to have the estimates reflect the population of private schools when analyzing the data. The data from the area frame component were weighted to reflect the sampling rates (probability of selection) of the PSUs. Survey data from both the list and area frame components were adjusted for school nonresponse. The final weight for PSS data items is the product of the Basic Weight and the Nonresponse Adjustment Factor, where:
Basic Weight is the inverse of the probability of selection of the school. The basic weight is equal to one for all list-frame schools. For area-frame schools, the basic weight is equal to the inverse of the probability of selecting the PSU in which the school resides. Nonresponse Adjustment Factor is an adjustment that accounts for school nonresponse. It is the weighted (base weight) ratio of the total eligible in-scope schools (interviewed schools plus noninterviewed schools) to the total responding in-scope schools (interviewed schools) within cells. Noninterviewed and out-of-scope cases are assigned a nonresponse adjustment factor of zero.
The cells used to compute the nonresponse adjustment were defined differently for list-frame and area-frame schools. For schools in the list frame, the cells were defined by affiliation (17 categories), locale type (4 categories), grade level (4 categories), Census region (4 categories), and enrollment (up to 20 categories). The nonresponse adjustment cells for area-frame schools were defined by three-level typology (3 categories) and grade level (4 categories). If the number of schools in a cell was fewer than 15 or the nonresponse adjustment factor was greater than 1.5, then that cell was collapsed into a similar cell. The variables used to collapse the cells and the collapse order varied according to whether the school was from the list or area frame and whether a school was a traditional or k-terminal school. The cells for traditional schools from the list frame were collapsed within enrollment category, locale type, grade level, and Census region. Cells for k-terminal schools from the list frame were collapsed within enrollment category, locale type, Census region, and affiliation. Cells for traditional schools from the area frame were collapsed within grade level and then within three-level typology. Cells for k-terminal schools from the area frame were collapsed within three-level typology.
Variance Estimation In surveys with complex sample designs, direct estimates of sampling errors that assume a simple random sample will typically underestimate the variability in the estimates. The PSS sample design and estimation included procedures that deviate from the assumption of simple random sampling, primarily resulting from the stratified cluster sampling occurring in the area frame.
Producing Replicate Weights The preferred method of calculating sampling errors to reflect these aspects of the complex sample design of PSS is using replication. Replication methods involve constructing a number of subsamples, or replicates, from the full sample and computing the statistic of interest for each replicate. The mean square
4 PSS: Public-Use Data File User’s Manual for School Year 2017–18
error of the replicate estimates around the full sample estimate provides an estimate of the variance of the statistic. The replicate weights are used to compute the variance of a statistic, Y, as given below:
Variance ∑ −
=
rr YY
nY 2)(1)(
where: Yr = the estimate of Y using the rth set of replicate weights n = the number of replicates PSS uses a procedure known as balanced repeated replication (BRR) for the calculation of sampling variance. BRR assumes sampling is done with replacement, and hence, BRR does not reflect the increase in precision due to sampling a large proportion of a finite population. To execute the BRR procedure, half-samples are defined by pairing sample PSUs within each sampling stratum, forming variance strata. The final product is 88 replicate weights. After the variance strata were assigned, an orthogonal matrix (matrix H where: HHT = nIn where In is the identity matrix of order n) was used to form the 88 balanced half-sample replicates.
Applying Replicate Weights Each PSS data file includes a set of 88 replicate weights designed to produce variance estimates. Replicate weights were created for each of the 88 samples using the same estimation procedures used for the full sample and are included in the data file. The replicate weights for PSS are REPW1 to REPW88. The computation of sampling errors using these replicate weights can be done easily using one of the following software: AM Statistical Software, SAS, STATA, SUDAAN, or WesVar Complex Sample Software.
• AM. The user needs to set the replicate weights along with the replication method using the right-click context menu in the variable list window. Once the “Set Replicate Weights” window is displayed, the replicate weights as identified above can be highlighted and dragged into the window. At the bottom of the window are four options for replication method; BRR should be selected. For more information, visit http://am.air.org.
• SAS. Standard errors based on BRR can be generated in SAS version 9.2 or higher using the survey procedures (SURVEYMEANS, SURVEYFREQ, SURVEYREG, and SURVEYLOGISTIC) available in the SAS/STAT module. (This module is an addition to the Base SAS software). The BRR method is specified in the PROC statement using the VARMETHOD option parameter (VARMETHOD=BRR). The replicate weight variables are specified using the REPWEIGHT statement (REPWEIGHTS variables;). For more information, see http://www.sas.com/.
• Stata. Standard errors based on BRR can be generated in Stata using the ‘svy’ commands. The data must first be declared as complex survey data using the ‘svyset’ command. This command also designates variables that contain information about the survey design, and specifies the default method for variance estimation. The ‘vce’ option to this command should be set for “brr” (“vce(brr)”) for balanced repeated replication; the weight variables are specified with the option ‘brrweight(varlist)’. For more information, see the Stata website at https://www.stata.com.
II. Frame Creation 5
SUDAAN. The user needs to specify the sample design as a “Balanced Repeated replication” design as well as specifying the replicate weight variables. Specifying the sample design (DESIGN = BRR) is done in the procedure call statement (i.e., PROC DESCRIPT DESIGN = BRR;). The specification of the replicate weights is done with the REPWGT statement (i.e., to produce the sampling errors for estimates use the statement: REPWGT REPW1-REPW88;). For more information, visit www.rti.org/sudaan/.
• WesVar. The user needs to create a new WesVar data file by specifying the full sample weight variable and the replicate weight variables as defined above, and the replication method, BRR. The replicate weights and the full sample weight can be highlighted and dragged to their appropriate place on the “New WesVar Data File” window. For more information, visit https://www.westat.com/our-work/.
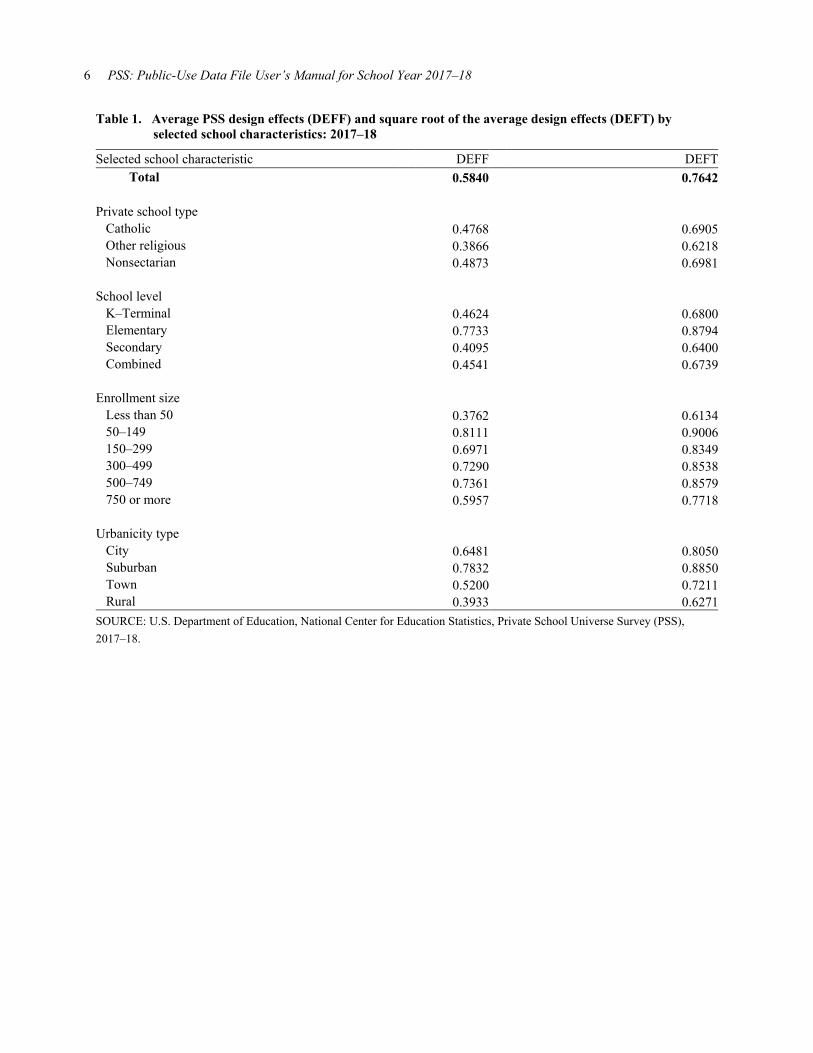
Approximate Sampling Errors Although the preferred method of calculating sampling errors to reflect the aspects of the complex sample design of PSS is using BRR, it is also possible to obtain approximate standard errors by simpler methods. One such method uses design effects (DEFF) of some key estimates obtained from the survey. The design effect of a survey estimate is defined as the ratio of the variance of the estimate under the sampling design used for the survey to the variance of the estimate under simple random sampling. In stratified sampling designs like the one used for the 2017–18 PSS, cases within a particular stratum tend to have responses that are more similar than if the cases were chosen completely at random from the population. The appropriate value of DEFF depends on the particular domain being analyzed (e.g., the DEFF for secondary schools is different than that for elementary schools). Since each estimate has a different design effect and these may be unstable, an average DEFF was computed over different variables. Table 1 gives average values of DEFF for selected subgroups. A simple method of obtaining the approximate standard error of an estimate from the survey is to first compute the standard error of the estimate under simple random sampling and multiply the standard error by the square root of the design effect (DEFT). An example of how to approximate the standard error of a survey mean is as follows. First, the mean should be estimated using the full sample weight and any standard statistical package like SAS or SPSS. Next, the standard error of the estimate should be obtained under simple random sampling without using weights. These simple random sample standard errors should not include any finite population correction. This unweighted standard error should then be multiplied by the square root of the average design effect to get the approximate standard error of the mean under the design. For example, suppose that the estimated (weighted) mean number of students in elementary schools is 108 and the simple random sampling standard error (unweighted) is 4.20 students. The approximate standard error for the estimate would then be 3.69 (i.e., 4.20 students times .8794, the DEFT for elementary schools (table 1).
6 PSS: Public-Use Data File User’s Manual for School Year 2017–18
Table 1. Average PSS design effects (DEFF) and square root of the average design effects (DEFT) by selected school characteristics: 2017–18
Selected school characteristic DEFF DEFT Total 0.5840 0.7642
Private school type Catholic 0.4768 0.6905 Other religious 0.3866 0.6218 Nonsectarian 0.4873 0.6981
School level K–Terminal 0.4624 0.6800 Elementary 0.7733 0.8794 Secondary 0.4095 0.6400 Combined 0.4541 0.6739
Enrollment size Less than 50 0.3762 0.6134 50–149 0.8111 0.9006 150–299 0.6971 0.8349 300–499 0.7290 0.8538 500–749 0.7361 0.8579 750 or more 0.5957 0.7718
Urbanicity type City 0.6481 0.8050 Suburban 0.7832 0.8850 Town 0.5200 0.7211 Rural 0.3933 0.6271 SOURCE: U.S. Department of Education, National Center for Education Statistics, Private School Universe Survey (PSS), 2017–18.
III. Data Collection 7
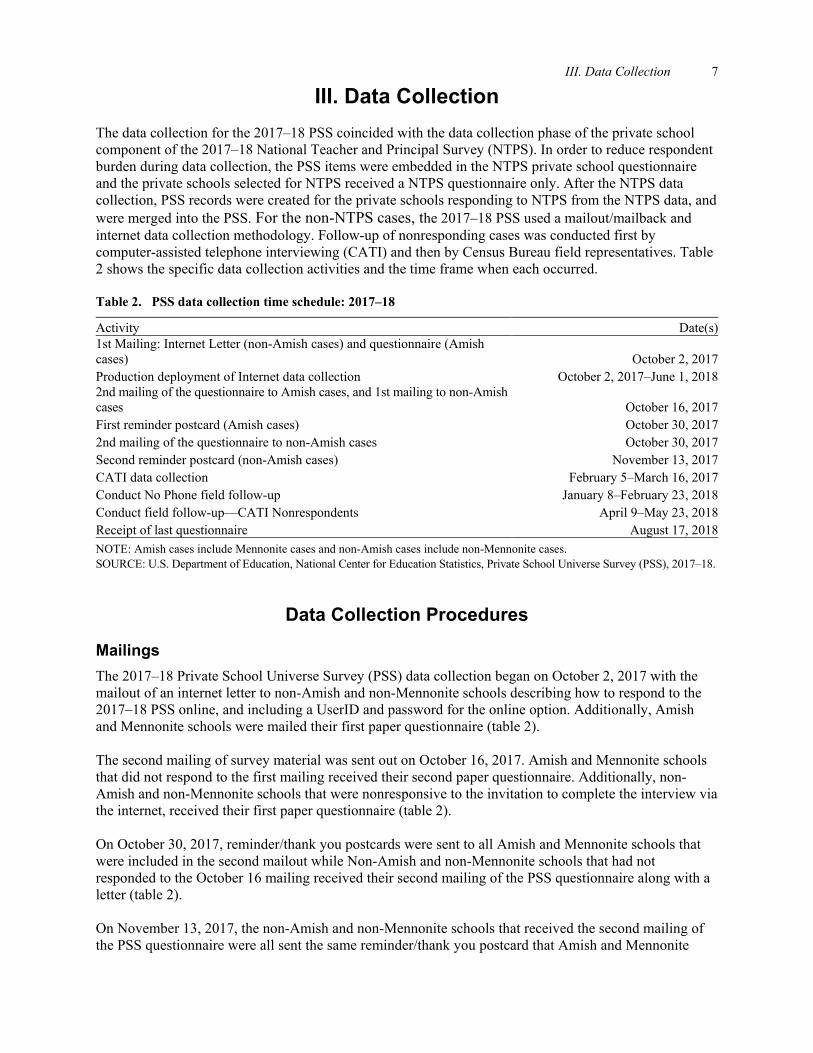
III. Data Collection The data collection for the 2017–18 PSS coincided with the data collection phase of the private school component of the 2017–18 National Teacher and Principal Survey (NTPS). In order to reduce respondent burden during data collection, the PSS items were embedded in the NTPS private school questionnaire and the private schools selected for NTPS received a NTPS questionnaire only. After the NTPS data collection, PSS records were created for the private schools responding to NTPS from the NTPS data, and were merged into the PSS. For the non-NTPS cases, the 2017–18 PSS used a mailout/mailback and internet data collection methodology. Follow-up of nonresponding cases was conducted first by computer-assisted telephone interviewing (CATI) and then by Census Bureau field representatives. Table 2 shows the specific data collection activities and the time frame when each occurred. Table 2. PSS data collection time schedule: 2017–18
Activity Date(s) 1st Mailing: Internet Letter (non-Amish cases) and questionnaire (Amish cases) October 2, 2017 Production deployment of Internet data collection October 2, 2017–June 1, 2018 2nd mailing of the questionnaire to Amish cases, and 1st mailing to non-Amish cases October 16, 2017 First reminder postcard (Amish cases) October 30, 2017 2nd mailing of the questionnaire to non-Amish cases October 30, 2017 Second reminder postcard (non-Amish cases) November 13, 2017 CATI data collection February 5–March 16, 2017 Conduct No Phone field follow-up January 8–February 23, 2018 Conduct field follow-up—CATI Nonrespondents April 9–May 23, 2018 Receipt of last questionnaire August 17, 2018 NOTE: Amish cases include Mennonite cases and non-Amish cases include non-Mennonite cases. SOURCE: U.S. Department of Education, National Center for Education Statistics, Private School Universe Survey (PSS), 2017–18.
Data Collection Procedures
Mailings The 2017–18 Private School Universe Survey (PSS) data collection began on October 2, 2017 with the mailout of an internet letter to non-Amish and non-Mennonite schools describing how to respond to the 2017–18 PSS online, and including a UserID and password for the online option. Additionally, Amish and Mennonite schools were mailed their first paper questionnaire (table 2). The second mailing of survey material was sent out on October 16, 2017. Amish and Mennonite schools that did not respond to the first mailing received their second paper questionnaire. Additionally, non-Amish and non-Mennonite schools that were nonresponsive to the invitation to complete the interview via the internet, received their first paper questionnaire (table 2). On October 30, 2017, reminder/thank you postcards were sent to all Amish and Mennonite schools that were included in the second mailout while Non-Amish and non-Mennonite schools that had not responded to the October 16 mailing received their second mailing of the PSS questionnaire along with a letter (table 2). On November 13, 2017, the non-Amish and non-Mennonite schools that received the second mailing of the PSS questionnaire were all sent the same reminder/thank you postcard that Amish and Mennonite
8 PSS: Public-Use Data File User’s Manual for School Year 2017–18
schools received. The PSS (mail and Internet) return rate before the start of CATI (February 05, 2018) was 45 percent.4
Nonresponse Follow-up
Telephone Follow-up Telephone Follow-up took place at once for both List Frame and Area Search Frame (ASF) schools, as opposed to separate waves as had been done in the past. The operation began on February 5, 2018, and only involved PSS schools that had not responded by mail or on the internet for which phone numbers were available. Telephone interviewing took place at the Census Bureau’s CATI facilities located in Tucson, Arizona and Jeffersonville, Indiana. CATI follow-up for PSS cases with a phone number continued through March 16, 2018.
Field Follow-up The Census Bureau’s 6 Regional Field Offices began in-person no-phone follow-up on January 8, 2018 on PSS cases that did not have a telephone number listed. Follow-up of these schools continued through February 23, 2018. Following CATI closeout of schools in mid-March, additional follow-up was conducted by Census Bureau field representatives. Field follow-up continued through May 23, 2018 (table 2).
Interviewer Training CATI interviewers and Census Bureau regional office representatives conducting the PSS field follow-up received training on the content and data collection procedures for the 2017–18 PSS. CATI operator training consisted of 1 hour of self study and 3 hours of classroom instruction conducted at the Census Bureau’s CATI facilities in Tucson, Arizona and Jeffersonville, Indiana. The Tucson training had approximately 60 staff attend and the Jeffersonville training had approximately 50 attendees. Training for field representatives consisted of 2 hours of self study. Five hundred and sixty field representatives completed training for the two field follow-up operations.
Efforts to increase Response Rates Several steps were taken to maximize response rates during data collection. A prepaid business reply envelope was included in the questionnaire mailings for respondents to use when returning the completed questionnaires. The second questionnaire mailings were followed one week later with reminder postcards. In addition, a toll-free number and an e-mail address were provided for respondents to contact with inquires regarding the survey. Multiple follow-up contacts were made to nonrespondents by telephone and in person.
4 The return rates cited in the data collection portion of the documentation are unweighted return rates calculated by dividing the total number of returns (interviews, refusals, and out-of-scopes) less undeliverable as addressed/blank questionnaires by the total number of schools.
III. Data Collection 9
Response Rates
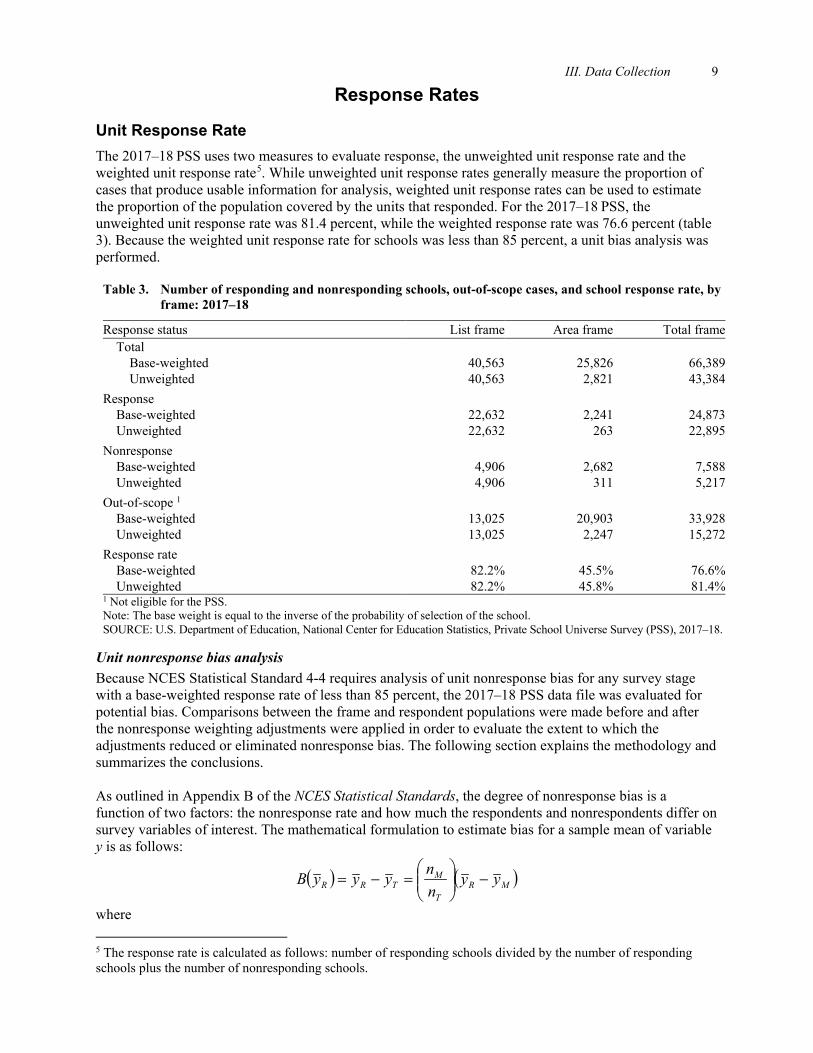
Unit Response Rate The 2017–18 PSS uses two measures to evaluate response, the unweighted unit response rate and the weighted unit response rate5. While unweighted unit response rates generally measure the proportion of cases that produce usable information for analysis, weighted unit response rates can be used to estimate the proportion of the population covered by the units that responded. For the 2017–18 PSS, the unweighted unit response rate was 81.4 percent, while the weighted response rate was 76.6 percent (table 3). Because the weighted unit response rate for schools was less than 85 percent, a unit bias analysis was performed.
Table 3. Number of responding and nonresponding schools, out-of-scope cases, and school response rate, by frame: 2017–18
Response status List frame Area frame Total frame Total
Base-weighted 40,563 25,826 66,389 Unweighted 40,563 2,821 43,384
Response Base-weighted 22,632 2,241 24,873 Unweighted 22,632 263 22,895
Nonresponse Base-weighted 4,906 2,682 7,588 Unweighted 4,906 311 5,217
Out-of-scope 1 Base-weighted 13,025 20,903 33,928 Unweighted 13,025 2,247 15,272
Response rate Base-weighted 82.2% 45.5% 76.6% Unweighted 82.2% 45.8% 81.4%
1 Not eligible for the PSS. Note: The base weight is equal to the inverse of the probability of selection of the school. SOURCE: U.S. Department of Education, National Center for Education Statistics, Private School Universe Survey (PSS), 2017–18.
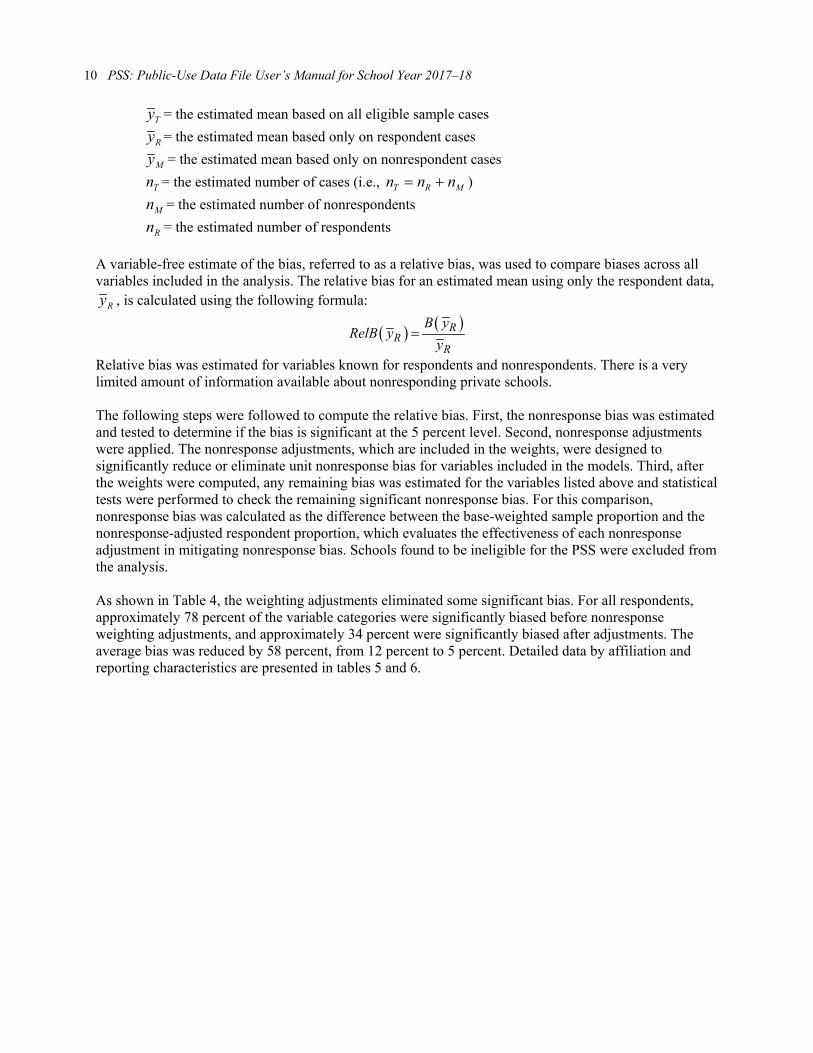
Unit nonresponse bias analysis Because NCES Statistical Standard 4-4 requires analysis of unit nonresponse bias for any survey stage with a base-weighted response rate of less than 85 percent, the 2017–18 PSS data file was evaluated for potential bias. Comparisons between the frame and respondent populations were made before and after the nonresponse weighting adjustments were applied in order to evaluate the extent to which the adjustments reduced or eliminated nonresponse bias. The following section explains the methodology and summarizes the conclusions. As outlined in Appendix B of the NCES Statistical Standards, the degree of nonresponse bias is a function of two factors: the nonresponse rate and how much the respondents and nonrespondents differ on survey variables of interest. The mathematical formulation to estimate bias for a sample mean of variable y is as follows:
( ) ( )MRT
MTRR yy
nnyyyB −
=−=
where 5 The response rate is calculated as follows: number of responding schools divided by the number of responding schools plus the number of nonresponding schools.
10 PSS: Public-Use Data File User’s Manual for School Year 2017–18
Ty = the estimated mean based on all eligible sample cases
Ry = the estimated mean based only on respondent cases
My = the estimated mean based only on nonrespondent cases
Tn = the estimated number of cases (i.e., MRT nnn += )
Mn = the estimated number of nonrespondents
Rn = the estimated number of respondents
A variable-free estimate of the bias, referred to as a relative bias, was used to compare biases across all variables included in the analysis. The relative bias for an estimated mean using only the respondent data,
Ry , is calculated using the following formula:
( ) ( )RR
R
B yRelB y
y=
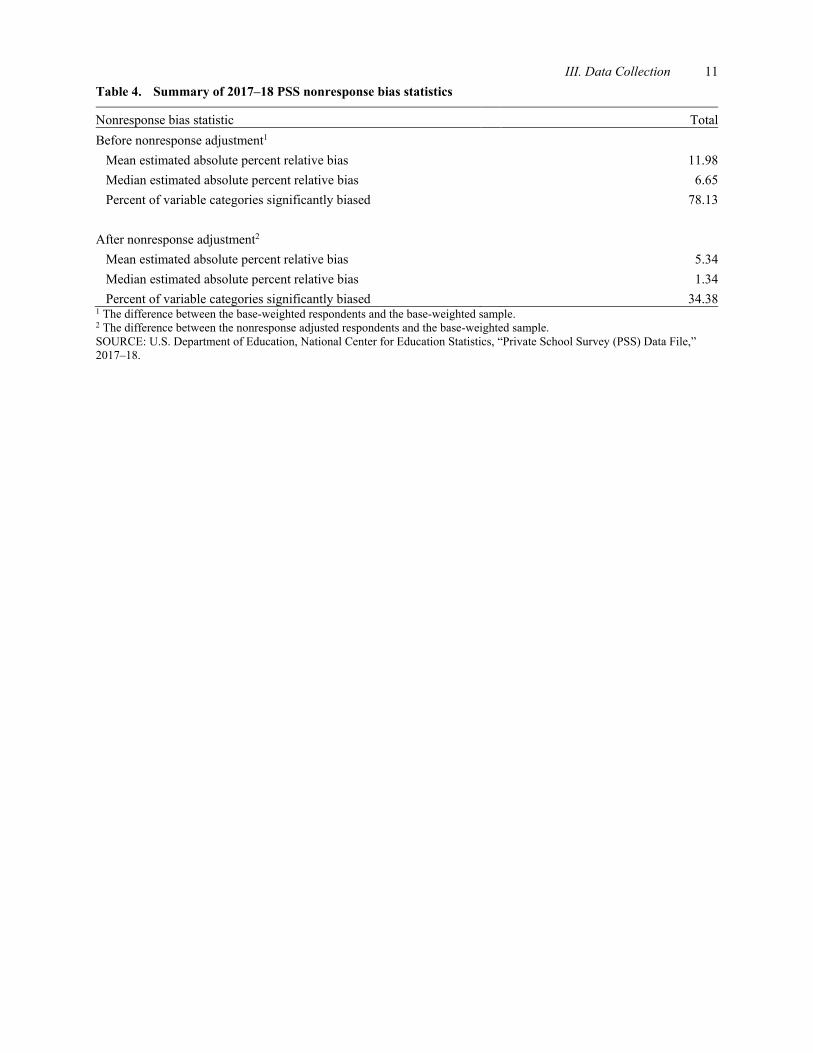
Relative bias was estimated for variables known for respondents and nonrespondents. There is a very limited amount of information available about nonresponding private schools. The following steps were followed to compute the relative bias. First, the nonresponse bias was estimated and tested to determine if the bias is significant at the 5 percent level. Second, nonresponse adjustments were applied. The nonresponse adjustments, which are included in the weights, were designed to significantly reduce or eliminate unit nonresponse bias for variables included in the models. Third, after the weights were computed, any remaining bias was estimated for the variables listed above and statistical tests were performed to check the remaining significant nonresponse bias. For this comparison, nonresponse bias was calculated as the difference between the base-weighted sample proportion and the nonresponse-adjusted respondent proportion, which evaluates the effectiveness of each nonresponse adjustment in mitigating nonresponse bias. Schools found to be ineligible for the PSS were excluded from the analysis. As shown in Table 4, the weighting adjustments eliminated some significant bias. For all respondents, approximately 78 percent of the variable categories were significantly biased before nonresponse weighting adjustments, and approximately 34 percent were significantly biased after adjustments. The average bias was reduced by 58 percent, from 12 percent to 5 percent. Detailed data by affiliation and reporting characteristics are presented in tables 5 and 6.
III. Data Collection 11
Table 4. Summary of 2017–18 PSS nonresponse bias statistics
Nonresponse bias statistic Total Before nonresponse adjustment1 Mean estimated absolute percent relative bias 11.98 Median estimated absolute percent relative bias 6.65 Percent of variable categories significantly biased 78.13 After nonresponse adjustment2 Mean estimated absolute percent relative bias 5.34 Median estimated absolute percent relative bias 1.34 Percent of variable categories significantly biased 34.38 1 The difference between the base-weighted respondents and the base-weighted sample. 2 The difference between the nonresponse adjusted respondents and the base-weighted sample. SOURCE: U.S. Department of Education, National Center for Education Statistics, “Private School Survey (PSS) Data File,” 2017–18.
12 PSS: Public-Use Data File User’s Manual for School Year 2017–18
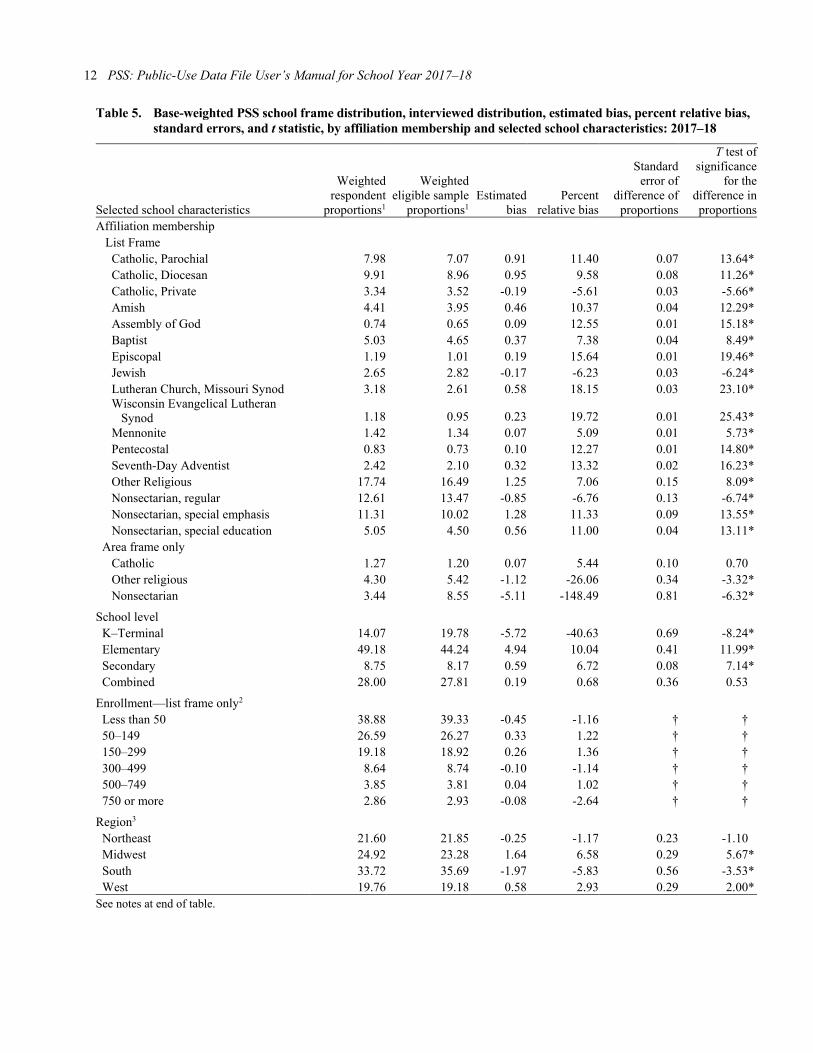
Table 5. Base-weighted PSS school frame distribution, interviewed distribution, estimated bias, percent relative bias, standard errors, and t statistic, by affiliation membership and selected school characteristics: 2017–18
Selected school characteristics
Weighted respondent
proportions1
Weighted eligible sample
proportions1 Estimated
bias Percent
relative bias
Standard error of
difference of proportions
T test of significance
for the difference in proportions
Affiliation membership List Frame Catholic, Parochial 7.98 7.07 0.91 11.40 0.07 13.64 * Catholic, Diocesan 9.91 8.96 0.95 9.58 0.08 11.26 * Catholic, Private 3.34 3.52 -0.19 -5.61 0.03 -5.66 * Amish 4.41 3.95 0.46 10.37 0.04 12.29 * Assembly of God 0.74 0.65 0.09 12.55 0.01 15.18 * Baptist 5.03 4.65 0.37 7.38 0.04 8.49 * Episcopal 1.19 1.01 0.19 15.64 0.01 19.46 * Jewish 2.65 2.82 -0.17 -6.23 0.03 -6.24 * Lutheran Church, Missouri Synod 3.18 2.61 0.58 18.15 0.03 23.10 * Wisconsin Evangelical Lutheran Synod 1.18 0.95 0.23 19.72 0.01 25.43 * Mennonite 1.42 1.34 0.07 5.09 0.01 5.73 * Pentecostal 0.83 0.73 0.10 12.27 0.01 14.80 * Seventh-Day Adventist 2.42 2.10 0.32 13.32 0.02 16.23 * Other Religious 17.74 16.49 1.25 7.06 0.15 8.09 * Nonsectarian, regular 12.61 13.47 -0.85 -6.76 0.13 -6.74 * Nonsectarian, special emphasis 11.31 10.02 1.28 11.33 0.09 13.55 * Nonsectarian, special education 5.05 4.50 0.56 11.00 0.04 13.11 * Area frame only Catholic 1.27 1.20 0.07 5.44 0.10 0.70 Other religious 4.30 5.42 -1.12 -26.06 0.34 -3.32 * Nonsectarian 3.44 8.55 -5.11 -148.49 0.81 -6.32 *
School level K–Terminal 14.07 19.78 -5.72 -40.63 0.69 -8.24 * Elementary 49.18 44.24 4.94 10.04 0.41 11.99 * Secondary 8.75 8.17 0.59 6.72 0.08 7.14 * Combined 28.00 27.81 0.19 0.68 0.36 0.53
Enrollment—list frame only2 Less than 50 38.88 39.33 -0.45 -1.16 † † 50–149 26.59 26.27 0.33 1.22 † † 150–299 19.18 18.92 0.26 1.36 † † 300–499 8.64 8.74 -0.10 -1.14 † † 500–749 3.85 3.81 0.04 1.02 † † 750 or more 2.86 2.93 -0.08 -2.64 † †
Region3 Northeast 21.60 21.85 -0.25 -1.17 0.23 -1.10 Midwest 24.92 23.28 1.64 6.58 0.29 5.67 * South 33.72 35.69 -1.97 -5.83 0.56 -3.53 * West 19.76 19.18 0.58 2.93 0.29 2.00 * See notes at end of table.
III. Data Collection 13
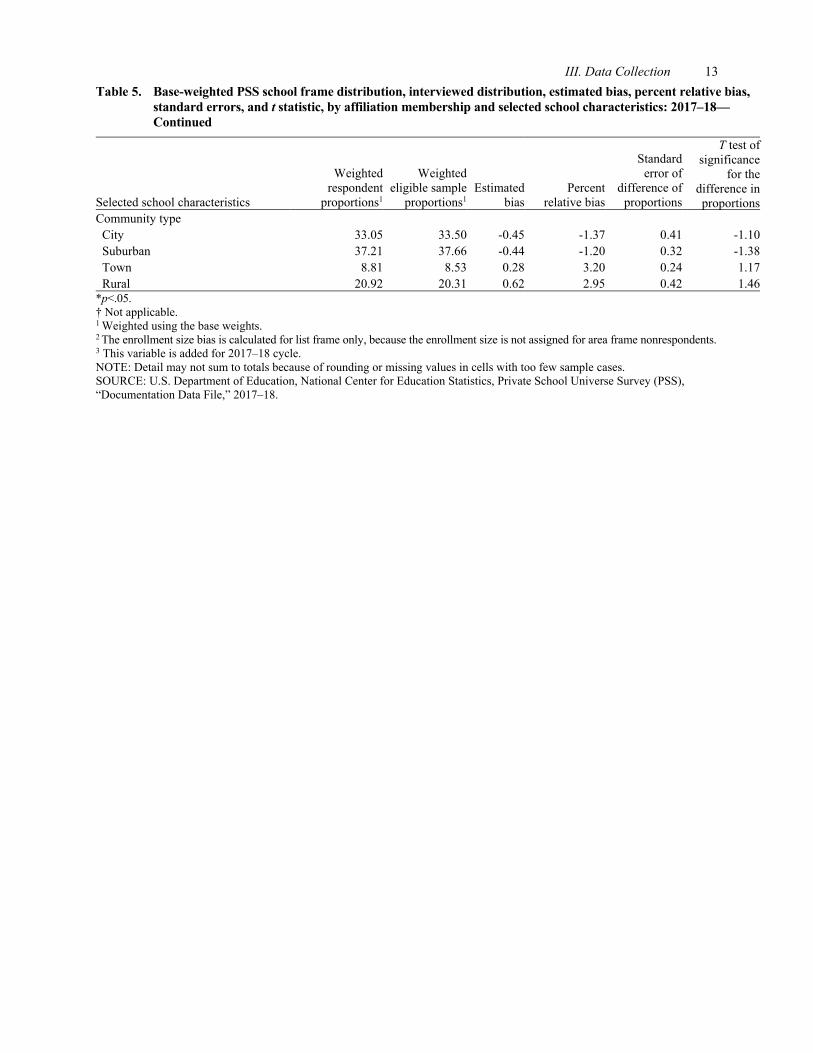
Table 5. Base-weighted PSS school frame distribution, interviewed distribution, estimated bias, percent relative bias, standard errors, and t statistic, by affiliation membership and selected school characteristics: 2017–18—Continued
Selected school characteristics
Weighted respondent
proportions1
Weighted eligible sample
proportions1 Estimated
bias Percent
relative bias
Standard error of
difference of proportions
T test of significance
for the difference in
proportions Community type City 33.05 33.50 -0.45 -1.37 0.41 -1.10 Suburban 37.21 37.66 -0.44 -1.20 0.32 -1.38 Town 8.81 8.53 0.28 3.20 0.24 1.17 Rural 20.92 20.31 0.62 2.95 0.42 1.46 *p<.05. † Not applicable. 1 Weighted using the base weights. 2 The enrollment size bias is calculated for list frame only, because the enrollment size is not assigned for area frame nonrespondents. 3 This variable is added for 2017–18 cycle. NOTE: Detail may not sum to totals because of rounding or missing values in cells with too few sample cases. SOURCE: U.S. Department of Education, National Center for Education Statistics, Private School Universe Survey (PSS), “Documentation Data File,” 2017–18.
14 PSS: Public-Use Data File User’s Manual for School Year 2017–18
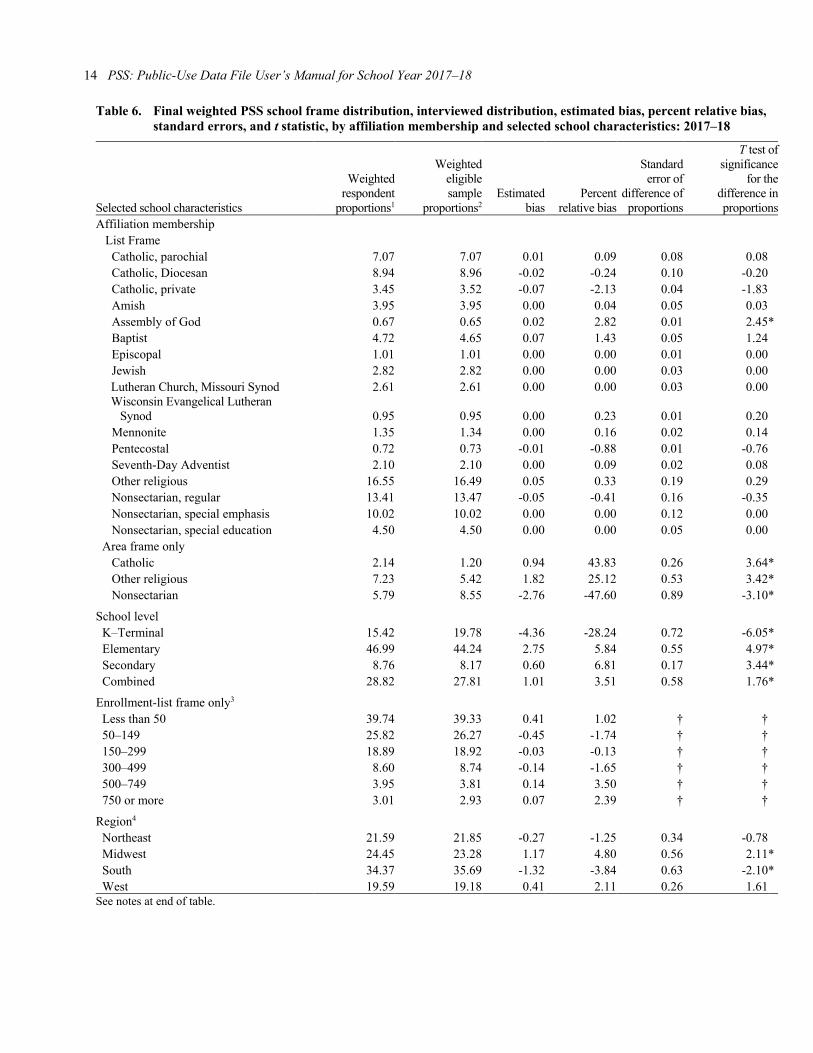
Table 6. Final weighted PSS school frame distribution, interviewed distribution, estimated bias, percent relative bias, standard errors, and t statistic, by affiliation membership and selected school characteristics: 2017–18
Selected school characteristics
Weighted respondent
proportions1
Weighted eligible sample
proportions2 Estimated
bias Percent
relative bias
Standard error of
difference of proportions
T test of significance
for the difference in
proportions Affiliation membership List Frame Catholic, parochial 7.07 7.07 0.01 0.09 0.08 0.08 Catholic, Diocesan 8.94 8.96 -0.02 -0.24 0.10 -0.20 Catholic, private 3.45 3.52 -0.07 -2.13 0.04 -1.83 Amish 3.95 3.95 0.00 0.04 0.05 0.03 Assembly of God 0.67 0.65 0.02 2.82 0.01 2.45 * Baptist 4.72 4.65 0.07 1.43 0.05 1.24 Episcopal 1.01 1.01 0.00 0.00 0.01 0.00 Jewish 2.82 2.82 0.00 0.00 0.03 0.00 Lutheran Church, Missouri Synod 2.61 2.61 0.00 0.00 0.03 0.00 Wisconsin Evangelical Lutheran Synod 0.95 0.95 0.00 0.23 0.01 0.20 Mennonite 1.35 1.34 0.00 0.16 0.02 0.14 Pentecostal 0.72 0.73 -0.01 -0.88 0.01 -0.76 Seventh-Day Adventist 2.10 2.10 0.00 0.09 0.02 0.08 Other religious 16.55 16.49 0.05 0.33 0.19 0.29 Nonsectarian, regular 13.41 13.47 -0.05 -0.41 0.16 -0.35 Nonsectarian, special emphasis 10.02 10.02 0.00 0.00 0.12 0.00 Nonsectarian, special education 4.50 4.50 0.00 0.00 0.05 0.00 Area frame only Catholic 2.14 1.20 0.94 43.83 0.26 3.64 * Other religious 7.23 5.42 1.82 25.12 0.53 3.42 * Nonsectarian 5.79 8.55 -2.76 -47.60 0.89 -3.10 * School level K–Terminal 15.42 19.78 -4.36 -28.24 0.72 -6.05 * Elementary 46.99 44.24 2.75 5.84 0.55 4.97 * Secondary 8.76 8.17 0.60 6.81 0.17 3.44 * Combined 28.82 27.81 1.01 3.51 0.58 1.76 * Enrollment-list frame only3 Less than 50 39.74 39.33 0.41 1.02 † † 50–149 25.82 26.27 -0.45 -1.74 † † 150–299 18.89 18.92 -0.03 -0.13 † † 300–499 8.60 8.74 -0.14 -1.65 † † 500–749 3.95 3.81 0.14 3.50 † † 750 or more 3.01 2.93 0.07 2.39 † † Region4 Northeast 21.59 21.85 -0.27 -1.25 0.34 -0.78 Midwest 24.45 23.28 1.17 4.80 0.56 2.11 * South 34.37 35.69 -1.32 -3.84 0.63 -2.10 * West 19.59 19.18 0.41 2.11 0.26 1.61 See notes at end of table.
III. Data Collection 15
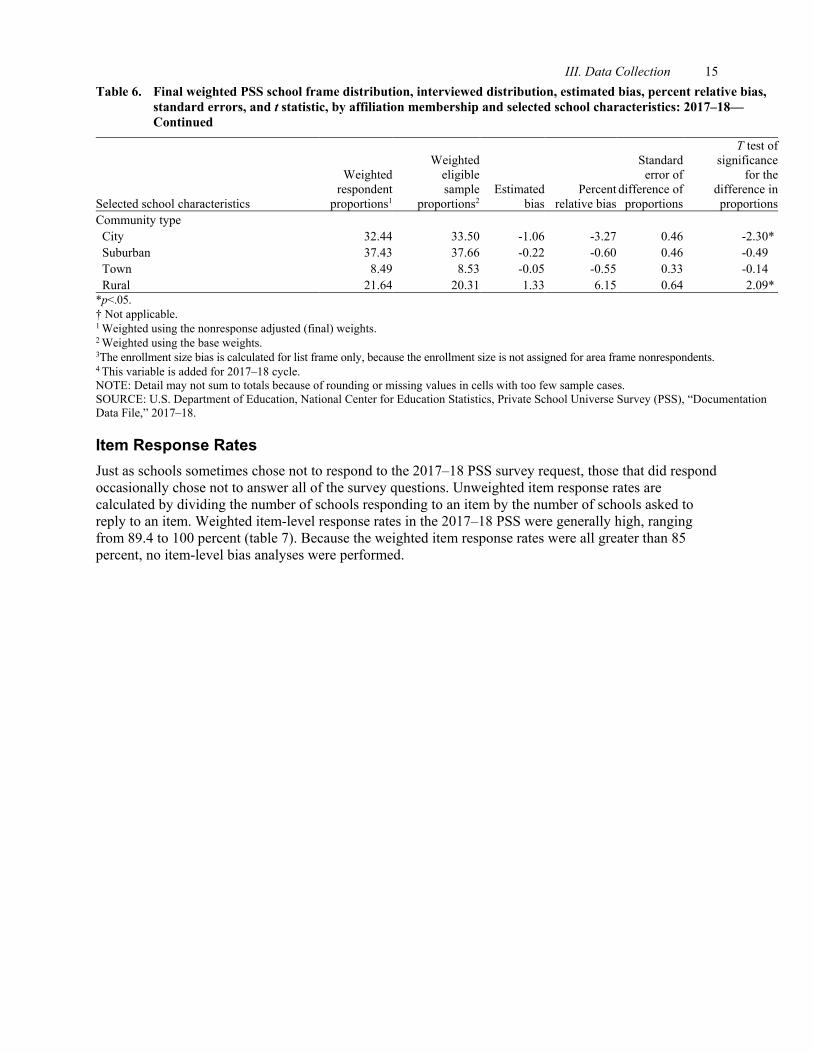
Table 6. Final weighted PSS school frame distribution, interviewed distribution, estimated bias, percent relative bias, standard errors, and t statistic, by affiliation membership and selected school characteristics: 2017–18—Continued
Selected school characteristics
Weighted respondent
proportions1
Weighted eligible sample
proportions2 Estimated
bias Percent
relative bias
Standard error of
difference of proportions
T test of significance
for the difference in
proportions Community type City 32.44 33.50 -1.06 -3.27 0.46 -2.30 * Suburban 37.43 37.66 -0.22 -0.60 0.46 -0.49 Town 8.49 8.53 -0.05 -0.55 0.33 -0.14 Rural 21.64 20.31 1.33 6.15 0.64 2.09 * *p<.05. † Not applicable. 1 Weighted using the nonresponse adjusted (final) weights.
2 Weighted using the base weights.
3The enrollment size bias is calculated for list frame only, because the enrollment size is not assigned for area frame nonrespondents.
4 This variable is added for 2017–18 cycle.
NOTE: Detail may not sum to totals because of rounding or missing values in cells with too few sample cases. SOURCE: U.S. Department of Education, National Center for Education Statistics, Private School Universe Survey (PSS), “Documentation Data File,” 2017–18.
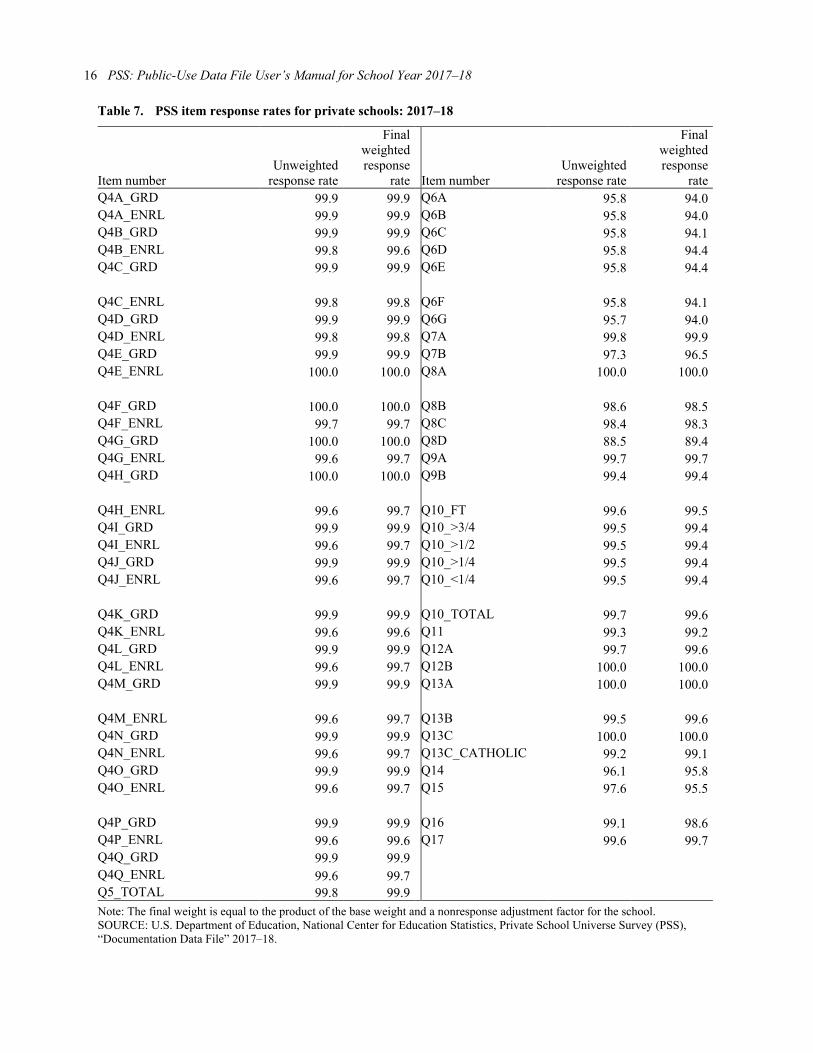
Item Response Rates Just as schools sometimes chose not to respond to the 2017–18 PSS survey request, those that did respond occasionally chose not to answer all of the survey questions. Unweighted item response rates are calculated by dividing the number of schools responding to an item by the number of schools asked to reply to an item. Weighted item-level response rates in the 2017–18 PSS were generally high, ranging from 89.4 to 100 percent (table 7). Because the weighted item response rates were all greater than 85 percent, no item-level bias analyses were performed.
16 PSS: Public-Use Data File User’s Manual for School Year 2017–18
Table 7. PSS item response rates for private schools: 2017–18
Item number Unweighted
response rate
Final weighted
Item number
Unweighted response rate
Final weighted response
rate response
rate
Q4A_GRD 99.9 99.9 Q6A 95.8 94.0 Q4A_ENRL 99.9 99.9 Q6B 95.8 94.0 Q4B_GRD 99.9 99.9 Q6C 95.8 94.1 Q4B_ENRL 99.8 99.6 Q6D 95.8 94.4 Q4C_GRD 99.9 99.9 Q6E 95.8 94.4
Q4C_ENRL 99.8 99.8 Q6F 95.8 94.1 Q4D_GRD 99.9 99.9 Q6G 95.7 94.0 Q4D_ENRL 99.8 99.8 Q7A 99.8 99.9 Q4E_GRD 99.9 99.9 Q7B 97.3 96.5 Q4E_ENRL 100.0 100.0 Q8A 100.0 100.0
Q4F_GRD 100.0 100.0 Q8B 98.6 98.5 Q4F_ENRL 99.7 99.7 Q8C 98.4 98.3 Q4G_GRD 100.0 100.0 Q8D 88.5 89.4 Q4G_ENRL 99.6 99.7 Q9A 99.7 99.7 Q4H_GRD 100.0 100.0 Q9B 99.4 99.4
Q4H_ENRL 99.6 99.7 Q10_FT 99.6 99.5 Q4I_GRD 99.9 99.9 Q10_>3/4 99.5 99.4 Q4I_ENRL 99.6 99.7 Q10_>1/2 99.5 99.4 Q4J_GRD 99.9 99.9 Q10_>1/4 99.5 99.4 Q4J_ENRL 99.6 99.7 Q10_<1/4 99.5 99.4
Q4K_GRD 99.9 99.9 Q10_TOTAL 99.7 99.6 Q4K_ENRL 99.6 99.6 Q11 99.3 99.2 Q4L_GRD 99.9 99.9 Q12A 99.7 99.6 Q4L_ENRL 99.6 99.7 Q12B 100.0 100.0 Q4M_GRD 99.9 99.9 Q13A 100.0 100.0
Q4M_ENRL 99.6 99.7 Q13B 99.5 99.6 Q4N_GRD 99.9 99.9 Q13C 100.0 100.0 Q4N_ENRL 99.6 99.7 Q13C_CATHOLIC 99.2 99.1 Q4O_GRD 99.9 99.9 Q14 96.1 95.8 Q4O_ENRL 99.6 99.7 Q15 97.6 95.5
Q4P_GRD 99.9 99.9 Q16 99.1 98.6 Q4P_ENRL 99.6 99.6 Q17 99.6 99.7 Q4Q_GRD 99.9 99.9 Q4Q_ENRL 99.6 99.7 Q5_TOTAL 99.8 99.9 Note: The final weight is equal to the product of the base weight and a nonresponse adjustment factor for the school. SOURCE: U.S. Department of Education, National Center for Education Statistics, Private School Universe Survey (PSS), “Documentation Data File” 2017–18.
IV. Data Preparation 17
IV. Data Preparation Questionnaire Check-in and Data Capture
Paper questionnaires returned by individual respondents and those completed by field representatives during field follow-up were sent to the Census Bureau’s National Processing Center (NPC) in Jeffersonville, Indiana. Upon receipt, codes were assigned to each questionnaire to indicate its status (e.g., complete interview, refusal, or out-of-scope). Then the questionnaires were grouped into batches for data capture. The 2017–18 PSS data were captured using a combination of manual data keying and imaging technology, using the Integrated Computer Assisted Data Entry (iCADE) system. The questionnaires were disassembled and each page was scanned. Clerical staff reviewed and resolved data issues due to system errors such as the inability to read a barcode, inability to recognize a page corner point, or checkbox ambiguities (e.g., marks outside checkbox, scratch outs, random marks on a page). Each imaged response was presented to a keying operator and all fields except the checkboxes were keyed from image (KFI). The checkboxes were captured using Optical Mark Recognition (OMR). All nonblank data fields were 100 percent KFI verified. After the PSS questionnaire data were captured, the output files from the different sources (keyed, Internet, and CATI) were merged into one file. Corrections to the name, address, and telephone numbers supplied by the respondents were then applied to the PSS file. These corrections were keyed, either by NPC or during the CATI interviews. All addresses were then checked with National Change of Address (NCOA) software, a commercial software package that corrects and standardizes addresses.
Computer Pre-Edit After data capture, the data were processed through a pre-edit designed to identify respondent errors in variables needed for determining interview status or imputation. This pre-edit program generated lists of cases where there were potential data problems. Census Bureau staff reviewed the computer record of cases that met each pre-edit rejection condition. All of the pre-edit conditions are listed in appendix F of the 2017–18 Private School Universe Survey (PSS) Survey Documentation (NCES 2019-076). Whenever possible, unacceptable entries were corrected by the analyst using information reported in other questionnaire items or information from other sources. Unacceptable entries that could not be corrected were blanked in the data record. These procedures are referred to as “pre-edits” because staff, rather than computer algorithms, handled computer-identified problems.
Computer Edit After pre-edit corrections were made, the file was submitted to a completely automated computer edit. This edit consisted of a consistency edit, a blanking edit, and a logic edit. The consistency edit identified inconsistent entries within each record. The fields compared could be within items (e.g., if the response in item 8a, whether any students were enrolled in 12th grade last year, was “No,” but the second part of the question reported 12th graders enrolled the previous year) or between items (e.g., if kindergarten was reported in item 4c and the response to item 9a indicated that the school did not offer kindergarten). Entries were corrected for those inconsistencies that could be resolved; for those that could not be resolved, the entries were deleted. The blanking edit assigned the “not answered” code to items that should have been answered but were not and deleted entries to items that should not have been answered. In the logic edit, data from the 2015–16 PSS were used to fill the items with missing values whenever possible. For example, if the type of school was not reported in item 11 and it had been reported on the
18 PSS: Public-Use Data File User’s Manual for School Year 2017–18
2015–16 PSS, the 2015–16 response was copied to the 2017–18 record. In addition to filling items where values were missing, some inconsistencies between students by race and total enrollment items were corrected by ratio adjustment during the logic edit. For records where the number of students in item 6 (students by race) did not equal the enrollment in item 5 (total enrollment), excluding prekindergarten, the item 6 entries were adjusted to be consistent with item 5; that is, each entry in item 6 was multiplied by the ratio of the student count in item 6 to the enrollment in item 5, excluding prekindergarten.
Imputation After the edit processing was complete, there were missing values within some records classified as interviews. These were cases where the respondent had not answered some applicable questionnaire items (and data for these items were not added in the pre-edit, consistency, or logic edit) or the response had been deleted during editing. Values were imputed to the missing data during imputation, which is described below.
Donor Imputation In donor imputation, values were created by extracting data from the record for a sample case (donor) with similar characteristics, using a procedure known as the “sequential nearest neighbor hot deck” (Kalton and Kasprzyk 1982, 1986; Kalton 1983; Little and Rubin 1987; Madow, Olkin, and Rubin 1983). In order to match incomplete records to those with complete data, “imputation” variables that identify certain characteristics of the school that were deemed to be important to the reporting of the data in each item (e.g., religious affiliation, enrollment, school level of instruction) were used. Items were grouped according to the perceived relevance of the imputation variables to the data collected by the item. For example, school level of instruction was used for matching incomplete records and donors to fill item 15 (length of school year) but was not used for item 6 (students by race). Items 12b (located in a private home that is used primarily as a family residence), 13a and 13c (religious orientation or purpose, and religious orientation or affiliation), and 14 (association membership) did not go through the donor imputation program. If, after the logic edit, item 12b or 14 was still incomplete, the assumption was made for item 12b that the school was not located in a private home and for item 14 that the school did not belong to any associations. If values were still missing for items 13a and 13c after the logic edit, the records were reviewed and imputed by an analyst.
Analyst Imputation After the donor imputation was completed, there were records that still had missing values for 60 items. These were cases where the imputation failed to create a value because there was no suitable record to use as a donor, or the value imputed was deleted because it was outside the acceptable range for the item or was inconsistent with other data on the same record, or the religious orientation or purpose, or the religious orientation or affiliation, was not reported (items 13a and 13c) and no previous PSS information was available. For these cases, values were imputed by analysts to the items with missing data. That is, staff reviewed the data record, sample file record, and the questionnaire and identified a value consistent with the information from these sources for imputation.
Imputation Flags The imputation flags indicate the imputation method used, such as donor imputation or analyst imputation. The codes used for imputation flags are described in section V.
V. Guide to the Public-Use Data File and Code Book 19
V. Guide to the Public-Use Data File and Code Book The 2017–18 PSS public-use data file contains data from all 22,895 completed interviews. The public-use data are available in SAS, SPSS, and in tab-delimited ASCII (text) format. The public-use materials include SAS and SPSS syntax files, and survey documentation for public-use data users in Adobe Portable Document Format (pdf), which includes the 2017–18 PSS questionnaire, an ASCII file layout, and a codebook with the public-use variables in appendices A, B, and C of this report, respectively.
Categories of Variables Variables on the public-use PSS data files fall into one of five categories: frame, survey, weighting, imputation flag, and composite variables. The purpose of these categories is to help the user better understand what types of variables are included on the files and what the sources were for the variables. Variables were classified as frame variables if they were drawn from the 2015–16 PSS file or based on the 2017–18 PSS frame update. Examples of frame variables include the school’s permanent identification number (PPIN) or the ZIP code of the school’s mailing address (PZIP). Survey variables are the actual variables drawn from the questionnaire responses. Each item on the questionnaire has a small number printed to the left. This number is the source code. A single letter “P” was added to the beginning of the source code to create the corresponding variable name. For example, item 5 has a source code of 305. On the data file, the variable name for this item is P305. There are two types of weighting variables on the file. The first is the final weight for the respondent, and the second includes the 88 replicate weights. The final weight adjusts for nonresponse and the sampling rates of the area-frame PSUs, and is used so that estimates represent the population of private schools. The replicate weights are used as a set to generate standard errors for estimates. On the file, the final weight is named PFNLWT, and the replicate weights are REPW1 to REPW88. The imputation flags identify whether a survey item was imputed for missing data. All survey variables have a corresponding imputation flag that indicates whether a value was imputed and, if so, what method was used. All survey imputation flags begin with “F_” and are followed by the name of the variable. For example, the imputation flag for P135 is F_P135. The flag values represent the type of imputation method used and are as follows:
0 = Value not imputed 4 = Imputed by using a donor value 5 = Data adjusted by analyst during review
Composite variables are based on survey variables, frame variables, or other created variables. These variables are frequently used in NCES publications and have been added to the files to facilitate data analysis. A list of the composite variables included in the file is presented in the next section with an explanation of how they were derived.
20 PSS: Public-Use Data File User’s Manual for School Year 2017–18
Composite Variables DIOCESE—Diocese of Catholic school: Purpose: To provide the Diocese in which a Catholic school is located. General explanation: Based on the Catholic school’s physical location (PCNTY). Values:
See codebook in appendix C. HIGR2018—Highest grade level in school: Purpose: To provide a measure of the highest grade level in the school. General explanation: The highest reported grade level in the school based on the grades offered (P135, P145, P155, P165, P175, P185, P195, P205, P215, P225, P235, P245, P255, P265, P275, P285, and P295). Values:
1 = All Ungraded (P135 = 1 and P145-P295 = 2) 2 = Highest grade in school is prekindergarten (P145 = 1 and P155-P295 = 2) 3 = Highest grade in school is kindergarten (P155 = 1 and P165-P295 = 2) 4 = Highest grade in school is transitional kindergarten (P165 = 1 and P175-P295 = 2) 5 = Highest grade in school is transitional 1st grade (P175 = 1 and P185-P295 = 2) 6 = Highest grade in school is 1st grade (P185 = 1 and P195-P295 = 2) 7 = Highest grade in school is 2nd grade (P195 = 1 and P205-P295 = 2) 8 = Highest grade in school is 3rd grade (P205 = 1 and P215-P295 = 2) 9 = Highest grade in school is 4th grade (P215 = 1 and P225-P295 = 2) 10 = Highest grade in school is 5th grade (P225 = 1 and P235-P295 = 2) 11 = Highest grade in school is 6th grade (P235 = 1 and P245-P295 = 2) 12 = Highest grade in school is 7th grade (P245 = 1 and P255-P295 = 2) 13 = Highest grade in school is 8th grade (P255 = 1 and P265-P295 = 2) 14 = Highest grade in school is 9th grade (P265 = 1 and P275-P295 = 2) 15 = Highest grade in school is 10th grade (P275 = 1 and P285-P295 = 2) 16 = Highest grade in school is 11th grade (P285 = 1 and P295 = 2) 17 = Highest grade in school is 12th grade (P295 = 1)
LEVEL—Grade level of school: Purpose: To provide a summary measure of the grades provided by the school. General explanation: Based on the grades offered (P135, P145, P155, P165, P175, P185, P195, P205, P215, P225, P235, P245, P255, P265, P275, P285, and P295). Values:
1 = Elementary: A school is elementary if it has one or more of grades K–6 and does not have any grade higher than grade 8.
2 = Secondary: A school is secondary if it has one or more of grades 7–12 and does not have any grade lower than grade 7.
3 = Combined: A school is classified as combined if it has one or more of grades K–6 and one or more of grades 9–12. Schools in which all students are ungraded (i.e., not classified by standard grade levels) are also classified as combined.
LATITUDE18—Latitude: Purpose: To provide a measure of a school’s location. General explanation: Based on the school’s physical location. Values:
The 3 digits to the left of the decimal represent the number of degrees from the equator; the 6 digits to the right of the decimal represent the fraction of the next degree carried out to six decimal places.
V. Guide to the Public-Use Data File and Code Book 21
LOGR2018—Lowest grade level in school: Purpose: To provide a measure of the lowest grade level in the school. General explanation: Based on the grades offered (P135, P145, P155, P165, P175, P185, P195, P205, P215, P225, P235, P245, P255, P265, P275, P285, and P295). Values:
1 = All Ungraded (P135 =1 and P145-P295 = 2) 2 = Lowest grade in school is prekindergarten (P145 = 1 and P135 = 2) 3 = Lowest grade in school is kindergarten (P155 = 1 and P135-P145 = 2) 4 = Lowest grade in school is transitional kindergarten (P165 = 1 and P135-P155 =2) 5 = Lowest grade in school is transitional 1st grade (P175 = 1 and P135-P165 = 2) 6 = Lowest grade in school is 1st grade (P185 = 1 and P135-P175 = 2) 7 = Lowest grade in school is 2nd grade (P195 = 1 and P135-P185 = 2) 8 = Lowest grade in school is 3rd grade (P205 = 1 and P135-P195 = 2) 9 = Lowest grade in school is 4th grade (P215 = 1 and P135-P205 = 2) 10 = Lowest grade in school is 5th grade (P225 = 1 and P135-P215 = 2) 11 = Lowest grade in school is 6th grade (P235 = 1 and P135-P225 = 2) 12 = Lowest grade in school is 7th grade (P245 = 1 and P135-P235 = 2) 13 = Lowest grade in school is 8th grade (P255 = 1 and P135-P245 = 2) 14 = Lowest grade in school is 9th grade (P265 = 1 and P135-P255 = 2) 15 = Lowest grade in school is 10th grade (P275 = 1 and P135-P265 = 2) 16 = Lowest grade in school is 11th grade (P285 = 1 and P135-P275 = 2) 17 = Lowest grade in school is 12th grade (P295 = 1 and P135-P285 = 2)
LONGITUDE18—Longitude: Purpose: To provide a measure of a school’s location. General explanation: Based on the school’s physical location. Values:
The 3 digits to the left of the decimal represent the number of degrees from the prime meridian; the 6 digits to the right of the decimal represent the fraction of the next degree carried out to six decimal places.
MALES—Number of K–12 and ungraded male students in the school: Purpose: To provide a measure for the total number of male students in the school. General explanation: Based on the coeducational status of the school (P335), the number of male students in coeducational schools (P340), and NUMSTUDS. Values:
MALES = P340 (if P335 = 1), 0 (if P335 = 2) or NUMSTUDS (if P335 = 3)
NUMSTUDS—Number of K–12 and ungraded students in the school: Purpose: To provide a summary measure of the non-prekindergarten enrollment in the school. General explanation: Based on the grades-by-grade enrollment (P140, P160, P170, P180, P190, P200, P210, P220, P230, P240, P250, P260, P270, P280, P290, and P300). Values:
NUMSTUDS = P140 + P160 + P170 + P180 + P190 + P200 + P210 + P220 + P230 + P240 + P250 + P260 + P270 + P280 + P290 + P300
22 PSS: Public-Use Data File User’s Manual for School Year 2017–18
NUMTEACH—Number of Full-Time-Equivalent (FTE) teachers in the school: Purpose: To provide a measure of the number of FTE teachers in the school. General explanation: Based on the number of teachers in each full-time and part-time work status category (P385, P390, P395, P400, and P405) Values:
NUMTEACH = P385 + (.875 x P390) + (.625 x P395) + (.375 x P400) + (.125 x P405) ORIENT—School’s religious or nonsectarian orientation: Purpose: To provide a detailed religious and nonsectarian classification of private schools. General explanation: Based on the school’s religious orientation (P430) or affiliation (P440): Values:
1 = Roman Catholic (P440 = 1) 2 = African Methodist Episcopal (P440 = 2) 3 = Amish (P440 = 3) 4 = Assembly of God (P440 = 4) 5 = Baptist (P440 = 5) 6 = Brethren (P440 =6) 7 = Calvinist (P440 = 7) 8 = Christian, no specific denomination (P440 = 8) 9 = Church of Christ (P440 = 9) 10 = Church of God (P440 = 10) 11 = Church of God in Christ (P440 = 11) 12 = Church of the Nazarene (P440 = 12) 13 = Disciples of Christ (P440 = 13) 14 = Episcopal (P440 = 14) 15 = Friends (P440 = 15) 16 = Greek Orthodox (P440 = 16) 17 = Islamic (P440 = 17) 18 = Jewish (P440 = 18) 19 = Latter Day Saints (P440 = 19) 20 = Lutheran Church - Missouri Synod (P440 = 20) 21 = Evangelical Lutheran Church in America (P440 = 21) 22 = Wisconsin Evangelical Lutheran Synod (P440 = 22) 23 = Other Lutheran (P440 = 23) 24 = Mennonite (P440 = 24) 25 = Methodist (P440 = 25) 26 = Pentecostal (P440 = 26) 27 = Presbyterian (P440 = 27) 28 = Seventh-day Adventist (P440 = 28) 29 = Other (P440 = 29) 30 = Nonsectarian (P430 = 2)
P_ASIAN—Percentage of K–12 and ungraded students who are Asian, not of Hispanic or Latino origin: Purpose: To provide a measure of the percentage of the school’s students who are Asian. General explanation: Based the number of Asian students (P316) and total K–12 and ungraded enrollment (NUMSTUDS). Values:
P_ASIAN = P316 / NUMSTUDS
V. Guide to the Public-Use Data File and Code Book 23
P_BLACK—Percentage of K–12 and ungraded students who are Black or African American, not of Hispanic or Latino origin: Purpose: To provide a measure of the percentage of the school’s students who are Black or African American. General explanation: Based the number of Black or African American students (P325) and total K–12 and ungraded enrollment (NUMSTUDS). Values:
P_BLACK = P325 / NUMSTUDS P_HISP—Percentage of K–12 and ungraded students who are Hispanic or Latino, regardless of race: Purpose: To provide a measure of the percentage of the school’s students who are Hispanic or Latino. General explanation: Based the number of Hispanic or Latino students (P320) and total K–12 and ungraded enrollment (NUMSTUDS). Values:
P_HISP = P320 / NUMSTUDS P_INDIAN—Percentage of K–12 and ungraded students who are American Indian or Alaska Native, not of Hispanic or Latino origin: Purpose: To provide a measure of the percentage of the school’s students who are American Indian or Alaska Native. General explanation: Based the number of American Indian or Alaska Native students (P310) and total K–12 and ungraded enrollment (NUMSTUDS). Values:
P_INDIAN = P310 / NUMSTUDS P_PACIFIC—Percentage of K–12 and ungraded students who are Native Hawaiian or other Pacific Islander, not of Hispanic or Latino origin: Purpose: To provide a measure of the percentage of the school’s students who are Native Hawaiian or other Pacific Islander. General explanation: Based the number of Native Hawaiian or other Pacific Islander students (P318) and total K–12 and ungraded enrollment (NUMSTUDS). Values:
P_PACIFIC = P318 / NUMSTUDS P_TR—Percentage of K–12 and ungraded students who are Two or more races, not of Hispanic or Latino origin: Purpose: To provide a measure of the percentage of the school’s students who are Two or more races. General explanation: Based the number of students who are Two or more races (P332) and total K–12 and ungraded enrollment (NUMSTUDS). Values:
P_TR = P332 / NUMSTUDS P_WHITE—Percentage of K–12 and ungraded students who are White, not of Hispanic or Latino origin: Purpose: To provide a measure of the percentage of the school’s students who are White. General explanation: Based the number of White students (P330) and total K–12 and ungraded enrollment (NUMSTUDS). Values:
P_WHITE = P330 / NUMSTUDS
24 PSS: Public-Use Data File User’s Manual for School Year 2017–18
REGION—Geographic region of school: Purpose: To provide a summary measure of the school’s physical location. General explanation: Based on the state of the school’s physical location (PSTANSI). Values:
1 = Northeast: Maine, New Hampshire, Vermont, Massachusetts, Rhode Island, Connecticut, New York, New Jersey, and Pennsylvania;
2 = Midwest: Ohio, Indiana, Illinois, Michigan, Wisconsin, Minnesota, Iowa, Missouri, North Dakota, South Dakota, Nebraska, and Kansas;
3 = South: Delaware, Maryland, District of Columbia, Virginia, West Virginia, North Carolina, South Carolina, Georgia, Florida, Kentucky, Tennessee, Alabama, Mississippi, Arkansas, Louisiana, Oklahoma, and Texas; and
4 = West: Montana, Idaho, Wyoming, Colorado, New Mexico, Arizona, Utah, Nevada, Washington, Oregon, California, Alaska, and Hawaii.
RELIG—School’s religious affiliation: Purpose: To provide a summary classification for private schools. General explanation: Based on the school’s religious orientation and affiliation (P430 and P440) Values:
1 = Catholic (P430 =1 and P440 =1) 2 = Other religious (P430 = 1 and P440 ne 1) 3 = Nonsectarian (P430 = 2)
SIZE—Categorized number of K–12 and ungraded students in the school: Purpose: To provide a summary classification for private school enrollment. General explanation: Based on the school’s K–12 and ungraded enrollment (NUMSTUDS) Values:
1 = Less than 50 students (NUMSTUDS = 1–49) 2 = 50-149 students (NUMSTUDS = 50–149) 3 = 150-299 students (NUMSTUDS = 150–299) 4 = 300-499 students (NUMSTUDS = 300–499) 5 = 500-749 students (NUMSTUDS = 500–749) 6 = 750 students or more (NUMSTUDS greater than 749)
S_KG—Total number of kindergarten students in the school: Purpose: To provide a total count of number of kindergarten students in the school. General explanation: Based on the school’s kindergarten (P160), transitional kindergarten (P170) and transitional first grade enrollment (P180). Values:
S_KG = P160 + P170 + P180
STTCH_RT—Student/teacher ratio: Purpose: To provide a measure of the student/teacher ratio for K–12 and ungraded levels. General explanation: Based on the school’s FTE teachers (NUMTEACH) and total K–12 and ungraded enrollment (NUMSTUDS). Values:
STTCH_RT = NUMSTUDS / NUMTEACH
V. Guide to the Public-Use Data File and Code Book 25
TABFLAG—Tabulation flag: Purpose: To allow selection of schools meeting the pre-1995 PSS definition of a private school (schools offering ungraded or grade 1 or above). General explanation: : Based on students in reported grade levels (P135, P185, P195, P205, P215, P225, P235, P245, P255, P265, P275, P285, and P295) Values:
1 = Schools with ungraded or grade 1 or above students (P135 = 1 or P185 = 1 or P195 = 1 or P205 = 1 or P215 = 1 or P225 = 1 or P235 = 1 or P245 = 1 or P255 = 1 or P265 = 1 or P275 = 1 or P285 = 1 or P295 = 1) 2 = Schools with no ungraded or grade 1 or above students (P135 = 2 and P185 = 2 and P195 = 2 and P205 = 2 and P215 = 2 and P225 = 2 and P235 = 2 and P245 = 2 and P255 = 2 and P265 = 2 and P275 = 2 and P285 = 2 and P295 = 2)
TOTHRS—Length of school day in hours: Purpose: To provide a measure for the total length of the school day. General explanation: Based on the length of the school day in hours (P650) and minutes (P655) Values: TOTHRS = P650 + P655/60 TYPOLOGY—NCES 9-category typology: Purpose: To provide a summary classification for private schools. General explanation: Based on the school’s religious affiliation (RELIG and P445), association membership (P450-P640), and program emphasis (P415) Values:
1 = Catholic, parochial—Catholic schools with a parochial or inter-parochial governance structure (RELIG =1 and P445 = 1)
2 = Catholic, diocesan—Catholic schools with a Diocesan governance structure (RELIG = 1 and P445=2)
3 = Catholic, private—Catholic schools with a private governance structure (RELIG = 1 and P445 = 3)
4 = Other Religious, Conservative Christian—Other religious schools with membership in at least one of four associations: Accelerated Christian Education, American Association of Christian Schools, Association of Christian Schools International, or Oral Roberts University Education Fellowship (RELIG = 2 and P455, P460, P465, or P520 = 1)
5 = Other Religious, affiliated—Other religious schools not classified as Conservative Christian with membership in at least one of twelve associations: Association of Christian Teachers and Schools, Association of Classical and Christian Schools , Christian Schools International, Evangelical Lutheran Education Association, Friends Council on Education, General Conference of the Seventh-Day Adventist Church, Islamic School League of America, National Association of Episcopal Schools, National Christian School Association, National Society for Hebrew Day Schools, Solomon Schechter Day Schools, Southern Baptist Association of Christian Schools, or indicating membership in “other religious school associations.” (RELIG = 2, TYPOLOGY ne 4, and P467, P468, P470, P480, P485, P490, P492, P500, P510, P515, P525, P530, or P535 = 1)
6= Other Religious, unaffiliated—Other religious schools not classified as Conservative Christian or affiliated (RELIG = 2 and TYPOLOGY ne 4 or 5)
7 = Nonsectarian, Regular—Nonsectarian schools with a regular or early childhood program emphasis (RELIG = 3 and P415 = 1 or 7)
8 = Nonsectarian, special emphasis—Nonsectarian schools with a Montessori, career/technical/vocational, alternative, or special program emphasis (RELIG = 3 and P415 = 2, 3, 5, or 6)
9 = Nonsectarian, special education—Nonsectarian schools with a special education program
26 PSS: Public-Use Data File User’s Manual for School Year 2017–18
emphasis (RELIG = 3 and P415 =4) UCOMMTYP—Urban-centric community type: Purpose: To provide a measure of a school’s community type relative to populous areas: General explanation: Based on the urban-centric local code (ULOCALE18). Values:
1 = City (ULOCALE18 = 11, 12, or 13) 2 = Suburb (ULOCALE18 = 21, 22, or 23) 3 = Town (ULOCALE18 = 31, 32, or 33) 4 = Rural (ULOCALE18 = 41, 42, or 43)
ULOCALE18—Urban-centric locale code: Purpose: To provide a measure of a school’s location relative to populous areas. General explanation: Based on the school’s physical address or the mailing address, if the physical address is not reported Values:
11 = City, Large: Territory inside an urbanized area and inside a principal city with population of 250,000 or more.
12 = City, Midsize: Territory inside an urbanized area and inside a principal city with population less than 250,000 and greater than or equal to 100,000.
13 = City, Small: Territory inside an urbanized area and inside a principal city with population less than 100,000.
21 = Suburb, Large: Territory outside a principal city and inside an urbanized area with population of 250,000 or more.
22 = Suburb, Midsize: Territory outside a principal city and inside an urbanized area with population less than 250,000 and greater than or equal to 100,000.
23 = Suburb, Small: Territory outside a principal city and inside an urbanized area with population less than 100,000.
31 = Town, Fringe: Territory inside an urban cluster that is less than or equal to 10 miles from an urbanized area.
32 = Town, Distant: Territory inside an urban cluster that is more than 10 miles and less than or equal to 35 miles from an urbanized area.
33 = Town, Remote: Territory inside an urban cluster that is more than 35 miles of an urbanized area.
41= Rural, Fringe: Census-defined rural territory that is less than or equal to 5 miles from an urbanized area, as well as rural territory that is less than or equal to 2.5 miles from an urban cluster.
42 = Rural, Distant: Census-defined rural territory that is more than 5 miles but less than or equal to 25 miles from an urbanized area, as well as rural territory that is more than 2.5 miles but less than or equal to 10 miles from an urban cluster.
43 = Rural, Remote: Census-defined rural territory that is more than 25 miles from an urbanized area and is also more than 10 miles from an urban cluster.
The variable names, descriptions, and descriptive statistics for all variables on the public-use file are contained in appendix C.

V. Guide to the Public-Use Data File and Code Book 27
Unique School Identifier Each school record on the 2017–18 PSS file contains a unique school identifier, the permanent identification number (PPIN). PPIN is a unique 8-character code assigned when a private school is first included in PSS. PPIN can be used to match a school’s 2017–18 PSS record to those of other years.
28 PSS: Public-Use Data File User’s Manual for School Year 2017–18
VI. User Notes and Cautions This section provides some caveats and considerations that analysts should take into account when using the 2017–18 PSS data.
Locale Code (Urbanicity) The 2017–18 PSS public-use data file does not contain the 8-category locale code (LOCALE) that was included on the 2005–06 and earlier PSS files. The 2017–18 file does contain the new (2003) 12-category locale code (ULOCALE), which is also included on the 2003–04, 2005–06, 2007–08, 2009–10, 2011–12, 2013–14, and 2015–16 PSS data files.
Race/Ethnicity Beginning with the 2009–10 PSS, race/ethnicity data (Item 6) were collected following the Department of Education’s October 2007 guidance on collecting and reporting race and ethnicity data. The seven race/ethnicity categories used in 2009–10 were Hispanic or Latino, regardless of race (P320); and for those not of Hispanic or Latino origin, American Indian or Alaska Native (P310), Asian (P316), Black or African American (P325), Native Hawaiian or other Pacific Islander (P318), White (P330), and Two or more races (P332). In earlier PSS collections, race/ethnicity data were collected using five categories; Asians and Pacific Islanders were combined in one category—Asian or Pacific Islander, and there was no category for those of Two or more races.
References 29
References Beller, N.D. (1984). Private Elementary and Secondary Education, 1983 Enrollment, Teachers, and
Schools (Bulletin). U.S. Department of Education. Washington, DC: National Center for Education Statistics.
Kalton, G. (1983). Compensating for Missing Survey Data. Ann Arbor: Survey Research Center, University of Michigan.
Kalton, G., and Kasprzyk, D. (1982). Imputing for Missing Survey Responses. American Statistical Association 1982 Proceedings of the Section on Survey Research Methods, 22–31.
Kalton, G., and Kasprzyk, D. (1986). The Treatment of Missing Survey Data. Survey Methodology, 12(1): 1–16.
Little, R.J.A., and Rubin, D.B. (1987). Statistical Analysis with Missing Data. New York: John Wiley and Sons.
Madow, W.G., Olkin, I., and Rubin, D.B. (Eds.) (1983). Incomplete Data in Sample Surveys, Vols. 1, 2, and 3, New York: Academic Press.

Appendix A. 2017–18 Private School
Universe Survey Questionnaire
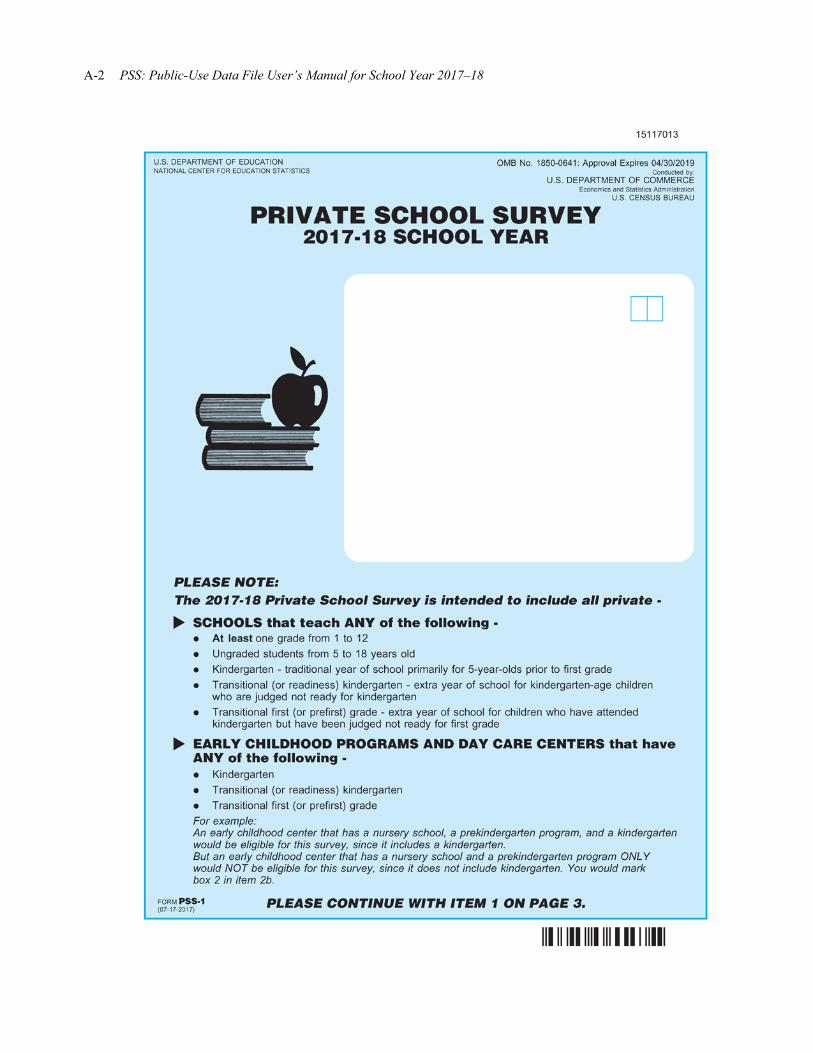
A-2 PSS: Public-Use Data File User’s Manual for School Year 2017–18
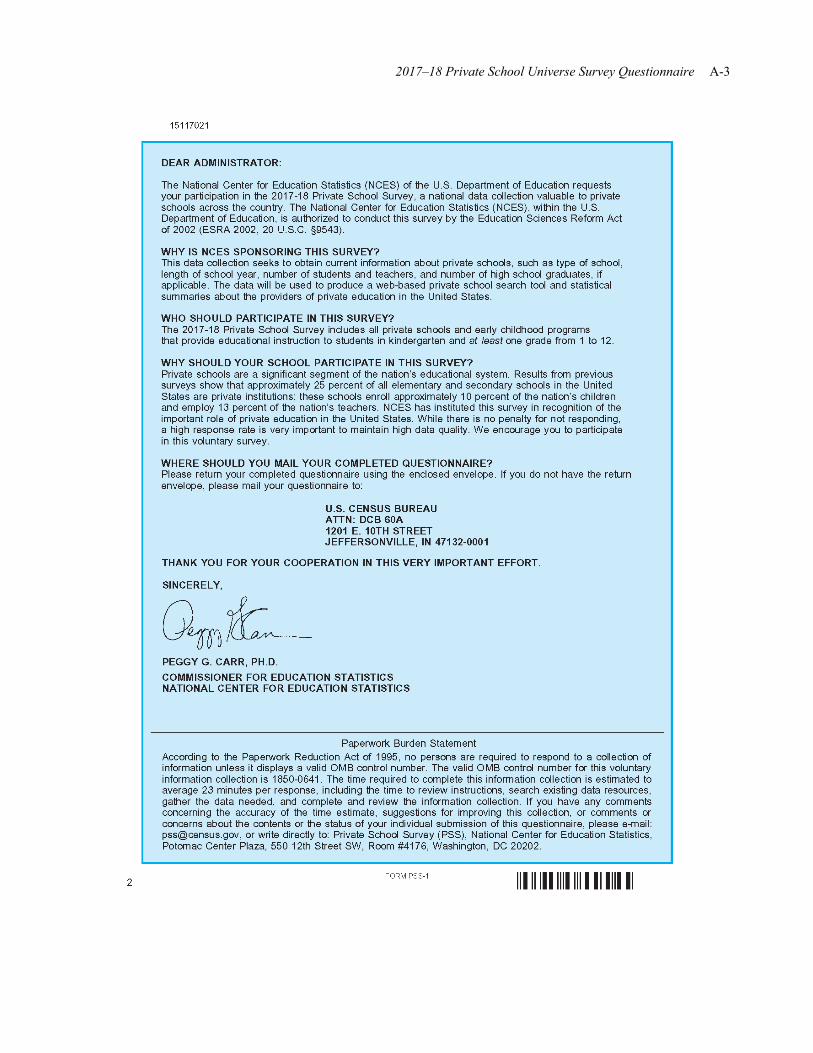
2017–18 Private School Universe Survey Questionnaire A-3
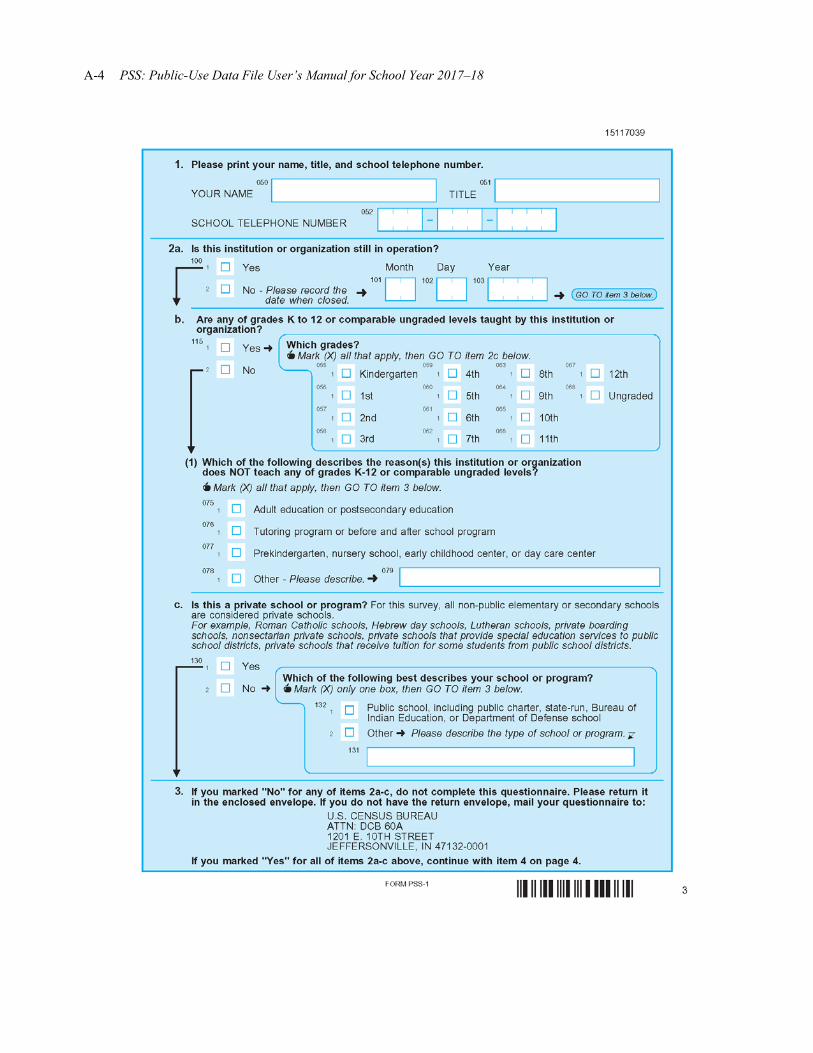
A-4 PSS: Public-Use Data File User’s Manual for School Year 2017–18
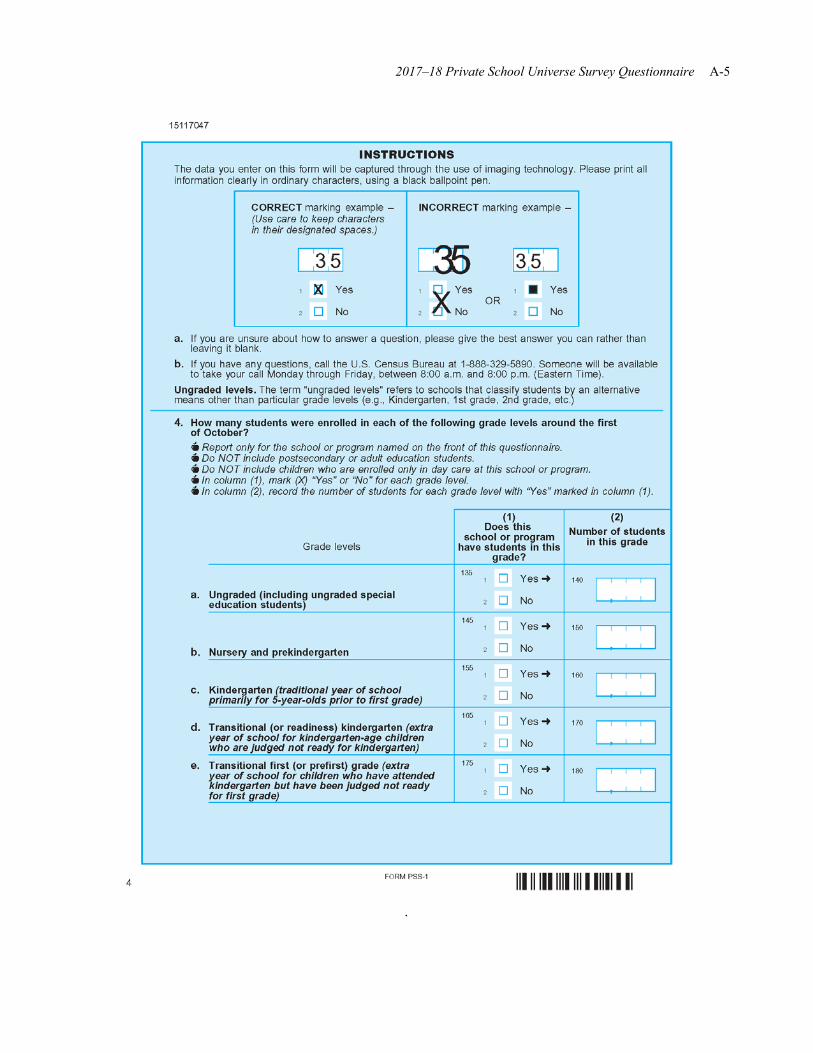
2017–18 Private School Universe Survey Questionnaire A-5
.
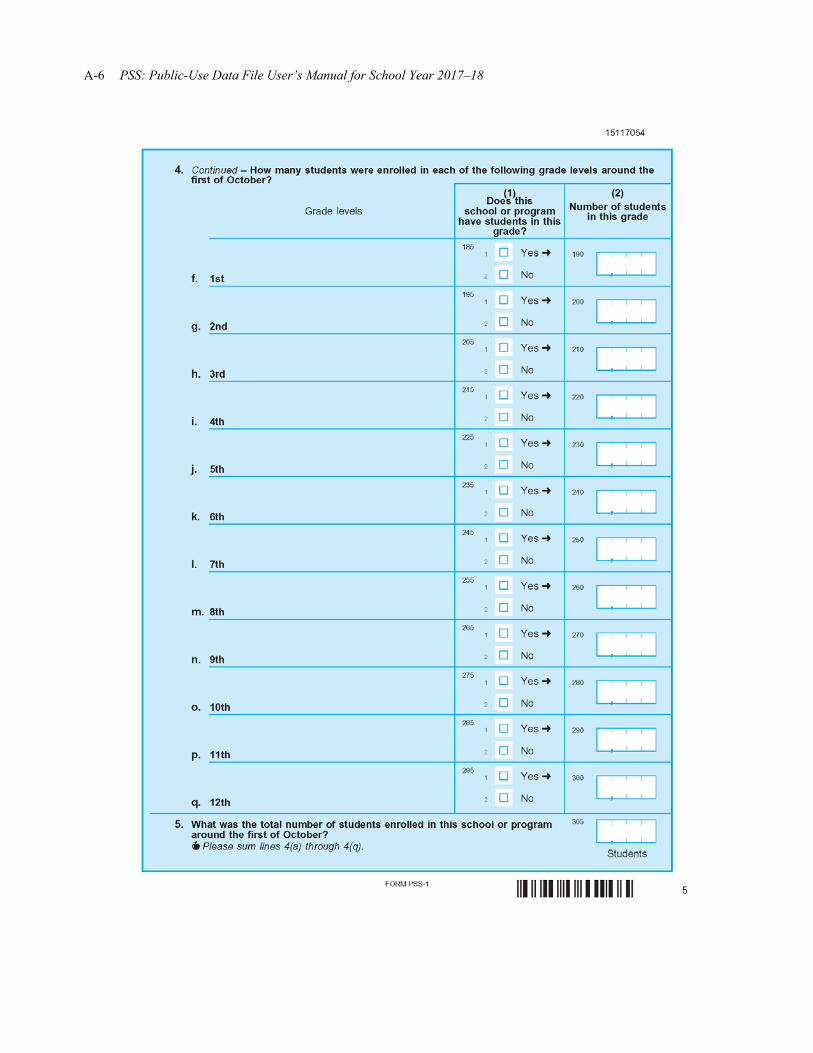
A-6 PSS: Public-Use Data File User’s Manual for School Year 2017–18
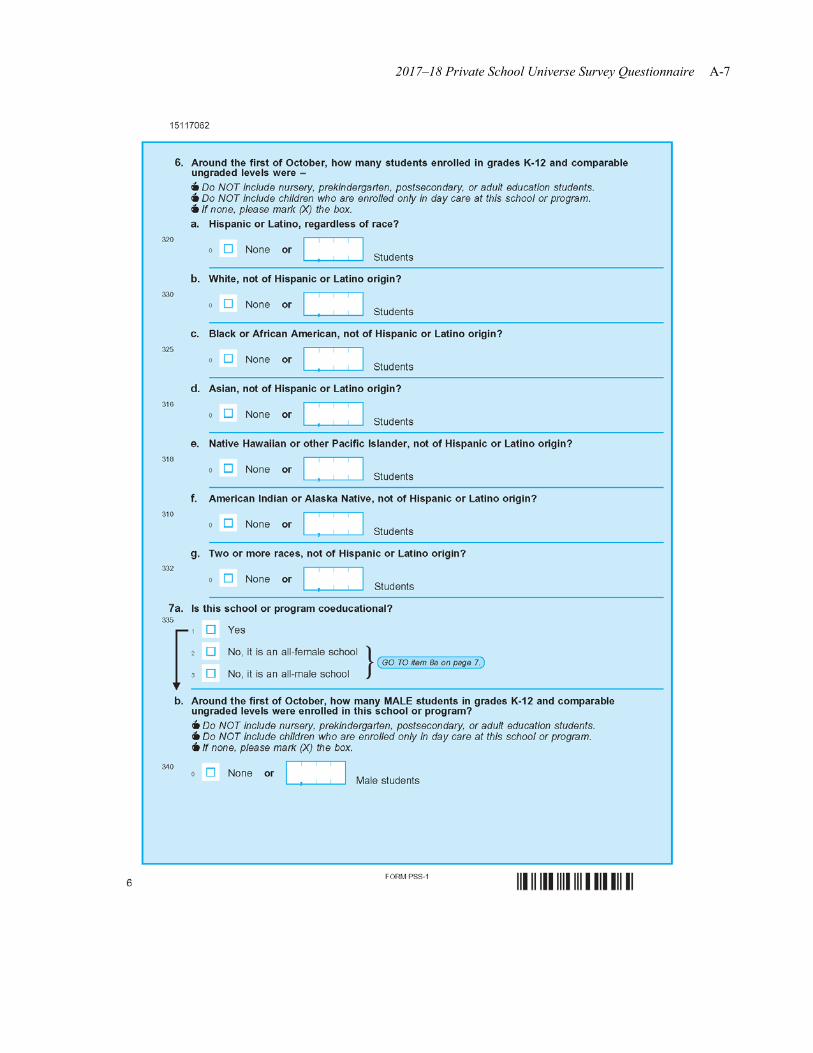
2017–18 Private School Universe Survey Questionnaire A-7
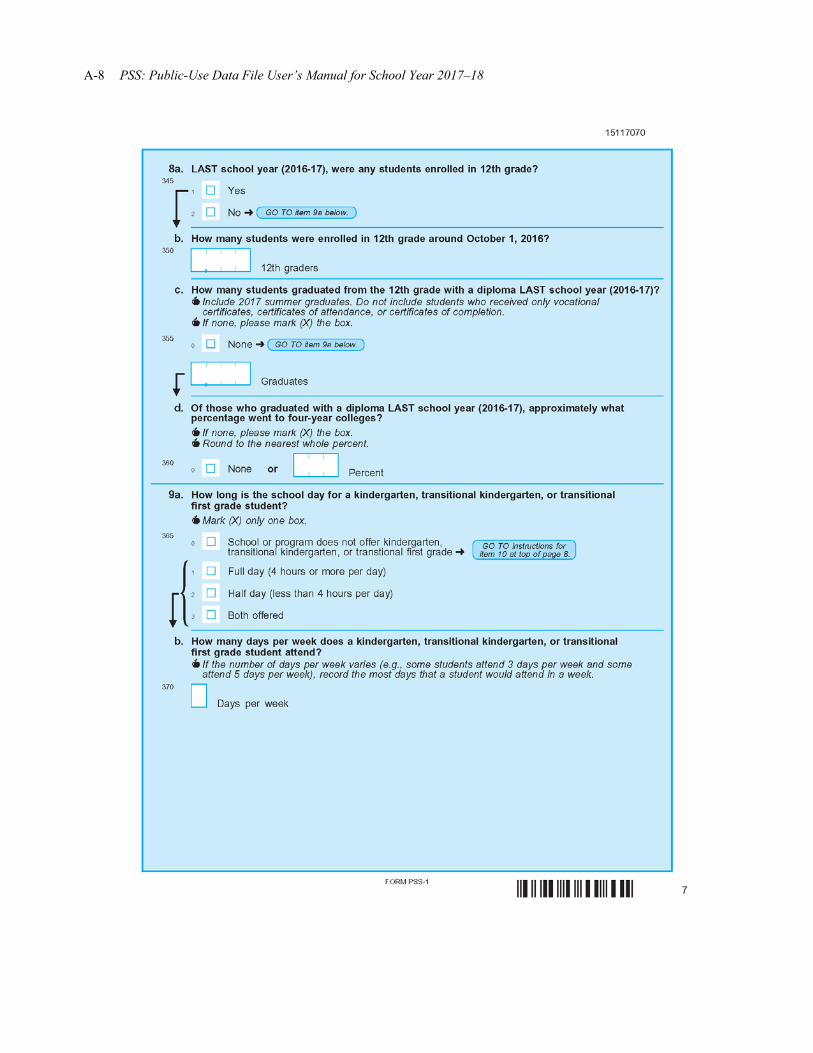
A-8 PSS: Public-Use Data File User’s Manual for School Year 2017–18
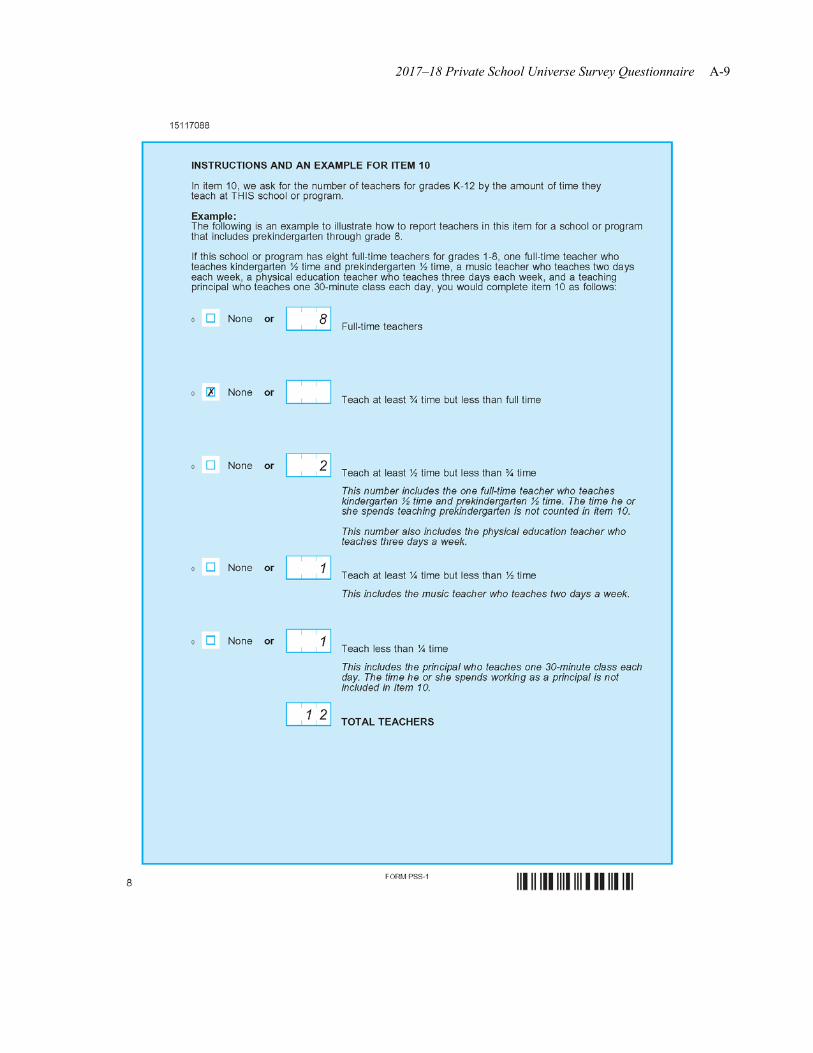
2017–18 Private School Universe Survey Questionnaire A-9
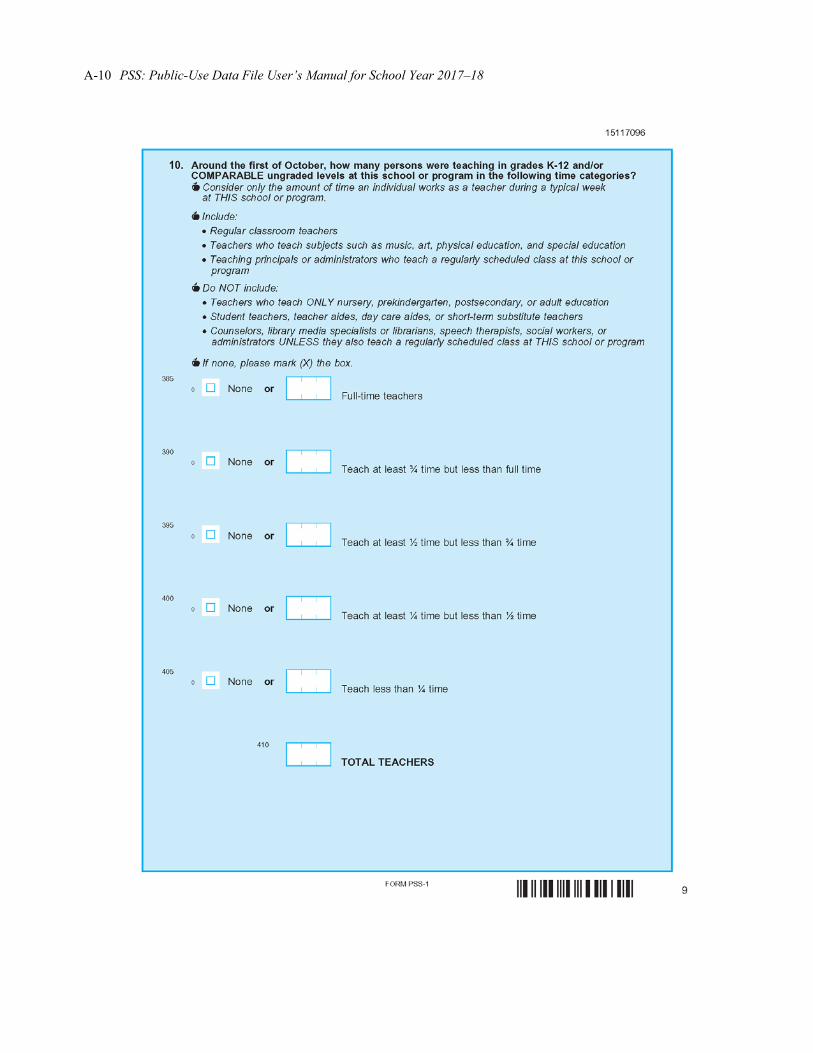
A-10 PSS: Public-Use Data File User’s Manual for School Year 2017–18
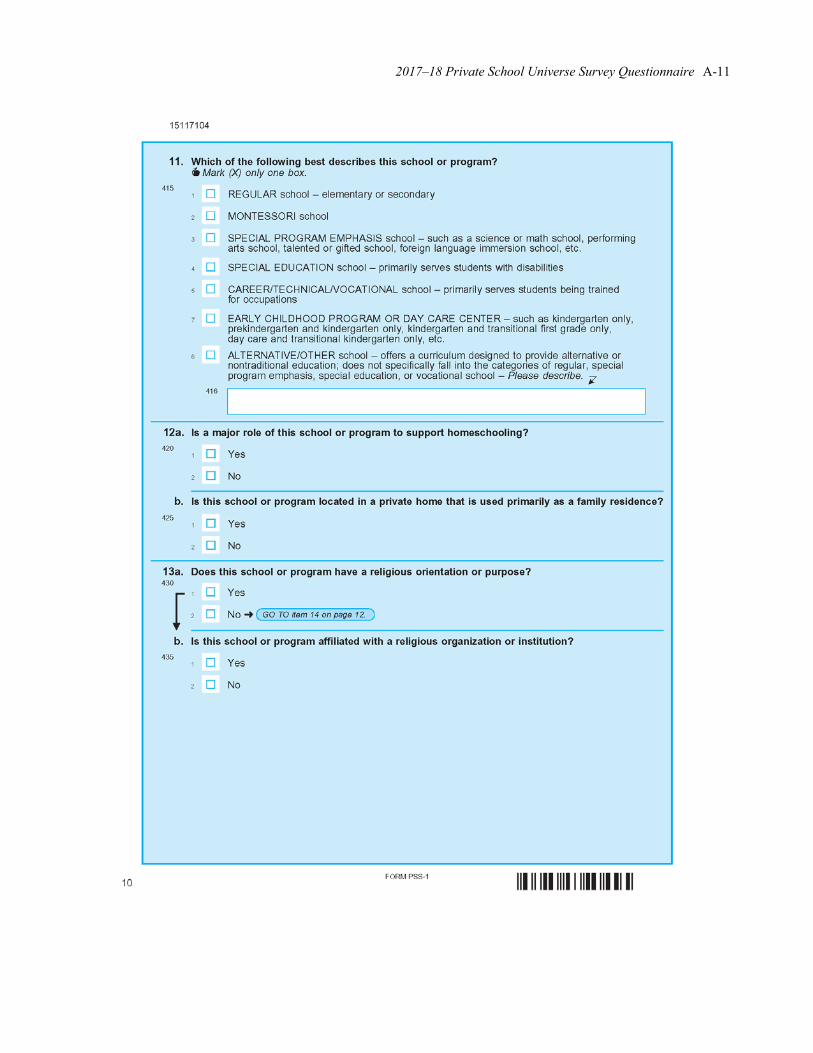
2017–18 Private School Universe Survey Questionnaire A-11
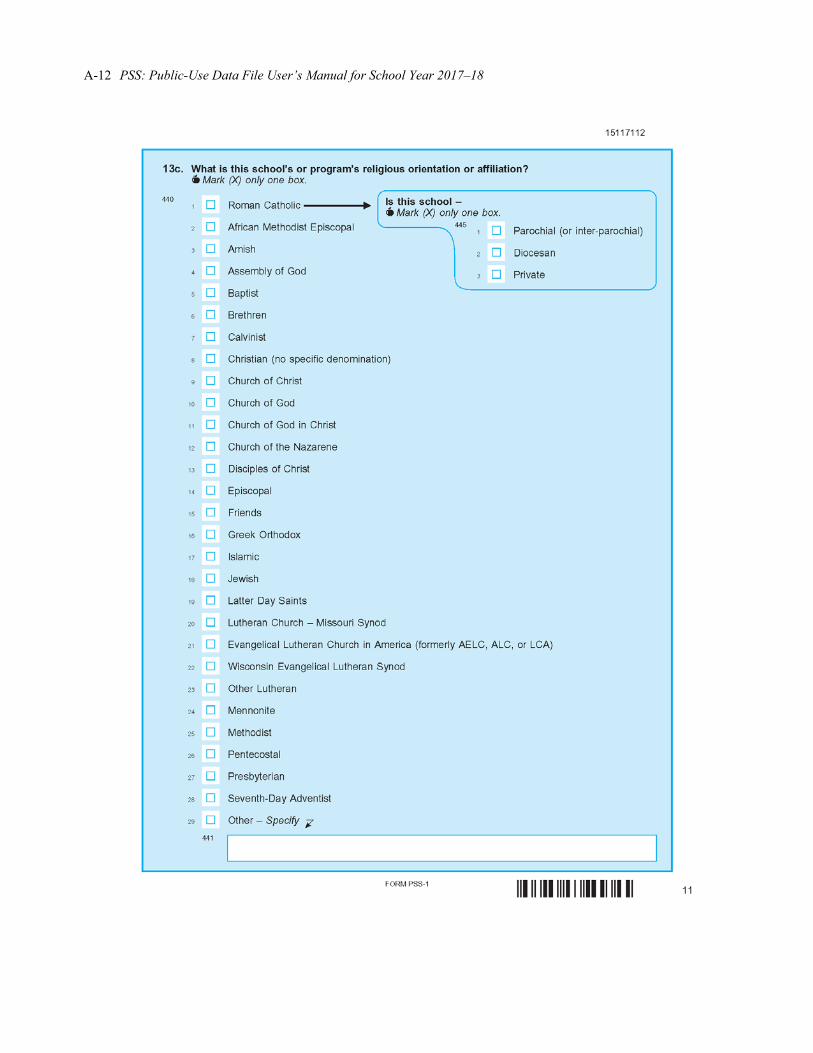
A-12 PSS: Public-Use Data File User’s Manual for School Year 2017–18
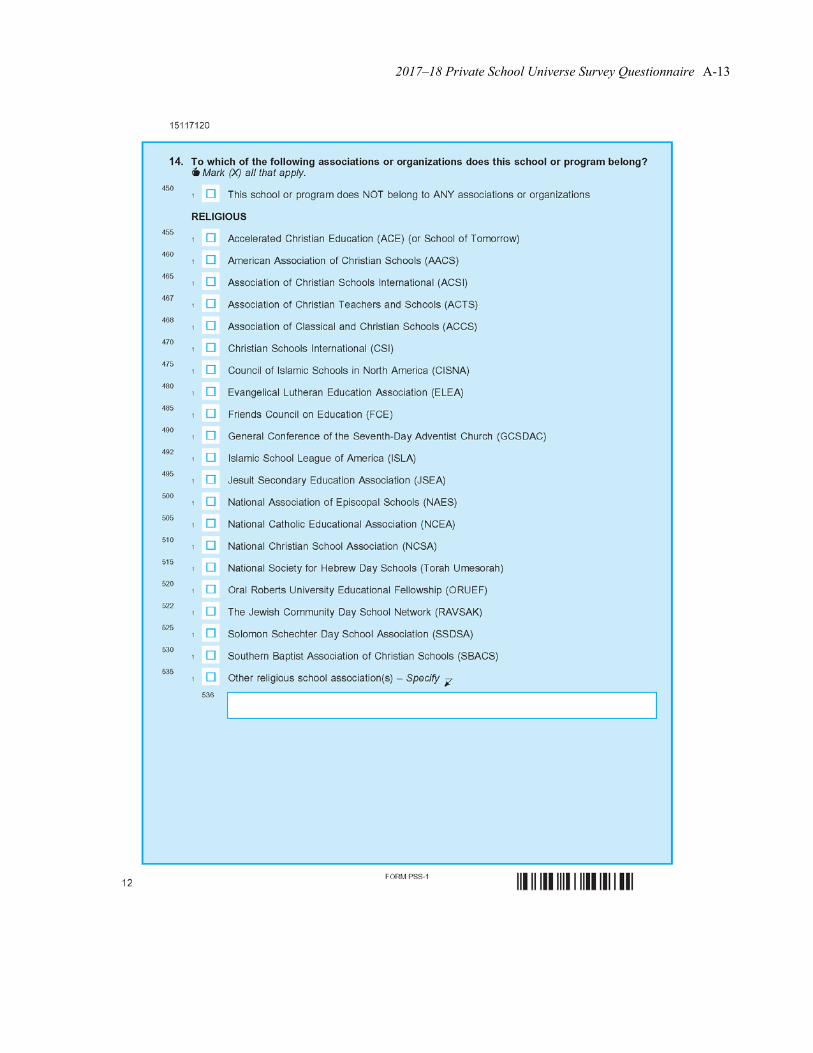
2017–18 Private School Universe Survey Questionnaire A-13
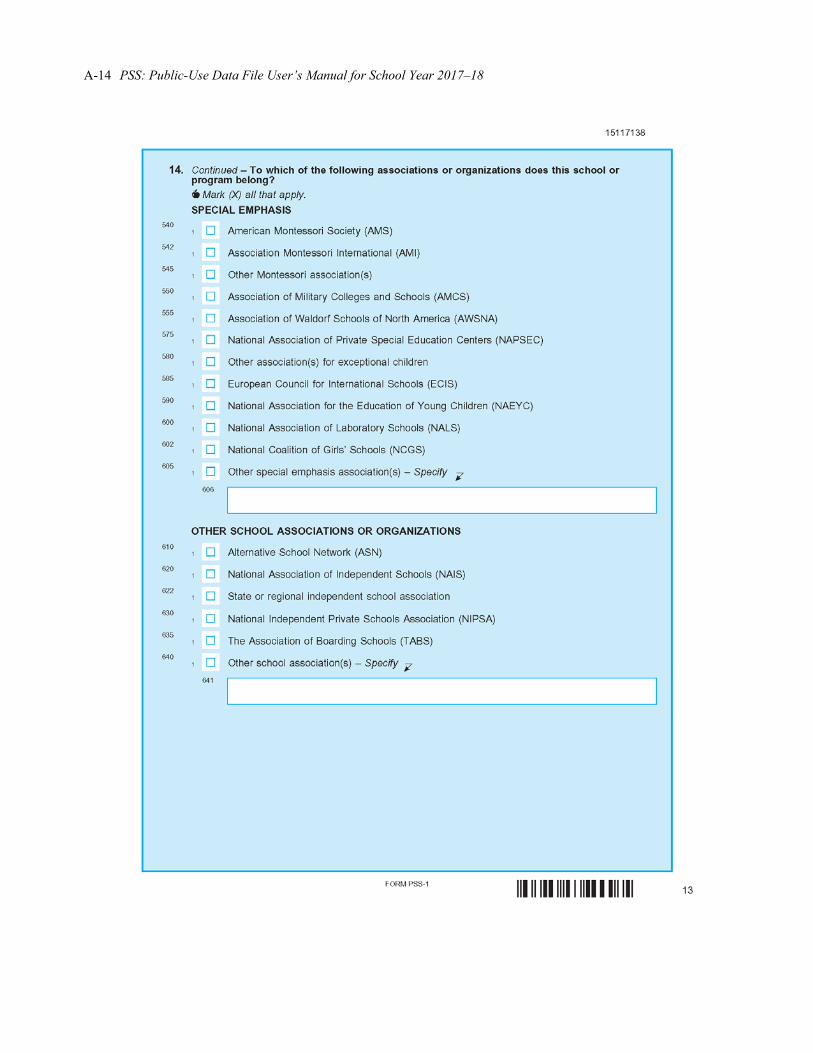
A-14 PSS: Public-Use Data File User’s Manual for School Year 2017–18
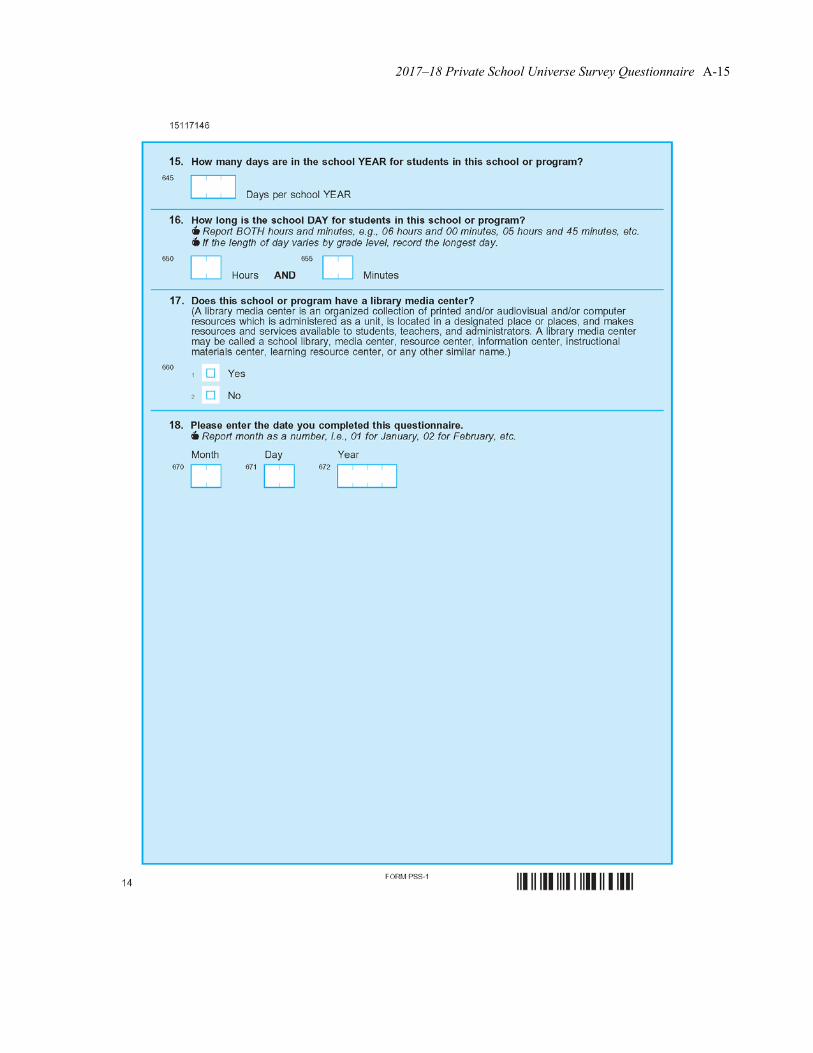
2017–18 Private School Universe Survey Questionnaire A-15
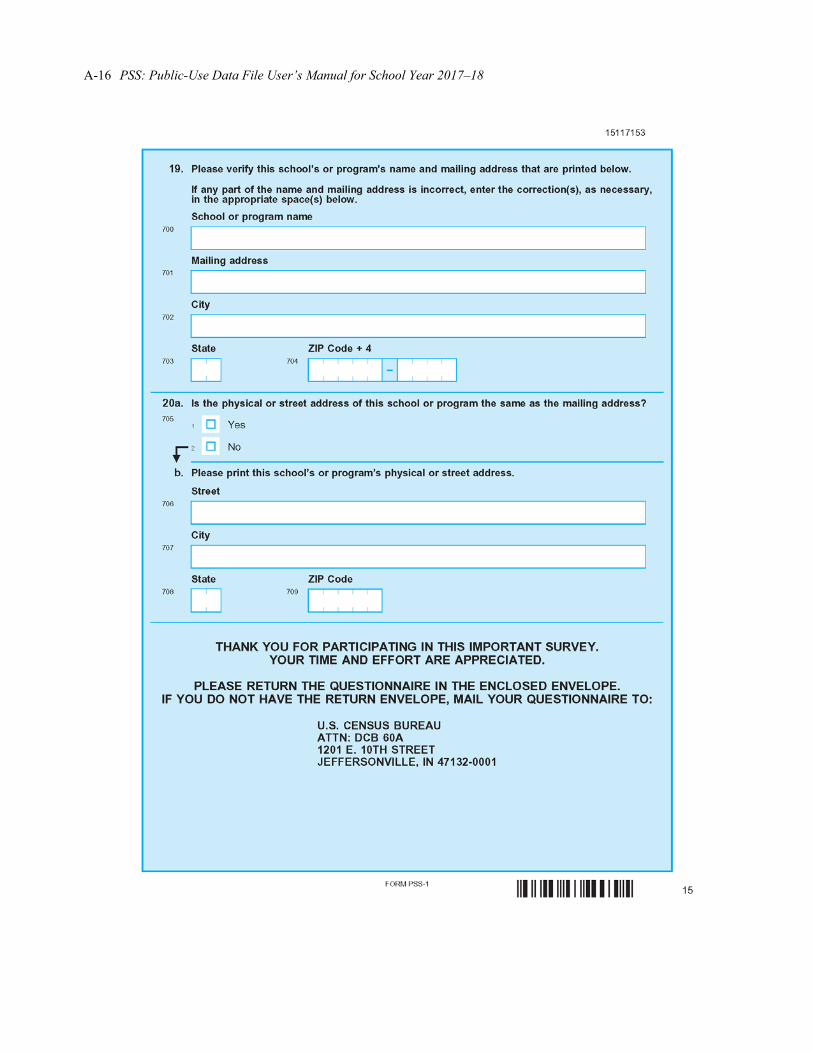
A-16 PSS: Public-Use Data File User’s Manual for School Year 2017–18
2017–18 Private School Universe Survey Questionnaire A-17

Appendix B. List of Variables and Record Layout of the Tab-Delimited ASCII File of the 2017–18
PSS Public-Use Data
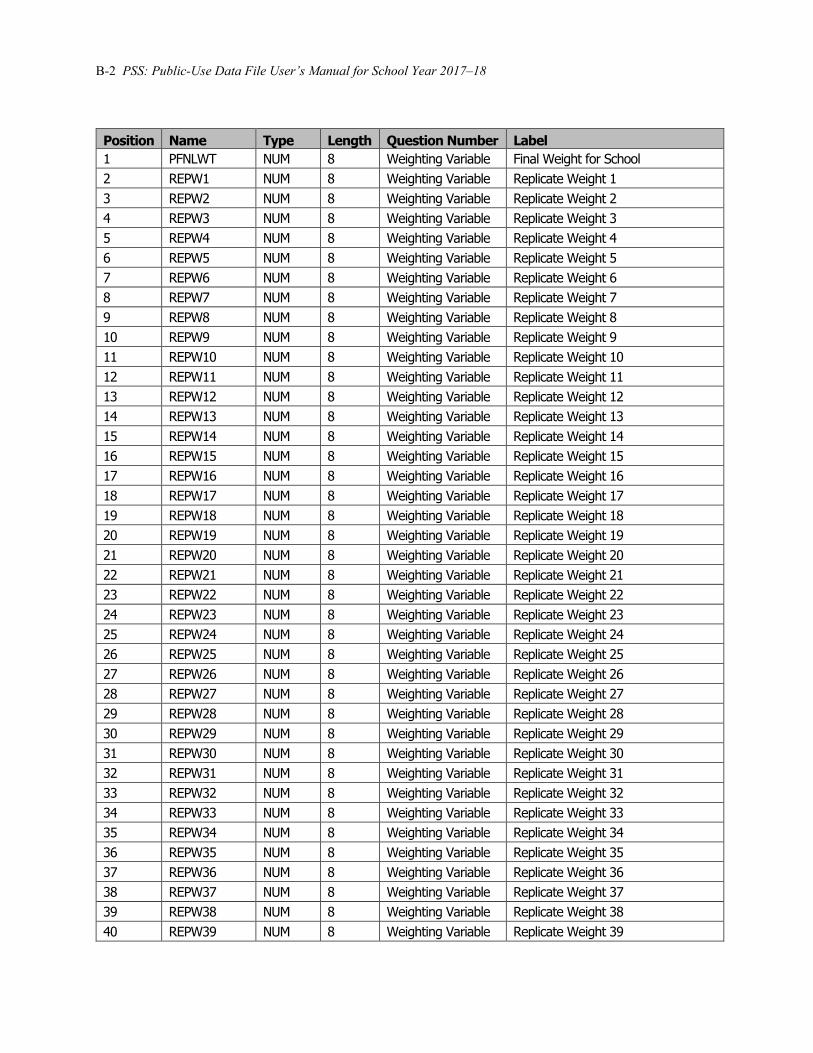
B-2 PSS: Public-Use Data File User’s Manual for School Year 2017–18
Position Name Type Length Question Number Label 1 PFNLWT NUM 8 Weighting Variable Final Weight for School 2 REPW1 NUM 8 Weighting Variable Replicate Weight 1 3 REPW2 NUM 8 Weighting Variable Replicate Weight 2 4 REPW3 NUM 8 Weighting Variable Replicate Weight 3 5 REPW4 NUM 8 Weighting Variable Replicate Weight 4 6 REPW5 NUM 8 Weighting Variable Replicate Weight 5 7 REPW6 NUM 8 Weighting Variable Replicate Weight 6 8 REPW7 NUM 8 Weighting Variable Replicate Weight 7 9 REPW8 NUM 8 Weighting Variable Replicate Weight 8 10 REPW9 NUM 8 Weighting Variable Replicate Weight 9 11 REPW10 NUM 8 Weighting Variable Replicate Weight 10 12 REPW11 NUM 8 Weighting Variable Replicate Weight 11 13 REPW12 NUM 8 Weighting Variable Replicate Weight 12 14 REPW13 NUM 8 Weighting Variable Replicate Weight 13 15 REPW14 NUM 8 Weighting Variable Replicate Weight 14 16 REPW15 NUM 8 Weighting Variable Replicate Weight 15 17 REPW16 NUM 8 Weighting Variable Replicate Weight 16 18 REPW17 NUM 8 Weighting Variable Replicate Weight 17 19 REPW18 NUM 8 Weighting Variable Replicate Weight 18 20 REPW19 NUM 8 Weighting Variable Replicate Weight 19 21 REPW20 NUM 8 Weighting Variable Replicate Weight 20 22 REPW21 NUM 8 Weighting Variable Replicate Weight 21 23 REPW22 NUM 8 Weighting Variable Replicate Weight 22 24 REPW23 NUM 8 Weighting Variable Replicate Weight 23 25 REPW24 NUM 8 Weighting Variable Replicate Weight 24 26 REPW25 NUM 8 Weighting Variable Replicate Weight 25 27 REPW26 NUM 8 Weighting Variable Replicate Weight 26 28 REPW27 NUM 8 Weighting Variable Replicate Weight 27 29 REPW28 NUM 8 Weighting Variable Replicate Weight 28 30 REPW29 NUM 8 Weighting Variable Replicate Weight 29 31 REPW30 NUM 8 Weighting Variable Replicate Weight 30 32 REPW31 NUM 8 Weighting Variable Replicate Weight 31 33 REPW32 NUM 8 Weighting Variable Replicate Weight 32 34 REPW33 NUM 8 Weighting Variable Replicate Weight 33 35 REPW34 NUM 8 Weighting Variable Replicate Weight 34 36 REPW35 NUM 8 Weighting Variable Replicate Weight 35 37 REPW36 NUM 8 Weighting Variable Replicate Weight 36 38 REPW37 NUM 8 Weighting Variable Replicate Weight 37 39 REPW38 NUM 8 Weighting Variable Replicate Weight 38 40 REPW39 NUM 8 Weighting Variable Replicate Weight 39
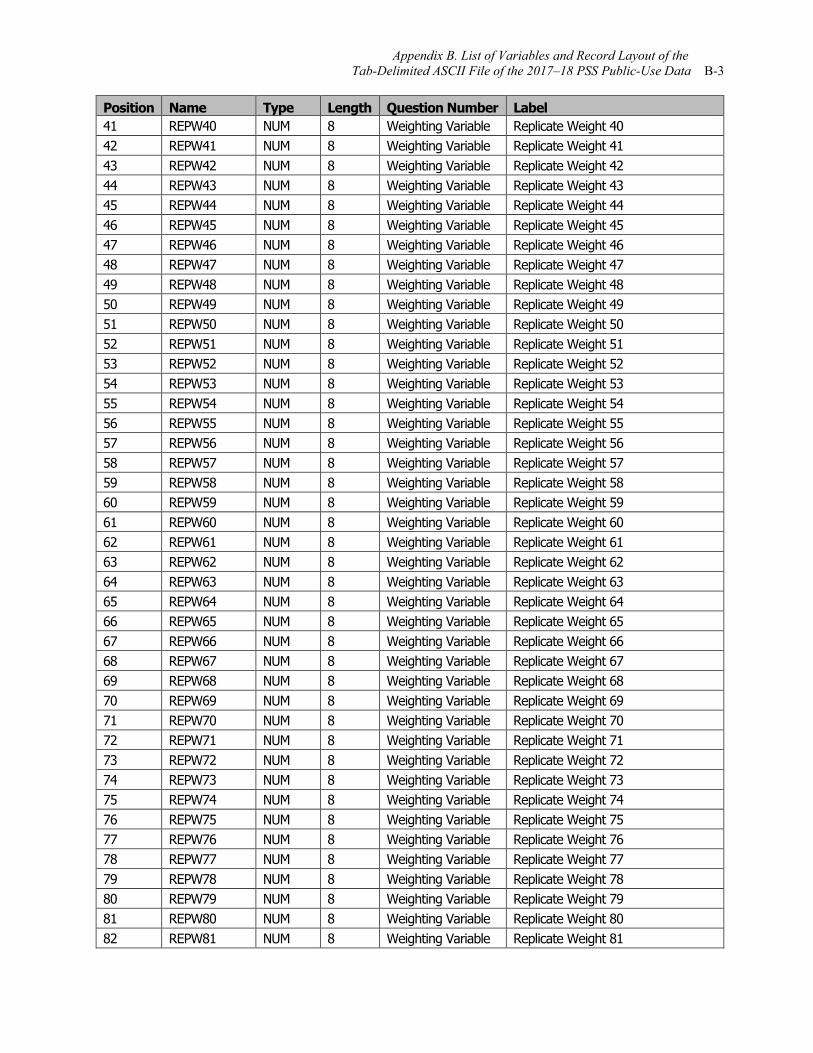
Appendix B. List of Variables and Record Layout of the Tab-Delimited ASCII File of the 2017–18 PSS Public-Use Data B-3
Position Name Type Length Question Number Label 41 REPW40 NUM 8 Weighting Variable Replicate Weight 40 42 REPW41 NUM 8 Weighting Variable Replicate Weight 41 43 REPW42 NUM 8 Weighting Variable Replicate Weight 42 44 REPW43 NUM 8 Weighting Variable Replicate Weight 43 45 REPW44 NUM 8 Weighting Variable Replicate Weight 44 46 REPW45 NUM 8 Weighting Variable Replicate Weight 45 47 REPW46 NUM 8 Weighting Variable Replicate Weight 46 48 REPW47 NUM 8 Weighting Variable Replicate Weight 47 49 REPW48 NUM 8 Weighting Variable Replicate Weight 48 50 REPW49 NUM 8 Weighting Variable Replicate Weight 49 51 REPW50 NUM 8 Weighting Variable Replicate Weight 50 52 REPW51 NUM 8 Weighting Variable Replicate Weight 51 53 REPW52 NUM 8 Weighting Variable Replicate Weight 52 54 REPW53 NUM 8 Weighting Variable Replicate Weight 53 55 REPW54 NUM 8 Weighting Variable Replicate Weight 54 56 REPW55 NUM 8 Weighting Variable Replicate Weight 55 57 REPW56 NUM 8 Weighting Variable Replicate Weight 56 58 REPW57 NUM 8 Weighting Variable Replicate Weight 57 59 REPW58 NUM 8 Weighting Variable Replicate Weight 58 60 REPW59 NUM 8 Weighting Variable Replicate Weight 59 61 REPW60 NUM 8 Weighting Variable Replicate Weight 60 62 REPW61 NUM 8 Weighting Variable Replicate Weight 61 63 REPW62 NUM 8 Weighting Variable Replicate Weight 62 64 REPW63 NUM 8 Weighting Variable Replicate Weight 63 65 REPW64 NUM 8 Weighting Variable Replicate Weight 64 66 REPW65 NUM 8 Weighting Variable Replicate Weight 65 67 REPW66 NUM 8 Weighting Variable Replicate Weight 66 68 REPW67 NUM 8 Weighting Variable Replicate Weight 67 69 REPW68 NUM 8 Weighting Variable Replicate Weight 68 70 REPW69 NUM 8 Weighting Variable Replicate Weight 69 71 REPW70 NUM 8 Weighting Variable Replicate Weight 70 72 REPW71 NUM 8 Weighting Variable Replicate Weight 71 73 REPW72 NUM 8 Weighting Variable Replicate Weight 72 74 REPW73 NUM 8 Weighting Variable Replicate Weight 73 75 REPW74 NUM 8 Weighting Variable Replicate Weight 74 76 REPW75 NUM 8 Weighting Variable Replicate Weight 75 77 REPW76 NUM 8 Weighting Variable Replicate Weight 76 78 REPW77 NUM 8 Weighting Variable Replicate Weight 77 79 REPW78 NUM 8 Weighting Variable Replicate Weight 78 80 REPW79 NUM 8 Weighting Variable Replicate Weight 79 81 REPW80 NUM 8 Weighting Variable Replicate Weight 80 82 REPW81 NUM 8 Weighting Variable Replicate Weight 81
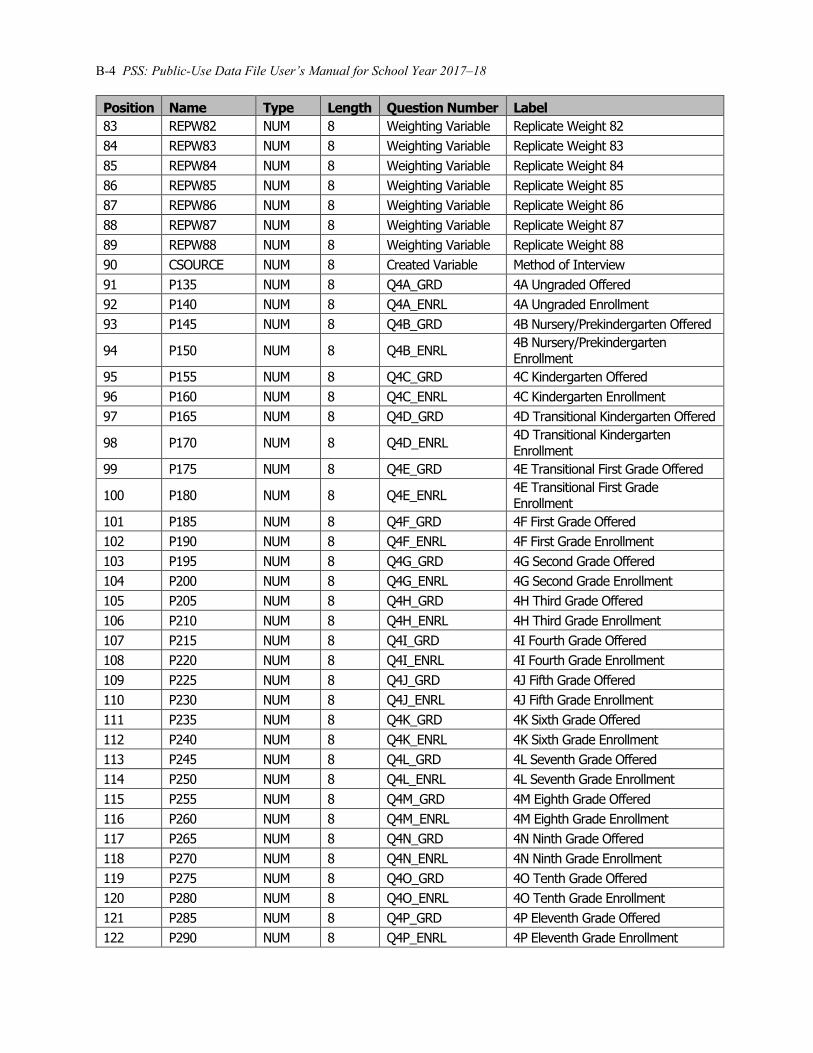
B-4 PSS: Public-Use Data File User’s Manual for School Year 2017–18
Position Name Type Length Question Number Label 83 REPW82 NUM 8 Weighting Variable Replicate Weight 82 84 REPW83 NUM 8 Weighting Variable Replicate Weight 83 85 REPW84 NUM 8 Weighting Variable Replicate Weight 84 86 REPW85 NUM 8 Weighting Variable Replicate Weight 85 87 REPW86 NUM 8 Weighting Variable Replicate Weight 86 88 REPW87 NUM 8 Weighting Variable Replicate Weight 87 89 REPW88 NUM 8 Weighting Variable Replicate Weight 88 90 CSOURCE NUM 8 Created Variable Method of Interview 91 P135 NUM 8 Q4A_GRD 4A Ungraded Offered 92 P140 NUM 8 Q4A_ENRL 4A Ungraded Enrollment 93 P145 NUM 8 Q4B_GRD 4B Nursery/Prekindergarten Offered
94 P150 NUM 8 Q4B_ENRL 4B Nursery/Prekindergarten Enrollment
95 P155 NUM 8 Q4C_GRD 4C Kindergarten Offered 96 P160 NUM 8 Q4C_ENRL 4C Kindergarten Enrollment 97 P165 NUM 8 Q4D_GRD 4D Transitional Kindergarten Offered
98 P170 NUM 8 Q4D_ENRL 4D Transitional Kindergarten Enrollment
99 P175 NUM 8 Q4E_GRD 4E Transitional First Grade Offered
100 P180 NUM 8 Q4E_ENRL 4E Transitional First Grade Enrollment
101 P185 NUM 8 Q4F_GRD 4F First Grade Offered 102 P190 NUM 8 Q4F_ENRL 4F First Grade Enrollment 103 P195 NUM 8 Q4G_GRD 4G Second Grade Offered 104 P200 NUM 8 Q4G_ENRL 4G Second Grade Enrollment 105 P205 NUM 8 Q4H_GRD 4H Third Grade Offered 106 P210 NUM 8 Q4H_ENRL 4H Third Grade Enrollment 107 P215 NUM 8 Q4I_GRD 4I Fourth Grade Offered 108 P220 NUM 8 Q4I_ENRL 4I Fourth Grade Enrollment 109 P225 NUM 8 Q4J_GRD 4J Fifth Grade Offered 110 P230 NUM 8 Q4J_ENRL 4J Fifth Grade Enrollment 111 P235 NUM 8 Q4K_GRD 4K Sixth Grade Offered 112 P240 NUM 8 Q4K_ENRL 4K Sixth Grade Enrollment 113 P245 NUM 8 Q4L_GRD 4L Seventh Grade Offered 114 P250 NUM 8 Q4L_ENRL 4L Seventh Grade Enrollment 115 P255 NUM 8 Q4M_GRD 4M Eighth Grade Offered 116 P260 NUM 8 Q4M_ENRL 4M Eighth Grade Enrollment 117 P265 NUM 8 Q4N_GRD 4N Ninth Grade Offered 118 P270 NUM 8 Q4N_ENRL 4N Ninth Grade Enrollment 119 P275 NUM 8 Q4O_GRD 4O Tenth Grade Offered 120 P280 NUM 8 Q4O_ENRL 4O Tenth Grade Enrollment 121 P285 NUM 8 Q4P_GRD 4P Eleventh Grade Offered 122 P290 NUM 8 Q4P_ENRL 4P Eleventh Grade Enrollment
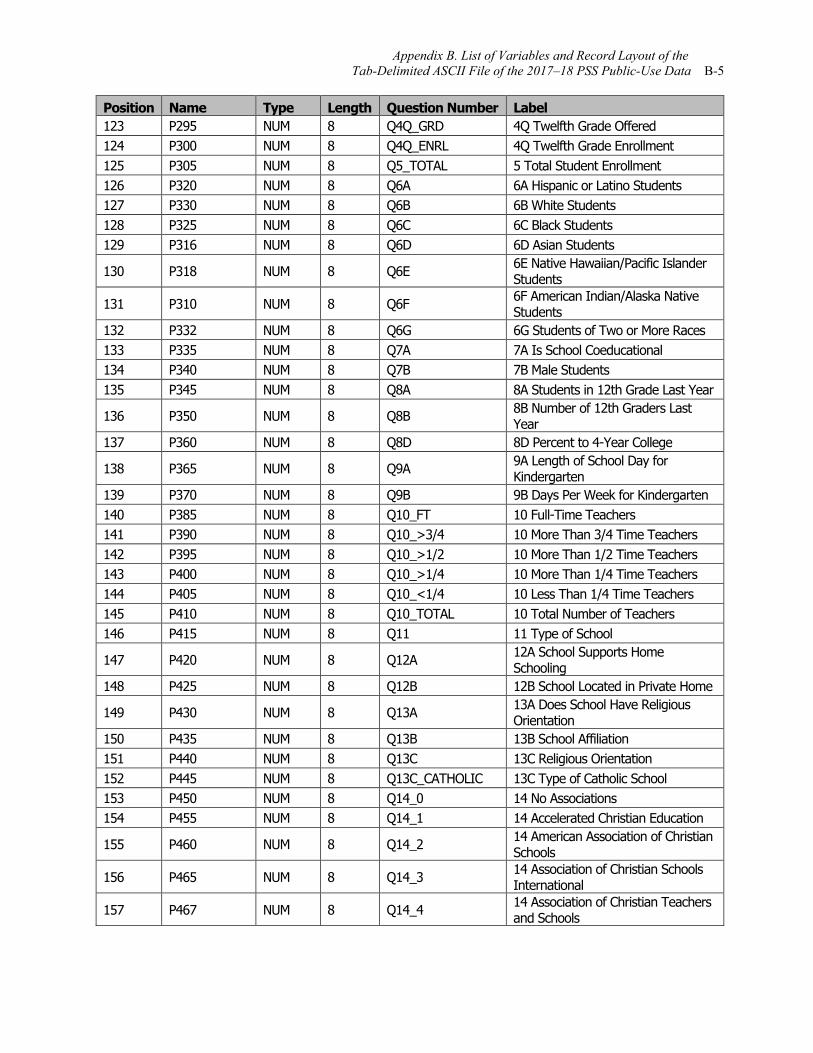
Appendix B. List of Variables and Record Layout of the Tab-Delimited ASCII File of the 2017–18 PSS Public-Use Data B-5
Position Name Type Length Question Number Label 123 P295 NUM 8 Q4Q_GRD 4Q Twelfth Grade Offered 124 P300 NUM 8 Q4Q_ENRL 4Q Twelfth Grade Enrollment 125 P305 NUM 8 Q5_TOTAL 5 Total Student Enrollment 126 P320 NUM 8 Q6A 6A Hispanic or Latino Students 127 P330 NUM 8 Q6B 6B White Students 128 P325 NUM 8 Q6C 6C Black Students 129 P316 NUM 8 Q6D 6D Asian Students
130 P318 NUM 8 Q6E 6E Native Hawaiian/Pacific Islander Students
131 P310 NUM 8 Q6F 6F American Indian/Alaska Native Students
132 P332 NUM 8 Q6G 6G Students of Two or More Races 133 P335 NUM 8 Q7A 7A Is School Coeducational 134 P340 NUM 8 Q7B 7B Male Students 135 P345 NUM 8 Q8A 8A Students in 12th Grade Last Year
136 P350 NUM 8 Q8B 8B Number of 12th Graders Last Year
137 P360 NUM 8 Q8D 8D Percent to 4-Year College
138 P365 NUM 8 Q9A 9A Length of School Day for Kindergarten
139 P370 NUM 8 Q9B 9B Days Per Week for Kindergarten 140 P385 NUM 8 Q10_FT 10 Full-Time Teachers 141 P390 NUM 8 Q10_>3/4 10 More Than 3/4 Time Teachers 142 P395 NUM 8 Q10_>1/2 10 More Than 1/2 Time Teachers 143 P400 NUM 8 Q10_>1/4 10 More Than 1/4 Time Teachers 144 P405 NUM 8 Q10_<1/4 10 Less Than 1/4 Time Teachers 145 P410 NUM 8 Q10_TOTAL 10 Total Number of Teachers 146 P415 NUM 8 Q11 11 Type of School
147 P420 NUM 8 Q12A 12A School Supports Home Schooling
148 P425 NUM 8 Q12B 12B School Located in Private Home
149 P430 NUM 8 Q13A 13A Does School Have Religious Orientation
150 P435 NUM 8 Q13B 13B School Affiliation 151 P440 NUM 8 Q13C 13C Religious Orientation 152 P445 NUM 8 Q13C_CATHOLIC 13C Type of Catholic School 153 P450 NUM 8 Q14_0 14 No Associations 154 P455 NUM 8 Q14_1 14 Accelerated Christian Education
155 P460 NUM 8 Q14_2 14 American Association of Christian Schools
156 P465 NUM 8 Q14_3 14 Association of Christian Schools International
157 P467 NUM 8 Q14_4 14 Association of Christian Teachers and Schools
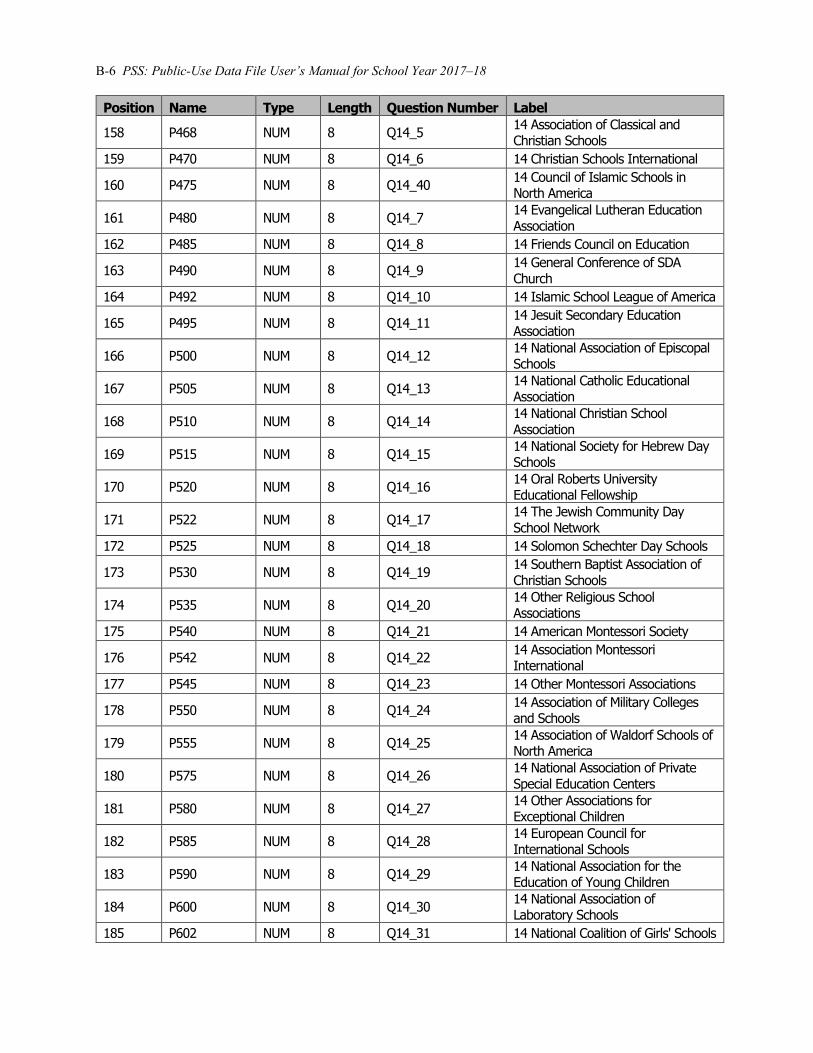
B-6 PSS: Public-Use Data File User’s Manual for School Year 2017–18
Position Name Type Length Question Number Label
158 P468 NUM 8 Q14_5 14 Association of Classical and Christian Schools
159 P470 NUM 8 Q14_6 14 Christian Schools International
160 P475 NUM 8 Q14_40 14 Council of Islamic Schools in North America
161 P480 NUM 8 Q14_7 14 Evangelical Lutheran Education Association
162 P485 NUM 8 Q14_8 14 Friends Council on Education
163 P490 NUM 8 Q14_9 14 General Conference of SDA Church
164 P492 NUM 8 Q14_10 14 Islamic School League of America
165 P495 NUM 8 Q14_11 14 Jesuit Secondary Education Association
166 P500 NUM 8 Q14_12 14 National Association of Episcopal Schools
167 P505 NUM 8 Q14_13 14 National Catholic Educational Association
168 P510 NUM 8 Q14_14 14 National Christian School Association
169 P515 NUM 8 Q14_15 14 National Society for Hebrew Day Schools
170 P520 NUM 8 Q14_16 14 Oral Roberts University Educational Fellowship
171 P522 NUM 8 Q14_17 14 The Jewish Community Day School Network
172 P525 NUM 8 Q14_18 14 Solomon Schechter Day Schools
173 P530 NUM 8 Q14_19 14 Southern Baptist Association of Christian Schools
174 P535 NUM 8 Q14_20 14 Other Religious School Associations
175 P540 NUM 8 Q14_21 14 American Montessori Society
176 P542 NUM 8 Q14_22 14 Association Montessori International
177 P545 NUM 8 Q14_23 14 Other Montessori Associations
178 P550 NUM 8 Q14_24 14 Association of Military Colleges and Schools
179 P555 NUM 8 Q14_25 14 Association of Waldorf Schools of North America
180 P575 NUM 8 Q14_26 14 National Association of Private Special Education Centers
181 P580 NUM 8 Q14_27 14 Other Associations for Exceptional Children
182 P585 NUM 8 Q14_28 14 European Council for International Schools
183 P590 NUM 8 Q14_29 14 National Association for the Education of Young Children
184 P600 NUM 8 Q14_30 14 National Association of Laboratory Schools
185 P602 NUM 8 Q14_31 14 National Coalition of Girls' Schools
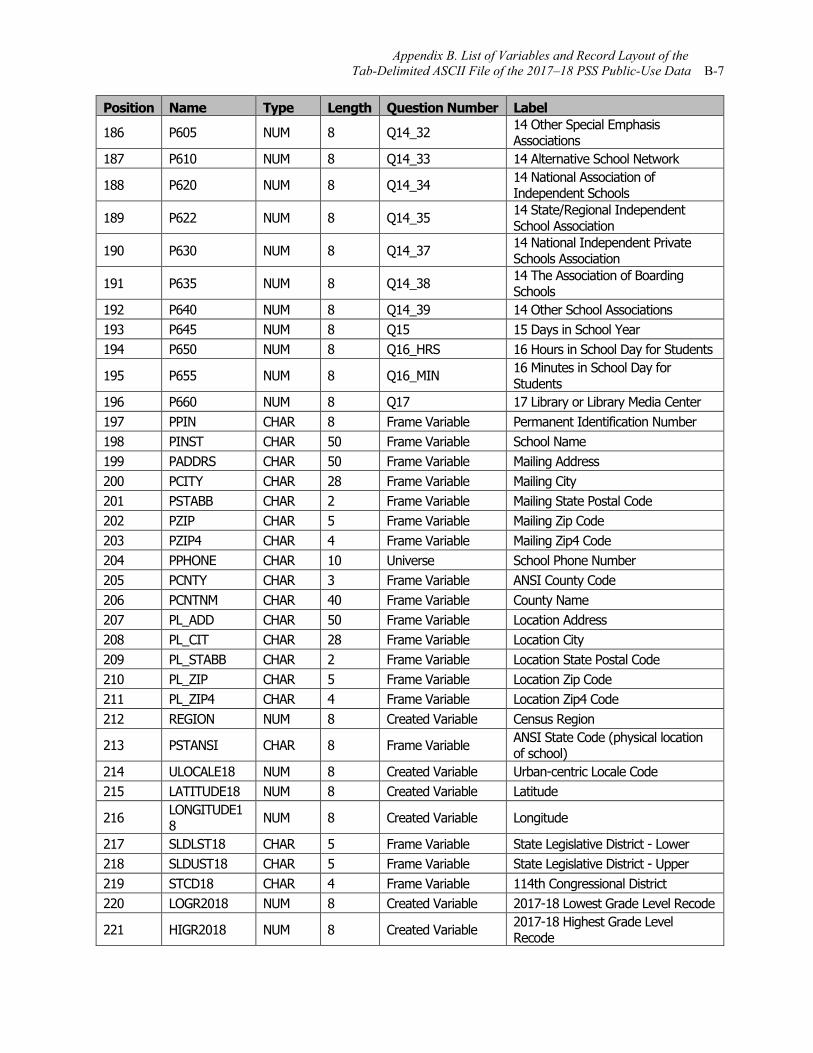
Appendix B. List of Variables and Record Layout of the Tab-Delimited ASCII File of the 2017–18 PSS Public-Use Data B-7
Position Name Type Length Question Number Label
186 P605 NUM 8 Q14_32 14 Other Special Emphasis Associations
187 P610 NUM 8 Q14_33 14 Alternative School Network
188 P620 NUM 8 Q14_34 14 National Association of Independent Schools
189 P622 NUM 8 Q14_35 14 State/Regional Independent School Association
190 P630 NUM 8 Q14_37 14 National Independent Private Schools Association
191 P635 NUM 8 Q14_38 14 The Association of Boarding Schools
192 P640 NUM 8 Q14_39 14 Other School Associations 193 P645 NUM 8 Q15 15 Days in School Year 194 P650 NUM 8 Q16_HRS 16 Hours in School Day for Students
195 P655 NUM 8 Q16_MIN 16 Minutes in School Day for Students
196 P660 NUM 8 Q17 17 Library or Library Media Center 197 PPIN CHAR 8 Frame Variable Permanent Identification Number 198 PINST CHAR 50 Frame Variable School Name 199 PADDRS CHAR 50 Frame Variable Mailing Address 200 PCITY CHAR 28 Frame Variable Mailing City 201 PSTABB CHAR 2 Frame Variable Mailing State Postal Code 202 PZIP CHAR 5 Frame Variable Mailing Zip Code 203 PZIP4 CHAR 4 Frame Variable Mailing Zip4 Code 204 PPHONE CHAR 10 Universe School Phone Number 205 PCNTY CHAR 3 Frame Variable ANSI County Code 206 PCNTNM CHAR 40 Frame Variable County Name 207 PL_ADD CHAR 50 Frame Variable Location Address 208 PL_CIT CHAR 28 Frame Variable Location City 209 PL_STABB CHAR 2 Frame Variable Location State Postal Code 210 PL_ZIP CHAR 5 Frame Variable Location Zip Code 211 PL_ZIP4 CHAR 4 Frame Variable Location Zip4 Code 212 REGION NUM 8 Created Variable Census Region
213 PSTANSI CHAR 8 Frame Variable ANSI State Code (physical location of school)
214 ULOCALE18 NUM 8 Created Variable Urban-centric Locale Code 215 LATITUDE18 NUM 8 Created Variable Latitude
216 LONGITUDE18 NUM 8 Created Variable Longitude
217 SLDLST18 CHAR 5 Frame Variable State Legislative District - Lower 218 SLDUST18 CHAR 5 Frame Variable State Legislative District - Upper 219 STCD18 CHAR 4 Frame Variable 114th Congressional District 220 LOGR2018 NUM 8 Created Variable 2017-18 Lowest Grade Level Recode
221 HIGR2018 NUM 8 Created Variable 2017-18 Highest Grade Level Recode
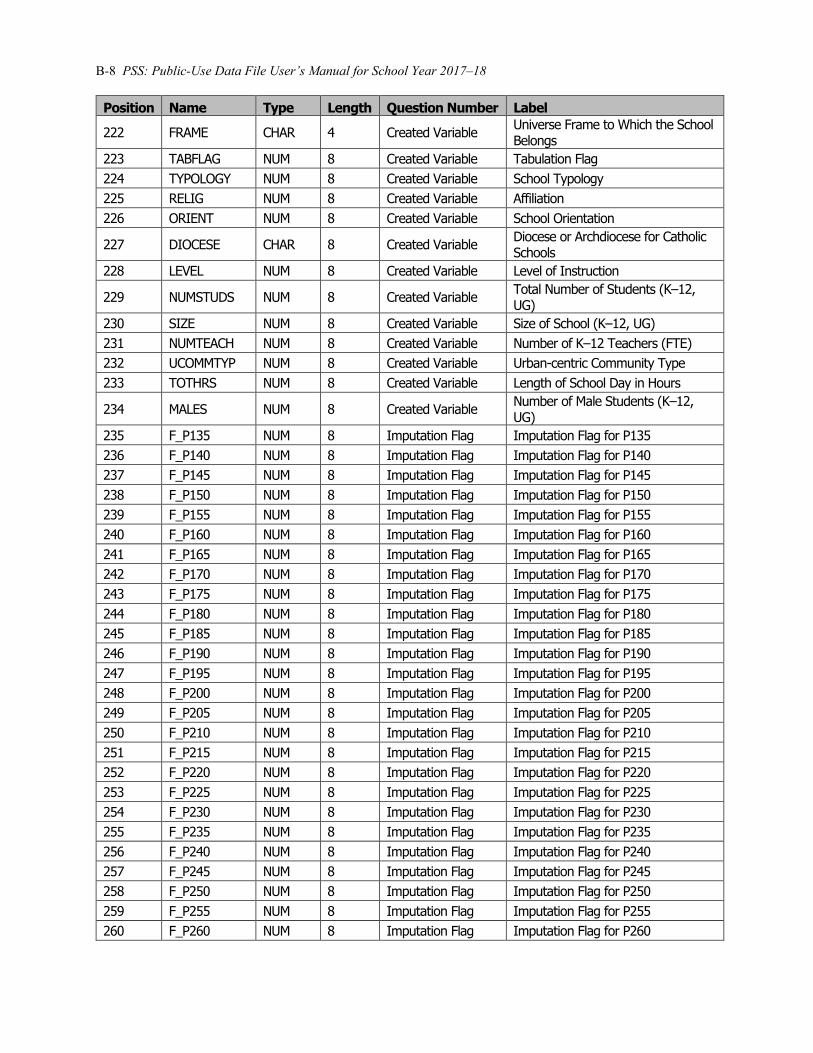
B-8 PSS: Public-Use Data File User’s Manual for School Year 2017–18
Position Name Type Length Question Number Label
222 FRAME CHAR 4 Created Variable Universe Frame to Which the School Belongs
223 TABFLAG NUM 8 Created Variable Tabulation Flag 224 TYPOLOGY NUM 8 Created Variable School Typology 225 RELIG NUM 8 Created Variable Affiliation 226 ORIENT NUM 8 Created Variable School Orientation
227 DIOCESE CHAR 8 Created Variable Diocese or Archdiocese for Catholic Schools
228 LEVEL NUM 8 Created Variable Level of Instruction
229 NUMSTUDS NUM 8 Created Variable Total Number of Students (K–12, UG)
230 SIZE NUM 8 Created Variable Size of School (K–12, UG) 231 NUMTEACH NUM 8 Created Variable Number of K–12 Teachers (FTE) 232 UCOMMTYP NUM 8 Created Variable Urban-centric Community Type 233 TOTHRS NUM 8 Created Variable Length of School Day in Hours
234 MALES NUM 8 Created Variable Number of Male Students (K–12, UG)
235 F_P135 NUM 8 Imputation Flag Imputation Flag for P135 236 F_P140 NUM 8 Imputation Flag Imputation Flag for P140 237 F_P145 NUM 8 Imputation Flag Imputation Flag for P145 238 F_P150 NUM 8 Imputation Flag Imputation Flag for P150 239 F_P155 NUM 8 Imputation Flag Imputation Flag for P155 240 F_P160 NUM 8 Imputation Flag Imputation Flag for P160 241 F_P165 NUM 8 Imputation Flag Imputation Flag for P165 242 F_P170 NUM 8 Imputation Flag Imputation Flag for P170 243 F_P175 NUM 8 Imputation Flag Imputation Flag for P175 244 F_P180 NUM 8 Imputation Flag Imputation Flag for P180 245 F_P185 NUM 8 Imputation Flag Imputation Flag for P185 246 F_P190 NUM 8 Imputation Flag Imputation Flag for P190 247 F_P195 NUM 8 Imputation Flag Imputation Flag for P195 248 F_P200 NUM 8 Imputation Flag Imputation Flag for P200 249 F_P205 NUM 8 Imputation Flag Imputation Flag for P205 250 F_P210 NUM 8 Imputation Flag Imputation Flag for P210 251 F_P215 NUM 8 Imputation Flag Imputation Flag for P215 252 F_P220 NUM 8 Imputation Flag Imputation Flag for P220 253 F_P225 NUM 8 Imputation Flag Imputation Flag for P225 254 F_P230 NUM 8 Imputation Flag Imputation Flag for P230 255 F_P235 NUM 8 Imputation Flag Imputation Flag for P235 256 F_P240 NUM 8 Imputation Flag Imputation Flag for P240 257 F_P245 NUM 8 Imputation Flag Imputation Flag for P245 258 F_P250 NUM 8 Imputation Flag Imputation Flag for P250 259 F_P255 NUM 8 Imputation Flag Imputation Flag for P255 260 F_P260 NUM 8 Imputation Flag Imputation Flag for P260
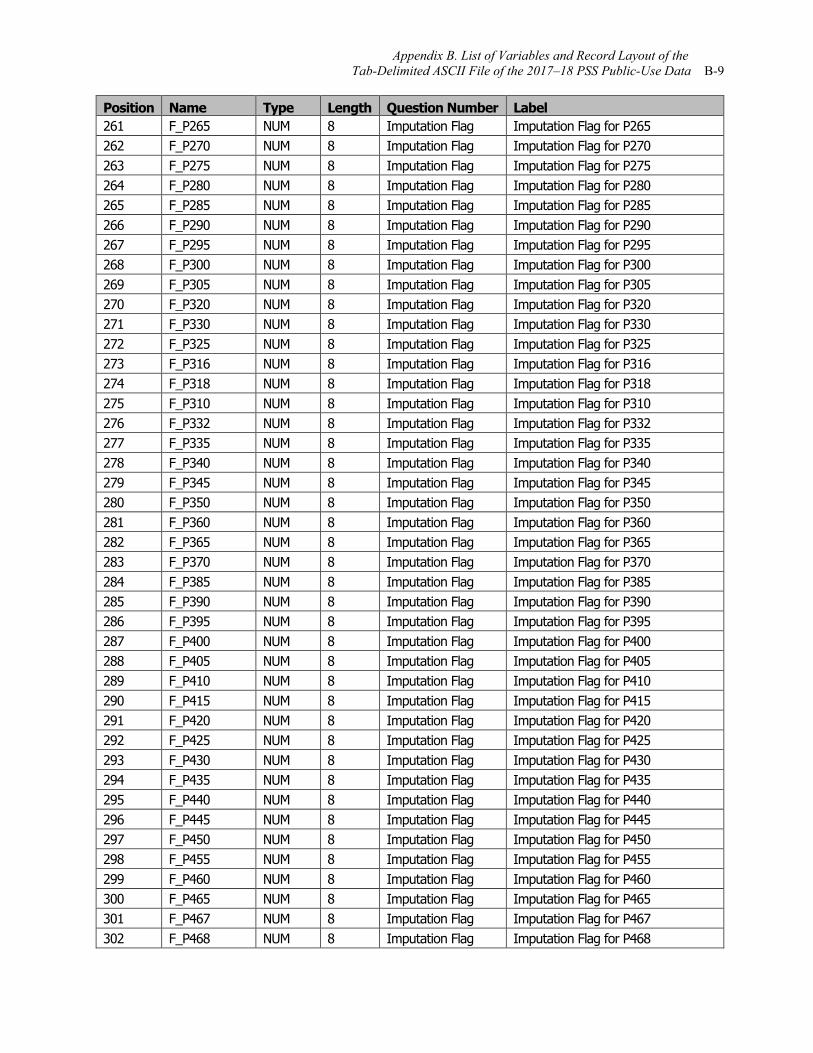
Appendix B. List of Variables and Record Layout of the Tab-Delimited ASCII File of the 2017–18 PSS Public-Use Data B-9
Position Name Type Length Question Number Label 261 F_P265 NUM 8 Imputation Flag Imputation Flag for P265 262 F_P270 NUM 8 Imputation Flag Imputation Flag for P270 263 F_P275 NUM 8 Imputation Flag Imputation Flag for P275 264 F_P280 NUM 8 Imputation Flag Imputation Flag for P280 265 F_P285 NUM 8 Imputation Flag Imputation Flag for P285 266 F_P290 NUM 8 Imputation Flag Imputation Flag for P290 267 F_P295 NUM 8 Imputation Flag Imputation Flag for P295 268 F_P300 NUM 8 Imputation Flag Imputation Flag for P300 269 F_P305 NUM 8 Imputation Flag Imputation Flag for P305 270 F_P320 NUM 8 Imputation Flag Imputation Flag for P320 271 F_P330 NUM 8 Imputation Flag Imputation Flag for P330 272 F_P325 NUM 8 Imputation Flag Imputation Flag for P325 273 F_P316 NUM 8 Imputation Flag Imputation Flag for P316 274 F_P318 NUM 8 Imputation Flag Imputation Flag for P318 275 F_P310 NUM 8 Imputation Flag Imputation Flag for P310 276 F_P332 NUM 8 Imputation Flag Imputation Flag for P332 277 F_P335 NUM 8 Imputation Flag Imputation Flag for P335 278 F_P340 NUM 8 Imputation Flag Imputation Flag for P340 279 F_P345 NUM 8 Imputation Flag Imputation Flag for P345 280 F_P350 NUM 8 Imputation Flag Imputation Flag for P350 281 F_P360 NUM 8 Imputation Flag Imputation Flag for P360 282 F_P365 NUM 8 Imputation Flag Imputation Flag for P365 283 F_P370 NUM 8 Imputation Flag Imputation Flag for P370 284 F_P385 NUM 8 Imputation Flag Imputation Flag for P385 285 F_P390 NUM 8 Imputation Flag Imputation Flag for P390 286 F_P395 NUM 8 Imputation Flag Imputation Flag for P395 287 F_P400 NUM 8 Imputation Flag Imputation Flag for P400 288 F_P405 NUM 8 Imputation Flag Imputation Flag for P405 289 F_P410 NUM 8 Imputation Flag Imputation Flag for P410 290 F_P415 NUM 8 Imputation Flag Imputation Flag for P415 291 F_P420 NUM 8 Imputation Flag Imputation Flag for P420 292 F_P425 NUM 8 Imputation Flag Imputation Flag for P425 293 F_P430 NUM 8 Imputation Flag Imputation Flag for P430 294 F_P435 NUM 8 Imputation Flag Imputation Flag for P435 295 F_P440 NUM 8 Imputation Flag Imputation Flag for P440 296 F_P445 NUM 8 Imputation Flag Imputation Flag for P445 297 F_P450 NUM 8 Imputation Flag Imputation Flag for P450 298 F_P455 NUM 8 Imputation Flag Imputation Flag for P455 299 F_P460 NUM 8 Imputation Flag Imputation Flag for P460 300 F_P465 NUM 8 Imputation Flag Imputation Flag for P465 301 F_P467 NUM 8 Imputation Flag Imputation Flag for P467 302 F_P468 NUM 8 Imputation Flag Imputation Flag for P468
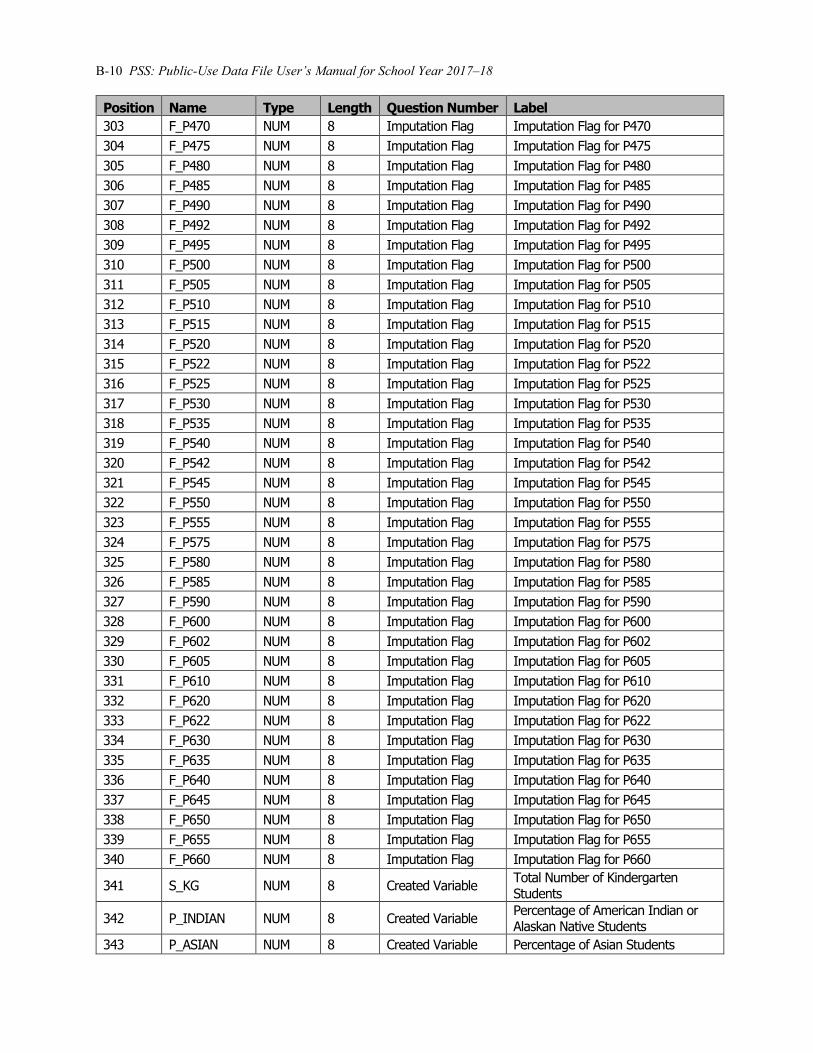
B-10 PSS: Public-Use Data File User’s Manual for School Year 2017–18
Position Name Type Length Question Number Label 303 F_P470 NUM 8 Imputation Flag Imputation Flag for P470 304 F_P475 NUM 8 Imputation Flag Imputation Flag for P475 305 F_P480 NUM 8 Imputation Flag Imputation Flag for P480 306 F_P485 NUM 8 Imputation Flag Imputation Flag for P485 307 F_P490 NUM 8 Imputation Flag Imputation Flag for P490 308 F_P492 NUM 8 Imputation Flag Imputation Flag for P492 309 F_P495 NUM 8 Imputation Flag Imputation Flag for P495 310 F_P500 NUM 8 Imputation Flag Imputation Flag for P500 311 F_P505 NUM 8 Imputation Flag Imputation Flag for P505 312 F_P510 NUM 8 Imputation Flag Imputation Flag for P510 313 F_P515 NUM 8 Imputation Flag Imputation Flag for P515 314 F_P520 NUM 8 Imputation Flag Imputation Flag for P520 315 F_P522 NUM 8 Imputation Flag Imputation Flag for P522 316 F_P525 NUM 8 Imputation Flag Imputation Flag for P525 317 F_P530 NUM 8 Imputation Flag Imputation Flag for P530 318 F_P535 NUM 8 Imputation Flag Imputation Flag for P535 319 F_P540 NUM 8 Imputation Flag Imputation Flag for P540 320 F_P542 NUM 8 Imputation Flag Imputation Flag for P542 321 F_P545 NUM 8 Imputation Flag Imputation Flag for P545 322 F_P550 NUM 8 Imputation Flag Imputation Flag for P550 323 F_P555 NUM 8 Imputation Flag Imputation Flag for P555 324 F_P575 NUM 8 Imputation Flag Imputation Flag for P575 325 F_P580 NUM 8 Imputation Flag Imputation Flag for P580 326 F_P585 NUM 8 Imputation Flag Imputation Flag for P585 327 F_P590 NUM 8 Imputation Flag Imputation Flag for P590 328 F_P600 NUM 8 Imputation Flag Imputation Flag for P600 329 F_P602 NUM 8 Imputation Flag Imputation Flag for P602 330 F_P605 NUM 8 Imputation Flag Imputation Flag for P605 331 F_P610 NUM 8 Imputation Flag Imputation Flag for P610 332 F_P620 NUM 8 Imputation Flag Imputation Flag for P620 333 F_P622 NUM 8 Imputation Flag Imputation Flag for P622 334 F_P630 NUM 8 Imputation Flag Imputation Flag for P630 335 F_P635 NUM 8 Imputation Flag Imputation Flag for P635 336 F_P640 NUM 8 Imputation Flag Imputation Flag for P640 337 F_P645 NUM 8 Imputation Flag Imputation Flag for P645 338 F_P650 NUM 8 Imputation Flag Imputation Flag for P650 339 F_P655 NUM 8 Imputation Flag Imputation Flag for P655 340 F_P660 NUM 8 Imputation Flag Imputation Flag for P660
341 S_KG NUM 8 Created Variable Total Number of Kindergarten Students
342 P_INDIAN NUM 8 Created Variable Percentage of American Indian or Alaskan Native Students
343 P_ASIAN NUM 8 Created Variable Percentage of Asian Students
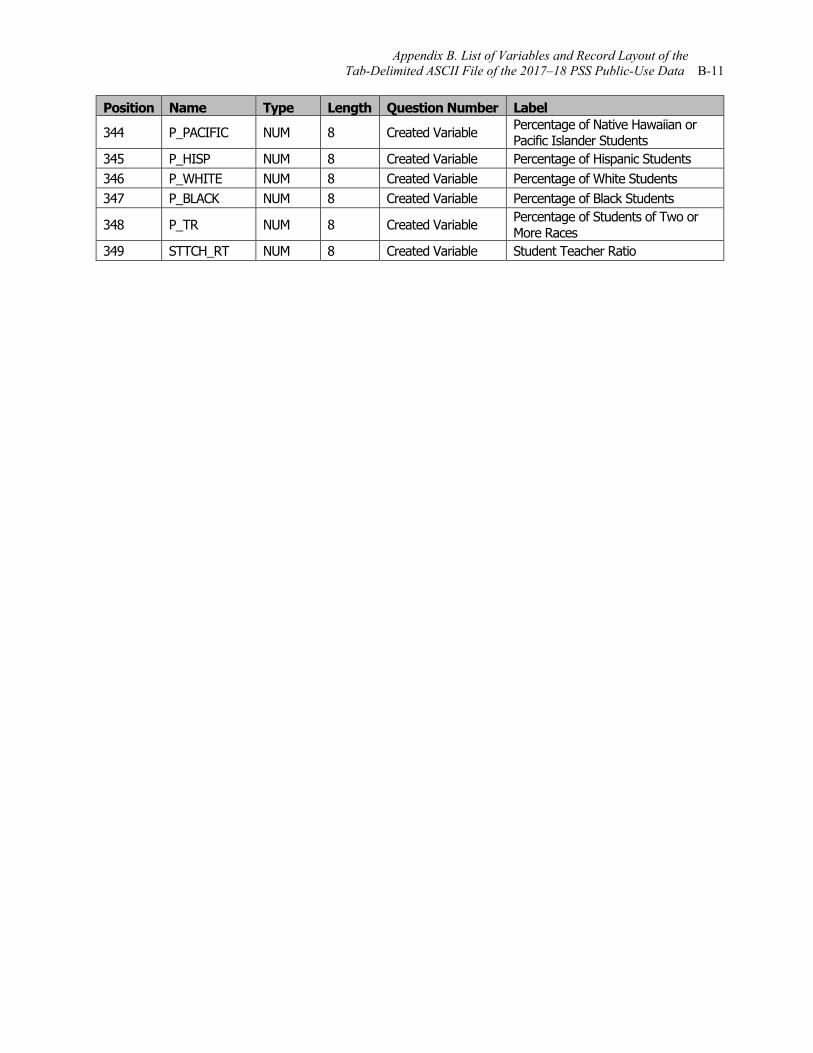
Appendix B. List of Variables and Record Layout of the Tab-Delimited ASCII File of the 2017–18 PSS Public-Use Data B-11
Position Name Type Length Question Number Label
344 P_PACIFIC NUM 8 Created Variable Percentage of Native Hawaiian or Pacific Islander Students
345 P_HISP NUM 8 Created Variable Percentage of Hispanic Students 346 P_WHITE NUM 8 Created Variable Percentage of White Students 347 P_BLACK NUM 8 Created Variable Percentage of Black Students
348 P_TR NUM 8 Created Variable Percentage of Students of Two or More Races
349 STTCH_RT NUM 8 Created Variable Student Teacher Ratio

Appendix C. 2017–18 Private School Universe Survey Public-Use Codebook
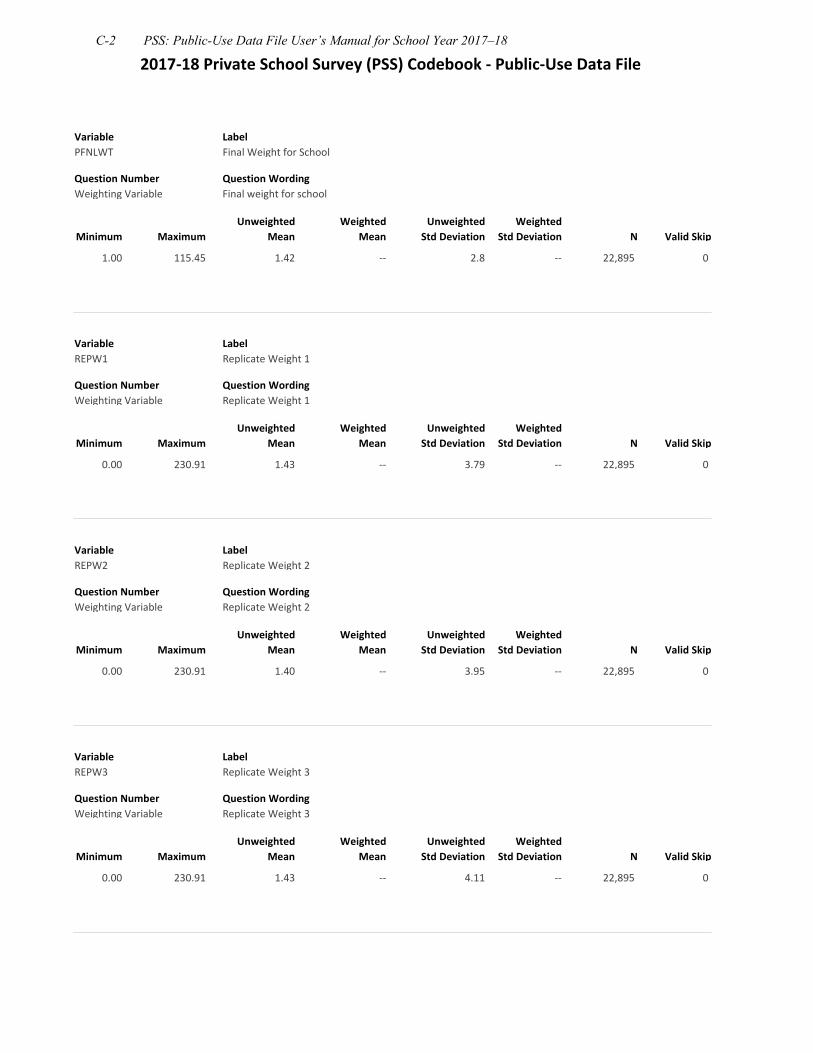
2017‐18 Private School Survey (PSS) Codebook ‐ Public‐Use Data File
Variable PFNLWT
Label Final Weight for School
Question Number Weighting Variable
Question Wording Final weight for school
Minimum Maximum Unweighted
Mean Weighted
Mean Unweighted
Std Deviation Weighted
Std Deviation N Valid Skip
1.00 115.45 1.42 ‐‐ 2.8 ‐‐ 22,895 0
Variable REPW1
Label Replicate Weight 1
Question Number Weighting Variable
Question Wording Replicate Weight 1
Minimum Maximum Unweighted
Mean Weighted
Mean Unweighted
Std Deviation Weighted
Std Deviation N Valid Skip
0.00 230.91 1.43 ‐‐ 3.79 ‐‐ 22,895 0
Variable REPW2
Label Replicate Weight 2
Question Number Weighting Variable
Question Wording Replicate Weight 2
Minimum Maximum Unweighted
Mean Weighted
Mean Unweighted
Std Deviation Weighted
Std Deviation N Valid Skip
0.00 230.91 1.40 ‐‐ 3.95 ‐‐ 22,895 0
Variable REPW3
Label Replicate Weight 3
Question Number Weighting Variable
Question Wording Replicate Weight 3
Minimum Maximum Unweighted
Mean Weighted
Mean Unweighted
Std Deviation Weighted
Std Deviation N Valid Skip
0.00 230.91 1.43 ‐‐ 4.11 ‐‐ 22,895 0
C-2 PSS: Public-Use Data File User’s Manual for School Year 2017–18
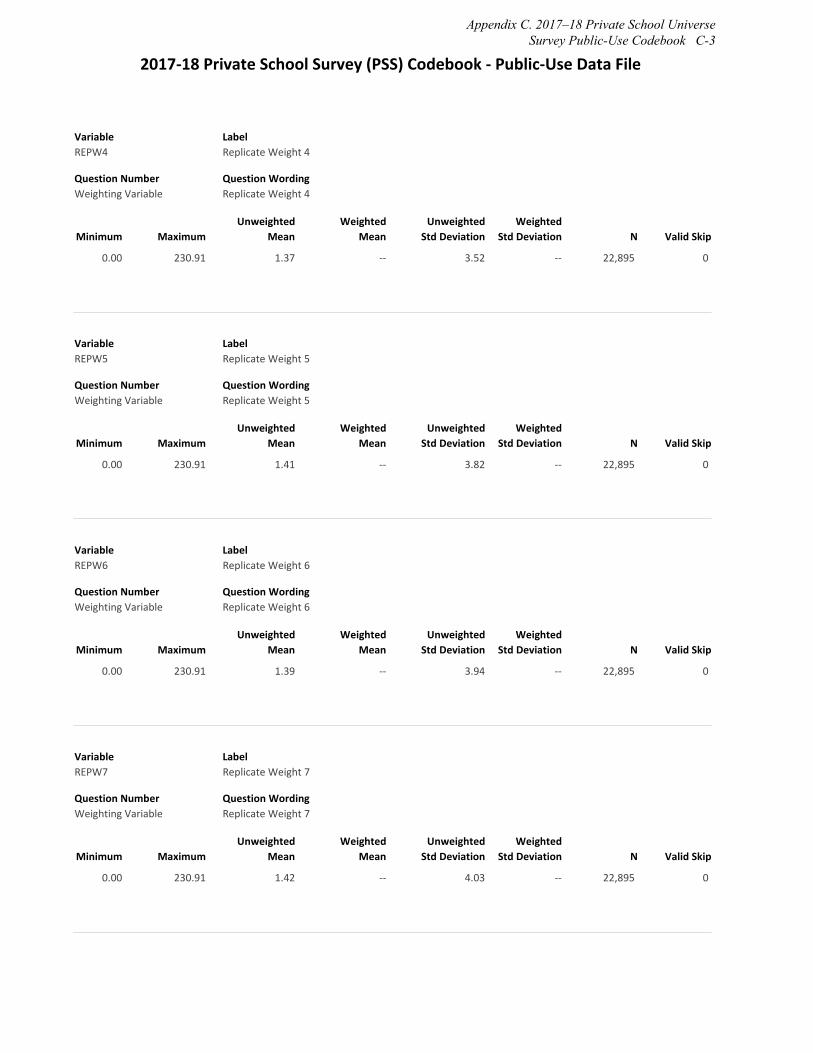
2017‐18 Private School Survey (PSS) Codebook ‐ Public‐Use Data File
Variable REPW4
Label Replicate Weight 4
Question Number Weighting Variable
Question Wording Replicate Weight 4
Minimum Maximum Unweighted
Mean Weighted
Mean Unweighted
Std Deviation Weighted
Std Deviation N Valid Skip
0.00 230.91 1.37 ‐‐ 3.52 ‐‐ 22,895 0
Variable REPW5
Label Replicate Weight 5
Question Number Weighting Variable
Question Wording Replicate Weight 5
Minimum Maximum Unweighted
Mean Weighted
Mean Unweighted
Std Deviation Weighted
Std Deviation N Valid Skip
0.00 230.91 1.41 ‐‐ 3.82 ‐‐ 22,895 0
Variable REPW6
Label Replicate Weight 6
Question Number Weighting Variable
Question Wording Replicate Weight 6
Minimum Maximum Unweighted
Mean Weighted
Mean Unweighted
Std Deviation Weighted
Std Deviation N Valid Skip
0.00 230.91 1.39 ‐‐ 3.94 ‐‐ 22,895 0
Variable REPW7
Label Replicate Weight 7
Question Number Weighting Variable
Question Wording Replicate Weight 7
Minimum Maximum Unweighted
Mean Weighted
Mean Unweighted
Std Deviation Weighted
Std Deviation N Valid Skip
0.00 230.91 1.42 ‐‐ 4.03 ‐‐ 22,895 0
Appendix C. 2017–18 Private School Universe Survey Public-Use Codebook C-3

2017‐18 Private School Survey (PSS) Codebook ‐ Public‐Use Data File
Variable REPW8
Label Replicate Weight 8
Question Number Weighting Variable
Question Wording Replicate Weight 8
Minimum Maximum Unweighted
Mean Weighted
Mean Unweighted
Std Deviation Weighted
Std Deviation N Valid Skip
0.00 230.91 1.38 ‐‐ 3.2 ‐‐ 22,895 0
Variable REPW9
Label Replicate Weight 9
Question Number Weighting Variable
Question Wording Replicate Weight 9
Minimum Maximum Unweighted
Mean Weighted
Mean Unweighted
Std Deviation Weighted
Std Deviation N Valid Skip
0.00 230.91 1.41 ‐‐ 3.64 ‐‐ 22,895 0
Variable REPW10
Label Replicate Weight 10
Question Number Weighting Variable
Question Wording Replicate Weight 10
Minimum Maximum Unweighted
Mean Weighted
Mean Unweighted
Std Deviation Weighted
Std Deviation N Valid Skip
0.00 230.91 1.42 ‐‐ 4.19 ‐‐ 22,895 0
Variable REPW11
Label Replicate Weight 11
Question Number Weighting Variable
Question Wording Replicate Weight 11
Minimum Maximum Unweighted
Mean Weighted
Mean Unweighted
Std Deviation Weighted
Std Deviation N Valid Skip
0.00 230.91 1.43 ‐‐ 4.1 ‐‐ 22,895 0
C-4 PSS: Public-Use Data File User’s Manual for School Year 2017–18

2017‐18 Private School Survey (PSS) Codebook ‐ Public‐Use Data File
Variable REPW12
Label Replicate Weight 12
Question Number Weighting Variable
Question Wording Replicate Weight 12
Minimum Maximum Unweighted
Mean Weighted
Mean Unweighted
Std Deviation Weighted
Std Deviation N Valid Skip
0.00 230.91 1.43 ‐‐ 3.94 ‐‐ 22,895 0
Variable REPW13
Label Replicate Weight 13
Question Number Weighting Variable
Question Wording Replicate Weight 13
Minimum Maximum Unweighted
Mean Weighted
Mean Unweighted
Std Deviation Weighted
Std Deviation N Valid Skip
0.00 230.91 1.40 ‐‐ 3.61 ‐‐ 22,895 0
Variable REPW14
Label Replicate Weight 14
Question Number Weighting Variable
Question Wording Replicate Weight 14
Minimum Maximum Unweighted
Mean Weighted
Mean Unweighted
Std Deviation Weighted
Std Deviation N Valid Skip
0.00 230.91 1.40 ‐‐ 3.55 ‐‐ 22,895 0
Variable REPW15
Label Replicate Weight 15
Question Number Weighting Variable
Question Wording Replicate Weight 15
Minimum Maximum Unweighted
Mean Weighted
Mean Unweighted
Std Deviation Weighted
Std Deviation N Valid Skip
0.00 230.91 1.41 ‐‐ 4.14 ‐‐ 22,895 0
Appendix C. 2017–18 Private School Universe Survey Public-Use Codebook C-5

2017‐18 Private School Survey (PSS) Codebook ‐ Public‐Use Data File
Variable REPW16
Label Replicate Weight 16
Question Number Weighting Variable
Question Wording Replicate Weight 16
Minimum Maximum Unweighted
Mean Weighted
Mean Unweighted
Std Deviation Weighted
Std Deviation N Valid Skip
0.00 230.91 1.45 ‐‐ 4.42 ‐‐ 22,895 0
Variable REPW17
Label Replicate Weight 17
Question Number Weighting Variable
Question Wording Replicate Weight 17
Minimum Maximum Unweighted
Mean Weighted
Mean Unweighted
Std Deviation Weighted
Std Deviation N Valid Skip
0.00 230.91 1.43 ‐‐ 3.97 ‐‐ 22,895 0
Variable REPW18
Label Replicate Weight 18
Question Number Weighting Variable
Question Wording Replicate Weight 18
Minimum Maximum Unweighted
Mean Weighted
Mean Unweighted
Std Deviation Weighted
Std Deviation N Valid Skip
0.00 230.91 1.41 ‐‐ 4.25 ‐‐ 22,895 0
Variable REPW19
Label Replicate Weight 19
Question Number Weighting Variable
Question Wording Replicate Weight 19
Minimum Maximum Unweighted
Mean Weighted
Mean Unweighted
Std Deviation Weighted
Std Deviation N Valid Skip
0.00 230.91 1.40 ‐‐ 3.94 ‐‐ 22,895 0
C-6 PSS: Public-Use Data File User’s Manual for School Year 2017–18
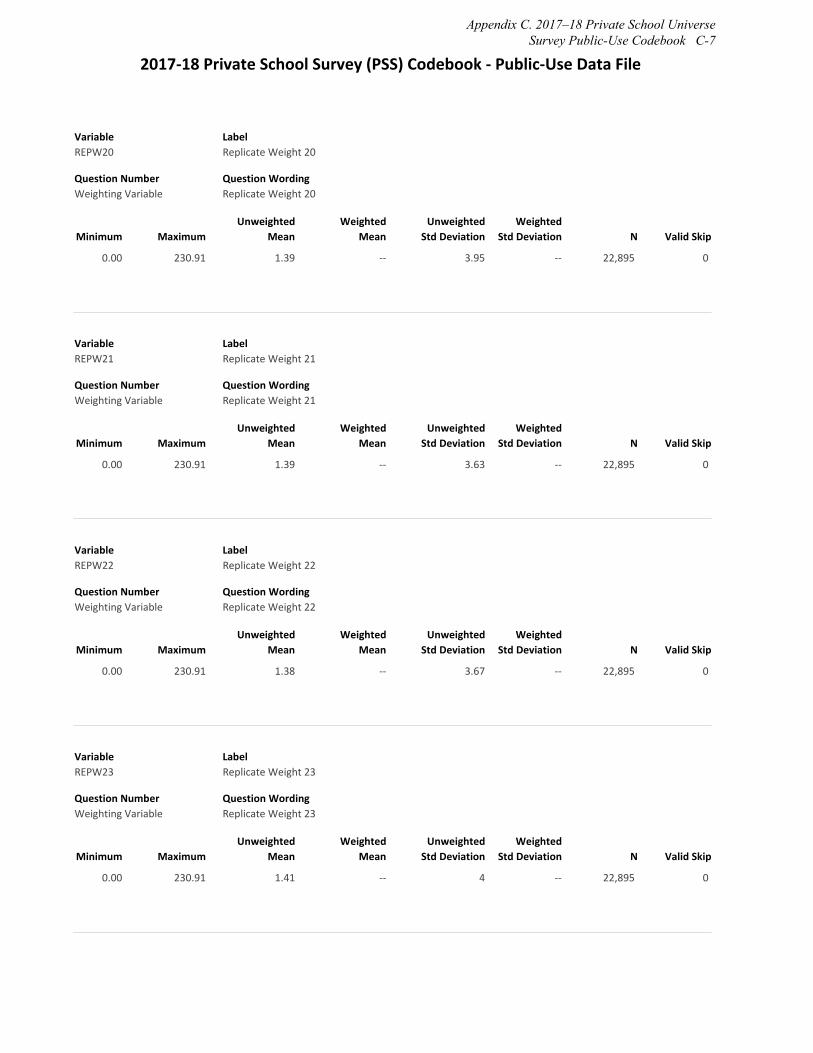
2017‐18 Private School Survey (PSS) Codebook ‐ Public‐Use Data File
Variable REPW20
Label Replicate Weight 20
Question Number Weighting Variable
Question Wording Replicate Weight 20
Minimum Maximum Unweighted
Mean Weighted
Mean Unweighted
Std Deviation Weighted
Std Deviation N Valid Skip
0.00 230.91 1.39 ‐‐ 3.95 ‐‐ 22,895 0
Variable REPW21
Label Replicate Weight 21
Question Number Weighting Variable
Question Wording Replicate Weight 21
Minimum Maximum Unweighted
Mean Weighted
Mean Unweighted
Std Deviation Weighted
Std Deviation N Valid Skip
0.00 230.91 1.39 ‐‐ 3.63 ‐‐ 22,895 0
Variable REPW22
Label Replicate Weight 22
Question Number Weighting Variable
Question Wording Replicate Weight 22
Minimum Maximum Unweighted
Mean Weighted
Mean Unweighted
Std Deviation Weighted
Std Deviation N Valid Skip
0.00 230.91 1.38 ‐‐ 3.67 ‐‐ 22,895 0
Variable REPW23
Label Replicate Weight 23
Question Number Weighting Variable
Question Wording Replicate Weight 23
Minimum Maximum Unweighted
Mean Weighted
Mean Unweighted
Std Deviation Weighted
Std Deviation N Valid Skip
0.00 230.91 1.41 ‐‐ 4 ‐‐ 22,895 0
Appendix C. 2017–18 Private School Universe Survey Public-Use Codebook C-7

2017‐18 Private School Survey (PSS) Codebook ‐ Public‐Use Data File
Variable REPW24
Label Replicate Weight 24
Question Number Weighting Variable
Question Wording Replicate Weight 24
Minimum Maximum Unweighted
Mean Weighted
Mean Unweighted
Std Deviation Weighted
Std Deviation N Valid Skip
0.00 230.91 1.43 ‐‐ 4.31 ‐‐ 22,895 0
Variable REPW25
Label Replicate Weight 25
Question Number Weighting Variable
Question Wording Replicate Weight 25
Minimum Maximum Unweighted
Mean Weighted
Mean Unweighted
Std Deviation Weighted
Std Deviation N Valid Skip
0.00 230.91 1.40 ‐‐ 3.89 ‐‐ 22,895 0
Variable REPW26
Label Replicate Weight 26
Question Number Weighting Variable
Question Wording Replicate Weight 26
Minimum Maximum Unweighted
Mean Weighted
Mean Unweighted
Std Deviation Weighted
Std Deviation N Valid Skip
0.00 230.91 1.35 ‐‐ 3.27 ‐‐ 22,895 0
Variable REPW27
Label Replicate Weight 27
Question Number Weighting Variable
Question Wording Replicate Weight 27
Minimum Maximum Unweighted
Mean Weighted
Mean Unweighted
Std Deviation Weighted
Std Deviation N Valid Skip
0.00 230.91 1.43 ‐‐ 4 ‐‐ 22,895 0
C-8 PSS: Public-Use Data File User’s Manual for School Year 2017–18

2017‐18 Private School Survey (PSS) Codebook ‐ Public‐Use Data File
Variable REPW28
Label Replicate Weight 28
Question Number Weighting Variable
Question Wording Replicate Weight 28
Minimum Maximum Unweighted
Mean Weighted
Mean Unweighted
Std Deviation Weighted
Std Deviation N Valid Skip
0.00 230.91 1.48 ‐‐ 4.61 ‐‐ 22,895 0
Variable REPW29
Label Replicate Weight 29
Question Number Weighting Variable
Question Wording Replicate Weight 29
Minimum Maximum Unweighted
Mean Weighted
Mean Unweighted
Std Deviation Weighted
Std Deviation N Valid Skip
0.00 230.91 1.43 ‐‐ 4.27 ‐‐ 22,895 0
Variable REPW30
Label Replicate Weight 30
Question Number Weighting Variable
Question Wording Replicate Weight 30
Minimum Maximum Unweighted
Mean Weighted
Mean Unweighted
Std Deviation Weighted
Std Deviation N Valid Skip
0.00 230.91 1.39 ‐‐ 3.75 ‐‐ 22,895 0
Variable REPW31
Label Replicate Weight 31
Question Number Weighting Variable
Question Wording Replicate Weight 31
Minimum Maximum Unweighted
Mean Weighted
Mean Unweighted
Std Deviation Weighted
Std Deviation N Valid Skip
0.00 230.91 1.41 ‐‐ 4.1 ‐‐ 22,895 0
Appendix C. 2017–18 Private School Universe Survey Public-Use Codebook C-9
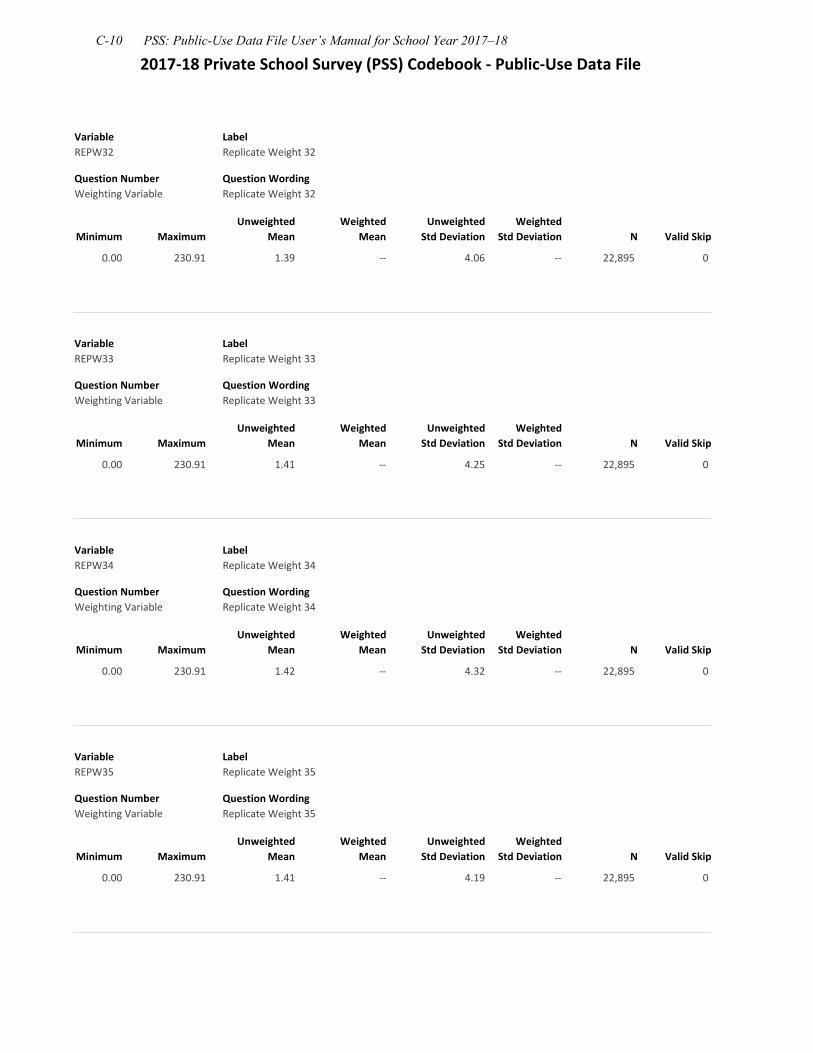
2017‐18 Private School Survey (PSS) Codebook ‐ Public‐Use Data File
Variable REPW32
Label Replicate Weight 32
Question Number Weighting Variable
Question Wording Replicate Weight 32
Minimum Maximum Unweighted
Mean Weighted
Mean Unweighted
Std Deviation Weighted
Std Deviation N Valid Skip
0.00 230.91 1.39 ‐‐ 4.06 ‐‐ 22,895 0
Variable REPW33
Label Replicate Weight 33
Question Number Weighting Variable
Question Wording Replicate Weight 33
Minimum Maximum Unweighted
Mean Weighted
Mean Unweighted
Std Deviation Weighted
Std Deviation N Valid Skip
0.00 230.91 1.41 ‐‐ 4.25 ‐‐ 22,895 0
Variable REPW34
Label Replicate Weight 34
Question Number Weighting Variable
Question Wording Replicate Weight 34
Minimum Maximum Unweighted
Mean Weighted
Mean Unweighted
Std Deviation Weighted
Std Deviation N Valid Skip
0.00 230.91 1.42 ‐‐ 4.32 ‐‐ 22,895 0
Variable REPW35
Label Replicate Weight 35
Question Number Weighting Variable
Question Wording Replicate Weight 35
Minimum Maximum Unweighted
Mean Weighted
Mean Unweighted
Std Deviation Weighted
Std Deviation N Valid Skip
0.00 230.91 1.41 ‐‐ 4.19 ‐‐ 22,895 0
C-10 PSS: Public-Use Data File User’s Manual for School Year 2017–18

2017‐18 Private School Survey (PSS) Codebook ‐ Public‐Use Data File
Variable REPW36
Label Replicate Weight 36
Question Number Weighting Variable
Question Wording Replicate Weight 36
Minimum Maximum Unweighted
Mean Weighted
Mean Unweighted
Std Deviation Weighted
Std Deviation N Valid Skip
0.00 230.91 1.42 ‐‐ 4.06 ‐‐ 22,895 0
Variable REPW37
Label Replicate Weight 37
Question Number Weighting Variable
Question Wording Replicate Weight 37
Minimum Maximum Unweighted
Mean Weighted
Mean Unweighted
Std Deviation Weighted
Std Deviation N Valid Skip
0.00 230.91 1.39 ‐‐ 3.59 ‐‐ 22,895 0
Variable REPW38
Label Replicate Weight 38
Question Number Weighting Variable
Question Wording Replicate Weight 38
Minimum Maximum Unweighted
Mean Weighted
Mean Unweighted
Std Deviation Weighted
Std Deviation N Valid Skip
0.00 230.91 1.42 ‐‐ 3.77 ‐‐ 22,895 0
Variable REPW39
Label Replicate Weight 39
Question Number Weighting Variable
Question Wording Replicate Weight 39
Minimum Maximum Unweighted
Mean Weighted
Mean Unweighted
Std Deviation Weighted
Std Deviation N Valid Skip
0.00 230.91 1.42 ‐‐ 3.92 ‐‐ 22,895 0
Appendix C. 2017–18 Private School Universe Survey Public-Use Codebook C-11
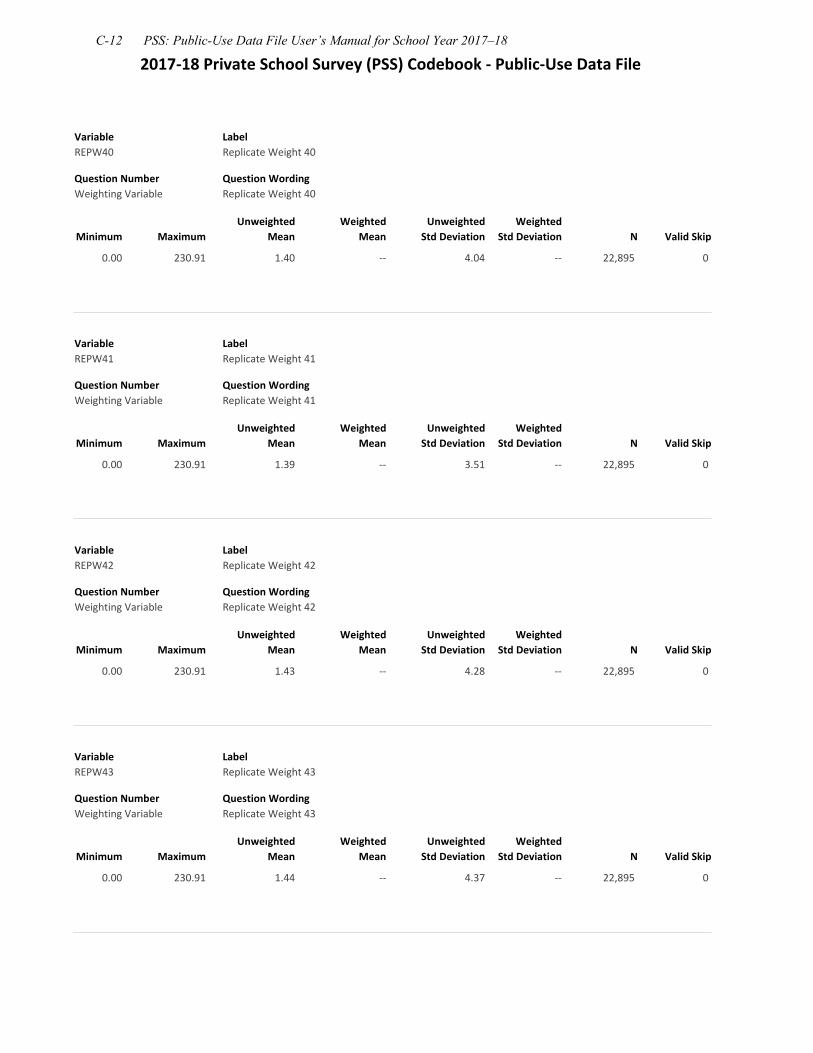
2017‐18 Private School Survey (PSS) Codebook ‐ Public‐Use Data File
Variable REPW40
Label Replicate Weight 40
Question Number Weighting Variable
Question Wording Replicate Weight 40
Minimum Maximum Unweighted
Mean Weighted
Mean Unweighted
Std Deviation Weighted
Std Deviation N Valid Skip
0.00 230.91 1.40 ‐‐ 4.04 ‐‐ 22,895 0
Variable REPW41
Label Replicate Weight 41
Question Number Weighting Variable
Question Wording Replicate Weight 41
Minimum Maximum Unweighted
Mean Weighted
Mean Unweighted
Std Deviation Weighted
Std Deviation N Valid Skip
0.00 230.91 1.39 ‐‐ 3.51 ‐‐ 22,895 0
Variable REPW42
Label Replicate Weight 42
Question Number Weighting Variable
Question Wording Replicate Weight 42
Minimum Maximum Unweighted
Mean Weighted
Mean Unweighted
Std Deviation Weighted
Std Deviation N Valid Skip
0.00 230.91 1.43 ‐‐ 4.28 ‐‐ 22,895 0
Variable REPW43
Label Replicate Weight 43
Question Number Weighting Variable
Question Wording Replicate Weight 43
Minimum Maximum Unweighted
Mean Weighted
Mean Unweighted
Std Deviation Weighted
Std Deviation N Valid Skip
0.00 230.91 1.44 ‐‐ 4.37 ‐‐ 22,895 0
C-12 PSS: Public-Use Data File User’s Manual for School Year 2017–18

2017‐18 Private School Survey (PSS) Codebook ‐ Public‐Use Data File
Variable REPW44
Label Replicate Weight 44
Question Number Weighting Variable
Question Wording Replicate Weight 44
Minimum Maximum Unweighted
Mean Weighted
Mean Unweighted
Std Deviation Weighted
Std Deviation N Valid Skip
0.00 230.91 1.43 ‐‐ 4.14 ‐‐ 22,895 0
Variable REPW45
Label Replicate Weight 45
Question Number Weighting Variable
Question Wording Replicate Weight 45
Minimum Maximum Unweighted
Mean Weighted
Mean Unweighted
Std Deviation Weighted
Std Deviation N Valid Skip
0.00 170.20 1.43 ‐‐ 4.17 ‐‐ 22,895 0
Variable REPW46
Label Replicate Weight 46
Question Number Weighting Variable
Question Wording Replicate Weight 46
Minimum Maximum Unweighted
Mean Weighted
Mean Unweighted
Std Deviation Weighted
Std Deviation N Valid Skip
0.00 154.92 1.46 ‐‐ 4.37 ‐‐ 22,895 0
Variable REPW47
Label Replicate Weight 47
Question Number Weighting Variable
Question Wording Replicate Weight 47
Minimum Maximum Unweighted
Mean Weighted
Mean Unweighted
Std Deviation Weighted
Std Deviation N Valid Skip
0.00 170.20 1.45 ‐‐ 4.37 ‐‐ 22,895 0
Appendix C. 2017–18 Private School Universe Survey Public-Use Codebook C-13

2017‐18 Private School Survey (PSS) Codebook ‐ Public‐Use Data File
Variable REPW48
Label Replicate Weight 48
Question Number Weighting Variable
Question Wording Replicate Weight 48
Minimum Maximum Unweighted
Mean Weighted
Mean Unweighted
Std Deviation Weighted
Std Deviation N Valid Skip
0.00 139.39 1.41 ‐‐ 3.72 ‐‐ 22,895 0
Variable REPW49
Label Replicate Weight 49
Question Number Weighting Variable
Question Wording Replicate Weight 49
Minimum Maximum Unweighted
Mean Weighted
Mean Unweighted
Std Deviation Weighted
Std Deviation N Valid Skip
0.00 170.20 1.43 ‐‐ 4.08 ‐‐ 22,895 0
Variable REPW50
Label Replicate Weight 50
Question Number Weighting Variable
Question Wording Replicate Weight 50
Minimum Maximum Unweighted
Mean Weighted
Mean Unweighted
Std Deviation Weighted
Std Deviation N Valid Skip
0.00 175.15 1.45 ‐‐ 4.45 ‐‐ 22,895 0
Variable REPW51
Label Replicate Weight 51
Question Number Weighting Variable
Question Wording Replicate Weight 51
Minimum Maximum Unweighted
Mean Weighted
Mean Unweighted
Std Deviation Weighted
Std Deviation N Valid Skip
0.00 154.92 1.41 ‐‐ 3.81 ‐‐ 22,895 0
C-14 PSS: Public-Use Data File User’s Manual for School Year 2017–18

2017‐18 Private School Survey (PSS) Codebook ‐ Public‐Use Data File
Variable REPW52
Label Replicate Weight 52
Question Number Weighting Variable
Question Wording Replicate Weight 52
Minimum Maximum Unweighted
Mean Weighted
Mean Unweighted
Std Deviation Weighted
Std Deviation N Valid Skip
0.00 144.05 1.39 ‐‐ 3.68 ‐‐ 22,895 0
Variable REPW53
Label Replicate Weight 53
Question Number Weighting Variable
Question Wording Replicate Weight 53
Minimum Maximum Unweighted
Mean Weighted
Mean Unweighted
Std Deviation Weighted
Std Deviation N Valid Skip
0.00 154.92 1.43 ‐‐ 4.17 ‐‐ 22,895 0
Variable REPW54
Label Replicate Weight 54
Question Number Weighting Variable
Question Wording Replicate Weight 54
Minimum Maximum Unweighted
Mean Weighted
Mean Unweighted
Std Deviation Weighted
Std Deviation N Valid Skip
0.00 175.15 1.48 ‐‐ 4.7 ‐‐ 22,895 0
Variable REPW55
Label Replicate Weight 55
Question Number Weighting Variable
Question Wording Replicate Weight 55
Minimum Maximum Unweighted
Mean Weighted
Mean Unweighted
Std Deviation Weighted
Std Deviation N Valid Skip
0.00 175.15 1.41 ‐‐ 3.77 ‐‐ 22,895 0
Appendix C. 2017–18 Private School Universe Survey Public-Use Codebook C-15

2017‐18 Private School Survey (PSS) Codebook ‐ Public‐Use Data File
Variable REPW56
Label Replicate Weight 56
Question Number Weighting Variable
Question Wording Replicate Weight 56
Minimum Maximum Unweighted
Mean Weighted
Mean Unweighted
Std Deviation Weighted
Std Deviation N Valid Skip
0.00 154.92 1.40 ‐‐ 3.87 ‐‐ 22,895 0
Variable REPW57
Label Replicate Weight 57
Question Number Weighting Variable
Question Wording Replicate Weight 57
Minimum Maximum Unweighted
Mean Weighted
Mean Unweighted
Std Deviation Weighted
Std Deviation N Valid Skip
0.00 175.15 1.41 ‐‐ 3.97 ‐‐ 22,895 0
Variable REPW58
Label Replicate Weight 58
Question Number Weighting Variable
Question Wording Replicate Weight 58
Minimum Maximum Unweighted
Mean Weighted
Mean Unweighted
Std Deviation Weighted
Std Deviation N Valid Skip
0.00 154.92 1.37 ‐‐ 3.53 ‐‐ 22,895 0
Variable REPW59
Label Replicate Weight 59
Question Number Weighting Variable
Question Wording Replicate Weight 59
Minimum Maximum Unweighted
Mean Weighted
Mean Unweighted
Std Deviation Weighted
Std Deviation N Valid Skip
0.00 175.15 1.48 ‐‐ 4.5 ‐‐ 22,895 0
C-16 PSS: Public-Use Data File User’s Manual for School Year 2017–18

2017‐18 Private School Survey (PSS) Codebook ‐ Public‐Use Data File
Variable REPW60
Label Replicate Weight 60
Question Number Weighting Variable
Question Wording Replicate Weight 60
Minimum Maximum Unweighted
Mean Weighted
Mean Unweighted
Std Deviation Weighted
Std Deviation N Valid Skip
0.00 175.15 1.42 ‐‐ 4.09 ‐‐ 22,895 0
Variable REPW61
Label Replicate Weight 61
Question Number Weighting Variable
Question Wording Replicate Weight 61
Minimum Maximum Unweighted
Mean Weighted
Mean Unweighted
Std Deviation Weighted
Std Deviation N Valid Skip
0.00 170.20 1.41 ‐‐ 3.93 ‐‐ 22,895 0
Variable REPW62
Label Replicate Weight 62
Question Number Weighting Variable
Question Wording Replicate Weight 62
Minimum Maximum Unweighted
Mean Weighted
Mean Unweighted
Std Deviation Weighted
Std Deviation N Valid Skip
0.00 175.15 1.44 ‐‐ 4.46 ‐‐ 22,895 0
Variable REPW63
Label Replicate Weight 63
Question Number Weighting Variable
Question Wording Replicate Weight 63
Minimum Maximum Unweighted
Mean Weighted
Mean Unweighted
Std Deviation Weighted
Std Deviation N Valid Skip
0.00 175.15 1.42 ‐‐ 3.93 ‐‐ 22,895 0
Appendix C. 2017–18 Private School Universe Survey Public-Use Codebook C-17

2017‐18 Private School Survey (PSS) Codebook ‐ Public‐Use Data File
Variable REPW64
Label Replicate Weight 64
Question Number Weighting Variable
Question Wording Replicate Weight 64
Minimum Maximum Unweighted
Mean Weighted
Mean Unweighted
Std Deviation Weighted
Std Deviation N Valid Skip
0.00 170.20 1.41 ‐‐ 3.64 ‐‐ 22,895 0
Variable REPW65
Label Replicate Weight 65
Question Number Weighting Variable
Question Wording Replicate Weight 65
Minimum Maximum Unweighted
Mean Weighted
Mean Unweighted
Std Deviation Weighted
Std Deviation N Valid Skip
0.00 139.39 1.43 ‐‐ 3.93 ‐‐ 22,895 0
Variable REPW66
Label Replicate Weight 66
Question Number Weighting Variable
Question Wording Replicate Weight 66
Minimum Maximum Unweighted
Mean Weighted
Mean Unweighted
Std Deviation Weighted
Std Deviation N Valid Skip
0.00 175.15 1.44 ‐‐ 4.17 ‐‐ 22,895 0
Variable REPW67
Label Replicate Weight 67
Question Number Weighting Variable
Question Wording Replicate Weight 67
Minimum Maximum Unweighted
Mean Weighted
Mean Unweighted
Std Deviation Weighted
Std Deviation N Valid Skip
0.00 154.92 1.43 ‐‐ 3.72 ‐‐ 22,895 0
C-18 PSS: Public-Use Data File User’s Manual for School Year 2017–18

2017‐18 Private School Survey (PSS) Codebook ‐ Public‐Use Data File
Variable REPW68
Label Replicate Weight 68
Question Number Weighting Variable
Question Wording Replicate Weight 68
Minimum Maximum Unweighted
Mean Weighted
Mean Unweighted
Std Deviation Weighted
Std Deviation N Valid Skip
0.00 175.15 1.46 ‐‐ 4.55 ‐‐ 22,895 0
Variable REPW69
Label Replicate Weight 69
Question Number Weighting Variable
Question Wording Replicate Weight 69
Minimum Maximum Unweighted
Mean Weighted
Mean Unweighted
Std Deviation Weighted
Std Deviation N Valid Skip
0.00 170.20 1.43 ‐‐ 3.88 ‐‐ 22,895 0
Variable REPW70
Label Replicate Weight 70
Question Number Weighting Variable
Question Wording Replicate Weight 70
Minimum Maximum Unweighted
Mean Weighted
Mean Unweighted
Std Deviation Weighted
Std Deviation N Valid Skip
0.00 170.20 1.41 ‐‐ 3.91 ‐‐ 22,895 0
Variable REPW71
Label Replicate Weight 71
Question Number Weighting Variable
Question Wording Replicate Weight 71
Minimum Maximum Unweighted
Mean Weighted
Mean Unweighted
Std Deviation Weighted
Std Deviation N Valid Skip
0.00 175.15 1.42 ‐‐ 4.31 ‐‐ 22,895 0
Appendix C. 2017–18 Private School Universe Survey Public-Use Codebook C-19
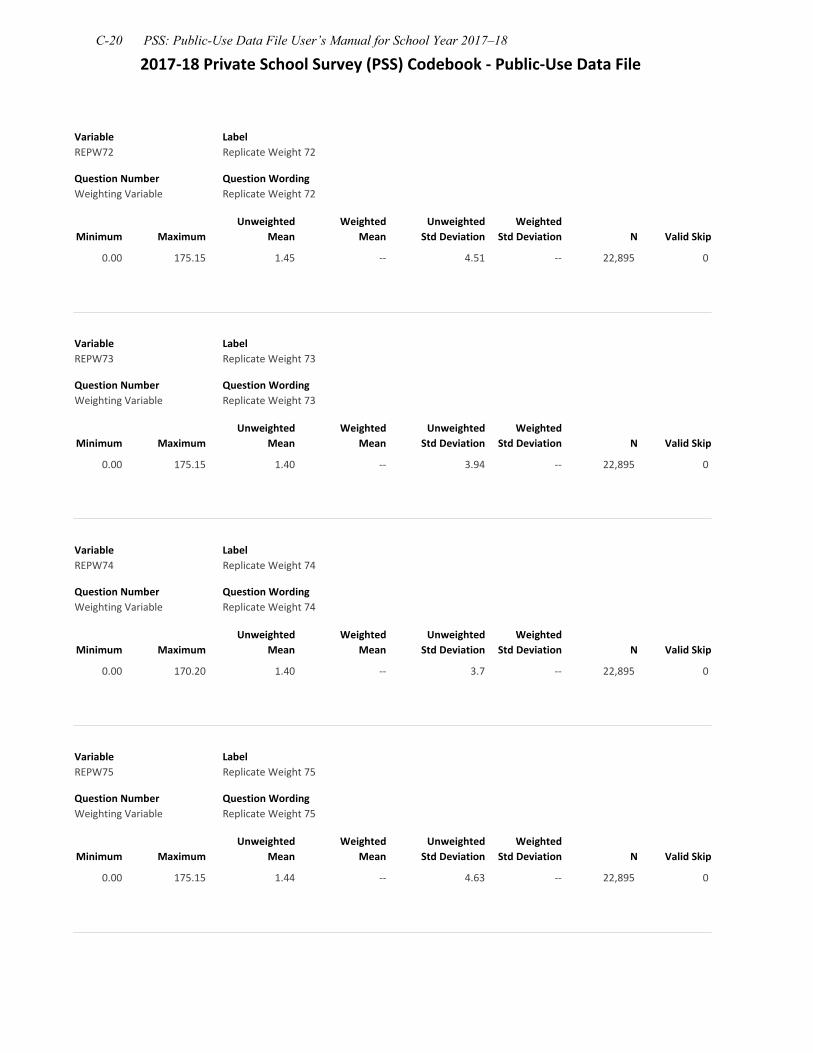
2017‐18 Private School Survey (PSS) Codebook ‐ Public‐Use Data File
Variable REPW72
Label Replicate Weight 72
Question Number Weighting Variable
Question Wording Replicate Weight 72
Minimum Maximum Unweighted
Mean Weighted
Mean Unweighted
Std Deviation Weighted
Std Deviation N Valid Skip
0.00 175.15 1.45 ‐‐ 4.51 ‐‐ 22,895 0
Variable REPW73
Label Replicate Weight 73
Question Number Weighting Variable
Question Wording Replicate Weight 73
Minimum Maximum Unweighted
Mean Weighted
Mean Unweighted
Std Deviation Weighted
Std Deviation N Valid Skip
0.00 175.15 1.40 ‐‐ 3.94 ‐‐ 22,895 0
Variable REPW74
Label Replicate Weight 74
Question Number Weighting Variable
Question Wording Replicate Weight 74
Minimum Maximum Unweighted
Mean Weighted
Mean Unweighted
Std Deviation Weighted
Std Deviation N Valid Skip
0.00 170.20 1.40 ‐‐ 3.7 ‐‐ 22,895 0
Variable REPW75
Label Replicate Weight 75
Question Number Weighting Variable
Question Wording Replicate Weight 75
Minimum Maximum Unweighted
Mean Weighted
Mean Unweighted
Std Deviation Weighted
Std Deviation N Valid Skip
0.00 175.15 1.44 ‐‐ 4.63 ‐‐ 22,895 0
C-20 PSS: Public-Use Data File User’s Manual for School Year 2017–18
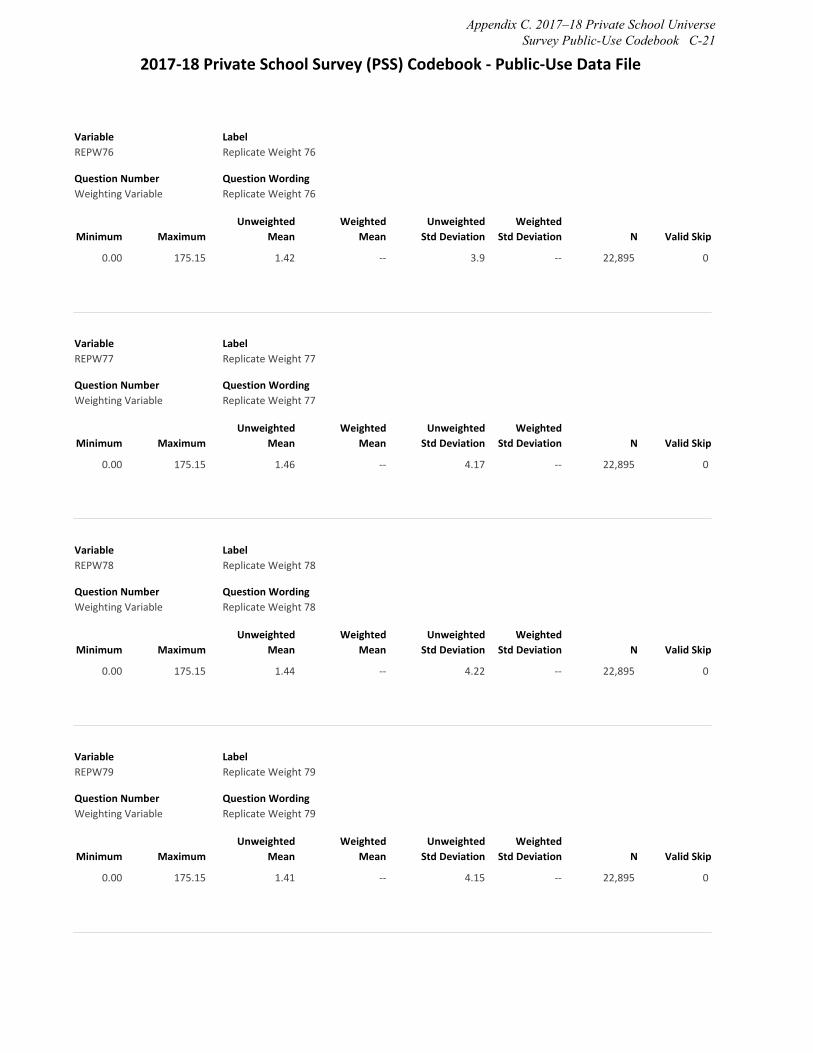
2017‐18 Private School Survey (PSS) Codebook ‐ Public‐Use Data File
Variable REPW76
Label Replicate Weight 76
Question Number Weighting Variable
Question Wording Replicate Weight 76
Minimum Maximum Unweighted
Mean Weighted
Mean Unweighted
Std Deviation Weighted
Std Deviation N Valid Skip
0.00 175.15 1.42 ‐‐ 3.9 ‐‐ 22,895 0
Variable REPW77
Label Replicate Weight 77
Question Number Weighting Variable
Question Wording Replicate Weight 77
Minimum Maximum Unweighted
Mean Weighted
Mean Unweighted
Std Deviation Weighted
Std Deviation N Valid Skip
0.00 175.15 1.46 ‐‐ 4.17 ‐‐ 22,895 0
Variable REPW78
Label Replicate Weight 78
Question Number Weighting Variable
Question Wording Replicate Weight 78
Minimum Maximum Unweighted
Mean Weighted
Mean Unweighted
Std Deviation Weighted
Std Deviation N Valid Skip
0.00 175.15 1.44 ‐‐ 4.22 ‐‐ 22,895 0
Variable REPW79
Label Replicate Weight 79
Question Number Weighting Variable
Question Wording Replicate Weight 79
Minimum Maximum Unweighted
Mean Weighted
Mean Unweighted
Std Deviation Weighted
Std Deviation N Valid Skip
0.00 175.15 1.41 ‐‐ 4.15 ‐‐ 22,895 0
Appendix C. 2017–18 Private School Universe Survey Public-Use Codebook C-21

2017‐18 Private School Survey (PSS) Codebook ‐ Public‐Use Data File
Variable REPW80
Label Replicate Weight 80
Question Number Weighting Variable
Question Wording Replicate Weight 80
Minimum Maximum Unweighted
Mean Weighted
Mean Unweighted
Std Deviation Weighted
Std Deviation N Valid Skip
0.00 135.88 1.40 ‐‐ 3.68 ‐‐ 22,895 0
Variable REPW81
Label Replicate Weight 81
Question Number Weighting Variable
Question Wording Replicate Weight 81
Minimum Maximum Unweighted
Mean Weighted
Mean Unweighted
Std Deviation Weighted
Std Deviation N Valid Skip
0.00 170.20 1.39 ‐‐ 3.8 ‐‐ 22,895 0
Variable REPW82
Label Replicate Weight 82
Question Number Weighting Variable
Question Wording Replicate Weight 82
Minimum Maximum Unweighted
Mean Weighted
Mean Unweighted
Std Deviation Weighted
Std Deviation N Valid Skip
0.00 154.92 1.40 ‐‐ 3.99 ‐‐ 22,895 0
Variable REPW83
Label Replicate Weight 83
Question Number Weighting Variable
Question Wording Replicate Weight 83
Minimum Maximum Unweighted
Mean Weighted
Mean Unweighted
Std Deviation Weighted
Std Deviation N Valid Skip
0.00 175.15 1.42 ‐‐ 4.2 ‐‐ 22,895 0
C-22 PSS: Public-Use Data File User’s Manual for School Year 2017–18

2017‐18 Private School Survey (PSS) Codebook ‐ Public‐Use Data File
Variable REPW84
Label Replicate Weight 84
Question Number Weighting Variable
Question Wording Replicate Weight 84
Minimum Maximum Unweighted
Mean Weighted
Mean Unweighted
Std Deviation Weighted
Std Deviation N Valid Skip
0.00 170.20 1.44 ‐‐ 3.88 ‐‐ 22,895 0
Variable REPW85
Label Replicate Weight 85
Question Number Weighting Variable
Question Wording Replicate Weight 85
Minimum Maximum Unweighted
Mean Weighted
Mean Unweighted
Std Deviation Weighted
Std Deviation N Valid Skip
0.00 175.15 1.42 ‐‐ 4.16 ‐‐ 22,895 0
Variable REPW86
Label Replicate Weight 86
Question Number Weighting Variable
Question Wording Replicate Weight 86
Minimum Maximum Unweighted
Mean Weighted
Mean Unweighted
Std Deviation Weighted
Std Deviation N Valid Skip
0.00 175.15 1.43 ‐‐ 4.24 ‐‐ 22,895 0
Variable REPW87
Label Replicate Weight 87
Question Number Weighting Variable
Question Wording Replicate Weight 87
Minimum Maximum Unweighted
Mean Weighted
Mean Unweighted
Std Deviation Weighted
Std Deviation N Valid Skip
0.00 175.15 1.40 ‐‐ 4.15 ‐‐ 22,895 0
Appendix C. 2017–18 Private School Universe Survey Public-Use Codebook C-23
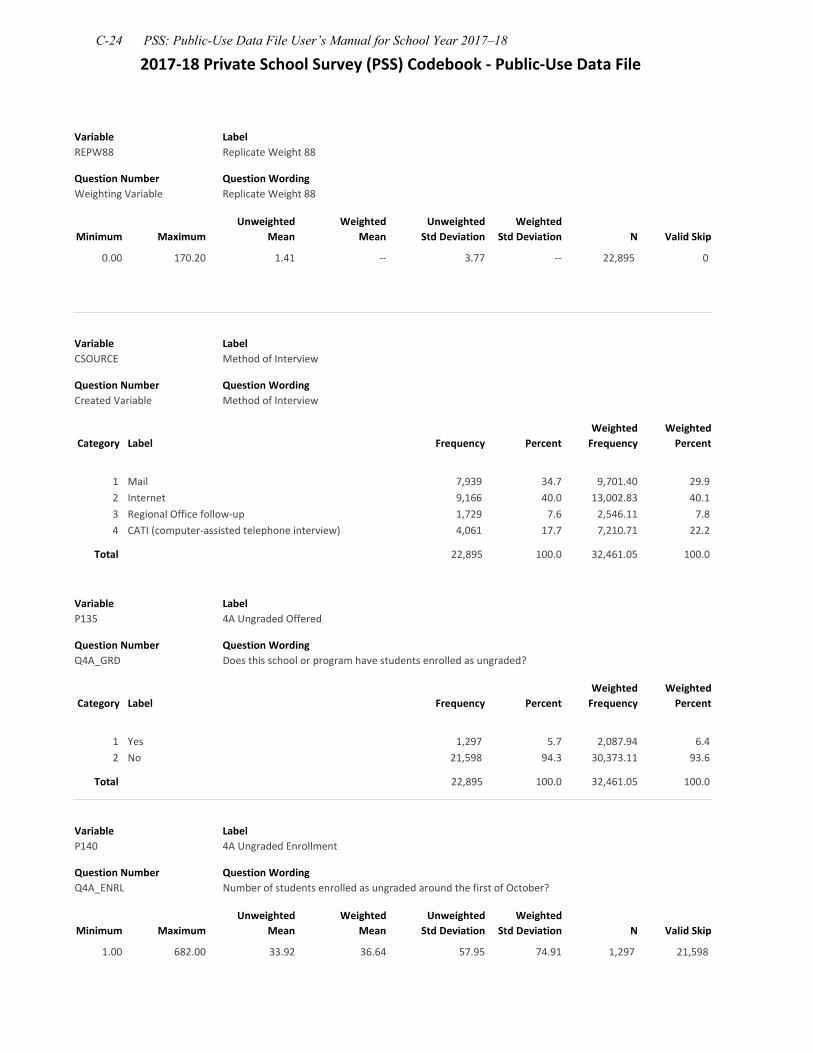
2017‐18 Private School Survey (PSS) Codebook ‐ Public‐Use Data File
Variable REPW88
Label Replicate Weight 88
Question Number Weighting Variable
Question Wording Replicate Weight 88
Minimum Maximum Unweighted
Mean Weighted
Mean Unweighted
Std Deviation Weighted
Std Deviation N Valid Skip
0.00 170.20 1.41 ‐‐ 3.77 ‐‐ 22,895 0
Variable CSOURCE
Label Method of Interview
Question Number Created Variable
Question Wording Method of Interview
Category Label Frequency Percent Weighted Frequency
Weighted Percent
1 Mail 7,939 34.7 9,701.40 29.9 2 Internet 9,166 40.0 13,002.83 40.1 3 Regional Office follow‐up 1,729 7.6 2,546.11 7.8 4 CATI (computer‐assisted telephone interview) 4,061 17.7 7,210.71 22.2
Total 22,895 100.0 32,461.05 100.0
Variable P135
Label 4A Ungraded Offered
Question Number Q4A_GRD
Question Wording Does this school or program have students enrolled as ungraded?
Category Label Frequency Percent Weighted Frequency
Weighted Percent
1 Yes 1,297 5.7 2,087.94 6.4 2 No 21,598 94.3 30,373.11 93.6
Total 22,895 100.0 32,461.05 100.0
Variable P140
Label 4A Ungraded Enrollment
Question Number Q4A_ENRL
Question Wording Number of students enrolled as ungraded around the first of October?
Minimum Maximum Unweighted
Mean Weighted
Mean Unweighted
Std Deviation Weighted
Std Deviation N Valid Skip
1.00 682.00 33.92 36.64 57.95 74.91 1,297 21,598
C-24 PSS: Public-Use Data File User’s Manual for School Year 2017–18
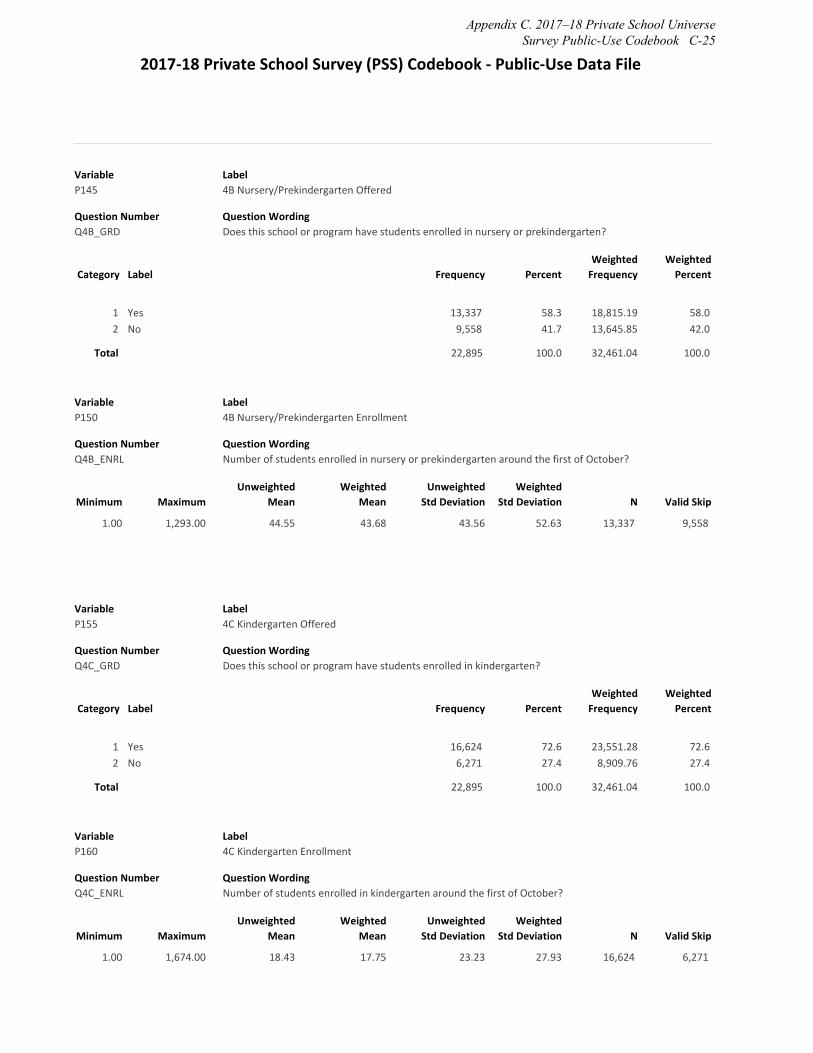
2017‐18 Private School Survey (PSS) Codebook ‐ Public‐Use Data File
Variable P145
Label 4B Nursery/Prekindergarten Offered
Question Number Q4B_GRD
Question Wording Does this school or program have students enrolled in nursery or prekindergarten?
Category Label Frequency Percent Weighted Frequency
Weighted Percent
1 Yes 13,337 58.3 18,815.19 58.0 2 No 9,558 41.7 13,645.85 42.0
Total 22,895 100.0 32,461.04 100.0
Variable P150
Label 4B Nursery/Prekindergarten Enrollment
Question Number Q4B_ENRL
Question Wording Number of students enrolled in nursery or prekindergarten around the first of October?
Minimum Maximum Unweighted
Mean Weighted
Mean Unweighted
Std Deviation Weighted
Std Deviation N Valid Skip
1.00 1,293.00 44.55 43.68 43.56 52.63 13,337 9,558
Variable P155
Label 4C Kindergarten Offered
Question Number Q4C_GRD
Question Wording Does this school or program have students enrolled in kindergarten?
Category Label Frequency Percent Weighted Frequency
Weighted Percent
1 Yes 16,624 72.6 23,551.28 72.6 2 No 6,271 27.4 8,909.76 27.4
Total 22,895 100.0 32,461.04 100.0
Variable P160
Label 4C Kindergarten Enrollment
Question Number Q4C_ENRL
Question Wording Number of students enrolled in kindergarten around the first of October?
Minimum Maximum Unweighted
Mean Weighted
Mean Unweighted
Std Deviation Weighted
Std Deviation N Valid Skip
1.00 1,674.00 18.43 17.75 23.23 27.93 16,624 6,271
Appendix C. 2017–18 Private School Universe Survey Public-Use Codebook C-25
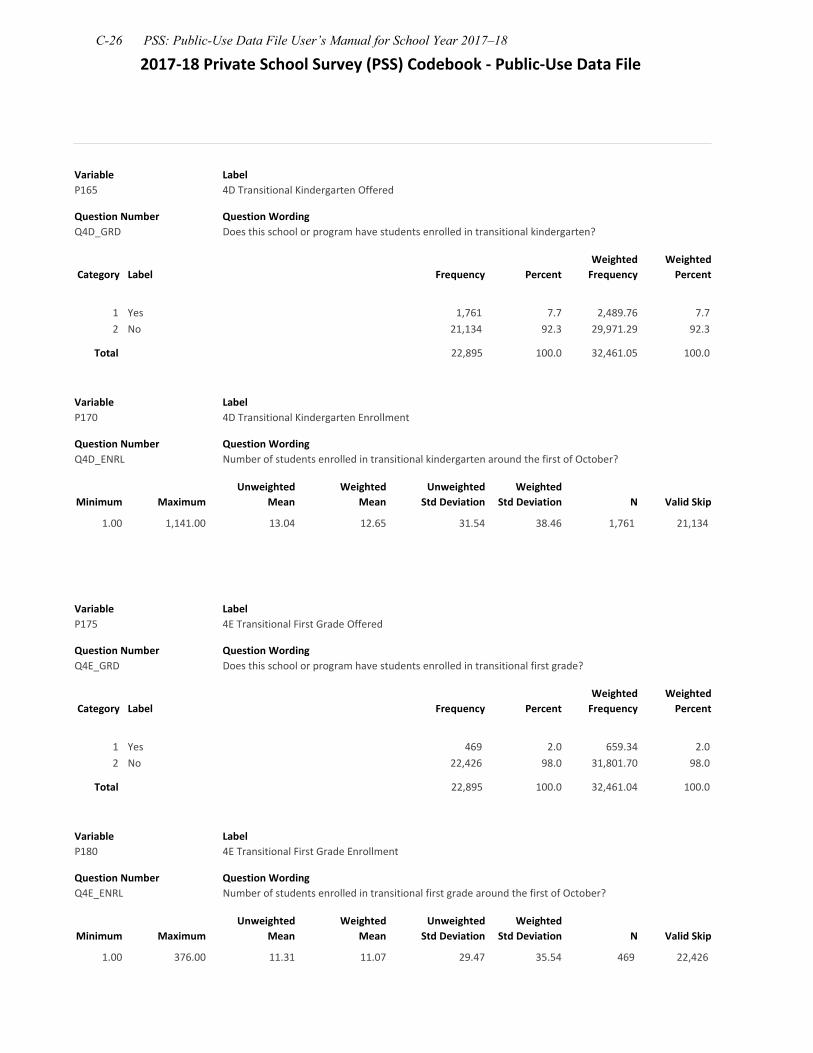
2017‐18 Private School Survey (PSS) Codebook ‐ Public‐Use Data File
Variable P165
Label 4D Transitional Kindergarten Offered
Question Number Q4D_GRD
Question Wording Does this school or program have students enrolled in transitional kindergarten?
Category Label Frequency Percent Weighted Frequency
Weighted Percent
1 Yes 1,761 7.7 2,489.76 7.7 2 No 21,134 92.3 29,971.29 92.3
Total 22,895 100.0 32,461.05 100.0
Variable P170
Label 4D Transitional Kindergarten Enrollment
Question Number Q4D_ENRL
Question Wording Number of students enrolled in transitional kindergarten around the first of October?
Minimum Maximum Unweighted
Mean Weighted
Mean Unweighted
Std Deviation Weighted
Std Deviation N Valid Skip
1.00 1,141.00 13.04 12.65 31.54 38.46 1,761 21,134
Variable P175
Label 4E Transitional First Grade Offered
Question Number Q4E_GRD
Question Wording Does this school or program have students enrolled in transitional first grade?
Category Label Frequency Percent Weighted Frequency
Weighted Percent
1 Yes 469 2.0 659.34 2.0 2 No 22,426 98.0 31,801.70 98.0
Total 22,895 100.0 32,461.04 100.0
Variable P180
Label 4E Transitional First Grade Enrollment
Question Number Q4E_ENRL
Question Wording Number of students enrolled in transitional first grade around the first of October?
Minimum Maximum Unweighted
Mean Weighted
Mean Unweighted
Std Deviation Weighted
Std Deviation N Valid Skip
1.00 376.00 11.31 11.07 29.47 35.54 469 22,426
C-26 PSS: Public-Use Data File User’s Manual for School Year 2017–18

2017‐18 Private School Survey (PSS) Codebook ‐ Public‐Use Data File
Variable P185
Label 4F First Grade Offered
Question Number Q4F_GRD
Question Wording Does this school or program have students enrolled in first grade?
Category Label Frequency Percent Weighted Frequency
Weighted Percent
1 Yes 15,745 68.8 21,607.19 66.6 2 No 7,150 31.2 10,853.85 33.4
Total 22,895 100.0 32,461.04 100.0
Variable P190
Label 4F First Grade Enrollment
Question Number Q4F_ENRL
Question Wording Number of students enrolled in first grade around the first of October?
Minimum Maximum Unweighted
Mean Weighted
Mean Unweighted
Std Deviation Weighted
Std Deviation N Valid Skip
1.00 512.00 17.12 16.71 18.94 22.23 15,745 7,150
Variable P195
Label 4G Second Grade Offered
Question Number Q4G_GRD
Question Wording Does this school or program have students enrolled in second grade?
Category Label Frequency Percent Weighted Frequency
Weighted Percent
1 Yes 15,726 68.7 21,608.33 66.6 2 No 7,169 31.3 10,852.72 33.4
Total 22,895 100.0 32,461.05 100.0
Variable P200
Label 4G Second Grade Enrollment
Question Number Q4G_ENRL
Question Wording Number of students enrolled in second grade around the first of October?
Minimum Maximum Unweighted
Mean Weighted
Mean Unweighted
Std Deviation Weighted
Std Deviation N Valid Skip
1.00 510.00 16.77 16.3 18.83 22.03 15,726 7,169
Appendix C. 2017–18 Private School Universe Survey Public-Use Codebook C-27
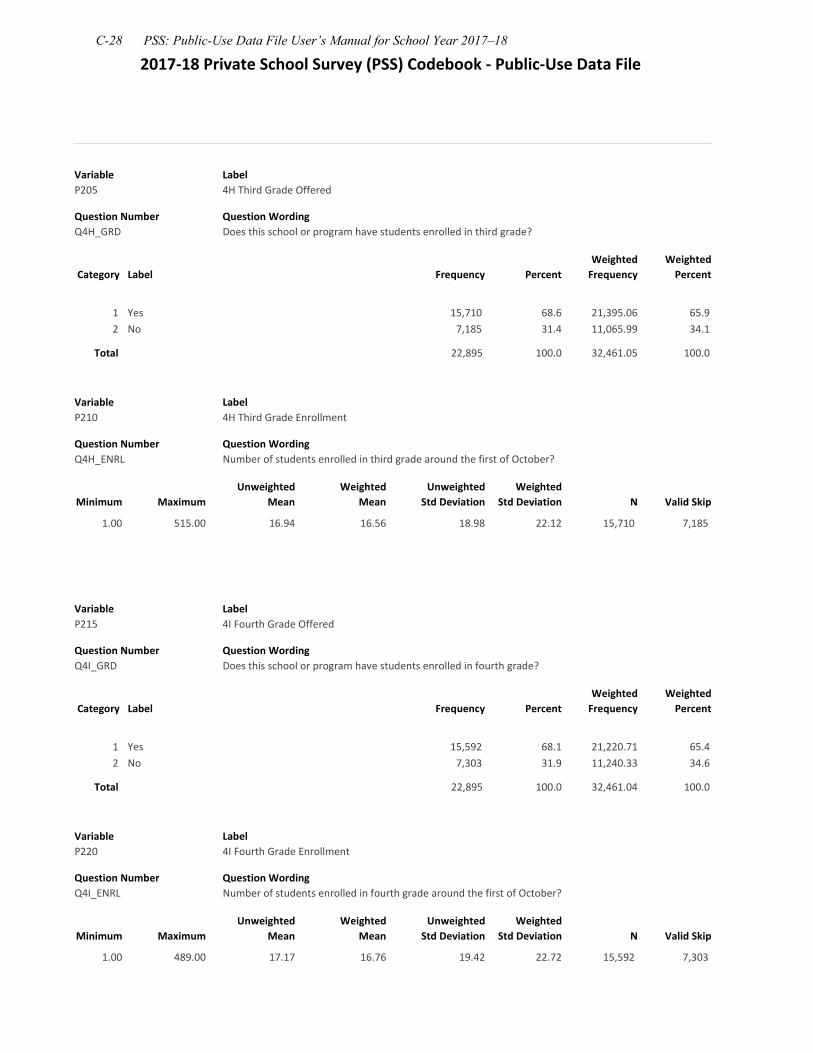
2017‐18 Private School Survey (PSS) Codebook ‐ Public‐Use Data File
Variable P205
Label 4H Third Grade Offered
Question Number Q4H_GRD
Question Wording Does this school or program have students enrolled in third grade?
Category Label Frequency Percent Weighted Frequency
Weighted Percent
1 Yes 15,710 68.6 21,395.06 65.9 2 No 7,185 31.4 11,065.99 34.1
Total 22,895 100.0 32,461.05 100.0
Variable P210
Label 4H Third Grade Enrollment
Question Number Q4H_ENRL
Question Wording Number of students enrolled in third grade around the first of October?
Minimum Maximum Unweighted
Mean Weighted
Mean Unweighted
Std Deviation Weighted
Std Deviation N Valid Skip
1.00 515.00 16.94 16.56 18.98 22.12 15,710 7,185
Variable P215
Label 4I Fourth Grade Offered
Question Number Q4I_GRD
Question Wording Does this school or program have students enrolled in fourth grade?
Category Label Frequency Percent Weighted Frequency
Weighted Percent
1 Yes 15,592 68.1 21,220.71 65.4 2 No 7,303 31.9 11,240.33 34.6
Total 22,895 100.0 32,461.04 100.0
Variable P220
Label 4I Fourth Grade Enrollment
Question Number Q4I_ENRL
Question Wording Number of students enrolled in fourth grade around the first of October?
Minimum Maximum Unweighted
Mean Weighted
Mean Unweighted
Std Deviation Weighted
Std Deviation N Valid Skip
1.00 489.00 17.17 16.76 19.42 22.72 15,592 7,303
C-28 PSS: Public-Use Data File User’s Manual for School Year 2017–18
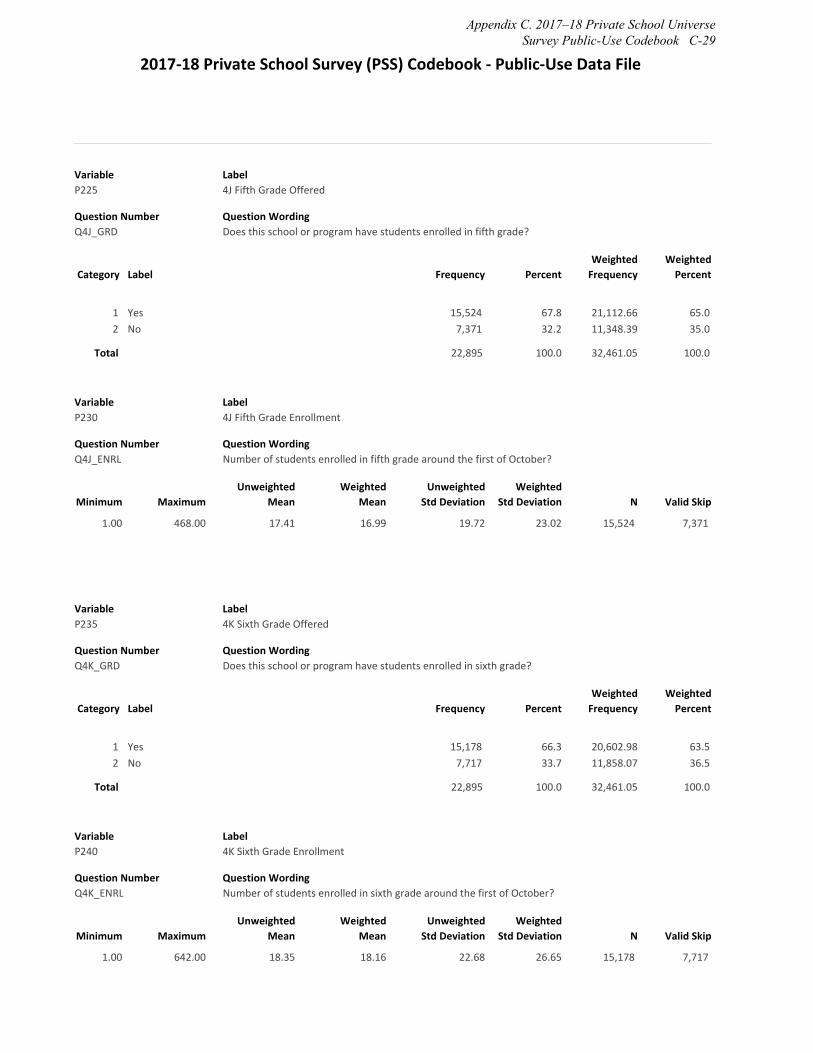
2017‐18 Private School Survey (PSS) Codebook ‐ Public‐Use Data File
Variable P225
Label 4J Fifth Grade Offered
Question Number Q4J_GRD
Question Wording Does this school or program have students enrolled in fifth grade?
Category Label Frequency Percent Weighted Frequency
Weighted Percent
1 Yes 15,524 67.8 21,112.66 65.0 2 No 7,371 32.2 11,348.39 35.0
Total 22,895 100.0 32,461.05 100.0
Variable P230
Label 4J Fifth Grade Enrollment
Question Number Q4J_ENRL
Question Wording Number of students enrolled in fifth grade around the first of October?
Minimum Maximum Unweighted
Mean Weighted
Mean Unweighted
Std Deviation Weighted
Std Deviation N Valid Skip
1.00 468.00 17.41 16.99 19.72 23.02 15,524 7,371
Variable P235
Label 4K Sixth Grade Offered
Question Number Q4K_GRD
Question Wording Does this school or program have students enrolled in sixth grade?
Category Label Frequency Percent Weighted Frequency
Weighted Percent
1 Yes 15,178 66.3 20,602.98 63.5 2 No 7,717 33.7 11,858.07 36.5
Total 22,895 100.0 32,461.05 100.0
Variable P240
Label 4K Sixth Grade Enrollment
Question Number Q4K_ENRL
Question Wording Number of students enrolled in sixth grade around the first of October?
Minimum Maximum Unweighted
Mean Weighted
Mean Unweighted
Std Deviation Weighted
Std Deviation N Valid Skip
1.00 642.00 18.35 18.16 22.68 26.65 15,178 7,717
Appendix C. 2017–18 Private School Universe Survey Public-Use Codebook C-29

2017‐18 Private School Survey (PSS) Codebook ‐ Public‐Use Data File
Variable P245
Label 4L Seventh Grade Offered
Question Number Q4L_GRD
Question Wording Does this school or program have students enrolled in seventh grade?
Category Label Frequency Percent Weighted Frequency
Weighted Percent
1 Yes 14,447 63.1 19,922.08 61.4 2 No 8,448 36.9 12,538.97 38.6
Total 22,895 100.0 32,461.05 100.0
Variable P250
Label 4L Seventh Grade Enrollment
Question Number Q4L_ENRL
Question Wording Number of students enrolled in seventh grade around the first of October?
Minimum Maximum Unweighted
Mean Weighted
Mean Unweighted
Std Deviation Weighted
Std Deviation N Valid Skip
1.00 757.00 19.07 18.62 24.99 29.46 14,447 8,448
Variable P255
Label 4M Eighth Grade Offered
Question Number Q4M_GRD
Question Wording Does this school or program have students enrolled in eighth grade?
Category Label Frequency Percent Weighted Frequency
Weighted Percent
1 Yes 14,385 62.8 19,864.32 61.2 2 No 8,510 37.2 12,596.72 38.8
Total 22,895 100.0 32,461.04 100.0
Variable P260
Label 4M Eighth Grade Enrollment
Question Number Question Wording Q4M_ENRL Number of students enrolled in eighth grade around the first of October?
Minimum Maximum Unweighted
Mean Weighted
Mean Unweighted
Std Deviation Weighted
Std Deviation N Valid Skip
1.00 782.00 19.32 18.84 26.01 30.56 14,385 8,510
C-30 PSS: Public-Use Data File User’s Manual for School Year 2017–18

2017‐18 Private School Survey (PSS) Codebook ‐ Public‐Use Data File
Variable P265
Label 4N Ninth Grade Offered
Question Number Q4N_GRD
Question Wording Does this school or program have students enrolled in ninth grade?
Category Label Frequency Percent Weighted Frequency
Weighted Percent
1 Yes 7,669 33.5 10,936.47 33.7 2 No 15,226 66.5 21,524.57 66.3
Total 22,895 100.0 32,461.04 100.0
Variable P270
Label 4N Ninth Grade Enrollment
Question Number Q4N_ENRL
Question Wording Number of students enrolled in ninth grade around the first of October?
Minimum Maximum Unweighted
Mean Weighted
Mean Unweighted
Std Deviation Weighted
Std Deviation N Valid Skip
1.00 2,569.00 36.45 34.19 65.73 75.44 7,669 15,226
Variable P275
Label 4O Tenth Grade Offered
Question Number Q4O_GRD
Question Wording Does this school or program have students enrolled in tenth grade?
Category Label Frequency Percent Weighted Frequency
Weighted Percent
1 Yes 7,423 32.4 10,553.07 32.5 2 No 15,472 67.6 21,907.97 67.5
Total 22,895 100.0 32,461.04 100.0
Variable P280
Label 4O Tenth Grade Enrollment
Question Number Q4O_ENRL
Question Wording Number of students enrolled in tenth grade around the first of October?
Minimum Maximum Unweighted
Mean Weighted
Mean Unweighted
Std Deviation Weighted
Std Deviation N Valid Skip
1.00 1,240.00 37.09 34.68 60.52 70.09 7,423 15,472
Appendix C. 2017–18 Private School Universe Survey Public-Use Codebook C-31

2017‐18 Private School Survey (PSS) Codebook ‐ Public‐Use Data File
Variable P285
Label 4P Eleventh Grade Offered
Question Number Q4P_GRD
Question Wording Does this school or program have students enrolled in eleventh grade?
Category Label Frequency Percent Weighted Frequency
Weighted Percent
1 Yes 7,131 31.1 10,124.19 31.2 2 No 15,764 68.9 22,336.86 68.8
Total 22,895 100.0 32,461.05 100.0
Variable P290
Label 4P Eleventh Grade Enrollment
Question Number Q4P_ENRL
Question Wording Number of students enrolled in eleventh grade around the first of October?
Minimum Maximum Unweighted
Mean Weighted
Mean Unweighted
Std Deviation Weighted
Std Deviation N Valid Skip
1.00 1,271.00 38.39 36.01 61.54 71.32 7,131 15,764
Variable P295
Label 4Q Twelfth Grade Offered
Question Number Q4Q_GRD
Question Wording Does this school or program have students enrolled in twelfth grade?
Category Label Frequency Percent Weighted Frequency
Weighted Percent
1 Yes 7,049 30.8 10,080.97 31.1 2 No 15,846 69.2 22,380.07 68.9
Total 22,895 100.0 32,461.04 100.0
Variable P300
Label 4Q Twelfth Grade Enrollment
Question Number Q4Q_ENRL
Question Wording Number of students enrolled in twelfth grade around the first of October?
Minimum Maximum Unweighted
Mean Weighted
Mean Unweighted
Std Deviation Weighted
Std Deviation N Valid Skip
1.00 879.00 38.34 35.61 60.27 69.89 7,049 15,846
C-32 PSS: Public-Use Data File User’s Manual for School Year 2017–18
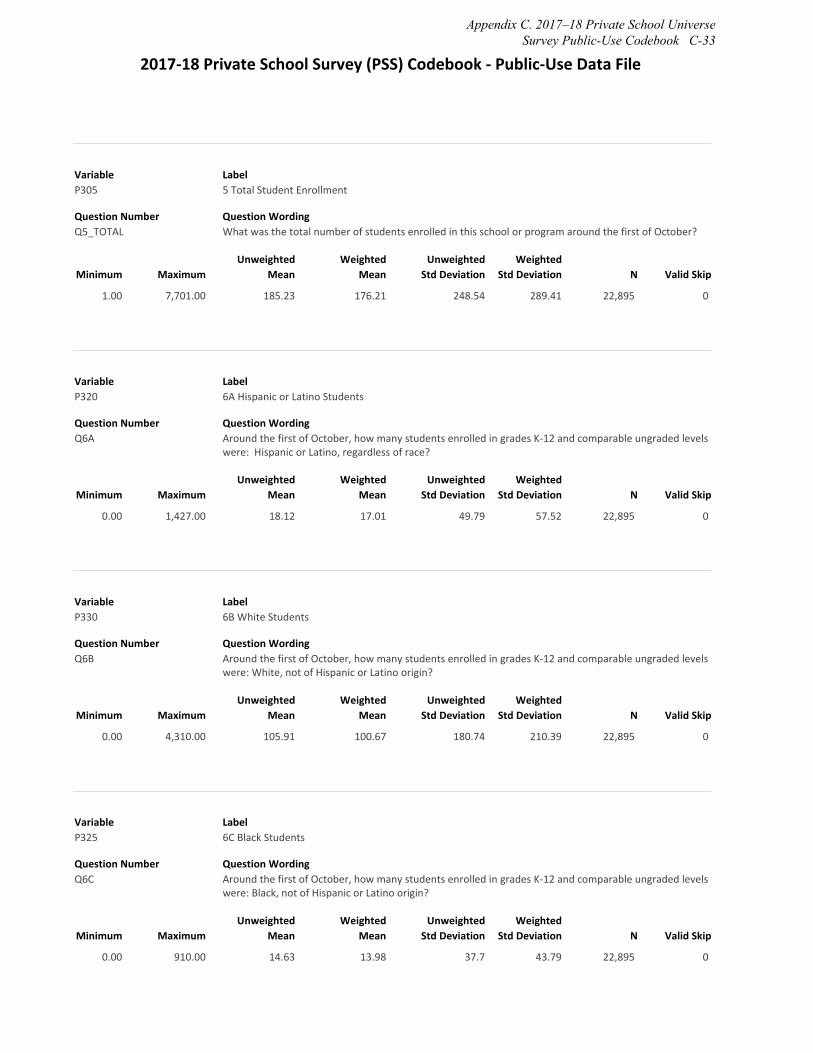
2017‐18 Private School Survey (PSS) Codebook ‐ Public‐Use Data File
Variable P305
Label 5 Total Student Enrollment
Question Number Q5_TOTAL
Question Wording What was the total number of students enrolled in this school or program around the first of October?
Minimum Maximum Unweighted
Mean Weighted
Mean Unweighted
Std Deviation Weighted
Std Deviation N Valid Skip
1.00 7,701.00 185.23 176.21 248.54 289.41 22,895 0
Variable P320
Label 6A Hispanic or Latino Students
Question Number Q6A
Question Wording Around the first of October, how many students enrolled in grades K‐12 and comparable ungraded levels were: Hispanic or Latino, regardless of race?
Minimum Maximum Unweighted
Mean Weighted
Mean Unweighted
Std Deviation Weighted
Std Deviation N Valid Skip
0.00 1,427.00 18.12 17.01 49.79 57.52 22,895 0
Variable P330
Label 6B White Students
Question Number Q6B
Question Wording Around the first of October, how many students enrolled in grades K‐12 and comparable ungraded levels were: White, not of Hispanic or Latino origin?
Minimum Maximum Unweighted
Mean Weighted
Mean Unweighted
Std Deviation Weighted
Std Deviation N Valid Skip
0.00 4,310.00 105.91 100.67 180.74 210.39 22,895 0
Variable P325
Label 6C Black Students
Question Number Q6C
Question Wording Around the first of October, how many students enrolled in grades K‐12 and comparable ungraded levels were: Black, not of Hispanic or Latino origin?
Minimum Maximum Unweighted
Mean Weighted
Mean Unweighted
Std Deviation Weighted
Std Deviation N Valid Skip
0.00 910.00 14.63 13.98 37.7 43.79 22,895 0
Appendix C. 2017–18 Private School Universe Survey Public-Use Codebook C-33
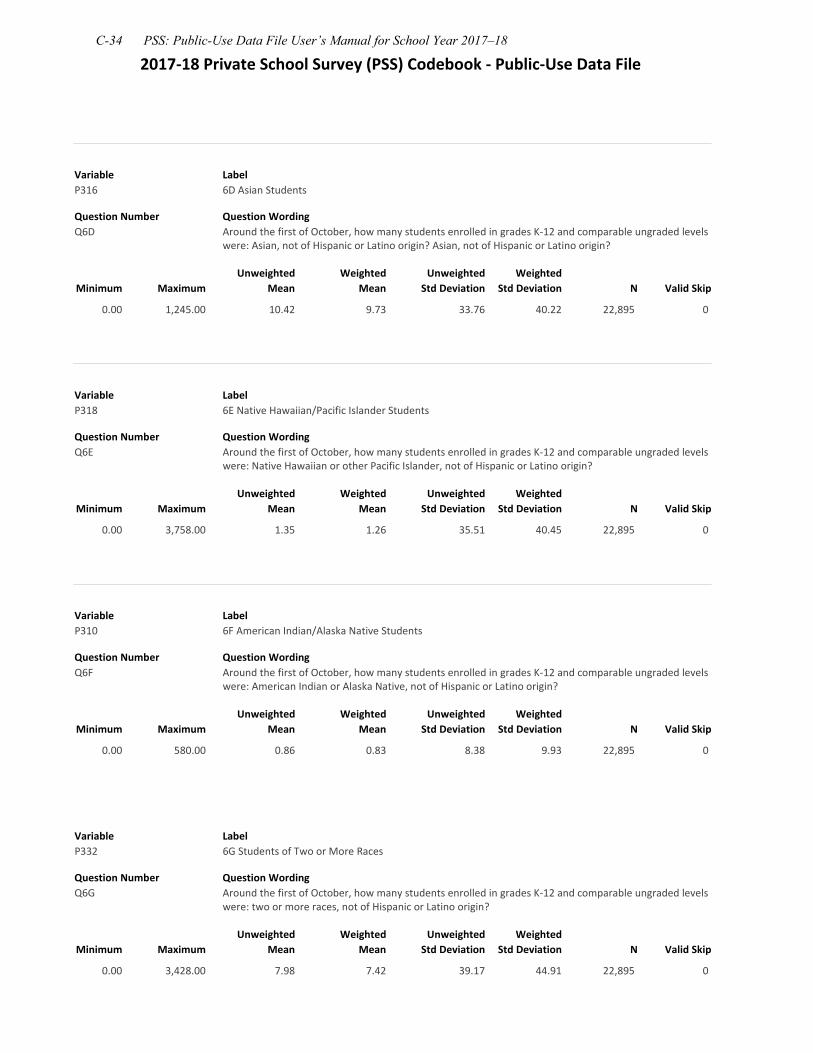
2017‐18 Private School Survey (PSS) Codebook ‐ Public‐Use Data File
Variable P316
Label 6D Asian Students
Question Number Q6D
Question Wording Around the first of October, how many students enrolled in grades K‐12 and comparable ungraded levels were: Asian, not of Hispanic or Latino origin? Asian, not of Hispanic or Latino origin?
Minimum Maximum Unweighted
Mean Weighted
Mean Unweighted
Std Deviation Weighted
Std Deviation N Valid Skip
0.00 1,245.00 10.42 9.73 33.76 40.22 22,895 0
Variable P318
Label 6E Native Hawaiian/Pacific Islander Students
Question Number Question Wording Q6E Around the first of October, how many students enrolled in grades K‐12 and comparable ungraded levels
were: Native Hawaiian or other Pacific Islander, not of Hispanic or Latino origin?
Minimum Maximum Unweighted
Mean Weighted
Mean Unweighted
Std Deviation Weighted
Std Deviation N Valid Skip
0.00 3,758.00 1.35 1.26 35.51 40.45 22,895 0
Variable P310
Label 6F American Indian/Alaska Native Students
Question Number Q6F
Question Wording Around the first of October, how many students enrolled in grades K‐12 and comparable ungraded levels were: American Indian or Alaska Native, not of Hispanic or Latino origin?
Minimum Maximum Unweighted
Mean Weighted
Mean Unweighted
Std Deviation Weighted
Std Deviation N Valid Skip
0.00 580.00 0.86 0.83 8.38 9.93 22,895 0
Variable P332
Label 6G Students of Two or More Races
Question Number Question Wording Q6G Around the first of October, how many students enrolled in grades K‐12 and comparable ungraded levels
were: two or more races, not of Hispanic or Latino origin?
Minimum Maximum Unweighted
Mean Weighted
Mean Unweighted
Std Deviation Weighted
Std Deviation N Valid Skip
0.00 3,428.00 7.98 7.42 39.17 44.91 22,895 0
C-34 PSS: Public-Use Data File User’s Manual for School Year 2017–18
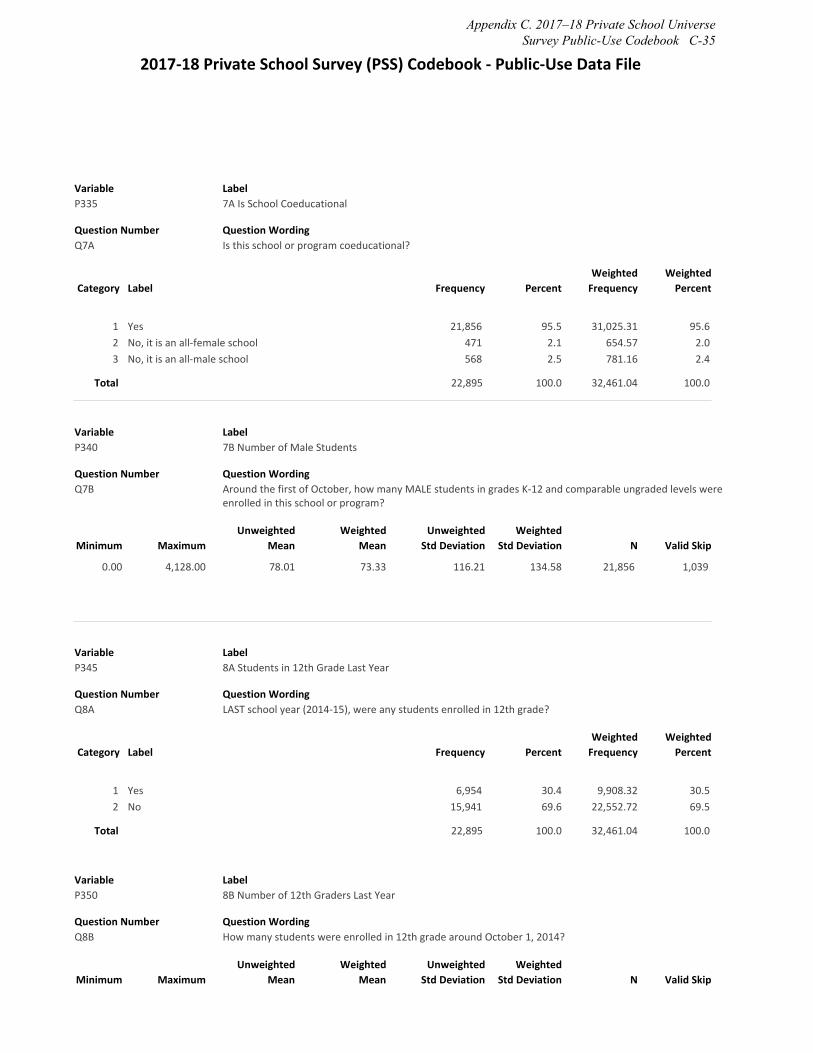
2017‐18 Private School Survey (PSS) Codebook ‐ Public‐Use Data File
Variable P335
Label 7A Is School Coeducational
Question Number Q7A
Question Wording Is this school or program coeducational?
Category Label Frequency Percent Weighted Frequency
Weighted Percent
1 Yes 21,856 95.5 31,025.31 95.6 2 No, it is an all‐female school 471 2.1 654.57 2.0 3 No, it is an all‐male school 568 2.5 781.16 2.4
Total 22,895 100.0 32,461.04 100.0
Variable P340
Label 7B Number of Male Students
Question Number Question Wording Q7B Around the first of October, how many MALE students in grades K‐12 and comparable ungraded levels were
enrolled in this school or program?
Minimum Maximum Unweighted
Mean Weighted
Mean Unweighted
Std Deviation Weighted
Std Deviation N Valid Skip
0.00 4,128.00 78.01 73.33 116.21 134.58 21,856 1,039
Variable P345
Label 8A Students in 12th Grade Last Year
Question Number Q8A
Question Wording LAST school year (2014‐15), were any students enrolled in 12th grade?
Category Label Frequency Percent Weighted Frequency
Weighted Percent
1 Yes 6,954 30.4 9,908.32 30.5 2 No 15,941 69.6 22,552.72 69.5
Total 22,895 100.0 32,461.04 100.0
Variable P350
Label 8B Number of 12th Graders Last Year
Question Number Q8B
Question Wording How many students were enrolled in 12th grade around October 1, 2014?
Minimum Maximum Unweighted
Mean Weighted
Mean Unweighted
Std Deviation Weighted
Std Deviation N Valid Skip
Appendix C. 2017–18 Private School Universe Survey Public-Use Codebook C-35
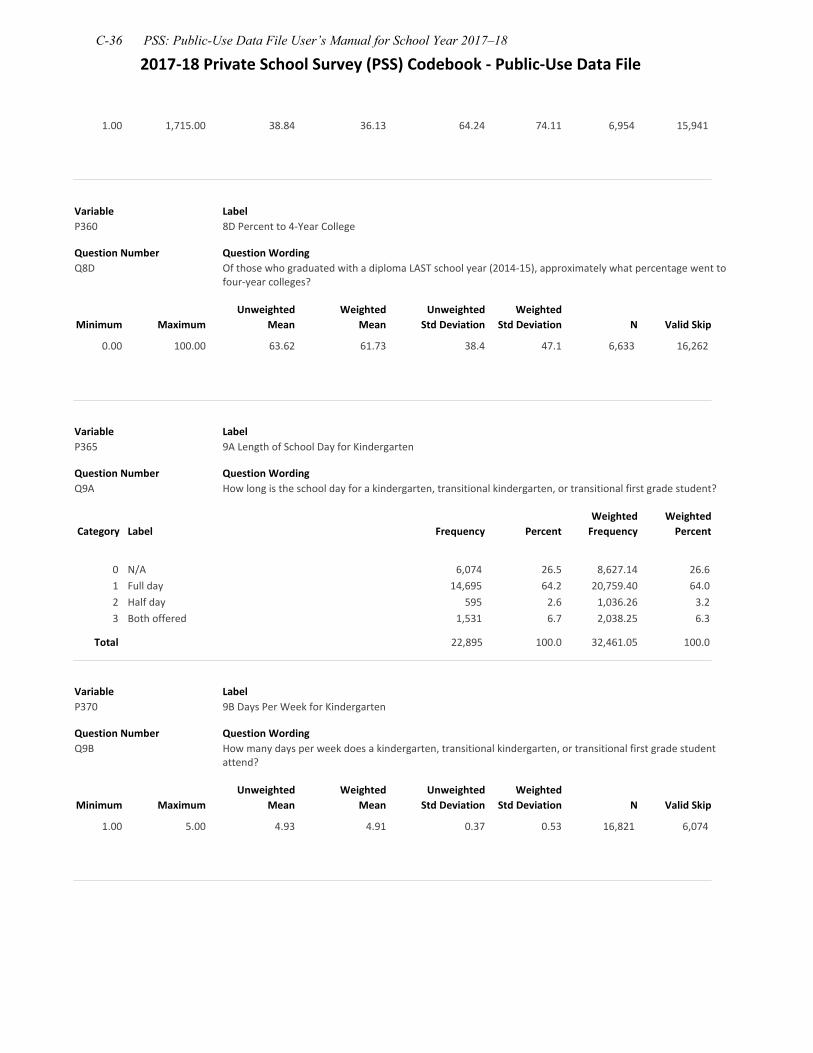
2017‐18 Private School Survey (PSS) Codebook ‐ Public‐Use Data File
1.00 1,715.00 38.84 36.13 64.24 74.11 6,954 15,941
Variable P360
Label 8D Percent to 4‐Year College
Question Number Q8D
Question Wording Of those who graduated with a diploma LAST school year (2014‐15), approximately what percentage went to four‐year colleges?
Minimum Maximum Unweighted
Mean Weighted
Mean Unweighted
Std Deviation Weighted
Std Deviation N Valid Skip
0.00 100.00 63.62 61.73 38.4 47.1 6,633 16,262
Variable P365
Label 9A Length of School Day for Kindergarten
Question Number Q9A
Question Wording How long is the school day for a kindergarten, transitional kindergarten, or transitional first grade student?
Category Label Frequency Percent Weighted Frequency
Weighted Percent
0 N/A 6,074 26.5 8,627.14 26.6 1 Full day 14,695 64.2 20,759.40 64.0 2 Half day 595 2.6 1,036.26 3.2 3 Both offered 1,531 6.7 2,038.25 6.3
Total 22,895 100.0 32,461.05 100.0
Variable P370
Label 9B Days Per Week for Kindergarten
Question Number Q9B
Question Wording How many days per week does a kindergarten, transitional kindergarten, or transitional first grade student attend?
Minimum Maximum Unweighted
Mean Weighted
Mean Unweighted
Std Deviation Weighted
Std Deviation N Valid Skip
1.00 5.00 4.93 4.91 0.37 0.53 16,821 6,074
C-36 PSS: Public-Use Data File User’s Manual for School Year 2017–18
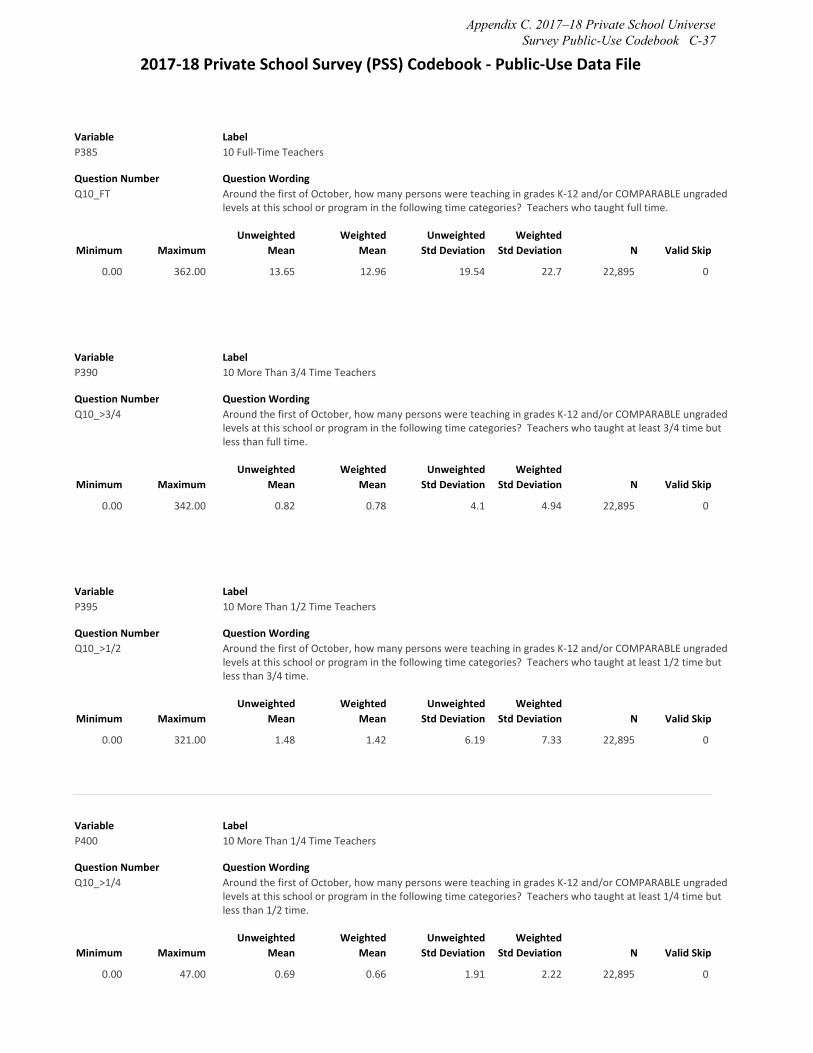
2017‐18 Private School Survey (PSS) Codebook ‐ Public‐Use Data File
Variable P385
Label 10 Full‐Time Teachers
Question Number Q10_FT
Question Wording Around the first of October, how many persons were teaching in grades K‐12 and/or COMPARABLE ungraded levels at this school or program in the following time categories? Teachers who taught full time.
Minimum Maximum Unweighted
Mean Weighted
Mean Unweighted
Std Deviation Weighted
Std Deviation N Valid Skip
0.00 362.00 13.65 12.96 19.54 22.7 22,895 0
Variable P390
Label 10 More Than 3/4 Time Teachers
Question Number Q10_>3/4
Question Wording Around the first of October, how many persons were teaching in grades K‐12 and/or COMPARABLE ungraded levels at this school or program in the following time categories? Teachers who taught at least 3/4 time but less than full time.
Minimum Maximum Unweighted
Mean Weighted
Mean Unweighted
Std Deviation Weighted
Std Deviation N Valid Skip
0.00 342.00 0.82 0.78 4.1 4.94 22,895 0
Variable P395
Label 10 More Than 1/2 Time Teachers
Question Number Q10_>1/2
Question Wording Around the first of October, how many persons were teaching in grades K‐12 and/or COMPARABLE ungraded levels at this school or program in the following time categories? Teachers who taught at least 1/2 time but less than 3/4 time.
Minimum Maximum Unweighted
Mean Weighted
Mean Unweighted
Std Deviation Weighted
Std Deviation N Valid Skip
0.00 321.00 1.48 1.42 6.19 7.33 22,895 0
Variable P400
Label 10 More Than 1/4 Time Teachers
Question Number Q10_>1/4
Question Wording Around the first of October, how many persons were teaching in grades K‐12 and/or COMPARABLE ungraded levels at this school or program in the following time categories? Teachers who taught at least 1/4 time but less than 1/2 time.
Minimum Maximum Unweighted
Mean Weighted
Mean Unweighted
Std Deviation Weighted
Std Deviation N Valid Skip
0.00 47.00 0.69 0.66 1.91 2.22 22,895 0
Appendix C. 2017–18 Private School Universe Survey Public-Use Codebook C-37
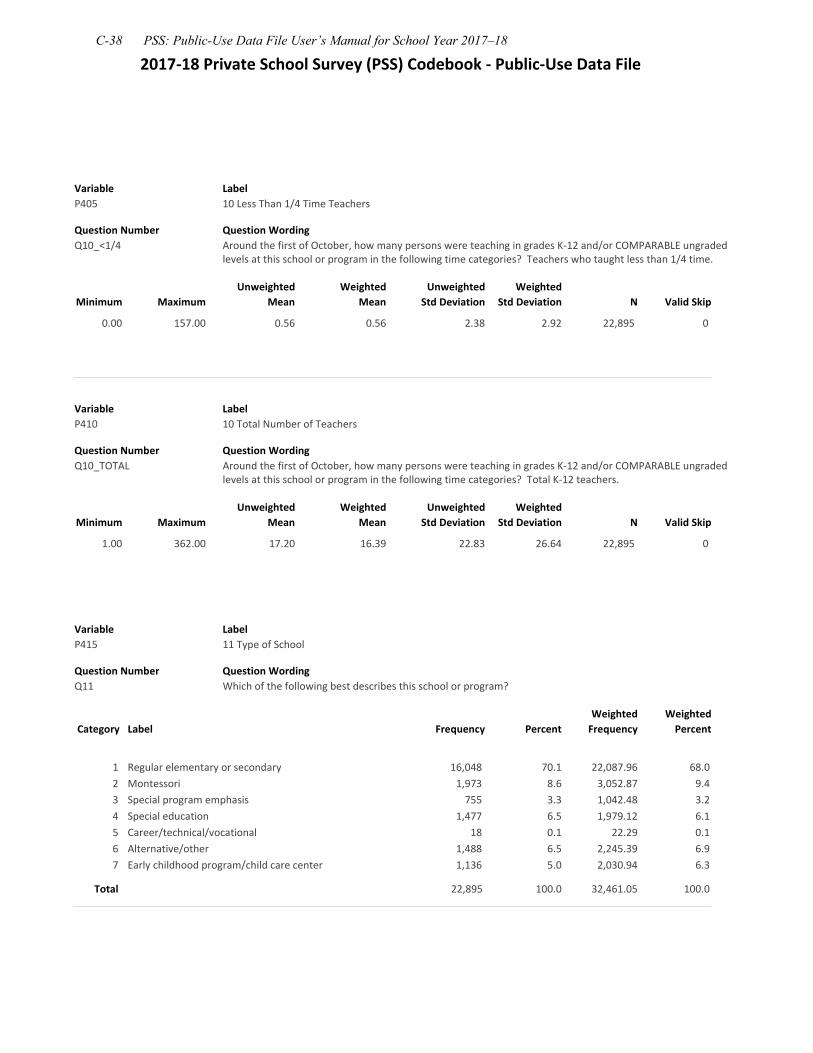
2017‐18 Private School Survey (PSS) Codebook ‐ Public‐Use Data File
Variable P405
Label 10 Less Than 1/4 Time Teachers
Question Number Question Wording Q10_<1/4 Around the first of October, how many persons were teaching in grades K‐12 and/or COMPARABLE ungraded
levels at this school or program in the following time categories? Teachers who taught less than 1/4 time.
Minimum Maximum Unweighted
Mean Weighted
Mean Unweighted
Std Deviation Weighted
Std Deviation N Valid Skip
0.00 157.00 0.56 0.56 2.38 2.92 22,895 0
Variable P410
Label 10 Total Number of Teachers
Question Number Q10_TOTAL
Question Wording Around the first of October, how many persons were teaching in grades K‐12 and/or COMPARABLE ungraded levels at this school or program in the following time categories? Total K‐12 teachers.
Minimum Maximum Unweighted
Mean Weighted
Mean Unweighted
Std Deviation Weighted
Std Deviation N Valid Skip
1.00 362.00 17.20 16.39 22.83 26.64 22,895 0
Variable P415
Label 11 Type of School
Question Number Q11
Question Wording Which of the following best describes this school or program?
Category Label Frequency Percent Weighted Frequency
Weighted Percent
1 Regular elementary or secondary 16,048 70.1 22,087.96 68.0 2 Montessori 1,973 8.6 3,052.87 9.4 3 Special program emphasis 755 3.3 1,042.48 3.2 4 Special education 1,477 6.5 1,979.12 6.1 5 Career/technical/vocational 18 0.1 22.29 0.1 6 Alternative/other 1,488 6.5 2,245.39 6.9 7 Early childhood program/child care center 1,136 5.0 2,030.94 6.3
Total 22,895 100.0 32,461.05 100.0
C-38 PSS: Public-Use Data File User’s Manual for School Year 2017–18
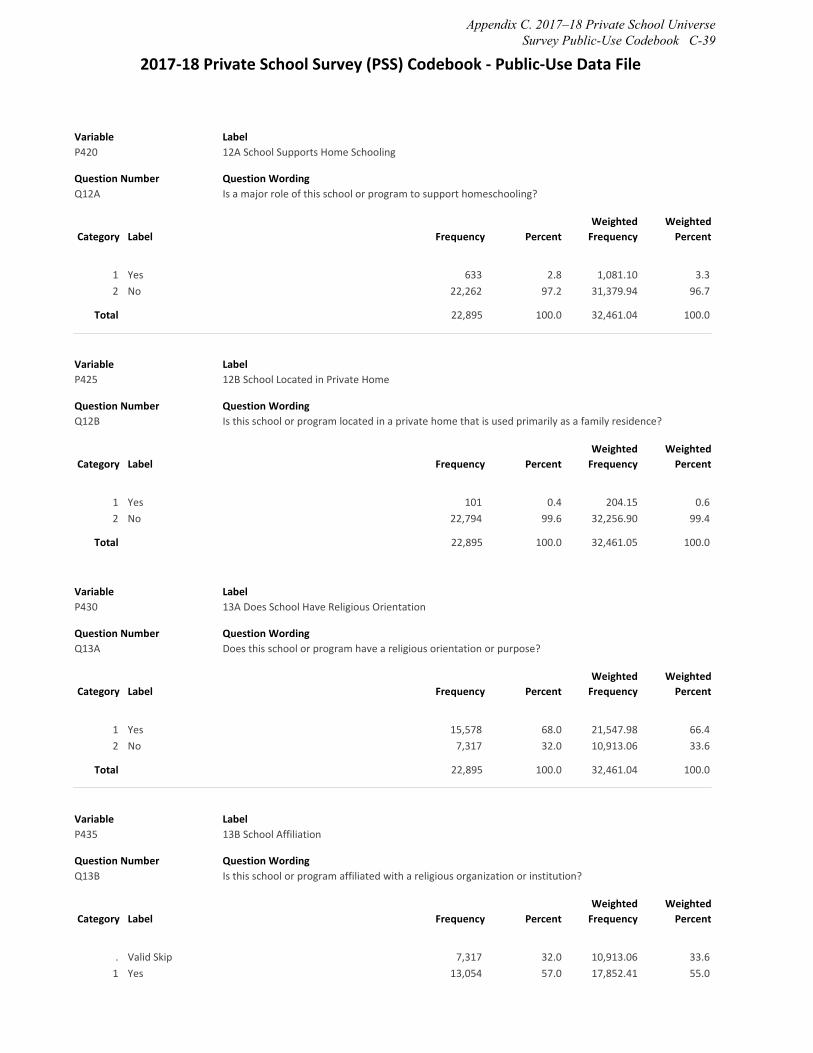
2017‐18 Private School Survey (PSS) Codebook ‐ Public‐Use Data File
Variable P420
Label 12A School Supports Home Schooling
Question Number Q12A
Question Wording Is a major role of this school or program to support homeschooling?
Category Label Frequency Percent Weighted Frequency
Weighted Percent
1 Yes 633 2.8 1,081.10 3.3 2 No 22,262 97.2 31,379.94 96.7
Total 22,895 100.0 32,461.04 100.0
Variable P425
Label 12B School Located in Private Home
Question Number Q12B
Question Wording Is this school or program located in a private home that is used primarily as a family residence?
Category Label Frequency Percent Weighted Frequency
Weighted Percent
1 Yes 101 0.4 204.15 0.6 2 No 22,794 99.6 32,256.90 99.4
Total 22,895 100.0 32,461.05 100.0
Variable P430
Label 13A Does School Have Religious Orientation
Question Number Q13A
Question Wording Does this school or program have a religious orientation or purpose?
Category Label Frequency Percent Weighted Frequency
Weighted Percent
1 Yes 15,578 68.0 21,547.98 66.4 2 No 7,317 32.0 10,913.06 33.6
Total 22,895 100.0 32,461.04 100.0
Variable P435
Label 13B School Affiliation
Question Number Q13B
Question Wording Is this school or program affiliated with a religious organization or institution?
Category Label Frequency Percent Weighted Frequency
Weighted Percent
. Valid Skip 7,317 32.0 10,913.06 33.6 1 Yes 13,054 57.0 17,852.41 55.0
Appendix C. 2017–18 Private School Universe Survey Public-Use Codebook C-39
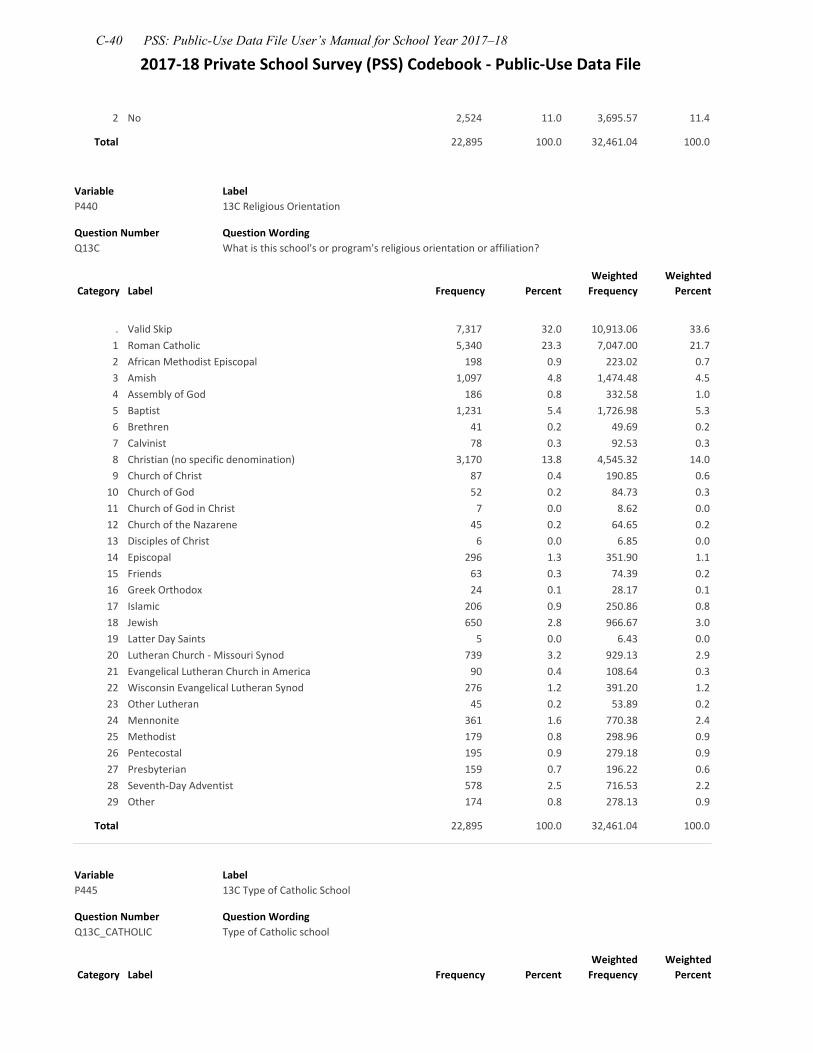
2017‐18 Private School Survey (PSS) Codebook ‐ Public‐Use Data File
2 No 2,524 11.0 3,695.57 11.4
Total 22,895 100.0 32,461.04 100.0
Variable P440
Label 13C Religious Orientation
Question Number Question Wording Q13C What is this school's or program's religious orientation or affiliation?
Weighted Weighted Category Label Frequency Percent Frequency Percent
. Valid Skip 7,317 32.0 10,913.06 33.6 1 Roman Catholic 5,340 23.3 7,047.00 21.7 2 African Methodist Episcopal 198 0.9 223.02 0.7 3 Amish 1,097 4.8 1,474.48 4.5 4 Assembly of God 186 0.8 332.58 1.0 5 Baptist 1,231 5.4 1,726.98 5.3 6 Brethren 41 0.2 49.69 0.2 7 Calvinist 78 0.3 92.53 0.3 8 Christian (no specific denomination) 3,170 13.8 4,545.32 14.0 9 Church of Christ 87 0.4 190.85 0.6
10 Church of God 52 0.2 84.73 0.3 11 Church of God in Christ 7 0.0 8.62 0.0 12 Church of the Nazarene 45 0.2 64.65 0.2 13 Disciples of Christ 6 0.0 6.85 0.0 14 Episcopal 296 1.3 351.90 1.1 15 Friends 63 0.3 74.39 0.2 16 Greek Orthodox 24 0.1 28.17 0.1 17 Islamic 206 0.9 250.86 0.8 18 Jewish 650 2.8 966.67 3.0 19 Latter Day Saints 5 0.0 6.43 0.0 20 Lutheran Church ‐ Missouri Synod 739 3.2 929.13 2.9 21 Evangelical Lutheran Church in America 90 0.4 108.64 0.3 22 Wisconsin Evangelical Lutheran Synod 276 1.2 391.20 1.2 23 Other Lutheran 45 0.2 53.89 0.2 24 Mennonite 361 1.6 770.38 2.4 25 Methodist 179 0.8 298.96 0.9 26 Pentecostal 195 0.9 279.18 0.9 27 Presbyterian 159 0.7 196.22 0.6 28 Seventh‐Day Adventist 578 2.5 716.53 2.2 29 Other 174 0.8 278.13 0.9
Total 22,895 100.0 32,461.04 100.0
Variable P445
Label 13C Type of Catholic School
Question Number Q13C_CATHOLIC
Question Wording Type of Catholic school
Category Label Frequency Percent Weighted Frequency
Weighted Percent
C-40 PSS: Public-Use Data File User’s Manual for School Year 2017–18
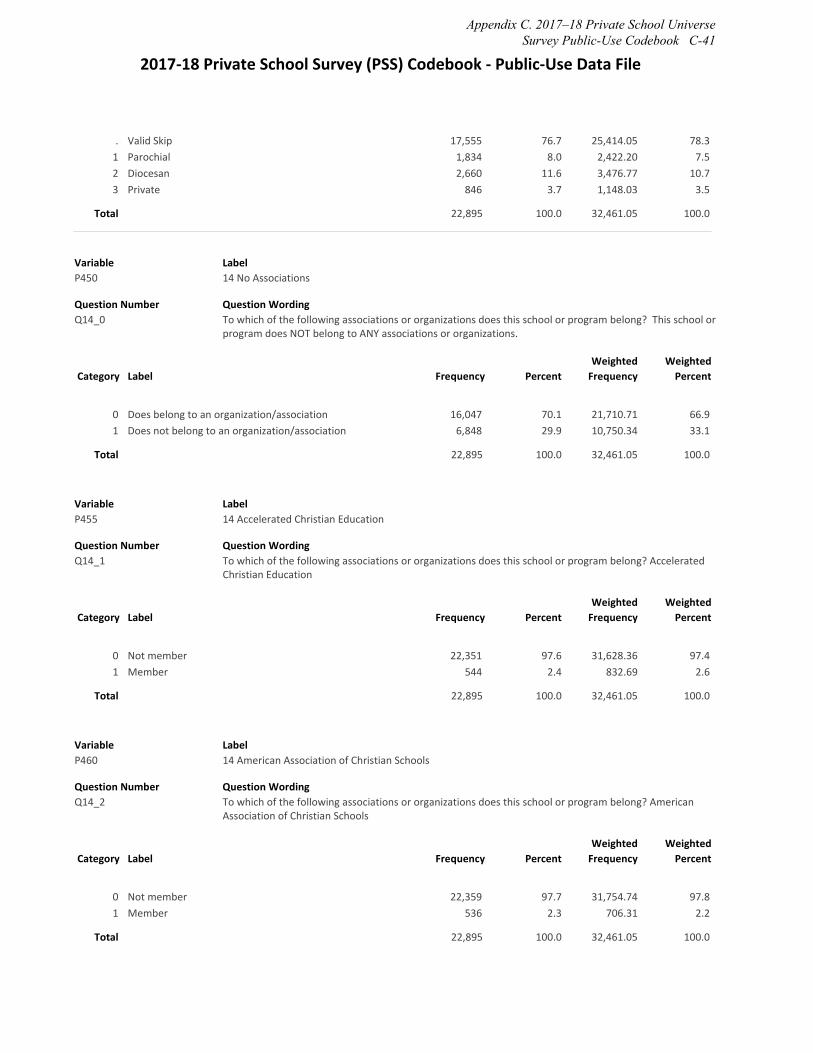
2017‐18 Private School Survey (PSS) Codebook ‐ Public‐Use Data File
. Valid Skip 17,555 76.7 25,414.05 78.3 1 Parochial 1,834 8.0 2,422.20 7.5 2 Diocesan 2,660 11.6 3,476.77 10.7 3 Private 846 3.7 1,148.03 3.5
Total 22,895 100.0 32,461.05 100.0
Variable P450
Label 14 No Associations
Question Number Q14_0
Question Wording To which of the following associations or organizations does this school or program belong? This school or program does NOT belong to ANY associations or organizations.
Category Label Frequency Percent Weighted Frequency
Weighted Percent
0 Does belong to an organization/association 16,047 70.1 21,710.71 66.9 1 Does not belong to an organization/association 6,848 29.9 10,750.34 33.1
Total 22,895 100.0 32,461.05 100.0
Variable P455
Label 14 Accelerated Christian Education
Question Number Q14_1
Question Wording To which of the following associations or organizations does this school or program belong? Accelerated Christian Education
Category Label Frequency Percent Weighted Frequency
Weighted Percent
0 Not member 22,351 97.6 31,628.36 97.4 1 Member 544 2.4 832.69 2.6
Total 22,895 100.0 32,461.05 100.0
Variable P460
Label 14 American Association of Christian Schools
Question Number Q14_2
Question Wording To which of the following associations or organizations does this school or program belong? American Association of Christian Schools
Category Label Frequency Percent Weighted Frequency
Weighted Percent
0 Not member 22,359 97.7 31,754.74 97.8 1 Member 536 2.3 706.31 2.2
Total 22,895 100.0 32,461.05 100.0
Appendix C. 2017–18 Private School Universe Survey Public-Use Codebook C-41
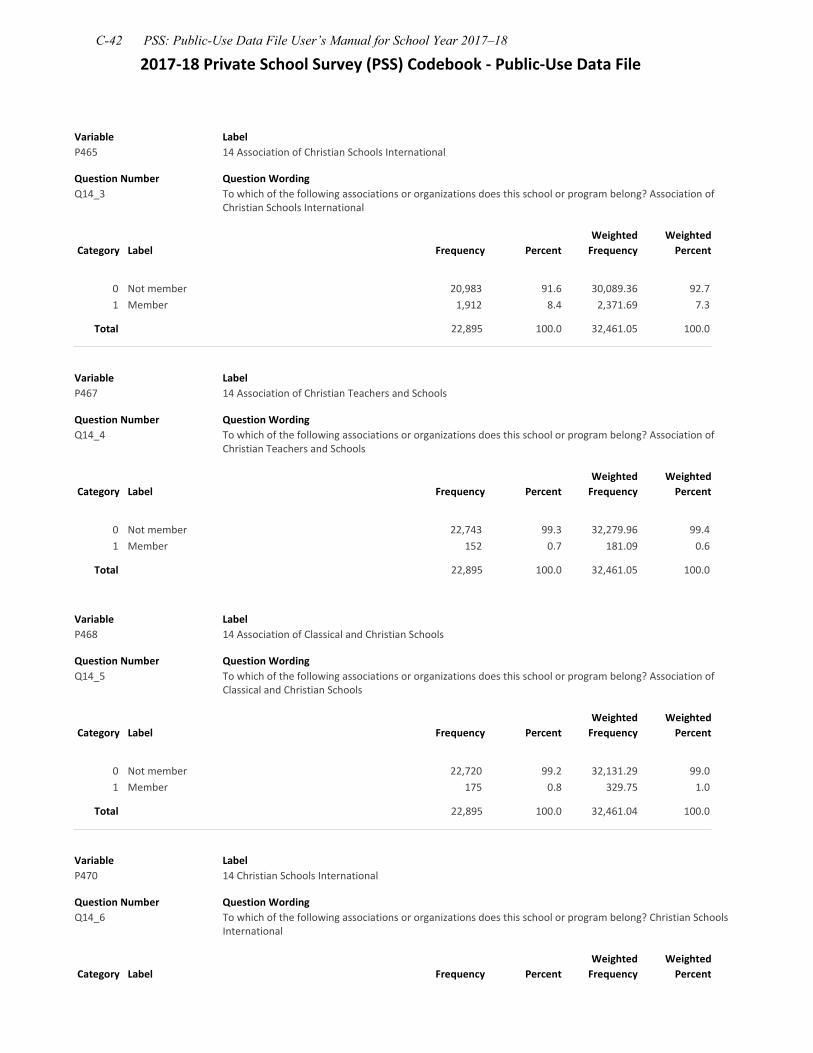
2017‐18 Private School Survey (PSS) Codebook ‐ Public‐Use Data File
Variable P465
Label 14 Association of Christian Schools International
Question Number Q14_3
Question Wording To which of the following associations or organizations does this school or program belong? Association of Christian Schools International
Category Label Frequency Percent Weighted Frequency
Weighted Percent
0 Not member 20,983 91.6 30,089.36 92.7 1 Member 1,912 8.4 2,371.69 7.3
Total 22,895 100.0 32,461.05 100.0
Variable P467
Label 14 Association of Christian Teachers and Schools
Question Number Q14_4
Question Wording To which of the following associations or organizations does this school or program belong? Association of Christian Teachers and Schools
Category Label Frequency Percent Weighted Frequency
Weighted Percent
0 Not member 22,743 99.3 32,279.96 99.4 1 Member 152 0.7 181.09 0.6
Total 22,895 100.0 32,461.05 100.0
Variable P468
Label 14 Association of Classical and Christian Schools
Question Number Q14_5
Question Wording To which of the following associations or organizations does this school or program belong? Association of Classical and Christian Schools
Category Label Frequency Percent Weighted Frequency
Weighted Percent
0 Not member 22,720 99.2 32,131.29 99.0 1 Member 175 0.8 329.75 1.0
Total 22,895 100.0 32,461.04 100.0
Variable P470
Label 14 Christian Schools International
Question Number Q14_6
Question Wording To which of the following associations or organizations does this school or program belong? Christian Schools International
Category Label Frequency Percent Weighted Frequency
Weighted Percent
C-42 PSS: Public-Use Data File User’s Manual for School Year 2017–18
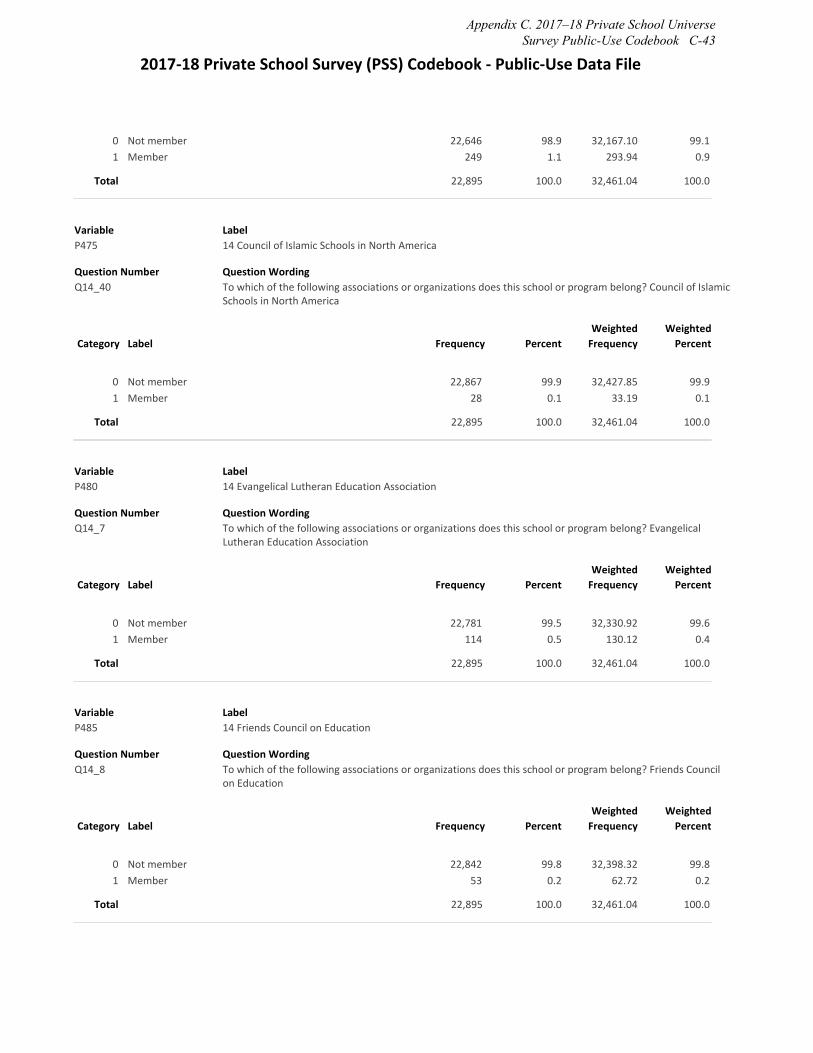
2017‐18 Private School Survey (PSS) Codebook ‐ Public‐Use Data File
0 Not member 22,646 98.9 32,167.10 99.1 1 Member 249 1.1 293.94 0.9
Total 22,895 100.0 32,461.04 100.0
Variable P475
Label 14 Council of Islamic Schools in North America
Question Number Q14_40
Question Wording To which of the following associations or organizations does this school or program belong? Council of Islamic Schools in North America
Category Label Frequency Percent Weighted Frequency
Weighted Percent
0 Not member 22,867 99.9 32,427.85 99.9 1 Member 28 0.1 33.19 0.1
Total 22,895 100.0 32,461.04 100.0
Variable P480
Label 14 Evangelical Lutheran Education Association
Question Number Q14_7
Question Wording To which of the following associations or organizations does this school or program belong? Evangelical Lutheran Education Association
Category Label Frequency Percent Weighted Frequency
Weighted Percent
0 Not member 22,781 99.5 32,330.92 99.6 1 Member 114 0.5 130.12 0.4
Total 22,895 100.0 32,461.04 100.0
Variable P485
Label 14 Friends Council on Education
Question Number Q14_8
Question Wording To which of the following associations or organizations does this school or program belong? Friends Council on Education
Category Label Frequency Percent Weighted Frequency
Weighted Percent
0 Not member 22,842 99.8 32,398.32 99.8 1 Member 53 0.2 62.72 0.2
Total 22,895 100.0 32,461.04 100.0
Appendix C. 2017–18 Private School Universe Survey Public-Use Codebook C-43
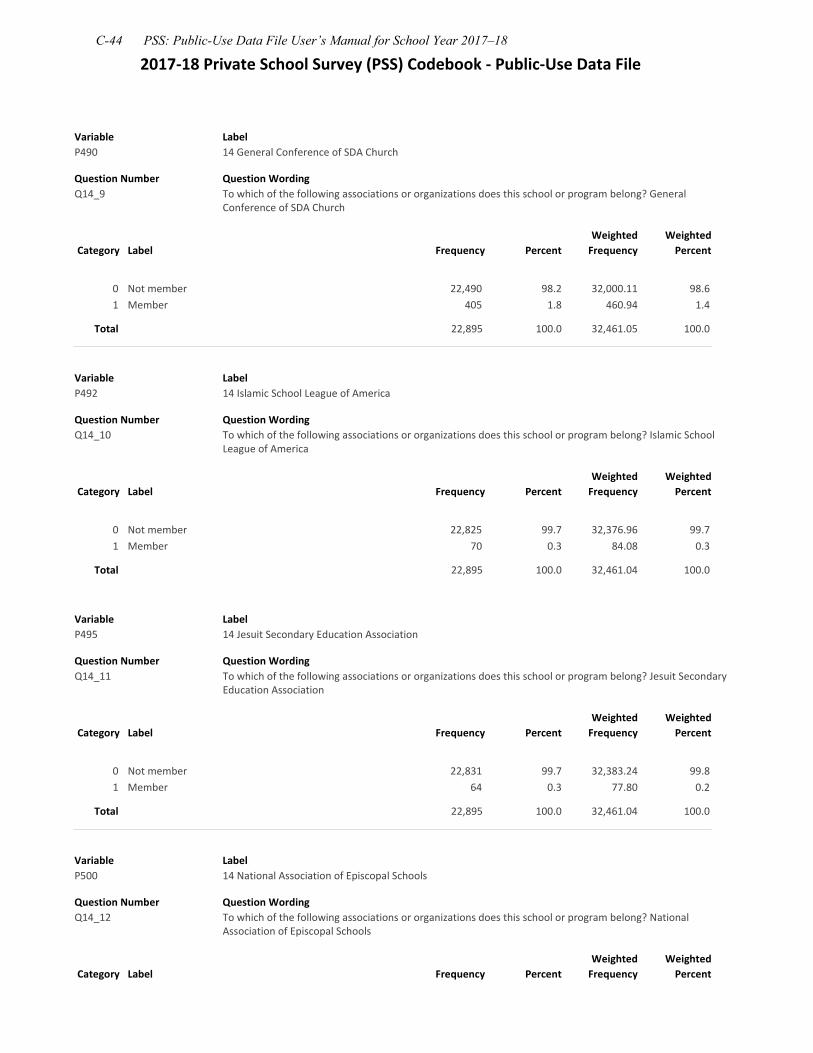
2017‐18 Private School Survey (PSS) Codebook ‐ Public‐Use Data File
Variable P490
Label 14 General Conference of SDA Church
Question Number Q14_9
Question Wording To which of the following associations or organizations does this school or program belong? General Conference of SDA Church
Category Label Frequency Percent Weighted Frequency
Weighted Percent
0 Not member 22,490 98.2 32,000.11 98.6 1 Member 405 1.8 460.94 1.4
Total 22,895 100.0 32,461.05 100.0
Variable P492
Label 14 Islamic School League of America
Question Number Q14_10
Question Wording To which of the following associations or organizations does this school or program belong? Islamic School League of America
Category Label Frequency Percent Weighted Frequency
Weighted Percent
0 Not member 22,825 99.7 32,376.96 99.7 1 Member 70 0.3 84.08 0.3
Total 22,895 100.0 32,461.04 100.0
Variable P495
Label 14 Jesuit Secondary Education Association
Question Number Q14_11
Question Wording To which of the following associations or organizations does this school or program belong? Jesuit Secondary Education Association
Category Label Frequency Percent Weighted Frequency
Weighted Percent
0 Not member 22,831 99.7 32,383.24 99.8 1 Member 64 0.3 77.80 0.2
Total 22,895 100.0 32,461.04 100.0
Variable P500
Label 14 National Association of Episcopal Schools
Question Number Question Wording Q14_12 To which of the following associations or organizations does this school or program belong? National
Association of Episcopal Schools
Category Label Frequency Percent Weighted Frequency
Weighted Percent
C-44 PSS: Public-Use Data File User’s Manual for School Year 2017–18

2017‐18 Private School Survey (PSS) Codebook ‐ Public‐Use Data File
0 Not member 22,679 99.1 32,205.07 99.2 1 Member 216 0.9 255.98 0.8
Total 22,895 100.0 32,461.05 100.0
Variable P505
Label 14 National Catholic Educational Association
Question Number Q14_13
Question Wording To which of the following associations or organizations does this school or program belong? National Catholic Educational Association
Category Label Frequency Percent Weighted Frequency
Weighted Percent
0 Not member 18,772 82.0 27,201.89 83.8 1 Member 4,123 18.0 5,259.15 16.2
Total 22,895 100.0 32,461.04 100.0
Variable P510
Label 14 National Christian School Association
Question Number Q14_14
Question Wording To which of the following associations or organizations does this school or program belong? National Christian School Association
Category Label Frequency Percent Weighted Frequency
Weighted Percent
0 Not member 22,789 99.5 32,317.29 99.6 1 Member 106 0.5 143.75 0.4
Total 22,895 100.0 32,461.04 100.0
Variable P515
Label 14 National Society for Hebrew Day Schools
Question Number Q14_15
Question Wording To which of the following associations or organizations does this school or program belong? National Society for Hebrew Day Schools
Category Label Frequency Percent Weighted Frequency
Weighted Percent
0 Not member 22,702 99.2 32,186.32 99.2 1 Member 193 0.8 274.72 0.8
Total 22,895 100.0 32,461.04 100.0
Appendix C. 2017–18 Private School Universe Survey Public-Use Codebook C-45
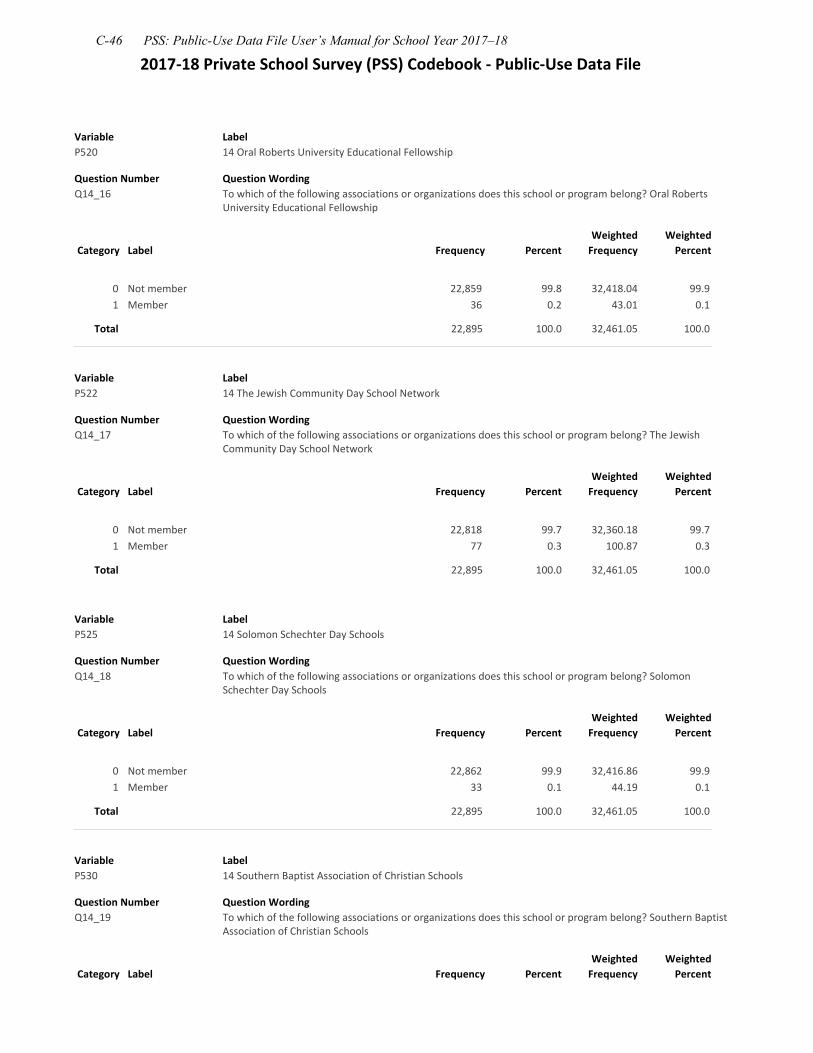
2017‐18 Private School Survey (PSS) Codebook ‐ Public‐Use Data File
Variable P520
Label 14 Oral Roberts University Educational Fellowship
Question Number Q14_16
Question Wording To which of the following associations or organizations does this school or program belong? Oral Roberts University Educational Fellowship
Category Label Frequency Percent Weighted Frequency
Weighted Percent
0 Not member 22,859 99.8 32,418.04 99.9 1 Member 36 0.2 43.01 0.1
Total 22,895 100.0 32,461.05 100.0
Variable P522
Label 14 The Jewish Community Day School Network
Question Number Q14_17
Question Wording To which of the following associations or organizations does this school or program belong? The Jewish Community Day School Network
Category Label Frequency Percent Weighted Frequency
Weighted Percent
0 Not member 22,818 99.7 32,360.18 99.7 1 Member 77 0.3 100.87 0.3
Total 22,895 100.0 32,461.05 100.0
Variable P525
Label 14 Solomon Schechter Day Schools
Question Number Q14_18
Question Wording To which of the following associations or organizations does this school or program belong? Solomon Schechter Day Schools
Category Label Frequency Percent Weighted Frequency
Weighted Percent
0 Not member 22,862 99.9 32,416.86 99.9 1 Member 33 0.1 44.19 0.1
Total 22,895 100.0 32,461.05 100.0
Variable P530
Label 14 Southern Baptist Association of Christian Schools
Question Number Q14_19
Question Wording To which of the following associations or organizations does this school or program belong? Southern Baptist Association of Christian Schools
Category Label Frequency Percent Weighted Frequency
Weighted Percent
C-46 PSS: Public-Use Data File User’s Manual for School Year 2017–18

2017‐18 Private School Survey (PSS) Codebook ‐ Public‐Use Data File
0 Not member 22,795 99.6 32,342.60 99.6 1 Member 100 0.4 118.45 0.4
Total 22,895 100.0 32,461.05 100.0
Variable P535
Label 14 Other Religious School Associations
Question Number Q14_20
Question Wording To which of the following associations or organizations does this school or program belong? Other Religious School Associations
Category Label Frequency Percent Weighted Frequency
Weighted Percent
0 Not member 21,676 94.7 30,769.82 94.8 1 Member 1,219 5.3 1,691.23 5.2
Total 22,895 100.0 32,461.05 100.0
Variable P540
Label 14 American Montessori Society
Question Number Question Wording Q14_21 To which of the following associations or organizations does this school or program belong? American
Montessori Society
Category Label Frequency Percent Weighted Frequency
Weighted Percent
0 Not member 21,920 95.7 31,274.60 96.3 1 Member 975 4.3 1,186.44 3.7
Total 22,895 100.0 32,461.04 100.0
Variable P542
Label 14 Association Montessori International
Question Number Q14_22
Question Wording To which of the following associations or organizations does this school or program belong? Association Montessori International
Category Label Frequency Percent Weighted Frequency
Weighted Percent
0 Not member 22,408 97.9 31,746.50 97.8 1 Member 487 2.1 714.55 2.2
Total 22,895 100.0 32,461.05 100.0
Appendix C. 2017–18 Private School Universe Survey Public-Use Codebook C-47
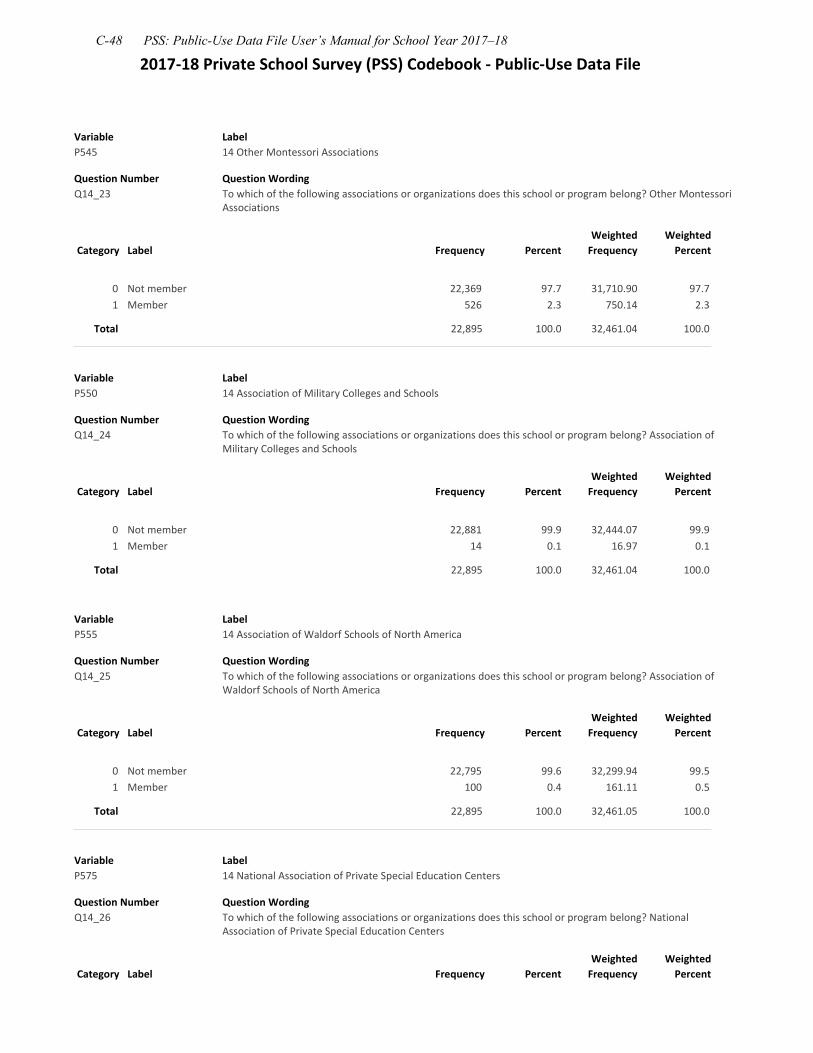
2017‐18 Private School Survey (PSS) Codebook ‐ Public‐Use Data File
Variable P545
Label 14 Other Montessori Associations
Question Number Q14_23
Question Wording To which of the following associations or organizations does this school or program belong? Other Montessori Associations
Category Label Frequency Percent Weighted Frequency
Weighted Percent
0 Not member 22,369 97.7 31,710.90 97.7 1 Member 526 2.3 750.14 2.3
Total 22,895 100.0 32,461.04 100.0
Variable P550
Label 14 Association of Military Colleges and Schools
Question Number Q14_24
Question Wording To which of the following associations or organizations does this school or program belong? Association of Military Colleges and Schools
Category Label Frequency Percent Weighted Frequency
Weighted Percent
0 Not member 22,881 99.9 32,444.07 99.9 1 Member 14 0.1 16.97 0.1
Total 22,895 100.0 32,461.04 100.0
Variable P555
Label 14 Association of Waldorf Schools of North America
Question Number Q14_25
Question Wording To which of the following associations or organizations does this school or program belong? Association of Waldorf Schools of North America
Category Label Frequency Percent Weighted Frequency
Weighted Percent
0 Not member 22,795 99.6 32,299.94 99.5 1 Member 100 0.4 161.11 0.5
Total 22,895 100.0 32,461.05 100.0
Variable P575
Label 14 National Association of Private Special Education Centers
Question Number Q14_26
Question Wording To which of the following associations or organizations does this school or program belong? National Association of Private Special Education Centers
Category Label Frequency Percent Weighted Frequency
Weighted Percent
C-48 PSS: Public-Use Data File User’s Manual for School Year 2017–18
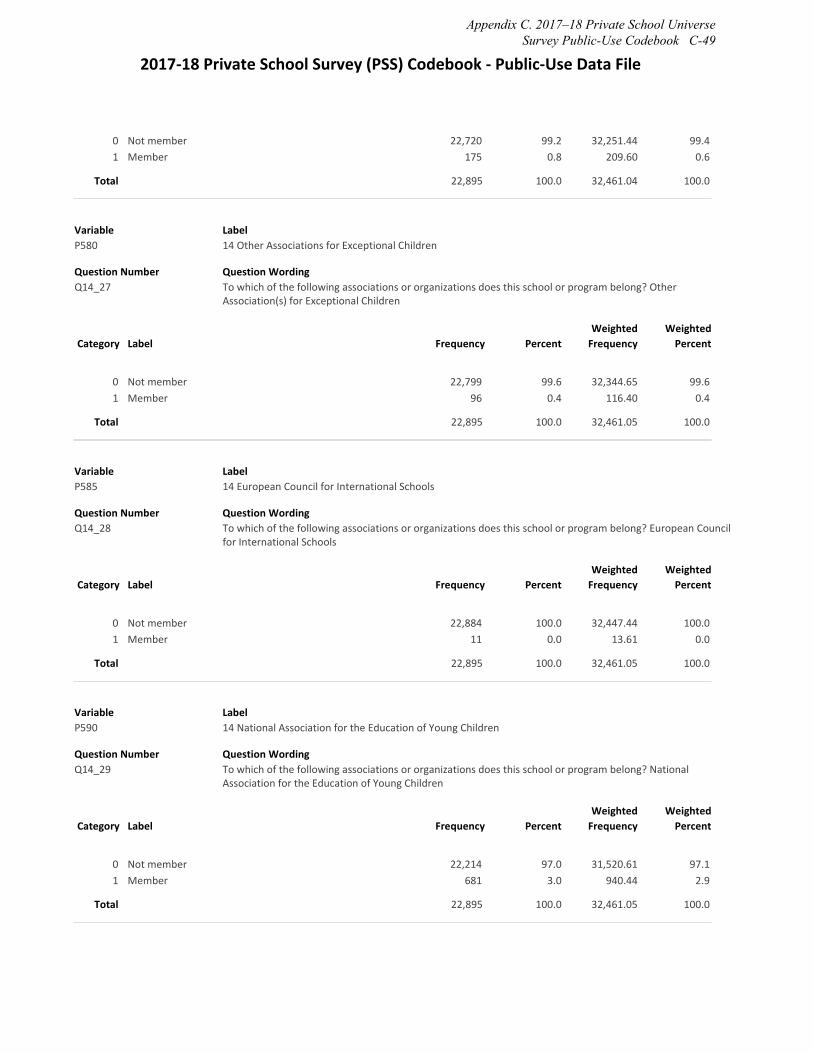
2017‐18 Private School Survey (PSS) Codebook ‐ Public‐Use Data File
0 Not member 22,720 99.2 32,251.44 99.4 1 Member 175 0.8 209.60 0.6
Total 22,895 100.0 32,461.04 100.0
Variable P580
Label 14 Other Associations for Exceptional Children
Question Number Q14_27
Question Wording To which of the following associations or organizations does this school or program belong? Other Association(s) for Exceptional Children
Category Label Frequency Percent Weighted Frequency
Weighted Percent
0 Not member 22,799 99.6 32,344.65 99.6 1 Member 96 0.4 116.40 0.4
Total 22,895 100.0 32,461.05 100.0
Variable P585
Label 14 European Council for International Schools
Question Number Q14_28
Question Wording To which of the following associations or organizations does this school or program belong? European Council for International Schools
Category Label Frequency Percent Weighted Frequency
Weighted Percent
0 Not member 22,884 100.0 32,447.44 100.0 1 Member 11 0.0 13.61 0.0
Total 22,895 100.0 32,461.05 100.0
Variable P590
Label 14 National Association for the Education of Young Children
Question Number Q14_29
Question Wording To which of the following associations or organizations does this school or program belong? National Association for the Education of Young Children
Category Label Frequency Percent Weighted Frequency
Weighted Percent
0 Not member 22,214 97.0 31,520.61 97.1 1 Member 681 3.0 940.44 2.9
Total 22,895 100.0 32,461.05 100.0
Appendix C. 2017–18 Private School Universe Survey Public-Use Codebook C-49
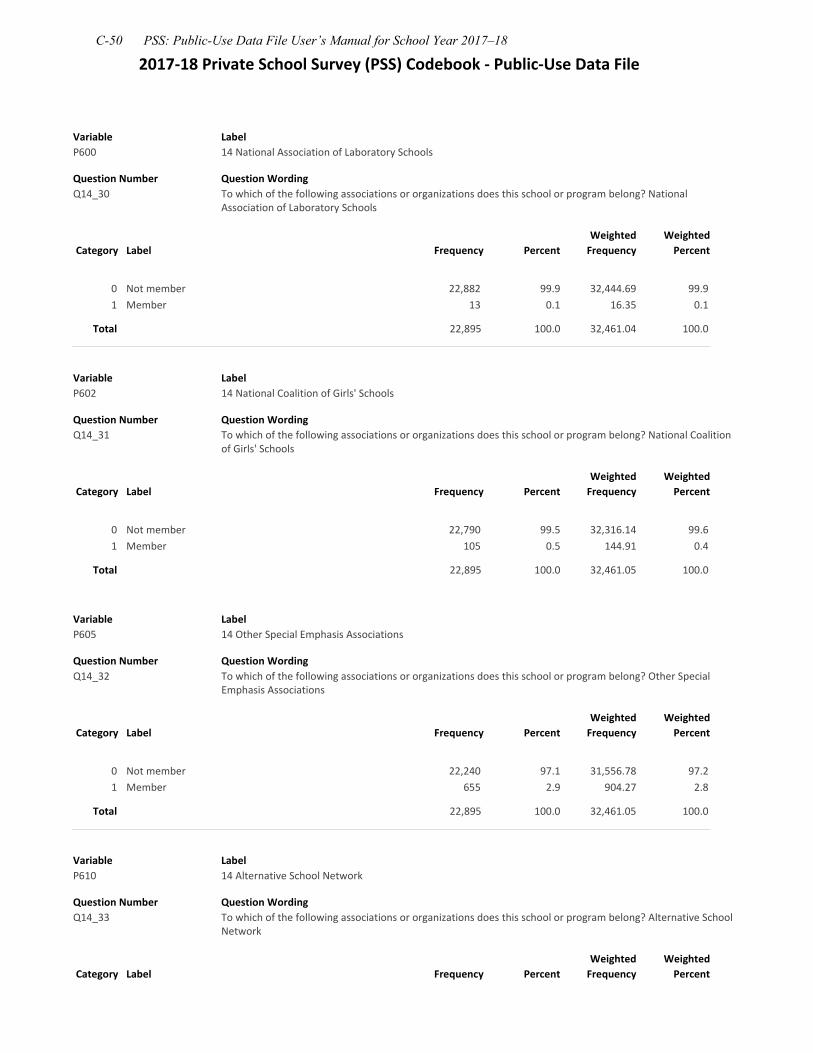
2017‐18 Private School Survey (PSS) Codebook ‐ Public‐Use Data File
Variable P600
Label 14 National Association of Laboratory Schools
Question Number Q14_30
Question Wording To which of the following associations or organizations does this school or program belong? National Association of Laboratory Schools
Category Label Frequency Percent Weighted Frequency
Weighted Percent
0 Not member 22,882 99.9 32,444.69 99.9 1 Member 13 0.1 16.35 0.1
Total 22,895 100.0 32,461.04 100.0
Variable P602
Label 14 National Coalition of Girls' Schools
Question Number Q14_31
Question Wording To which of the following associations or organizations does this school or program belong? National Coalition of Girls' Schools
Category Label Frequency Percent Weighted Frequency
Weighted Percent
0 Not member 22,790 99.5 32,316.14 99.6 1 Member 105 0.5 144.91 0.4
Total 22,895 100.0 32,461.05 100.0
Variable P605
Label 14 Other Special Emphasis Associations
Question Number Q14_32
Question Wording To which of the following associations or organizations does this school or program belong? Other Special Emphasis Associations
Category Label Frequency Percent Weighted Frequency
Weighted Percent
0 Not member 22,240 97.1 31,556.78 97.2 1 Member 655 2.9 904.27 2.8
Total 22,895 100.0 32,461.05 100.0
Variable P610
Label 14 Alternative School Network
Question Number Q14_33
Question Wording To which of the following associations or organizations does this school or program belong? Alternative School Network
Category Label Frequency Percent Weighted Frequency
Weighted Percent
C-50 PSS: Public-Use Data File User’s Manual for School Year 2017–18
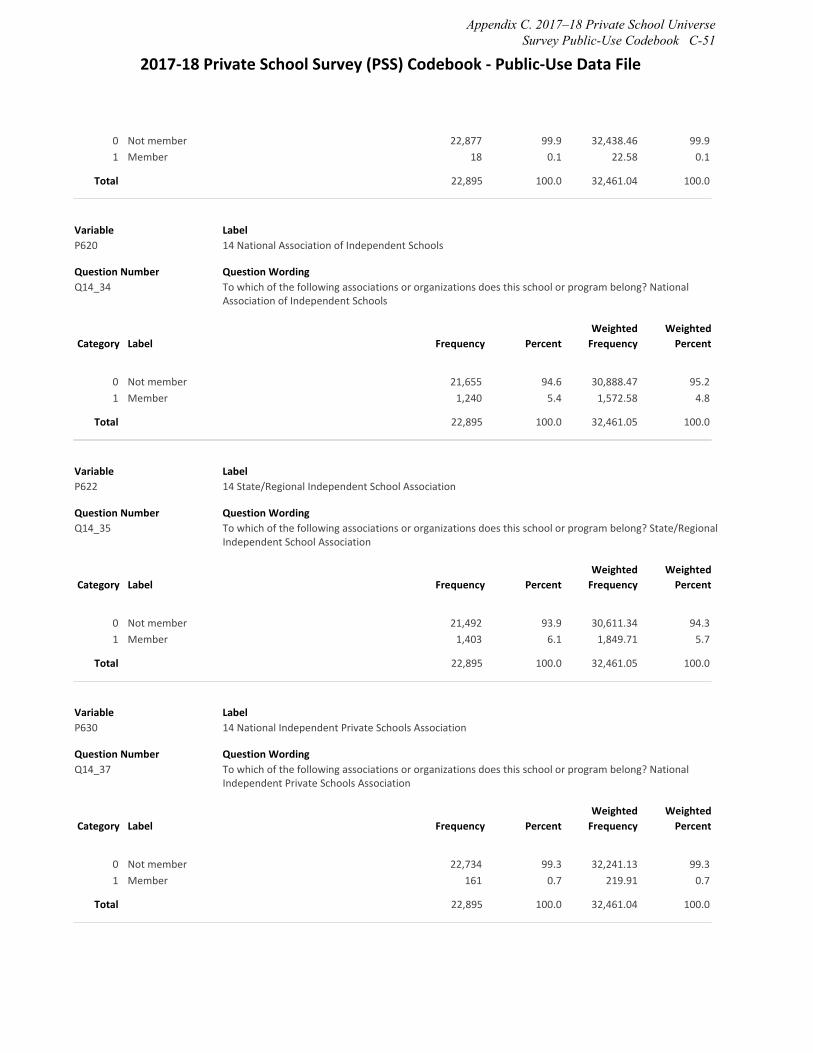
2017‐18 Private School Survey (PSS) Codebook ‐ Public‐Use Data File
0 Not member 22,877 99.9 32,438.46 99.9 1 Member 18 0.1 22.58 0.1
Total 22,895 100.0 32,461.04 100.0
Variable P620
Label 14 National Association of Independent Schools
Question Number Q14_34
Question Wording To which of the following associations or organizations does this school or program belong? National Association of Independent Schools
Category Label Frequency Percent Weighted Frequency
Weighted Percent
0 Not member 21,655 94.6 30,888.47 95.2 1 Member 1,240 5.4 1,572.58 4.8
Total 22,895 100.0 32,461.05 100.0
Variable P622
Label 14 State/Regional Independent School Association
Question Number Q14_35
Question Wording To which of the following associations or organizations does this school or program belong? State/Regional Independent School Association
Category Label Frequency Percent Weighted Frequency
Weighted Percent
0 Not member 21,492 93.9 30,611.34 94.3 1 Member 1,403 6.1 1,849.71 5.7
Total 22,895 100.0 32,461.05 100.0
Variable P630
Label 14 National Independent Private Schools Association
Question Number Q14_37
Question Wording To which of the following associations or organizations does this school or program belong? National Independent Private Schools Association
Category Label Frequency Percent Weighted Frequency
Weighted Percent
0 Not member 22,734 99.3 32,241.13 99.3 1 Member 161 0.7 219.91 0.7
Total 22,895 100.0 32,461.04 100.0
Appendix C. 2017–18 Private School Universe Survey Public-Use Codebook C-51
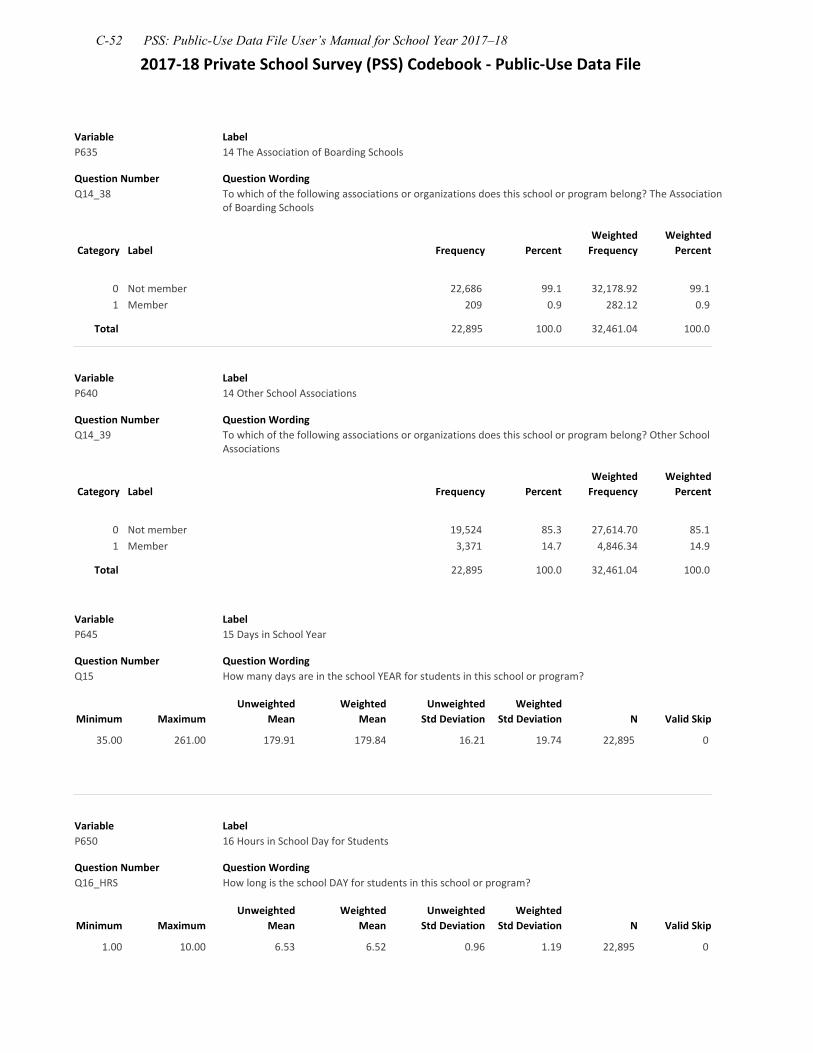
2017‐18 Private School Survey (PSS) Codebook ‐ Public‐Use Data File
Variable P635
Label 14 The Association of Boarding Schools
Question Number Q14_38
Question Wording To which of the following associations or organizations does this school or program belong? The Association of Boarding Schools
Category Label Frequency Percent Weighted Frequency
Weighted Percent
0 Not member 22,686 99.1 32,178.92 99.1 1 Member 209 0.9 282.12 0.9
Total 22,895 100.0 32,461.04 100.0
Variable P640
Label 14 Other School Associations
Question Number Q14_39
Question Wording To which of the following associations or organizations does this school or program belong? Other School Associations
Category Label Frequency Percent Weighted Frequency
Weighted Percent
0 Not member 19,524 85.3 27,614.70 85.1 1 Member 3,371 14.7 4,846.34 14.9
Total 22,895 100.0 32,461.04 100.0
Variable P645
Label 15 Days in School Year
Question Number Q15
Question Wording How many days are in the school YEAR for students in this school or program?
Minimum Maximum Unweighted
Mean Weighted
Mean Unweighted
Std Deviation Weighted
Std Deviation N Valid Skip
35.00 261.00 179.91 179.84 16.21 19.74 22,895 0
Variable P650
Label 16 Hours in School Day for Students
Question Number Q16_HRS
Question Wording How long is the school DAY for students in this school or program?
Minimum Maximum Unweighted
Mean Weighted
Mean Unweighted
Std Deviation Weighted
Std Deviation N Valid Skip
1.00 10.00 6.53 6.52 0.96 1.19 22,895 0
C-52 PSS: Public-Use Data File User’s Manual for School Year 2017–18
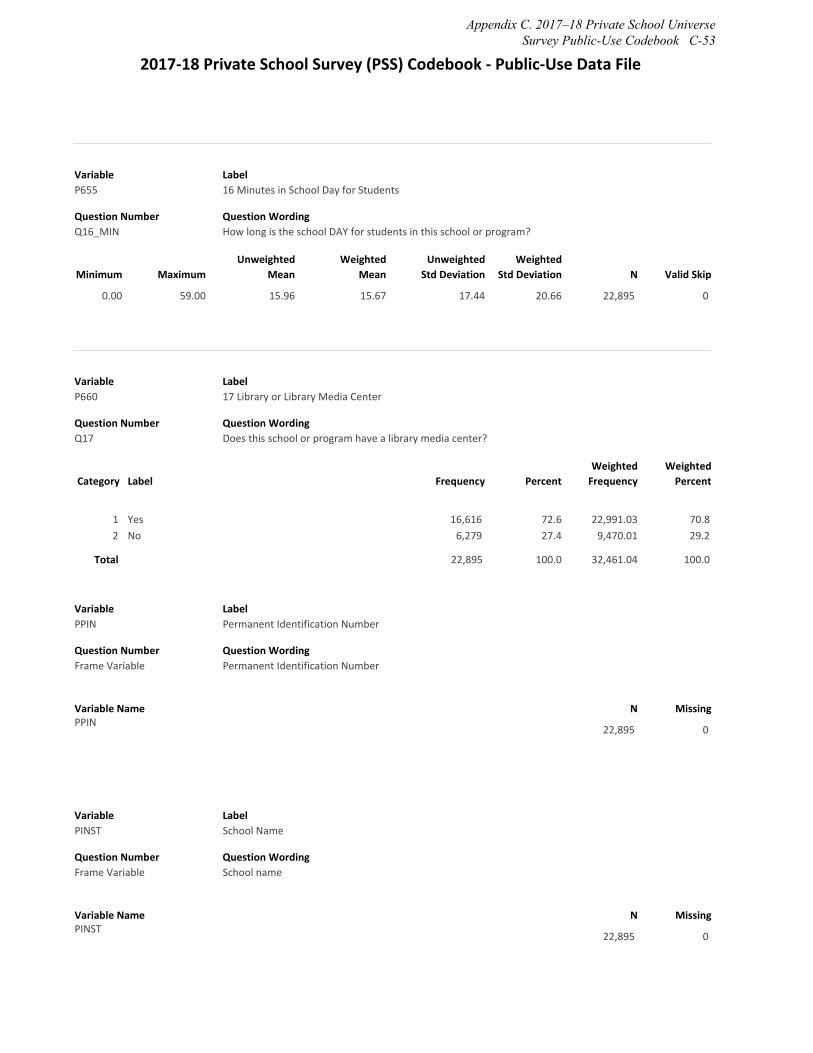
2017‐18 Private School Survey (PSS) Codebook ‐ Public‐Use Data File
Variable P655
Label 16 Minutes in School Day for Students
Question Number Q16_MIN
Question Wording How long is the school DAY for students in this school or program?
Minimum Maximum Unweighted
Mean Weighted
Mean Unweighted
Std Deviation Weighted
Std Deviation N Valid Skip
0.00 59.00 15.96 15.67 17.44 20.66 22,895 0
Variable P660
Label 17 Library or Library Media Center
Question Number Q17
Question Wording Does this school or program have a library media center?
Category Label Frequency Percent Weighted Frequency
Weighted Percent
1 Yes 16,616 72.6 22,991.03 70.8 2 No 6,279 27.4 9,470.01 29.2
Total 22,895 100.0 32,461.04 100.0
Variable PPIN
Label Permanent Identification Number
Question Number Frame Variable
Question Wording Permanent Identification Number
Variable Name N Missing PPIN
22,895 0
Variable PINST
Label School Name
Question Number Frame Variable
Question Wording School name
Variable Name N Missing PINST
22,895 0
Appendix C. 2017–18 Private School Universe Survey Public-Use Codebook C-53
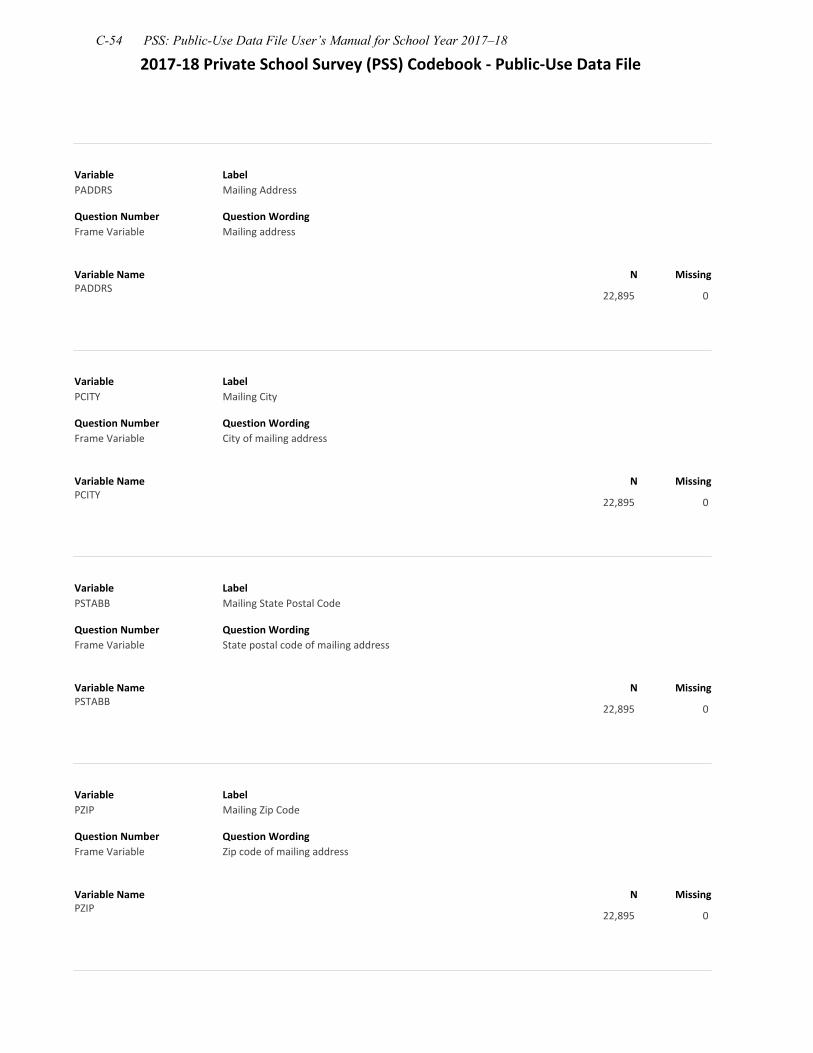
2017‐18 Private School Survey (PSS) Codebook ‐ Public‐Use Data File
Variable PADDRS
Label Mailing Address
Question Number Frame Variable
Question Wording Mailing address
Variable Name N MissingPADDRS
22,895 0
Variable PCITY
Label Mailing City
Question Number Frame Variable
Question Wording City of mailing address
Variable Name N MissingPCITY
22,895 0
Variable PSTABB
Label Mailing State Postal Code
Question Number Frame Variable
Question Wording State postal code of mailing address
Variable Name N MissingPSTABB
22,895 0
Variable PZIP
Label Mailing Zip Code
Question Number Frame Variable
Question Wording Zip code of mailing address
Variable Name N MissingPZIP
22,895 0
C-54 PSS: Public-Use Data File User’s Manual for School Year 2017–18
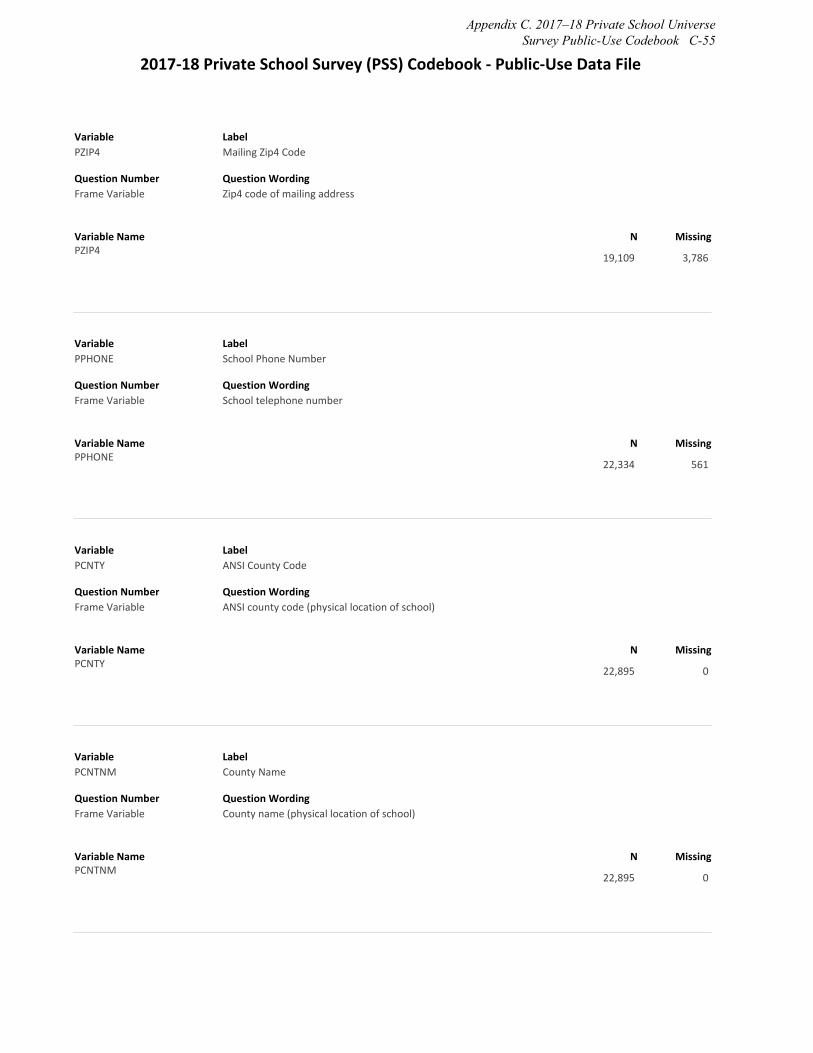
2017‐18 Private School Survey (PSS) Codebook ‐ Public‐Use Data File
Variable PZIP4
Label Mailing Zip4 Code
Question Number Frame Variable
Question Wording Zip4 code of mailing address
Variable Name N MissingPZIP4
19,109 3,786
Variable PPHONE
Label School Phone Number
Question Number Frame Variable
Question Wording School telephone number
Variable Name N MissingPPHONE
22,334 561
Variable PCNTY
Label ANSI County Code
Question Number Frame Variable
Question Wording ANSI county code (physical location of school)
Variable Name N MissingPCNTY
22,895 0
Variable PCNTNM
Label County Name
Question Number Frame Variable
Question Wording County name (physical location of school)
Variable Name N MissingPCNTNM
22,895 0
Appendix C. 2017–18 Private School Universe Survey Public-Use Codebook C-55
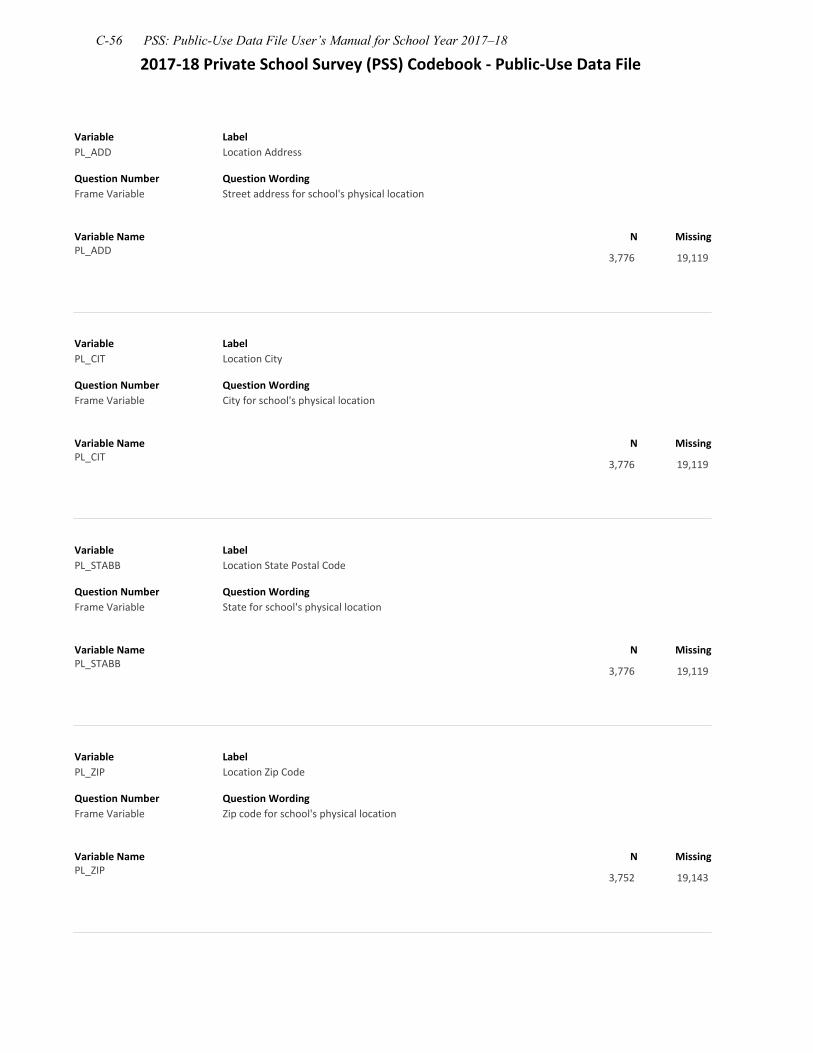
2017‐18 Private School Survey (PSS) Codebook ‐ Public‐Use Data File
Variable PL_ADD
Label Location Address
Question Number Frame Variable
Question Wording Street address for school's physical location
Variable Name N MissingPL_ADD
3,776 19,119
Variable PL_CIT
Label Location City
Question Number Frame Variable
Question Wording City for school's physical location
Variable Name N MissingPL_CIT
3,776 19,119
Variable PL_STABB
Label Location State Postal Code
Question Number Frame Variable
Question Wording State for school's physical location
Variable Name N MissingPL_STABB
3,776 19,119
Variable PL_ZIP
Label Location Zip Code
Question Number Frame Variable
Question Wording Zip code for school's physical location
Variable Name N MissingPL_ZIP
3,752 19,143
C-56 PSS: Public-Use Data File User’s Manual for School Year 2017–18
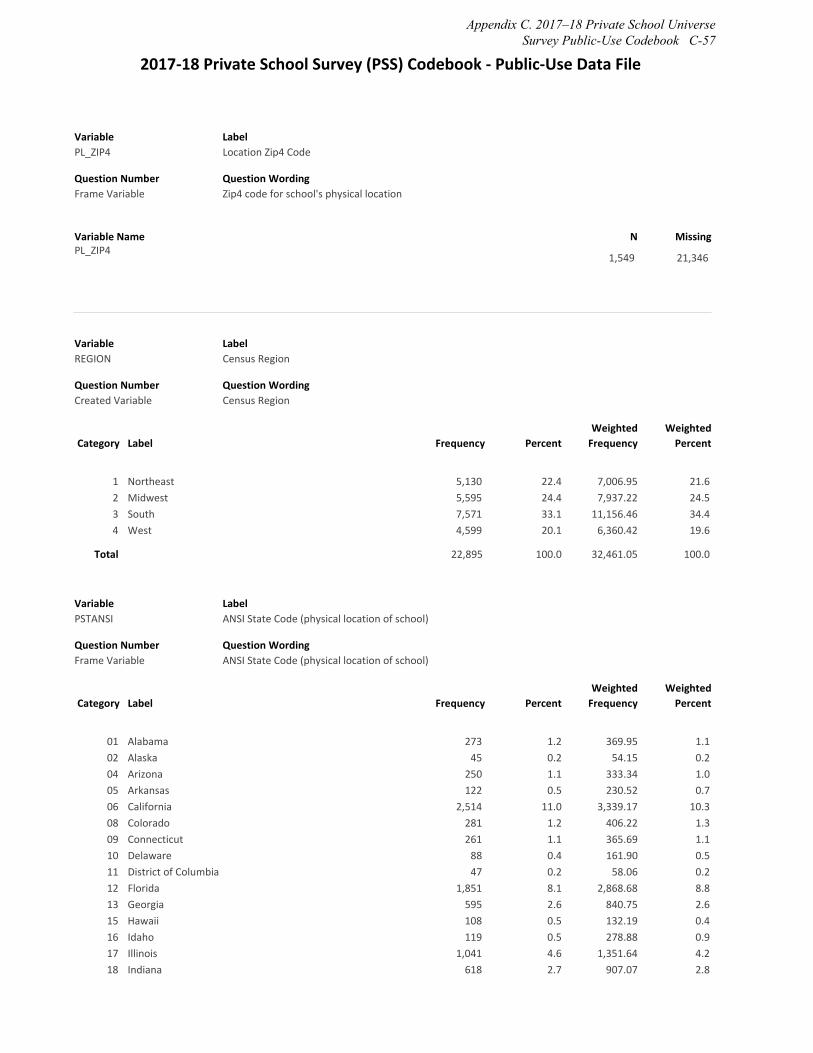
2017‐18 Private School Survey (PSS) Codebook ‐ Public‐Use Data File
Variable PL_ZIP4
Label Location Zip4 Code
Question Number Frame Variable
Question Wording Zip4 code for school's physical location
Variable Name N Missing PL_ZIP4
1,549 21,346
Variable REGION
Label Census Region
Question Number Created Variable
Question Wording Census Region
Category Label Frequency Percent Weighted Frequency
Weighted Percent
1 Northeast 5,130 22.4 7,006.95 21.6 2 Midwest 5,595 24.4 7,937.22 24.5 3 South 7,571 33.1 11,156.46 34.4 4 West 4,599 20.1 6,360.42 19.6
Total 22,895 100.0 32,461.05 100.0
Variable PSTANSI
Label ANSI State Code (physical location of school)
Question Number Frame Variable
Question Wording ANSI State Code (physical location of school)
Category Label Frequency Percent Weighted Frequency
Weighted Percent
01 Alabama 273 1.2 369.95 1.1 02 Alaska 45 0.2 54.15 0.2 04 Arizona 250 1.1 333.34 1.0 05 Arkansas 122 0.5 230.52 0.7 06 California 2,514 11.0 3,339.17 10.3 08 Colorado 281 1.2 406.22 1.3 09 Connecticut 261 1.1 365.69 1.1 10 Delaware 88 0.4 161.90 0.5 11 District of Columbia 47 0.2 58.06 0.2 12 Florida 1,851 8.1 2,868.68 8.8 13 Georgia 595 2.6 840.75 2.6 15 Hawaii 108 0.5 132.19 0.4 16 Idaho 119 0.5 278.88 0.9 17 Illinois 1,041 4.6 1,351.64 4.2 18 Indiana 618 2.7 907.07 2.8
Appendix C. 2017–18 Private School Universe Survey Public-Use Codebook C-57

2017‐18 Private School Survey (PSS) Codebook ‐ Public‐Use Data File
19 Iowa 188 0.8 318.49 1.0 20 Kansas 172 0.8 203.38 0.6 21 Kentucky 269 1.2 424.75 1.3 22 Louisiana 326 1.4 533.80 1.6 23 Maine 118 0.5 139.49 0.4 24 Maryland 563 2.5 753.82 2.3 25 Massachusetts 517 2.3 660.73 2.0 26 Michigan 603 2.6 836.70 2.6 27 Minnesota 432 1.9 805.37 2.5 28 Mississippi 165 0.7 201.26 0.6 29 Missouri 508 2.2 777.51 2.4 30 Montana 98 0.4 116.79 0.4 31 Nebraska 180 0.8 271.67 0.8 32 Nevada 112 0.5 138.48 0.4 33 New Hampshire 175 0.8 351.17 1.1 34 New Jersey 781 3.4 1,096.06 3.4 35 New Mexico 120 0.5 349.07 1.1 36 New York 1,334 5.8 1,687.97 5.2 37 North Carolina 522 2.3 644.45 2.0 38 North Dakota 42 0.2 50.22 0.2 39 Ohio 1,021 4.5 1,425.36 4.4 40 Oklahoma 128 0.6 152.13 0.5 41 Oregon 295 1.3 403.49 1.2 42 Pennsylvania 1,777 7.8 2,501.74 7.7 44 Rhode Island 84 0.4 105.07 0.3 45 South Carolina 291 1.3 391.18 1.2 46 South Dakota 66 0.3 76.28 0.2 47 Tennessee 402 1.8 489.70 1.5 48 Texas 1,188 5.2 2,089.78 6.4 49 Utah 123 0.5 151.72 0.5 50 Vermont 83 0.4 99.08 0.3 51 Virginia 639 2.8 823.22 2.5 53 Washington 504 2.2 621.60 1.9 54 West Virginia 102 0.5 122.58 0.4 55 Wisconsin 724 3.2 913.58 2.8 56 Wyoming 30 0.1 35.38 0.1
Total 22,895 100.0 32,461.05 100.0
Variable ULOCALE18
Label Urban‐centric Locale Code
Question Number Created Variable
Question Wording Urban‐cenric community type (based on 2010 Census geography)
Category Label Frequency Percent Weighted Frequency
Weighted Percent
11 City, Large 4,107 17.9 5,617.81 17.3 12 City, Midsize 1,690 7.4 2,164.25 6.7 13 City, Small 1,987 8.7 2,749.12 8.5 21 Suburb, Large 7,651 33.4 10,717.04 33.0 22 Suburb, Midsize 635 2.8 937.32 2.9
C-58 PSS: Public-Use Data File User’s Manual for School Year 2017–18
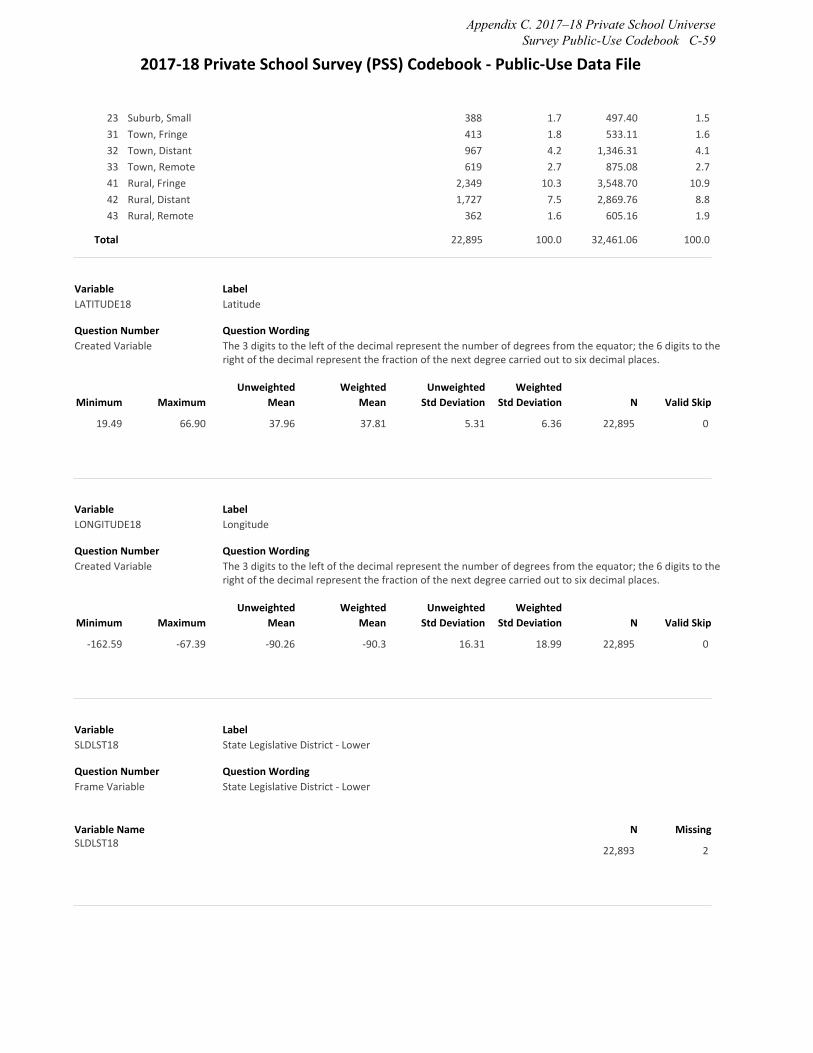
2017‐18 Private School Survey (PSS) Codebook ‐ Public‐Use Data File
23 Suburb, Small 388 1.7 497.40 1.5 31 Town, Fringe 413 1.8 533.11 1.6 32 Town, Distant 967 4.2 1,346.31 4.1 33 Town, Remote 619 2.7 875.08 2.7 41 Rural, Fringe 2,349 10.3 3,548.70 10.9 42 Rural, Distant 1,727 7.5 2,869.76 8.8 43 Rural, Remote 362 1.6 605.16 1.9
Total 22,895 100.0 32,461.06 100.0
Variable LATITUDE18
Label Latitude
Question Number Created Variable
Question Wording The 3 digits to the left of the decimal represent the number of degrees from the equator; the 6 digits to the right of the decimal represent the fraction of the next degree carried out to six decimal places.
Minimum Maximum Unweighted
Mean Weighted
Mean Unweighted
Std Deviation Weighted
Std Deviation N Valid Skip
19.49 66.90 37.96 37.81 5.31 6.36 22,895 0
Variable LONGITUDE18
Label Longitude
Question Number Created Variable
Question Wording The 3 digits to the left of the decimal represent the number of degrees from the equator; the 6 digits to the right of the decimal represent the fraction of the next degree carried out to six decimal places.
Minimum Maximum Unweighted
Mean Weighted
Mean Unweighted
Std Deviation Weighted
Std Deviation N Valid Skip
‐162.59 ‐67.39 ‐90.26 ‐90.3 16.31 18.99 22,895 0
Variable SLDLST18
Label State Legislative District ‐ Lower
Question Number Frame Variable
Question Wording State Legislative District ‐ Lower
Variable Name N Missing SLDLST18
22,893 2
Appendix C. 2017–18 Private School Universe Survey Public-Use Codebook C-59
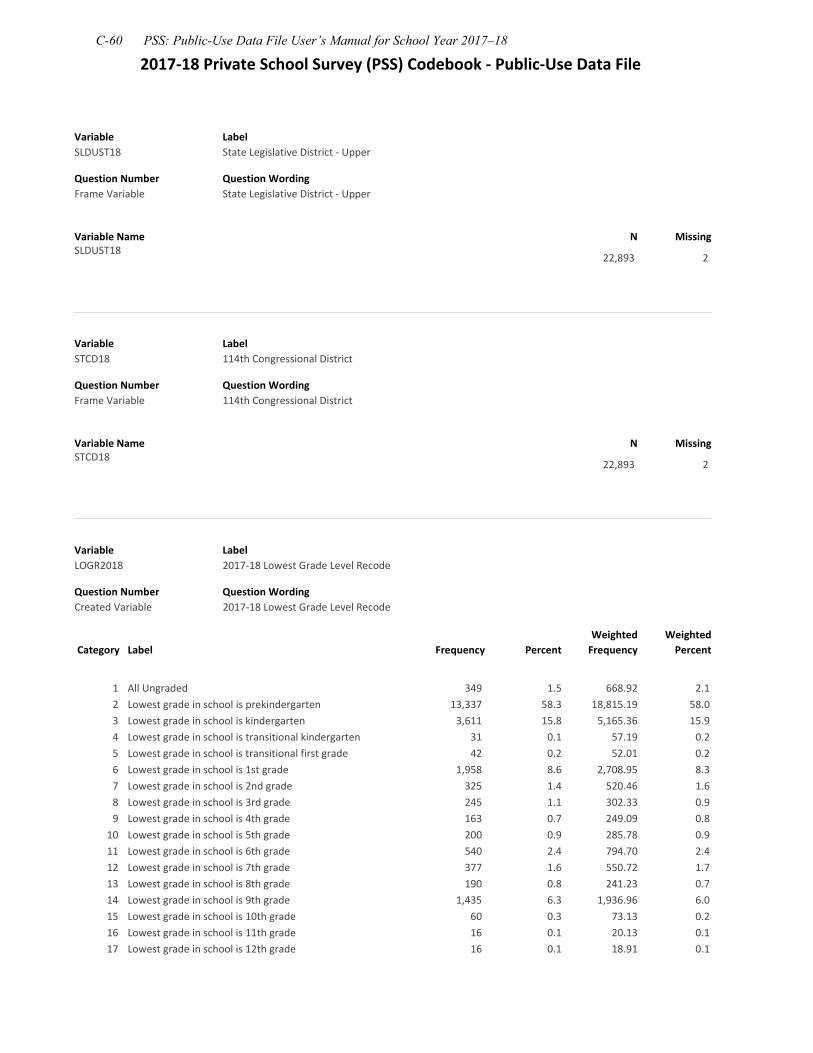
2017‐18 Private School Survey (PSS) Codebook ‐ Public‐Use Data File
Variable SLDUST18
Label State Legislative District ‐ Upper
Question Number Frame Variable
Question Wording State Legislative District ‐ Upper
Variable Name N MissingSLDUST18
22,893 2
Variable STCD18
Label 114th Congressional District
Question Number Frame Variable
Question Wording 114th Congressional District
Variable Name N MissingSTCD18
22,893 2
Variable LOGR2018
Label 2017‐18 Lowest Grade Level Recode
Question Number Created Variable
Question Wording 2017‐18 Lowest Grade Level Recode
Category Label Frequency Percent Weighted Frequency
Weighted Percent
1 All Ungraded 349 1.5 668.92 2.1 2 Lowest grade in school is prekindergarten 13,337 58.3 18,815.19 58.0 3 Lowest grade in school is kindergarten 3,611 15.8 5,165.36 15.9 4 Lowest grade in school is transitional kindergarten 31 0.1 57.19 0.2 5 Lowest grade in school is transitional first grade 42 0.2 52.01 0.2 6 Lowest grade in school is 1st grade 1,958 8.6 2,708.95 8.3 7 Lowest grade in school is 2nd grade 325 1.4 520.46 1.6 8 Lowest grade in school is 3rd grade 245 1.1 302.33 0.9 9 Lowest grade in school is 4th grade 163 0.7 249.09 0.8
10 Lowest grade in school is 5th grade 200 0.9 285.78 0.9 11 Lowest grade in school is 6th grade 540 2.4 794.70 2.4 12 Lowest grade in school is 7th grade 377 1.6 550.72 1.7 13 Lowest grade in school is 8th grade 190 0.8 241.23 0.7 14 Lowest grade in school is 9th grade 1,435 6.3 1,936.96 6.0 15 Lowest grade in school is 10th grade 60 0.3 73.13 0.2 16 Lowest grade in school is 11th grade 16 0.1 20.13 0.1 17 Lowest grade in school is 12th grade 16 0.1 18.91 0.1
C-60 PSS: Public-Use Data File User’s Manual for School Year 2017–18
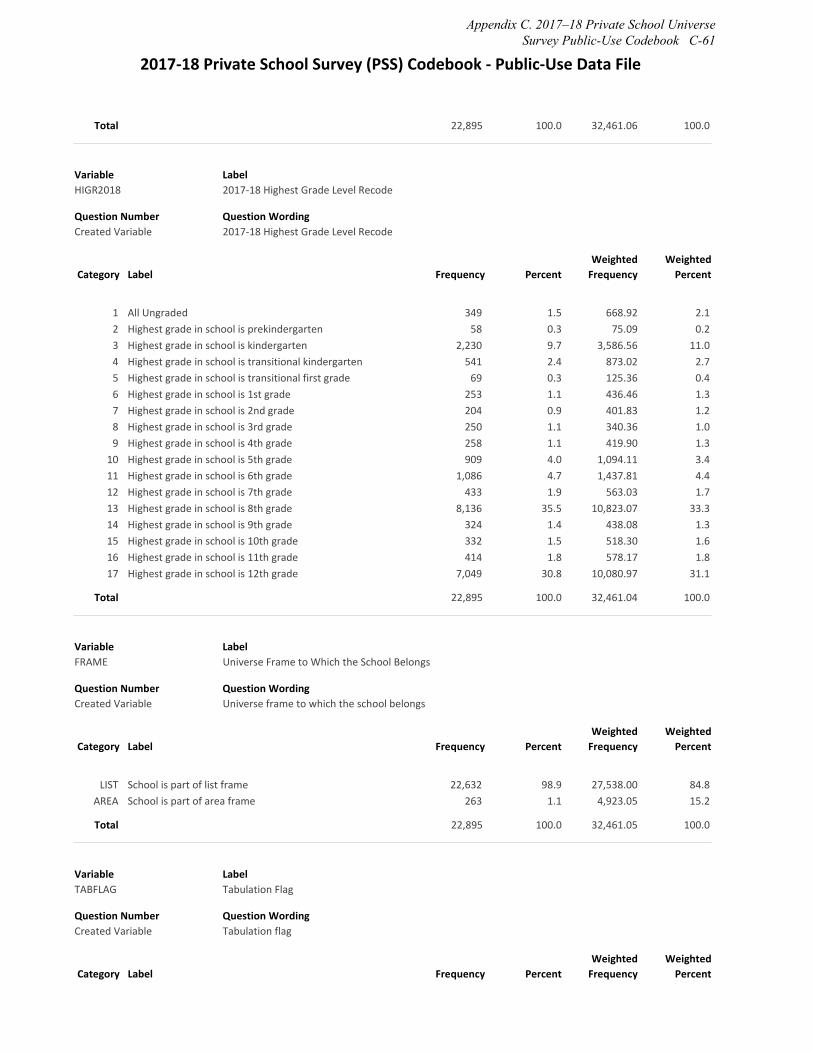
2017‐18 Private School Survey (PSS) Codebook ‐ Public‐Use Data File
Total 22,895 100.0 32,461.06 100.0
Variable HIGR2018
Label 2017‐18 Highest Grade Level Recode
Question Number Created Variable
Question Wording 2017‐18 Highest Grade Level Recode
Category Label Frequency Percent Weighted Frequency
Weighted Percent
1 All Ungraded 349 1.5 668.92 2.1 2 Highest grade in school is prekindergarten 58 0.3 75.09 0.2 3 Highest grade in school is kindergarten 2,230 9.7 3,586.56 11.0 4 Highest grade in school is transitional kindergarten 541 2.4 873.02 2.7 5 Highest grade in school is transitional first grade 69 0.3 125.36 0.4 6 Highest grade in school is 1st grade 253 1.1 436.46 1.3 7 Highest grade in school is 2nd grade 204 0.9 401.83 1.2 8 Highest grade in school is 3rd grade 250 1.1 340.36 1.0 9 Highest grade in school is 4th grade 258 1.1 419.90 1.3
10 Highest grade in school is 5th grade 909 4.0 1,094.11 3.4 11 Highest grade in school is 6th grade 1,086 4.7 1,437.81 4.4 12 Highest grade in school is 7th grade 433 1.9 563.03 1.7 13 Highest grade in school is 8th grade 8,136 35.5 10,823.07 33.3 14 Highest grade in school is 9th grade 324 1.4 438.08 1.3 15 Highest grade in school is 10th grade 332 1.5 518.30 1.6 16 Highest grade in school is 11th grade 414 1.8 578.17 1.8 17 Highest grade in school is 12th grade 7,049 30.8 10,080.97 31.1
Total 22,895 100.0 32,461.04 100.0
Variable FRAME
Label Universe Frame to Which the School Belongs
Question Number Created Variable
Question Wording Universe frame to which the school belongs
Category Label Frequency Percent Weighted Frequency
Weighted Percent
LIST School is part of list frame 22,632 98.9 27,538.00 84.8 AREA School is part of area frame 263 1.1 4,923.05 15.2
Total 22,895 100.0 32,461.05 100.0
Variable TABFLAG
Label Tabulation Flag
Question Number Created Variable
Question Wording Tabulation flag
Category Label Frequency Percent Weighted Frequency
Weighted Percent
Appendix C. 2017–18 Private School Universe Survey Public-Use Codebook C-61
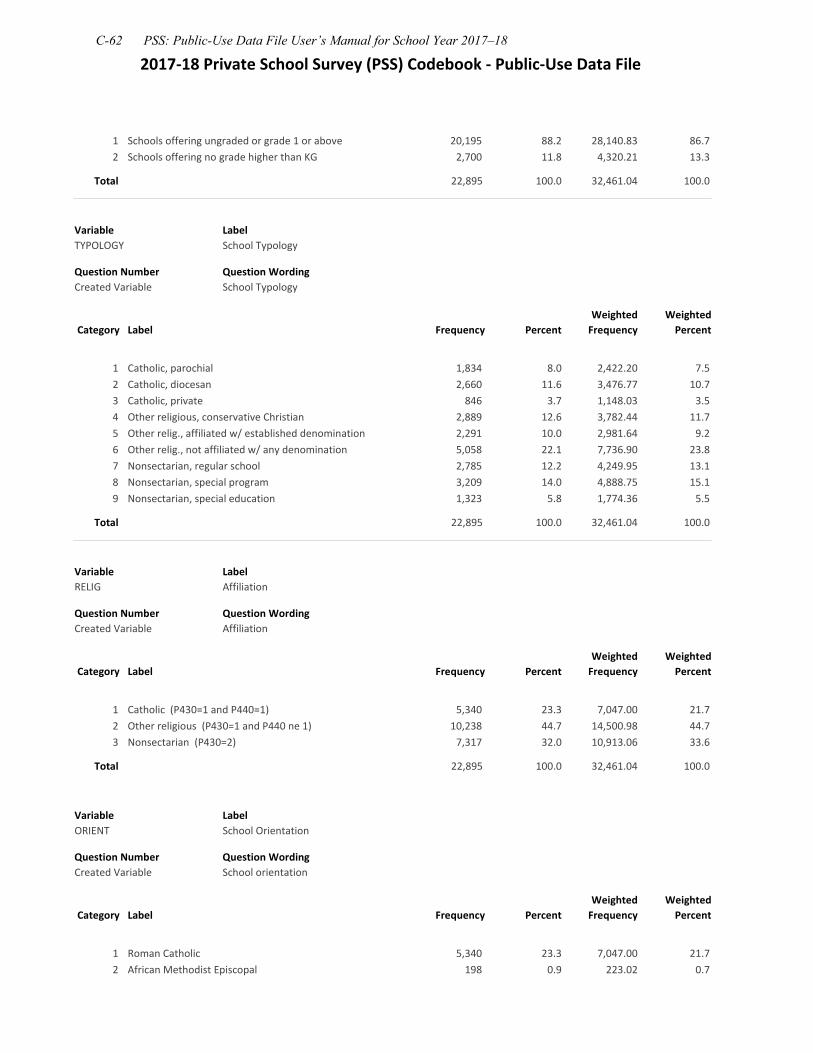
2017‐18 Private School Survey (PSS) Codebook ‐ Public‐Use Data File
1 Schools offering ungraded or grade 1 or above 20,195 88.2 28,140.83 86.7 2 Schools offering no grade higher than KG 2,700 11.8 4,320.21 13.3
Total 22,895 100.0 32,461.04 100.0
Variable TYPOLOGY
Label School Typology
Question Number Created Variable
Question Wording School Typology
Category Label Frequency Percent Weighted Frequency
Weighted Percent
1 Catholic, parochial 1,834 8.0 2,422.20 7.5 2 Catholic, diocesan 2,660 11.6 3,476.77 10.7 3 Catholic, private 846 3.7 1,148.03 3.5 4 Other religious, conservative Christian 2,889 12.6 3,782.44 11.7 5 Other relig., affiliated w/ established denomination 2,291 10.0 2,981.64 9.2 6 Other relig., not affiliated w/ any denomination 5,058 22.1 7,736.90 23.8 7 Nonsectarian, regular school 2,785 12.2 4,249.95 13.1 8 Nonsectarian, special program 3,209 14.0 4,888.75 15.1 9 Nonsectarian, special education 1,323 5.8 1,774.36 5.5
Total 22,895 100.0 32,461.04 100.0
Variable RELIG
Label Affiliation
Question Number Created Variable
Question Wording Affiliation
Category Label Frequency Percent Weighted Frequency
Weighted Percent
1 Catholic (P430=1 and P440=1) 5,340 23.3 7,047.00 21.7 2 Other religious (P430=1 and P440 ne 1) 10,238 44.7 14,500.98 44.7 3 Nonsectarian (P430=2) 7,317 32.0 10,913.06 33.6
Total 22,895 100.0 32,461.04 100.0
Variable ORIENT
Label School Orientation
Question Number Created Variable
Question Wording School orientation
Category Label Frequency Percent Weighted Frequency
Weighted Percent
1 Roman Catholic 5,340 23.3 7,047.00 21.7 2 African Methodist Episcopal 198 0.9 223.02 0.7
C-62 PSS: Public-Use Data File User’s Manual for School Year 2017–18
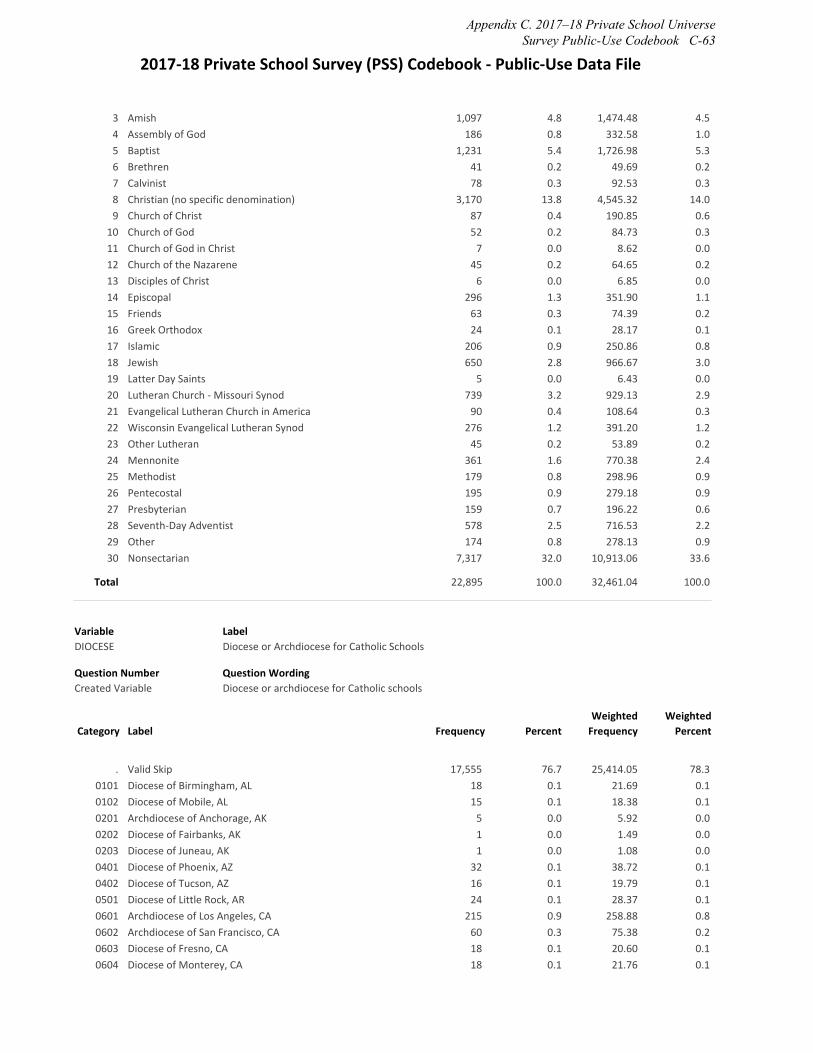
2017‐18 Private School Survey (PSS) Codebook ‐ Public‐Use Data File
3 Amish 1,097 4.8 1,474.48 4.5 4 Assembly of God 186 0.8 332.58 1.0 5 Baptist 1,231 5.4 1,726.98 5.3 6 Brethren 41 0.2 49.69 0.2 7 Calvinist 78 0.3 92.53 0.3 8 Christian (no specific denomination) 3,170 13.8 4,545.32 14.0 9 Church of Christ 87 0.4 190.85 0.6
10 Church of God 52 0.2 84.73 0.3 11 Church of God in Christ 7 0.0 8.62 0.0 12 Church of the Nazarene 45 0.2 64.65 0.2 13 Disciples of Christ 6 0.0 6.85 0.0 14 Episcopal 296 1.3 351.90 1.1 15 Friends 63 0.3 74.39 0.2 16 Greek Orthodox 24 0.1 28.17 0.1 17 Islamic 206 0.9 250.86 0.8 18 Jewish 650 2.8 966.67 3.0 19 Latter Day Saints 5 0.0 6.43 0.0 20 Lutheran Church ‐ Missouri Synod 739 3.2 929.13 2.9 21 Evangelical Lutheran Church in America 90 0.4 108.64 0.3 22 Wisconsin Evangelical Lutheran Synod 276 1.2 391.20 1.2 23 Other Lutheran 45 0.2 53.89 0.2 24 Mennonite 361 1.6 770.38 2.4 25 Methodist 179 0.8 298.96 0.9 26 Pentecostal 195 0.9 279.18 0.9 27 Presbyterian 159 0.7 196.22 0.6 28 Seventh‐Day Adventist 578 2.5 716.53 2.2 29 Other 174 0.8 278.13 0.9 30 Nonsectarian 7,317 32.0 10,913.06 33.6
Total 22,895 100.0 32,461.04 100.0
Variable DIOCESE
Label Diocese or Archdiocese for Catholic Schools
Question Number Created Variable
Question Wording Diocese or archdiocese for Catholic schools
Category Label Frequency Percent Weighted Frequency
Weighted Percent
. Valid Skip 17,555 76.7 25,414.05 78.3 0101 Diocese of Birmingham, AL 18 0.1 21.69 0.1 0102 Diocese of Mobile, AL 15 0.1 18.38 0.1 0201 Archdiocese of Anchorage, AK 5 0.0 5.92 0.0 0202 Diocese of Fairbanks, AK 1 0.0 1.49 0.0 0203 Diocese of Juneau, AK 1 0.0 1.08 0.0 0401 Diocese of Phoenix, AZ 32 0.1 38.72 0.1 0402 Diocese of Tucson, AZ 16 0.1 19.79 0.1 0501 Diocese of Little Rock, AR 24 0.1 28.37 0.1 0601 Archdiocese of Los Angeles, CA 215 0.9 258.88 0.8 0602 Archdiocese of San Francisco, CA 60 0.3 75.38 0.2 0603 Diocese of Fresno, CA 18 0.1 20.60 0.1 0604 Diocese of Monterey, CA 18 0.1 21.76 0.1
Appendix C. 2017–18 Private School Universe Survey Public-Use Codebook C-63
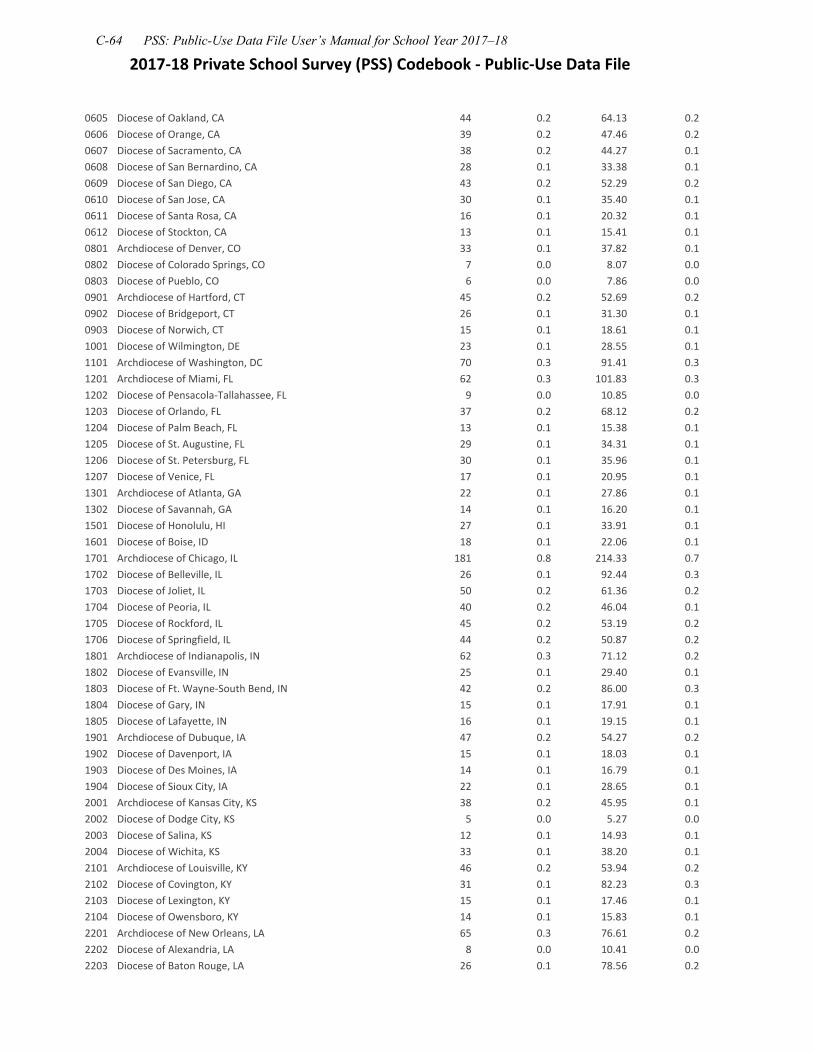
2017‐18 Private School Survey (PSS) Codebook ‐ Public‐Use Data File
0605 Diocese of Oakland, CA 44 0.2 64.13 0.2 0606 Diocese of Orange, CA 39 0.2 47.46 0.2 0607 Diocese of Sacramento, CA 38 0.2 44.27 0.1 0608 Diocese of San Bernardino, CA 28 0.1 33.38 0.1 0609 Diocese of San Diego, CA 43 0.2 52.29 0.2 0610 Diocese of San Jose, CA 30 0.1 35.40 0.1 0611 Diocese of Santa Rosa, CA 16 0.1 20.32 0.1 0612 Diocese of Stockton, CA 13 0.1 15.41 0.1 0801 Archdiocese of Denver, CO 33 0.1 37.82 0.1 0802 Diocese of Colorado Springs, CO 7 0.0 8.07 0.0 0803 Diocese of Pueblo, CO 6 0.0 7.86 0.0 0901 Archdiocese of Hartford, CT 45 0.2 52.69 0.2 0902 Diocese of Bridgeport, CT 26 0.1 31.30 0.1 0903 Diocese of Norwich, CT 15 0.1 18.61 0.1 1001 Diocese of Wilmington, DE 23 0.1 28.55 0.1 1101 Archdiocese of Washington, DC 70 0.3 91.41 0.3 1201 Archdiocese of Miami, FL 62 0.3 101.83 0.3 1202 Diocese of Pensacola‐Tallahassee, FL 9 0.0 10.85 0.0 1203 Diocese of Orlando, FL 37 0.2 68.12 0.2 1204 Diocese of Palm Beach, FL 13 0.1 15.38 0.1 1205 Diocese of St. Augustine, FL 29 0.1 34.31 0.1 1206 Diocese of St. Petersburg, FL 30 0.1 35.96 0.1 1207 Diocese of Venice, FL 17 0.1 20.95 0.1 1301 Archdiocese of Atlanta, GA 22 0.1 27.86 0.1 1302 Diocese of Savannah, GA 14 0.1 16.20 0.1 1501 Diocese of Honolulu, HI 27 0.1 33.91 0.1 1601 Diocese of Boise, ID 18 0.1 22.06 0.1 1701 Archdiocese of Chicago, IL 181 0.8 214.33 0.7 1702 Diocese of Belleville, IL 26 0.1 92.44 0.3 1703 Diocese of Joliet, IL 50 0.2 61.36 0.2 1704 Diocese of Peoria, IL 40 0.2 46.04 0.1 1705 Diocese of Rockford, IL 45 0.2 53.19 0.2 1706 Diocese of Springfield, IL 44 0.2 50.87 0.2 1801 Archdiocese of Indianapolis, IN 62 0.3 71.12 0.2 1802 Diocese of Evansville, IN 25 0.1 29.40 0.1 1803 Diocese of Ft. Wayne‐South Bend, IN 42 0.2 86.00 0.3 1804 Diocese of Gary, IN 15 0.1 17.91 0.1 1805 Diocese of Lafayette, IN 16 0.1 19.15 0.1 1901 Archdiocese of Dubuque, IA 47 0.2 54.27 0.2 1902 Diocese of Davenport, IA 15 0.1 18.03 0.1 1903 Diocese of Des Moines, IA 14 0.1 16.79 0.1 1904 Diocese of Sioux City, IA 22 0.1 28.65 0.1 2001 Archdiocese of Kansas City, KS 38 0.2 45.95 0.1 2002 Diocese of Dodge City, KS 5 0.0 5.27 0.0 2003 Diocese of Salina, KS 12 0.1 14.93 0.1 2004 Diocese of Wichita, KS 33 0.1 38.20 0.1 2101 Archdiocese of Louisville, KY 46 0.2 53.94 0.2 2102 Diocese of Covington, KY 31 0.1 82.23 0.3 2103 Diocese of Lexington, KY 15 0.1 17.46 0.1 2104 Diocese of Owensboro, KY 14 0.1 15.83 0.1 2201 Archdiocese of New Orleans, LA 65 0.3 76.61 0.2 2202 Diocese of Alexandria, LA 8 0.0 10.41 0.0 2203 Diocese of Baton Rouge, LA 26 0.1 78.56 0.2
C-64 PSS: Public-Use Data File User’s Manual for School Year 2017–18
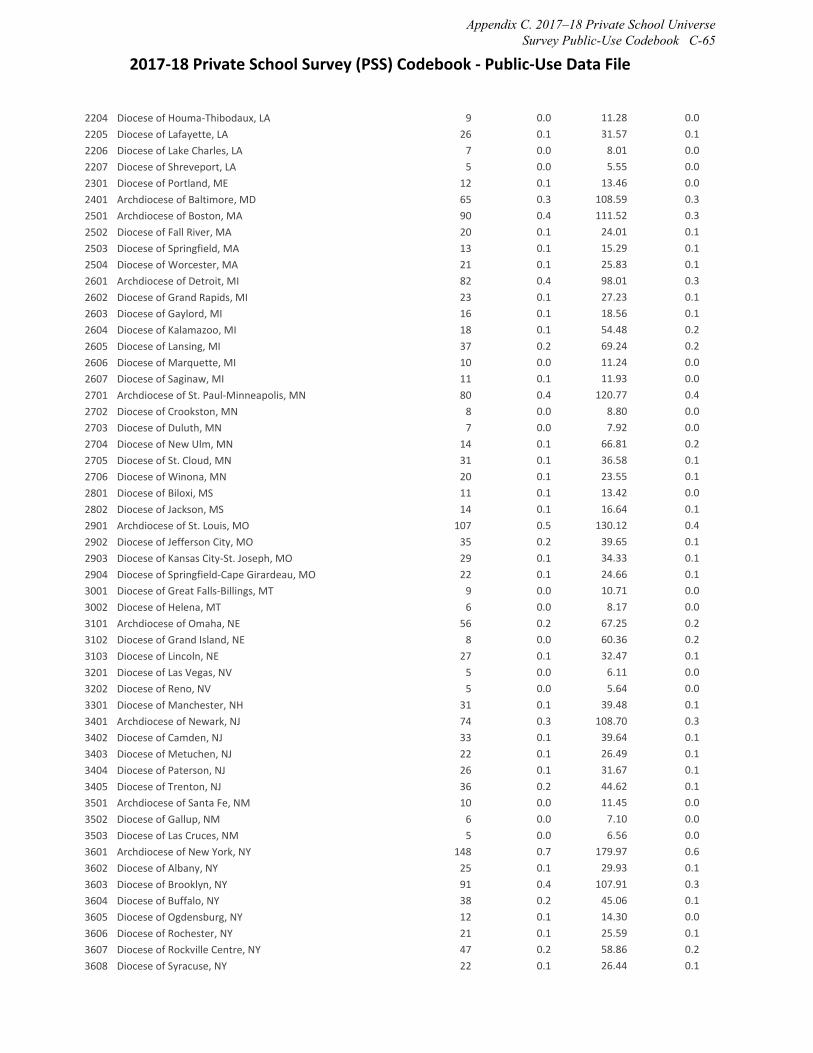
2017‐18 Private School Survey (PSS) Codebook ‐ Public‐Use Data File
2204 Diocese of Houma‐Thibodaux, LA 9 0.0 11.28 0.0 2205 Diocese of Lafayette, LA 26 0.1 31.57 0.1 2206 Diocese of Lake Charles, LA 7 0.0 8.01 0.0 2207 Diocese of Shreveport, LA 5 0.0 5.55 0.0 2301 Diocese of Portland, ME 12 0.1 13.46 0.0 2401 Archdiocese of Baltimore, MD 65 0.3 108.59 0.3 2501 Archdiocese of Boston, MA 90 0.4 111.52 0.3 2502 Diocese of Fall River, MA 20 0.1 24.01 0.1 2503 Diocese of Springfield, MA 13 0.1 15.29 0.1 2504 Diocese of Worcester, MA 21 0.1 25.83 0.1 2601 Archdiocese of Detroit, MI 82 0.4 98.01 0.3 2602 Diocese of Grand Rapids, MI 23 0.1 27.23 0.1 2603 Diocese of Gaylord, MI 16 0.1 18.56 0.1 2604 Diocese of Kalamazoo, MI 18 0.1 54.48 0.2 2605 Diocese of Lansing, MI 37 0.2 69.24 0.2 2606 Diocese of Marquette, MI 10 0.0 11.24 0.0 2607 Diocese of Saginaw, MI 11 0.1 11.93 0.0 2701 Archdiocese of St. Paul‐Minneapolis, MN 80 0.4 120.77 0.4 2702 Diocese of Crookston, MN 8 0.0 8.80 0.0 2703 Diocese of Duluth, MN 7 0.0 7.92 0.0 2704 Diocese of New Ulm, MN 14 0.1 66.81 0.2 2705 Diocese of St. Cloud, MN 31 0.1 36.58 0.1 2706 Diocese of Winona, MN 20 0.1 23.55 0.1 2801 Diocese of Biloxi, MS 11 0.1 13.42 0.0 2802 Diocese of Jackson, MS 14 0.1 16.64 0.1 2901 Archdiocese of St. Louis, MO 107 0.5 130.12 0.4 2902 Diocese of Jefferson City, MO 35 0.2 39.65 0.1 2903 Diocese of Kansas City‐St. Joseph, MO 29 0.1 34.33 0.1 2904 Diocese of Springfield‐Cape Girardeau, MO 22 0.1 24.66 0.1 3001 Diocese of Great Falls‐Billings, MT 9 0.0 10.71 0.0 3002 Diocese of Helena, MT 6 0.0 8.17 0.0 3101 Archdiocese of Omaha, NE 56 0.2 67.25 0.2 3102 Diocese of Grand Island, NE 8 0.0 60.36 0.2 3103 Diocese of Lincoln, NE 27 0.1 32.47 0.1 3201 Diocese of Las Vegas, NV 5 0.0 6.11 0.0 3202 Diocese of Reno, NV 5 0.0 5.64 0.0 3301 Diocese of Manchester, NH 31 0.1 39.48 0.1
3401 Archdiocese of Newark, NJ 74 0.3 108.70 0.3 3402 Diocese of Camden, NJ 33 0.1 39.64 0.1 3403 Diocese of Metuchen, NJ 22 0.1 26.49 0.1 3404 Diocese of Paterson, NJ 26 0.1 31.67 0.1 3405 Diocese of Trenton, NJ 36 0.2 44.62 0.1 3501 Archdiocese of Santa Fe, NM 10 0.0 11.45 0.0 3502 Diocese of Gallup, NM 6 0.0 7.10 0.0 3503 Diocese of Las Cruces, NM 5 0.0 6.56 0.0 3601 Archdiocese of New York, NY 148 0.7 179.97 0.6 3602 Diocese of Albany, NY 25 0.1 29.93 0.1 3603 Diocese of Brooklyn, NY 91 0.4 107.91 0.3 3604 Diocese of Buffalo, NY 38 0.2 45.06 0.1 3605 Diocese of Ogdensburg, NY 12 0.1 14.30 0.0 3606 Diocese of Rochester, NY 21 0.1 25.59 0.1 3607 Diocese of Rockville Centre, NY 47 0.2 58.86 0.2 3608 Diocese of Syracuse, NY 22 0.1 26.44 0.1
Appendix C. 2017–18 Private School Universe Survey Public-Use Codebook C-65
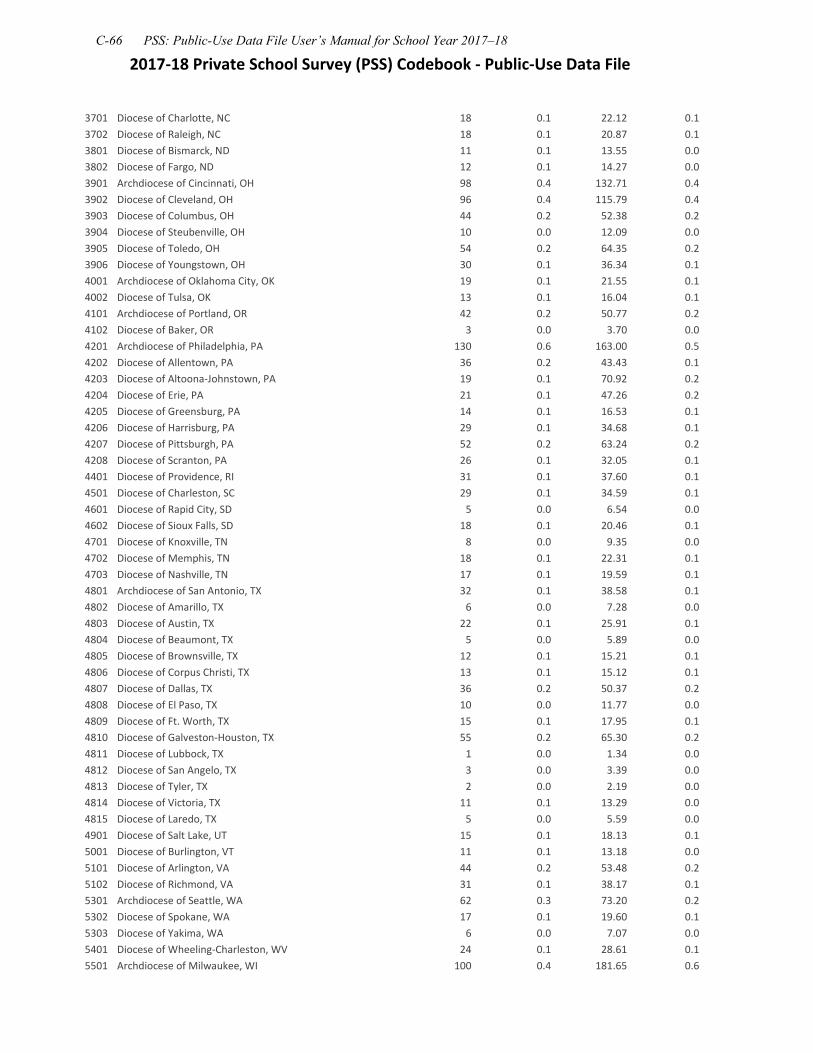
2017‐18 Private School Survey (PSS) Codebook ‐ Public‐Use Data File
3701 Diocese of Charlotte, NC 18 0.1 22.12 0.1 3702 Diocese of Raleigh, NC 18 0.1 20.87 0.1 3801 Diocese of Bismarck, ND 11 0.1 13.55 0.0 3802 Diocese of Fargo, ND 12 0.1 14.27 0.0 3901 Archdiocese of Cincinnati, OH 98 0.4 132.71 0.4 3902 Diocese of Cleveland, OH 96 0.4 115.79 0.4 3903 Diocese of Columbus, OH 44 0.2 52.38 0.2 3904 Diocese of Steubenville, OH 10 0.0 12.09 0.0 3905 Diocese of Toledo, OH 54 0.2 64.35 0.2 3906 Diocese of Youngstown, OH 30 0.1 36.34 0.1 4001 Archdiocese of Oklahoma City, OK 19 0.1 21.55 0.1 4002 Diocese of Tulsa, OK 13 0.1 16.04 0.1 4101 Archdiocese of Portland, OR 42 0.2 50.77 0.2 4102 Diocese of Baker, OR 3 0.0 3.70 0.0 4201 Archdiocese of Philadelphia, PA 130 0.6 163.00 0.5 4202 Diocese of Allentown, PA 36 0.2 43.43 0.1 4203 Diocese of Altoona‐Johnstown, PA 19 0.1 70.92 0.2 4204 Diocese of Erie, PA 21 0.1 47.26 0.2 4205 Diocese of Greensburg, PA 14 0.1 16.53 0.1 4206 Diocese of Harrisburg, PA 29 0.1 34.68 0.1 4207 Diocese of Pittsburgh, PA 52 0.2 63.24 0.2 4208 Diocese of Scranton, PA 26 0.1 32.05 0.1 4401 Diocese of Providence, RI 31 0.1 37.60 0.1 4501 Diocese of Charleston, SC 29 0.1 34.59 0.1 4601 Diocese of Rapid City, SD 5 0.0 6.54 0.0 4602 Diocese of Sioux Falls, SD 18 0.1 20.46 0.1 4701 Diocese of Knoxville, TN 8 0.0 9.35 0.0 4702 Diocese of Memphis, TN 18 0.1 22.31 0.1 4703 Diocese of Nashville, TN 17 0.1 19.59 0.1 4801 Archdiocese of San Antonio, TX 32 0.1 38.58 0.1 4802 Diocese of Amarillo, TX 6 0.0 7.28 0.0 4803 Diocese of Austin, TX 22 0.1 25.91 0.1 4804 Diocese of Beaumont, TX 5 0.0 5.89 0.0 4805 Diocese of Brownsville, TX 12 0.1 15.21 0.1 4806 Diocese of Corpus Christi, TX 13 0.1 15.12 0.1 4807 Diocese of Dallas, TX 36 0.2 50.37 0.2 4808 Diocese of El Paso, TX 10 0.0 11.77 0.0 4809 Diocese of Ft. Worth, TX 15 0.1 17.95 0.1 4810 Diocese of Galveston‐Houston, TX 55 0.2 65.30 0.2 4811 Diocese of Lubbock, TX 1 0.0 1.34 0.0 4812 Diocese of San Angelo, TX 3 0.0 3.39 0.0 4813 Diocese of Tyler, TX 2 0.0 2.19 0.0 4814 Diocese of Victoria, TX 11 0.1 13.29 0.0 4815 Diocese of Laredo, TX 5 0.0 5.59 0.0 4901 Diocese of Salt Lake, UT 15 0.1 18.13 0.1 5001 Diocese of Burlington, VT 11 0.1 13.18 0.0 5101 Diocese of Arlington, VA 44 0.2 53.48 0.2 5102 Diocese of Richmond, VA 31 0.1 38.17 0.1 5301 Archdiocese of Seattle, WA 62 0.3 73.20 0.2 5302 Diocese of Spokane, WA 17 0.1 19.60 0.1 5303 Diocese of Yakima, WA 6 0.0 7.07 0.0 5401 Diocese of Wheeling‐Charleston, WV 24 0.1 28.61 0.1 5501 Archdiocese of Milwaukee, WI 100 0.4 181.65 0.6
C-66 PSS: Public-Use Data File User’s Manual for School Year 2017–18
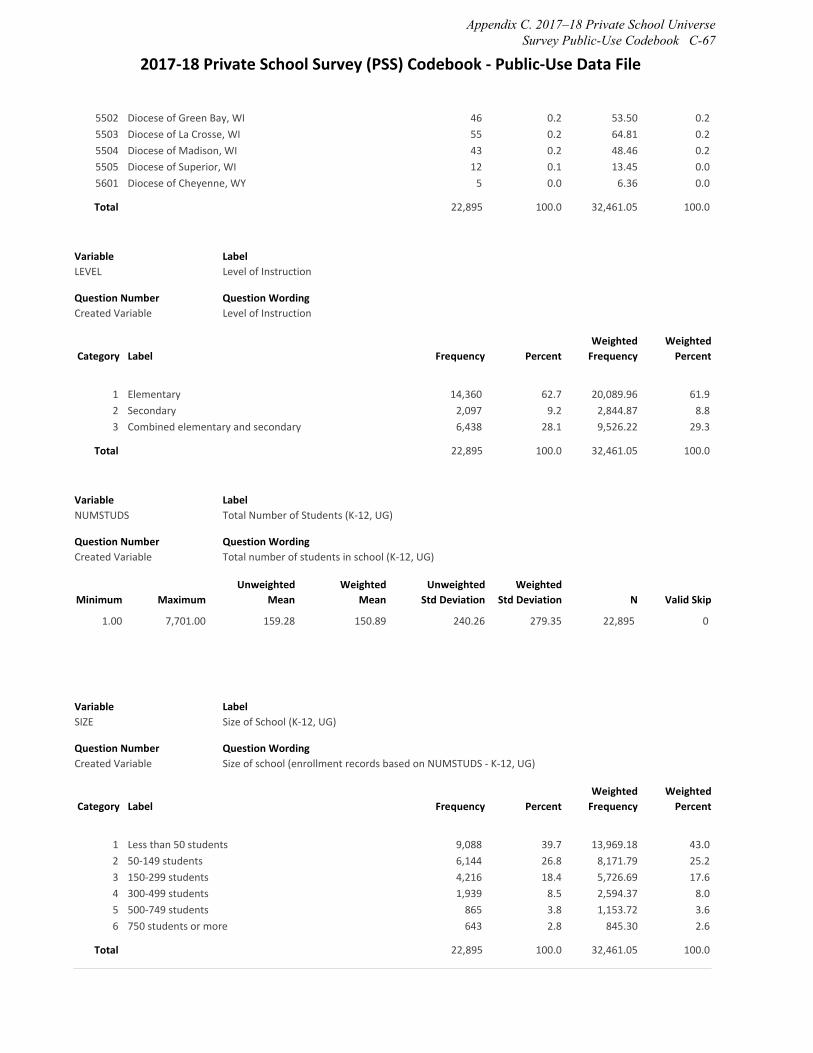
2017‐18 Private School Survey (PSS) Codebook ‐ Public‐Use Data File
5502 Diocese of Green Bay, WI 46 0.2 53.50 0.2 5503 Diocese of La Crosse, WI 55 0.2 64.81 0.2 5504 Diocese of Madison, WI 43 0.2 48.46 0.2 5505 Diocese of Superior, WI 12 0.1 13.45 0.0 5601 Diocese of Cheyenne, WY 5 0.0 6.36 0.0
Total 22,895 100.0 32,461.05 100.0
Variable LEVEL
Label Level of Instruction
Question Number Created Variable
Question Wording Level of Instruction
Category Label Frequency Percent Weighted Frequency
Weighted Percent
1 Elementary 14,360 62.7 20,089.96 61.9 2 Secondary 2,097 9.2 2,844.87 8.8 3 Combined elementary and secondary 6,438 28.1 9,526.22 29.3
Total 22,895 100.0 32,461.05 100.0
Variable NUMSTUDS
Label Total Number of Students (K‐12, UG)
Question Number Created Variable
Question Wording Total number of students in school (K‐12, UG)
Minimum Maximum Unweighted
Mean Weighted
Mean Unweighted
Std Deviation Weighted
Std Deviation N Valid Skip
1.00 7,701.00 159.28 150.89 240.26 279.35 22,895 0
Variable SIZE
Label Size of School (K‐12, UG)
Question Number Created Variable
Question Wording Size of school (enrollment records based on NUMSTUDS ‐ K‐12, UG)
Category Label Frequency Percent Weighted Frequency
Weighted Percent
1 Less than 50 students 9,088 39.7 13,969.18 43.0 2 50‐149 students 6,144 26.8 8,171.79 25.2 3 150‐299 students 4,216 18.4 5,726.69 17.6 4 300‐499 students 1,939 8.5 2,594.37 8.0 5 500‐749 students 865 3.8 1,153.72 3.6 6 750 students or more 643 2.8 845.30 2.6
Total 22,895 100.0 32,461.05 100.0
Appendix C. 2017–18 Private School Universe Survey Public-Use Codebook C-67
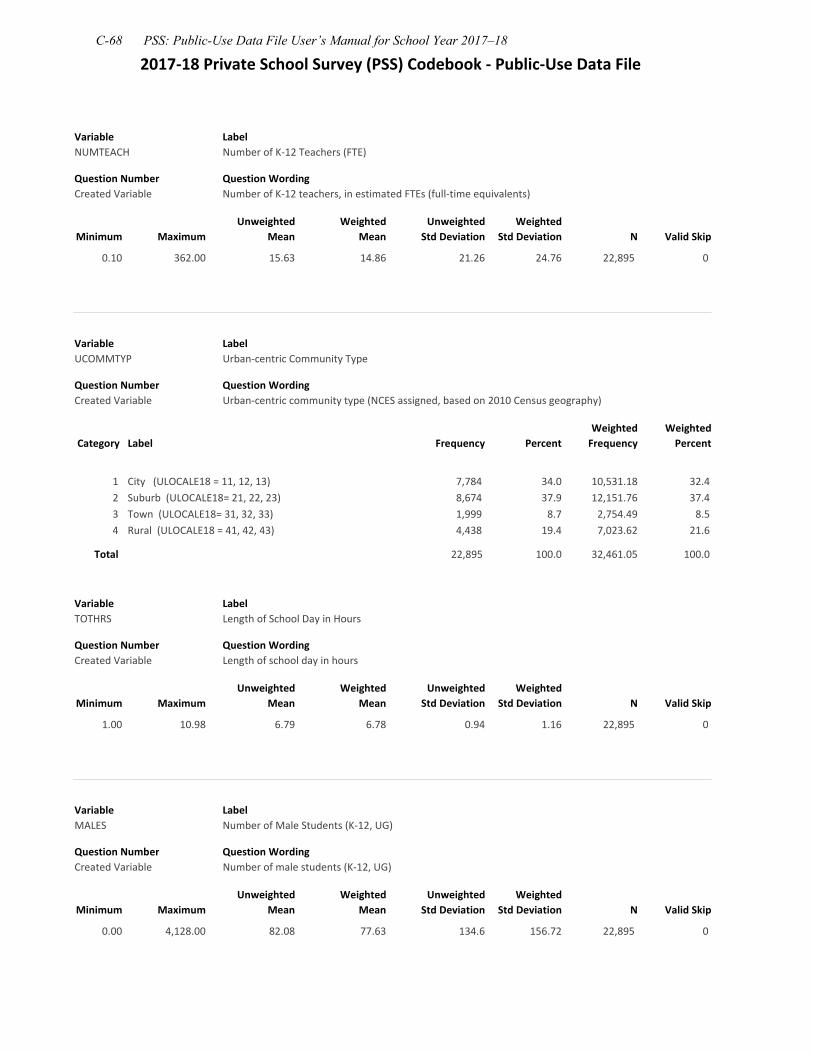
2017‐18 Private School Survey (PSS) Codebook ‐ Public‐Use Data File
Variable NUMTEACH
Label Number of K‐12 Teachers (FTE)
Question Number Created Variable
Question Wording Number of K‐12 teachers, in estimated FTEs (full‐time equivalents)
Minimum Maximum Unweighted
Mean Weighted
Mean Unweighted
Std Deviation Weighted
Std Deviation N Valid Skip
0.10 362.00 15.63 14.86 21.26 24.76 22,895 0
Variable UCOMMTYP
Label Urban‐centric Community Type
Question Number Created Variable
Question Wording Urban‐centric community type (NCES assigned, based on 2010 Census geography)
Category Label Frequency Percent Weighted Frequency
Weighted Percent
1 City (ULOCALE18 = 11, 12, 13) 7,784 34.0 10,531.18 32.4 2 Suburb (ULOCALE18= 21, 22, 23) 8,674 37.9 12,151.76 37.4 3 Town (ULOCALE18= 31, 32, 33) 1,999 8.7 2,754.49 8.5 4 Rural (ULOCALE18 = 41, 42, 43) 4,438 19.4 7,023.62 21.6
Total 22,895 100.0 32,461.05 100.0
Variable TOTHRS
Label Length of School Day in Hours
Question Number Created Variable
Question Wording Length of school day in hours
Minimum Maximum Unweighted
Mean Weighted
Mean Unweighted
Std Deviation Weighted
Std Deviation N Valid Skip
1.00 10.98 6.79 6.78 0.94 1.16 22,895 0
Variable MALES
Label Number of Male Students (K‐12, UG)
Question Number Created Variable
Question Wording Number of male students (K‐12, UG)
Minimum Maximum Unweighted
Mean Weighted
Mean Unweighted
Std Deviation Weighted
Std Deviation N Valid Skip
0.00 4,128.00 82.08 77.63 134.6 156.72 22,895 0
C-68 PSS: Public-Use Data File User’s Manual for School Year 2017–18
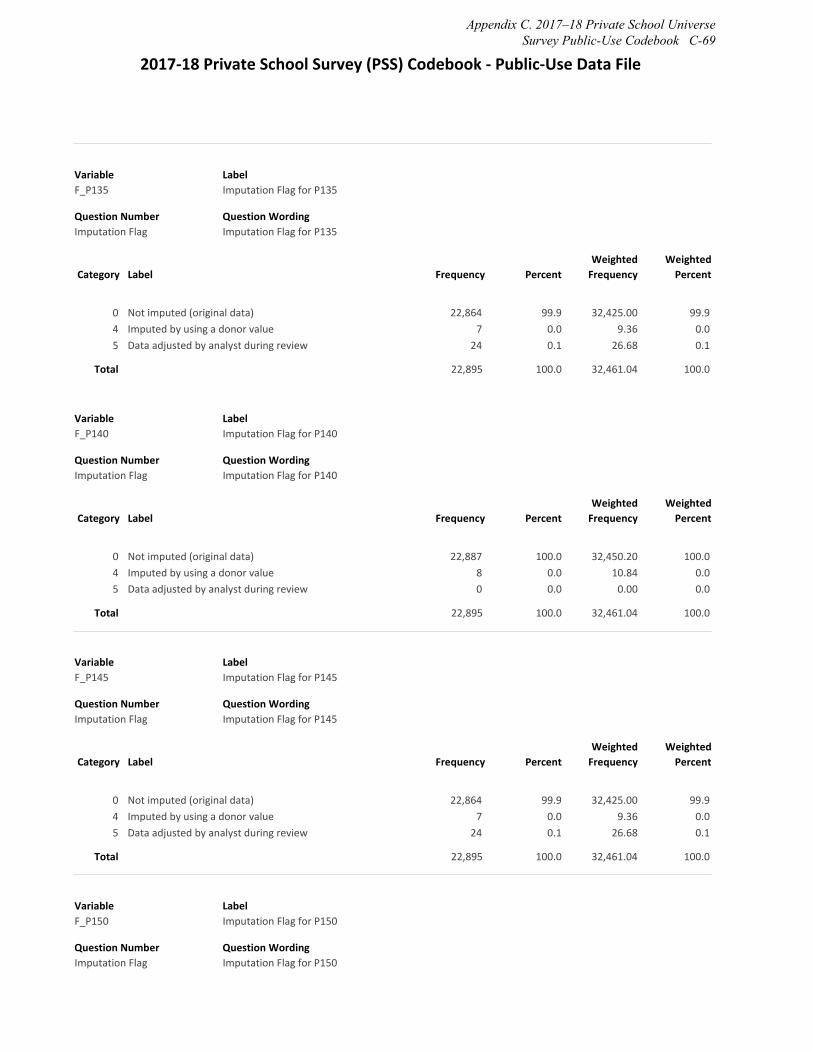
2017‐18 Private School Survey (PSS) Codebook ‐ Public‐Use Data File
Variable F_P135
Label Imputation Flag for P135
Question Number Imputation Flag
Question Wording Imputation Flag for P135
Category Label Frequency Percent Weighted Frequency
Weighted Percent
0 Not imputed (original data) 22,864 99.9 32,425.00 99.9 4 Imputed by using a donor value 7 0.0 9.36 0.0
5 Data adjusted by analyst during review 24 0.1 26.68 0.1
Total 22,895 100.0 32,461.04 100.0
Variable F_P140
Label Imputation Flag for P140
Question Number Imputation Flag
Question Wording Imputation Flag for P140
Category Label Frequency Percent Weighted Frequency
Weighted Percent
0 Not imputed (original data) 22,887 100.0 32,450.20 100.0 4 Imputed by using a donor value 8 0.0 10.84 0.0 5 Data adjusted by analyst during review 0 0.0 0.00 0.0
Total 22,895 100.0 32,461.04 100.0
Variable F_P145
Label Imputation Flag for P145
Question Number Imputation Flag
Question Wording Imputation Flag for P145
Category Label Frequency Percent Weighted Frequency
Weighted Percent
0 Not imputed (original data) 22,864 99.9 32,425.00 99.9 4 Imputed by using a donor value 7 0.0 9.36 0.0
5 Data adjusted by analyst during review 24 0.1 26.68 0.1
Total 22,895 100.0 32,461.04 100.0
Variable F_P150
Label Imputation Flag for P150
Question Number Imputation Flag
Question Wording Imputation Flag for P150
Appendix C. 2017–18 Private School Universe Survey Public-Use Codebook C-69
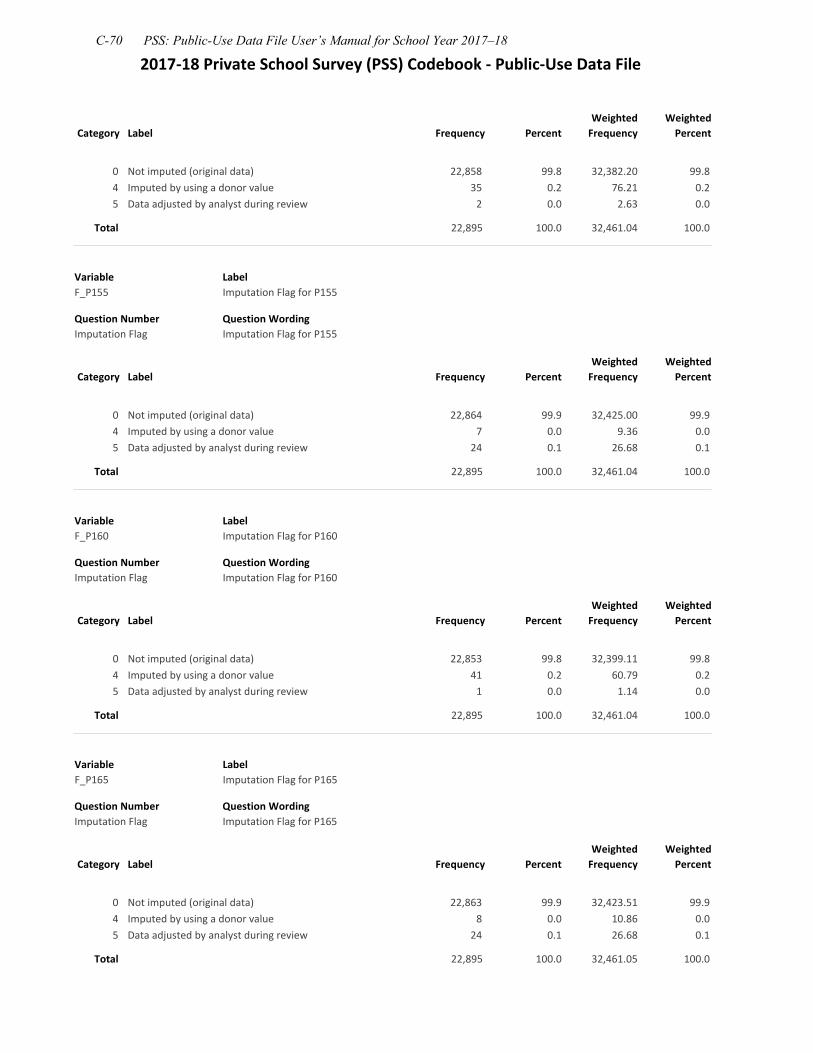
2017‐18 Private School Survey (PSS) Codebook ‐ Public‐Use Data File
Category Label Frequency Percent Weighted Frequency
Weighted Percent
0 Not imputed (original data) 22,858 99.8 32,382.20 99.8 4 Imputed by using a donor value 35 0.2 76.21 0.2 5 Data adjusted by analyst during review 2 0.0 2.63 0.0
Total 22,895 100.0 32,461.04 100.0
Variable F_P155
Label Imputation Flag for P155
Question Number Imputation Flag
Question Wording Imputation Flag for P155
Category Label Frequency Percent Weighted Frequency
Weighted Percent
0 Not imputed (original data) 22,864 99.9 32,425.00 99.9 4 Imputed by using a donor value 7 0.0 9.36 0.0
5 Data adjusted by analyst during review 24 0.1 26.68 0.1
Total 22,895 100.0 32,461.04 100.0
Variable F_P160
Label Imputation Flag for P160
Question Number Imputation Flag
Question Wording Imputation Flag for P160
Category Label Frequency Percent Weighted Frequency
Weighted Percent
0 Not imputed (original data) 22,853 99.8 32,399.11 99.8 4 Imputed by using a donor value 41 0.2 60.79 0.2 5 Data adjusted by analyst during review 1 0.0 1.14 0.0
Total 22,895 100.0 32,461.04 100.0
Variable F_P165
Label Imputation Flag for P165
Question Number Imputation Flag
Question Wording Imputation Flag for P165
Category Label Frequency Percent Weighted Frequency
Weighted Percent
0 Not imputed (original data) 22,863 99.9 32,423.51 99.9 4 Imputed by using a donor value 8 0.0 10.86 0.0 5 Data adjusted by analyst during review 24 0.1 26.68 0.1
Total 22,895 100.0 32,461.05 100.0
C-70 PSS: Public-Use Data File User’s Manual for School Year 2017–18

2017‐18 Private School Survey (PSS) Codebook ‐ Public‐Use Data File
Variable F_P170
Label Imputation Flag for P170
Question Number Imputation Flag
Question Wording Imputation Flag for P170
Category Label Frequency Percent Weighted Frequency
Weighted Percent
0 Not imputed (original data) 22,883 99.9 32,444.89 100.0 4 Imputed by using a donor value 12 0.1 16.15 0.0 5 Data adjusted by analyst during review 0 0.0 0.00 0.0
Total 22,895 100.0 32,461.04 100.0
Variable F_P175
Label Imputation Flag for P175
Question Number Imputation Flag
Question Wording Imputation Flag for P175
Category Label Frequency Percent Weighted Frequency
Weighted Percent
0 Not imputed (original data) 22,864 99.9 32,425.00 99.9 4 Imputed by using a donor value 7 0.0 9.36 0.0
5 Data adjusted by analyst during review 24 0.1 26.68 0.1
Total 22,895 100.0 32,461.04 100.0
Variable F_P180
Label Imputation Flag for P180
Question Number Imputation Flag
Question Wording Imputation Flag for P180
Category Label Frequency Percent Weighted Frequency
Weighted Percent
0 Not imputed (original data) 22,888 100.0 32,451.68 100.0 4 Imputed by using a donor value 7 0.0 9.36 0.0
5 Data adjusted by analyst during review 0 0.0 0.00 0.0
Total 22,895 100.0 32,461.04 100.0
Variable F_P185
Label Imputation Flag for P185
Question Number Imputation Flag
Question Wording Imputation Flag for P185
Category Label Frequency Percent Weighted Frequency
Weighted Percent
Appendix C. 2017–18 Private School Universe Survey Public-Use Codebook C-71

2017‐18 Private School Survey (PSS) Codebook ‐ Public‐Use Data File
0 Not imputed (original data) 22,888 100.0 32,451.68 100.0 4 Imputed by using a donor value 7 0.0 9.36 0.0
5 Data adjusted by analyst during review 0 0.0 0.00 0.0
Total 22,895 100.0 32,461.04 100.0
Variable F_P190
Label Imputation Flag for P190
Question Number Imputation Flag
Question Wording Imputation Flag for P190
Category Label Frequency Percent Weighted Frequency
Weighted Percent
0 Not imputed (original data) 22,836 99.7 32,389.74 99.8 4 Imputed by using a donor value 39 0.2 49.57 0.2 5 Data adjusted by analyst during review 20 0.1 21.74 0.1
Total 22,895 100.0 32,461.05 100.0
Variable F_P195
Label Imputation Flag for P195
Question Number Imputation Flag
Question Wording Imputation Flag for P195
Category Label Frequency Percent Weighted Frequency
Weighted Percent
0 Not imputed (original data) 22,888 100.0 32,451.68 100.0 4 Imputed by using a donor value 7 0.0 9.36 0.0
5 Data adjusted by analyst during review 0 0.0 0.00 0.0
Total 22,895 100.0 32,461.04 100.0
Variable F_P200
Label Imputation Flag for P200
Question Number Imputation Flag
Question Wording Imputation Flag for P200
Category Label Frequency Percent Weighted Frequency
Weighted Percent
0 Not imputed (original data) 22,833 99.7 32,386.00 99.8 4 Imputed by using a donor value 42 0.2 53.31 0.2 5 Data adjusted by analyst during review 20 0.1 21.74 0.1
Total 22,895 100.0 32,461.05 100.0
C-72 PSS: Public-Use Data File User’s Manual for School Year 2017–18

2017‐18 Private School Survey (PSS) Codebook ‐ Public‐Use Data File
Variable F_P205
Label Imputation Flag for P205
Question Number Imputation Flag
Question Wording Imputation Flag for P205
Category Label Frequency Percent Weighted Frequency
Weighted Percent
0 Not imputed (original data) 22,888 100.0 32,451.68 100.0 4 Imputed by using a donor value 7 0.0 9.36 0.0
5 Data adjusted by analyst during review 0 0.0 0.00 0.0
Total 22,895 100.0 32,461.04 100.0
Variable F_P210
Label Imputation Flag for P210
Question Number Imputation Flag
Question Wording Imputation Flag for P210
Category Label Frequency Percent Weighted Frequency
Weighted Percent
0 Not imputed (original data) 22,831 99.7 32,383.38 99.8 4 Imputed by using a donor value 44 0.2 55.92 0.2 5 Data adjusted by analyst during review 20 0.1 21.74 0.1
Total 22,895 100.0 32,461.04 100.0
Variable F_P215
Label Imputation Flag for P215
Question Number Imputation Flag
Question Wording Imputation Flag for P215
Category Label Frequency Percent Weighted Frequency
Weighted Percent
0 Not imputed (original data) 22,864 99.9 32,425.00 99.9 4 Imputed by using a donor value 7 0.0 9.36 0.0
5 Data adjusted by analyst during review 24 0.1 26.68 0.1
Total 22,895 100.0 32,461.04 100.0
Variable F_P220
Label Imputation Flag for P220
Question Number Imputation Flag
Question Wording Imputation Flag for P220
Category Label Frequency Percent Weighted Frequency
Weighted Percent
Appendix C. 2017–18 Private School Universe Survey Public-Use Codebook C-73
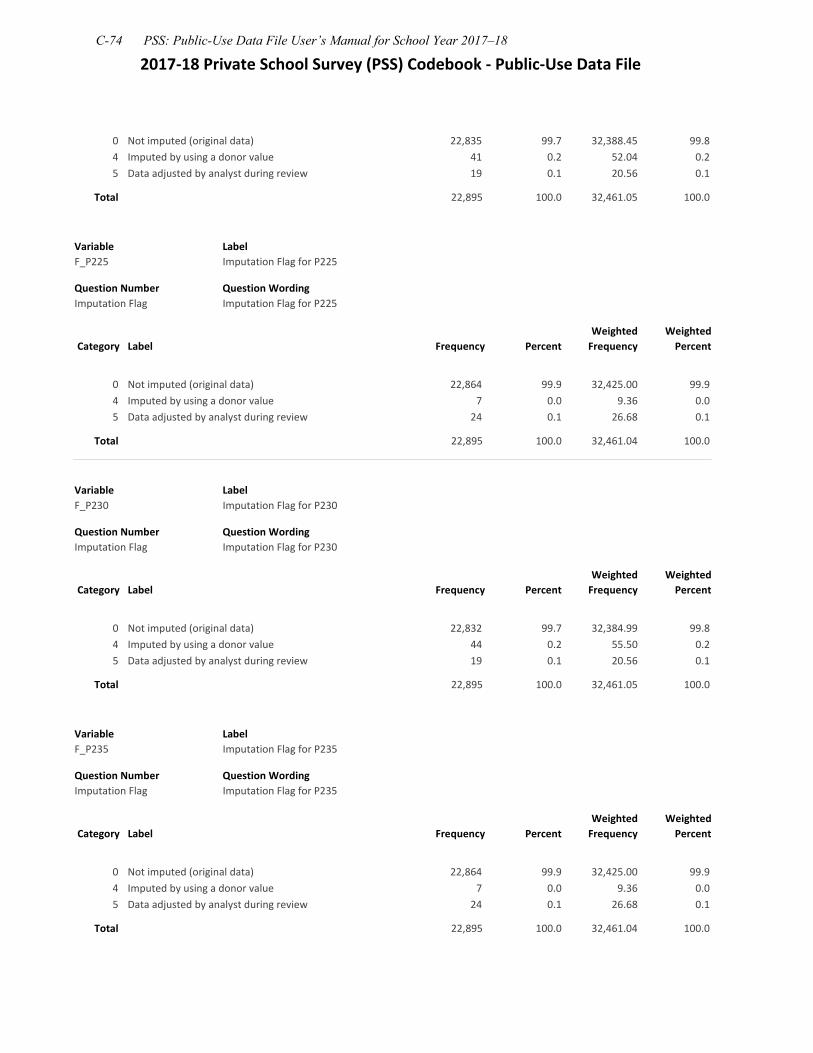
2017‐18 Private School Survey (PSS) Codebook ‐ Public‐Use Data File
0 Not imputed (original data) 22,835 99.7 32,388.45 99.8 4 Imputed by using a donor value 41 0.2 52.04 0.2 5 Data adjusted by analyst during review 19 0.1 20.56 0.1
Total 22,895 100.0 32,461.05 100.0
Variable F_P225
Label Imputation Flag for P225
Question Number Imputation Flag
Question Wording Imputation Flag for P225
Category Label Frequency Percent Weighted Frequency
Weighted Percent
0 Not imputed (original data) 22,864 99.9 32,425.00 99.9 4 Imputed by using a donor value 7 0.0 9.36 0.0
5 Data adjusted by analyst during review 24 0.1 26.68 0.1
Total 22,895 100.0 32,461.04 100.0
Variable F_P230
Label Imputation Flag for P230
Question Number Imputation Flag
Question Wording Imputation Flag for P230
Category Label Frequency Percent Weighted Frequency
Weighted Percent
0 Not imputed (original data) 22,832 99.7 32,384.99 99.8 4 Imputed by using a donor value 44 0.2 55.50 0.2 5 Data adjusted by analyst during review 19 0.1 20.56 0.1
Total 22,895 100.0 32,461.05 100.0
Variable F_P235
Label Imputation Flag for P235
Question Number Imputation Flag
Question Wording Imputation Flag for P235
Category Label Frequency Percent Weighted Frequency
Weighted Percent
0 Not imputed (original data) 22,864 99.9 32,425.00 99.9 4 Imputed by using a donor value 7 0.0 9.36 0.0
5 Data adjusted by analyst during review 24 0.1 26.68 0.1
Total 22,895 100.0 32,461.04 100.0
C-74 PSS: Public-Use Data File User’s Manual for School Year 2017–18

2017‐18 Private School Survey (PSS) Codebook ‐ Public‐Use Data File
Variable F_P240
Label Imputation Flag for P240
Question Number Imputation Flag
Question Wording Imputation Flag for P240
Category Label Frequency Percent Weighted Frequency
Weighted Percent
0 Not imputed (original data) 22,828 99.7 32,378.52 99.7 4 Imputed by using a donor value 47 0.2 60.80 0.2 5 Data adjusted by analyst during review 20 0.1 21.72 0.1
Total 22,895 100.0 32,461.04 100.0
Variable F_P245
Label Imputation Flag for P245
Question Number Imputation Flag
Question Wording Imputation Flag for P245
Category Label Frequency Percent Weighted Frequency
Weighted Percent
0 Not imputed (original data) 22,864 99.9 32,425.00 99.9 4 Imputed by using a donor value 7 0.0 9.36 0.0
5 Data adjusted by analyst during review 24 0.1 26.68 0.1
Total 22,895 100.0 32,461.04 100.0
Variable F_P250
Label Imputation Flag for P250
Question Number Imputation Flag
Question Wording Imputation Flag for P250
Category Label Frequency Percent Weighted Frequency
Weighted Percent
0 Not imputed (original data) 22,831 99.7 32,381.68 99.8 4 Imputed by using a donor value 44 0.2 57.64 0.2 5 Data adjusted by analyst during review 20 0.1 21.72 0.1
Total 22,895 100.0 32,461.04 100.0
Variable F_P255
Label Imputation Flag for P255
Question Number Imputation Flag
Question Wording Imputation Flag for P255
Category Label Frequency Percent Weighted Frequency
Weighted Percent
Appendix C. 2017–18 Private School Universe Survey Public-Use Codebook C-75

2017‐18 Private School Survey (PSS) Codebook ‐ Public‐Use Data File
0 Not imputed (original data) 22,864 99.9 32,425.00 99.9 4 Imputed by using a donor value 7 0.0 9.36 0.0
5 Data adjusted by analyst during review 24 0.1 26.68 0.1
Total 22,895 100.0 32,461.04 100.0
Variable F_P260
Label Imputation Flag for P260
Question Number Imputation Flag
Question Wording Imputation Flag for P260
Category Label Frequency Percent Weighted Frequency
Weighted Percent
0 Not imputed (original data) 22,831 99.7 32,381.90 99.8 4 Imputed by using a donor value 44 0.2 57.43 0.2 5 Data adjusted by analyst during review 20 0.1 21.72 0.1
Total 22,895 100.0 32,461.05 100.0
Variable F_P265
Label Imputation Flag for P265
Question Number Imputation Flag
Question Wording Imputation Flag for P265
Category Label Frequency Percent Weighted Frequency
Weighted Percent
0 Not imputed (original data) 22,863 99.9 32,423.73 99.9 4 Imputed by using a donor value 7 0.0 9.36 0.0
5 Data adjusted by analyst during review 25 0.1 27.95 0.1
Total 22,895 100.0 32,461.04 100.0
Variable F_P270
Label Imputation Flag for P270
Question Number Imputation Flag
Question Wording Imputation Flag for P270
Category Label Frequency Percent Weighted Frequency
Weighted Percent
0 Not imputed (original data) 22,861 99.9 32,416.47 99.9 4 Imputed by using a donor value 30 0.1 39.84 0.1 5 Data adjusted by analyst during review 4 0.0 4.74 0.0
Total 22,895 100.0 32,461.05 100.0
C-76 PSS: Public-Use Data File User’s Manual for School Year 2017–18
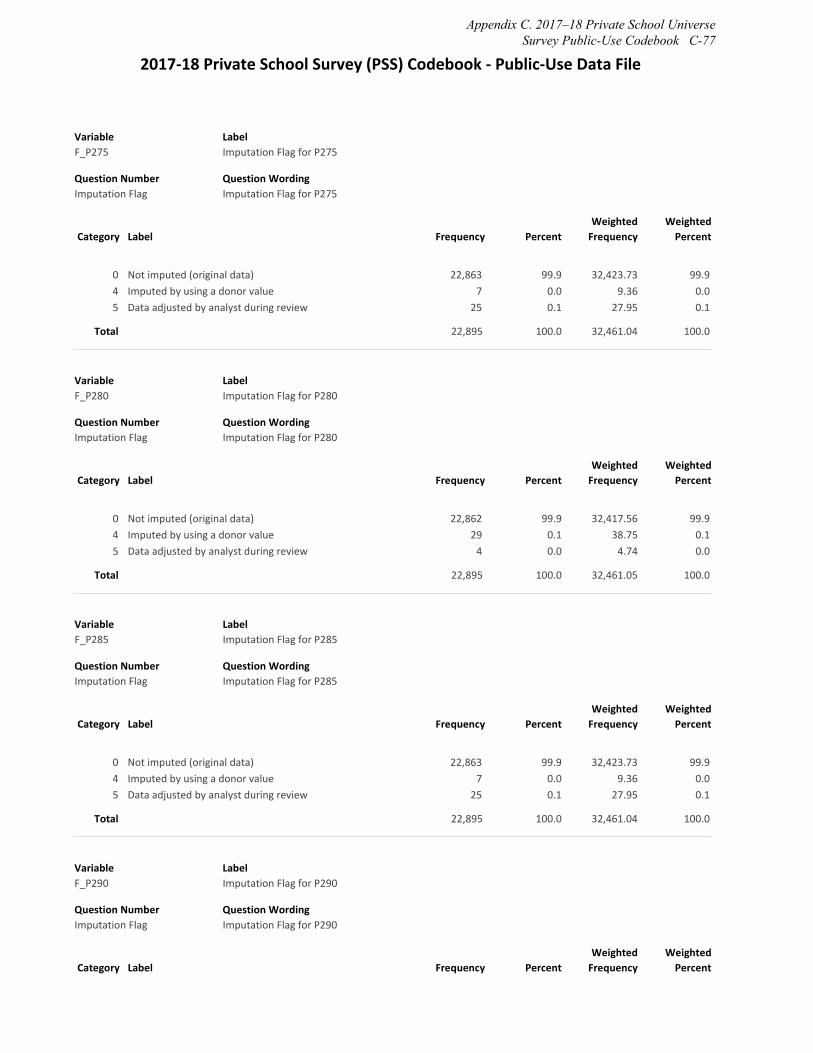
2017‐18 Private School Survey (PSS) Codebook ‐ Public‐Use Data File
Variable F_P275
Label Imputation Flag for P275
Question Number Imputation Flag
Question Wording Imputation Flag for P275
Category Label Frequency Percent Weighted Frequency
Weighted Percent
0 Not imputed (original data) 22,863 99.9 32,423.73 99.9 4 Imputed by using a donor value 7 0.0 9.36 0.0
5 Data adjusted by analyst during review 25 0.1 27.95 0.1
Total 22,895 100.0 32,461.04 100.0
Variable F_P280
Label Imputation Flag for P280
Question Number Imputation Flag
Question Wording Imputation Flag for P280
Category Label Frequency Percent Weighted Frequency
Weighted Percent
0 Not imputed (original data) 22,862 99.9 32,417.56 99.9 4 Imputed by using a donor value 29 0.1 38.75 0.1 5 Data adjusted by analyst during review 4 0.0 4.74 0.0
Total 22,895 100.0 32,461.05 100.0
Variable F_P285
Label Imputation Flag for P285
Question Number Imputation Flag
Question Wording Imputation Flag for P285
Category Label Frequency Percent Weighted Frequency
Weighted Percent
0 Not imputed (original data) 22,863 99.9 32,423.73 99.9 4 Imputed by using a donor value 7 0.0 9.36 0.0
5 Data adjusted by analyst during review 25 0.1 27.95 0.1
Total 22,895 100.0 32,461.04 100.0
Variable F_P290
Label Imputation Flag for P290
Question Number Imputation Flag
Question Wording Imputation Flag for P290
Category Label Frequency Percent Weighted Frequency
Weighted Percent
Appendix C. 2017–18 Private School Universe Survey Public-Use Codebook C-77

2017‐18 Private School Survey (PSS) Codebook ‐ Public‐Use Data File
0 Not imputed (original data) 22,861 99.9 32,416.10 99.9 4 Imputed by using a donor value 30 0.1 40.20 0.1 5 Data adjusted by analyst during review 4 0.0 4.74 0.0
Total 22,895 100.0 32,461.04 100.0
Variable F_P295
Label Imputation Flag for P295
Question Number Imputation Flag
Question Wording Imputation Flag for P295
Category Label Frequency Percent Weighted Frequency
Weighted Percent
0 Not imputed (original data) 22,863 99.9 32,423.73 99.9 4 Imputed by using a donor value 7 0.0 9.36 0.0
5 Data adjusted by analyst during review 25 0.1 27.95 0.1
Total 22,895 100.0 32,461.04 100.0
Variable F_P300
Label Imputation Flag for P300
Question Number Imputation Flag
Question Wording Imputation Flag for P300
Category Label Frequency Percent Weighted Frequency
Weighted Percent
0 Not imputed (original data) 22,863 99.9 32,419.06 99.9 4 Imputed by using a donor value 28 0.1 37.25 0.1 5 Data adjusted by analyst during review 4 0.0 4.74 0.0
Total 22,895 100.0 32,461.05 100.0
Variable F_P305
Label Imputation Flag for P305
Question Number Imputation Flag
Question Wording Imputation Flag for P305
Category Label Frequency Percent Weighted Frequency
Weighted Percent
0 Not imputed (original data) 22,860 99.8 32,415.06 99.9 4 Imputed by using a donor value 32 0.1 42.52 0.1 5 Data adjusted by analyst during review 3 0.0 3.46 0.0
Total 22,895 100.0 32,461.04 100.0
C-78 PSS: Public-Use Data File User’s Manual for School Year 2017–18

2017‐18 Private School Survey (PSS) Codebook ‐ Public‐Use Data File
Variable F_P320
Label Imputation Flag for P320
Question Number Imputation Flag
Question Wording Imputation Flag for P320
Category Label Frequency Percent Weighted Frequency
Weighted Percent
0 Not imputed (original data) 21,944 95.8 30,504.52 94.0 4 Imputed by using a donor value 951 4.2 1,956.53 6.0 5 Data adjusted by analyst during review 0 0.0 0.00 0.0
Total 22,895 100.0 32,461.05 100.0
Variable F_P330
Label Imputation Flag for P330
Question Number Imputation Flag
Question Wording Imputation Flag for P330
Category Label Frequency Percent Weighted Frequency
Weighted Percent
0 Not imputed (original data) 21,927 95.8 30,503.54 94.0 4 Imputed by using a donor value 968 4.2 1,957.50 6.0 5 Data adjusted by analyst during review 0 0.0 0.00 0.0
Total 22,895 100.0 32,461.04 100.0
Variable F_P325
Label Imputation Flag for P325
Question Number Imputation Flag
Question Wording Imputation Flag for P325
Category Label Frequency Percent Weighted Frequency
Weighted Percent
0 Not imputed (original data) 21,939 95.8 30,560.72 94.1 4 Imputed by using a donor value 956 4.2 1,900.33 5.9 5 Data adjusted by analyst during review 0 0.0 0.00 0.0
Total 22,895 100.0 32,461.05 100.0
Variable F_P316
Label Imputation Flag for P316
Question Number Imputation Flag
Question Wording Imputation Flag for P316
Category Label Frequency Percent Weighted Frequency
Weighted Percent
Appendix C. 2017–18 Private School Universe Survey Public-Use Codebook C-79

2017‐18 Private School Survey (PSS) Codebook ‐ Public‐Use Data File
0 Not imputed (original data) 21,931 95.8 30,645.28 94.4 4 Imputed by using a donor value 964 4.2 1,815.77 5.6 5 Data adjusted by analyst during review 0 0.0 0.00 0.0
Total 22,895 100.0 32,461.05 100.0
Variable F_P318
Label Imputation Flag for P318
Question Number Imputation Flag
Question Wording Imputation Flag for P318
Category Label Frequency Percent Weighted Frequency
Weighted Percent
0 Not imputed (original data) 21,930 95.8 30,646.14 94.4 4 Imputed by using a donor value 965 4.2 1,814.91 5.6 5 Data adjusted by analyst during review 0 0.0 0.00 0.0
Total 22,895 100.0 32,461.05 100.0
Variable F_P310
Label Imputation Flag for P310
Question Number Imputation Flag
Question Wording Imputation Flag for P310
Category Label Frequency Percent Weighted Frequency
Weighted Percent
0 Not imputed (original data) 21,923 95.8 30,546.09 94.1 4 Imputed by using a donor value 972 4.2 1,914.96 5.9 5 Data adjusted by analyst during review 0 0.0 0.00 0.0
Total 22,895 100.0 32,461.05 100.0
Variable F_P332
Label Imputation Flag for P332
Question Number Imputation Flag
Question Wording Imputation Flag for P332
Category Label Frequency Percent Weighted Frequency
Weighted Percent
0 Not imputed (original data) 21,908 95.7 30,523.19 94.0 4 Imputed by using a donor value 987 4.3 1,937.85 6.0 5 Data adjusted by analyst during review 0 0.0 0.00 0.0
Total 22,895 100.0 32,461.04 100.0
C-80 PSS: Public-Use Data File User’s Manual for School Year 2017–18

2017‐18 Private School Survey (PSS) Codebook ‐ Public‐Use Data File
Variable F_P335
Label Imputation Flag for P335
Question Number Imputation Flag
Question Wording Imputation Flag for P335
Category Label Frequency Percent Weighted Frequency
Weighted Percent
0 Not imputed (original data) 22,860 99.8 32,416.64 99.9 4 Imputed by using a donor value 35 0.2 44.41 0.1 5 Data adjusted by analyst during review 0 0.0 0.00 0.0
Total 22,895 100.0 32,461.05 100.0
Variable F_P340
Label Imputation Flag for P340
Question Number Imputation Flag
Question Wording Imputation Flag for P340
Category Label Frequency Percent Weighted Frequency
Weighted Percent
0 Not imputed (original data) 22,295 97.4 31,369.88 96.6 4 Imputed by using a donor value 588 2.6 1,078.15 3.3 5 Data adjusted by analyst during review 12 0.1 13.01 0.0
Total 22,895 100.0 32,461.04 100.0
Variable F_P345
Label Imputation Flag for P345
Question Number Imputation Flag
Question Wording Imputation Flag for P345
Category Label Frequency Percent Weighted Frequency
Weighted Percent
0 Not imputed (original data) 22,886 100.0 32,450.20 100.0 4 Imputed by using a donor value 0 0.0 0.00 0.0
5 Data adjusted by analyst during review 9 0.0 10.84 0.0
Total 22,895 100.0 32,461.04 100.0
Variable F_P350
Label Imputation Flag for P350
Question Number Imputation Flag
Question Wording Imputation Flag for P350
Category Label Frequency Percent Weighted Frequency
Weighted Percent
Appendix C. 2017–18 Private School Universe Survey Public-Use Codebook C-81

2017‐18 Private School Survey (PSS) Codebook ‐ Public‐Use Data File
0 Not imputed (original data) 22,801 99.6 32,312.83 99.5 4 Imputed by using a donor value 88 0.4 140.56 0.4 5 Data adjusted by analyst during review 6 0.0 7.66 0.0
Total 22,895 100.0 32,461.05 100.0
Variable F_P360
Label Imputation Flag for P360
Question Number Imputation Flag
Question Wording Imputation Flag for P360
Category Label Frequency Percent Weighted Frequency
Weighted Percent
0 Not imputed (original data) 22,129 96.7 31,452.32 96.9 4 Imputed by using a donor value 763 3.3 1,005.14 3.1 5 Data adjusted by analyst during review 3 0.0 3.58 0.0
Total 22,895 100.0 32,461.04 100.0
Variable F_P365
Label Imputation Flag for P365
Question Number Imputation Flag
Question Wording Imputation Flag for P365
Category Label Frequency Percent Weighted Frequency
Weighted Percent
0 Not imputed (original data) 22,821 99.7 32,361.00 99.7 4 Imputed by using a donor value 73 0.3 98.71 0.3 5 Data adjusted by analyst during review 1 0.0 1.34 0.0
Total 22,895 100.0 32,461.05 100.0
Variable F_P370
Label Imputation Flag for P370
Question Number Imputation Flag
Question Wording Imputation Flag for P370
Category Label Frequency Percent Weighted Frequency
Weighted Percent
0 Not imputed (original data) 22,788 99.5 32,306.48 99.5 4 Imputed by using a donor value 106 0.5 153.22 0.5 5 Data adjusted by analyst during review 1 0.0 1.34 0.0
Total 22,895 100.0 32,461.04 100.0
C-82 PSS: Public-Use Data File User’s Manual for School Year 2017–18

2017‐18 Private School Survey (PSS) Codebook ‐ Public‐Use Data File
Variable F_P385
Label Imputation Flag for P385
Question Number Imputation Flag
Question Wording Imputation Flag for P385
Category Label Frequency Percent Weighted Frequency
Weighted Percent
0 Not imputed (original data) 22,795 99.6 32,307.40 99.5 4 Imputed by using a donor value 100 0.4 153.65 0.5 5 Data adjusted by analyst during review 0 0.0 0.00 0.0
Total 22,895 100.0 32,461.05 100.0
Variable F_P390
Label Imputation Flag for P390
Question Number Imputation Flag
Question Wording Imputation Flag for P390
Category Label Frequency Percent Weighted Frequency
Weighted Percent
0 Not imputed (original data) 22,778 99.5 32,267.24 99.4 4 Imputed by using a donor value 117 0.5 193.80 0.6 5 Data adjusted by analyst during review 0 0.0 0.00 0.0
Total 22,895 100.0 32,461.04 100.0
Variable F_P395
Label Imputation Flag for P395
Question Number Imputation Flag
Question Wording Imputation Flag for P395
Category Label Frequency Percent Weighted Frequency
Weighted Percent
0 Not imputed (original data) 22,778 99.5 32,275.21 99.4 4 Imputed by using a donor value 117 0.5 185.83 0.6 5 Data adjusted by analyst during review 0 0.0 0.00 0.0
Total 22,895 100.0 32,461.04 100.0
Variable F_P400
Label Imputation Flag for P400
Question Number Imputation Flag
Question Wording Imputation Flag for P400
Category Label Frequency Percent Weighted Frequency
Weighted Percent
Appendix C. 2017–18 Private School Universe Survey Public-Use Codebook C-83

2017‐18 Private School Survey (PSS) Codebook ‐ Public‐Use Data File
0 Not imputed (original data) 22,775 99.5 32,263.92 99.4 4 Imputed by using a donor value 120 0.5 197.12 0.6 5 Data adjusted by analyst during review 0 0.0 0.00 0.0
Total 22,895 100.0 32,461.04 100.0
Variable F_P405
Label Imputation Flag for P405
Question Number Imputation Flag
Question Wording Imputation Flag for P405
Category Label Frequency Percent Weighted Frequency
Weighted Percent
0 Not imputed (original data) 22,777 99.5 32,266.17 99.4 4 Imputed by using a donor value 118 0.5 194.87 0.6 5 Data adjusted by analyst during review 0 0.0 0.00 0.0
Total 22,895 100.0 32,461.04 100.0
Variable F_P410
Label Imputation Flag for P410
Question Number Imputation Flag
Question Wording Imputation Flag for P410
Category Label Frequency Percent Weighted Frequency
Weighted Percent
0 Not imputed (original data) 22,816 99.7 32,330.20 99.6 4 Imputed by using a donor value 78 0.3 129.58 0.4 5 Data adjusted by analyst during review 1 0.0 1.27 0.0
Total 22,895 100.0 32,461.05 100.0
Variable F_P415
Label Imputation Flag for P415
Question Number Imputation Flag
Question Wording Imputation Flag for P415
Category Label Frequency Percent Weighted Frequency
Weighted Percent
0 Not imputed (original data) 22,734 99.3 32,188.99 99.2 4 Imputed by using a donor value 160 0.7 270.91 0.8 5 Data adjusted by analyst during review 1 0.0 1.15 0.0
Total 22,895 100.0 32,461.05 100.0
C-84 PSS: Public-Use Data File User’s Manual for School Year 2017–18

2017‐18 Private School Survey (PSS) Codebook ‐ Public‐Use Data File
Variable F_P420
Label Imputation Flag for P420
Question Number Imputation Flag
Question Wording Imputation Flag for P420
Category Label Frequency Percent Weighted Frequency
Weighted Percent
0 Not imputed (original data) 22,821 99.7 32,341.68 99.6 4 Imputed by using a donor value 74 0.3 119.37 0.4 5 Data adjusted by analyst during review 0 0.0 0.00 0.0
Total 22,895 100.0 32,461.05 100.0
Variable F_P425
Label Imputation Flag for P425
Question Number Imputation Flag
Question Wording Imputation Flag for P425
Category Label Frequency Percent Weighted Frequency
Weighted Percent
0 Not imputed (original data) 22,895 100.0 32,461.05 100.0 4 Imputed by using a donor value 0 0.0 0.00 0.0
5 Data adjusted by analyst during review 0 0.0 0.00 0.0
Total 22,895 100.0 32,461.05 100.0
Variable F_P430
Label Imputation Flag for P430
Question Number Imputation Flag
Question Wording Imputation Flag for P430
Category Label Frequency Percent Weighted Frequency
Weighted Percent
0 Not imputed (original data) 22,894 100.0 32,459.55 100.0 4 Imputed by using a donor value 0 0.0 0.00 0.0
5 Data adjusted by analyst during review 1 0.0 1.50 0.0
Total 22,895 100.0 32,461.05 100.0
Variable F_P435
Label Imputation Flag for P435
Question Number Imputation Flag
Question Wording Imputation Flag for P435
Category Label Frequency Percent Weighted Frequency
Weighted Percent
Appendix C. 2017–18 Private School Universe Survey Public-Use Codebook C-85

2017‐18 Private School Survey (PSS) Codebook ‐ Public‐Use Data File
0 Not imputed (original data) 22,824 99.7 32,369.52 99.7 4 Imputed by using a donor value 70 0.3 90.02 0.3 5 Data adjusted by analyst during review 1 0.0 1.50 0.0
Total 22,895 100.0 32,461.04 100.0
Variable F_P440
Label Imputation Flag for P440
Question Number Imputation Flag
Question Wording Imputation Flag for P440
Category Label Frequency Percent Weighted Frequency
Weighted Percent
0 Not imputed (original data) 22,894 100.0 32,459.55 100.0 4 Imputed by using a donor value 0 0.0 0.00 0.0
5 Data adjusted by analyst during review 1 0.0 1.50 0.0
Total 22,895 100.0 32,461.05 100.0
Variable F_P445
Label Imputation Flag for P445
Question Number Imputation Flag
Question Wording Imputation Flag for P445
Category Label Frequency Percent Weighted Frequency
Weighted Percent
0 Not imputed (original data) 22,852 99.8 32,397.09 99.8 4 Imputed by using a donor value 43 0.2 63.96 0.2 5 Data adjusted by analyst during review 0 0.0 0.00 0.0
Total 22,895 100.0 32,461.05 100.0
Variable F_P450
Label Imputation Flag for P450
Question Number Imputation Flag
Question Wording Imputation Flag for P450
Category Label Frequency Percent Weighted Frequency
Weighted Percent
0 Not imputed (original data) 22,886 100.0 32,451.51 100.0 4 Imputed by using a donor value 0 0.0 0.00 0.0
5 Data adjusted by analyst during review 9 0.0 9.54 0.0
Total 22,895 100.0 32,461.05 100.0
C-86 PSS: Public-Use Data File User’s Manual for School Year 2017–18

2017‐18 Private School Survey (PSS) Codebook ‐ Public‐Use Data File
Variable F_P455
Label Imputation Flag for P455
Question Number Imputation Flag
Question Wording Imputation Flag for P455
Category Label Frequency Percent Weighted Frequency
Weighted Percent
0 Not imputed (original data) 22,895 100.0 32,461.05 100.0 4 Imputed by using a donor value 0 0.0 0.00 0.0
5 Data adjusted by analyst during review 0 0.0 0.00 0.0
Total 22,895 100.0 32,461.05 100.0
Variable F_P460
Label Imputation Flag for P460
Question Number Imputation Flag
Question Wording Imputation Flag for P460
Category Label Frequency Percent Weighted Frequency
Weighted Percent
0 Not imputed (original data) 22,895 100.0 32,461.05 100.0 4 Imputed by using a donor value 0 0.0 0.00 0.0
5 Data adjusted by analyst during review 0 0.0 0.00 0.0
Total 22,895 100.0 32,461.05 100.0
Variable F_P465
Label Imputation Flag for P465
Question Number Imputation Flag
Question Wording Imputation Flag for P465
Category Label Frequency Percent Weighted Frequency
Weighted Percent
0 Not imputed (original data) 22,895 100.0 32,461.05 100.0 4 Imputed by using a donor value 0 0.0 0.00 0.0
5 Data adjusted by analyst during review 0 0.0 0.00 0.0
Total 22,895 100.0 32,461.05 100.0
Variable F_P467
Label Imputation Flag for P467
Question Number Imputation Flag
Question Wording Imputation Flag for P467
Category Label Frequency Percent Weighted Frequency
Weighted Percent
Appendix C. 2017–18 Private School Universe Survey Public-Use Codebook C-87

2017‐18 Private School Survey (PSS) Codebook ‐ Public‐Use Data File
0 Not imputed (original data) 22,895 100.0 32,461.05 100.0 4 Imputed by using a donor value 0 0.0 0.00 0.0
5 Data adjusted by analyst during review 0 0.0 0.00 0.0
Total 22,895 100.0 32,461.05 100.0
Variable F_P468
Label Imputation Flag for P468
Question Number Imputation Flag
Question Wording Imputation Flag for P468
Category Label Frequency Percent Weighted Frequency
Weighted Percent
0 Not imputed (original data) 22,895 100.0 32,461.05 100.0 4 Imputed by using a donor value 0 0.0 0.00 0.0
5 Data adjusted by analyst during review 0 0.0 0.00 0.0
Total 22,895 100.0 32,461.05 100.0
Variable F_P470
Label Imputation Flag for P470
Question Number Imputation Flag
Question Wording Imputation Flag for P470
Category Label Frequency Percent Weighted Frequency
Weighted Percent
0 Not imputed (original data) 22,895 100.0 32,461.05 100.0 4 Imputed by using a donor value 0 0.0 0.00 0.0
5 Data adjusted by analyst during review 0 0.0 0.00 0.0
Total 22,895 100.0 32,461.05 100.0
Variable F_P475
Label Imputation Flag for P475
Question Number Imputation Flag
Question Wording Imputation Flag for P475
Category Label Frequency Percent Weighted Frequency
Weighted Percent
0 Not imputed (original data) 22,895 100.0 32,461.05 100.0 4 Imputed by using a donor value 0 0.0 0.00 0.0
5 Data adjusted by analyst during review 0 0.0 0.00 0.0
Total 22,895 100.0 32,461.05 100.0
C-88 PSS: Public-Use Data File User’s Manual for School Year 2017–18

2017‐18 Private School Survey (PSS) Codebook ‐ Public‐Use Data File
Variable F_P480
Label Imputation Flag for P480
Question Number Imputation Flag
Question Wording Imputation Flag for P480
Category Label Frequency Percent Weighted Frequency
Weighted Percent
0 Not imputed (original data) 22,895 100.0 32,461.05 100.0 4 Imputed by using a donor value 0 0.0 0.00 0.0
5 Data adjusted by analyst during review 0 0.0 0.00 0.0
Total 22,895 100.0 32,461.05 100.0
Variable F_P485
Label Imputation Flag for P485
Question Number Imputation Flag
Question Wording Imputation Flag for P485
Category Label Frequency Percent Weighted Frequency
Weighted Percent
0 Not imputed (original data) 22,895 100.0 32,461.05 100.0 4 Imputed by using a donor value 0 0.0 0.00 0.0
5 Data adjusted by analyst during review 0 0.0 0.00 0.0
Total 22,895 100.0 32,461.05 100.0
Variable F_P490
Label Imputation Flag for P490
Question Number Imputation Flag
Question Wording Imputation Flag for P490
Category Label Frequency Percent Weighted Frequency
Weighted Percent
0 Not imputed (original data) 22,895 100.0 32,461.05 100.0 4 Imputed by using a donor value 0 0.0 0.00 0.0
5 Data adjusted by analyst during review 0 0.0 0.00 0.0
Total 22,895 100.0 32,461.05 100.0
Variable F_P492
Label Imputation Flag for P492
Question Number Imputation Flag
Question Wording Imputation Flag for P492
Category Label Frequency Percent Weighted Frequency
Weighted Percent
Appendix C. 2017–18 Private School Universe Survey Public-Use Codebook C-89
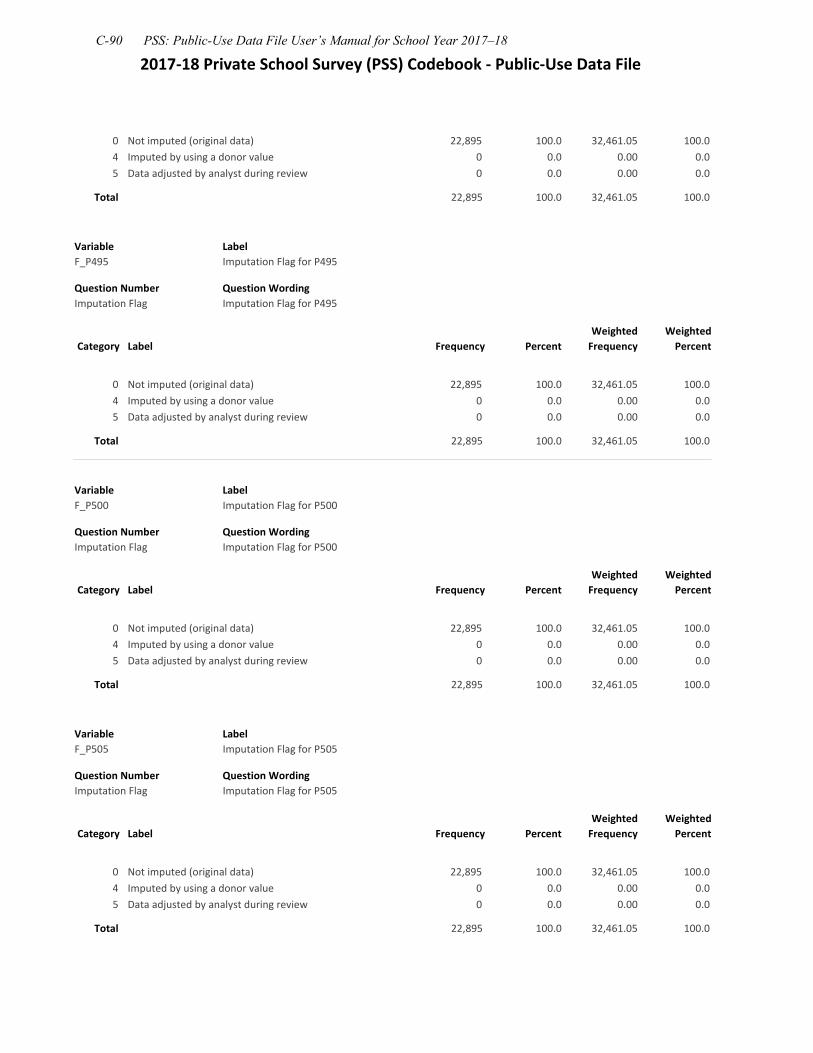
2017‐18 Private School Survey (PSS) Codebook ‐ Public‐Use Data File
0 Not imputed (original data) 22,895 100.0 32,461.05 100.0 4 Imputed by using a donor value 0 0.0 0.00 0.0
5 Data adjusted by analyst during review 0 0.0 0.00 0.0
Total 22,895 100.0 32,461.05 100.0
Variable F_P495
Label Imputation Flag for P495
Question Number Imputation Flag
Question Wording Imputation Flag for P495
Category Label Frequency Percent Weighted Frequency
Weighted Percent
0 Not imputed (original data) 22,895 100.0 32,461.05 100.0 4 Imputed by using a donor value 0 0.0 0.00 0.0
5 Data adjusted by analyst during review 0 0.0 0.00 0.0
Total 22,895 100.0 32,461.05 100.0
Variable F_P500
Label Imputation Flag for P500
Question Number Imputation Flag
Question Wording Imputation Flag for P500
Category Label Frequency Percent Weighted Frequency
Weighted Percent
0 Not imputed (original data) 22,895 100.0 32,461.05 100.0 4 Imputed by using a donor value 0 0.0 0.00 0.0
5 Data adjusted by analyst during review 0 0.0 0.00 0.0
Total 22,895 100.0 32,461.05 100.0
Variable F_P505
Label Imputation Flag for P505
Question Number Imputation Flag
Question Wording Imputation Flag for P505
Category Label Frequency Percent Weighted Frequency
Weighted Percent
0 Not imputed (original data) 22,895 100.0 32,461.05 100.0 4 Imputed by using a donor value 0 0.0 0.00 0.0
5 Data adjusted by analyst during review 0 0.0 0.00 0.0
Total 22,895 100.0 32,461.05 100.0
C-90 PSS: Public-Use Data File User’s Manual for School Year 2017–18

2017‐18 Private School Survey (PSS) Codebook ‐ Public‐Use Data File
Variable F_P510
Label Imputation Flag for P510
Question Number Imputation Flag
Question Wording Imputation Flag for P510
Category Label Frequency Percent Weighted Frequency
Weighted Percent
0 Not imputed (original data) 22,895 100.0 32,461.05 100.0 4 Imputed by using a donor value 0 0.0 0.00 0.0
5 Data adjusted by analyst during review 0 0.0 0.00 0.0
Total 22,895 100.0 32,461.05 100.0
Variable F_P515
Label Imputation Flag for P515
Question Number Imputation Flag
Question Wording Imputation Flag for P515
Category Label Frequency Percent Weighted Frequency
Weighted Percent
0 Not imputed (original data) 22,895 100.0 32,461.05 100.0 4 Imputed by using a donor value 0 0.0 0.00 0.0
5 Data adjusted by analyst during review 0 0.0 0.00 0.0
Total 22,895 100.0 32,461.05 100.0
Variable F_P520
Label Imputation Flag for P520
Question Number Imputation Flag
Question Wording Imputation Flag for P520
Category Label Frequency Percent Weighted Frequency
Weighted Percent
0 Not imputed (original data) 22,895 100.0 32,461.05 100.0 4 Imputed by using a donor value 0 0.0 0.00 0.0
5 Data adjusted by analyst during review 0 0.0 0.00 0.0
Total 22,895 100.0 32,461.05 100.0
Variable F_P522
Label Imputation Flag for P522
Question Number Imputation Flag
Question Wording Imputation Flag for P522
Category Label Frequency Percent Weighted Frequency
Weighted Percent
Appendix C. 2017–18 Private School Universe Survey Public-Use Codebook C-91

2017‐18 Private School Survey (PSS) Codebook ‐ Public‐Use Data File
0 Not imputed (original data) 22,895 100.0 32,461.05 100.0 4 Imputed by using a donor value 0 0.0 0.00 0.0
5 Data adjusted by analyst during review 0 0.0 0.00 0.0
Total 22,895 100.0 32,461.05 100.0
Variable F_P525
Label Imputation Flag for P525
Question Number Imputation Flag
Question Wording Imputation Flag for P525
Category Label Frequency Percent Weighted Frequency
Weighted Percent
0 Not imputed (original data) 22,895 100.0 32,461.05 100.0 4 Imputed by using a donor value 0 0.0 0.00 0.0
5 Data adjusted by analyst during review 0 0.0 0.00 0.0
Total 22,895 100.0 32,461.05 100.0
Variable F_P530
Label Imputation Flag for P530
Question Number Imputation Flag
Question Wording Imputation Flag for P530
Category Label Frequency Percent Weighted Frequency
Weighted Percent
0 Not imputed (original data) 22,895 100.0 32,461.05 100.0 4 Imputed by using a donor value 0 0.0 0.00 0.0
5 Data adjusted by analyst during review 0 0.0 0.00 0.0
Total 22,895 100.0 32,461.05 100.0
Variable F_P535
Label Imputation Flag for P535
Question Number Imputation Flag
Question Wording Imputation Flag for P535
Category Label Frequency Percent Weighted Frequency
Weighted Percent
0 Not imputed (original data) 22,895 100.0 32,461.05 100.0 4 Imputed by using a donor value 0 0.0 0.00 0.0
5 Data adjusted by analyst during review 0 0.0 0.00 0.0
Total 22,895 100.0 32,461.05 100.0
C-92 PSS: Public-Use Data File User’s Manual for School Year 2017–18

2017‐18 Private School Survey (PSS) Codebook ‐ Public‐Use Data File
Variable F_P540
Label Imputation Flag for P540
Question Number Imputation Flag
Question Wording Imputation Flag for P540
Category Label Frequency Percent Weighted Frequency
Weighted Percent
0 Not imputed (original data) 22,895 100.0 32,461.05 100.0 4 Imputed by using a donor value 0 0.0 0.00 0.0
5 Data adjusted by analyst during review 0 0.0 0.00 0.0
Total 22,895 100.0 32,461.05 100.0
Variable F_P542
Label Imputation Flag for P542
Question Number Imputation Flag
Question Wording Imputation Flag for P542
Category Label Frequency Percent Weighted Frequency
Weighted Percent
0 Not imputed (original data) 22,895 100.0 32,461.05 100.0 4 Imputed by using a donor value 0 0.0 0.00 0.0
5 Data adjusted by analyst during review 0 0.0 0.00 0.0
Total 22,895 100.0 32,461.05 100.0
Variable F_P545
Label Imputation Flag for P545
Question Number Imputation Flag
Question Wording Imputation Flag for P545
Category Label Frequency Percent Weighted Frequency
Weighted Percent
0 Not imputed (original data) 22,895 100.0 32,461.05 100.0 4 Imputed by using a donor value 0 0.0 0.00 0.0
5 Data adjusted by analyst during review 0 0.0 0.00 0.0
Total 22,895 100.0 32,461.05 100.0
Variable F_P550
Label Imputation Flag for P550
Question Number Imputation Flag
Question Wording Imputation Flag for P550
Category Label Frequency Percent Weighted Frequency
Weighted Percent
Appendix C. 2017–18 Private School Universe Survey Public-Use Codebook C-93

2017‐18 Private School Survey (PSS) Codebook ‐ Public‐Use Data File
0 Not imputed (original data) 22,895 100.0 32,461.05 100.0 4 Imputed by using a donor value 0 0.0 0.00 0.0
5 Data adjusted by analyst during review 0 0.0 0.00 0.0
Total 22,895 100.0 32,461.05 100.0
Variable F_P555
Label Imputation Flag for P555
Question Number Imputation Flag
Question Wording Imputation Flag for P555
Category Label Frequency Percent Weighted Frequency
Weighted Percent
0 Not imputed (original data) 22,895 100.0 32,461.05 100.0 4 Imputed by using a donor value 0 0.0 0.00 0.0
5 Data adjusted by analyst during review 0 0.0 0.00 0.0
Total 22,895 100.0 32,461.05 100.0
Variable F_P575
Label Imputation Flag for P575
Question Number Imputation Flag
Question Wording Imputation Flag for P575
Category Label Frequency Percent Weighted Frequency
Weighted Percent
0 Not imputed (original data) 22,895 100.0 32,461.05 100.0 4 Imputed by using a donor value 0 0.0 0.00 0.0
5 Data adjusted by analyst during review 0 0.0 0.00 0.0
Total 22,895 100.0 32,461.05 100.0
Variable F_P580
Label Imputation Flag for P580
Question Number Imputation Flag
Question Wording Imputation Flag for P580
Category Label Frequency Percent Weighted Frequency
Weighted Percent
0 Not imputed (original data) 22,895 100.0 32,461.05 100.0 4 Imputed by using a donor value 0 0.0 0.00 0.0
5 Data adjusted by analyst during review 0 0.0 0.00 0.0
Total 22,895 100.0 32,461.05 100.0
C-94 PSS: Public-Use Data File User’s Manual for School Year 2017–18

2017‐18 Private School Survey (PSS) Codebook ‐ Public‐Use Data File
Variable F_P585
Label Imputation Flag for P585
Question Number Imputation Flag
Question Wording Imputation Flag for P585
Category Label Frequency Percent Weighted Frequency
Weighted Percent
0 Not imputed (original data) 22,895 100.0 32,461.05 100.0 4 Imputed by using a donor value 0 0.0 0.00 0.0
5 Data adjusted by analyst during review 0 0.0 0.00 0.0
Total 22,895 100.0 32,461.05 100.0
Variable F_P590
Label Imputation Flag for P590
Question Number Imputation Flag
Question Wording Imputation Flag for P590
Category Label Frequency Percent Weighted Frequency
Weighted Percent
0 Not imputed (original data) 22,895 100.0 32,461.05 100.0 4 Imputed by using a donor value 0 0.0 0.00 0.0
5 Data adjusted by analyst during review 0 0.0 0.00 0.0
Total 22,895 100.0 32,461.05 100.0
Variable F_P600
Label Imputation Flag for P600
Question Number Imputation Flag
Question Wording Imputation Flag for P600
Category Label Frequency Percent Weighted Frequency
Weighted Percent
0 Not imputed (original data) 22,895 100.0 32,461.05 100.0 4 Imputed by using a donor value 0 0.0 0.00 0.0
5 Data adjusted by analyst during review 0 0.0 0.00 0.0
Total 22,895 100.0 32,461.05 100.0
Variable F_P602
Label Imputation Flag for P602
Question Number Imputation Flag
Question Wording Imputation Flag for P602
Category Label Frequency Percent Weighted Frequency
Weighted Percent
Appendix C. 2017–18 Private School Universe Survey Public-Use Codebook C-95

2017‐18 Private School Survey (PSS) Codebook ‐ Public‐Use Data File
0 Not imputed (original data) 22,895 100.0 32,461.05 100.0 4 Imputed by using a donor value 0 0.0 0.00 0.0
5 Data adjusted by analyst during review 0 0.0 0.00 0.0
Total 22,895 100.0 32,461.05 100.0
Variable F_P605
Label Imputation Flag for P605
Question Number Imputation Flag
Question Wording Imputation Flag for P605
Category Label Frequency Percent Weighted Frequency
Weighted Percent
0 Not imputed (original data) 22,895 100.0 32,461.05 100.0 4 Imputed by using a donor value 0 0.0 0.00 0.0
5 Data adjusted by analyst during review 0 0.0 0.00 0.0
Total 22,895 100.0 32,461.05 100.0
Variable F_P610
Label Imputation Flag for P610
Question Number Imputation Flag
Question Wording Imputation Flag for P610
Category Label Frequency Percent Weighted Frequency
Weighted Percent
0 Not imputed (original data) 22,895 100.0 32,461.05 100.0 4 Imputed by using a donor value 0 0.0 0.00 0.0
5 Data adjusted by analyst during review 0 0.0 0.00 0.0
Total 22,895 100.0 32,461.05 100.0
Variable F_P620
Label Imputation Flag for P620
Question Number Imputation Flag
Question Wording Imputation Flag for P620
Category Label Frequency Percent Weighted Frequency
Weighted Percent
0 Not imputed (original data) 22,895 100.0 32,461.05 100.0 4 Imputed by using a donor value 0 0.0 0.00 0.0
5 Data adjusted by analyst during review 0 0.0 0.00 0.0
Total 22,895 100.0 32,461.05 100.0
C-96 PSS: Public-Use Data File User’s Manual for School Year 2017–18

2017‐18 Private School Survey (PSS) Codebook ‐ Public‐Use Data File
Variable F_P622
Label Imputation Flag for P622
Question Number Imputation Flag
Question Wording Imputation Flag for P622
Category Label Frequency Percent Weighted Frequency
Weighted Percent
0 Not imputed (original data) 22,895 100.0 32,461.05 100.0 4 Imputed by using a donor value 0 0.0 0.00 0.0
5 Data adjusted by analyst during review 0 0.0 0.00 0.0
Total 22,895 100.0 32,461.05 100.0
Variable F_P630
Label Imputation Flag for P630
Question Number Imputation Flag
Question Wording Imputation Flag for P630
Category Label Frequency Percent Weighted Frequency
Weighted Percent
0 Not imputed (original data) 22,895 100.0 32,461.05 100.0 4 Imputed by using a donor value 0 0.0 0.00 0.0
5 Data adjusted by analyst during review 0 0.0 0.00 0.0
Total 22,895 100.0 32,461.05 100.0
Variable F_P635
Label Imputation Flag for P635
Question Number Imputation Flag
Question Wording Imputation Flag for P635
Category Label Frequency Percent Weighted Frequency
Weighted Percent
0 Not imputed (original data) 22,895 100.0 32,461.05 100.0 4 Imputed by using a donor value 0 0.0 0.00 0.0
5 Data adjusted by analyst during review 0 0.0 0.00 0.0
Total 22,895 100.0 32,461.05 100.0
Variable F_P640
Label Imputation Flag for P640
Question Number Imputation Flag
Question Wording Imputation Flag for P640
Category Label Frequency Percent Weighted Frequency
Weighted Percent
Appendix C. 2017–18 Private School Universe Survey Public-Use Codebook C-97

2017‐18 Private School Survey (PSS) Codebook ‐ Public‐Use Data File
0 Not imputed (original data) 22,895 100.0 32,461.05 100.0 4 Imputed by using a donor value 0 0.0 0.00 0.0
5 Data adjusted by analyst during review 0 0.0 0.00 0.0
Total 22,895 100.0 32,461.05 100.0
Variable F_P645
Label Imputation Flag for P645
Question Number Imputation Flag
Question Wording Imputation Flag for P645
Category Label Frequency Percent Weighted Frequency
Weighted Percent
0 Not imputed (original data) 22,335 97.6 31,006.81 95.5 4 Imputed by using a donor value 560 2.4 1,454.24 4.5 5 Data adjusted by analyst during review 0 0.0 0.00 0.0
Total 22,895 100.0 32,461.05 100.0
Variable F_P650
Label Imputation Flag for P650
Question Number Imputation Flag
Question Wording Imputation Flag for P650
Category Label Frequency Percent Weighted Frequency
Weighted Percent
0 Not imputed (original data) 22,678 99.1 32,014.21 98.6 4 Imputed by using a donor value 216 0.9 445.69 1.4 5 Data adjusted by analyst during review 1 0.0 1.15 0.0
Total 22,895 100.0 32,461.05 100.0
Variable F_P655
Label Imputation Flag for P655
Question Number Imputation Flag
Question Wording Imputation Flag for P655
Category Label Frequency Percent Weighted Frequency
Weighted Percent
0 Not imputed (original data) 22,678 99.1 32,014.21 98.6 4 Imputed by using a donor value 216 0.9 445.69 1.4 5 Data adjusted by analyst during review 1 0.0 1.15 0.0
Total 22,895 100.0 32,461.05 100.0
C-98 PSS: Public-Use Data File User’s Manual for School Year 2017–18
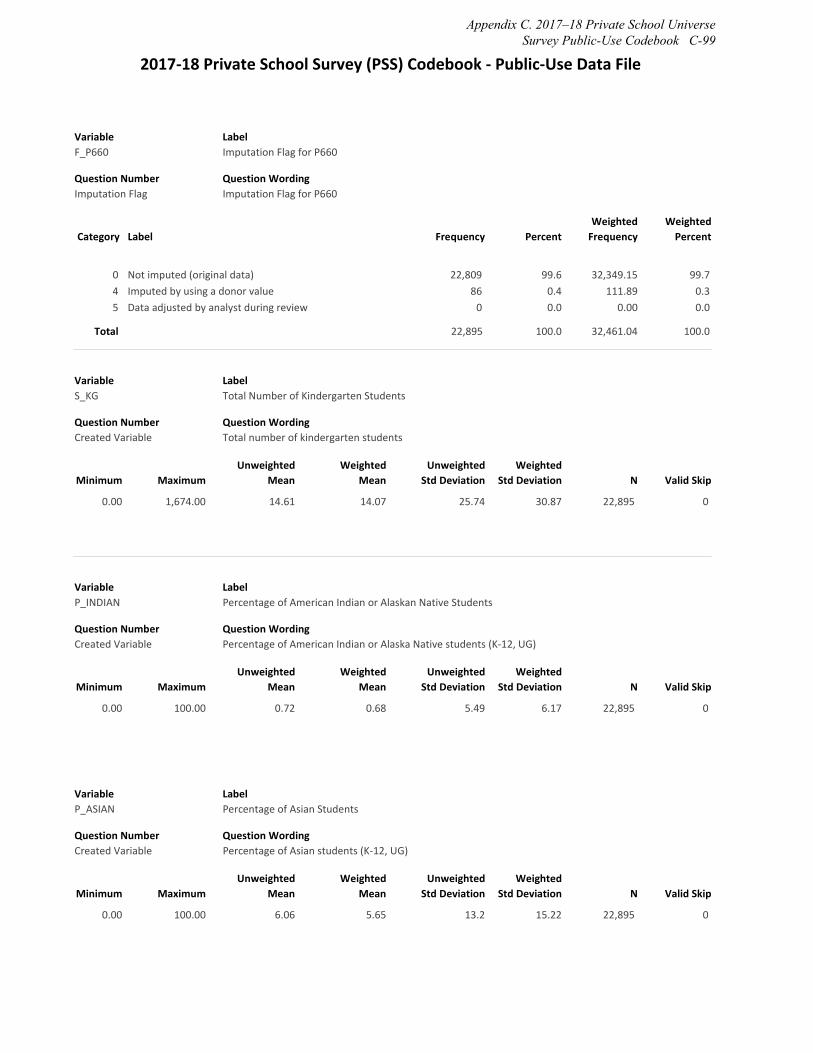
2017‐18 Private School Survey (PSS) Codebook ‐ Public‐Use Data File
Variable F_P660
Label Imputation Flag for P660
Question Number Imputation Flag
Question Wording Imputation Flag for P660
Category Label Frequency Percent Weighted Frequency
Weighted Percent
0 Not imputed (original data) 22,809 99.6 32,349.15 99.7 4 Imputed by using a donor value 86 0.4 111.89 0.3 5 Data adjusted by analyst during review 0 0.0 0.00 0.0
Total 22,895 100.0 32,461.04 100.0
Variable S_KG
Label Total Number of Kindergarten Students
Question Number Created Variable
Question Wording Total number of kindergarten students
Minimum Maximum Unweighted
Mean Weighted
Mean Unweighted
Std Deviation Weighted
Std Deviation N Valid Skip
0.00 1,674.00 14.61 14.07 25.74 30.87 22,895 0
Variable P_INDIAN
Label Percentage of American Indian or Alaskan Native Students
Question Number Created Variable
Question Wording Percentage of American Indian or Alaska Native students (K‐12, UG)
Minimum Maximum Unweighted
Mean Weighted
Mean Unweighted
Std Deviation Weighted
Std Deviation N Valid Skip
0.00 100.00 0.72 0.68 5.49 6.17 22,895 0
Variable P_ASIAN
Label Percentage of Asian Students
Question Number Created Variable
Question Wording Percentage of Asian students (K‐12, UG)
Minimum Maximum Unweighted
Mean Weighted
Mean Unweighted
Std Deviation Weighted
Std Deviation N Valid Skip
0.00 100.00 6.06 5.65 13.2 15.22 22,895 0
Appendix C. 2017–18 Private School Universe Survey Public-Use Codebook C-99
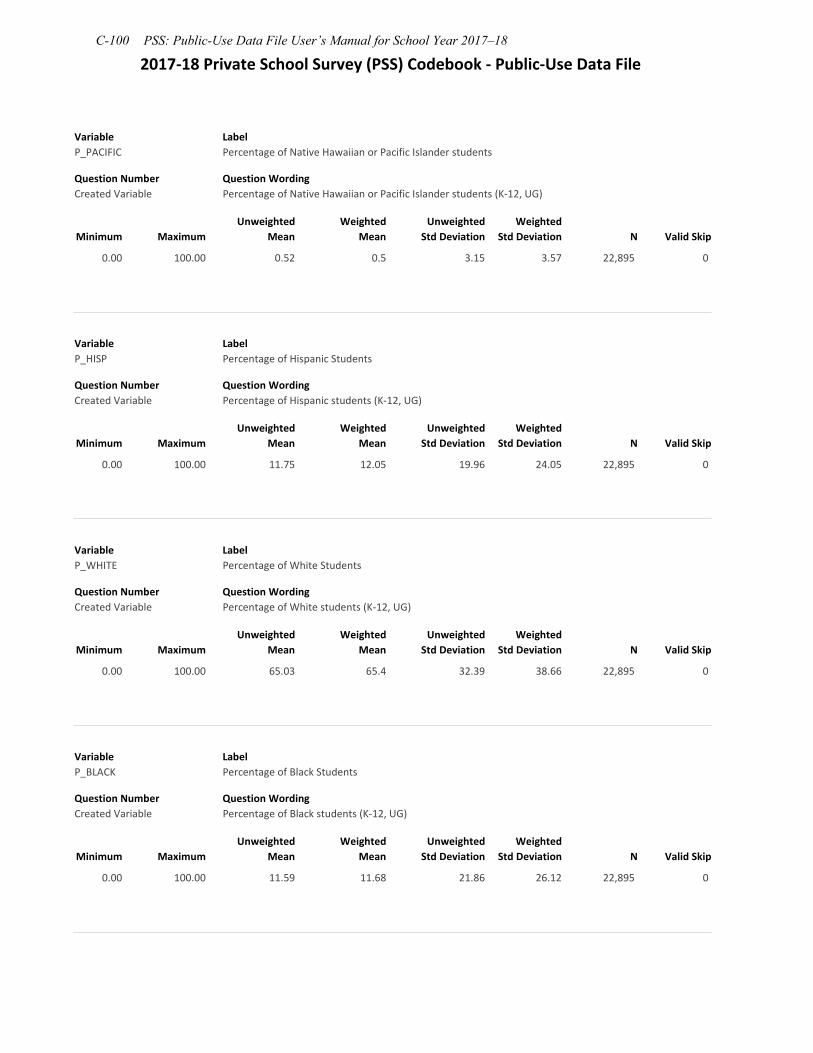
2017‐18 Private School Survey (PSS) Codebook ‐ Public‐Use Data File
Variable P_PACIFIC
Label Percentage of Native Hawaiian or Pacific Islander students
Question Number Question Wording Created Variable Percentage of Native Hawaiian or Pacific Islander students (K‐12, UG)
Minimum Maximum Unweighted
Mean Weighted
Mean Unweighted
Std Deviation Weighted
Std Deviation N Valid Skip
0.00 100.00 0.52 0.5 3.15 3.57 22,895 0
Variable P_HISP
Label Percentage of Hispanic Students
Question Number Created Variable
Question Wording Percentage of Hispanic students (K‐12, UG)
Minimum Maximum Unweighted
Mean Weighted
Mean Unweighted
Std Deviation Weighted
Std Deviation N Valid Skip
0.00 100.00 11.75 12.05 19.96 24.05 22,895 0
Variable P_WHITE
Label Percentage of White Students
Question Number Created Variable
Question Wording Percentage of White students (K‐12, UG)
Minimum Maximum Unweighted
Mean Weighted
Mean Unweighted
Std Deviation Weighted
Std Deviation N Valid Skip
0.00 100.00 65.03 65.4 32.39 38.66 22,895 0
Variable P_BLACK
Label Percentage of Black Students
Question Number Created Variable
Question Wording Percentage of Black students (K‐12, UG)
Minimum Maximum Unweighted
Mean Weighted
Mean Unweighted
Std Deviation Weighted
Std Deviation N Valid Skip
0.00 100.00 11.59 11.68 21.86 26.12 22,895 0
C-100 PSS: Public-Use Data File User’s Manual for School Year 2017–18
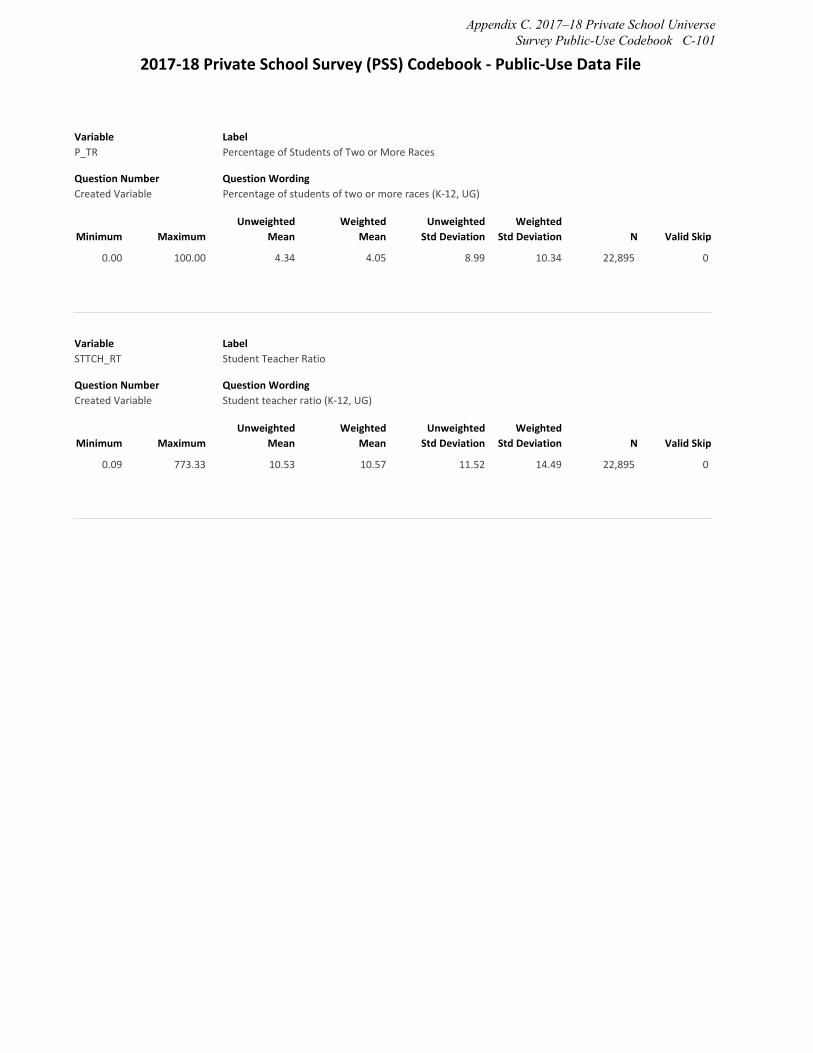
2017‐18 Private School Survey (PSS) Codebook ‐ Public‐Use Data File
Variable P_TR
Label Percentage of Students of Two or More Races
Question Number Created Variable
Question Wording Percentage of students of two or more races (K‐12, UG)
Minimum Maximum Unweighted
Mean Weighted
Mean Unweighted
Std Deviation Weighted
Std Deviation N Valid Skip
0.00 100.00 4.34 4.05 8.99 10.34 22,895 0
Variable STTCH_RT
Label Student Teacher Ratio
Question Number Created Variable
Question Wording Student teacher ratio (K‐12, UG)
Minimum Maximum Unweighted
Mean Weighted
Mean Unweighted
Std Deviation Weighted
Std Deviation N Valid Skip
0.09 773.33 10.53 10.57 11.52 14.49 22,895 0
Appendix C. 2017–18 Private School Universe Survey Public-Use Codebook C-101