Embed Size (px)
Citation preview
DEMOGRAPHIC RESEARCHA peer-reviewed, open-access journal of population sciences
DEMOGRAPHIC RESEARCH
VOLUME 44, ARTICLE 52, PAGES 1271–1294PUBLISHED 30 JUNE 2021http://www.demographic-research.org/Volumes/Vol44/52/DOI: 10.4054/DemRes.2021.44.52
Research Article
Probabilistic forecasting of maximum humanlifespan by 2100 using Bayesian populationprojections
Michael Pearce
Adrian E. Raftery
c© 2021 Michael Pearce & Adrian E. Raftery.
This open-access work is published under the terms of the CreativeCommons Attribution 3.0 Germany (CC BY 3.0 DE), which permits use,reproduction, and distribution in any medium, provided the originalauthor(s) and source are given credit.See https://creativecommons.org/licenses/by/3.0/de/legalcode
Contents
1 Introduction 1272
2 The exponential survival model for supercentenarians 12742.1 Model 12742.2 Application to IDL version 3 data 1275
3 Methodology 12793.1 Bayesian population projections 12803.2 Unconditional density curve of MRAD this century 1282
4 Results 1283
5 Discussion 1285
6 Acknowledgements 1287
References 1288
Appendix 1292
Demographic Research: Volume 44, Article 52
Research Article
Probabilistic forecasting of maximum human lifespan by 2100 usingBayesian population projections
Michael Pearce1
Adrian E. Raftery2
Abstract
BACKGROUNDWe consider the problem of quantifying the human lifespan using a statistical approachthat probabilistically forecasts the maximum reported age at death (MRAD) through2100.
OBJECTIVEWe seek to quantify the probability that any person attains various extreme ages, such asthose above 120, by the year 2100.
METHODSWe use the exponential survival model for supercentenarians (people over age 110) ofRootzen and Zholud (2017) but extend the forecasting window, quantify population un-certainty using Bayesian population projections, and incorporate the most recent datafrom the International Database on Longevity (IDL) to obtain unconditional estimates ofthe distribution of MRAD this century in a fully Bayesian analysis.
RESULTSWe find that the exponential survival model for supercentenarians is consistent with themost recent IDL data and that projections of the population aged 110–114 through 2080are sensible. We integrate over the posterior distributions of the exponential model pa-rameter and uncertainty in the supercentenarian population projections to estimate anunconditional distribution of MRAD by 2100.
CONCLUSIONSBased on the Bayesian analysis, there is a greater than 99% probability that the currentMRAD of 122 will be broken by 2100. We estimate the probabilities that a person livesto at least age 126, 128, or 130 this century, as 89%, 44%, and 13%, respectively.
1 Departments of Statistics, University of Washington, USA. Email: [email protected] Departments of Statistics and Sociology, University of Washington, USA.
http://www.demographic-research.org 1271
Pearce & Raftery: Probabilistic forecasting of maximum human lifespan by 2100
CONTRIBUTIONWe have updated the supercentenarian survival model of Rootzen and Zholud using themost recent IDL data, incorporated Bayesian population projections, and extended theforecasting window to create the first fully Bayesian and unconditional probabilistic pro-jection of MRAD by 2100.
1. Introduction
Understanding longevity is of great importance, as it has big implications for governmentprograms, economic policy, and individual planning. Although longevity has been stud-ied scientifically for well over a century, the topic of human lifespan, quantified by themaximum reported age at death (MRAD) statistic, has been intensively investigated onlysince the 1990s (Marck et al. 2017).
Many authors have forecast an immutable, fixed limit to human lifespan. Some haveargued that the flattening gains in life expectancy at birth that have been observed inmany populations imply that MRAD will also fail to increase substantially in the comingdecades (Olshansky, Carnes, and Cassel 1990; Dong, Milholland, and Vijg 2016). Sim-ilarly, many authors have suggested that strong biological forces limit human lifespan,such as the inevitable deterioration of cells that cannot be overcome, even as diseaseslike cancer, diabetes, or Parkinson’s continue to be addressed (Olshansky, Carnes, andDesesquelles 2001; Carnes and Olshansky 2007; Olshansky and Carnes 2009; Le Bourg2012; Vijg and Le Bourg 2017). These conclusions have support in the biological liter-ature as well. Hayflick (2007) argued that aging is not an addressable disease, but theresult of “random losses in molecular fidelity.” Also, Steenstrup et al. (2017) found thatthe shortening of leukocyte telomeres below a certain threshold with age, a process thatis “highly heritable and largely determined at birth,” strongly predicts imminent death.
Other authors have disagreed. Vaupel (1997) noted that mortality for people in their80s and 90s has decreased significantly in recent decades, suggesting that old-age mor-tality is far more plastic than previously thought. Oeppen and Vaupel (2002) noted thatbetween 1928 and 1990 proposed caps to human lifespan were always broken quickly, anaverage of five years after they had been proposed. They found that the flattening of lifeexpectancy “is an artifact of laggards catching up and leaders falling behind,” not that itis somehow tied to caps on human lifespan. Responding to the criticism that the currentrecord for lifespan (122 years and 164 days set by Jeanne Calment of France) has notchanged since 1997, Gavrilov, Krut’ko, and Gavrilova (2017) noted that other periodshave seen no major gains in MRAD or life expectancy, only to be followed by periods ofdramatic improvement.
Also, biologists and researchers have recently found promising pathways to stop
1272 http://www.demographic-research.org
Demographic Research: Volume 44, Article 52
biological aging, such as in emerging drugs and therapies currently undergoing clinicaltrials (Ben-Haim et al. 2017; Flatt and Partridge 2018; Campisi et al. 2019; Pignolo 2019).Regarding the lack of evolutionary pressure past reproductive years, Kirkwood (2017) ob-served that lifespans may continue to increase as evolution still encourages health throughyouth and adulthood, which is increasingly seen as correlated with decreased mortality insenescence.
Perhaps the most unifying aspect of the debate at hand is its uncertainty. Researchershave found that the small number of people to have verifiably reached age 110, unknownfuture scientific breakthroughs, and lack of biological knowledge regarding the mecha-nisms of aging limit our ability to make definitive claims about limits to human lifespan(Vaupel 1997; Wilmoth 2000; Le Bourg and Vijg 2017; Robine and Cubaynes 2017). De-spite arguing for the existence of a cap to human lifespan, Olshansky and Carnes (2009)agreed that the probability of survival at any given age cannot be exactly zero, leav-ing open the possibility of MRAD records being broken continuously as the centenarianpopulation increases. They later noted that purely mathematical models cannot be usedexclusively to predict MRAD, citing Zeno’s arrow paradox (Olshansky and Carnes 2019).
Despite substantial research, before 2010 statistical analyses of supercentenarians(those who live to at least age 110) were plagued by age-attainment bias, which is definedas the tendency of advanced-age people to exaggerate or round up their age (Poulain2010). This problem was mitigated by the publication of the International Database onLongevity (IDL) by the Max Planck Institute for Demographic Research. At the time ofits release, the IDL was the first unified dataset with rigorously verified birth, life, anddeath records of supercentenarians, including only those who age could be confirmedwith a high degree of certainty (Poulain 2010).
Since 2010, a number of analyses have employed the IDL data to study the possibil-ity of a limit to human lifespan. Notably, Dong, Milholland, and Vijg (2016) proposedan immutable cap to human lifespan at age 115, barring outliers such as Jeanne Calment.Although this paper was roundly criticized for methodological issues (Lenart and Vaupel2017; Rozing, Kirkwood, and Westendorp 2017; Hughes and Hekimi 2017), its princi-pal arguments have also been modified to support a cap to human lifespan at age 125(de Beer, Bardoutsos, and Janssen 2017).
In this paper, we reexamine and extend the rebuttal of Dong, Milholland, and Vijg byRootzen and Zholud (2017) (henceforth referred to as RZ) in support of the “human life isunlimited, but short” hypothesis. This hypothesis builds upon the evidence that mortalitybeyond age 110 does not follow an increasing Gompertzian pattern, but instead plateausby age 110 at approximately 50% year-over-year mortality (see Robine and Vaupel 2002;Gampe 2010; later supported by Barbi et al. 2018; Feehan 2018; Belzile et al. 2020).Although the flattening of the mortality curve for supercentenarians may appear implau-sible, research suggests that these lucky individuals simply do not follow the mortalitypatterns of most people: For example, da Silva Antero-Jacquemin et al. (2015) found
http://www.demographic-research.org 1273
Pearce & Raftery: Probabilistic forecasting of maximum human lifespan by 2100
that Olympic athletes, presumably some of the world’s healthiest individuals, experiencemortality similar to the world population at large.
The hypothesized constant survival probability past age 110 suggests an exponentialsupercentenarian population model, which embodies the idea that human life is theoret-ically unbounded but unlikely to extend well beyond currently observed levels. The keycontribution of RZ was to estimate a density curve of the maximum human lifespan by2042 based on their model, using order statistics and a nonprobabilistic projection of thenumber of people to reach age 110 between 2018 and 2042.
This paper extends the work of RZ in three ways: (1) by incorporating Bayesianpopulation projections into a probabilistic and unconditional posterior density for maxi-mum human lifespan, (2) by extending the projections to 2100, and (3) by using updateddata from the IDL.
The paper is organized as follows. In Section 2 we review the exponential survivalmodel for supercentenarians and present updated estimates of the model for the IDLversion 3 data. In Section 3 we describe our methodology, and give results in Section 4.We conclude with a discussion in Section 5.
2. The exponential survival model for supercentenarians
2.1 Model
RZ tested a variety of supercentenarian survival models using statistical Extreme ValueTheory. Ultimately, they found that a simple, exponential survival model best fit the data.The exponential survival model beyond age 110 is notable for a few reasons. First, it isa single parameter distribution that does not incorporate any covariates, which suggeststhat survival probabilities are equivalent beyond age 110 regardless of sex, nationality, orgenetic background. Also, the exponential survival model suggests that the probability ofsurviving one additional year conditional on current age is constant, due to the memory-less property of the exponential distribution. It is worth noting that this model does notsuggest that equal numbers of people by sex, nationality, or genetic background will attainsupercentenarian ages, nor that populations are constant beyond age 110. Instead, it onlyimplies that conditional on attaining any age past 110, the probability of surviving oneadditional year is equal regardless of any other characteristic.
We now describe the model. Let X be a random variable that represents the age atdeath minus 110. Then,
X ∼ Exponential(λ), (1)
such that E[X] = 1λ and X has probability density function at age x equal to λe−λx.
1274 http://www.demographic-research.org
Demographic Research: Volume 44, Article 52
Then the probability of surviving one additional year, conditional on attaining some fixedage x at or beyond 110, is 1sx = e−λ, which is independent of x.
Now, suppose we have an independent and identically distributed sample of N peo-ple who attain age 110, and letX1, . . . ,XN be the ages at which they die, minus 110. LetX(N) = maxi=1,...,N Xi be the age at death of the person who survives longest past age110, also called the maximum order statistic of the ages at death. Then the probabilitydensity function of X(N) is
f(N)(x|λ) = Nλe−λx[1− e−λx]N−1 (2)
(De Haan and Ferreira 2007).RZ obtained a point estimate and confidence interval for λ using maximum likeli-
hood estimation that incorporated the truncation and sampling patterns present in the IDL(see Section 2.2 for details). They then obtained a point estimate and confidence intervalfor the number of people to attain age 110 in the period 2018–2042, N , as follows. Firstthey estimated the number of people to die in Italy, England and Wales, and the UnitedStates using Poisson regression with linear link function in the period 1980–1999. Theythen extrapolated to the period of interest and multiplied that estimate and confidenceinterval by the historical supercentenarian population ratio between those countries andall others represented in the IDL database. Ultimately, they estimated the mean of theexponential distribution, 1/λ, to be 1.34 with 95% confidence interval (1.22, 1.46) andN to be 2, 974 (2, 334, 3, 615). Plugging these values into equation (2) yields a densitycurve of maximum age at death in the period 2018–2042.
We now point out two issues with the analysis of RZ. First, the authors use a verysimple estimation technique to findN , which relies only on a portion of the populations ofinterest and fails to adequately capture the uncertainty in the population estimates, espe-cially since the number of people reaching advanced ages is expected to increase sharplyover the next several decades due to fast population growth. Second, their projection pe-riod covers only 25 years after publication, perhaps due to unwillingness to extrapolatefar beyond the population model’s training data. These issues will be resolved by the fullyBayesian method presented in Section 3. But first, we confirm the exponential survivalmodel and update RZ’s analysis using data in the most recent version of the IDL.
2.2 Application to IDL version 3 data
Since the original publication of the IDL in 2010, there have been two updates. The cur-rent version (“IDL v3”; described in Jdanov, Shkolnikov, and Gellers-Barkmann 2021)contains n = 1, 119 records of deceased individuals who attained at least age 110 andrepresent 13 countries: Austria, Belgium, Canada, Denmark, England and Wales, Fin-
http://www.demographic-research.org 1275
Pearce & Raftery: Probabilistic forecasting of maximum human lifespan by 2100
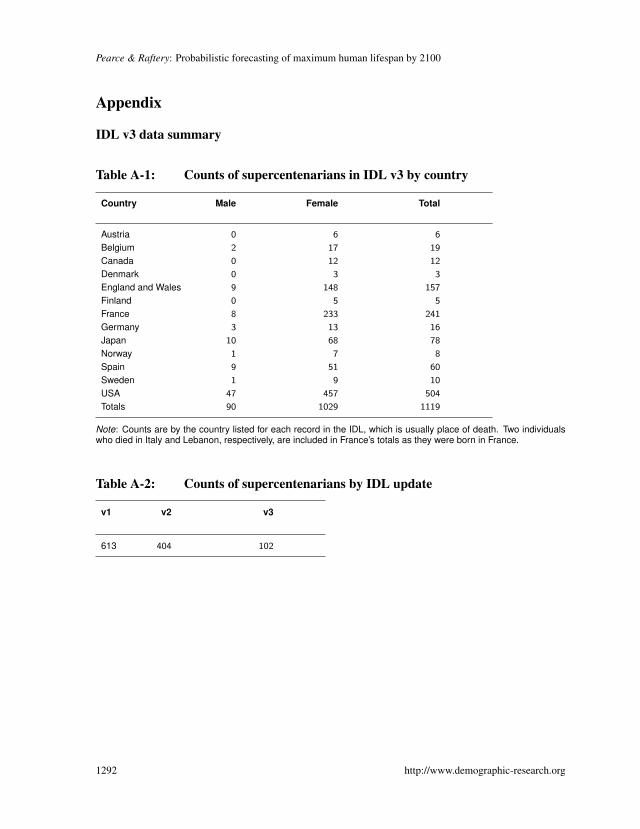
land, France, Germany, Japan, Norway, Spain, Sweden, and the United States, which wewill refer to as the “IDL countries.”3 In this collection, the five most represented countriesare the United States (504 observations), France (241), England and Wales (157), Japan(78), and Spain (60). We notice that the number of supercentenarians is roughly propor-tional to their comparative population sizes. A complete set of overall and sex-specificcounts for the IDL countries can be found in the Appendix Table A-1.
IDL v3 improved upon previous versions by adding additional supercentenarianrecords from existing countries and one additional country (Austria), and by remov-ing data from Australia that may have exhibited age-attainment bias. Unfortunately,there were also records removed from the IDL due to new privacy regulations, specifi-cally for supercentenarians from Switzerland and Italy (Jdanov, Shkolnikov, and Gellers-Barkmann 2021; Max Planck Institute for Demographic Research 2020).
The IDL v3 also includes the records of 13,931 individuals who died between theages of 105–109, called semisupercentenarians, who come from 9 of the 13 IDL coun-tries (there were no entries from Finland, Japan, Spain, or Sweden). The semisupercente-narian records were excluded from the analysis due to statistically significant evidencesuggesting a difference in mortality between semisupercentenarians and supercentenari-ans, as well as sex- and region-specific differences in mortality for the former group. SeeAppendix for details.
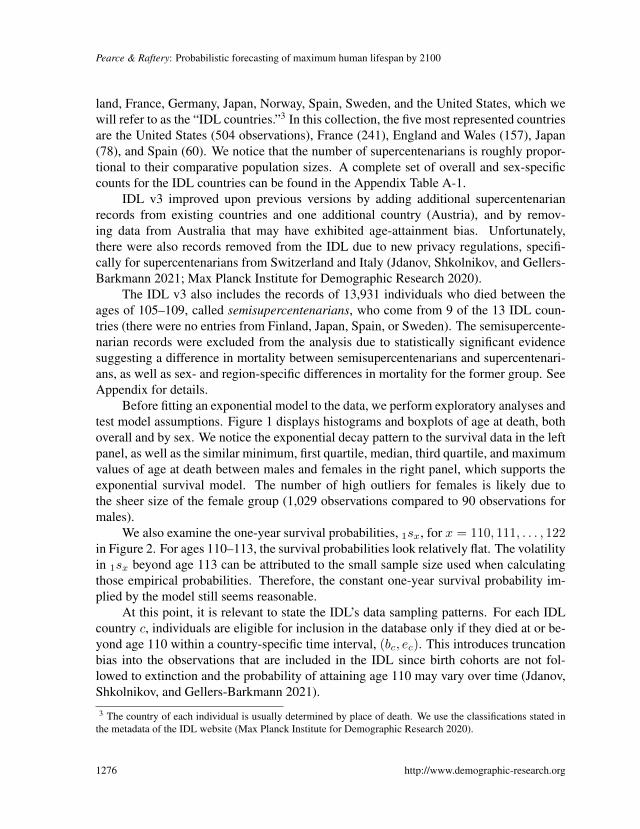
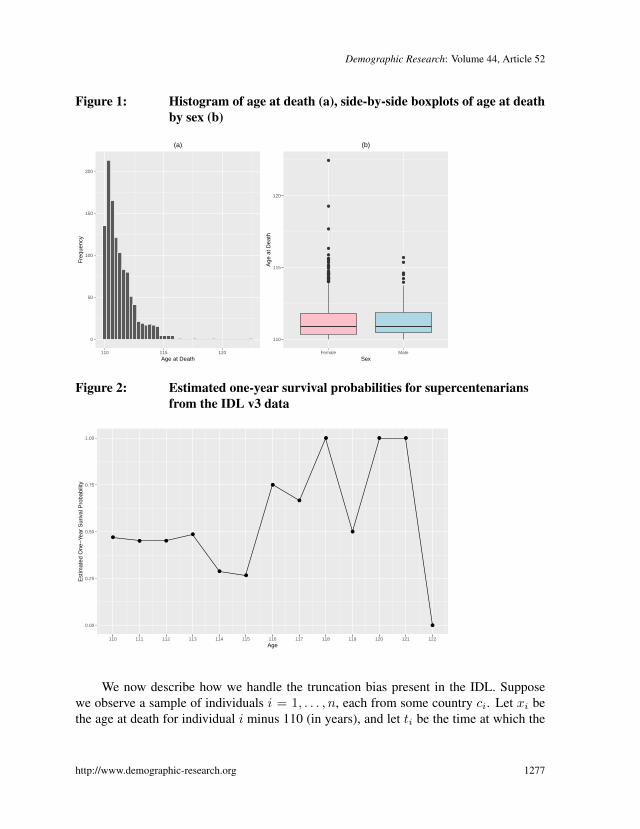
Before fitting an exponential model to the data, we perform exploratory analyses andtest model assumptions. Figure 1 displays histograms and boxplots of age at death, bothoverall and by sex. We notice the exponential decay pattern to the survival data in the leftpanel, as well as the similar minimum, first quartile, median, third quartile, and maximumvalues of age at death between males and females in the right panel, which supports theexponential survival model. The number of high outliers for females is likely due tothe sheer size of the female group (1,029 observations compared to 90 observations formales).
We also examine the one-year survival probabilities, 1sx, for x = 110, 111, . . . , 122in Figure 2. For ages 110–113, the survival probabilities look relatively flat. The volatilityin 1sx beyond age 113 can be attributed to the small sample size used when calculatingthose empirical probabilities. Therefore, the constant one-year survival probability im-plied by the model still seems reasonable.
At this point, it is relevant to state the IDL’s data sampling patterns. For each IDLcountry c, individuals are eligible for inclusion in the database only if they died at or be-yond age 110 within a country-specific time interval, (bc, ec). This introduces truncationbias into the observations that are included in the IDL since birth cohorts are not fol-lowed to extinction and the probability of attaining age 110 may vary over time (Jdanov,Shkolnikov, and Gellers-Barkmann 2021).
3 The country of each individual is usually determined by place of death. We use the classifications stated inthe metadata of the IDL website (Max Planck Institute for Demographic Research 2020).
1276 http://www.demographic-research.org
Demographic Research: Volume 44, Article 52
Figure 1: Histogram of age at death (a), side-by-side boxplots of age at deathby sex (b)
0
50
100
150
200
110 115 120Age at Death
Fre
quen
cy
(a)
●
●
●
●
●
●●
●●
●
●●●
●●●●
●
●
●●
●●
●
●
●
●
●
●
●
●
●
●●
●
●
●
●
●
●
●●
●
●
●●
●
●
●
●
●
●
●
110
115
120
Female MaleSex
Age
at D
eath
(b)
0
50
100
150
200
110 115 120Age at Death
Fre
quen
cy
(a)
●
●
●
●
●
●●
●●
●
●●●
●●●●
●
●
●●
●●
●
●
●
●
●
●
●
●
●
●●
●
●
●
●
●
●
●●
●
●
●●
●
●
●
●
●
●
●
110
115
120
Female MaleSex
Age
at D
eath
(b)
Figure 2: Estimated one-year survival probabilities for supercentenariansfrom the IDL v3 data
●● ●
●
●●
●
●
●
●
● ●
●0.00
0.25
0.50
0.75
1.00
110 111 112 113 114 115 116 117 118 119 120 121 122Age
Est
imat
ed O
ne−
Year
Sur
ival
Pro
babi
lity
We now describe how we handle the truncation bias present in the IDL. Supposewe observe a sample of individuals i = 1, . . . ,n, each from some country ci. Let xi bethe age at death for individual i minus 110 (in years), and let ti be the time at which the
http://www.demographic-research.org 1277
Pearce & Raftery: Probabilistic forecasting of maximum human lifespan by 2100
individual reached age 110. Then, let f and F be the probability and cumulative densityfunctions, respectively, for the distribution of age at death minus 110. For individuals inthe IDL, there are two cases to consider: (1) ti ≤ bci and (2) ti > bci .
In the first case, we only observe the individual if they lived long enough (but not toolong) after attaining at 110 to die within the interval (bci , eci). This truncates the range ofobservable excess ages. Thus, the individual’s contribution to the joint likelihood shouldbe
f(xi)
F (eci − ti)− F (bci − ti). (3)
In the second case, we only observe the individual if they do not live long enough to dieafter the year eci . Thus, the individual’s contribution to the joint likelihood should be
f(xi)
F (eci − ti). (4)
In all subsequent statistical tests and model fitting, the sampling pattern described aboveis incorporated. Country-specific intervals (bc, ec) are determined based on the IDL meta-data files.
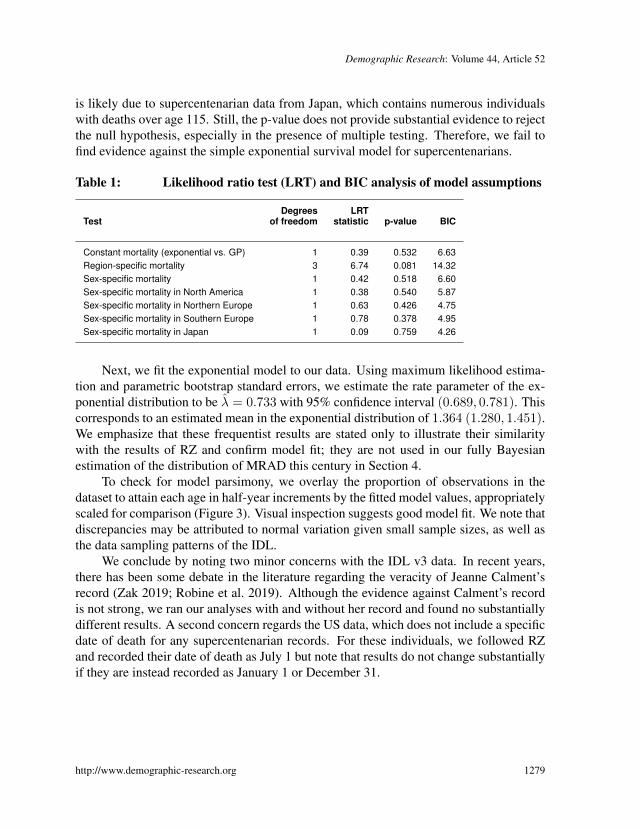
Now, we formally test the model assumptions of flat mortality and no differencesin mortality based on region or sex using likelihood ratio tests (LRT) and the BayesianInformation Criterion (BIC) as defined by Raftery (1995). For each of the tests describedbelow, a large p-value or a positive BIC indicates lack of evidence against the null hy-pothesis model, and a small p-value or a negative BIC indicates evidence in favor of thealternative hypothesis model. Results are shown in Table 1.
To look for evidence of nonconstant mortality after age 110, we test the null hypoth-esis of an exponential survival model against the alternative of a Generalized-Pareto (GP)model with location parameter µ = 0, which is a generalization of the exponential modelby inclusion of an additional shape parameter to allow for constant mortality. Findingno evidence against the null hypothesis of an exponential survival model, we then testfor differences in mortality based on region and sex, as well as sex-specific differenceswithin regions. In each test, the null hypothesis is of a single-parameter exponential sur-vival model (no differences in mortality based on sex or region), where the alternativehypothesis allows for differences in mortality based on sex or region.
We use four regions: North America (Canada and the United States), Northern Eu-rope (Belgium, England and Wales, Denmark, Finland, Germany, Norway, and Sweden),Southern Europe (Austria, France, and Spain), and Japan. Testing is generally not per-formed at the country level due to small sample sizes. In each test, we find no statisticallysignificant evidence to reject the null hypothesis. The single small p-value in Table 1
1278 http://www.demographic-research.org
Demographic Research: Volume 44, Article 52
is likely due to supercentenarian data from Japan, which contains numerous individualswith deaths over age 115. Still, the p-value does not provide substantial evidence to rejectthe null hypothesis, especially in the presence of multiple testing. Therefore, we fail tofind evidence against the simple exponential survival model for supercentenarians.
Table 1: Likelihood ratio test (LRT) and BIC analysis of model assumptions
Degrees LRTTest of freedom statistic p-value BIC
Constant mortality (exponential vs. GP) 1 0.39 0.532 6.63Region-specific mortality 3 6.74 0.081 14.32Sex-specific mortality 1 0.42 0.518 6.60Sex-specific mortality in North America 1 0.38 0.540 5.87Sex-specific mortality in Northern Europe 1 0.63 0.426 4.75Sex-specific mortality in Southern Europe 1 0.78 0.378 4.95Sex-specific mortality in Japan 1 0.09 0.759 4.26
Next, we fit the exponential model to our data. Using maximum likelihood estima-tion and parametric bootstrap standard errors, we estimate the rate parameter of the ex-ponential distribution to be λ = 0.733 with 95% confidence interval (0.689, 0.781). Thiscorresponds to an estimated mean in the exponential distribution of 1.364 (1.280, 1.451).We emphasize that these frequentist results are stated only to illustrate their similaritywith the results of RZ and confirm model fit; they are not used in our fully Bayesianestimation of the distribution of MRAD this century in Section 4.
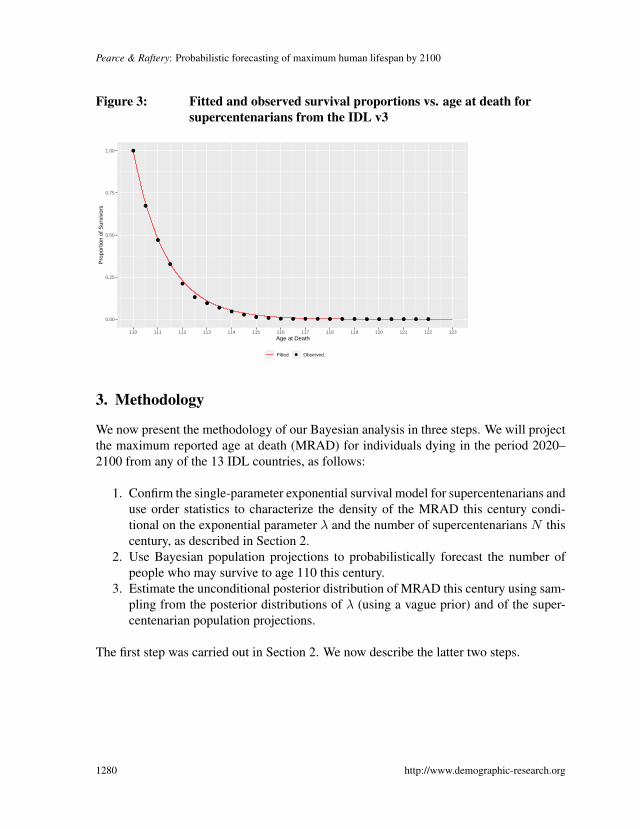
To check for model parsimony, we overlay the proportion of observations in thedataset to attain each age in half-year increments by the fitted model values, appropriatelyscaled for comparison (Figure 3). Visual inspection suggests good model fit. We note thatdiscrepancies may be attributed to normal variation given small sample sizes, as well asthe data sampling patterns of the IDL.
We conclude by noting two minor concerns with the IDL v3 data. In recent years,there has been some debate in the literature regarding the veracity of Jeanne Calment’srecord (Zak 2019; Robine et al. 2019). Although the evidence against Calment’s recordis not strong, we ran our analyses with and without her record and found no substantiallydifferent results. A second concern regards the US data, which does not include a specificdate of death for any supercentenarian records. For these individuals, we followed RZand recorded their date of death as July 1 but note that results do not change substantiallyif they are instead recorded as January 1 or December 31.
http://www.demographic-research.org 1279
Pearce & Raftery: Probabilistic forecasting of maximum human lifespan by 2100
Figure 3: Fitted and observed survival proportions vs. age at death forsupercentenarians from the IDL v3
●
●
●
●
●
●
●
●●
●● ● ● ● ● ● ● ● ● ● ● ● ● ● ●0.00
0.25
0.50
0.75
1.00
110 111 112 113 114 115 116 117 118 119 120 121 122 123Age at Death
Pro
port
ion
of S
urvi
vors
●Fitted Observed
3. Methodology
We now present the methodology of our Bayesian analysis in three steps. We will projectthe maximum reported age at death (MRAD) for individuals dying in the period 2020–2100 from any of the 13 IDL countries, as follows:
1. Confirm the single-parameter exponential survival model for supercentenarians anduse order statistics to characterize the density of the MRAD this century condi-tional on the exponential parameter λ and the number of supercentenarians N thiscentury, as described in Section 2.
2. Use Bayesian population projections to probabilistically forecast the number ofpeople who may survive to age 110 this century.
3. Estimate the unconditional posterior distribution of MRAD this century using sam-pling from the posterior distributions of λ (using a vague prior) and of the super-centenarian population projections.
The first step was carried out in Section 2. We now describe the latter two steps.
1280 http://www.demographic-research.org
Demographic Research: Volume 44, Article 52
3.1 Bayesian population projections
We create Bayesian population projections for the 13 IDL countries through 2080, whichroughly allows those attaining age 110 in 2080 sufficient time to die before 2100 (underthe assumption that MRAD will not extend far beyond age 130, which seems reasonablebased on the previous results and those seen in Section 4).
Bayesian population projections are obtained using the method first discussed inRaftery et al. (2012). These projections take account of uncertainty regarding futurelevels of total fertility and life expectancy using Bayesian hierarchical models, as wellas between-country correlation for fertility rates and between-sex correlation of life ex-pectancy (Alkema et al. 2011; Raftery et al. 2013; Fosdick and Raftery 2014; Sevcıkovaet al. 2016). This method has been used by the United Nations World Population Prospects(WPP) since 2015 (Raftery, Alkema, and Gerland 2014).
We note that the projection method of Raftery et al. (2012) does not make specificassumptions about flat mortality after age 110. However, it does account for age-, sex-,and country-specific mortality patterns across all age ranges over time. Details of theseassumptions can be found in Sevcıkova et al. (2016), which also shows that many coun-tries have flat or nearly-flat estimated mortality after age 110. Regardless, we find the flatmortality assumption reasonable due to our own testing in Section 2, as well as the widebody of literature to support this assumption as discussed in Section 1.
Specific projections are obtained through the R implementation of this method inthe package bayesPop (Sevcıkova and Raftery 2016). The package, however, only pro-vides the number of people reaching 5-year age ranges at 5-year intervals, so we developa method to estimate the total number of people to attain age 110 in each 5-year timeperiod. This is a particularly important step when modeling supercentenarians becauseso many individuals who reach age 110 will die before they reach even age 111, signif-icantly distorting the number of people alive in the age 110–114 age window from thenumber of people who attained age 110. The method is established through the followingproposition.
Suppose we observe P people in a 5-year age range, (x,x+5), at a given time, t. Ifwe assume that λ is the true exponential survival parameter and that people attained agex in uniform increments over the prior time period (t − 5, t), then the number of peopleto attain age x over the period (t− 5, t) is N =M × P , where
M =5λ
1− e−5λ. (5)
Suppose N people will attain age 110 in the interval (t − 5, t), spread uniformlyacross the time interval. Since the survival curve is dictated by the one-year survival
http://www.demographic-research.org 1281
Pearce & Raftery: Probabilistic forecasting of maximum human lifespan by 2100
probability 1sx = e−λ, we use the rectangle method to attain an estimate of the numberof people we should expect to observe at time t, denoted P , from the N original people:
P =N
5
∫ 5
0
e−λxdx
=N(1− e−5λ)
5λ.
Therefore, we have
N =5λP
1− e−5λ≡M × P
where M = 5λ1−e−5λ , as desired.
3.2 Unconditional density curve of MRAD this century
To obtain an unconditional density curve of MRAD this century, f(x), we first considerthe following expression based on the posterior distribution of λ given the IDL data, andthe posterior distribution of supercentenarian population projections, P , given the WPP2019 data (United Nations 2019) which is fed into the projection method:
f(x) =
∫ ∫f(x|P ,λ)f(P |WPP 2019 Data)f(λ|IDL Data) dPdλ
=
∫ ∫ [MλPλe
−λx[1− e−λx]MλP−1]f(P |WPP 2019 Data)f(λ|IDL Data) dPdλ. (6)
Equation (6) is obtained from the previous line using equations (5) and (2). Since wedo not have access to the analytic form of the posterior distribution of P , we instead ap-proximate the unconditional density f(x) by Monte Carlo using the following simulation
1282 http://www.demographic-research.org
Demographic Research: Volume 44, Article 52
algorithm:
Algorithm 1: Approximate MRAD Density Algorithm
for iteration = 1, . . . ,T doSample one value from the posterior distribution λ|IDL Data, specified
according to equation 7;Sample one value of P |WPP 2019 Data with replacement from the
population trajectories provided by bayesPop;Sample one value of x from the conditional distribution of x|P ,λ using the
fact that x|P ,λ is the maximum order statistic of an Exponential(λ) from asample of size MλP ;
end
The collection of the sampled values of x from Algorithm 1 will approximate theunconditional distribution of MRAD this century.
The first step of the algorithm is based on the Bayesian posterior of λ|X , where Xdenotes the sample of supercentenarian death ages from the IDL data. We note that ouranalysis must take into account the truncation present in the IDL, as discussed in Section2.2. We denote by C1 and C2 the sets of individuals i ∈ {1, . . . ,n} that exhibit case (1)or case (2) of truncation. Then, using the standard vague prior π(λ) ∝ 1/λ (Elfessi andReineke 2001), we see that,
f(λ|X) ∝ f(X|λ)π(λ)
=( n∏i=1
f(Xi|λ))π(λ)
=( ∏i∈C1
f(Xi|λ))( ∏
i∈C2
f(Xi|λ))π(λ)
∝( ∏i∈C1
λe−λXi
(1− e−λ(eci−ti))− (1− e−λ(bci−ti))
)( ∏i∈C2
λe−λXi
(1− e−λ(eci−ti))
)( 1λ
)=
λn−1e−λ∑ni=1Xi∏
i∈C1(e−λ(bci−ti) − e−λ(eci−ti))×
∏i∈C2
(1− e−λ(eci−ti)). (7)
4. Results
In this section, we carry out each step of the methodology described at the beginningof Section 3. Step 1 was completed in Section 2 by confirming the exponential survival
http://www.demographic-research.org 1283
Pearce & Raftery: Probabilistic forecasting of maximum human lifespan by 2100
model for supercentenarians and specifying the density of the maximum order statisticfor that model, conditional on the exponential rate parameter λ.
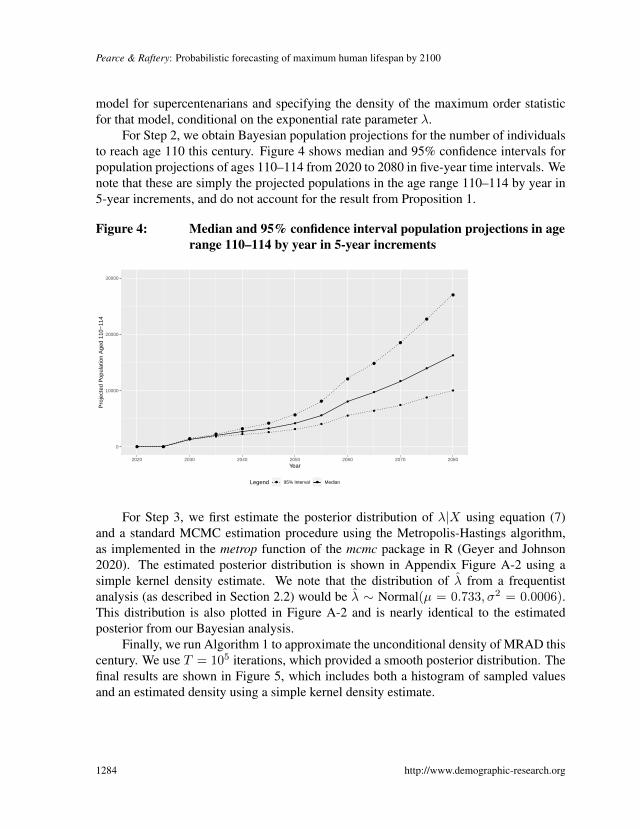
For Step 2, we obtain Bayesian population projections for the number of individualsto reach age 110 this century. Figure 4 shows median and 95% confidence intervals forpopulation projections of ages 110–114 from 2020 to 2080 in five-year time intervals. Wenote that these are simply the projected populations in the age range 110–114 by year in5-year increments, and do not account for the result from Proposition 1.
Figure 4: Median and 95% confidence interval population projections in agerange 110–114 by year in 5-year increments
● ●
●
●
●●
●
●
●
●
●
●
●
● ●
●●
●●
●
●
●
●
●
●
●
● ●
●
●
●
●
●
●
●
●
●
●
●
0
10000
20000
30000
2020 2030 2040 2050 2060 2070 2080Year
Pro
ject
ed P
opul
atio
n A
ged
110−
114
Legend ●● ●●95% Interval Median
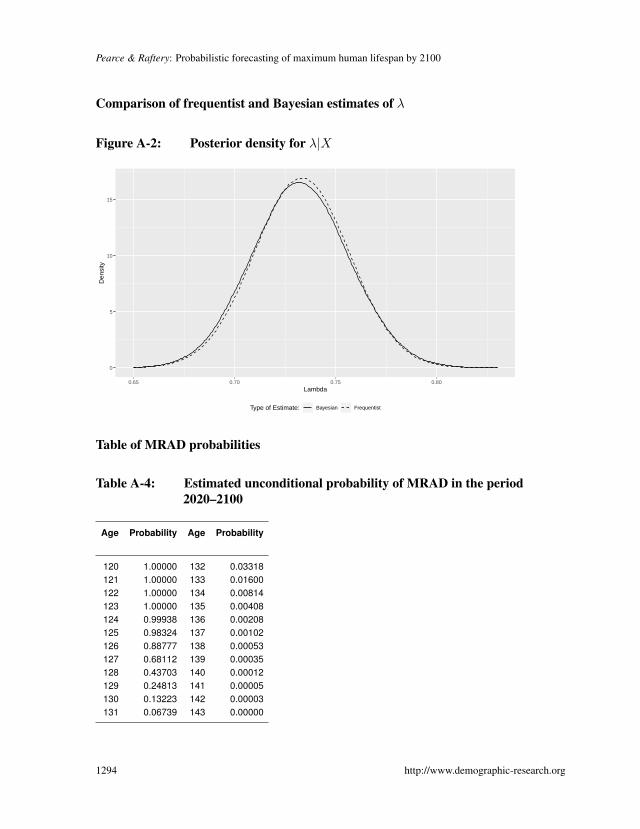
For Step 3, we first estimate the posterior distribution of λ|X using equation (7)and a standard MCMC estimation procedure using the Metropolis-Hastings algorithm,as implemented in the metrop function of the mcmc package in R (Geyer and Johnson2020). The estimated posterior distribution is shown in Appendix Figure A-2 using asimple kernel density estimate. We note that the distribution of λ from a frequentistanalysis (as described in Section 2.2) would be λ ∼ Normal(µ = 0.733,σ2 = 0.0006).This distribution is also plotted in Figure A-2 and is nearly identical to the estimatedposterior from our Bayesian analysis.
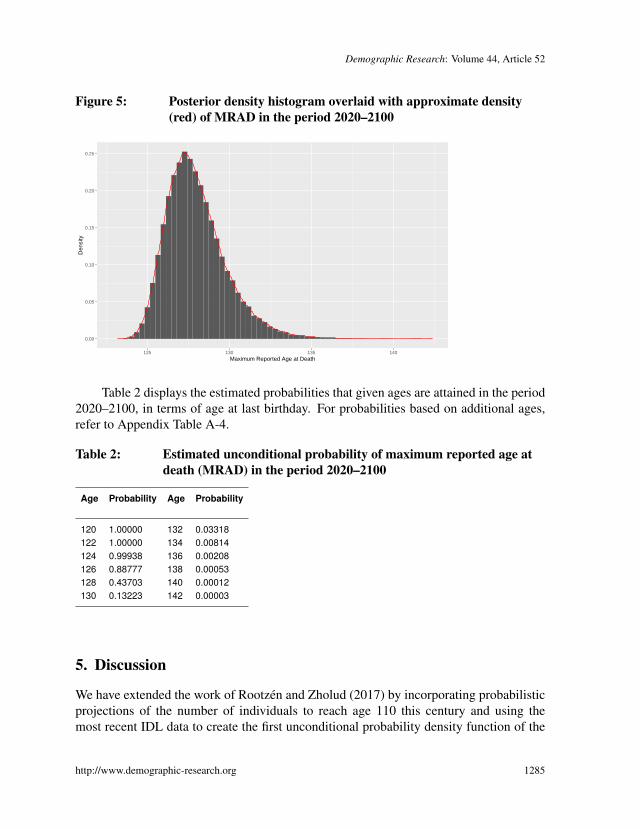
Finally, we run Algorithm 1 to approximate the unconditional density of MRAD thiscentury. We use T = 105 iterations, which provided a smooth posterior distribution. Thefinal results are shown in Figure 5, which includes both a histogram of sampled valuesand an estimated density using a simple kernel density estimate.
1284 http://www.demographic-research.org
Demographic Research: Volume 44, Article 52
Figure 5: Posterior density histogram overlaid with approximate density(red) of MRAD in the period 2020–2100
0.00
0.05
0.10
0.15
0.20
0.25
125 130 135 140Maximum Reported Age at Death
Den
sity
Table 2 displays the estimated probabilities that given ages are attained in the period2020–2100, in terms of age at last birthday. For probabilities based on additional ages,refer to Appendix Table A-4.
Table 2: Estimated unconditional probability of maximum reported age atdeath (MRAD) in the period 2020–2100
Age Probability Age Probability
120 1.00000 132 0.03318122 1.00000 134 0.00814124 0.99938 136 0.00208126 0.88777 138 0.00053128 0.43703 140 0.00012130 0.13223 142 0.00003
5. Discussion
We have extended the work of Rootzen and Zholud (2017) by incorporating probabilisticprojections of the number of individuals to reach age 110 this century and using themost recent IDL data to create the first unconditional probability density function of the
http://www.demographic-research.org 1285
Pearce & Raftery: Probabilistic forecasting of maximum human lifespan by 2100
maximum reported age at death (MRAD) this century with a fully Bayesian approach.Based on this methodology, we find that the probability of breaking the current MRADrecord (122 years and 164 days, set by Jeanne Calment of France) this century is near1, the probability of a person reaching age 126 is very high at approximately 89%, andthe probability of a person reaching age 130 is still reasonable at nearly 13%. Althoughpossible under the model, it is extremely unlikely that a person will attain age 135 or 140this century.
Our results may be viewed as a way to resolve the apparent conflict between a limitto human lifespan and the lack of any specific bound to human life. The exponentialsurvival model for supercentenarians suggests that the MRAD will continue to increaseas more and more people reach age 110. However, the high year-over-year mortality ratesimplied by the model also suggest that the frequency at which these records are brokenis likely to slow unless there are order of magnitude increases to the number of peopleto reach age 110. Under the most recent IDL data and population projections, it is quitelikely that someone will reach age 125 this century, but not age 135.
There are a few details of the model to discuss. First, we note that technically ourmodel applies only to supercentenarians who die on or after January 1, 2020, and not toany currently living supercentenarians. Ultimately, we believe their omission from ourprojections is (1) necessary due to data quality issues and (2) will not impact the resultssubstantially. Regarding the first point, the available data from the IDL only includessupercentenarians who have already died. Although records of many alive individualswho reached age 110 by 2020 are quite possibly accurate, we do not have a unified andwell-documented verification source that is free of age-attainment bias.
Regarding the second point, the key observation is that the number of supercente-narians alive on January 1st, 2020 is not sizable. As previously mentioned, order of mag-nitude increases to supercentenarian populations are necessary to meaningfully changethe distribution of MRAD this century; the projections presented in Section 4 do notshow any significant supercentenarian population until at least 2030. Furthermore, thereare too few individuals alive today who are old enough to be likely to break the currentMRAD. The current oldest living human is Kane Tanaka of Japan at age 118, with justthree other individuals older than age 115. These records were verified by the Gerontol-ogy Research Group (GRG) which may not necessarily uphold the rigorous standards ofthe IDL (Gerontology Research Group 2021).
Also, the projections apply only to individuals from one of the 13 IDL countrieslisted in Section 2. Since the single-parameter exponential survival model for super-centenarians can be verified only for individuals from these countries, we have omittedindividuals projected to reach age 110 from other countries from our analysis. This choicecan only make our results more conservative as the probability that an individual from aIDL country becomes the record holder for MRAD this century is nonzero.
In any analysis of this type, it is important to emphasize the dependence of results
1286 http://www.demographic-research.org

Demographic Research: Volume 44, Article 52
on the accuracy of the supercentenarian survival data. Although the IDL provides anextremely rigorous verification of supercentenarians within country-specific periods, in-accuracies or missing data may bias the results. Records excluded from the IDL becausethey lack verification documents may in fact be “missing not at random” and bias theresults up or down. Furthermore, there is always the possibility of age-attainment biasinfluencing the data, despite the best efforts of the IDL. As pointed out by Jdanov, Shkol-nikov, and Gellers-Barkmann (2021), the enactment of new regulations will make theaccurate collection and publication of supercentenarian records more challenging, sincemore and more records may be removed or excluded from the database as time progresses.If, for example, record-breaking individuals must be removed due to privacy protectionlaws, results will be biased low.
Regardless, as more and more people attain age 110 in the coming decades, it willbe important to reverify the assumptions made in this analysis. Specifically, it will benecessary to confirm the flat mortality assumption and assumptions of no region- or sex-specific differences in mortality conditional on attaining age 110. If these assumptionsdo not continue to hold, our projection of the MRAD by 2100 may not either.
In summary, we have found that the probability an individual exceeds the currentrecord for maximum reported age at death this century is near 1, although it is unlikelythat any individual will live beyond age 135. Moreover, increases to the age record dependheavily upon substantial increases to the number of people to attain age 110 in the comingdecades. Projected supercentenarian population increases suggest that ages previouslyargued to be impossible may soon be attained.
6. Acknowledgements
We are grateful to the editor and two anonymous reviewers for their helpful comments.This work was supported by NICHD grant R01 HD070936. Views expressed in thisarticle are those of the authors and do not necessarily reflect those of NIH.
http://www.demographic-research.org 1287

Pearce & Raftery: Probabilistic forecasting of maximum human lifespan by 2100
References
Alkema, L., Raftery, A.E., Gerland, P., Clark, S.J., Pelletier, F., Buettner, T., and Heilig,G.K. (2011). Probabilistic projections of the total fertility rate for all countries. De-mography 48(3): 815–839. doi:10.1007/s13524-011-0040-5.
Barbi, E., Lagona, F., Marsili, M., Vaupel, J.W., and Wachter, K.W. (2018). The plateau ofhuman mortality: Demography of longevity pioneers. Science 360(6396): 1459–1461.doi:10.1126/science.aat3119.
Belzile, L.R., Davison, A.C., Rootzen, H., and Zholud, D. (2020). Human mortality atextreme age. Ithaca: Cornell University (arXiv preprint arXiv:2001.04507).
Ben-Haim, M.S., Kanfi, Y., Mitchell, S.J., Maoz, N., Vaughan, K.L., Amariglio, N.,Lerrer, B., de Cabo, R., Rechavi, G., and Cohen, H.Y. (2017). Breaking the ceiling ofhuman maximal life span. The Journals of Gerontology: Series A 73(11): 1465–1471.doi:10.1093/gerona/glx219.
Campisi, J., Kapahi, P., Lithgow, G.J., Melov, S., Newman, J.C., and Verdin, E. (2019).From discoveries in ageing research to therapeutics for healthy ageing. Nature 571:183–192. doi:10.1038/s41586-019-1365-2.
Carnes, B.A. and Olshansky, S.J. (2007). A realist view of aging, mortality, and futurelongevity. Population and Development Review 33(2): 367–381.
da Silva Antero-Jacquemin, J., Berthelot, G., Marck, A., Noirez, P., Latouche, A., andToussaint, J.F. (2015). Learning from leaders: Life-span trends in Olympians andsupercentenarians. The Journals of Gerontology. Series A, Biological Sciences andMedical Sciences 70(8): 940–949. doi:10.1093/gerona/glu130.
de Beer, J., Bardoutsos, A., and Janssen, F. (2017). Maximum human lifespan mayincrease to 125 years. Nature 546(7660): e16–e17. doi:10.1038/nature22792.
De Haan, L. and Ferreira, A. (2007). Extreme value theory: An introduction. Berlin:Springer Science and Business Media.
Dong, X., Milholland, B., and Vijg, J. (2016). Evidence for a limit to human lifespan.Nature 538(7624): 257–259. doi:10.1038/nature19793.
Elfessi, A. and Reineke, D.M. (2001). A Bayesian look at classical estima-tion: The exponential distribution. Journal of Statistics Education 9(1): 1–7.doi:10.1080/10691898.2001.11910648.
Feehan, D.M. (2018). Separating the signal from the noise: Evidence for deceleration inold-age death rates. Demography 55(6): 2025–2044. doi:10.1007/s13524-018-0728-x.
Flatt, T. and Partridge, L. (2018). Horizons in the evolution of aging. BMC Biology 16(1):
1288 http://www.demographic-research.org
Demographic Research: Volume 44, Article 52
1–13. doi:10.1186/s12915-018-0562-z.
Fosdick, B.K. and Raftery, A.E. (2014). Regional probabilistic fertility forecasting bymodeling between-country correlations. Demographic Research 30(35): 1011–1034.doi:10.4054/DemRes.2014.30.35.
Gampe, J. (2010). Human mortality beyond age 110. In: Maier, H., Gampe, J., Jeune, B.,Robine, J.M., and Vaupel, J.W. (eds.). Supercentenarians. Berlin: Springer: 219–230.doi:10.1007/978-3-642-11520-213.
Gavrilov, L.A., Krut’ko, V.N., and Gavrilova, N.S. (2017). The future of human longevity.Gerontology 63(6): 524–526. doi:10.1159/000477965.
Gerontology Research Group (2021). GRG world supercentenarian rankings list.https://grg.org/WSRL/TableE.aspx. Accessed: 2021-02-04.
Geyer, C.J. and Johnson, L.T. (2020). MCMC: Markov Chain Monte Carlo. R packageversion 0.9-7. https://CRAN.R-project.org/package=mcmc.
Hayflick, L. (2007). Biological aging is no longer an unsolved problem. Annals of theNew York Academy of Sciences 1100: 1–13. doi:10.1196/annals.1395.001.
Hughes, B.G. and Hekimi, S. (2017). Many possible maximum lifespan trajectories.Nature 546: e8–e9. doi:10.1038/nature22786.
Jdanov, D.A., Shkolnikov, V.M., and Gellers-Barkmann, S. (2021). The internationaldatabase on longevity: Data resource profile. In: Maier, H., Jeune, B., and Vaupel,J.W. (eds.). Exceptional lifespans. Cham: Springer International Publishing: 13–25.doi:10.1007/978-3-030-49970-92.
Kirkwood, T.B.L. (2017). Why and how are we living longer? Experimental Physiology102(9): 1067–1074. doi:10.1113/EP086205.
Le Bourg, E. (2012). Forecasting continuously increasing life expectancy: What impli-cations? Ageing Research Reviews 11(2): 325–328. doi:10.1016/j.arr.2012.01.002.
Le Bourg, E. and Vijg, J. (2017). The future of human longevity: Time for a reality check.Gerontology 63(6): 527–528. doi:10.1159/000478891.
Lenart, A. and Vaupel, J.W. (2017). Questionable evidence for a limit to human lifespan.Nature 546(7660): e13–e14. doi:10.1038/nature22790.
Marck, A., Antero, J., Berthelot, G., Sauliere, G., Jancovici, J.M., Masson-Delmotte,V., Boeuf, G., Spedding, M., Le Bourg, E., and Toussaint, J.F. (2017). Arewe reaching the limits of Homo sapiens? Frontiers in Physiology 8: 812.doi:10.3389/fphys.2017.00812.
Max Planck Institute for Demographic Research (2020). International database on
http://www.demographic-research.org 1289
Pearce & Raftery: Probabilistic forecasting of maximum human lifespan by 2100
longevity. Munich: IDL. https://www.supercentenarians.org/. Accessed: 2021-01-13.
Oeppen, J. and Vaupel, J.W. (2002). Broken limits to life expectancy. Science 296(5570):1029–1031. doi:10.1126/science.1069675.
Olshansky, S.J. and Carnes, B.A. (2009). The future of human longevity. In: Uhlenberg,P. (ed.). International handbook of population aging. Dordrecht: Springer: 731–745.doi:10.1007/978-1-4020-8356-333.
Olshansky, S.J. and Carnes, B.A. (2019). Inconvenient truths about humanlongevity. The Journals of Gerontology: Series A 74(Supplement 1): s7–s12.doi:10.1093/gerona/glz098.
Olshansky, S.J., Carnes, B.A., and Cassel, C. (1990). In search of Methuselah: Estimatingthe upper limits to human longevity. Science 250(4981): 634–640.
Olshansky, S.J., Carnes, B.A., and Desesquelles, A. (2001). Prospects for humanlongevity. Science 291(5508): 1491–1492. doi:10.1126/science.291.5508.1491.
Pignolo, R.J. (2019). Exceptional human longevity. Mayo Clinic Proceedings 94(1):110–124. doi:10.1016/j.mayocp.2018.10.005.
Poulain, M. (2010). On the age validation of supercentenarians. In: Maier, H., Gampe, J.,Jeune, B., Robine, J.M., and Vaupel, J.W. (eds.). Supercentenarians. Berlin: Springer:3–30. doi:10.1007/978-3-642-11520-21.
Raftery, A.E. (1995). Bayesian model selection in social research. Sociological Method-ology 25: 111–163. doi:10.2307/271063.
Raftery, A.E., Alkema, L., and Gerland, P. (2014). Bayesian population projections forthe United Nations. Statistical Science: A Review Journal of the Institute of Mathe-matical Statistics 29(1): 58–68. doi:10.1214/13-STS419.
Raftery, A.E., Chunn, J.L., Gerland, P., and Sevcıkova, H. (2013). Bayesian probabilisticprojections of life expectancy for all countries. Demography 50(3): 777–801.
Raftery, A.E., Li, N., Sevcıkova, H., Gerland, P., and Heilig, G.K. (2012). Bayesian prob-abilistic population projections for all countries. Proceedings of the National Academyof Sciences 109(35): 13915–13921.
Robine, J.M., Allard, M., Herrmann, F.R., and Jeune, B. (2019). The real facts supportingJeanne Calment as the oldest ever human. The Journals of Gerontology: Series A 74(1):s13–s20. doi:10.1093/gerona/glz198.
Robine, J.M. and Cubaynes, S. (2017). Worldwide demography of centenarians. Mecha-nisms of Ageing and Development 165: 59–67. doi:10.1016/j.mad.2017.03.004.
Robine, J.M. and Vaupel, J. (2002). Emergence of supercentenarians in
1290 http://www.demographic-research.org
Demographic Research: Volume 44, Article 52
low mortality countries. North American Actuarial Journal 6: 54–63.doi:10.1080/10920277.2002.10596057.
Rootzen, H. and Zholud, D. (2017). Human life is unlimited – but short. Extremes 20(4):713–728. doi:10.1007/s10687-017-0305-5.
Rozing, M.P., Kirkwood, T.B.L., and Westendorp, R.G.J. (2017). Is there evidence for alimit to human lifespan? Nature 546: e11–e12. doi:10.1038/nature22788.
Sevcıkova, H., Li, N., Kantorova, V., Gerland, P., and Raftery, A.E. (2016). Age-specificmortality and fertility rates for probabilistic population projections. In: Dynamic de-mographic analysis. Cham: Springer: 285–310.
Sevcıkova, H. and Raftery, A.E. (2016). bayesPop: Probabilistic population projections.Journal of Statistical Software 75(5): 1–29. doi:10.18637/jss.v075.i05.
Steenstrup, T., Kark, J.D., Verhulst, S., Thinggaard, M., Hjelmborg, J.V., Dalgard,C., Kyvik, K.O., Christiansen, L., Mangino, M., Spector, T.D. et al. (2017).Telomeres and the natural lifespan limit in humans. Aging 9(4): 1130—1142.doi:10.18632/aging.101216.
United Nations (2019). World population prospects: The 2019 revision. New York:United Nations.
Vaupel, J.W. (1997). The average French baby may live 95 or 100 years. In: Robine, J.M.,Vaupel, J.W., Jeune, B., and Allard, M. (eds.). Longevity: To the limits and beyond.Berlin: Springer, 11–27.
Vijg, J. and Le Bourg, E. (2017). Aging and the inevitable limit to human life span.Gerontology 63(5): 432–434. doi:10.1159/000477210.
Wilmoth, J.R. (2000). Demography of longevity: past, present, and future trends. Exper-imental Gerontology 35(9–10): 1111–1129. doi:10.1016/s0531-5565(00)00194-7.
Zak, N. (2019). Evidence that Jeanne Calment died in 1934 – not 1997. RejuvenationResearch 22(1): 3–12. doi:10.1089/rej.2018.2167.
http://www.demographic-research.org 1291
Pearce & Raftery: Probabilistic forecasting of maximum human lifespan by 2100
Appendix
IDL v3 data summary
Table A-1: Counts of supercentenarians in IDL v3 by country
Country Male Female Total
Austria 0 6 6
Belgium 2 17 19
Canada 0 12 12
Denmark 0 3 3
England and Wales 9 148 157
Finland 0 5 5
France 8 233 241
Germany 3 13 16
Japan 10 68 78
Norway 1 7 8
Spain 9 51 60
Sweden 1 9 10
USA 47 457 504
Totals 90 1029 1119
Note: Counts are by the country listed for each record in the IDL, which is usually place of death. Two individualswho died in Italy and Lebanon, respectively, are included in France’s totals as they were born in France.
Table A-2: Counts of supercentenarians by IDL update
v1 v2 v3
613 404 102
1292 http://www.demographic-research.org
Demographic Research: Volume 44, Article 52
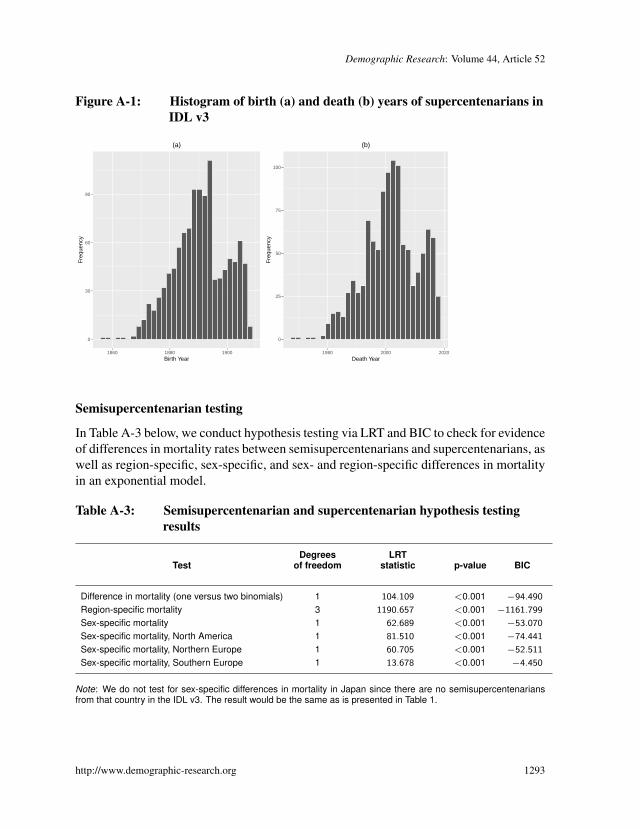
Figure A-1: Histogram of birth (a) and death (b) years of supercentenarians inIDL v3
0
30
60
90
1860 1880 1900Birth Year
Fre
quen
cy
(a)
0
25
50
75
100
1980 2000 2020Death Year
Fre
quen
cy
(b)
0
30
60
90
1860 1880 1900Birth Year
Fre
quen
cy
(a)
0
25
50
75
100
1980 2000 2020Death Year
Fre
quen
cy
(b)
Semisupercentenarian testing
In Table A-3 below, we conduct hypothesis testing via LRT and BIC to check for evidenceof differences in mortality rates between semisupercentenarians and supercentenarians, aswell as region-specific, sex-specific, and sex- and region-specific differences in mortalityin an exponential model.
Table A-3: Semisupercentenarian and supercentenarian hypothesis testingresults
Degrees LRTTest of freedom statistic p-value BIC
Difference in mortality (one versus two binomials) 1 104.109 <0.001 −94.490Region-specific mortality 3 1190.657 <0.001 −1161.799Sex-specific mortality 1 62.689 <0.001 −53.070Sex-specific mortality, North America 1 81.510 <0.001 −74.441Sex-specific mortality, Northern Europe 1 60.705 <0.001 −52.511Sex-specific mortality, Southern Europe 1 13.678 <0.001 −4.450
Note: We do not test for sex-specific differences in mortality in Japan since there are no semisupercentenariansfrom that country in the IDL v3. The result would be the same as is presented in Table 1.
http://www.demographic-research.org 1293
Pearce & Raftery: Probabilistic forecasting of maximum human lifespan by 2100
Comparison of frequentist and Bayesian estimates of λ
Figure A-2: Posterior density for λ|X
0
5
10
15
0.65 0.70 0.75 0.80Lambda
Den
sity
Type of Estimate: Bayesian Frequentist
Table of MRAD probabilities
Table A-4: Estimated unconditional probability of MRAD in the period2020–2100
Age Probability Age Probability
120 1.00000 132 0.03318121 1.00000 133 0.01600122 1.00000 134 0.00814123 1.00000 135 0.00408124 0.99938 136 0.00208125 0.98324 137 0.00102126 0.88777 138 0.00053127 0.68112 139 0.00035128 0.43703 140 0.00012129 0.24813 141 0.00005130 0.13223 142 0.00003131 0.06739 143 0.00000
1294 http://www.demographic-research.org