Embed Size (px)
Citation preview
Probabilistic Forecasting
pdfs and Histograms
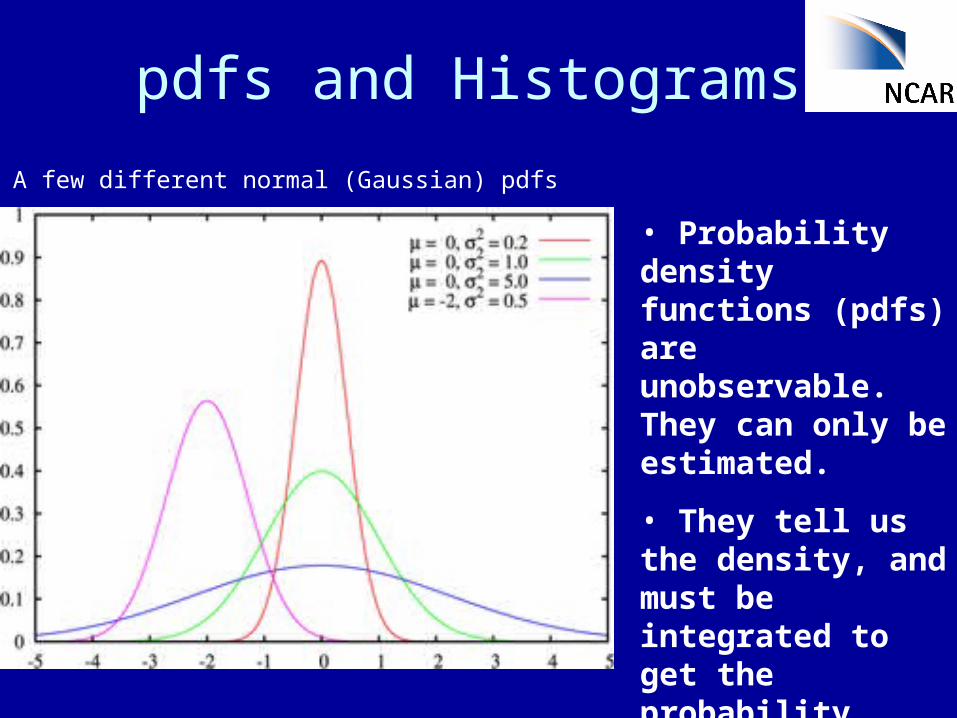
• Probability density functions (pdfs) are unobservable. They can only be estimated.
• They tell us the density, and must be integrated to get the probability.
A few different normal (Gaussian) pdfs
pdfs and Histograms
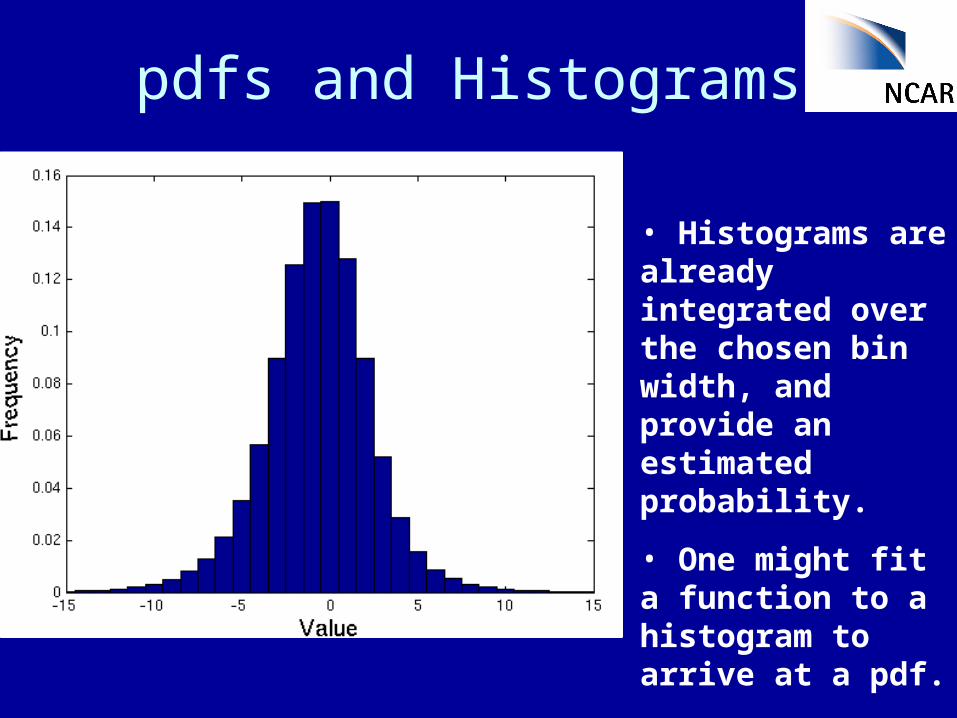
• Histograms are already integrated over the chosen bin width, and provide an estimated probability.
• One might fit a function to a histogram to arrive at a pdf.
pdfs and Histograms
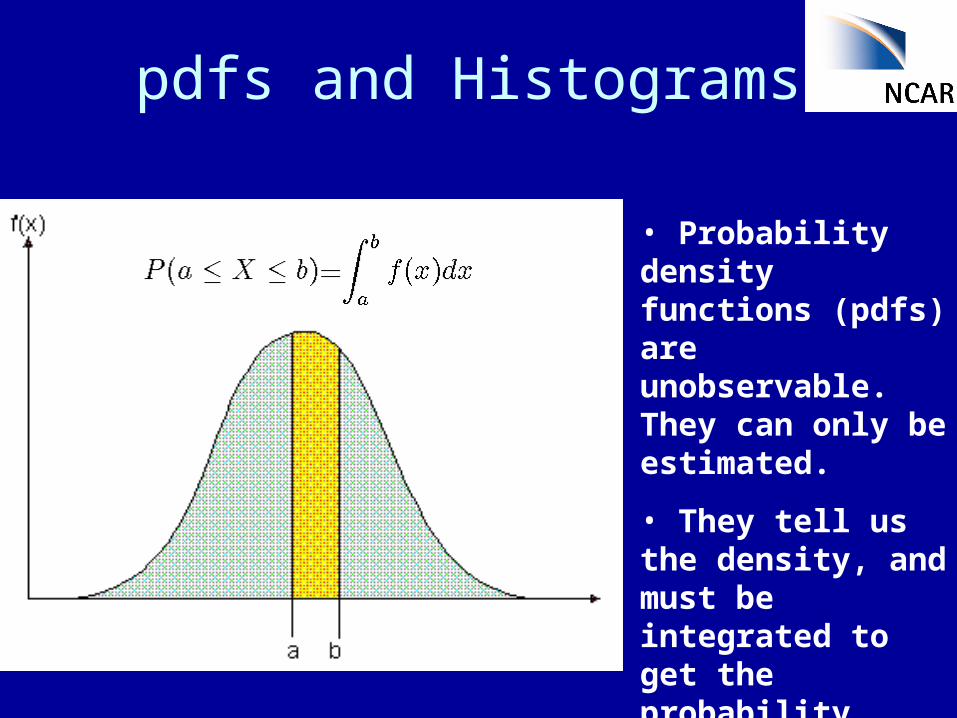
• Probability density functions (pdfs) are unobservable. They can only be estimated.
• They tell us the density, and must be integrated to get the probability.
cdfs and thresholds
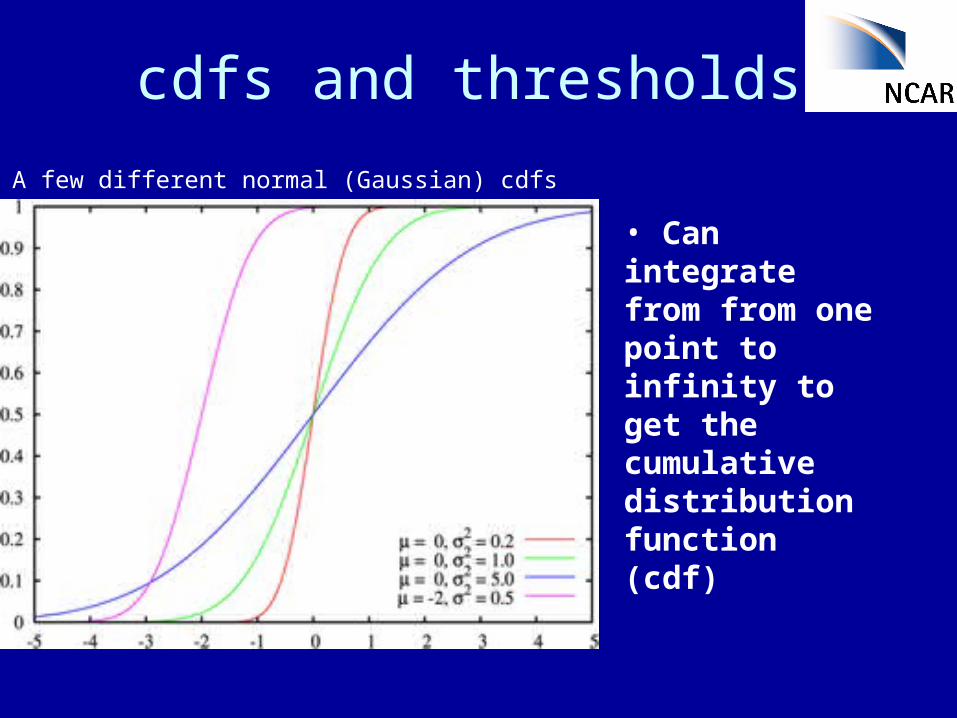
• Can integrate from from one point to infinity to get the cumulative distribution function (cdf)
A few different normal (Gaussian) cdfs
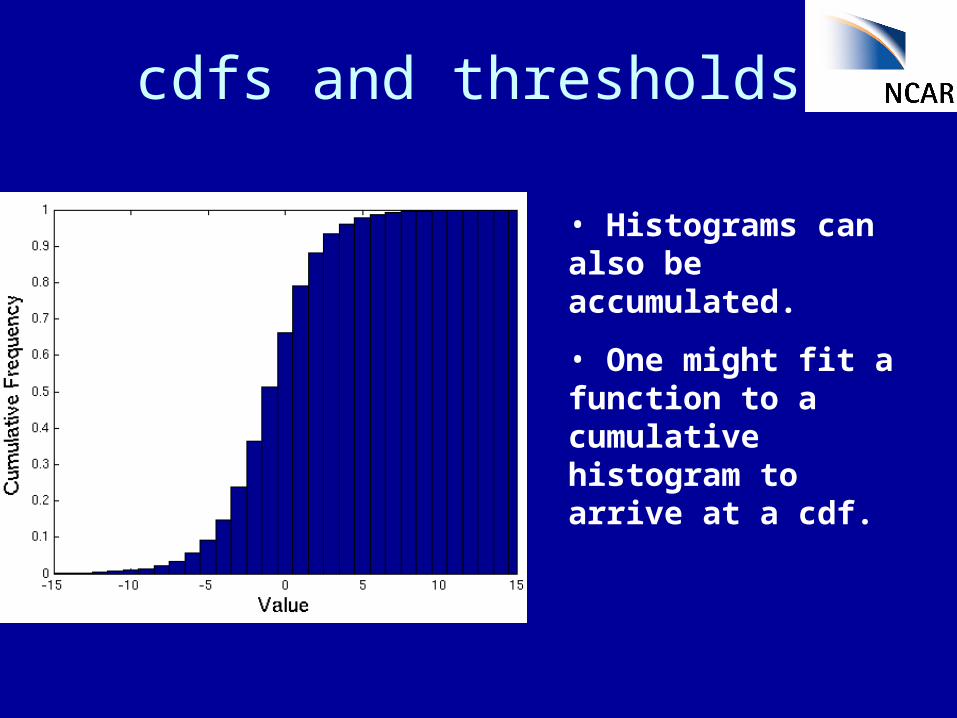
cdfs and thresholds
• Histograms can also be accumulated.
• One might fit a function to a cumulative histogram to arrive at a cdf.
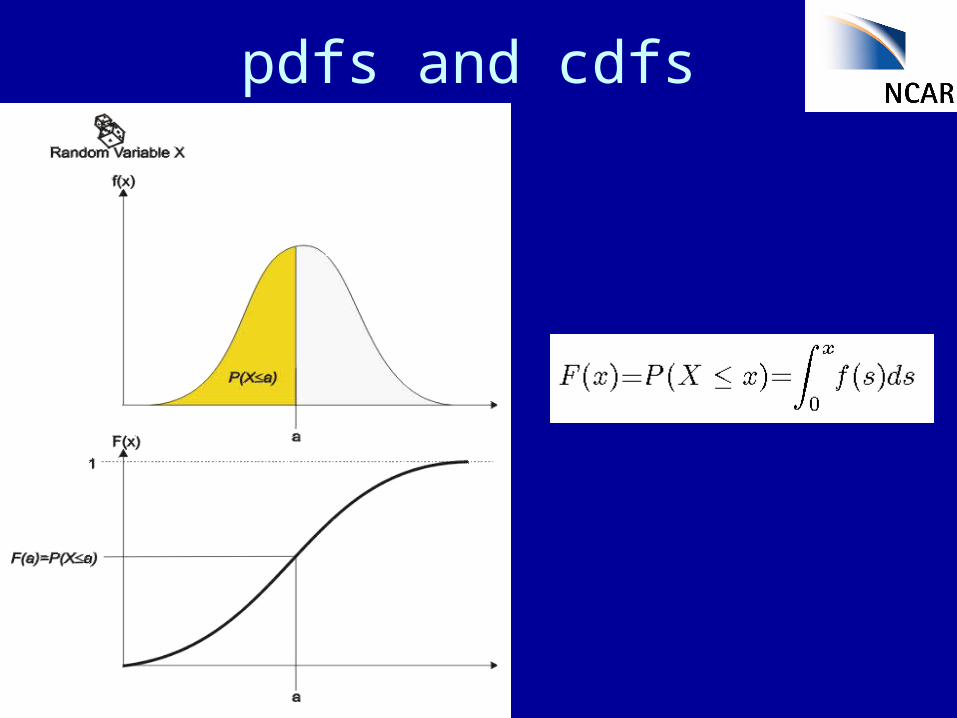
pdfs and cdfs
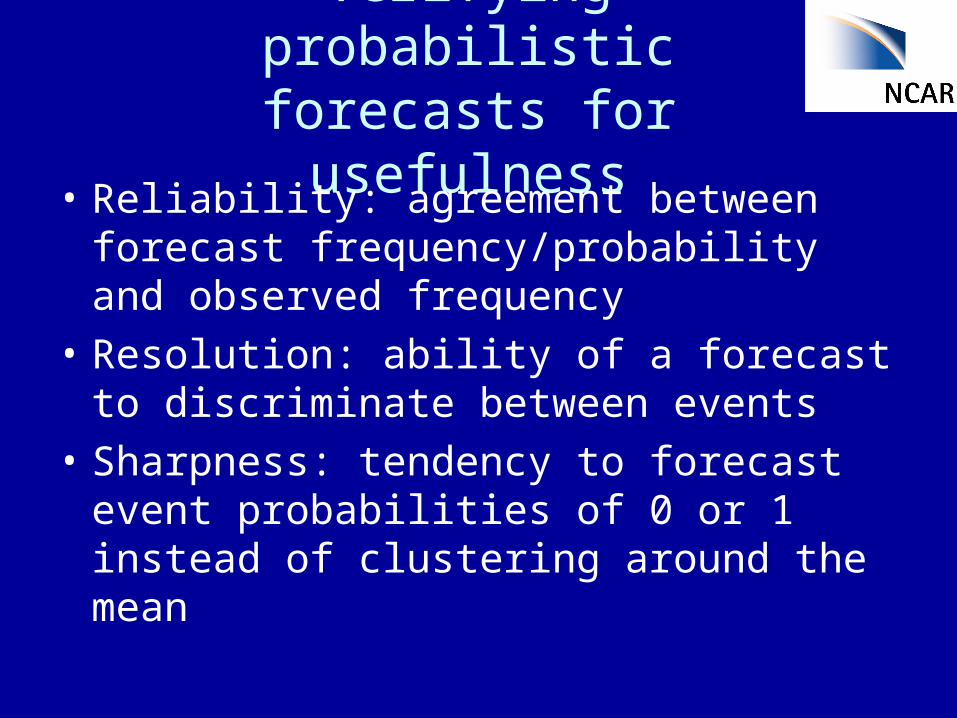
Verifying probabilistic forecasts for usefulness
• Reliability: agreement between forecast frequency/probability and observed frequency
• Resolution: ability of a forecast to discriminate between events
• Sharpness: tendency to forecast event probabilities of 0 or 1 instead of clustering around the mean
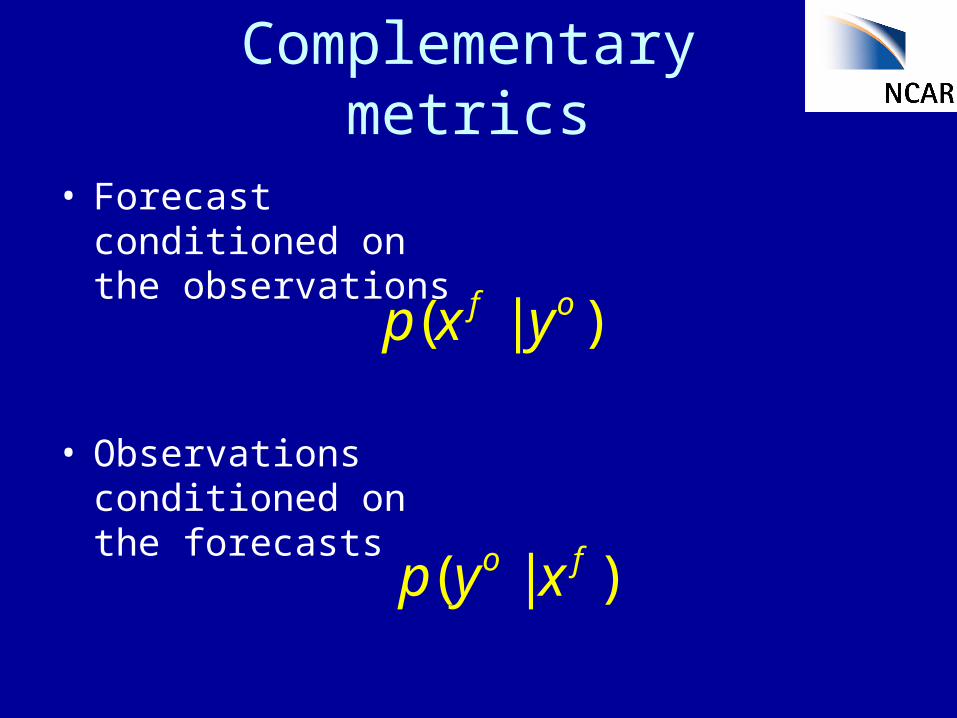
Complementary metrics
• Forecast conditioned on the observations
• Observations conditioned on the forecasts
( | )o fp y x
( | )f op x y
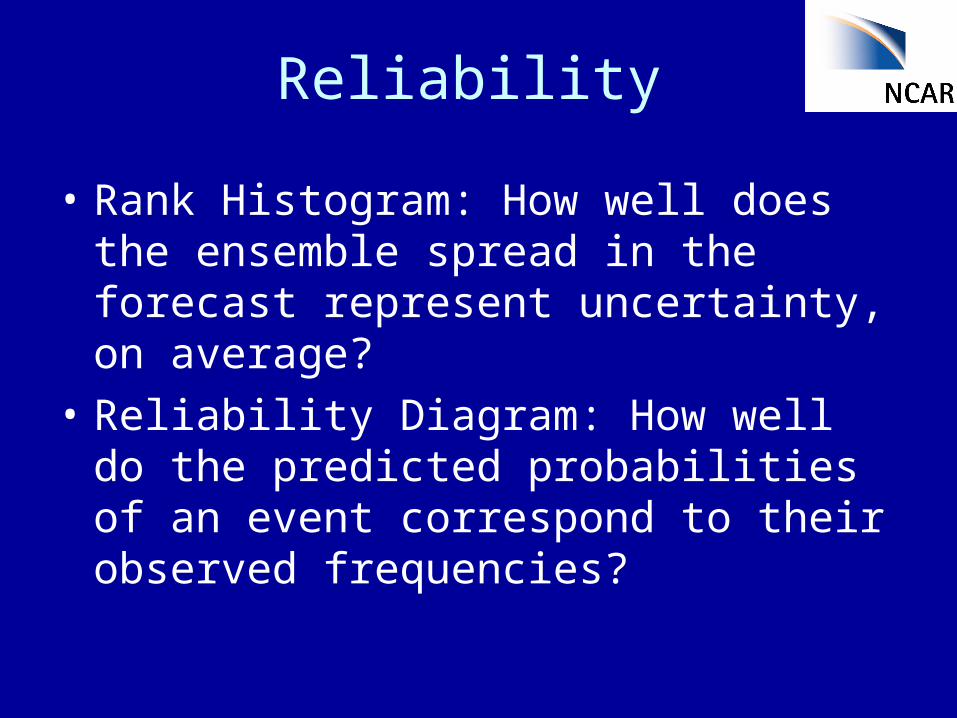
Reliability
• Rank Histogram: How well does the ensemble spread in the forecast represent uncertainty, on average?
• Reliability Diagram: How well do the predicted probabilities of an event correspond to their observed frequencies?
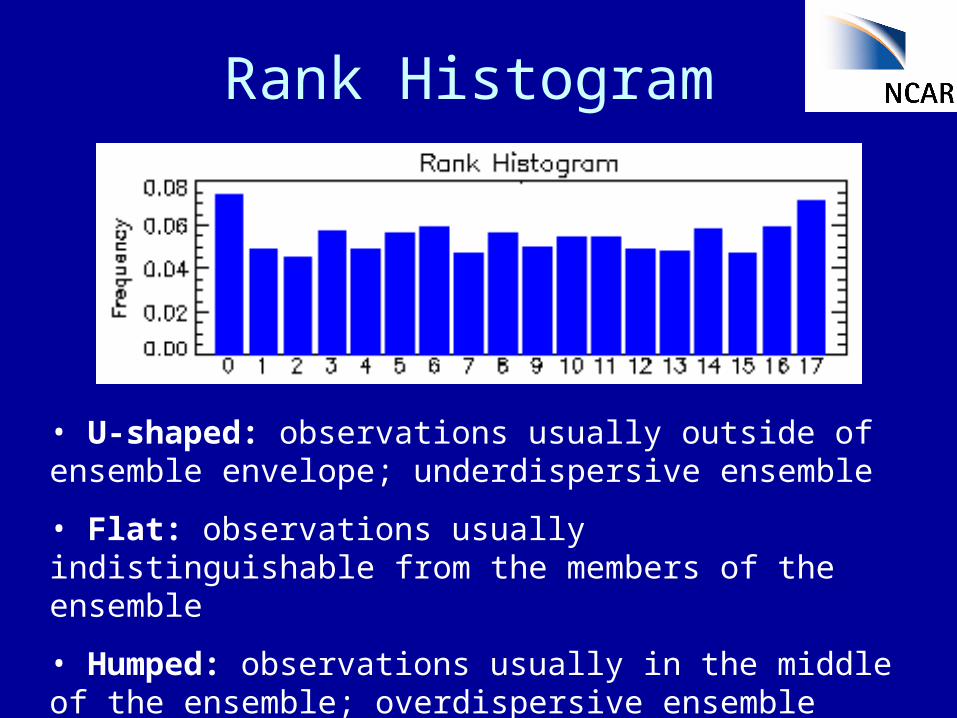
Rank Histogram
• U-shaped: observations usually outside of ensemble envelope; underdispersive ensemble
• Flat: observations usually indistinguishable from the members of the ensemble
• Humped: observations usually in the middle of the ensemble; overdispersive ensemble
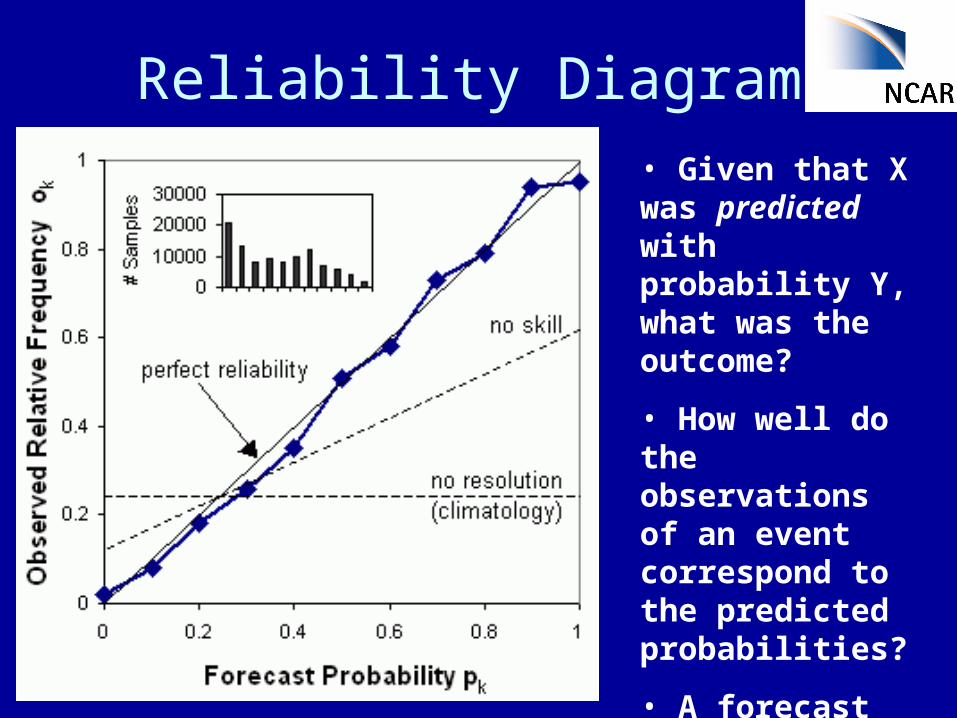
Reliability Diagram• Given that X was predicted with probability Y, what was the outcome?
• How well do the observations of an event correspond to the predicted probabilities?
• A forecast of climatology has no reolution.
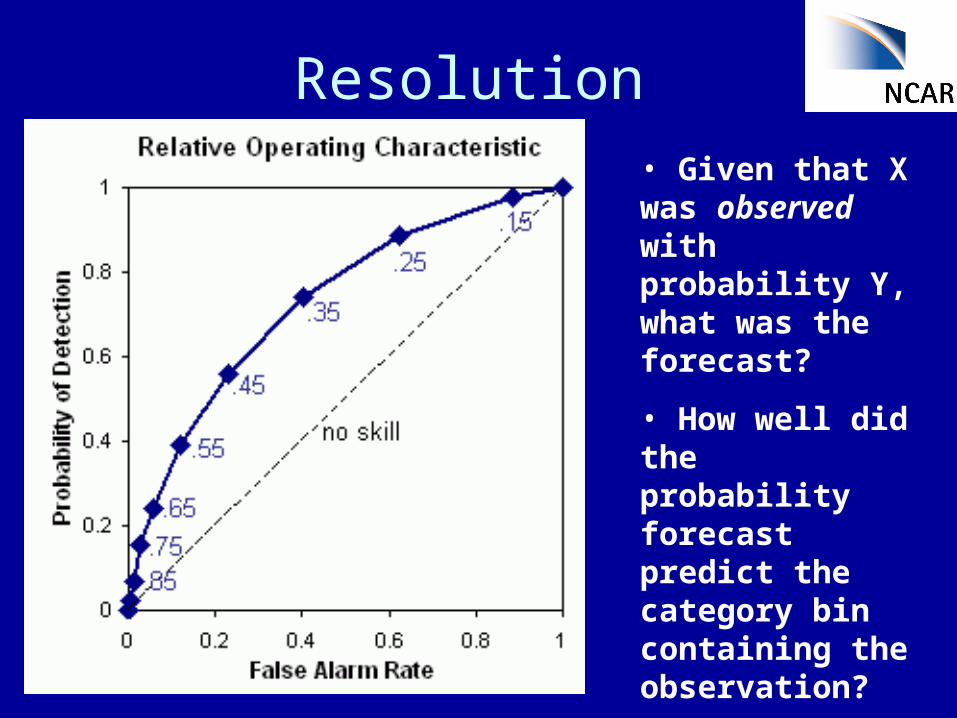
Resolution• Given that X was observed with probability Y, what was the forecast?
• How well did the probability forecast predict the category bin containing the observation?
Calibration
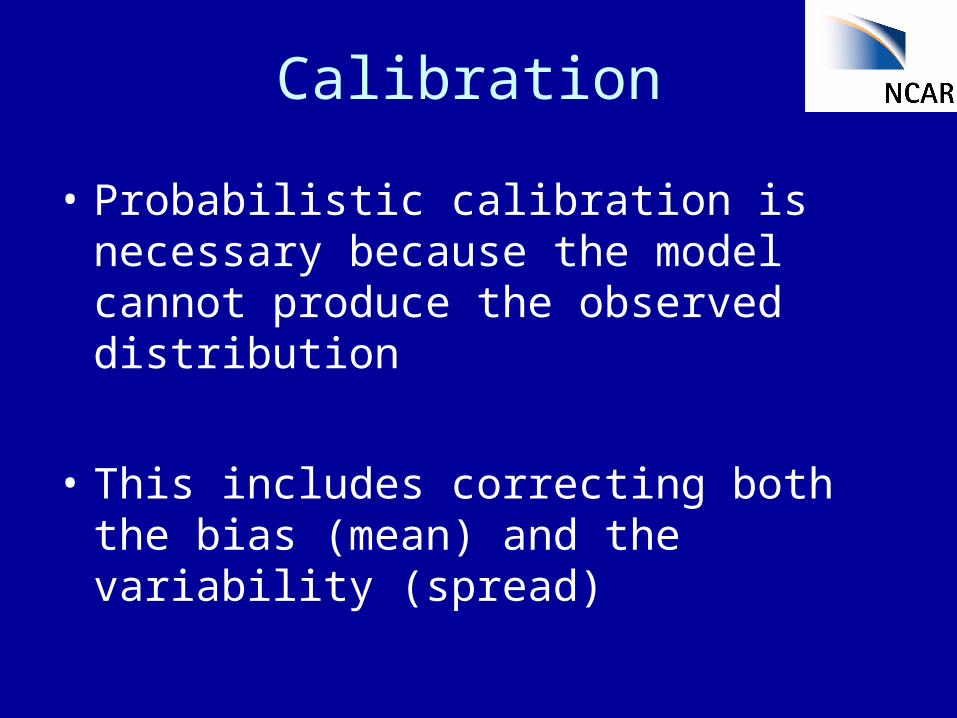
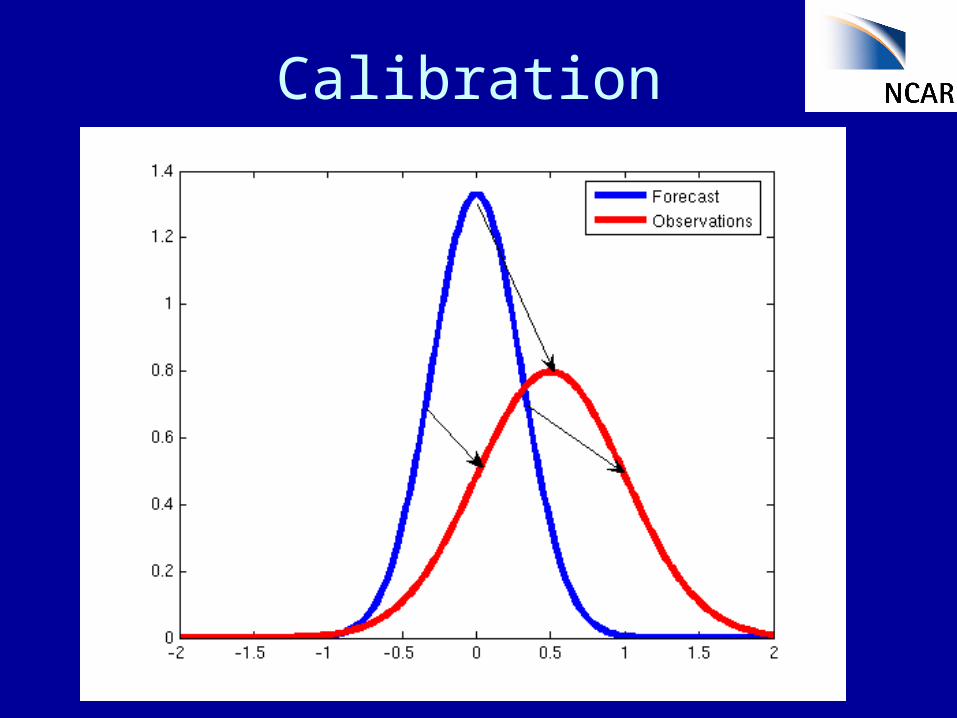
• Probabilistic calibration is necessary because the model cannot produce the observed distribution
• This includes correcting both the bias (mean) and the variability (spread)
Calibration
Test Environment
• Lot-acceptance ammunition testing
• Planning and test completion thresholds of 5 and 7 m/s crosswinds
• Peak winds (gust) on-site decisions
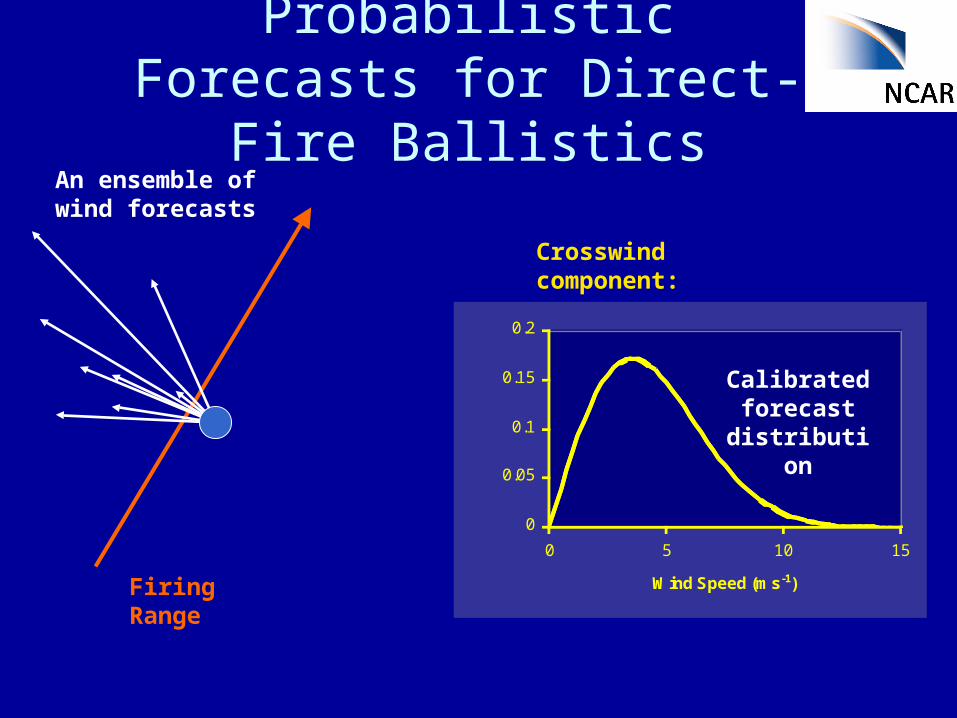
Probabilistic Forecasts for Direct-Fire Ballistics
0
0.05
0.1
0.15
0.2
0 5 10 15
Wind Speed (ms-1)
Probability
Calibrated forecast
distribution
Firing Range
An ensemble of wind forecasts
Crosswind component:
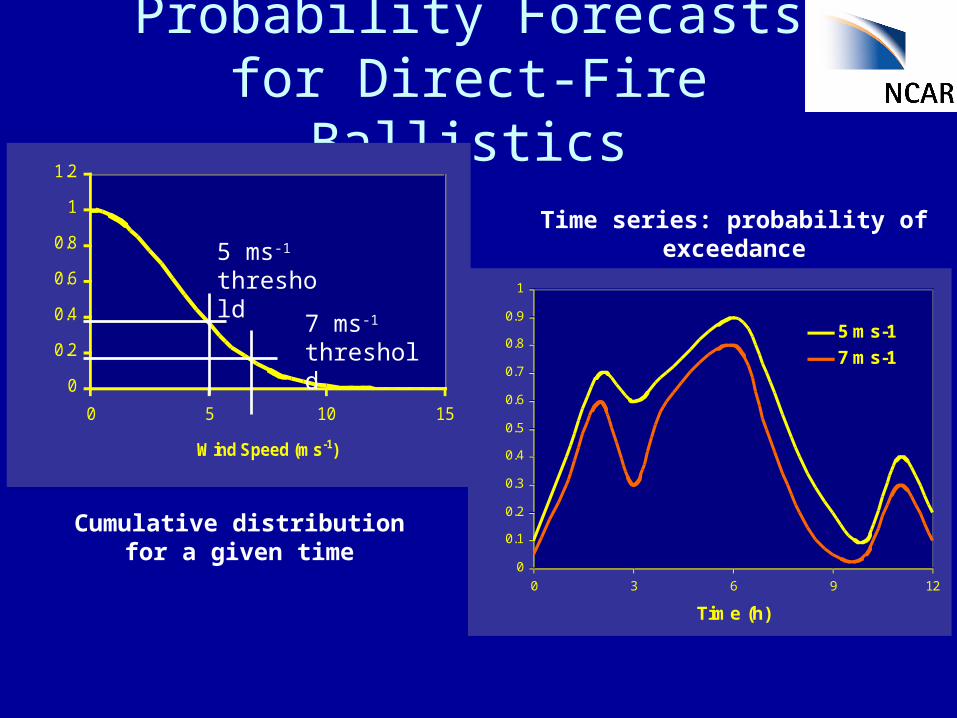
Probability Forecasts for Direct-Fire Ballistics
0
0.2
0.4
0.6
0.8
1
1.2
0 5 10 15
Wind Speed (ms-1)
Cumulative Probability
0
0.1
0.2
0.3
0.4
0.5
0.6
0.7
0.8
0.9
1
0 3 6 9 12
Time (h)
Probability of Exceedance
5 ms-1
7 ms-1
Time series: probability of exceedance
Cumulative distribution for a given time
7 ms-1 threshold
5 ms-1 threshold
Goal: Reliable Ensembles for Crosswind Thresholds
• Over several forecasts, the verification is statistically indistinguishable from the ensemble.
• Model error must be taken into account (calibration).
• Reliability is the first step, later we will consider resolution.
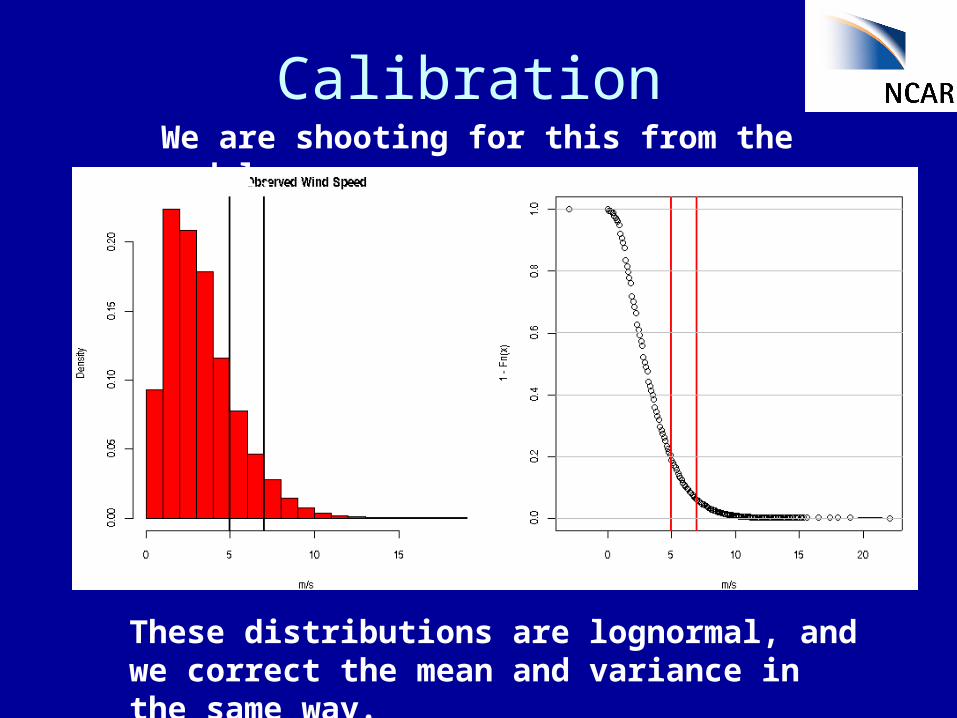
CalibrationWe are shooting for this from the model:
These distributions are lognormal, and we correct the mean and variance in the same way.
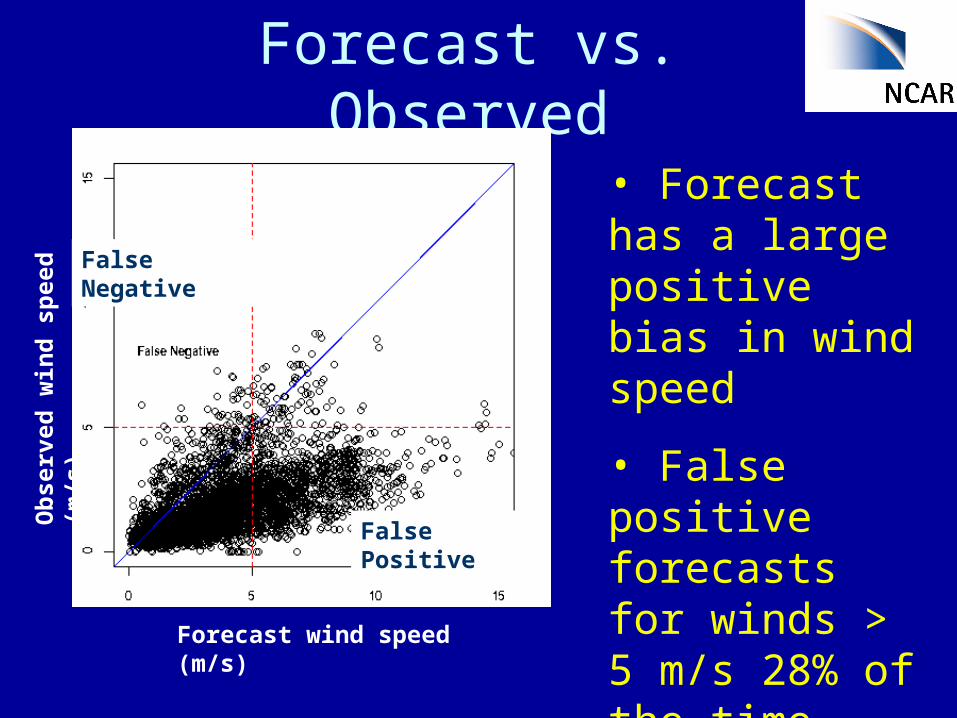
Forecast vs. Observed
• Forecast has a large positive bias in wind speed
• False positive forecasts for winds > 5 m/s 28% of the time.
False Positive
False Negative
Forecast wind speed (m/s)
Ob
serv
ed w
ind
sp
eed
(m
/s)
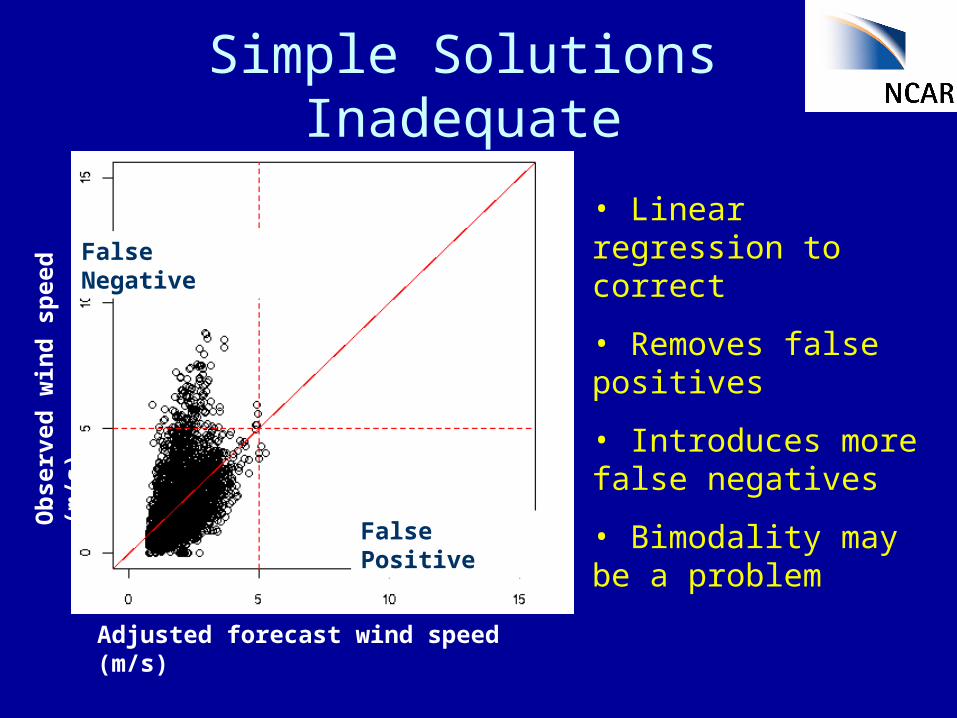
Simple Solutions Inadequate
Ob
serv
ed w
ind
sp
eed
(m
/s)
Adjusted forecast wind speed (m/s)
• Linear regression to correct
• Removes false positives
• Introduces more false negatives
• Bimodality may be a problem
False Negative
False Positive
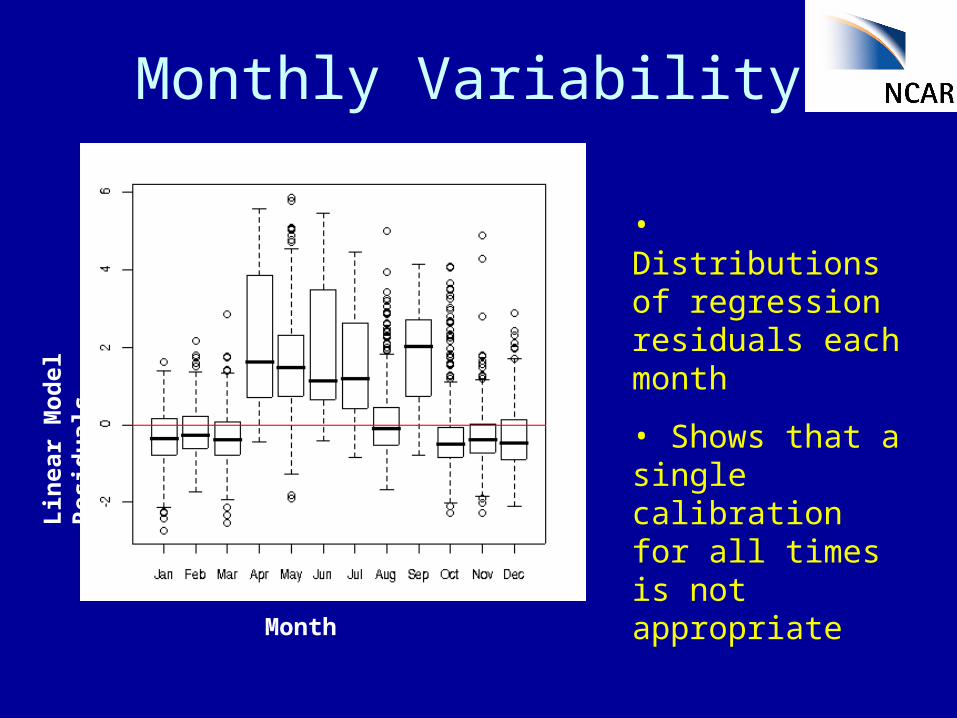
Monthly VariabilityL
inea
r M
od
el R
esid
ual
s
Month
• Distributions of regression residuals each month
• Shows that a single calibration for all times is not appropriate
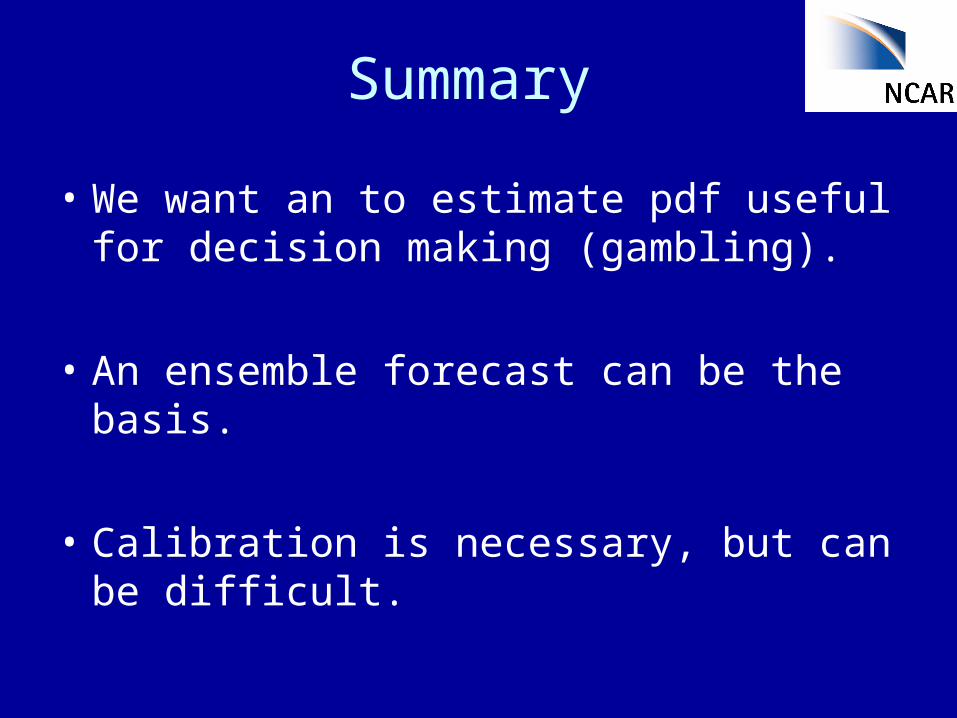
Summary
• We want an to estimate pdf useful for decision making (gambling).
• An ensemble forecast can be the basis.
• Calibration is necessary, but can be difficult.


![What can hypothetical choices tell us about unobservable ... · What can hypothetical choices tell us about unobservable behaviours? Nicolas KRUCIEN, ... [IPS] ‘ as if ’ approach](https://img.pdfslide.net/doc/110x75/5ca9393288c993db388b4d5b/what-can-hypothetical-choices-tell-us-about-unobservable-what-can-hypothetical.jpg)