Embed Size (px)
Citation preview

Probabilistic Graphical Models for Semi-Supervised Traffic Classification
Rotsos Charalampos, Jurgen Van Gael, Andrew W. Moore, Zoubin Ghahramani
Computer Laboratory and Engineering Department, University of Cambridge

Traffic classification
• Traffic classification is the problem of defining the application class of a network flow by inspecting its packets.
• port-based pattern match statistical analysis.
• Useful in order to perform other network functions:• Security: Fine grain access control, valuable dimension for analysis• Network Management: network planning, QoS• Performance measurement: Performance dependence on traffic
class

Problem Space
• So far research focuses on packet-level measurement with good results.
• But no systems implementations, because… Required measurements are difficult
Focus on flow records. Existing research exhibit encouraging results.
Inflexible and generic models use modern ML techniques (Bayesian Modeling, Probabilistic
graphical models) Develop a problem specific ML-model with well defined parameters Since records are sensitive to minor network changes, use semi-
supervised learning

Outline
• Model Presentation
• Results
• Related work
• Further Development

Problem definition
• N flows extracted from a router each having M feauture.
• Each flow is represented by a vector xi that has set of features xij with 0 < j ≤ M and 0< I ≤ N.
• Each flow has an application class ci.
• Assume that we have L flows labeled and U flow unlabeled with L+U = N.
• Define f(.) such as , If Xi ∈ U , f(Xi | CL, L) = ci
• Assume that flow records are generated without any sampling applied and xij are independent.

Probabilistic Graphical Models
• Diagrammatic representations of probability distributions• Directed acyclic graphs represent conditional dependence among R.V.• Easy to perform inference
• Simple graph manipulation can give us complex distributions.• Advantages:
• Modularity• Iterative design• Unifying framework
P(a,b,c) = P(a) P(b | a) P(c | a,b)
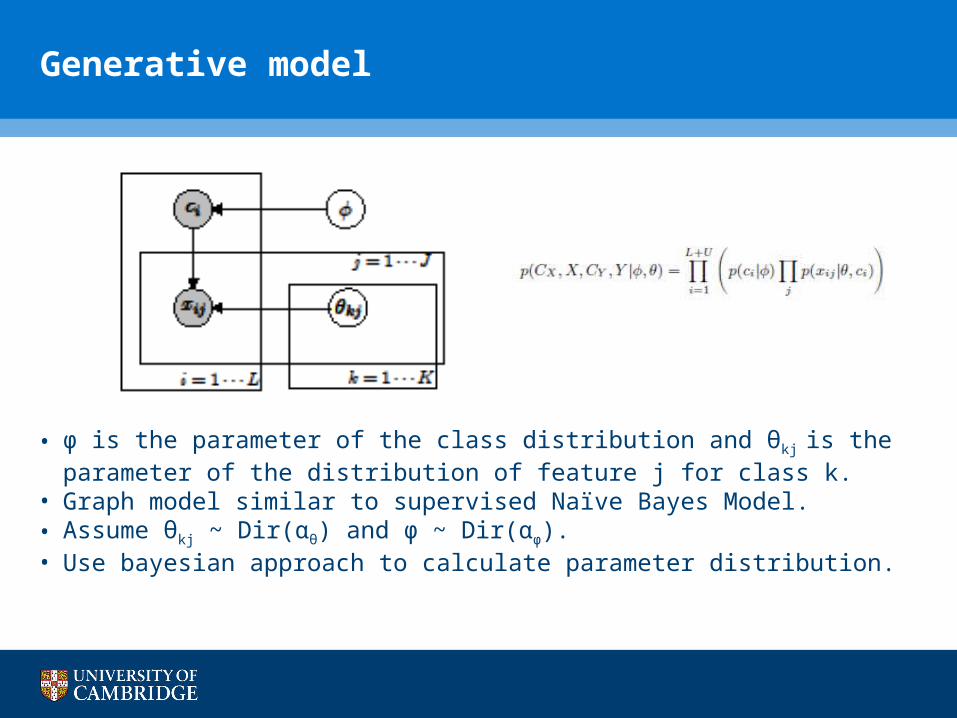
• φ is the parameter of the class distribution and θkj is the parameter of the distribution of feature j for class k.
• Graph model similar to supervised Naïve Bayes Model.• Assume θkj ~ Dir(αθ) and φ ~ Dir(αφ). • Use bayesian approach to calculate parameter distribution.
Generative model

Semi supervised learning
• Hybrid approach of supervised and unsupervised learning
• Train using a labeled dataset and extend model by integrating newly labelled datapoints.
• Advantages:
Reduced training dataset.
Increased accuracy when the model is correct.
Highly configurable when used with Bayesian modeling.
• Disadvantages
Computationally complex .

• Calculating parameter increases exponentially as new unlabled datapoint are added.
• Hard assignment: Add newly labelled datapoint to the Cx with the highest posterior probability.
• Soft assignment: update the posterior for each parameter according to the predicted weight of the datapoint.
• Define class using:
Semi supervised graphical model

Outline
• Model Presentation
• Results
• Related work
• Further Development

Data
• 2 day trace from research facility [Li et al, Computer Networks 2009]. Appr. 6 million tcp flows.
• Ground-truth using GTVS tool.
• Netflow records exported using nProbe. Settings similar to a Tier-1 ISP.
• Model implemented in C#. Also used the Naïve Bayes with kernel estimation implementation from the Weka Platform.
• Feature set:srcIp/dstIP srcPort/dstPort ip tos start/end time
tcpFlags bytes # packets time length
avg. packet size byte rate packet rate tcpF* (uniq. flag)

Application statistics
App % App % App %
database 4.3 services 0.03 peer-to-peer 11.47
mail 2.5 Spam filter 0.48 web 72.33
ftp 6.25 streaming 0.31 vpn 0.1
im 0.6 voip 0.16 Remote access 0.61

Baseline comparison

Baseline comparison – Class accuracy

Dataset size

Model parameters

Outline
• Model Presentation
• Results
• Related work
• Further Development

Related work
• Lots of work on traffic classification using machine learning
Survey paper [Ngyen et al, IEEE CST 2008] and method comparison [Kim et al, Connext08]
Semi-supervised learning used on packet-level measurements in [Erman et al, Sigmetrics07]
Traffic classification using NetFlow data is quite recent
First attempt using a Naïve Bayes classifier introduced in [Jiang et al, INM07]
Approach to the problem using C4.5 classifier in [Carela-Espanol et al, Technical report 09]

Outline
• Model Presentation
• Results
• Related work
• Further Development

Further development
• Packet sampling
• Difficult problem – multi view points could simplify the problem
• Adapt model for host characterization problem
• Aggregate traffic on the host level and enrich data dimensions
• Incorporate graph level information in the model
• Computer networks bares similarities with social networks

Conclusion
• Flow records may be a good data primitive for traffic classification.
• Modeling using probabilistic graphical model is not very difficult.
• Semi supervised learning is an effective concept, but is not a one-solves-all solution.
• Our model achieves 5-10% better performance than generic classifier and exhibits a good stability in short scale.
• Bayesian modeling and graphical models allow easy integration of domain knowledge and adaptation to the requirements of the user.
• Model can be extended to achieve better results.
Thank you!!!!