Embed Size (px)
Citation preview
Probabilistic Modeling of Dynamic U-Factor
K. Pietrzyk, Ph.D. C.-E. Hagentoft, Ph.D.
ABSTRACT
A probabilistic model of thermal transmittance (U-factor) for a building with lightweight construction is presented. Steady-state conditions of airflow and heat flow through the structure are assumed. Three cases, dependent on the direction of the airflowthrough the envelope, are considered: tight envelope, infiltration, and exfiltration. Thermal transmittance is treated in the modelas a random variable varying with the changes of microclimatic conditions at the site of a building.
As an example, the test house situated in two different climatic zones is considered. The probability density functions of U-factor are approximated on the basis of probability density functions of climatic parameters and the air change rate. First-orderreliability method (FORM) techniques are used as a tool for the probabilistic approximation.
INTRODUCTION
For some building technologies, especially those involv-ing lightweight timber frame with mineral wool filling andloose mineral wool layers for roof insulation, one can speakabout the dependence of the thermal properties of buildingcomponents on air infiltration. It is very clear for the so-called“dynamic wall” (Anderlind and Johansson 1983), speciallydesigned to save energy. The interaction between thermaltransmittance and airflow through the components should beconsidered while calculating heat loss through a buildingenvelope. The thermal transmittance becomes the most inter-esting parameter that can vary with the climatic parameters. Amodeling approach based on probabilistic methods isproposed (Pietrzyk et al. 2003a, 2004), which seems very wellsuited for handling the natural driving forces governing therate of airflow through a building envelope and the value ofthermal transmittance.
The probabilistic model of thermal transmittance isshown in Figure 1. It includes a limit state approach based onfirst-order reliability method (FORM) techniques, whichgives opportunity to directly calculate the probability ofrandom variable (U-factor) exceeding the assumed service-
ability limit, as well as to approximate the probability densityfunction of that variable (Pietrzyk 2000). The load randomvariables are selected from the many parameters influencingthermal transmittance. It means that only some of the param-eters and mechanisms influencing dynamic performance of abuilding envelope have been taken into account in the model.
Figure 1 Probabilistic modeling of thermal transmittance.
©2004 ASHRAE.
Krystyna Pietrzyk is a researcher and Carl-Eric Hagentoft is a professor at the Department of Building Technology, Schoolof Civil Engineering, Chalmers University of Technology at Gothenburg, Sweden.

However, the aim for the authors in this paper is not todeliver a complete product for the practitioners but to demon-strate a new modeling approach in analyzing dynamic perfor-mance of building envelopes.
FORMs provide effective estimation of the probability offailure, i.e., the probability that a certain design requirement isnot fulfilled, without the need—but leaving the possibility—to evaluate the probability density function of the output vari-able. Applying FORM offers savings in computer processingtime as compared to, for example, Monte Carlo simulations.Fundamentals of reliability analysis together with the descrip-tion of FORM can be found in Ditlevsen and Madsen (1996),Haldar and Mahadevan (2000), Nowak and Collins (2000),and Czmoch (1998).
THERMAL TRANSMITTANCE—A VIEW OF DETERMINISTIC APPROACH
The averaged thermal transmittance of a building compo-nent is given by the following equation (Hagentoft 2001):
(1)
where
Ri = total thermal resistance of the ith element of the envelope (m2K/W)
αex = external heat transfer coefficient (W/m2K)
αin = internal heat transfer coefficient (W/m2K)
dj = thickness of the jth layer of the ith element of the envelope (m)
λc,j = thermal conductivity estimated for certain humidity and temperature of the material of the jth layer of the ith element of the envelope (W/mK)
Thermal conductivity increases with the actual tempera-ture of the material. The results of the measurements for theinsulation materials presented by Wahlgren (2001) andSerkitjis (1995) show this phenomenon.
The Nusselt number Nu describes the effect of convectiveflows (leakage and interstitial convection) on the thermalperformance of a structure. The Nusselt number for the ithelement is defined as in Kohonen et al. (1985).
(2)
where
Φt,i = transmission heat flow through the ith element (with leakages) (kW)
Φt0,i = transmission heat flow through the ith element estimated for the impermeable surface (without leakages) (kW)
One has to point out that the so-called transmission heat flowincludes the effect of infiltration on the heat conduction.
The Nusselt number is equal to one for the element with-out convection flow. The value of the Nusselt number dependson the velocity of the airflow through the insulation, the direc-tion of the flow, and the thickness and density of the insulation.It can be described by the expression below (Hagentoft 2001),where the cases of infiltration and exfiltration are given bydifferent equations.
(3)
and, for the case of exfiltration,
(4)
and, for the case of infiltration,
(5)
whereρa = air density (kg/m3),ca = specific heat capacity of air (at a constant pressure)
(J/kgK),U0 = thermal transmittance (see Equation 1) (W/m2K),A = area (m2),Q = airflow rate (m3/s).
Infiltration Case
In the case of infiltration, the cold air from the outsideflows through the cracks and openings in the envelope into thebuilding, while the heat flows in the opposite direction, asshown in Figure 2. The transmission heat loss is lower,compared to pure conduction, because the conduction heat ispartially used to warm up the infiltrating air on the leakageroutes from the outer surface of the structure to the inner one.The relative reduction of transmission heat flow at the outersurface is described by the Nusselt number (Nu < 1) (Kohonenet al. 1985). The inflow temperature is equal to the temperatureoutside of the building. The temperature of the internal surfaceof the wall is lower than the temperature of the internal surfaceof a tight envelope, as shown in Figure 2.
Ui
0
Ui
0 1
Ri
-----1
1
αex
--------1
αin
--------dj
λc,j
--------
j 1=
m
∑+ +
------------------------------------------------= =
Nui
Φt ,i
Φt0,i
-----------=
Figure 2 Illustration of heat flow through the leaky wall—infiltration.
Nu ξeξ
eξ
1–
--------------=
ξcaρaQ
U0A
---------------- ,=
ξcaρaQ
U0A
---------------- ,–=
2 Buildings IX
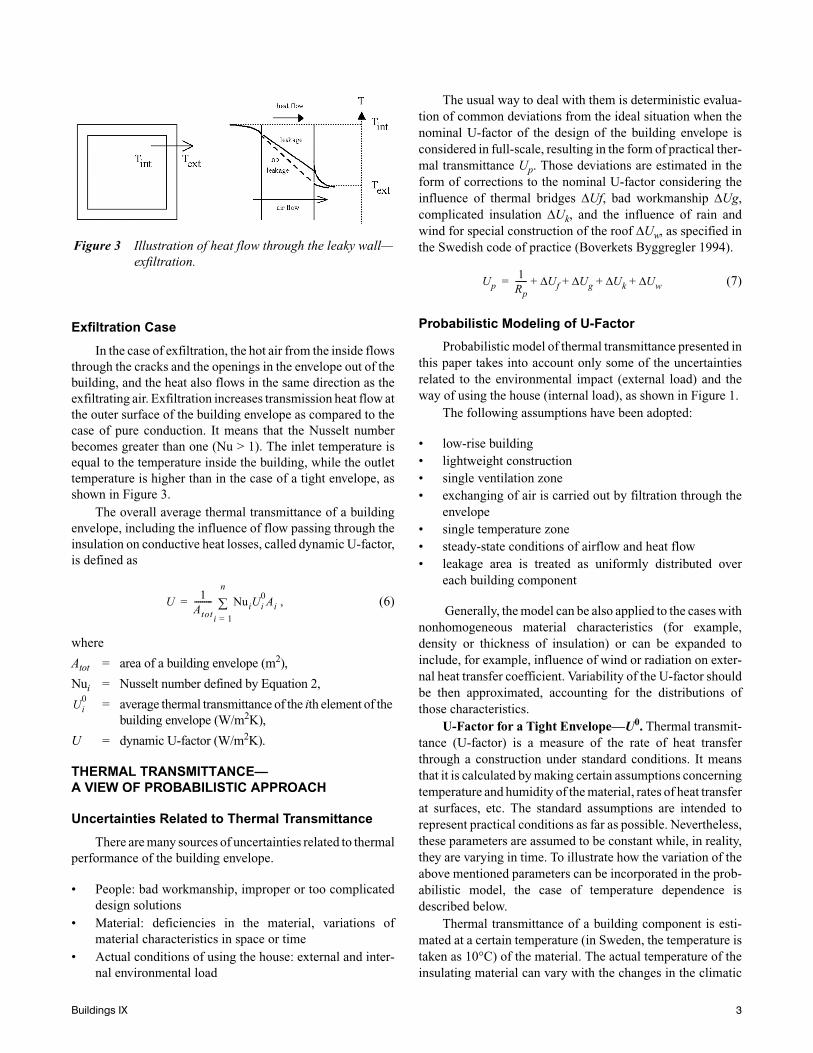
Exfiltration Case
In the case of exfiltration, the hot air from the inside flowsthrough the cracks and the openings in the envelope out of thebuilding, and the heat also flows in the same direction as theexfiltrating air. Exfiltration increases transmission heat flow atthe outer surface of the building envelope as compared to thecase of pure conduction. It means that the Nusselt numberbecomes greater than one (Nu > 1). The inlet temperature isequal to the temperature inside the building, while the outlettemperature is higher than in the case of a tight envelope, asshown in Figure 3.
The overall average thermal transmittance of a buildingenvelope, including the influence of flow passing through theinsulation on conductive heat losses, called dynamic U-factor,is defined as
(6)
where
Atot = area of a building envelope (m2),
Nui = Nusselt number defined by Equation 2,
= average thermal transmittance of the ith element of the building envelope (W/m2K),
U = dynamic U-factor (W/m2K).
THERMAL TRANSMITTANCE—A VIEW OF PROBABILISTIC APPROACH
Uncertainties Related to Thermal Transmittance
There are many sources of uncertainties related to thermalperformance of the building envelope.
• People: bad workmanship, improper or too complicateddesign solutions
• Material: deficiencies in the material, variations ofmaterial characteristics in space or time
• Actual conditions of using the house: external and inter-nal environmental load
The usual way to deal with them is deterministic evalua-tion of common deviations from the ideal situation when thenominal U-factor of the design of the building envelope isconsidered in full-scale, resulting in the form of practical ther-mal transmittance Up. Those deviations are estimated in theform of corrections to the nominal U-factor considering theinfluence of thermal bridges ∆Uf, bad workmanship ∆Ug,complicated insulation ∆Uk, and the influence of rain andwind for special construction of the roof ∆Uw, as specified inthe Swedish code of practice (Boverkets Byggregler 1994).
(7)
Probabilistic Modeling of U-Factor
Probabilistic model of thermal transmittance presented inthis paper takes into account only some of the uncertaintiesrelated to the environmental impact (external load) and theway of using the house (internal load), as shown in Figure 1.
The following assumptions have been adopted:
• low-rise building• lightweight construction• single ventilation zone • exchanging of air is carried out by filtration through the
envelope • single temperature zone• steady-state conditions of airflow and heat flow• leakage area is treated as uniformly distributed over
each building component
Generally, the model can be also applied to the cases withnonhomogeneous material characteristics (for example,density or thickness of insulation) or can be expanded toinclude, for example, influence of wind or radiation on exter-nal heat transfer coefficient. Variability of the U-factor shouldbe then approximated, accounting for the distributions ofthose characteristics.
U-Factor for a Tight Envelope—U0. Thermal transmit-tance (U-factor) is a measure of the rate of heat transferthrough a construction under standard conditions. It meansthat it is calculated by making certain assumptions concerningtemperature and humidity of the material, rates of heat transferat surfaces, etc. The standard assumptions are intended torepresent practical conditions as far as possible. Nevertheless,these parameters are assumed to be constant while, in reality,they are varying in time. To illustrate how the variation of theabove mentioned parameters can be incorporated in the prob-abilistic model, the case of temperature dependence isdescribed below.
Thermal transmittance of a building component is esti-mated at a certain temperature (in Sweden, the temperature istaken as 10°C) of the material. The actual temperature of theinsulating material can vary with the changes in the climatic
Figure 3 Illustration of heat flow through the leaky wall—exfiltration.
U1
Atot
--------- NuiUi
0Ai ,
i 1=
n
∑=
Ui
0
Up
1
Rp
------ Uf∆ Ug∆ Uk∆ Uw∆+ + + +=
Buildings IX 3

conditions. The dependence of the U-factor on the tempera-ture of the material, T
w, can be approximated by the following
expression (Bankvall 1972):
(8)
where
= U-factor for the material in temperature of 283K (W/m2K)
x = parameter depending on the density of the insulation (W/m2K2)
An example of relationship between thermal conductivityof a porous material λc and its temperature Tw for a fibrousinsulation with a density of 16.4 kg/m3 is shown in Figure 4(Bankvall 1972).
For the constant internal temperature Tint = 20°C, themean temperature of insulation can be approximated by
(9)
where ∆T is the difference between internal and externaltemperature.
Assuming an internal temperature of 20°C and that theexternal temperature varies between –20°C and 13°C duringthe heating season, the mean temperature of the insulation isin the range of 0°C to 17°C. Surface heat transfer coefficientsare also temperature dependent. The thermal transmittance isa function of the thermal conductivity, and the internal andexternal heat transfer coefficients can vary about the designvalue by 5% for low-density insulation. Finally, accounting forEquations 8 and 9, thermal transmittance for a tight envelopeU0 can be given by
(10)
For a normally distributed temperature difference (Pietrzyk2000) the mean and the standard deviation of U-factor are esti-mated as
(11)
The thermal transmittance U0 is treated in the model as anormally distributed random variable with the mean value andthe standard deviation given by Equation 11, expressing vari-ations of the mean U-factor of n elements of the building enve-lope caused by the changing outdoor temperature. Themean (area weighted) thermal transmittance is given by thefollowing equation:
(12)
The mean thermal transmittance of the ith component ofa building envelope (see Equation 12) could eveninclude the deterministic corrections presented in Equation 7.
U-Factor for a Leaky Envelope (Dynamic U-Factor)—U. It has been assumed for a tight building that variations of U0
are caused mainly by the changes of external temperature. Fora leaky building, airflow through the building envelope(governed by random climatic conditions) can also change theactual U-factor (Kohonen et al. 1985), depending on the lengthof the leakage route and the thermal properties of the wallaround the crack. The influence of the convective flow onconductive heat losses is described by the Nusselt number (seeEquation 2). Variations of the actual U-factor are caused by aclimate-dependent velocity of the flow through insulation (seeEquations 3 to 6). The actual value of overall average thermaltransmittance depends on the temperature in the insulation aswell as on the Nusselt number, which can be expressed by thefunction of the airflow and the thermal transmittance U0 (seeEquations 3 to 5). Eventually, thermal transmittance U0 and airchange rate have been chosen to be the input random variablefor the model of a leaky building envelope.
Dynamic thermal transmittance depends also on thedirection of airflow through a structure and, therefore, is spec-ified separately for infiltration and exfiltration case.
The decision of which case applies for the chosen build-ing component is governed by
• wind velocity and wind direction,
• location of the component with respect to the neutralpressure layer, and
• mechanical ventilation (for example, exhaust ventilationsystem, using the openings in the building envelope asinlet of infiltrating air).
U0
U10
0x Tw 10–( )+=
U10
0
Tw 20 T∆– 2⁄( ) ,=
U0
U10
0x 10
T∆2
-------–⎝ ⎠⎛ ⎞ .+=
µU
0 U10
0x 10
µ T∆
2---------–⎝ ⎠
⎛ ⎞+=
σU
0
x
2---σ T∆ .=
U10
0
U10
0 1
Atot
--------- U10,i
0Ai
i 1=
n
∑=
U10,i
0
Figure 4 Thermal conductivity of fibrous insulation as afunction of mean temperature of the material(courtesy of Bankvall [1972]).
4 Buildings IX

Approximation of a Probability Density Functionof Thermal Transmittance
Approximation of the probability density functions of adynamic U-factor is carried out with the help of FORM tech-niques. The probability density function of dynamic U-factoris evaluated using FORM sensitivity analysis (Pietrzyk 2000;Pietrzyk and Hagentoft 2003a). It depends on statisticalparameters of the joint distribution of two random variables:thermal transmittance U0 (see Equation 1) and air change rate(ACH). Stochastic information is limited to the parameters ofmarginal probability density functions of those variables andthe correlation coefficient between them.
The air exchange carried out by filtration through theenvelope is evaluated with the help of probabilistic modelPROMO described by Pietrzyk (2000) and in Pietrzyk andHagentoft (2003b). It takes into account the influence of natu-ral forces (wind, temperature) and mechanical forces. For anaturally ventilated building, the model used can be describedby the following equation:
(13)
where
∆T =Tint-Text = temperature difference across the envelope
v = wind speed
d = wind direction
s1, s2, s3 = deterministic coefficients dependent on the parameters of the flow balance for the stack effect
wd,1, wd,2, wd,3 = deterministic coefficients dependent on the flow balance for various wind directions d
The probabilistic distributions of the air change rate areapproximated on the basis of climatic parameter distributionstypical for the site: wind speed and direction, internal-externaltemperature difference, and data concerning the building, itsenvironment, and its using like airtightness of the envelope orinside temperature. The air change rate follows different prob-ability distributions depending on the contribution and thequantity of the stack, wind, or mechanical forces. The mosttypical are normal, lognormal, Weibull, and Gamma distribu-tions.
The distribution of dynamic thermal transmittance, U,depends on the direction of airflow through a structure and isspecified separately for the cases of exfiltration and infiltra-tion. It has been assumed that the average thermal transmit-tance U0 is a normally distributed random variable dependenton the temperature and the density of insulation with meanvalue and standard deviation given by Equations 11. It meansthat the probabilistic description of variable U0 already refersto its variations caused by the changes of the temperature ofmaterial.
Correlation coefficients between random variables ACHand U0
are dependent on the case considered: infiltration or
exfiltration. For the infiltration case, when the heating seasonis considered, the U0 is negatively correlated with the airflowthrough the insulation, while, for the exfiltration case, thecorrelation is positive.
A functional relationship among ACH and U0 anddynamic U-factor is established with the help of mathematicalmodels. It is called the performance function (see Figure 1)and is described by Equations 15 and 16. They are obtainedfrom Equations 3 to 6 and account for the following relation-ship between airflow rate Q (m3/s) and air change rate (ACH)(1/h):
(14)
where
V = ventilated volume of a building (m3).
The performance function of a dynamic U-factor for theinfiltration case is given by
(15)
The performance function of a dynamic U-factor for theexfiltration case is given by
(16)
where
(17)
where
ρa = air density (kg/m3),
ca = specific heat capacity of air (at a constant pressure) (kJ/kgK), and
V = ventilated volume of a building (m3).
Reliability Analysis of Dynamic U-Factor
The physical state of a building in the context of thermalperformance is described by the U-factor. Undesired perfor-mance can appear as a response to the changes of physical stateof the building caused by variations of load parameters:climatic, environmental (external load), structural parameters,building installations parameters, or occupant behavior (inter-nal loads) (see Figure 1). Performance failure is associatedwith the U-factor being higher than a preselected performancecriterion, also called serviceability limit. Limit state approachgives opportunity to calculate Pf, probability of the perfor-mance failure, or reliability, which is a complement to Pf.
ACHd s1 T2
∆ s2 T∆ s3 T∆1.5
wd,1vd4
wd,2vd2
wd ,3vd3
+ + + + +=
QACH
3600------------V=
Ua ACH⋅
A--------------------–
a
A---–ACH
U0
------------⎝ ⎠⎛ ⎞exp
a
A---–ACH
U0
------------⎝ ⎠⎛ ⎞exp 1–
-------------------------------------------- .=
Ua ACH⋅
A--------------------–
a
A---–ACH
U0
------------⎝ ⎠⎛ ⎞exp
a
A---ACH
U0
------------⎝ ⎠⎛ ⎞exp 1–
----------------------------------------- ,=
acaρaV
3600--------------- ,=
Buildings IX 5

The serviceability limit criterion for U-factor for a housecan be obtained for example from the Swedish Building Code(Boverkets Byggregler 1994), where the maximum allowablevalue of overall thermal transmittance is stated as equal to
(18)
where
Af
= total area of windows and doors (m2) and
Atot
= total area of a building envelope (m2).
A serviceability requirement can be formulated as. A performance failure is then described by .
Probability of performance failure given by Equation 19is equal to the area under probability density function of ther-mal transmittance for (see Figure 5).
(19)
In a similar way the serviceability limit can be consideredfor a dynamic U-factor. However, it is important to rememberthat the limits evaluated for the two cases (infiltration andexfiltration) can be different. They should be stated in relationto the effect of the heating system. Analyzing the probabilityof failure for different heating demands and for differentconstructions of a building exposed to the climatic conditionstypical for the site, one can choose the reliable heating solution(with acceptable likelihood of performance failure). Reliabil-
ity analysis can then become a tool helping in dimensioning ofthe heating system.
CASE STUDY
The object of our study is a timber-framed low-rise natu-rally ventilated building with aspect ratio 2 and slope of theroof of 45°. The building envelope is homogeneous. Twobuilding sites situated in the districts of Luleå and Göteborgare considered. Examples are made for wind blowing from thewest and from the south. The site is described as a semi-urbanarea with the surface roughness equal to 0.3 m. It is assumedthat the building is surrounded by other obstructions (otherbuildings, topography, vegetation) equivalent to half of itsheight. The following input data are used:
• Building-related deterministic input data:
1. Dimensions: volume of the house of 486 m3, total areaof the envelope of 336 m2.
2. Leakage characteristics of the house: The envelopefrom the south side is five times more leaky than fromthe west side.
3. Thermal properties of the envelope are characterizedby the area-weighted thermal transmittance (see Equa-tion 12) equal to 0.359 W/m2K.
• Climate-related random input data:One-hour mean wind speed and one-hour mean externaltemperature are the two random variables. Parameters ofthe distribution of each variable are estimated on the basisof a 40-year record of observations made on meteorolog-ical stations at the airports in Luleå and Göteborg. Windspeed data were transformed to the house location. Exter-nal temperature at the building site is assumed to be equalto the temperature measured at the meteorologicalstation. Probabilistic characteristics of local wind speedand external temperature are given in Table 1.A constant internal temperature in the building of 20°C isassumed. The difference between internal and externaltemperature at the site is given in the form of parametersof truncated normal distribution evaluated for the “heat-ing” periods (when Text < Tint), when wind was blowingfrom the specified direction sectors. The correlation
Figure 5 Concept of the serviceability limit for thermaltransmittance: pdf (probability density function).
RU
0 0.18 0.95Af
Atot
--------- ,+=
U RU
0≤ U RU
0>
U RU
0>
Pf P U RU
0>( ) 1 P U RU
0≤( )–= =
Table 1. Statistical Parameters of the Temperature Difference ∆T =Tint – Text, the Wind Speed at the Site vd, and
the Correlation Coefficient between the Wind Speed and the Temperature Difference ρ∆T,v for the Periods When
Wind Was Blowing from the South (S) and from the West (W)
Building Site dMean
vd
StandardDeviation
vd
Mean∆T
StandardDeviation
∆T ρ∆T,v
Göteborg W 3.73 2.18 8.90 6.13 0
Göteborg S 3.51 2.13 12.13 6.55 0
Luleå W 2.15 1.51 17.09 9.60 0.37
Luleå S 2.37 1.44 15.30 9.46 0.18
6 Buildings IX
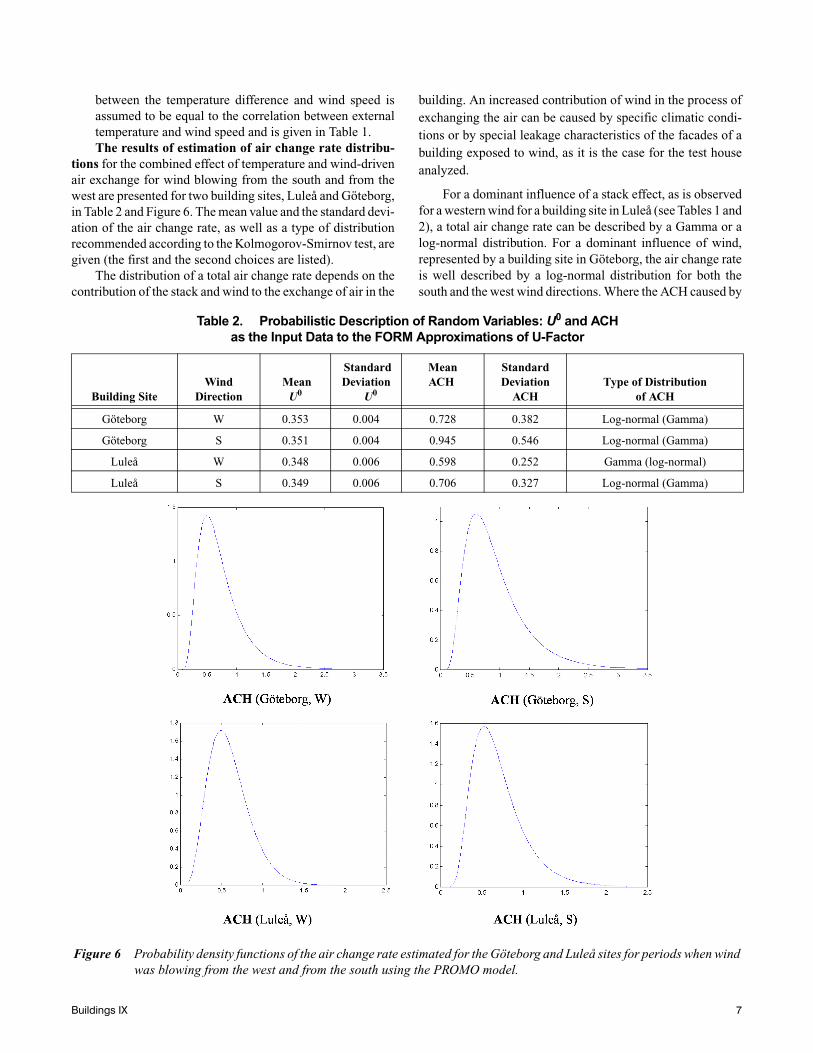
between the temperature difference and wind speed isassumed to be equal to the correlation between externaltemperature and wind speed and is given in Table 1. The results of estimation of air change rate distribu-
tions for the combined effect of temperature and wind-drivenair exchange for wind blowing from the south and from thewest are presented for two building sites, Luleå and Göteborg,in Table 2 and Figure 6. The mean value and the standard devi-ation of the air change rate, as well as a type of distributionrecommended according to the Kolmogorov-Smirnov test, aregiven (the first and the second choices are listed).
The distribution of a total air change rate depends on thecontribution of the stack and wind to the exchange of air in the
building. An increased contribution of wind in the process ofexchanging the air can be caused by specific climatic condi-tions or by special leakage characteristics of the facades of abuilding exposed to wind, as it is the case for the test houseanalyzed.
For a dominant influence of a stack effect, as is observedfor a western wind for a building site in Luleå (see Tables 1 and2), a total air change rate can be described by a Gamma or alog-normal distribution. For a dominant influence of wind,represented by a building site in Göteborg, the air change rateis well described by a log-normal distribution for both thesouth and the west wind directions. Where the ACH caused by
Figure 6 Probability density functions of the air change rate estimated for the Göteborg and Luleå sites for periods when windwas blowing from the west and from the south using the PROMO model.
Table 2. Probabilistic Description of Random Variables: U0 and ACHas the Input Data to the FORM Approximations of U-Factor
Building SiteWind
Direction Mean
U0
StandardDeviation
U0
MeanACH
StandardDeviation
ACHType of Distribution
of ACH
Göteborg W 0.353 0.004 0.728 0.382 Log-normal (Gamma)
Göteborg S 0.351 0.004 0.945 0.546 Log-normal (Gamma)
Luleå W 0.348 0.006 0.598 0.252 Gamma (log-normal)
Luleå S 0.349 0.006 0.706 0.327 Log-normal (Gamma)
Buildings IX 7
wind and the ACH caused by stack effect are comparable (seethe case Luleå, wind from the south), a log-normal distributionof ACH is also fitted.
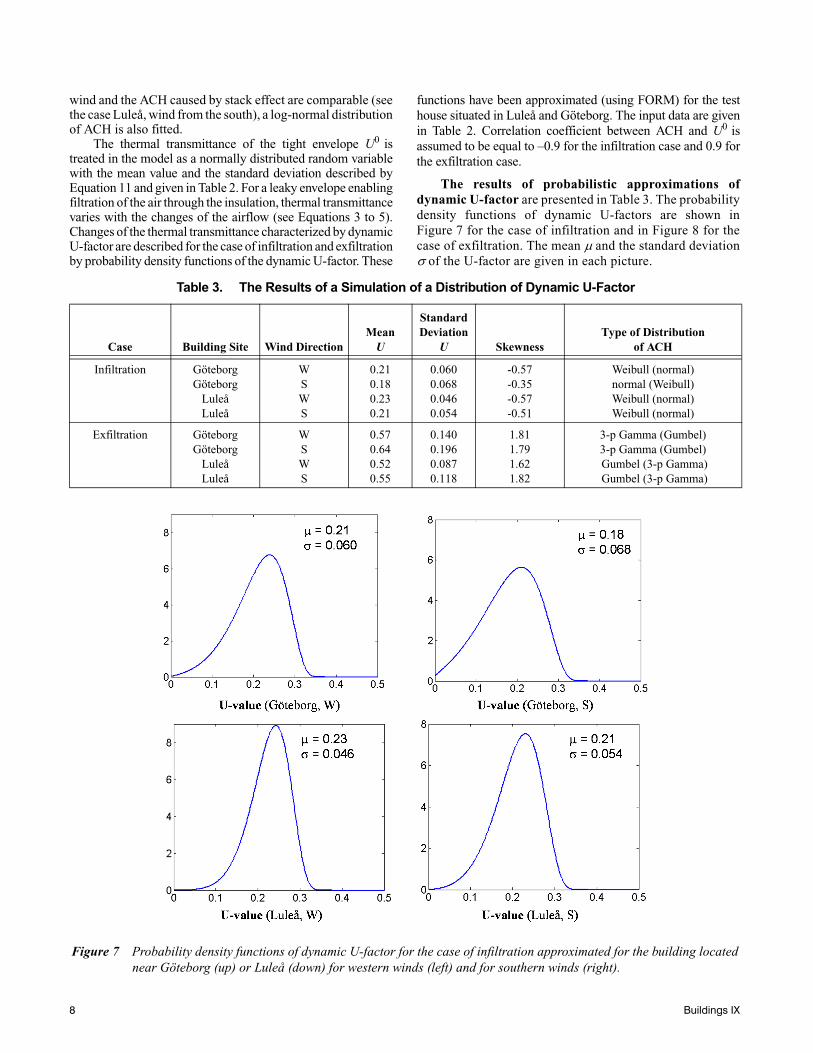
The thermal transmittance of the tight envelope U0 istreated in the model as a normally distributed random variablewith the mean value and the standard deviation described byEquation 11 and given in Table 2. For a leaky envelope enablingfiltration of the air through the insulation, thermal transmittancevaries with the changes of the airflow (see Equations 3 to 5).Changes of the thermal transmittance characterized by dynamicU-factor are described for the case of infiltration and exfiltrationby probability density functions of the dynamic U-factor. These
functions have been approximated (using FORM) for the testhouse situated in Luleå and Göteborg. The input data are givenin Table 2. Correlation coefficient between ACH and U0 isassumed to be equal to –0.9 for the infiltration case and 0.9 forthe exfiltration case.
The results of probabilistic approximations ofdynamic U-factor are presented in Table 3. The probabilitydensity functions of dynamic U-factors are shown inFigure 7 for the case of infiltration and in Figure 8 for thecase of exfiltration. The mean µ and the standard deviationσ of the U-factor are given in each picture.
Figure 7 Probability density functions of dynamic U-factor for the case of infiltration approximated for the building locatednear Göteborg (up) or Luleå (down) for western winds (left) and for southern winds (right).
Table 3. The Results of a Simulation of a Distribution of Dynamic U-Factor
Case Building Site Wind Direction Mean
U
StandardDeviation
U SkewnessType of Distribution
of ACH
Infiltration GöteborgGöteborg
LuleåLuleå
WSWS
0.210.180.230.21
0.0600.0680.0460.054
-0.57-0.35-0.57-0.51
Weibull (normal)normal (Weibull)Weibull (normal)Weibull (normal)
Exfiltration GöteborgGöteborg
LuleåLuleå
WSWS
0.570.640.520.55
0.1400.1960.0870.118
1.811.791.621.82
3-p Gamma (Gumbel)3-p Gamma (Gumbel) Gumbel (3-p Gamma) Gumbel (3-p Gamma)
8 Buildings IX

For the case of Göteborg, southern wind, the air changerate is higher than for other cases (see Table 2), and the influ-ence on the mean value and the standard deviation of the ther-mal transmittance is more significant (see Table 3). This is dueto a combined effect of higher wind velocity and more leakyenvelope of the southern face of the building.
Generally, one can notice that the probability densityfunctions of the dynamic U-factor approximated for the infil-tration are skewed to the left, while these approximated for theexfiltration are skewed to the right (see Table 3). This isbecause of the specific character of the relationship betweenNusselt number and air change rate (see Equations 3 to 5). Italso influences the family of distributions, giving the best fitto dynamic thermal transmittance. For the case of infiltration,the best fits according to the Kolmogorov-Smirnov test havebeen obtained for the Weibull family of distributions while, forthe exfiltration case, the three-parameter Gamma or, alterna-tively, Gumbel distributions have been fitted with the bestresults (see Table 3).
SUMMARY AND DISCUSSION
A probabilistic model of dynamic U-factor has beenpresented. It takes into account only some of the uncertainties
related to the climatic load of a building site and the internalload coming from the building installations and occupantbehavior. The model can be used to estimate a probabilitydistribution of the effective (actual) U-factor of the buildingenvelope accounting for the properties of the thermal insula-tion and stochastic characteristics of the microclimatic load.The model should be further developed to include uncertain-ties caused by other mechanisms and factors such as, forexample, influence of wind or radiation on external heat trans-fer coefficient or the influence of nonhomogenity of the mate-rial characteristics (for example, density or thickness ofinsulation).
Probability density functions of thermal transmittancedepend on the direction of the airflow through the envelope aswell as on the shape of the air change rate distribution. Themodel uses probability density functions of air change rateapproximated with the help of FORM techniques and theprobabilistic model of air infiltration developed by Pietrzyk(2000). Depending on the relative contribution of the naturalforces (wind, temperature) and mechanical forces the airchange rate follows different probability distributions(normal, lognormal, Weibull, and Gamma). Generally, theprobability density functions of the dynamic U-factor approx-
Figure 8 Probability density functions of dynamic U-factor for the case of exfiltration approximated for the building locatednear to Göteborg (up) or Luleå (down) for western winds (left) and southern winds (right).
Buildings IX 9

imated for the infiltration are skewed to the left, while theseapproximated for the exfiltration are skewed to the right. Thisis because of the specific character of the relationship betweenNusselt number and air change rate. It also influences thefamily of distributions, giving the best fit to dynamic thermaltransmittance. For the case of infiltration, the best fits accord-ing to the Kolmogorov-Smirnov test have been obtained forthe Weibull family of distributions, while, for the exfiltrationcase, the three-parameter Gamma (or, alternatively, Gumbel)distributions have been fitted with the best results (seeTable 3).
The probabilistic approach can be applied even at thedesign stage to estimate thermal performance of a buildingenvelope. The actual heating load for a building with light-weight construction with insulation, exposed to the climaticconditions typical for the site, can be predicted accounting forthe variations of the thermal transmittance of the buildingcomponents. Reliability analysis of U-factor can become atool helping in dimensioning of the heating system.
ACKNOWLEDGMENT
The authors thanks Dr. Ireneusz Czmoch for kindlymaking his FORM program available.
REFERENCES
Anderlind G., and B. Johansson. 1983. Dynamic insula-tion—A theoretical analysis of thermal insulationthrough which a gas or fluid flows. The Swedish Coun-cil for Building Research, Stockholm.
Bankvall, C. 1972. Heat transfer in fibrous materials. TheSwedish Council for Building Research.
Boverkets Byggregler (Swedish Building Code). 1994. BBR94:1. Stockholm, Sweden.
Czmoch, I. 1998. Influence of structural timber variability onreliability and damage tolerance of timber beams. Ph.D.
thesis, Division of Structural Mechanics of Luleå Uni-versity of Technology.
Ditlevsen, O., and H.O. Madsen. 1996. Structural ReliabilityMethods. England: John Wiley & Sons.
Haldar, A., and S. Mahadevan. 2000. Probability, Reliabilityand Statistical Methods in Engineering Design. JohnWiley & Sons, Inc.
Hagentoft, C.-E. 2001. Introduction to Building Physics.ISBN 91-44-01896-7. Lund, Sweden.
Kohonen, R., E. Kokko, T. Ojanen, and M. Virtanen. 1985.Thermal effects of air flows in building structures. Tech-nical Research Centre of Finland, Laboratory of Heatingand Ventilating, Espoo, Finland.
Nowak, A.S., and K.R. Collins. 2000. Reliability of Struc-tures. McGraw-Hill.
Pietrzyk, K. 2000. Probabilistic modelling of air infiltrationand heat loss in low-rise buildings. Ph.D. thesis, Schoolof Architecture at Chalmers University of Technology.Gothenburg, Sweden.
Pietrzyk, K., and C.-E. Hagentoft. 2003a. Reliability analy-sis in building physics design. Submitted to Buildingand Environment.
Pietrzyk, K., and C.-E. Hagentoft. 2003b. Probabilisticdesign of air infiltration in low-rise buildings. Submittedto Building and Environment.
Pietrzyk, K., K. Kurkinen, and C.-E. Hagentoft. 2004. Anexample of application of limit state approach for reli-ability analysis of moisture performance of a buildingcomponent. Journal of Thermal Envelope and BuildingScience (Journal of Building Physics) 28(01):9-26.
Serkitjis, M. 1995. Natural convection heat transfer in a hori-zontal thermal insulation layer underlying an air layer.Ph.D. thesis, Building Physics, Chalmers University ofTechnology, Gothenburg, Sweden.
Wahlgren, P. 2001. Convection in loose-fill attic insulation.Ph.D. thesis, Building Physics, Chalmers University ofTechnology, Gothenburg, Sweden.
10 Buildings IX