Embed Size (px)
Citation preview

Probabilistic Risk Modelling at the Wildland Urban Interface: the 2003 Cedar Fire, II
David R. Brillinger, Statistics UC Berkeley ([email protected], www.stat.berkeley.edu/~brill)
Benjamin Scott Autrey, PopularMedia Inc. (Sequoia Ventures) ([email protected])
Matias D. Cattaneo, Economics UC Berkeley([email protected])

Data preparation, data preparation, data preparation
Booker’s Law
An ounce of application is worth a ton of abstraction.

Overview.
A story of wildfires at the urban-wildland interface
“… where humans and their development meet or intermix with wildland fuel.” Federal Register (2004)
Getting/preparing data – yiiiih
Focus on the San Diego County Cedar Fire of 2003
Looking for: associations with explanatories, understanding of movement, …
Trying to understand costs - losses of life, property, animals, social cost (veg), private cost (home), fire suppression, …
Insurance premium?

The Cedar Fire.
25 October – 4 November, 2003
15 deaths, 6000 firefighters, 2232 homes, 273246 acres, many evacuations, … (All ±)
Santa Anna conditions
A disaster
Large amounts of data, but …


J. Gibbons

Some formalism.
Spatial marked point process
Data (xi , yi , Mi )
(xi,yi): location, Mi: mark
How to describe a point process X?
dX(x,y)/dxdy = Σ δ(x-xi,y-yi)
Dirac delta
Rate/intensity
μX(x,y) = E{Σ δ(x-xi,y-yi)}
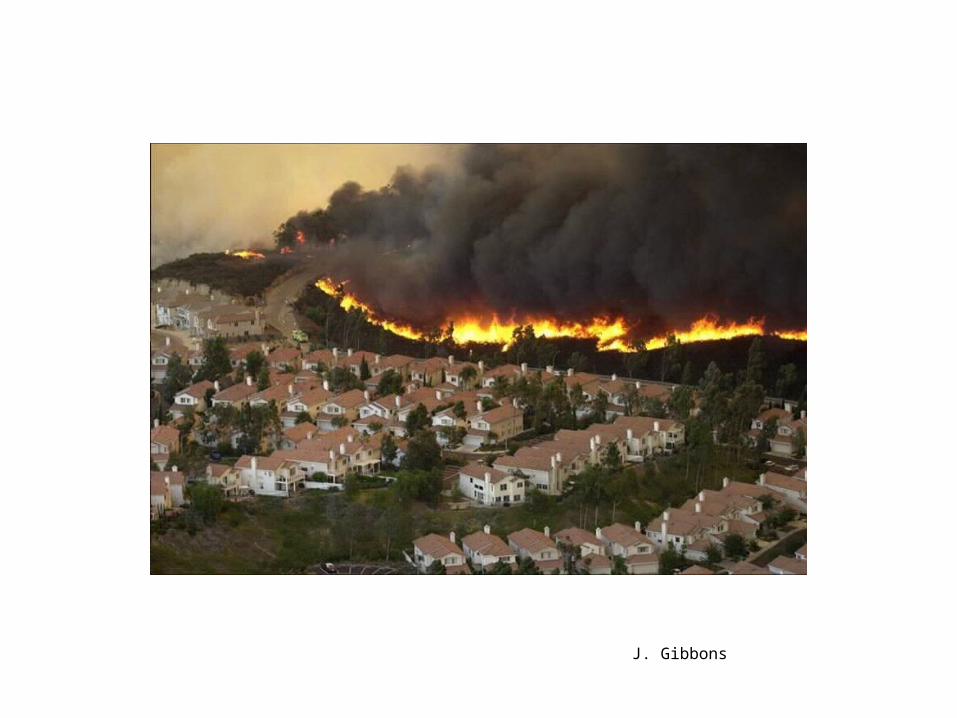
Perhaps Y a subset of X (e.g. destroyed)
Ratio of rates
p(X,Y) = μY(x,y) /μX(x,y)
Useful for comparison, …

How to describe a m.p.p.
dU(x,y)/dxdy = Σ Miδ(x-xi,y-yi)
Average
νU(x,y) = E{Σ Miδ(x-xi,y-yi)}
Thinning with Mi = 0 or 1 randomly yields p.p.
Y subset of X
Ratio of averages
νV(x,y)/νU(x,y)

Logit-gam model
Logit{Prob[destroyed|explanatories]}
= αj with j vegetation class
= β(x,y) with (x,y) location
= γ(s) with s slope
= δ(a) with a assessed improvement value
= α + β + γ + δ + (αβ) + …
After first case, function is assumed smooth

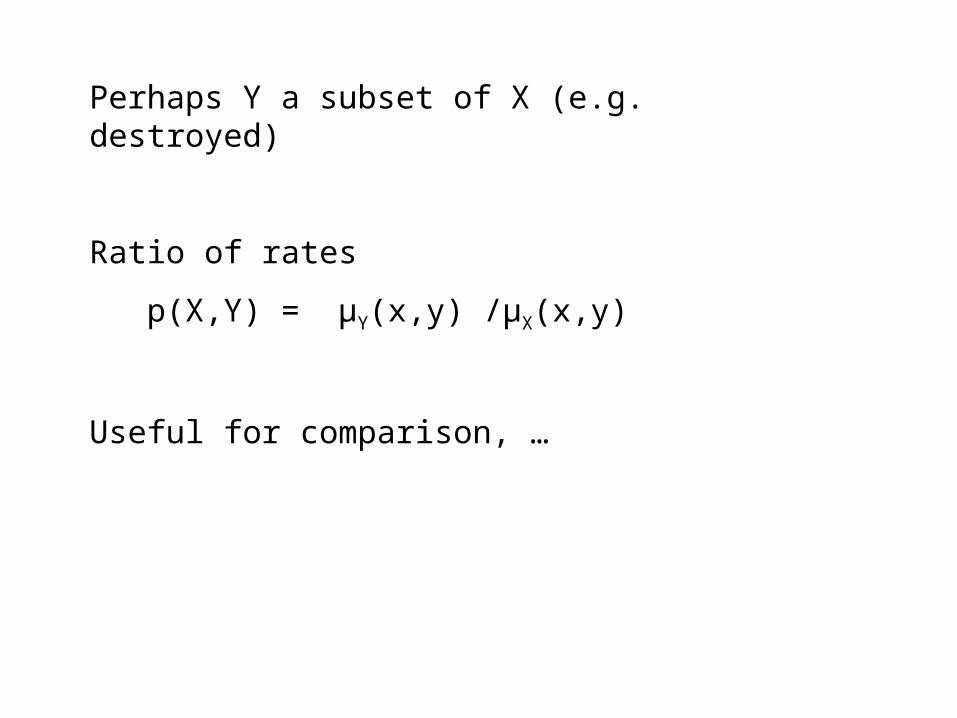
Developing “the” data set.
Many people, organizations, file formats, coordinate-systems, decisions, definitions, authorities, issues, skills, tricks, uncertainties,Nas, errors, checks,…
Publically available data
Tax records, assesors, satellites
GIS files – didn’t need package
Difficulty merging – APN, (X,Y), address,…
Response: 0-1 (destroyed) or continuous (sq ft)
Explanatories: topography, vegetation, roofing, brush,…


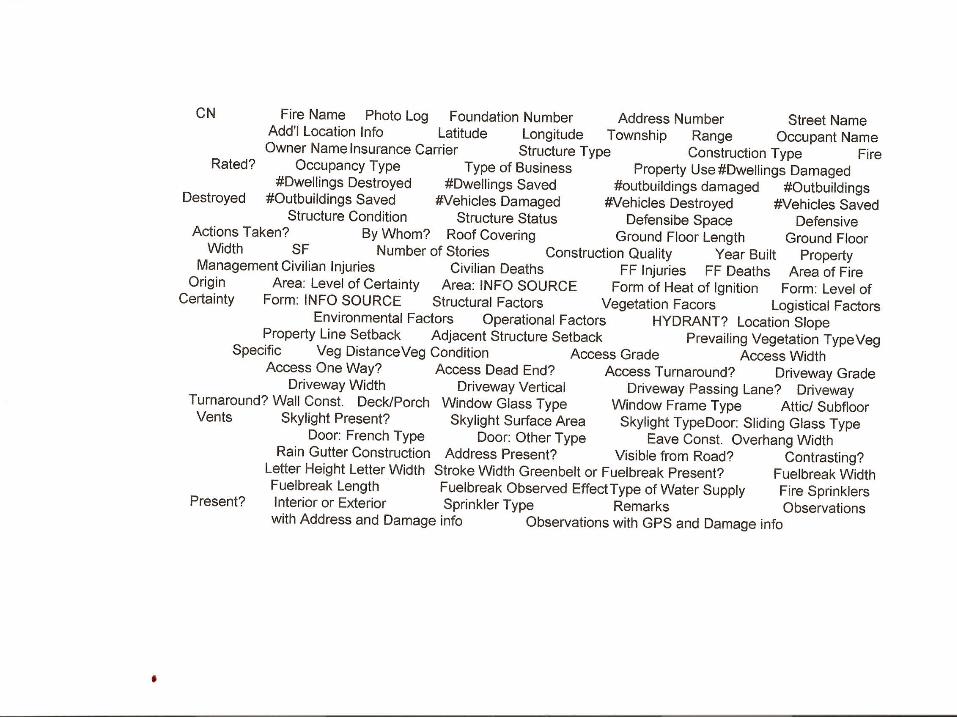
TAX RECORD DATA – all houses
AREA PERIMETER PARCEL_ PARCEL_ID PARCELID OVERLAY_JU POSTID
POSTDATE SUBDIVID GRAPHSRC CONFACTR APNID APN_POSTID
APN_POSTDA PENDING APN APN_8 MULTI OWN_NAME1 OWN_NAME2
OWN_NAME3 FRACTINT OWN_ADDR1 OWN_ADDR2 OWN_ADDR3 OWN_ADDR4
OWN_ZIP ASR_SITENA LEGLDESC ASR_LAND ASR_IMPR ASR_TOTAL ACREAGE
TAXSTAT OWNEROCC TRANUM ASR_ZONE ASR_LANDUS SUBMAP SUBNAME
UNITQTY ADDRNO ADDRFRAC ADDRUNIT ROADPDIR ROADNAME ROADSFX
JURIS ZIP X_COORD Y_COORD SITUS_ADDR SITUS_FRAC SITUS_SUIT
SITUS_PRE_ SITUS_NAME SITUS_SUFF SITUS_POST YEAR_EFFEC
TOTAL_LVG_ BEDROOMS BATHS ADDITION_A GARAGE_CON GARAGE_STA
CARPORT_ST POOL PAR_VIEW USABLE_SQ_ OBJECTID


R. Martin


Analyses.
spatial, spatial-temporal, binary, continuous
R functions: str(), read.shapefile(), inout(), match(), read.xls(), read.dbf(), image(), as.numeric(as.character()), library(),…

str(L)
List of 3
$ shp:List of 2
..$ shp : num [1, 1:4] 1 309373 -549829 1
.. ..- attr(*, "dimnames")=List of 2
.. .. ..$ : NULL
.. .. ..$ : chr [1:4] "record" "x" "y" "shape.type"
..$ header:List of 12
.. ..$ file.code : int 9994
.. ..$ file.length : int 64
.. ..$ file.version: int 1000
.. ..$ shape.type : int 1
.. ..$ xmin : num 309373
.. ..$ ymin : num -549829
.. ..$ xmax : num 309373
.. ..$ ymax : num -549829
.. ..$ zmin : num 0
.. ..$ zmax : num 0
.. ..$ mmin : num 0
.. ..$ mmax : num 0
$ shx:List of 2
..$ index : num [1, 1:2] 50 10
.. ..- attr(*, "dimnames")=List of 2
.. .. ..$ : NULL
.. .. ..$ : chr [1:2] "Offset" "Length"
..$ header:List of 12
.. ..$ file.code : int 9994
Example of shapefile
contents

Looking at the point process data.
Unincorporated SD County + Scripps Ranch
Fire boundary
Locations (destroyed and not)
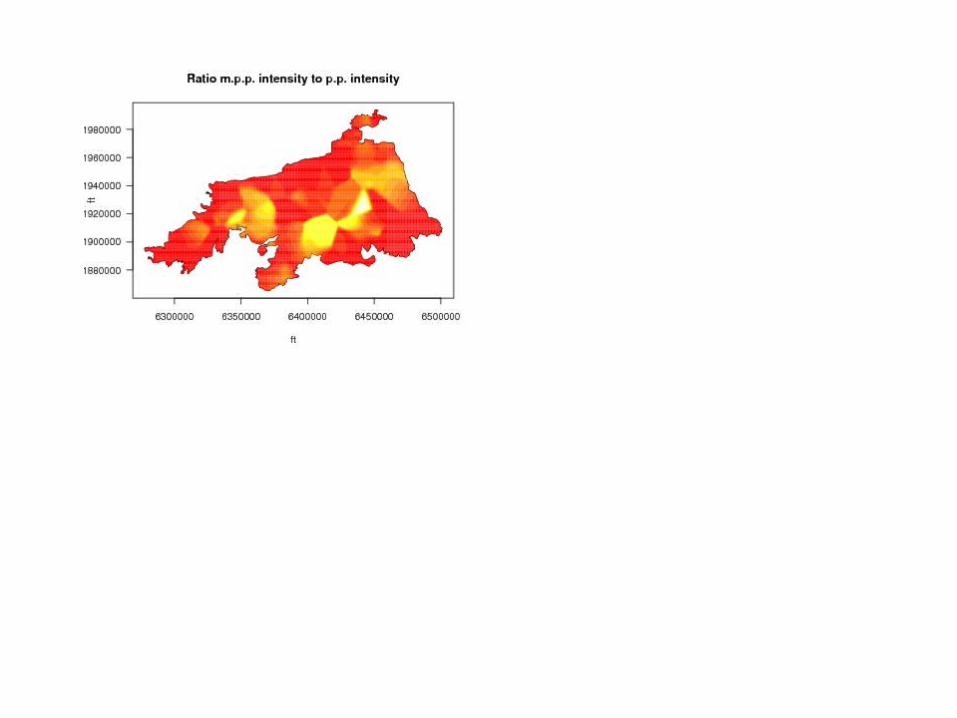
Rates/intensities and ratio


Looking at the continous data.
m.p.p. : area of house (square feet)
a cost proxy ($150/sqft)
Smoothed sqrt(squared feet)
Σ ZI K(x-xi,y-yi)
Some descriptive statistics


Inference results. Point process case.
Intensity of houses at (x,y) initially μX(x,y)
Intensity of destroyed μY(x,y)
p(x,y) = μY(x,y)/ μX(x,y)
“probability” of a house’s destruction


Inference results. Continuous case.
Square feet (from tax records)
Is there a difference wrt squared feet between destroyed and rest?
Estimate νV(x,y)/νU(x,y)


Does size depend on location?
dN(x,y,z)/dxdydz = Σ δ(x-xi,y-yi,z-zi)
Σ zi δ(x-xi,y-yi,z-zi)
If Z independent of p.p. {X(x,y)}, average satisfies
γ(x,y,z) = γ1(x,y) γ2(z)
Consider γ(x,y,z)/γ1(x,y)

Explanatories.
Vegetation type (15 categories)
Slope
Assessed improvement value
Destroyed
Structure location
Square feet
…


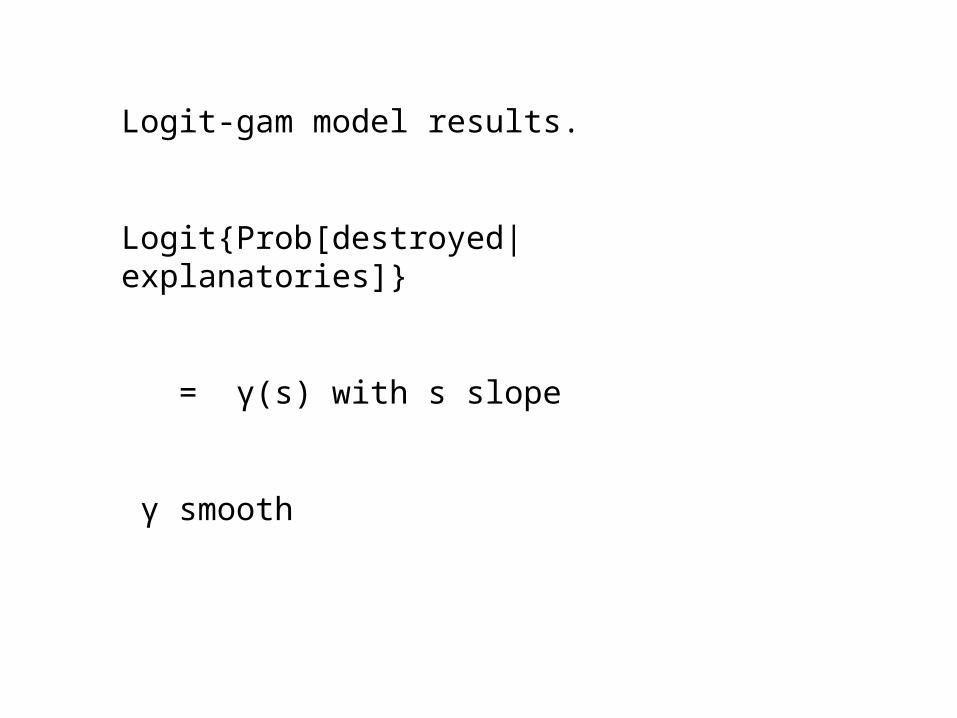
Logit-gam model results.
Logit{Prob[destroyed|explanatories]}
= γ(s) with s slope
γ smooth


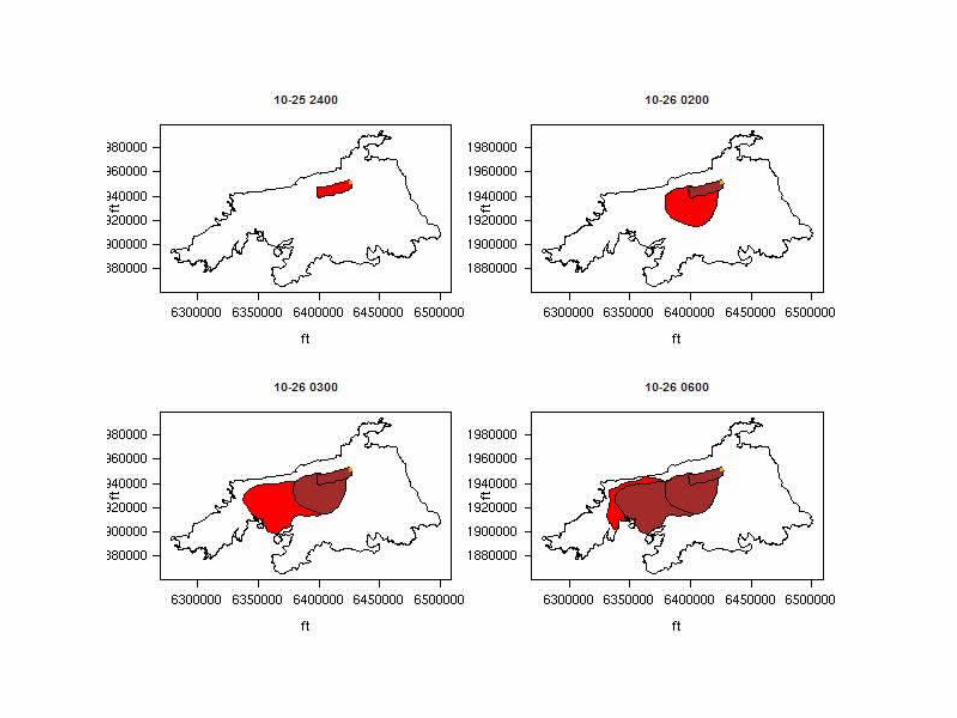
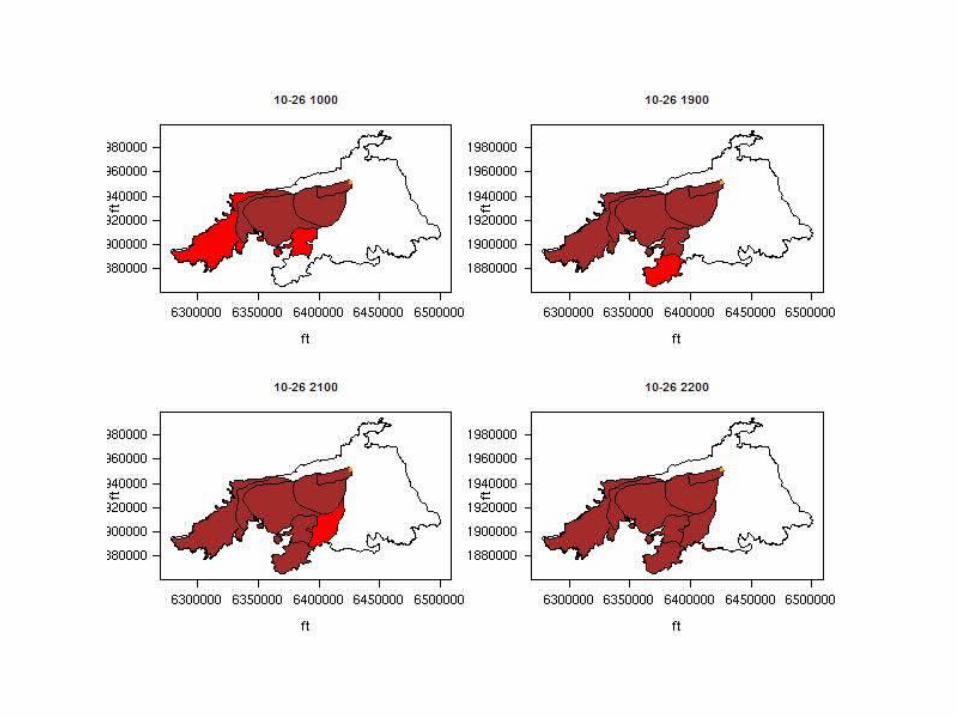
Spatial-temporal results.
polygons
wavefront
How quantities in polygons depend on time
Time defined as interval from midnight 25 October to last fire boundary

Observed fire boundaries


Economic Valuation: $$$
• Key distinction:
• Social Cost (public goods)
(e.g., vegetation lost or air pollution)
• Private Cost (private goods)
(e.g., properties or assets destroyed)
• Short-run vs. Long-run Effects

Social cost - loss of Chaparral
Example of non-market valuation:• Stormwater runoff increased by 12 million cubic feet.• Cost of retaining is estimated at $25 million dollars.• Underestimation: This reflects only one dimension of value.

• Downward trend in chance of destruction as
assessedvalue increases.

Other thoughts.
Damaged houses
Other explanatories
Other models
Other fires
Spatial correlation
Uncertainties
…

Discussion.
Limitations
“they are ‘messy’ datasets and do require a bit of massaging to make sense” … “the damage assesment we performed … was a rapid assessment. There were 18 … teams. … we used a variety of GPSs of varying accuracy. The individual team members also had varying degrees of competency.” J. Batchelor (SD County)
Just one fire, lurking variables/proxies
GISs – Cedar fire areal time success for the GIS industry
Can grab shapefile data for R analyses
Would robust/resistant methods have helped?

Summary.
A work in progress, a story
Difficulties of getting, cleaning and employing data
Used statistical package, R, with Sangis data layers

Acknowledgements.
SanGIS, SDSU, SDCounty, SDFoundation, SDCity, …
A. Ager (USFS), J. Benoit (USFS), C. Hunter (Rancho Santa Fe), D. Sapsis (State of Ca), P. Spector (UCB), C. Westling (SD County), K. Wright (USFS), J. Batchelor (SD County), R. Martin (SD County), M-H. Tsou (SDSU), D. Gilmore (SD County),…